Article

Locating Strong Electromagnetic Pulses Recorded by a Single Satellite with Cluster Analysis and Worldwide Lightning Location Network Observations

1
State Key Laboratory of NBC Protection for Civilian, Beijing 102205, China
2
State Key Laboratory of Severe Weather, Chinese Academy of Meteorological Sciences, Beijing 100081, China
3
College of Information and Communication Engineering, Harbin Engineering University, Harbin 150001, China
*
Author to whom correspondence should be addressed.
Remote Sens. 2024, 16(23), 4442; https://doi.org/10.3390/rs16234442
Submission received: 7 September 2024 / Revised: 10 November 2024 / Accepted: 23 November 2024 / Published: 27 November 2024

Abstract

:
The integration of satellite-borne and ground-based global lightning location networks offers a better perspective to study lightning processes and their evolutionary characteristics within thunderstorm clouds, thereby bolstering the predictive capabilities for severe weather phenomena. Currently, the satellite-borne network is in the preliminary testing phase with a single satellite. The geographic locations of single-satellite detection events primarily rely on synchronous information from coincident ground-based network events; this method is called synchronous locating (SCL). However, variations in detection-frequency bands and system capabilities prevent this method from accurately locating more than a mere 10% of events. To address this limitation, this paper introduces a cluster-analysis-based strategy, utilizing the observations from the Worldwide Lightning Location Network (WWLLN), termed the cluster analysis locating (CAL) method. The CAL method’s performance, influenced by the density-based spatial clustering of applications with noise (DBSCAN), the K-means, and the mean shift algorithms, is examined. Subsequently, an advanced version, mean shift denoised (MSDN)-CAL, is proposed, demonstrating marked improvements in location accuracy and reliability over the other CAL methods. The satellite-borne wideband electromagnetic pulse detector (WEMPD), orbiting at an altitude of approximately 500 km with a 97.5° inclination, captured 1061 strong electromagnetic pulses (EMPs). Among these, trans-ionospheric single pulses (TISPs) and trans-ionospheric pulse pairs (TIPPs) constituted 21.30% and 78.70%, respectively. Using the MSDN-CAL method successfully determines the geographic locations for 81.15% (861 out of 1061) of the events. This success rate represents an approximate eightfold enhancement over the SCL method. The arithmetic mean, geometric mean, and standard deviation of the two-dimensional range deviation of the locating results between the MSDN-CAL method versus the WWLLN-SCL (or the Guangdong-Hong Kong-Macao Lightning Location System (GHMLLS)-SCL) method are 51.06 (176.26) km, 16.17 (92.53) km, and 100.95 (174.79) km, respectively. Furthermore, it has been possible to estimate the occurrence altitudes for 81.92% (684 out of 835) of the TIPP events. The altitude deviations, as determined by comparing them with the GHMLLS-SCL method’s locating results, exhibit an arithmetic mean of 2.08 km, a geometric mean of 1.30 km, and a standard deviation of 2.26 km. The outcomes of this research establish a foundation for deeper investigation into the origins of various event types, their seasonal variations, and their geographical distribution patterns. Moreover, they pave the way for utilizing a single satellite to measure global surface reflectance, thus contributing valuable data for meteorological and atmospheric studies.

1. Introduction

Lightning discharges emit electromagnetic radiation in broadband frequency ranges covering from ULF/VLF, VHF/UHF, and even up to gamma-ray [1], where VHF energy can be detected and recorded by satellites through the ionosphere [2]. At the end of the 20th century, the United States and a few European nations proposed an innovative concept of establishing a multi-star joint network to capture the electromagnetic pulses (EMPs) generated by lightning, thereby creating a global lightning location network. This network would complement the existing ground-based location networks and enhance the predictive capabilities for extreme weather events [3,4]. Recently, the Marshall Space Flight Center of NASA and the Los Alamos Laboratory jointly launched the ‘CubeSpark’ project. This project plans to deploy six low-orbit small satellites equipped with optical and electromagnetic detectors to form a detection constellation, which will synchronously capture lightning EMPs to provide a detailed description of the three-dimensional morphology and evolution of lightning within thunderstorm clouds [5].
Although the detailed results of this technology have not yet been publicly reported and are still in the experimental stage, some low-orbit single satellite detection projects have made progress, such as the American ALEXIS satellite [2] and FORTE satellite [6], Russia’s Chibis-M satellite [7], and Japan’s Maido-1 satellite [8]. As for the characteristics and capabilities of high-orbit satellites in detecting lightning EMPs, recent studies have reported on the STPsat6 satellite [9].
The SY15 satellite was successfully deployed into a sun-synchronous orbit in September 2022. It operates with an orbital period of 90 min, revisits the same area every 11 h, and maintains an altitude of 500 km with an inclination of 97.5°. The satellite is equipped with a wideband electromagnetic pulse detector (WEMPD) that is sensitive to a frequency band of 25 to 75 MHz, designed to detect atmospheric EMPs [10].
During its operational period from March 2023 to December 2023, the SY15 satellite captured some strong EMPs. To clarify, these events are identified when, after accounting for the ionospheric dispersion of the signal (a process known as ‘dechirping’), the square of the peak value of the electric field exceeds 0.1 m V 2 / m 2 . This level of intensity corresponds to an effective radiated power from the ground source in the range of 10 kW. Additionally, the slant total electron content (STEC) inferred from the dechirping signal is found to be greater than 5 TECU ( 10 16   electrons / m 2 ). The two defining characteristics of a strong EMP are mathematically expressed as E d e c 2 > 0.1 m V 2 / m 2 and S T E C d e c > 5 T E C U .
During the detection and recording of events, the satellite’s subsatellite points are distributed globally. This necessitates the determination of the geographical locations of radiation sources to further investigate the origins of various types of events, as well as their seasonal variations and geographical distributions. Single-satellite detection of EMPs is not capable of directly pinpointing the source of radiation. The geographical locations of events detected by a single satellite are primarily ascertained by ‘borrowing’ the location information of concurrent events within the ground-based lightning location network [11,12]. This method is named synchronous locating (SCL).
However, there is often an issue with the inconsistent detection of frequency bands between the satellite-borne and ground-based systems that cover a broad area, as well as the focus on different physical processes of lightning. The satellite-borne system can detect more intra-cloud lightning flashes by monitoring the VHF band, while the ground-based system can detect more cloud-to-ground lightning flashes by monitoring the VLF band. This discrepancy leads to a very limited number of events that can be determined using the SCL method. Employing the SCL method based on the observations from the National Lightning Detection Network, it was only possible to ascertain the geographic coordinates for a small fraction, less than 10%, of the events detected by the FORTE satellite [11,12].
This manuscript introduces an innovative approach for pinpointing the geographical locations of the events detected by a single satellite, leveraging cluster analysis and data from the Worldwide Lightning Location Network (WWLLN). This technique is referred to as the cluster analysis locating (CAL) method. Specifically, the temporal and spatial details of an event detected by the satellite are initially utilized to compile a dataset that derives from the WWLLN observations and aligns with the stipulated time conditions and spatial criteria, as further explained in the subsequent analysis. This dataset is then subjected to clustering analysis to identify potential radiation-source locations. The singularity of the radiation source is ultimately confirmed by evaluating the S T E C d e c of the detected event.
This paper further investigates the impact of the density-based spatial clustering of applications with noise (DBSCAN), the K-means, and the mean shift (MS) algorithms on the accuracy of the CAL method [13,14,15]. Building on these insights, an enhanced mean shift denoised (MSDN)-CAL method is introduced. The method in question achieves the most favorable comprehensive score for locating error, which stands at 56.06 km. This metric is indicative of the method’s precision, with lower values being more desirable (see below for details). In comparison, the other three CAL methods yield comprehensive scores of 58.51 km, 100.24 km, and 80.16 km, respectively. The MSDC-CAL method demonstrates superior precision and dependability compared to the other three CAL methods.
Ultimately, using the method successfully determines the two-dimensional locations for 81.15% of the detection events, with horizontal inaccuracies ranging from 10 to 100 km. This success rate represents an approximate eightfold enhancement over the SCL method, effectively addresses the limitations of the SCL method, and establishes a solid groundwork for future research endeavors.

2. Detection System and Data

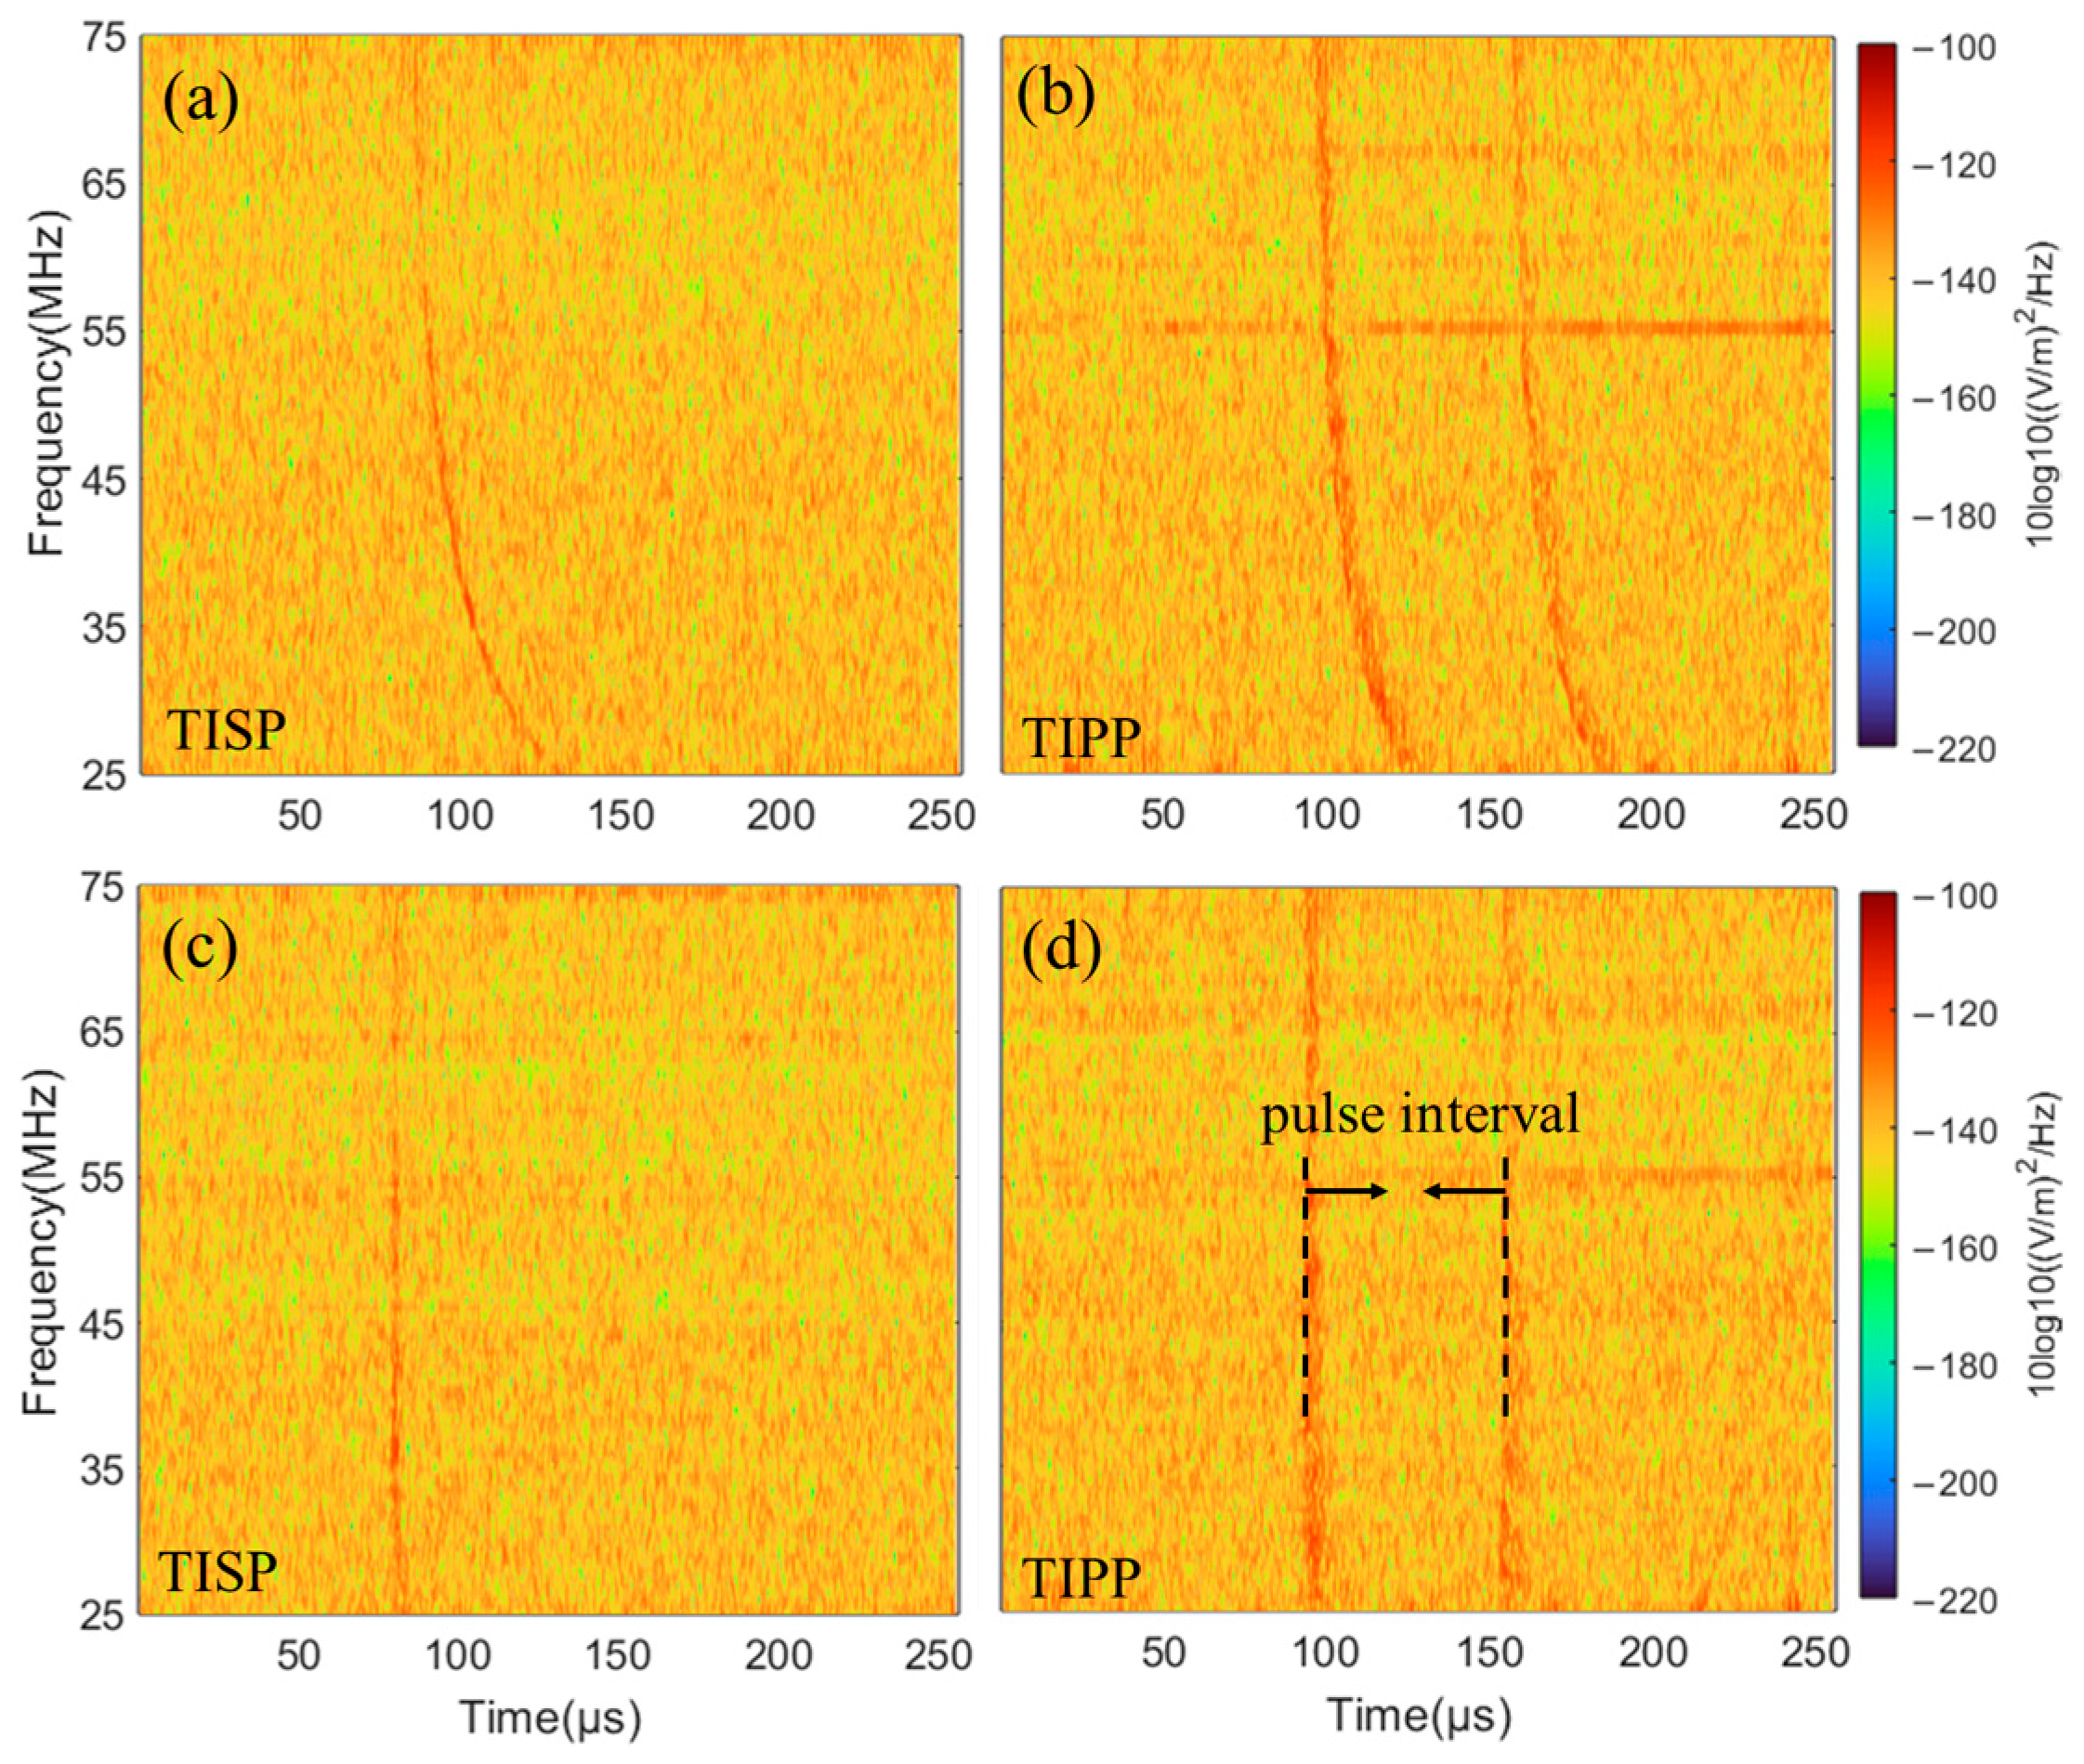
2.1. Wideband Electromagnetic Pulse Detector

Li et al. [10] have provided an in-depth introduction to the wideband electromagnetic pulse detector (WEMPD) system, outlining its fundamental components and operational parameters. The WEMPD is composed of a high-performance receiving antenna and a sophisticated receiver. The antenna, with a 3 dB beamwidth of approximately 130°, is designed to capture signals with specific frequency bands and polarization modes while maintaining a parallel orientation to the ground during satellite orbit. The receiver is adept at amplifying, detecting, classifying, and storing signals within a 25 to 75 MHz frequency range, facilitated by a sampling rate of 160 MS/s.
Detecting wideband EMPs from space is primarily challenging due to the prevalence of numerous interference events [2,16,17] (17 submitted to Advances in Space Research). Therefore, the receiver is equipped with a fast detection mode that employs an advanced short-time Fourier algorithm to identify EMPs with a distinct “L”-shaped time–frequency distribution. This approach demonstrates a marked improvement over the sub-band triggering scheme based on analog circuits used in the payload on the FORTE satellite [18], offering a simpler circuit design, robust anti-interference capabilities, and enhanced channel consistency. In fast-detection mode, the system initiates a sampling length of 256 μs and incorporates a GPS timestamp at 102.4 μs, which corresponds to 40% into each frame. Furthermore, the receiver is equipped with a data-acquisition system that contains ample random-access memory, enabling it to continuously acquire data for up to 1.5 s. This robust system is designed to meet the demands of high-fidelity EMP detection.

2.2. Worldwide Lightning Location Network

The WWLLN initiated and established by the University of Washington in 2004 has its central station situated on the university’s campus, with sensors strategically positioned across the globe to facilitate real-time and ongoing surveillance of lightning activity worldwide.
Operating within the very low-frequency band ranging from 3 to 30 kHz, the WWLLN’s sensors are capable of capturing EMPs from lightning strokes that occur thousands of kilometers away. The system employs the time-of-group-arrival method for lightning location, with a global average location error of 3.4 km, as reported by [19]. By 2017, the number of WWLLN’s ground stations had expanded significantly from 11 in 2003 to over 65, according to [20]. The network is adept at detecting both intra-cloud lightning and cloud-to-ground lightning, achieving a global detection efficiency of 15% for total flash occurrences, as documented by [21].
The dataset furnished by the WWLLN includes comprehensive parameters for each lightning event, such as the precise timestamp, geographical longitude, and latitude. Since 2009, the network has been enhanced by integrating energy-related metrics for lightning occurrences. Furthermore, the temporal precision of the recorded data has been refined to an accuracy of 1 μs, as confirmed in the studies by [20,21].
While the detection efficiency of the WWLLN may not match that of terrestrial-based systems within land areas, its capacity to monitor global lightning phenomena, particularly over the vast oceanic regions where ground-based detection is sparse or absent, offers unique and invaluable advantages in the field of atmospheric electricity and weather monitoring.

2.3. Guangdong–Hong Kong–Macao Lightning Location System

The Guangdong–Hong Kong–Macao Lightning Location System (GHMLLS) has been collaboratively established by the meteorological agencies across Guangdong, Hong Kong, and Macao since 2005. Presently, the GHMLLS comprises 19 detector stations and employs a time-difference and direction-finding integrated location technique. This method is adept at gauging the precise moment of lightning events, their three-dimensional coordinates, polarity, and magnitude, and distinguishing between intra-cloud and cloud-to-ground lightning discharges, as documented by [22].
Chen et al. [23] conducted an assessment of the GHMLLS’s operational performance using data collected from the Guangzhou high-rise building lightning observatory from 2016 to 2017. The findings indicated that the system achieved a detection efficiency of 93% for both first and subsequent strokes. The arithmetic mean (and median) value of the location errors was about 361 m (188 m), 252 m (167 m), and 294 m (173 m) for downward first negative strokes, downward subsequent negative strokes, and upward negative strokes, respectively.

3. Theories and Methodology

3.1. Basic Theory

The ionosphere is a part of the Earth’s upper atmosphere, extending from 65 to 1000 km above the surface, and is predominantly made up of plasma that has been ionized by solar radiation. This plasma exhibits a property of dispersion, which results in a frequency-dependent group delay for radio waves as they travel through the ionosphere. By disregarding the effects of the geomagnetic field, the higher-order terms in the ‘quasi-longitudinal’ expansion of the Appleton-Hartree equation, and the variations in displacement during the satellite detecting a pulse source, the group delay of time of arrival for radio waves of various frequencies traveling from the ground to the detector adheres to the following relationship:
τ t o a f = α × S T E C f
In this formula, all variables are expressed in metric units, where α = 1.34 × 10 7 , f signifies the different frequency components of radio waves, and S T E C refers to the slant total electron content (STEC) along the path of the radiation source over the satellite’s trajectory. The formula provided allows for two principal methodologies to ascertain the STEC. The first approach involves fitting the frequency-time-of-arrival coefficient for wideband signals, a method that has been explored in several scholarly works [2,10,24,25,26]. The second technique is the ‘dechirping’ of signals, as detailed by [6]. For this paper, the latter method has been selected to calculate the STEC from various signals, and this calculated value is designated as S T E C d e c .
Figure 1 illustrates a simplified representation of a signal captured by the WEMPD. The ionosphere is conceptualized as a spherical shell, and the trajectory from the signal’s origin to the satellite intersects the ionosphere at a point of presumed maximum electron density. At the ionospheric pierce point (IPP), the relationship between the STEC and the vertical total electron content (VTEC) is given by the following equation:
V T E C = S T E C × cos δ = S T E C × 1 R e R e + H i sin θ 2
Here, δ   denotes the zenith angle of the satellite with respect to the IPP; R e is Earth’s radius; and H i is the altitude of the peak electron density layer, which is assumed to be 300 km in this study. Furthermore, θ   represents the angle of incidence of the signal as it travels from the radiation source to the satellite. For a radiation source located at a certain altitude H e above the ground in the lower atmosphere, θ   can be approximated using the following formula once its two-dimensional position is established:
θ = π 2 arctan ( H s + R e 1 cos β R e sin β ) + β
In this formula, β is the angle between the radiation source and the satellite footprint, and H s is the altitude of the satellite, as depicted in Figure 1.

3.2. The Methods of Locating Strong Electromagnetic Pulses

The technique of synchronizing events across multiple detection systems in both space and time, based on the distinctiveness of physical processes or the occurrence of events, is frequently employed. This method serves to validate system capabilities or to enrich the detection data from various systems to deepen the comprehension of the underlying physical processes and the mechanisms of detection events. In this study, the spatial and temporal information from the WEMPD detection events are matched in synchronization with a ground-based lightning location network. The precise locational data from this network are utilized to compensate for the inherent limitations of single-satellite detection.
In a previous study, [27] demonstrated that the FORTE satellite detected the effective radiated power of the most potent lightning in the order of 100 kW( corresponding to on-orbit E d e c 2 in the order of 1 m V 2 / m 2 ). Subsequently, in a pivotal investigation conducted by [10], the WEMPD was employed to discern signals emanating from an electromagnetic pulse pulser (EMPP) with an effective radiated power of about 1 MW, corresponding to the strongest lightning radiations. This study revealed that the WEMPD exhibited the sensitivity to capture the EMPP signals within an 800 km radius of the subsatellite point. Furthermore, it was observed that the propagation time for these emissions to traverse the spatial expanse to the SY15 satellite is approximately 2 to 3 ms. Drawing on the outcomes of these two studies, the times of arrival and the subsatellite points of the events documented by the SY15 satellite are cross-referenced with the events detected by ground-based lightning locating networks. If two events in two systems exhibit a time difference of less than +3 milliseconds (satellite time minus ground time), a two-dimensional spatial deviation within 800 km, and a one-to-one correlation, it is hypothesized that they may originate from an identical radiation source.
Furthermore, utilizing the geographic coordinate information from the ground-based lightning location network, the temporal difference, denoted as t , is ascertained between the ‘occurrence’ time of the WEMPD-detected events, post-adjustment for the effects of distance and the ionosphere, and the timestamp ascribed to the events by the ground-based lightning location network. Jacobson et al. [11] conducted an analysis concluding that when the temporal difference t between the satellite-borne and ground-based detection systems is less than 300 μs, the probability that the radiation source pertains to the same event is 97.5%. To augment the reliability of the synchronous matching process for locating the WEMPD-detected events, this study adopts the geographic coordinate information from the ground-based lightning location network, focusing on events with a temporal difference t of less than 100 μs, which corresponds to a spatial error of 30 km. The aforementioned process for ascertaining the geographic locations of single satellite-detected events constitutes the SCL method.
However, discrepancies in detection frequency bands and capabilities between spaceborne and ground-based systems limit the SCL method’s ability to accurately pinpoint the geographic coordinates for a limited portion of events captured by a single satellite, typically no more than 10%, according to Jacobson et al. [11]. To address this limitation, the following refined strategies are implemented to enhance the determination of geographic locations for the WEMPD-detected events:
1. Retaining the aforementioned spatial matching conditions, an additional temporal window is introduced for alignment with the WWLLN observations, thereby yielding a dataset denoted as S under these specified conditions.
2. Should the count of events in S exceed a threshold N (set at 50), a clustering process is initiated to delineate C i clusters (as illustrated in Figure 2, Cluster 1 through Cluster 5). If the number of lightning flashes within these clusters surpasses a value n (set at 5), it is postulated that the event may originate from the centroids of these clusters (as depicted in Figure 2).
3. In instances where C i equates to 1, the event’s geographic location is presumed to be the cluster’s centroid. Conversely, if C i exceeds 1, the International Reference Ionosphere model is initially applied to calculate the V T E C i at the IPP for each distinct cluster centroid relative to the satellite. Subsequently, the V T E C i values are transformed into S T E C i using the satellite’s zenith angle δ i in relation to various IPPs (as shown in Figure 2). Ultimately, the cluster center that exhibits the minimal divergence between S T E C i and the event’s S T E C d e c is identified as the event’s geographic location.
In scenarios where multiple cluster centers are essentially aligned on concentric circles, indicating that the incidence angles of the satellite relative to the cluster centers are nearly identical, the aforementioned method may not effectively discern the event’s geographic location. The aforementioned process of ascertaining the geographic locations of single satellite-detected events through clustering analysis and the ground-based lightning location network observations encapsulates the essence of the CAL method.
Furthermore, once the two-dimensional coordinates of trans-ionospheric pulse pairs (TIPPs) are established, the radiation height H e can be calculated based on the TIPPs’ reflection mechanism. This relationship is given by the formula:
H e = c τ cos θ 1 sin 2 θ
In this equation, c denotes the speed of light, and τ represents the interval between the two pulses within a TIPP, as depicted in Figure 3d.

4. Results and Analysis

4.1. Relationship Between Strong Electromagnetic Pulses and Lightning Discharges

Throughout its operational period from March to December 2023, the SY15 satellite equipped with the WEMPD has predominantly observed strong EMPs in two distinct patterns: single pulse and double pulses. On the time-frequency distribution plots, the times of arrival of varying frequencies are staggered, with the lower frequencies consistently arriving after the higher ones, creating an ‘L’ shaped pattern, as illustrated in Figure 3. This configuration, coupled with the pronounced dispersion traits, indicates that the signals originate beneath the ionosphere. Consequently, the two types of signals are referred to as trans-ionospheric single pulses (TISPs) and TIPPs, respectively.
The phenomenon of TIPPs was initially observed and documented by the ALEXIS satellite. Since its discovery, the underlying physics and origins of TIPPs have been extensively examined and debated. It is widely accepted that the secondary pulse within a TIPP event arises from the ground reflecting the energy of lightning discharges that occur within the cloud layer.
In Figure 3, the TISP event is identified over Central Africa, specifically at coordinates (6.0349N, 17.3659E). This event was recorded at 19:10:05.319101706 on 4 August 2023 (local time, LT), with a S T E C d e c of 22.38 TECU.
On the other hand, the TIPP event is situated along the coast of Colombia, with geographical coordinates of (3.917023445N, 77.72694689W). The event took place at 05:13:12.483972000 on 6 April 2023 (LT), characterized by a S T E C d e c of 14.15 TECU and a pulse interval of 50.23 μs.
Furthermore, as depicted in Figure 3b, alongside the dispersive TIPP event, there are also distinct horizontal wave distributions observable at frequencies of 54, 60, 61, and 67 MHz, each with bandwidths ranging from 1 to 2 MHz. These are most likely attributable to terrestrial frequency-modulation radio and television signals.
The SY 15 Satellite, equipped with the WEMPD, recorded a total of 1,061 events that meet the criteria for strong EMPs. Among these, a substantial majority, specifically 78.70%, are classified as TIPP events. In contrast, the TISP events constitute a smaller proportion, precisely 21.30%, as detailed in Table 1.
Table 1 details the synchronization of the WEMPD-detected events with those recorded by the WWLLN and the GHMLLS across different time windows. Within a narrow time window of +3 ms, the matching rate (MR) between the WEMPD and WWLLN is 9.61%. In contrast, the MR between the WEMPD and the GHMLLS is significantly lower at 1.79%, which can be primarily attributed to the fact that the detection range of the GHMLLS is confined to the immediate vicinity of the Guangdong coastline. These suggest a minimal likelihood of the WEMPD and ground-based lightning location networks detecting the same radiation source simultaneously.
Expanding the timeframe to broader windows of ±30 s, ±150 s, and ±300 s, the MR between the WEMPD and WWLLN increases to 90.96%, 98.49%, and 99.06%, respectively. Notably, the MR for the TIPP events achieves a perfect 100% within ±300 s. These figures underscore a strong correlation between the WEMPD-detected events and thunderstorm lightning discharges.
It is important to highlight that among the events, 10 TISPs did not find corresponding matches in the WWLLN observations within both ±150 s and ±300 s. These events exhibited radio-wave birefringence, characterized by distinct linear polarization, suggesting that they were likely not associated with lightning discharges. The nature of the radiation sources for these occurrences merits further investigation, which will not be addressed in the current paper. Furthermore, the mean match counts (MMCs) between the TIPP events and the WWLLN observations within +3 ms, ±30 s, ± 150 s, and ±300 s are 2.00%, 37.58%, 38.36%, and 37.71% higher than that of the TISP events, respectively. The presence of a TIPP event suggests an increased frequency of lightning discharges within the thunderstorm clouds.

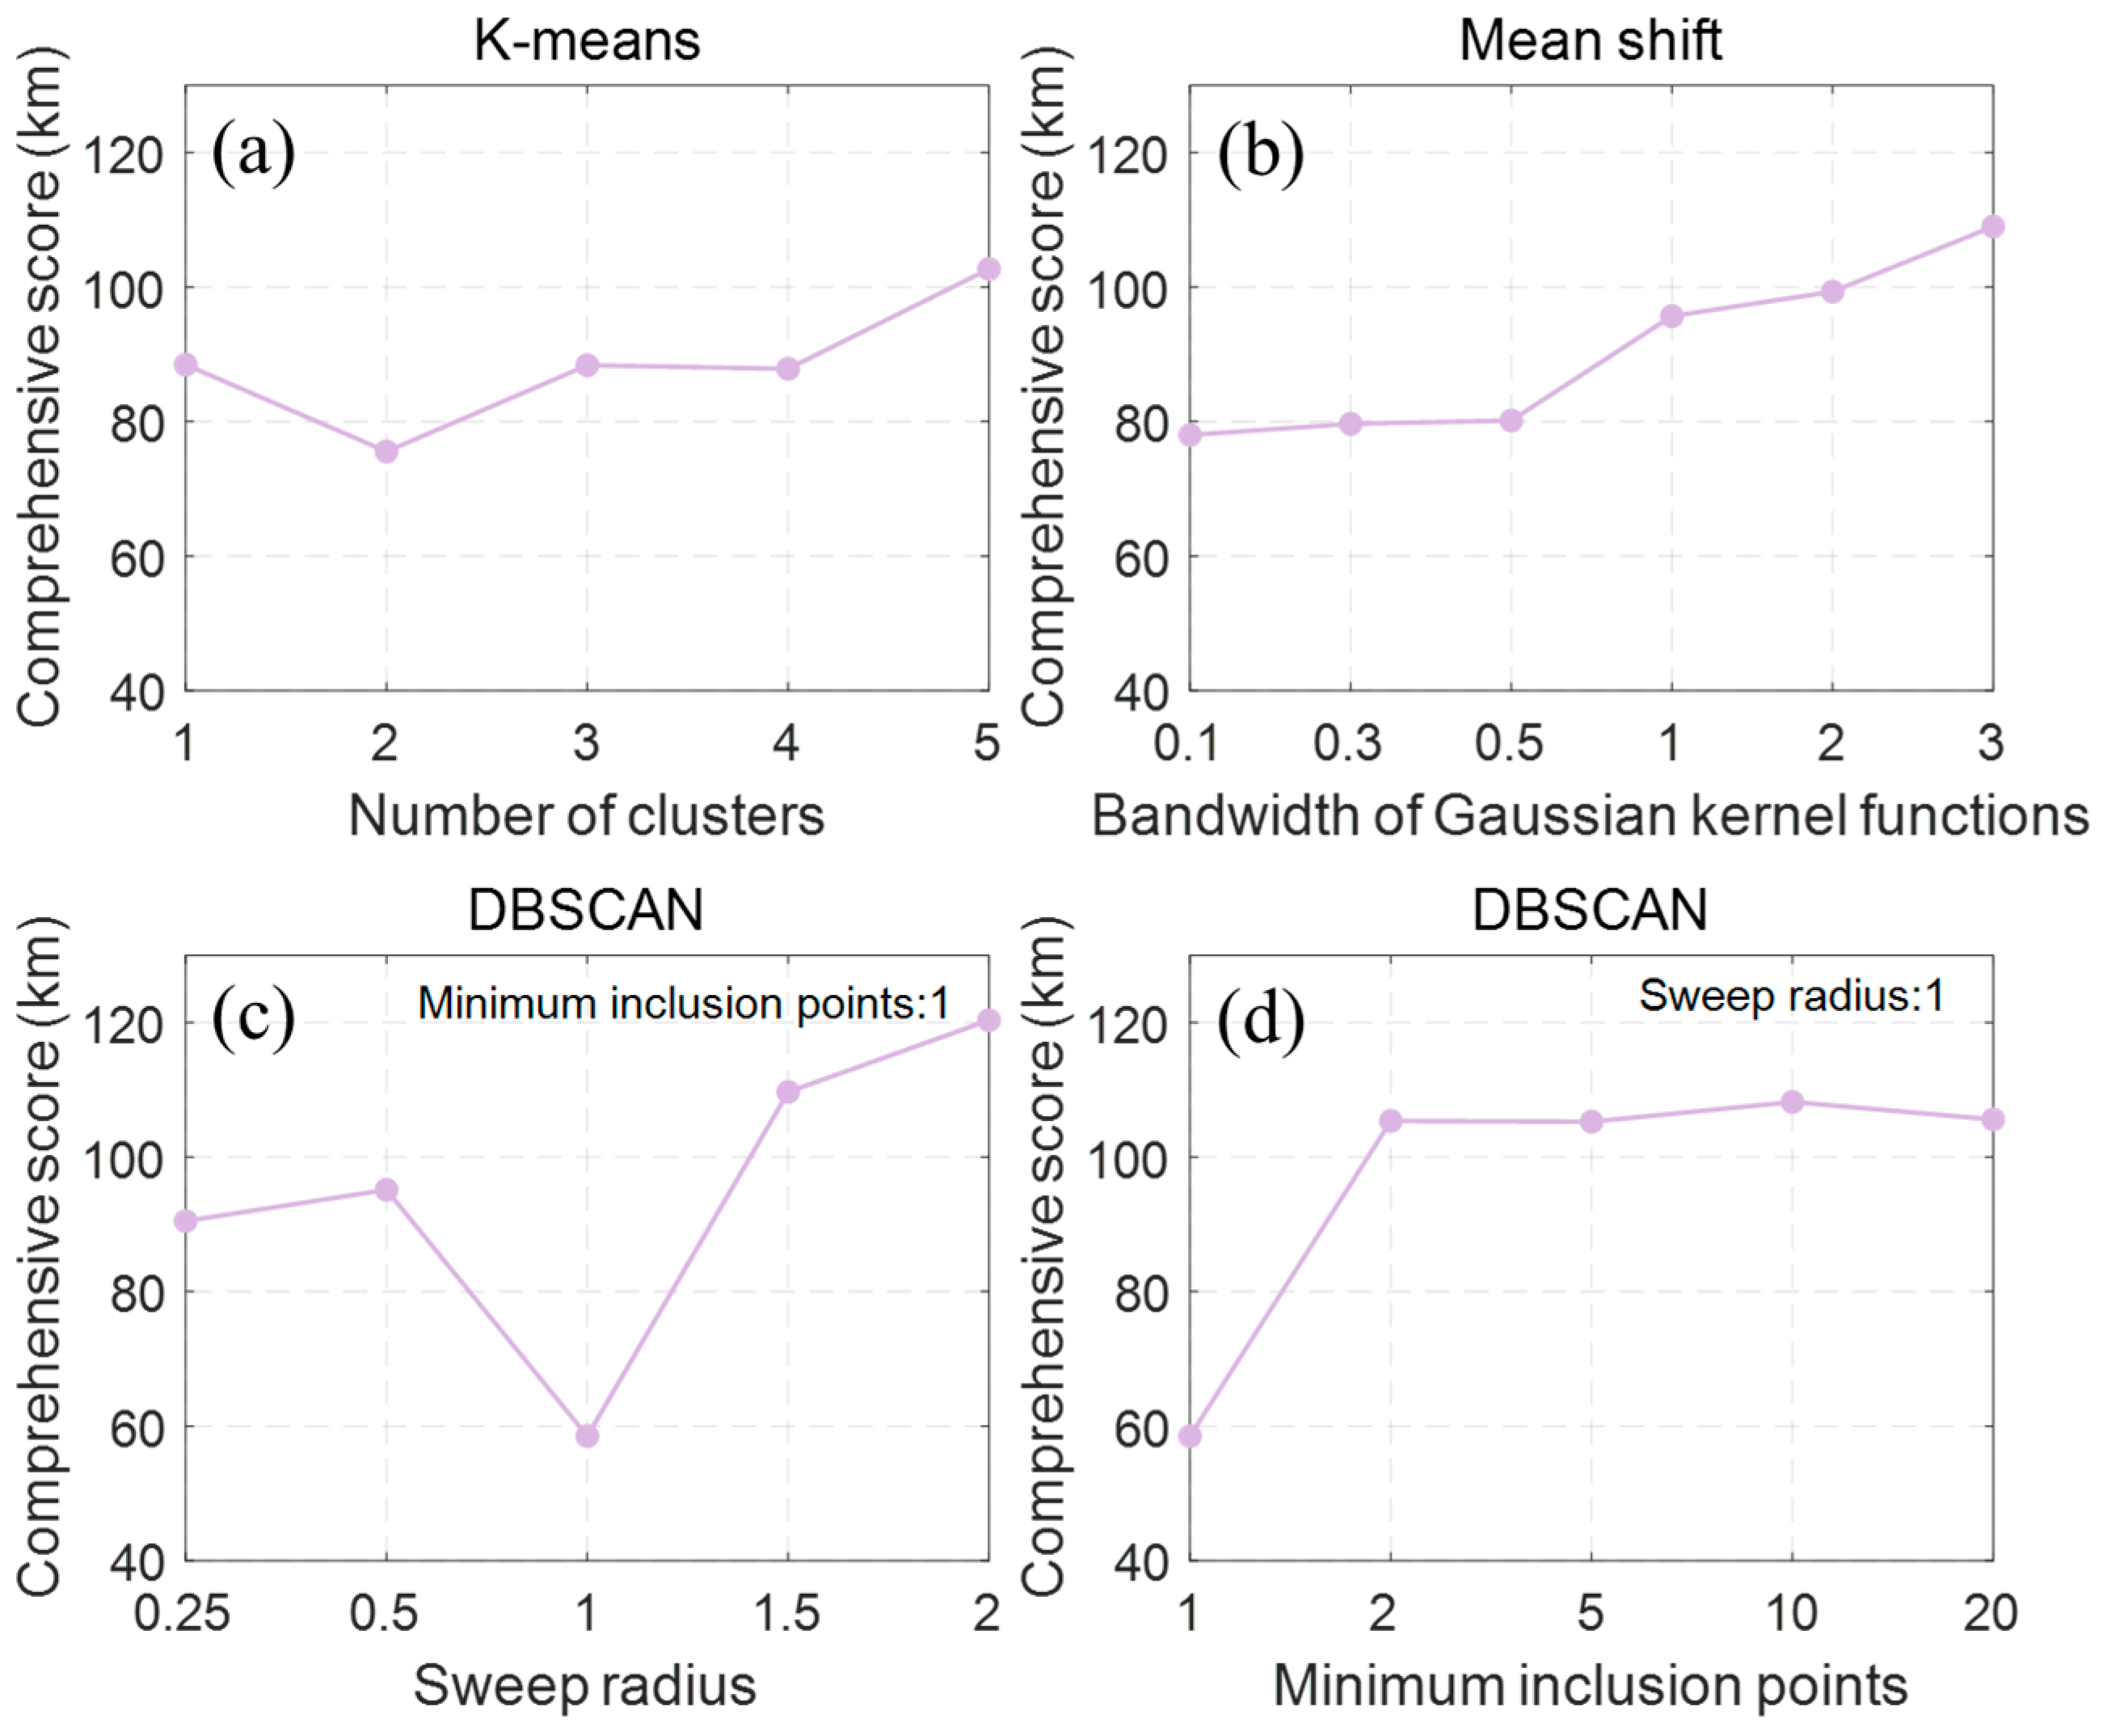
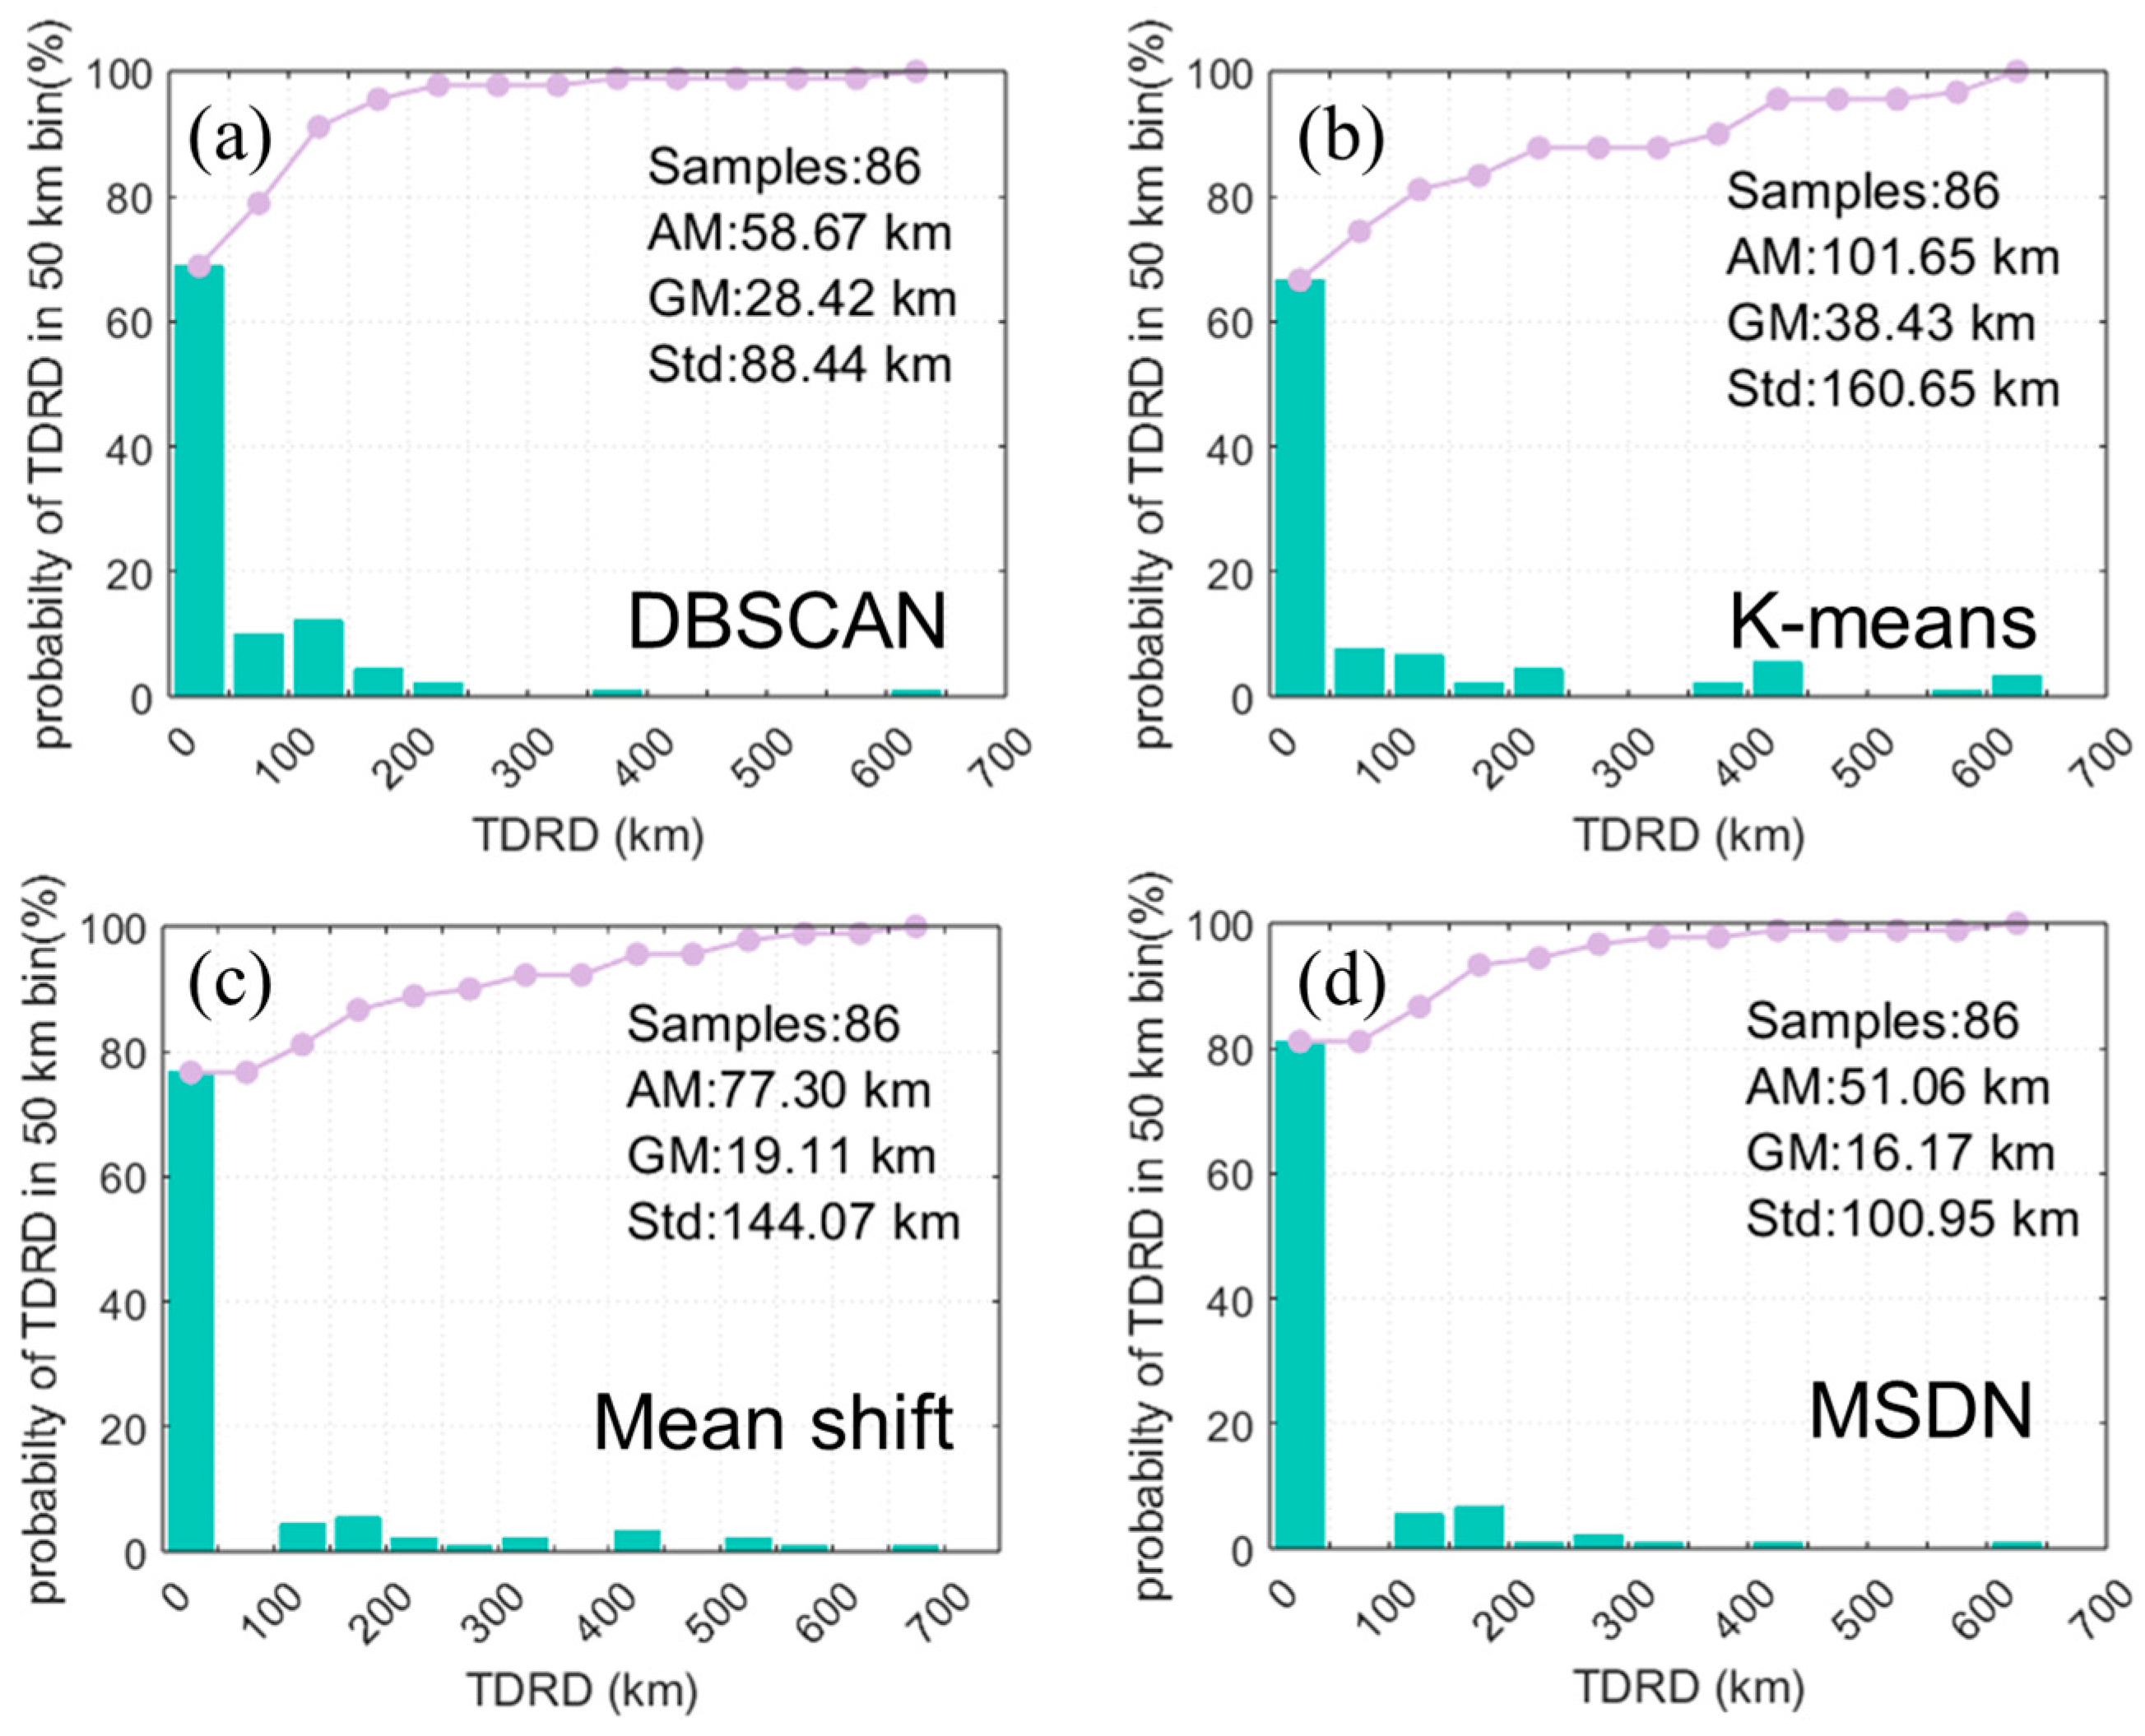
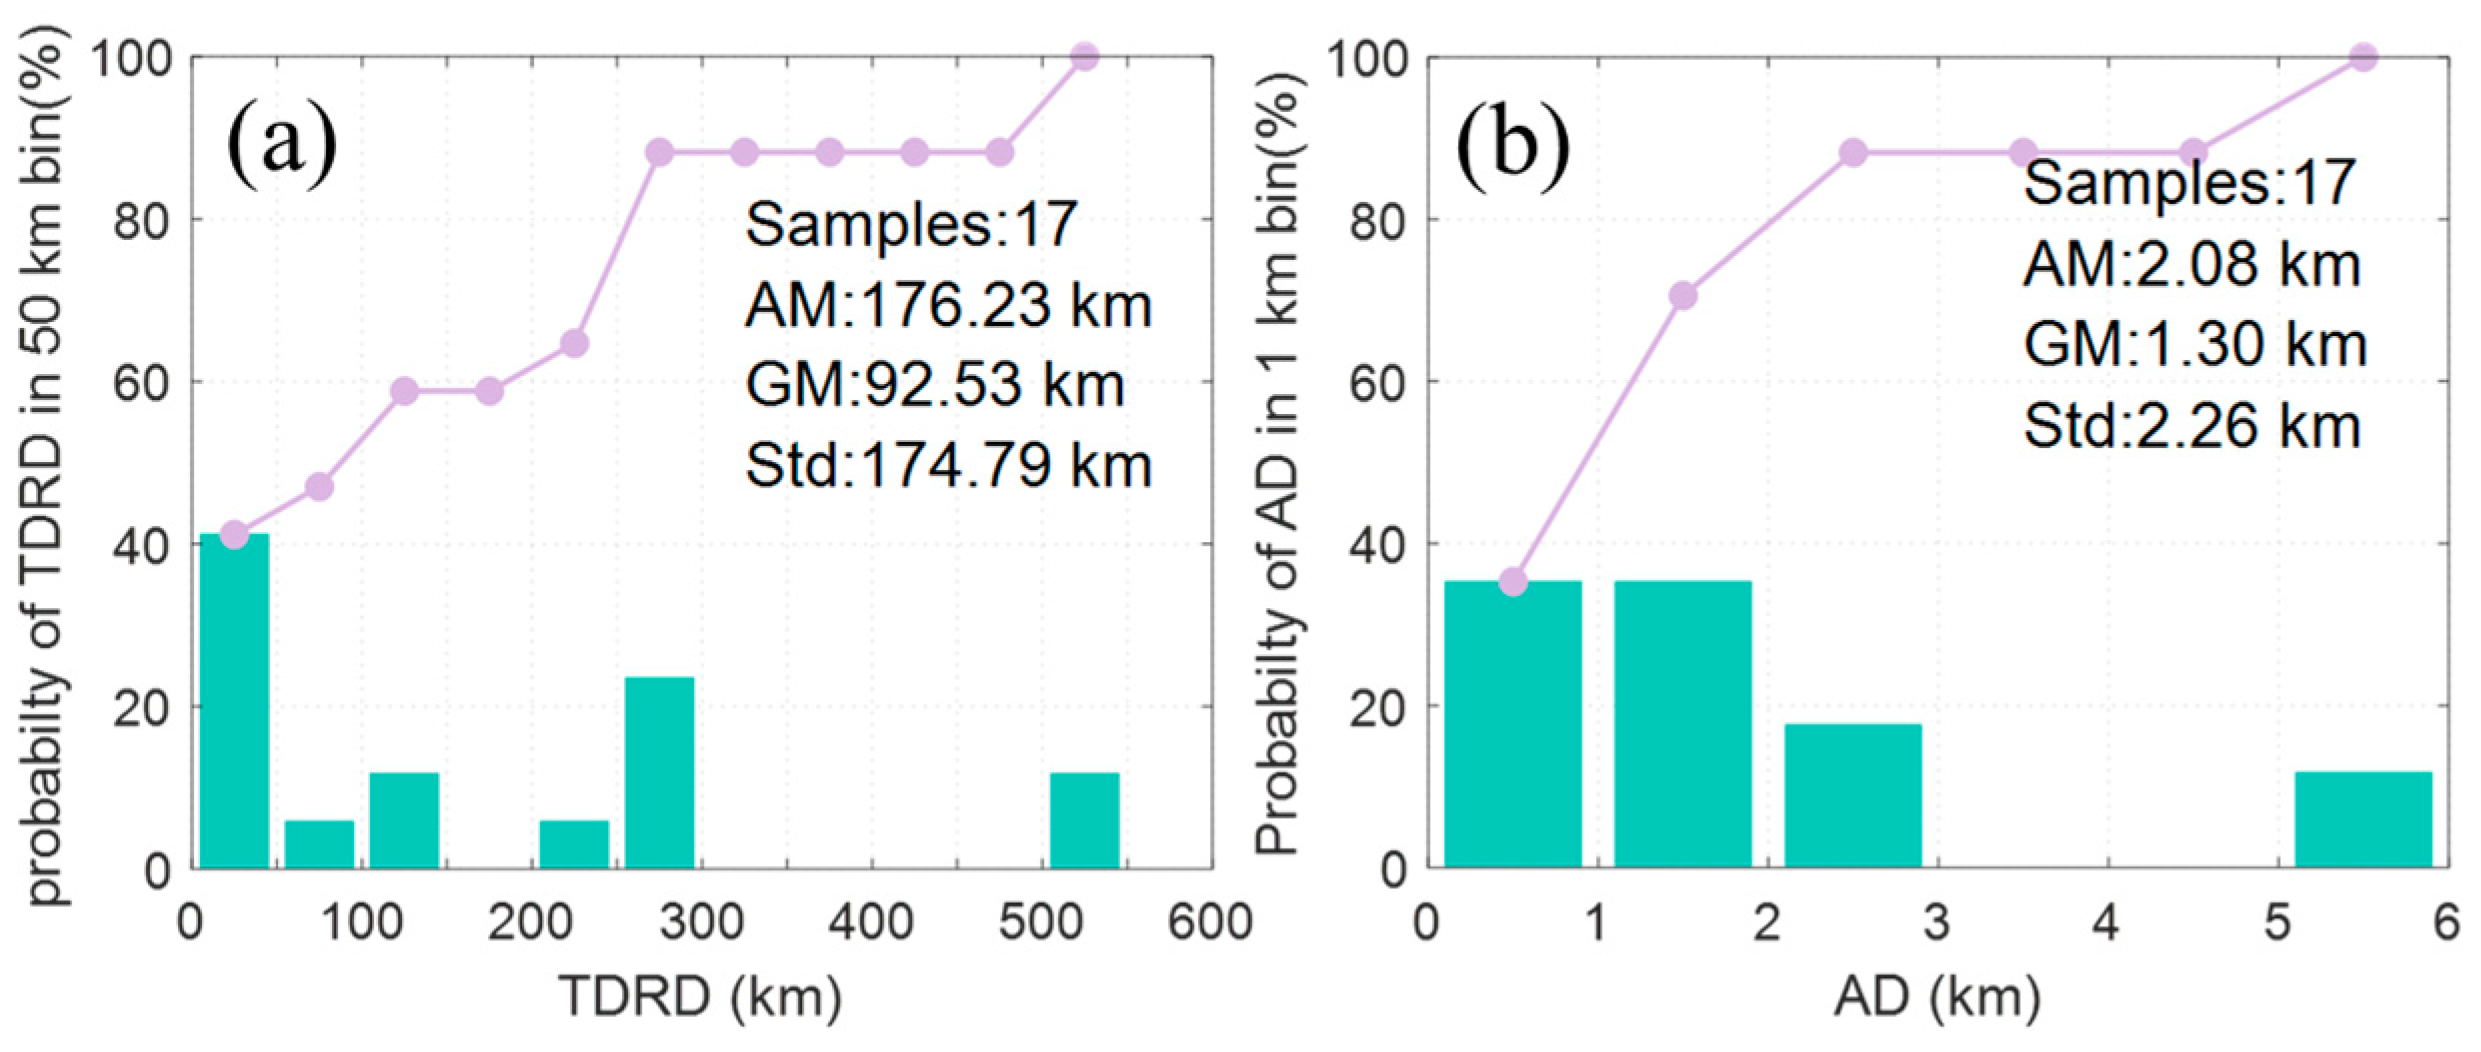
4.2. Assessing the Impact of Various Clustering Algorithms on the Cluster Analysis Locating Method

The strong EMPs detected by the WEMPD closely match the observations of the WWLLN and GHMLNS on a nearly one-to-one basis within a +3 ms window. Notably, there are two TIPP instances respectively corresponding to two separate events in the WWLLN within this timeframe (refer to Table 1). However, the multiple events in both sets of matches link to nearly identical locations. Consequently, under these specific space–time conditions, the origins of these events can be distinctly identified, allowing for the calculation of the time difference ( t ) between the ‘occurrence’ time of the WEMPD-detected events and the timestamps provided by the ground-based location networks (as illustrated in Figure 4). The events with an absolute time difference ( t ) less than 100 μs, as identified by the WWLLN and the GHMLNS, account for 8.48% (90 out of 1061) and 1.79% (19 out of 1061), respectively. This indicates that the SCL based on data from the WWLLN and the GHMLNS can reliably pinpoint the geographic locations for approximately 10% of the WEMPD-detected events.
The capacity to pinpoint the geographical locations of events through the CAL method is contingent upon the MR and MMC between the WEMPD-detected events and those of the WWLLN across various timeframes. As illustrated in Table 1, both detection systems demonstrate an MR exceeding 90% within the broader time windows of ±30 s, ±150 s, and ±300 s. These high MRs are instrumental in establishing the geographic locations for the majority of events, effectively compensating for the limitations of the SCL method.
The WEMPD’s detection capability for strong EMPs is circumscribed within a spherical radius of 800 km from the subsatellite point, resulting in a typical detection duration of 3 to 5 min within any given locale. To mitigate the inclusion of extraneous events, dataset S is chosen for cluster analysis. This dataset is composed exclusively of the WWLLN events that coincide with a WEMPD-recorded event within ±150 s.
Figure 5 illustrates the comprehensive scores of the three CAL methods based on the density-based spatial clustering of applications with noise (DBSCAN), the K-means, and the mean shift (MS) when employing various parameter settings. The comprehensive score, which evaluates the performance, is calculated as the mean of the arithmetic mean, geometric mean, and standard deviation of the two-dimensional range deviation (TDRD) of the locating results between the three CAL methods versus the WWLLN-SCL method. A lower score indicates superior performance. For the K-means algorithm, the optimal performance is observed when the number of clusters is set to 2. In the case of the MS algorithm, a smaller bandwidth for the Gaussian kernel function generally yields better results, with little variation in performance when the bandwidth is set to 0.1, 0.3, or 0.5. However, considering the trade-off between performance and computational cost, a bandwidth of 0.5 is deemed the most effective choice due to its balance between effectiveness and reduced computational demand. The DBSCAN algorithm is governed by two parameters: the sweep radius and the minimum inclusion points. When both parameters are assigned a value of 1, the comprehensive score attains its minimum value, which is 58.51 km, indicating optimal performance (as shown in Figure 5c,d).
Figure 6 provides a detailed comparison of the TDRD distribution of the locating results between the three CAL methods and the WWLLN-SCL method. It is evident that the K-means-CAL method exhibits higher arithmetic mean, geometric mean, and standard deviation values for the TDRD when compared to the other methods. This discrepancy is likely due to the necessity of predefining the number of clusters in the K-means algorithm, which, as depicted in Figure 2, can lead to significant errors when clusters 3, 4, and 5 are merged.
The percentage of events where the TDRD does not exceed 50 km, as determined by comparing the MS-CAL method’s results with those of the WWLLN-SCL method, stands at 76.67%. This is a higher rate than the 68.89% achieved by the DBSCAN-CAL method and the 66.67% of the K-means-CAL method. This superior performance may be attributed to the MS algorithm’s focus on identifying the densest cluster centers, which often align with areas of high lightning frequency, thus better reflecting the patterns of lightning occurrence.
However, the MS-CAL method’s TDRD metrics are slightly higher than those of the DBSCAN-CAL method, suggesting a less-precise overall match. This could be due to the presence of isolated noise points in the WWLLN data, which the DBSCAN algorithm can effectively mitigate by using its sweep radius to define cluster boundaries.
Nevertheless, the DBSCAN-CAL method, which calculates the geometric center of clusters, may yield results that deviate from the actual lightning event center in cases of cluster fragmentation or noise, as illustrated in Figure 2 for clusters 1 and 2. This could explain why the proportion of events with a TDRD less than 50 km for the DBSCAN-CAL method is lower than that for the MS-CAL method when compared to the WWLLN-SCL method.
In summary, to bolster the precision and dependability of the CAL method, the clustering process has been enhanced with the following steps: Initially, the DBSCAN algorithm clusters the dataset S , and any clusters with fewer than five events (among values from 1 to 10, this one yields the most favorable comprehensive score) are filtered out, yielding a cleansed dataset named S _ n e w . Subsequently, the MS algorithm is applied to S _ n e w , and the other procedures are unchanged. This refined approach is termed the mean shift denoised (MSDN)-CAL method. With the optimal parameter configurations (as previously discussed), the proportion of the TDRD of the locating results between the MSDN-CAL method and the WWLLN-SCL method less than 50 km is 81.11%. Furthermore, the method in question achieves the most favorable comprehensive score for locating error, which stands at 56.06 km. In comparison, the other three CAL methods yield comprehensive scores of 58.51, 100.24, and 80.16 km, respectively. The MSDC-CAL method demonstrates superior precision and dependability compared to the other three CAL methods, as illustrated in Figure 6.
Using the MSDN-CAL method, we successfully obtained two-dimensional geographical locations for 82.39% (861 out of 1045) of the WEMPD-recorded events that match the WWLLN observations within ±150 s. Among these, TIPP and TISP events constitute 79.44% (684 out of 861) and 20.56% (177 out of 861), respectively. The other 17.61% (184 out of 1045) of the events could not be geographically pinpointed for two main reasons: firstly, due to a limited number of WEMPD-detected events that match the WWLLN observations within the specified time frame, which accounts for 40.76% (75 out of 184) of these events; and secondly, due to insufficient differentiation of the S T E C i using the CAL method, which represents 59.24% (109 out of 184) of the undetermined events.
The two-dimensional locations of 81.92% (684 out of 835) of the TIPP events have been successfully determined using the MSDN-CAL method. Therefore, the three-dimensional locations of these TIPP events could be obtained by further estimating their occurrence height. When comparing the MSDN-CAL method’s results for the two-dimensional locations with those of the GHMLLS-SCL method, 88.24% of the TDRD are found to be within a 300 km range. The respective arithmetic mean, geometric mean, and standard deviation of the TDRD are 176.26 km, 92.53 km, and 174.79 km, respectively. Additionally, for the altitude deviation (AD) of the locating results between the same methods, the arithmetic mean, geometric mean, and standard deviation are 2.08 km, 1.30 km, and 2.26 km, respectively (see Figure 7 for details).
These levels of accuracy are substantial for the comprehensive analysis of the events’ sources, occurrences, and distributions on a global scale, which could provide valuable insights into the phenomena under study.

5. Conclusions

During its operational tenure from March to December 2023, the SY15 satellite, equipped with the WEMPD, detected 1061 strong EMPs predominantly categorized as TISPs and TIPPs, at 21.21% and 78.79%, respectively. The MRs between the WEMPD-detected events and the WWLLN observations, within time frames of ±30 s, ±150 s, and ±300 s and an 800 km radius of the subsatellite point (this spatial correlation criterion is adopted below), consistently exceeded 90%. This high correlation underscores a strong link between the WEMPD-detected events and lightning discharges of thunderstorms. Nonetheless, a small fraction of 4.42% (10 out of 226) TISP events lacks corresponding matches in the WWLLN observations within ±150 s and ±300 s, suggesting their radiation sources may be unrelated to lightning discharges. The underlying origins of these events warrant further investigation.
The occurrence of a TIPP event is indicative of heightened lightning activity within thunderstorm clouds. With the future establishment of a satellite-borne lightning location network, TIPP events could serve as indicators of severe weather, potentially enhancing numerical assimilation methods and improving the short-term forecasting capabilities for lightning occurrences.
Using the MSDN-CAL method introduced in this paper successfully pinpoints the two-dimensional geographic locations for 81.15% (861 out of 1061) of the WEMPD-detected events and the three-dimensional locations for 81.92% (684 out of 835) of the TIPP events. The TDRD and the AD of locating results between this method and the SCL methods based on ground-based lightning location networks are in the order of 10 km and 1 km, respectively. This effectively addresses the limitations of the SCL method, which is only able to locate 10% of the WEMPD-detected events.
Based on the results of this study, we are carrying out two aspects of work. On the one hand, we can gain a deeper understanding of the seasonal variations and geographical distributions of the various types of events detected by a single satellite around the world. On the other hand, the reflection hypothesis has been used to explain the formation mechanism of TIPPs, but the challenges facing this hypothesis remain unsolved. For example, 20% of TIPPs exhibit a pulse energy ratio (the ratio of the second pulse to the first pulse) exceeding unity, and there is no correlation between the two pulses within a TIPP. We can further explore the causes of this phenomenon. If the reflection hypothesis is fully confirmed, it opens up the possibility for a single satellite to measure global ground reflectivity using the pulse energy ratio of TIPPs, as suggested by [28].

Author Contributions

Conceptualization, Z.L. and P.L.; Data curation, W.Z.; Formal analysis, W.Z., X.Z., Y.W., X.L. (Xiao Li) and C.D.; Investigation, X.Z.; Resources, P.L.; Software, Z.L.; Supervision, X.L. (Xiaoqiang Li) and P.L.; Validation, B.C. and X.L. (Xiao Li); Visualization, X.L. (Xiaoqiang Li); Writing—original draft, Z.L.; Writing—review and editing, B.C., W.Z., X.L. (Xiaoqiang Li) and P.L. All authors have read and agreed to the published version of the manuscript.

Funding

This research received no external funding.

Data Availability Statement

Data are unavailable due to privacy or ethical restrictions.

Acknowledgments

Special thanks are extended to Wencai Cai and Guangze Xin from the Shanghai Academy of Aerospace Technology for their invaluable contributions and expertise. Their assistance in the areas of satellite telemetry and scientific data transmission was instrumental to our research. We greatly appreciate their dedication and support throughout the project.

Conflicts of Interest

The authors declare that they have no known competing financial interest or personal relationships that could have appeared to influence the work reported in this paper.

References

  1. Rakov, V.A.; Uman, M.A. Lightning: Physics and Effects; Cambridge University Press: Cambridge, UK; New York, NY, USA, 2003; ISBN 978-0-521-58327-5. [Google Scholar]
  2. Holden, D.N.; Munson, C.P.; Devenport, J.C. Satellite observations of transionospheric pulse pairs. Geophys. Res. Lett. 1995, 22, 889–892. [Google Scholar] [CrossRef]
  3. Troglia Gamba, M.; Polidori, B.D.; Minetto, A.; Dovis, F.; Banfi, E.; Dominici, F. GNSS Radio Frequency Interference Monitoring from LEO Satellites: An In-Laboratory Prototype. Sensors 2024, 24, 508. [Google Scholar] [CrossRef] [PubMed]
  4. Waters, C.L.; Anderson, B.J.; Liou, K. Estimation of global field aligned currents using the iridium® System magnetometer data. Geophys. Res. Lett. 2001, 28, 2165–2168. [Google Scholar] [CrossRef]
  5. Behnke, S.; Katko, K.; Edens, H.; Gatlin, P.; Lang, T.; Haynes, W.; Snow, P.; Rushton, J.; Renck, J.; Weaver, C.; et al. CubeSpark: Space-based 3-D Lightning Mapping using a Constellation of Radio Frequency Sensors. In Proceedings of the Copernicus Meetings, Vienna, Austria, 14–19 April 2024. [Google Scholar] [CrossRef]
  6. Jacobson, A.R.; Knox, S.O.; Franz, R.; Enemark, D.C. FORTE observations of lightning radio-frequency signatures: Capabilities and basic results. Radio Sci. 1999, 34, 337–354. [Google Scholar] [CrossRef]
  7. Dolgonosov, M.S.; Gotlib, V.M.; Vavilov, D.I.; Zelenyi, L.M.; Klimov, S.I. “Solitary” Trans-Ionospheric Pulse Pairs onboard of the microsatellite “Chibis-M”. Adv. Space Res. 2015, 56, 1177–1184. [Google Scholar] [CrossRef]
  8. Kikuchi, H.; Yoshida, S.; Morimoto, T.; Ushio, T.; Kawasaki, Z. VHF Radio Wave Observations by Maido-1 Satellite and Evaluation of Its Relationship with Lightning Discharges. IEICE Trans. Commun. 2013, E96-B, 880–886. [Google Scholar] [CrossRef]
  9. Lay, E.H.; Romero, L.; Peterson, M.; Nag, A.; Behnke, S.; Pailoor, N. Radio Frequency Sensor: Very High Frequency Radio Frequency Lightning Detection in Geostationary Orbit. Radio Sci. 2024, 59, e2023RS007931. [Google Scholar] [CrossRef]
  10. Li, Z.; Cao, B.; Li, P.; Li, X. Methodology and experiment study for the derivation of propagation parameters of the transionospheric electromagnetic pulses. Chin. J. Geophys. 2024. [Google Scholar]
  11. Jacobson, A.R.; Cummins, K.L.; Carter, M.; Klingner, P.; Roussel-Dupré, D.; Knox, S.O. FORTE radio-frequency observations of lightning strokes detected by the National Lightning Detection Network. J. Geophys. Res. 2000, 105, 15653–15662. [Google Scholar] [CrossRef]
  12. Tierney, H.E.; Jacobson, A.R.; Beasley, W.H.; Argo, P.E. Determination of source thunderstorms for VHF emissions observed by the FORTE satellite. Radio Sci. 2001, 36, 79–96. [Google Scholar] [CrossRef]
  13. Ahmed, M.; Seraj, R.; Islam, S.M.S. The k-means Algorithm: A Comprehensive Survey and Performance Evaluation. Electronics 2020, 9, 1295. [Google Scholar] [CrossRef]
  14. Comaniciu, D.; Meer, P. Mean shift analysis and applications. In Proceedings of the Seventh IEEE International Conference on Computer Vision, Corfu, Greece, 20–27 September 1999; Volume 2, pp. 1197–1203. [Google Scholar] [CrossRef]
  15. Ester, M.; Kriegel, H.-P.; Sander, J.; Xu, X. A density-based algorithm for discovering clusters in large spatial databases with noise. In Proceedings of the Second International Conference on Knowledge Discovery and Data Mining, Portland, OR, USA, 2–4 August 1996; AAAI Press: Portland, OR, USA, 1996; pp. 226–231. [Google Scholar]
  16. Argo, P.E.; Joseph Fitzgerald, T.; Freeman, M.J. TransIonospheric Chirp Event Classifier. In Proceedings of the Applications of Time-Frequency and Time-Scale Methods, University of Warwick, Coventry, UK, 30–31 August 1995. [Google Scholar]
  17. Li, Z.; Zhang, T.; Wei, Y.; Wang, Y.; Wang, L.; Duan, C.; Li, X.; Cao, B.; Li, P. Satellite Observations of Global Radio Frequency Noise and Strong Interference Events at 500 km Altitude: Basic Characteristics and Geographical Distribution. Adv. Space Res. 2024. under review. [Google Scholar]
  18. Enemark, D.C.; Shipley, M.E. The FORTE Receiver and Sub-Band Triggering Unit; Los Alamos National Lab.: Los Alamos, NM, USA, 1994. [Google Scholar]
  19. Rodger, C.J.; Brundell, J.B.; Dowden, R.L. Location accuracy of VLF World-Wide Lightning Location (WWLL) network: Post-algorithm upgrade. Ann. Geophys. 2005, 23, 277–290. [Google Scholar] [CrossRef]
  20. Hutchins, M.L.; Holzworth, R.H.; Brundell, C.J.; Rodger, J.B. Relative detection efficiency of the World Wide Lightning Location Network. Radio Sci. 2012, 47, RS6005. [Google Scholar] [CrossRef]
  21. Rodger, C.J.; Brundell, J.B.; Hutchins, M.; Holzworth, R.H. The world wide lightning location network (WWLLN): Update of status and applications. In Proceedings of the 2014 XXXIth URSI General Assembly and Scientific Symposium (URSI GASS), Beijing, China, 16–23 August 2014; IEEE: Beijing, China, 2014; pp. 1–2. [Google Scholar] [CrossRef]
  22. Liu, F.; Lu, G.; Neubert, T.; Lei, J.; Chanrion, O.; Østgaard, N.; Li, D.; Luque, A.; Gordillo-Vázquez, F.J.; Reglero, V.; et al. Optical emissions associated with narrow bipolar events from thunderstorm clouds penetrating into the stratosphere. Nat. Commun. 2021, 12, 6631. [Google Scholar] [CrossRef]
  23. Chen, L.; Lyu, W.; Zhang, Y.; Ma, Y. Detection results of Guangdong-Hongkong-Macao lightning location system for tall-object lightning. J. Appl. Meteorol. Sci. 2020, 31, 165–174. [Google Scholar]
  24. Huang, Z.; Roussel-Dupré, R. Total electron content (TEC) variability at Los Alamos, New Mexico: A comparative study: FORTE-derived TEC analysis. Radio Sci. 2005, 40, RS6007. [Google Scholar] [CrossRef]
  25. Lay, E.H.; Close, S.; Colestock, P.; Bust, G. Development and error analysis of nonlinear ionospheric removal algorithm for ionospheric electron density determination using broadband RF data. J. Geophys. Res. Space Phys. 2011, 116, A02316. [Google Scholar] [CrossRef]
  26. Massey, R.S.; Knox, S.O.; Franz, R.C.; Holden, D.N.; Rhodes, C.T. Measurements of transionospheric radio propagation parameters using the FORTE satellite. Radio Sci. 1998, 33, 1739–1753. [Google Scholar] [CrossRef]
  27. Light, T.E.L.; Jacobson, A.R. Characteristics of impulsive VHF lightning signals observed by the FORTE satellite. J. Geophys. Res. Atmos. 2002, 107, ACL 8-1–ACL 8-8. [Google Scholar] [CrossRef]
  28. Light, T.E.L. A Retrospective of Findings from the FORTE Satellite Mission. J. Geophys. Res. Atmos. 2020, 125, e2019JD032264. [Google Scholar] [CrossRef]
Figure 1. Schematic of the space-borne WEMPD signal detection.
Remotesensing 16 04442 g001
Figure 2. Geolocation of single-satellite detection events via the CAL method.
Remotesensing 16 04442 g002
Figure 3. Strong EMPs captured by the WEMPD. Panels (a,b) display the time-frequency distributions for the TISP and TIPP events, respectively. Panels (c,d) illustrate the time–frequency distributions of the aforementioned events following a dechirping process. The TISP event was located in Central Africa at coordinates (6.0349 N, 17.3659 E) and occurred at 4 August 2023 19:10:05.319101706 (LT), with S T E C d e c = 22.38   TECU . The TIPP event is located in the coastal area of Colombia at coordinates (6.0349 N, 17.3659 E), and the occurrence time is 6 April 2023 05:13:12.483972000 (LT), with S T E C d e c = 14.15   TECU .
Remotesensing 16 04442 g003
Figure 4. Statistical histograms of the time discrepancy ( t ) between the corrected ‘occurrence’ times of the WEMPD-detected events, accounting for distance and ionospheric effects, and the event timestamps recorded by the ground-based lightning location networks. Panel (a) represents the comparison with the WWLLN, while panel (b) corresponds to the GHMLNS.
Remotesensing 16 04442 g004
Figure 5. Evaluation of comprehensive scores for the three CAL methods under varying parameter selections. Panel (a) represents the K-means-CAL; panel (b) illustrates the MS-CAL; panels (c) and (d) correspond to the DBSCAN-CAL. Note: the comprehensive score refers to the mean of the arithmetic mean, geometric mean, and standard deviation of the TDRD of the locating results between the CAL method and the WWLLN-SCL method.
Remotesensing 16 04442 g005
Figure 6. Statistical histograms of the TDRD of the locating results between the four CAL methods and the WWLLN-SCL method. Panel (a) presents the DBSCAN-CAL; panel (b) shows the K-means-CAL; panel (c) corresponds to MS-CAL; and panel (d) represents the MSDN-CAL. The figure presents 86 samples, which correspond to the successful determination of geographical locations using the CAL method out of a total of 90 events. These events are characterized by a time difference ( Δ t ) of less than 100 μs between the WEMPD and the GHMLL.
Remotesensing 16 04442 g006
Figure 7. Statistical histograms of the differences of the three-dimensional geographical coordinates of the TIPP events’ locating results between the MSDN-CAL method and the GHMLL-SCL method. (a) TDRD; (b) AD. The figure presents 17 samples, which correspond to the successful determination of geographical locations using the MSDN-CAL method out of a total of 19 events. These events are characterized by a time difference ( Δ t ) of less than 100 microseconds between the WEMPD and the GHMLL.
Remotesensing 16 04442 g007
Table 1. Correlation of the WEMPD-detected events with the WWLLN and GHMLLS data across various time windows.
Event
Types
Event
Count
WWLLNGHMLLS
+3 ms±30 s±150 s±300 s+3 ms
MR 1 (%)MMC 2MR (%)MMCMR (%)MMCMR (%)MMCMR (%)MMC
ALL10619.61%1.0290.96%35.1998.49%162.9799.06%329.422.07%1.00
TISP2267.08%1.0088.50%29.8895.58%125.1895.58%269.250.00%0.00
TIPP83510.30%1.0291.62%41.1199.28%173.20100%370.782.63%1.00
1 MR denotes the proportion of WEMPD-detected events that coincide with those identified by the ground-based lightning location network under specific spatial and temporal parameters relative to the overall count of the WEMPD-detected events. 2 MMC is the ratio of the cumulative number of events from the ground-based lightning location network that meet the required temporal and spatial criteria to the number of the WEMPD-detected events that match the ground-based network’s detections. An MMC value of 1 indicates a one-to-one correspondence between the WEMPD-detected events and those detected by the ground-based lightning location network. The spatial window for matches, as presented in the table, is confined to an 800 km radius from the subsatellite point.
Disclaimer/Publisher’s Note: The statements, opinions and data contained in all publications are solely those of the individual author(s) and contributor(s) and not of MDPI and/or the editor(s). MDPI and/or the editor(s) disclaim responsibility for any injury to people or property resulting from any ideas, methods, instructions or products referred to in the content.

