Abstract
The Arctic, characterised by severe climatic conditions and sparse vegetation, is experiencing rapid warming, with temperatures increasing by up to four times the global rate since 1979. Extensive impacts from these changes have far-reaching consequences for the global climate and energy balance. Satellite remote sensing is a valuable tool for monitoring Arctic vegetation dynamics, particularly in regions with limited ground observations. To investigate the ongoing impact of climate change on Arctic and sub-Arctic vegetation dynamics, a review of 162 studies published between 2000 and November 2024 was conducted. This review analyses the research objectives, spatial distribution of study areas, methods, and the temporal and spatial resolution of utilised satellite data. The key findings reveal circumpolar tendencies, including Arctic greening, lichen decline, shrub increase, and positive primary productivity trends. These changes impact the carbon balance in the tundra and affect specialised fauna and local communities. A large majority of studies conducted their analysis based on multispectral data, primarily using AVHRR, MODIS, and Landsat sensors. Although the warming of the Arctic is linked to greening trends, increased productivity, and shrub expansion, the diverse and localised ecological shifts are influenced by a multitude of complex factors. Furthermore, these changes can be challenging to observe due to difficult cloud cover and illumination conditions when acquiring optical satellite data. Additionally, the difficulty in validating these changes is compounded by the scarcity of in situ data. The fusion of satellite data with different spatial–temporal characteristics and sensor types, combined with methodological advancements, may help mitigate data gaps. This may be particularly crucial when assessing the Arctic’s potential role as a future carbon source or sink.
Keywords:
arctic; tundra; vegetation; greening; satellite; remote sensing; EO; climate change; review 1. Introduction
1.1. Changes in the Arctic and Sub-Arctic Regions
The impact of global warming is severe in the Arctic regions, with surface temperatures increasing by at least three times the global rate [1]; newer studies even report an increase of about four times the global rate since 1979 [2]. The intensified impact of climate change in the Arctic is referred to as Arctic amplification. While changes in the average photosynthetic capacity approximated by Vegetation Indices (VIs) have been recognised since the early 1980s [3], the upward trend has become increasingly significant since 2001 [4]. Advances in available satellite optical data products have led to an increased use of VIs in Arctic ecological studies, resulting in the “Arctic Greening” concept. It is defined as the change of multiple ecological conditions in an extreme environment, characterised by sparse vegetation, a narrow window of vegetation growth during polar summer, and widespread permafrost. Figure 1 depicts important environmental variables that influence ongoing changes in Arctic and sub-Arctic vegetation related to Arctic Greening.

Figure 1.
Overview depicting relevant environmental variables influencing the interpretations of Arctic Greening processes in the Arctic and sub-Arctic regions. Several symbols were adapted from the Integrated and Application Network, University of Maryland Center for Environmental Science [5] and University of Berlin [6].
The Arctic comprises the tundra biome, uniquely characterized by several factors, including different plant functional types that are adapted to an extreme climate consisting of short growing periods, widespread permafrost soils, and harsh winters. Additionally, sea-ice extent exerts a strong climatic influence on Arctic coastal regions. The climatic conditions exhibit a large temperature gradient from north to south during the growing season of roughly 0–3 °C to 10–12 °C [7]. The southern extent of the Arctic is not uniformly defined. The boundary between Arctic and sub-Arctic regions varies, with different definitions, including the Arctic Circle (66°33′44″N), the treeline, or the 10 °C July isotherm [7]. A comprehensive overview of various Arctic definitions is provided by the Arctic Council [8]. This review focuses on the Arctic and sub-Arctic regions, following the boundary defined by the Arctic Conservation of Arctic Flora and Fauna used by several other reviews and reports [3,7]. In addition, the review includes the Tundra–Taiga Ecotone (TTE). Vegetation density in the tundra biome varies from almost vegetation-devoid polar deserts, typically in northern regions, to shrub dominated towards warmer, southern regions. The appearance of trees marks the transition to sub-Arctic regions, with increasing tree coverage towards the tundra–taiga ecotone zone. Even though plant species diversity is rather low in the Arctic, with less than 1% of known vascular plant species worldwide (plants with xylem tissues to transport water and nutrients), it contains over 2000 species [7]. Other plant groups common in the Arctic include bryophytes (mosses and liverworts) and algae, as well as the symbiotic complex of alga and fungi, the lichens. The climatic conditions constrain the growth of trees in this biome. The northern vegetation zone, following the definition of Walker et al. [9], is dominated by herbs, followed by the dwarf shrub zone and the southern subzone covered by evergreen shrubs. Roughly three quarter of the species belong to the plant functional type forb (herbaceous flowering plant, non grass-like), while the remaining quarter are grasses and a small percentage of sedges (grass-like flowering plants) in wetland areas. A comprehensive overview of Arctic plant species is given in [7].
While sparsely populated, the Arctic region functions as a major contributor regulating the global climate and the energy and carbon balance of the Earth [7,10]. Observing and quantifying the changes of the Arctic vegetation is therefore not only important to local stakeholders, as changes in the Arctic region will affect the rest of the world [11].
1.2. Remote Sensing of Vegetation in the Arctic and Sub-Arctic Region
Traditional ground observations are sparse in the Arctic and typically clustered close to more densely populated areas. Furthermore, these data lack a temporal component often driven by logistical constrains related to remote access to research sites. Data regarding plant parameters like species, biomass, and phenology are either collected by dedicated field campaigns or by public resources of camera networks like PhenoCam [12], georeferenced field photos [13], and eddy covariance towers like the FLUXNET system [14].
Satellite remote sensing has the advantage of observing the land surface at different temporal and spatial scales, with both long-term continuous as well as specialised short-term datasets based on different sensor types. Important applications include the monitoring of the climate change progression by gathering information on essential climate variables (ECVs). Esau et al. [1] provides a comprehensive overview of ESA Climate Change Initiative ECVs and complementary products with regards to Arctic amplification, such as land cover, sea ice extent, snow cover, and soil moisture products. The ECVs are designed to provide consistent and long-term datasets for various applications.
Several plant properties can be observed by satellite remote sensing. The change of plant productivity, height, biomass, and cover contribute to the change in VI signal [15,16,17]. Therefore, VI trends have been utilised as an approximation for Leaf Area Index (LAI) and Net Primary Productivity (NPP) [18]. The derivation of VI trends typically involves the application of regression analysis, followed by the utilisation of statistical tests to determine the trend’s significance. The shift of phenological stages impacts the greening signal [16,19], as NPP is often calculated as an integrated value for the entire growing season. The start and end of the growing season (SOS and EOS) are derived by phenometrical algorithms, whereby the timing of the phenological stage is generally associated with a specific VI threshold. The phenological development also impacts the food web of the Arctic, with potential mismatch between available food sources and propagation of consumers like reindeer, caribou, and smaller prey animals [7]. Finally, a changing species composition on the ground can also impact the VI signal [17,20,21], as the coverage of photosynthetic active foliage is highly variable for species common in the Arctic and sub-Arctic regions. The species composition is typically derived through the application of diverse classification algorithms to satellite imagery, in conjunction with reference data to train and validate the algorithms.
While the majority of the Arctic region exhibits either no trend (∼58% of area) or an increase of VI signal (∼38% of area), some regions indicate a decline in VIs or trend reversal, which is also known as “Browning” (∼4% ) [16,17,22]. The browning signal can be attributed to a number of different disturbance events, including wildfire, insect damage, and changes in soil properties due to thawing permafrost. These can in turn lead to the formation of retrogressive thaw slumps and erosion [23,24,25]. Unfavourable changes in the ecosystem can result in either drought stress [10,26,27] or flooding [27]. Both can lead to a continuous browning trend.
1.3. Objectives of This Review
The main objective of this review is to present the findings and developments of satellite remote-sensing applications employed for monitoring vegetation changes in the Arctic, sub-Arctic, and TTE regions. The review complements and builds upon recent and long-standing reviews and reports, such as Piao et al. [3], Beamish et al. [10], Myers-Smith et al. [16], Stow et al. [28], Walker et al. [29], Tommervik et al. [30], Jorgenson and Grosse [31], Callaghan et al. [32], Foster et al. [33], and Esau et al. [1]. It encompasses new literature, with a potential new methodological focus based on the rise of Artificial Intelligence (AI) in the remote-sensing community, and it differs from previous reviews by focusing specifically on dynamic vegetation change.
We seek to answer the following questions and identify knowledge gaps: 1. How is Earth observation data utilized to analyse the changes in the Arctic vegetation? 2. Are there common (circumpolar) trends in the changes of Arctic vegetation and which data and methods have been used to derive them? 3. Are there common ecological conditions connected to circumpolar trends?
2. Review Methodology
The literature review was conducted in the Web of Science database and follows the PRISMA guidelines [34]. A search string was defined to extract important Science Citation Index (SCI) papers focusing on dynamic vegetation changes analysed with satellite remote-sensing data. The central steps of the review and the resulting number of relevant papers are depicted in Figure 2. The entire search string is listed in Table 1 and defines keywords regarding vegetation, the Arctic region, satellite platforms, and temporal coverage. Exclusion criteria based on the article title and keywords were added to filter articles with a non-vegetation research scope. Finally, the search string includes the publication year, language, and document type. A summary of the included and excluded publications is provided in the supplementary material.
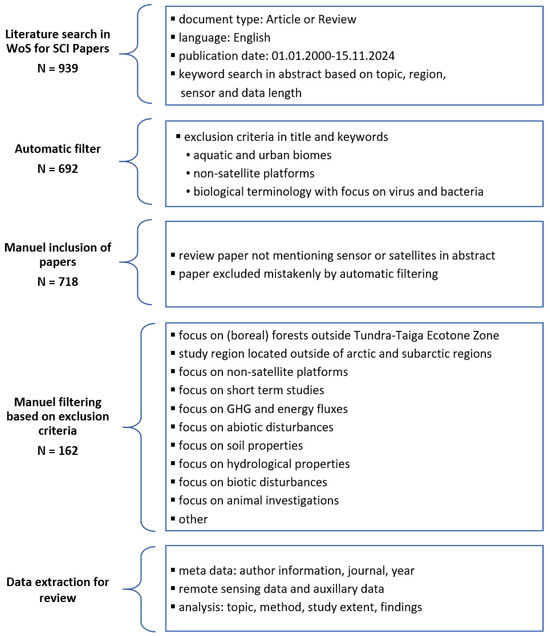
Figure 2.
Overview of the selection process for important Science Citation Index (SCI) articles in this review based on the Web of Science (WoS) database. GHG: greenhouse gas.

Table 1.
Search string used in the WoS database.The asterisk sign (*) is used as a wildcard in the search string.
The year 2000 was chosen as the starting point for the analysis due to the availability of data from the Moderate Resolution Imaging Spectroradiometer (MODIS) sensor on board the Aqua and Terra satellite constellation. This allowed for the inclusion of significant articles and review papers that have already been recognised by the scientific community, as well as more recent research results. The focus on English articles may have resulted in a degree of limitation in the comprehensiveness of the findings. The final search string yielded 692 papers. An additional 26 articles were identified as being of particular significance based on the review articles and other highly cited articles and were subsequently included in the selection. Some of the articles were excluded in the search string based on their keywords, while others did not mention satellite or sensor names in the abstract.
The article selection was further reduced to 162 articles by applying the exclusion criteria set out in Figure 2. The screening process was conducted by one author (M.W.), and ambiguous articles were discussed in detail (M.W. and A.D.). The objective of this review was to examine long-term vegetation developments associated with greening processes in the Arctic and sub-Arctic regions, employing satellite remote-sensing techniques. The Tundra–Taiga Ecotone (TTE), also known as the Tundra–Forest Ecotone (TFE), was selected as the southern boundary for this review. A further 85 studies were excluded on the grounds that they focused on the boreal regions, while a further 65 studies had study sites located outside of the Arctic and sub-Arctic regions.
The study areas were classified in descending order of size, from the smallest to the largest: “local”, “regional”, “national”, “circumpolar”, and “circumpolar including boreal”. The Bathurst Caribou range in the Northwest Territories of Canada was identified as a significant research focus and is thus designated as the reference area for the “regional” study area category. Study areas smaller than the Bathurst Caribou range area of approximately 390,000 km2 were defied as “local”. This category therefore includes study areas that may be captured by a single satellite pixel or multiple satellite images. The Alaska and Yukon region was another research hotspot and was therefore used as the “national” reference, with an approximated area of 1,770,000 km2. Both reference areas are depicted in Figure 5b. If the study area encompasses the circumpolar region delineated by the black outline in Figure 5b, it is classified as “circumpolar” rather than “national”. This category includes both the Arctic and sub-Arctic biomes. Studies encompassing the TTE and smaller portions of the boreal biome are categorised as “circumpolar including boreal”, since some global studies applied a more general definition of the tundra biome, including latitudes above 45–55° North. In this review, only findings regarding the tundra biome and the TTE zone were included.
Another important parameter to analyse is the spatio-temporal resolution of the utilised satellite data. The spatial sensor resolution was divided into six categories, each defined by an interval that indicates excluded numbers by outward facing square brackets and included numbers by inward facing square brackets. The categories are: , , , , ]500, 10,500] metre (m) and “other” and were chosen based on the resolution of common satellite products. The temporal coverage of the utilised sensor and satellite data was either considered continuous for periodic time series or discontinuous for a smaller number of satellite images spanning decades. Short-term studies with less than 5 years of continuous data were excluded as this review is focused on long-term changes of vegetation parameters. The five-year threshold allows the inclusion of studies using data from more recent satellite missions like the Sentinel fleet. However, it does not satisfy the common threshold of 30 years, which is, for example, used as a standard for trend analysis in climatology [35]. The temporal criteria resulted in the exclusion of 66 articles. A further 67 articles were excluded as they primarily utilised non-satellite Earth observation data, including airborne platforms such as aircraft and Unmanned Aerial Vehicles (UAVs), as well as in situ data.
The remaining articles were excluded on the grounds that they focused on non-vegetation research objectives. All vegetation-related research objectives were categorised in the context of this review into six overarching categories: “literature review”, “VI trends”, “plant productivity”, “species composition”, “plant phenology”, and “disturbance”. While many studies encompass multiple research objectives, one main objective was selected which matched the research focus the most to evaluate possible shifts in research priorities. The first category includes all reviews and general reports which cover multiple research topics regarding Arctic vegetation. The second research objective category includes all studies which analysed radiometric index trends and the derived data products. Such products include LAI and FPAR. The “plant productivity” category focuses on articles which derived the primary productivity of Arctic vegetation or the biomass. The change of species composition, treeline shifts, and the expansion of shrubs was summarised into the “species composition” category. Articles focusing on the development of vegetation and their seasonality were categorised as the “plant phenology” category. Finally, the “disturbance” category includes articles which focus on disturbance and recovery mechanics in the Arctic vegetation.
Articles which did not fit the six research objective categories exhibited the following research foci: greenhouse gases and energy fluxes (67 studies), abiotic disturbance detection, such as wildfire (52 studies), biotic disturbances, such as grazing (29 studies), soil and hydrological properties (49 and 38 studies), and animal behaviour (24 studies). Six articles were not allocated to any category and were therefore summarised as “other”. Articles that identified abiotic or biotic disturbances as the primary drivers of vegetation development were retained for further analysis, as their focus was on the impact of these disturbances on plant growth.
The final 162 papers were analysed based on the following criteria:
- Quantitative analysis of meta data, like number of published articles per year and first-author affiliations
- Spatial and temporal coverage of studies
- Utilised sensor and satellite data
- Examined research objectives
- Methods
- Important findings and challenges
3. Results
3.1. Quantitative Analysis of Publication Meta Data
Figure 3 illustrates the number of articles published on a yearly basis, with the colour of each bar representing the predefined study area category. The number of studies is increasing with time, from 5 studies in 2000 to 13 studies for the years 2020–2022. The number of articles in 2024 decreased to nine as only studies up to the 15th of November were considered. Local studies represent the primary area size of research throughout the 2020–2024 period. The “circumpolar” and “circumpolar including boreal” category have increased in recent years since 2010. National and regional studies are roughly equally distributed during the entire time frame. The dip in 2016–2017 is probably related to fewer publications in 2017 and a large number of excluded articles in 2016.
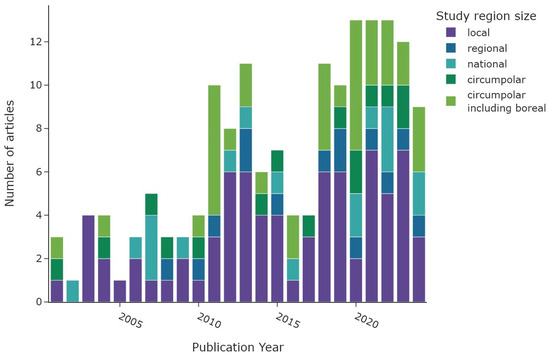
Figure 3.
Number of articles per publication year. The colour scheme depicts the extent of the study regions.
The origin of the first-author-affiliated research institution is depicted in Figure 4. The first-author affiliations were predominantly located in the USA (68 articles), Canada (25 articles), and China (14 articles). A smaller number of publications were sourced from Russian institutions (nine articles) and Scandinavian countries (Norway with six, Sweden with two, and Finland with five publications). The remaining affiliations were predominantly Central European, with the exceptions of Australia, South Korea, and Iran. The location of affiliated research institutions align with the locations of the study sites, which are predominantly in North America. Countries with tundra biomes that are directly affected by Arctic change account for nearly three-quarters of the first-authoring institutions. The number of Russian contributions may be underestimated, as only English articles were considered for this review.
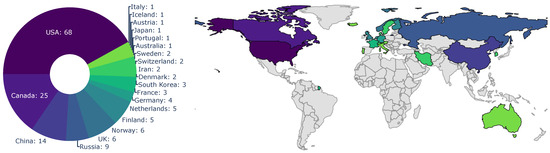
Figure 4.
Distribution of first-author affiliation. The colour scheme depicts the number of articles with the same first-author country.
3.2. Spatial and Temporal Coverage
Figure 5 provides an overview of the study area size and geographical location. Almost half of all reviewed studies were conducted on a local scale. Cirumpolar studies were the second-most common, followed by studies including the boreal area (see Figure 5a). Figure 5b displays the approximated study area extent of all reviewed articles in a polar projection. The extent was either inferred by considering maps in the article or more precisely transferred if coordinates were mentioned. The black line depicts the boundary for the circumpolar Arctic and sub-Arctic regions and is based on the Arctic Conservation of Arctic Flora and Fauna (CAFF) boundary [36]. The reference areas for “regional” and “national” area size are depicted in blue colours. Most articles cover a study area within the sub-Arctic boundary, with a clear focus on the North Slope of Alaska and the Canadian Arctic regions. Fewer studies cover the Eurasian continent, with two hotspots in the Scandinavian and Russian Arctic regions. Articles covering the entire study area are often based on global or northern hemispheric datasets [37,38,39]. Hotspot study areas are as follows:
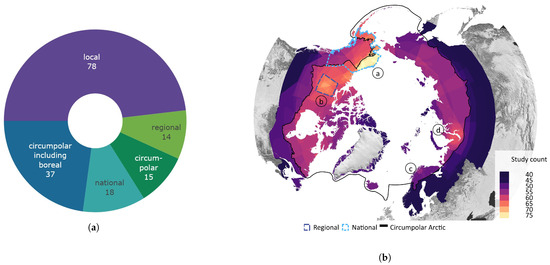
Figure 5.
Overview of study area size and location. (a) Number of articles categorised by area size as follows: local < 390,000 km2, regional: 390,000 km2–1,770,000 km2, national: >1,770,000 km2, circumpolar: >1,770,000 km2 distributed around the pole, circumpolar areas including boreal, and circumpolar studies extending southward of the Arctic Conservation of Arctic Flora and Fauna (CAFF) boundary. (b) Circumpolar distribution of study regions with four frequent study locations labelled alphabetically. The black line depicts the boundary for the circumpolar Arctic and sub-Arctic regions and is based on the CAFF boundary [36], the dotted bright and dark blue lines show the reference areas for the “regional” and “national” study area size. The colour depicts the number of studies covering the study area. The letters a–d refer to the hotspot study areas described in Section 3.2.
- (a)
- the North Slope of Alaska with 28 dedicated studies [23,24,25,40,41,42,43,44,45,46,47,48,49,50,51,52,53,54,55,56,57,58,59,60,61]
- (b)
- the Bathurst Caribou Range with 7 dedicated studies [19,42,62,63,64,65,66]
- (c)
- the Finnmark region with 7 studies [26,30,67,68,69,70,71]
- (d)
- the Yamal Peninsula region with 6 studies [29,72,73,74,75,76,77]
The temporal coverage of the reviewed articles is visualised in Figure 6. Four launch dates of the most common satellites are shown as vertical lines for reference. The green line depicts the launch of the Landsat constellation in 1972, which includes payloads of several multispectral and thermal sensors over the years. The red line indicates the launch of the Advanced Very High Resolution Radiometer (AVHRR) multispectral sensor mounted on US National Oceanic and Atmospheric Administration (NOAA) satellites in 1978. The orange line depicts the launch of the “Satellite Pour l’Observation de la Terre” (SPOT) satellite, with multispectral sensors, and the purple line indicates the launch of the Aqua-Terra constellation, with multispectral MODIS sensors on board. The distinction between continuous time-series and discontinuous multi-temporal data was omitted for clarity.
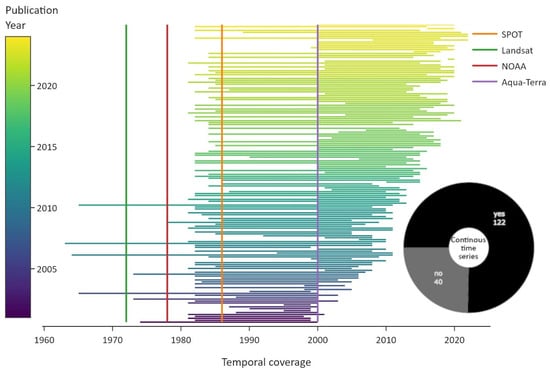
Figure 6.
Overview of the temporal coverage of studies, colour coded by publication year. The vertical lines indicate the launch dates of important satellite constellations. The pie chart displays the distribution of continuous data, which refers to periodic time-series data.
The length of the utilised satellite data increased in general in more recent publications. Few studies employed de-classified reconnaissance satellite data from the 1960s, and they were published between 2006 and 2014 [78,79,80,81]. The impact of the AVHRR and MODIS datasets is quite visible. While AVHRR sensors were launched in 1978, popular AVHRR-based products include data starting from 1981/82 onwards, like the Global Agricultural Monitoring System (GIMMS) Normalised Difference Vegetation Index (NDVI) or the NOAA Climate Data Record Leaf Area Index (LAI) dataset [82,83]. Continuous AVHRR data starting from 1981/82 were used in 41 articles. Another five studies summarised results based on AVHRR data in review papers and reports. In total, roughly three-quarters of the studies used continuous time-series data.
3.3. Examined Research Objectives
Figure 7 shows the overall distribution of research objectives; the colour represents the corresponding main objective category. The category “VI trends” (n = 77) accounts for 48% of all research objectives (n = 162), with NDVI trends derived in 66 articles alone. An overview of all utilised radiometric indices and derived vegetation parameters is shown in Table 2. The “species composition” category is represented by 35 articles (22%), followed by “plant phenology” with 17 articles (10%). The category “plant productivity” was focus in 17 articles, followed by “disturbance” with a total of 8 articles. The same number of articles were categorised as “literature reviews”. The temporal distribution of the main research objectives is displayed in Figure 8. Most research objective categories are roughly equally distributed during the study period, with the exception of “plant phenology” and “disturbance”. Both categories are not present before 2009 and are more common since 2018. Figure 9 shows the number of study areas which found significant changes in the research objectives of “VI trends”, “species composition”, and “plant phenology”. The first category is divided into positive VI trends, indicating vegetation greening, and negative trends, indicating vegetation browning.
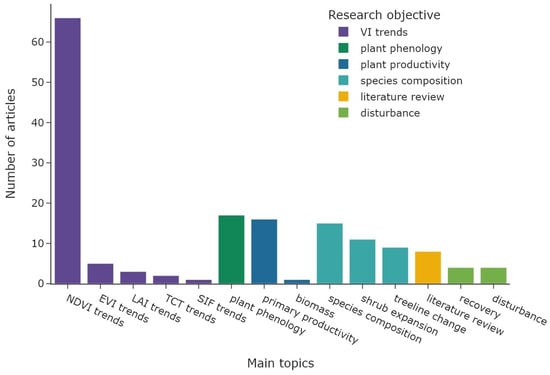
Figure 7.
Distribution of main research objectives. The colour represents the general objective category.
Table 2.
Overview of radiometric indices and related VI-based vegetation parameters in order from most to least common.
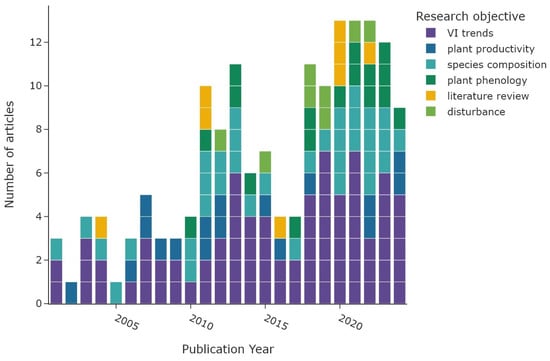
Figure 8.
Main research objectives per publication year. The colour represents the general objective category.
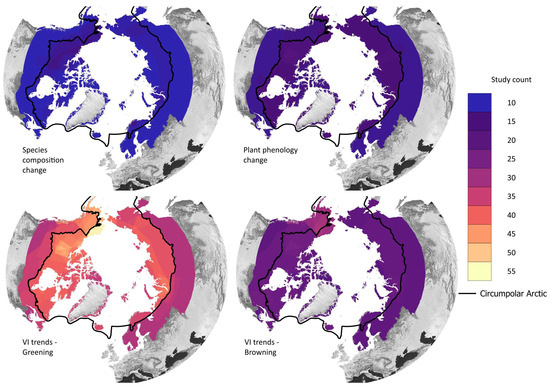
Figure 9.
Study location where significant changes were found for the research objectives “species composition” and “plant phenology” and the positive VI trends (greening) and negative VI trends (browning). The black line denotes the CAFF boundary, which includes the Arctic and sub-Arctic regions.
3.3.1. VI Trends
This section summarises the findings of 77 articles that focus on radiometric trends and presents key insights.
A majority of 28 studies (36.4%) that set out to derive VI trends found greening trends in at least some parts of their study area [18,48,50,56,58,61,64,72,89,90,91,92,93,94,95,96,97,98,99,100,101,102,103,104,105,106,107,108] or mixed trends with predominately greening in another 26 studies (33.8%) [1,3,22,23,24,25,55,59,60,65,109,110,111,112,113,114,115,116,117,118,119,120,121,122,123,124]. Only four studies (∼5%) found predominantly browning trends in the tundra [27,125,126,127], while several other studies found partial browning trends. The drivers for browning in the tundra were found to be related to hydrology, both by flooding events and summer droughts [27,127], or snow melt leading to strong absorption in the near-infrared and shortwave infrared bands [126]. Biotic disturbances like increasing built-up and abiotic disturbances like volcanic ash were also connected to browning trends [125]. The absence of VI trends does not imply ecological stability, as ∼12% of radiometric vegetation index studies found changes in the Arctic vegetation without significant VI trends [17,29,128,129,130,131,132,133,134].
Table 3 offers an overview of selected studies that have identified primarily greening trends. It demonstrates the diverse methods of trend tests and significance levels that are frequently applied. The depicted study area is inferred from maps and location description of the referenced articles. Not all of the 77 studies presented the VI trends in terms of change per year, and a significant portion did not specify the trend test or the significance level, making cross-comparison of the different trends challenging. This is not only due to the different spatial and temporal satellite resolutions but also because of the varied statistical methods applied.
Table 3.
Overview of VI trends, trend tests, and significance parameters for a selection of studies that found (predominantly) greening trends.
Greening trends were often derived in the North Slope of Alaska and in the Bathurst region (see Figure 9), similar to the overall study location distribution (see Figure 5b). It is important to note that comparing trends can be challenging, not only due to variations in spectral data and the length of time series but also because different trend tests and significance thresholds are frequently applied. The magnitude of the greening trend in Alaska, for example, ranges from an increase in NDVI by 0.003 based on 1982–2003 AVHRR-NDVI data [59] and 1984–2012 Landsat-NDVI [55] to 0.03 based on 2000–2015 MODIS-NDVI data [56]. Forkel et al. [94] recommends, based on testing different trend detection methods for the Alaska region, creating a multi-method ensemble NDVI trend. Browning trends were also more common in Alaska (see Figure 9), but few articles found predominantly browning trends.
The analysis of VI trends and their possible drivers was generally conducted by taking several environmental parameters into account. The influence of land cover on VI trends was the focus of eight studies. Wang and Friedl [109] found that almost half of the areas showing land-cover change also exhibit significant NDVI trends. While shrub loss resulted in both browning and greening trends, shrub and herbaceous cover increase was only associated with greening trends. Other studies have identified a more pronounced greening signal in areas covered by shrubs, but no evidence was found to suggest an increase in shrub coverage [64]. However, a general positive relationship between (increased) shrub cover and greening trends was found in several studies (e.g., [20,24,72,101]).
Temperature, in combination with land cover, was also commonly used as an environmental parameter. Olthof and Latifovic [128] compared VI trends with temperature anomalies for dry and humid regions in Canada. The NDVI trend did not change in dry regions with increasing temperatures. However, a significant increase in NDVI was detected for shrubs and trees and negative trends for lichen and moss. In contrast, a study in Siberia by Dutrieux et al. [121] found that species common in the bioclimatic subzone A (barren, moss, and lichen coverage) showed the largest increase in NDVI. Heterogeneous trends were also found by Berner et al. [110], showing a strong increase in average tundra greenness based on maximum NDVI and summer air temperature for the last three decades in the Arctic region. Several other studies support the positive correlation between summer NDVI trends and increasing surface temperature [18,24,111]. The impact of temperature was found to be stronger in colder, shrub-dominated regions, whereas soil moisture availability was also relevant in warmer regions in the tundra–taiga ecotone zone [112]. The influence of soil parameters on VI trends was investigated by some studies [25,92]. The findings indicate a positive relationship between smaller grain sizes (derived from field samples and geological maps) and greening rates.
Surface water and soil moisture were key factors examined in VI trend studies. Li et al. [22] investigated the relationship between VI trends and surface water based on the Global Surface Water Dataset for different spatial scales ranging from 30 m up to 4 km satellite data. While the reduction of surface water was correlated with greening trends, browning trends were correlated with increased surface water, possibly due to water logging and permafrost thawing. Bieniek et al. [60] found declining NDVI trends in the early growing season in Alaska which coincided with higher snow depth, but there was overall greening for the entire growing season. Another study derived the influence of water availability on the VI signal during different phenological stages. Increased vegetation growth in spring was related to decreased soil moisture and greenness in summer for the tundra [135]. In general, soil moisture was found to be a driving force for local differences in plant size and coverage [93,100,124], especially in the drier parts of the tundra [124]. The influence of permafrost thaw on LAI and NDVI was the subject of a study by Chen and Jeong [136]. Negative correlations for VI trends and permafrost thaw were found during the early to mid growing season (and positive temperature–VI trend correlation) and positive relationships for the late growing season (and positive soil moisture–VI trend correlation).
The comparison of VI trends during different phenological stages was another common research approach. Greening trends derived over the entire growing season were the subject of several studies (e.g., [89,90]), with generally stronger trends for the lower Arctic. The strongest difference between tundra vegetation types (moist acidic, moist non-acidic, shrub, sandy, and wet tundra) were found in the early growing season [49], while both vegetation type and soil substrate were shown to strongly impact seasonal NDVI, regardless of climate data.
Several studies focused on comparing different VI trend products [37,61,96,99,107,115,117,118,122,137,138], highlighting discrepancies between, e.g., AVHRR-NDVI and MODIS-NDVI, especially for the higher latitudes [37,122]. Beck et al. [96] compared four different AVHRR-based NDVI products with Landsat-NDVI and MODIS-NDVI. MODIS-NDVI showed the best agreement with Landsat-NDVI in comparison to all four AVHRR-based products. The AVHRR-based LTDR V3 product had lower atmospheric errors compared to the other products and followed the absolute values of Landsat-NDVI best; however, GIMMS-NDVI was better suited for change detection in the 1981–1999 time period.
3.3.2. Species Composition
The research objective category “species composition” includes articles that investigated the general changes of Arctic vegetation composition. The sub-categories “treeline change” and “shrub expansion” summarise the findings for these plant types specifically. The spatial distribution of study areas where species composition changes were noted is depicted in Figure 9. Alaska, Western Canada, and a small part of Scandinavia were slightly overrepresented.
The change of the boreal treeline was investigated in nine studies (e.g., [54,62,63,68,70,81,139,140,141]). Several articles found no evidence of treeline advancements, e.g., in Canadian study regions based on the analysis of Landsat data from 1974 to 2000 [62] or in the Finnish Lapland region [70]. In contrast, Macander et al. [43] found evidence for birch and pine advancement into the tundra region of Finnmark. Furthermore, an increase in the extent of the treeline was derived in the Canadian region of Labrador [140] and in the Vorkuta region [141]. The circumpolar study of the tundra–taiga ecotone by Guo and Rees [139] analysed the state of fragmentation and latitudinal trends. Northward trends were found for eastern Canada, Scandinavia, and Eurasia between 100 and140°E and opposing southward trends for Hudson Bay, parts of Siberia, and Eastern Europe. Southward trends were connected to paludification (conversion of forests to peatland), while northward trends were connected to a higher fragmentation of vegetation. Contrary to the previous study, forests in Siberia were found to move northwards [39]. Larch stands were found to advance into the tundra ecosystem with a rate of 3–10 m per year based on a comparison of declassified reconnaissance satellite data by the CORONA programme from the 1960s and Landsat data in the forests of the Russian Taymyr Peninsula [81].
Fifteen studies focused on mapping the changes of several plant types [15,21,42,43,67,71,79,142,143,144,145,146,147]. While six authors found declining lichen cover, e.g., in the Scandinavian [67,69] or North American TTE [43], Caribou ranges in Alaska and Canada [42], Greenland [147], or the Siberian lowland [21], the drivers and benefiting land-cover classes differ. The studies by Johansen and Karlsen [69], Kennedy et al. [42], and Tommervik et al. [67] identified Reindeer or Caribou grazing as a driver for declining lichen cover and increasing shrub cover in the latter studies. Similar tendencies of decreasing lichen cover coinciding with increasing shrub cover were found in parts of the North American TTE by Macander et al. [43] and in the Mackenzie Delta region by Nill et al. [15] by applying supervised machine-learning algorithms.
The term “shrubification” denotes the increase and spread of shrub vegetation into the higher tundra regions. Eleven studies focused solely on the expansion of shrubs into the lichen-dominated tundra [44,45,47,51,57,76,78,148,149,150,151].
Evidence of increasing shrub cover was found in the alpine tundra region of Canada and Alaska [44,148], and in the North Slope of Alaska [44]. Shrub expansion mainly occurred adjacent to existing shrubs, especially along drainage slopes and valley bottoms [44,148] or within flood plains [44], while shallow permafrost along coastal areas limited shrub growth [44]. In addition, Schore et al. [57] found that decreasing near-surface permafrost probability was positively correlated with both willow and alder shrub abundance at the Seward Peninsula of Alaska. The authors concluded that alder shrubs, with their nitrogen fixating abilities, could mitigate poor soil conditions and facilitate shrub expansion. Similar environmental parameters influenced the shrub growth in Siberia, where active disturbance regimes like flood planes and thawed permafrost soils showed both the strongest decline and increase of shrub cover [78]. Positive correlations between shrub growth and pre-growing season temperatures were found in the Alaskan Arctic [150]. Temperature was also a limiting factor for shrub growth in Greenland [149]. In contrast, a study in North America by Liu et al. [47] found that seed dispersal and fire were the main controls on shrub expansion opposed to environmental suitability.
Three studies found no significant changes in circumpolar Arctic vegetation cover types. A multi-satellite data classification of forest, shrub, and herbaceous cover types using a random forest machine-learning approach in the North American tundra–taiga ecotone revealed tendencies of increased shrub and herbaceous classes but no significant trends [142]. Shrub cover on the Kola peninsula was also found to remain stable by Kravtsova and Loshkareva [143], and the Beringian Arctic region showed no consistent trends or overall changes [79].
3.3.3. Plant Phenology
Figure 9 shows that changes in the vegetation phenology were more common within the Arctic tundra region. Fewer studies found significant changes in the transition zone between the sub-Arctic and TTE.
Circumpolar studies were conducted by seven authors [152,153,154,155,156,157,158]. Madani et al. [152] derived trends of growing season length for the circumpolar Arctic using a 2000–2020 MODIS SIF time series. They found that ecoregions were the most important parameter to explain phenological trends, with increased photosynthetic activity in the early growing season and declining growth towards the end. NDVI trends were similar to SIF trends. The lowest green-up velocities were found for lichen, mosses, and sparse vegetation, which also showed a slight negative trend [153]. Velocity was positively correlated with temperature and negatively with precipitation [153]. Other studies showed variability in SOS and End-of-Season (EOS) timing based on extraction methods and the vegetation index dataset [154], with discrepancies between different phenological metrics for the North American tundra [155]. Zeng et al. [156] found discrepancies between MODIS and AVHRR for phenological timings, with AVHRR indicating delayed EOS, while MODIS exhibited strong significant SOS advancement in North America. Contrary to these findings, Gonsamo et al. [157] derived decreasing growing season length for the Arctic regions, while both sub-Arctic and boreal regions showed an increasing growing season length. SOS was detected earlier in Eurasia, while EOS was derived earlier in most polar regions.
Several studies derived an SOS trend in the coastal regions and the northeastern part of Brooks Range in Alaska [46], in northern Alaska [159], parts of the Siberian TTE [160], and in one coastal study site in Greenland [161]. The average vegetation growth onset in Svalbard was shown to advance based on both MODIS and Sentinel-2 data [162]; however, the study by Karlsen et al. [163] showed no significant phenology trends for SOS for Svalbard based on a 2000–2013 MODIS time series.
The growing season length in multiple national parks in Canada was found to increase as the end of the growing season was delayed for many tundra vegetation classes, especially for mountainous regions [19]. The authors concluded that the higher spring temperature increase in the mountains is likely the primary explanation for the topography dependency in phenological changes, rather than attributing the changes to the reduced snow cover due to fewer woody vegetation types.
The Yamal Peninsula region showed heterogeneous phenological timings, with strong latitudinal relationships for SOS, EOS, and last day of snow cover [73]. Snow cover was identified as a key driver for EOS timing for all land-cover classes; however, the SOS timing responded differently to snow cover depending on the land-cover classes. Another study in the same region revealed no significant phenology trends based on either MODIS or SPOT data, while AVHRR-based trends showed delayed EOS [74].
3.3.4. Plant Productivity
The “plant productivity” category includes 16 articles focusing on the estimation of primary productivity and one article deriving the plant biomass as the main objective.
Vegetation Gross Primary Productivity (GPP) is a measurement of the total amount of fixed in an ecosystem through plant photosynthesis, while Net Primary Productivity (NPP) is the remainder of GPP after plant respiration. Both values are often derived by combining remote-sensing-based LAI products with a Production Efficiency Model (e.g., [40,41,164,165,166]). Positive trends for both GPP and NPP were found by Kimball et al. [40] for the 1982–2000 period in the Western Arctic Linkage Experiment in Alaska and northwest Canada, and both measurements were positively correlated with summer temperature. Early thawing of permafrost in spring was found to be correlated with greater LAI and annual productivity in the same study region and time frame [41]. The authors concluded that the primary constraint of canopy photosynthesis and NPP was low temperature and not soil moisture. Contrary evidence was found a few years later by Zhang et al. [164] for the circumpolar Arctic tundra. The tundra region exhibited a positive mean annual NPP trend despite droughts during that time period. A small positive productivity trend for the tundra biome with was also found by Zhang et al. [166], based on the reanalysis of meteorology data in combination with AVHRR-based LAI and FPAR products. The main driver linked to the increased productivity were the changes in vegetation cover rather than meteorological changes.
Photosynthesis and respiration model results based on remotely sensed FPAR and climatic variables showed increased growing season length and photosynthetic uptake in the tundra vegetation. Higher latitudes were found to be a carbon source since 2011 due to changing environmental conditions negatively impacting boreal forests, despite increased carbon uptake in the tundra [167]. A similar approach was used in the study by Tagesson et al. [168]. The authors found increasing GPP uptake in Zackenberg for the time frame 1992–2008; however, the model uncertainty was considerable.
Marsh and Zhang [169] compared three GPP products based on remotely sensed Solar-Induced Chlorophyll Fluorescence (SIF) data (GOSIF-GPP), Near-Infrared Reflectance AVHRR data (NIRv-GPP), and in situ eddy flux measurements fused with satellite data (FluxSat-GPP) for the northern hemisphere. The authors found that spring temperature increase is correlated with an increase in productivity in the Arctic ecosystem for all products.
Another common indirect measure of vegetation productivity is the time-integrated VI (e.g., [66,170,171]). While some articles applying this research focus might fall under the “VI trends” category, the categorisation was made based on the research intent and the terminology chosen by the authors. The increase of time-integrated VI coincided with increased growing season length [66], increased plant biomass [170], and increased temperature [52]. The GPP estimate based on a 1982–2014 time-integrated NDVI time series showed a continuous net increase for the tundra vegetation, while growing season metrics exhibited heterogeneous trends [165]. Beck and Goetz [171] found that productivity increased for several plant functional types in the circumpolar tundra, with the exception of the Siberian tundra, where no trend was found. Tundra productivity in Eurasia was related to sea ice in late spring and large-scale weather patterns, while the correlation between temperature and NDVI was the strongest [77]. A study by Tommervik et al. [30] investigated biomass change for mountain birch forests and mountain heath in northern Norway based on aerial, remote-sensing data and in situ biomass data. While tree biomass, shrubs, and vascular plants in general increased in biomass, lichen biomass significantly decreased from 1957 to 2000, with a small recovery from 2000 to 2006, connected to reduced reindeer grazing.
3.3.5. Disturbance
The “disturbance” category encompasses studies focusing on attributing potential causes of disturbance as well as vegetation recovery after known cases of disturbance.
Slightly more articles focused on finding potential drivers and causes for disturbance events, e.g., [33,172,173,174]. Negative MODIS-NDVI trends in parts of Alaska were associated with early spring permafrost thaw, indicating elevated surface moisture, especially in low-elevation drainage systems [172]. Early spring snow melt was found to be related to the area burned by wildfire in northern Alaska, while large wildfires coincided with negative NDVI breakpoints [173]. A general overview of disturbance types and interactions by Foster et al. [33] for the boreal and tundra region of North America revealed that high-intensity events are less common than low-severity disturbance events. Drought and wildfire disturbance events are often linked, with evidence of positive links of wildfire and increased deciduous shrub growth in the tundra. In addition, abrupt trend changes before and after a break point are often distinctly opposite, e.g., gradual browning trends followed after abrupt greening, and vice versa [174].
Studies focusing on vegetation recovery found both quick recovery after winter warming events within 2 years [26] and slow recovery after a tundra fire ∼25 years later [75]. NDVI and SAVI were best suited to monitor recently established vegetation for up to 6 years in a study region in Alberta, avoiding the saturation effects of high LAI vegetation (>3 ) [175]. The authors found that, while NDVI and SAVI exhibited better relationships with in situ LAI, SR was a better indicator for stem density.
3.4. Sensors and Satellites
This section describes the characteristics of the sensors mounted on various satellite platforms and the environmental parameters applied in the analysis.
Sensor data types were classified into the following categories: (1) Multispectral data, which typically ranges from the visible spectrum (380–700 nm) to near-infrared around 1.5 m; (2) Thermal data, with spectral wavelengths ranging from 3 to 10 m; (3) Hyperspectral data, with a similar spectrum to multispectral sensors but in much narrower spectral bands covering only 5–10 m; (4) Historical reconnaissance satellites carrying black and white (B/W) cameras; (5) Light Detection and Ranging (LIDAR) instruments, which use lasers to derive the distance between the satellite and the Earth’s surface.
Figure 10 displays the distribution of used satellite constellations and their sensor types. The pie chart in Figure 10a shows that 56.2% of the studies analysed data from a single satellite platform, with a large majority focusing solely on multispectral sensor data (∼93% of single platform studies). Multispectral in combination with thermal data accounted for 2.5% and the remainder were thermal data. The most common satellite platform used was NOAA, with the majority of studies solely using optical AVHRR data (see Figure 10b, n = 32). The Aqua-Terra constellation was used in 26 articles, followed by Landsat in 21 articles. Less common were the SPOT, IKONOS, and Sentinel-2 satellites with, in total, only six articles.
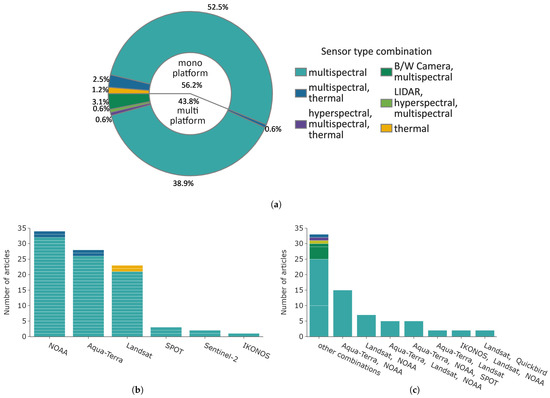
Figure 10.
Overview of platforms, classified by mono- or mulit-platform use. The colour indicates the sensor type. (a) Distribution of single and multi-platform studies. The colour depicts the sensor type or sensor type combinations for multi-platform studies. (b) Distribution of mono-satellite platforms. (c) Distribution of mulit-satellite platforms.
The most common sensor type of multi-platform studies was “multispectral”, with ∼89% (63 studies in total). The satellite combinations are shown in Figure 10c. Most combinations include Aqua-Terra, NOAA, and Landsat satellites. Four studies combined data with high resolution IKONOS or QUICKBIRD data of up to 10 m spatial resolution. All other unique satellite combinations were grouped into “other combinations”. This group includes all sensors types; however, only eight articles used sensor data besides multispectral data.
The total number of all satellite platforms from mono- and multi-platform studies is displayed in Figure 11 in a logarithmic scale. Figure 11a (left) depicts the sensor type, and the right Figure 11b illustrates the spatial resolution of the sensors. While the sensor type is predominately multispectral, the sensor resolution is considerably more heterogeneous. The majority of satellite data exhibits a spatial resolution of 10 to 80 m, largely due to the prevalence of Landsat, SPOT, and Sentinel-2 data. The low spatial resolution of 500 to 10,500 m is also very common due to the NOAA-AVHRR satellite constellation 1100 m spatial resolution, similar to the low to medium resolution of the Aqua-Terra constellation, with 80 to 500 m. Very high to high spatial resolution ranging from 0 to 10 m is used in forty articles. However, the overall prevalence is much smaller compared to the most common categories of 10–80 m, 80–500 m, and 500–10,500 m. Uncommon satellite platforms include ICESat-2 (LIDAR system used to study ice sheets, glaciers, and sea level rise), hyperspectral satellites PRISMA and EnMAP, Orbview-2 (multispectral sensor to derive optical properties of oceans), Envisat (multispectral sensor to derive optical properties of oceans, amongst other sensors), PlanetScope (multispectral sensor in higher spatial resolution), and the sole use of the Terra platform.

Figure 11.
Number of satellite platform counts in logarithmic scale. The total number of sensors exceeds the number of articles as all satellite platforms are included in this graph. The spatial resolution categories are defined in accordance with mathematical intervals, with the inclusion of endpoints indicated by the use of closed parentheses and their exclusion indicated by the use of open outward parentheses. (a) Sensor type of satellite platforms. (b) Sensor resolution of satellite platforms.
The connection between the spatial resolution of sensor data and study area extent is illustrated in Figure 12. Figure 12b shows the distribution of the sensor spatial resolution categories for each study area category, while the left Figure 12a displays the distribution of study area size. Local studies exhibit the largest share of very-high-resolution satellite data, spanning from 0 to 10 m relative to all other study area categories. Still, the majority of local studies use medium- to low-resolution data. The proportion of higher spatial resolution data tends to decrease as the study area increases, while circumpolar studies that include the boreal region exhibit a similar share compared to regional studies. Low-resolution data are equally prevalent across all categories, including “regional”, “circumpolar”, and “circumpolar including boreal”. Medium-resolution data are most commonly used in local and national studies. Data categorized as “other” is most common in circumpolar studies.
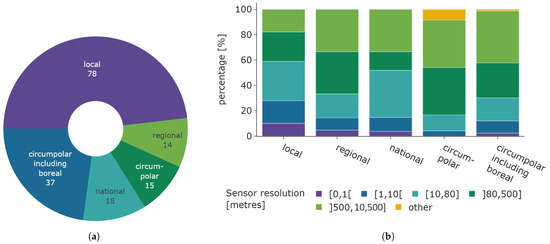
Figure 12.
Overview of spatial relations between study area and utilised sensor resolution. (a) Distribution of study area size. (b) Distribution of sensor resolution based on study area size.
The distribution of sensor characteristics and environmental parameters for the main research objectives is presented in Figure 13. The analysis of plant phenology was based exclusively on continuous time series, whereas articles focusing on disturbance events and the composition of different plant species were derived from equally multi-temporal and continuous data. The majority of studies examining vegetation index trends and plant productivity applied continuous satellite data in their research. Other review articles, grouped into “literature review”, are based on non-continuous satellite data (see Figure 13a).
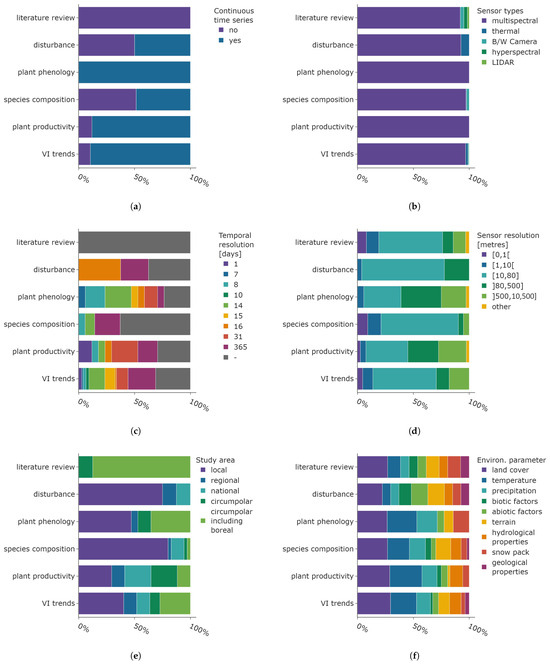
Figure 13.
Distribution of sensor parameters, final temporal, and spatial resolution after data processing and environmental parameters shown for the main research objective categories. The categories follow the definitions given in Section 2 and Section 3.4. (a) Application of continuous time series data. (b) Distribution of sensor types. (c) Final temporal resolution of satellite data. (d) Spatial resolution of satellite data. (e) Study area size. (f) Utilised environmental parameters.
As already stated, multispectral data is the dominating sensor type, which is true for all main research objective categories (see Figure 13b). Thermal data is used to analyse research objectives belonging to the “disturbance” (e.g., Kornienko [75]) and “VI trends” categories (e.g., Nill et al. [98]). In addition to multispectral data, black and white Camera film was generally used to derive shrub cover and treeline changes, both of which are part of the “species composition” research objective category. Finally, the literature review category includes all types of sensor data.
The final temporal resolution of the satellite data after pre-processing steps like smoothing or interpolation is shown in Figure 13c. Studies which did not report the temporal resolution are indicated by the grey colour. The high proportion of annual data analysed in research objectives “disturbance” and “species composition” matches the time scales associated with underlying biological processes. These include plant succession and the establishment of shrubs and trees, which occur over a span of years or decades. The “disturbance” category is predominately analysed with 16-daily resolution data. This is the temporal resolution of the global 250 m spatial resolution NDVI product based on the MODIS sensors on the Aqua and Terra satellites. The analysis of research objectives pertaining to the categories of “plant phenology”, “plant productivity”, and “VI trends” was conducted using satellite data from a diverse range of time resolutions. A relatively small share of higher-temporal-resolution data is used in phenology studies (mainly based on 7-daily MODIS products), which is surprising given the swift ecological timings in the Arctic and sub-Arctic. The large share of coarser temporal resolution data can be attributed to phenological metrics integrated over the entire growing season, where the pre-processing was conducted on higher-temporal-resolution data. The “plant productivity” data are mainly derived with monthly AVHRR products.
The subsequent characteristic considered in this analysis is the spatial sensor resolution displayed in Figure 13d. The spatial resolution of 10 to 80 m is the most prevalent across all research objective categories, with the exception of phenology, where it is the second most common resolution. The utilisation of very fine-resolution satellite data is predominantly confined to the research objective categories of “species composition” and “VI trends”, where the distinction between plant species benefits from the higher spatial resolution data. Low-resolution satellite data based on NOAA-AHVRR is common for studies focusing on phenology, productivity, and vegetation index trends.
Figure 13e displays the distribution of study area size. A substantial number of studies focusing on disturbance events and plant species composition have identified changes at the local level. An in-depth understanding of local environmental conditions is frequently necessary for the examination of both research objective categories for interpretation and validation. The literature reviews encompassed both the circumpolar and boreal regions, which is a logical approach given that findings supported by a range of studies from all Arctic and sub-Arctic regions have a greater impact on the identification of general trends. Articles focusing on plant phenology, productivity, and trends cover the entire range from local studies to circumpolar areas including the boreal ecoregions.
Finally, the distribution of environmental parameters per main research objective category is displayed in Figure 13d. The most crucial parameter for all research objectives is information regarding the land cover, which encompasses general data about ecoregions and comprehensive land-cover maps. The analysis of temperature is also of great importance for understanding plant phenology and productivity. Moreover, it is the second most prevalent parameter in articles focusing on the species composition and vegetation index trends. Precipitation is also frequently employed in the analysis and represents the third most common environmental parameter across four categories (plant phenology, species composition, plant productivity, VI trends). Information about the terrain is frequently employed, particularly in analyses pertaining to disturbance, species composition, and VI trends. The large proportion of biotic and abiotic factors within the “disturbance” category is expected, as this information helps identify potential causal factors and links between the observed changes in satellite data and underlying environmental processes. Hydrological properties are of lesser importance, yet are frequently employed, with the exception of the “plant phenology” research objective. The snow pack parameter is of greater significance within this research objective category, clearly demonstrating the connection between phenological timings and snow melt. Geological parameters are infrequently utilised, with the highest occurrence in the “disturbance” category, probably linked to investigations concerning permafrost thaw.
3.5. Methods
This section summarises the applied methods, which have been grouped into the following overarching categories: regression, statistical association, classification, phenometrics, and change detection. The regression category includes all studies that used regression analysis to derive trends of radiometric indices and infer causative relationships between indices and other plant or environmental variables. The subcategories are divided into the supervised machine-learning (ML) regression approach (e.g., Nill et al. [15], Chen et al. [101]) and all other types of regression (e.g., Forkel et al. [94], Berner et al. [110]).
Studies that used some form of analysis to describe the degree of statistical association between VI trends and other plant or environmental variables are included in the category “statistical association”. This includes the conventional measurement of linear relationships in the form of correlations, analysis of variance, which determines the difference of the mean of several parameters (e.g., Forkel et al. [94], Khormizi et al. [133]), and Principle Component Analysis (PCA) (e.g., Lin et al. [79], Campbell et al. [124]). One study applied the causal method of structural equation modeling [161].
Articles which differentiated land-cover classes based on satellite and/or auxiliary data were grouped into the “classification” category. The four subcategories include the supervised machine-learning approach (e.g., Macander et al. [43], Liu et al. [47]), unsupervised and supervised classification (Bonney et al. [65], Guo and Rees [139], Frost et al. [72], Beck et al. [144]), and manual classification (e.g., Frost and Epstein [78], Kravtsova and Loshkareva [143]). The distinction between supervised and unsupervised classification is mainly that supervised classification relies on labelled training data, whereas unsupervised classification requires labelling the clustered data afterwards.
Studies which derived the phenological progression of plant growth, like SOS, EOS, growing season length, or peak growing season vegetation activity, were grouped into the “phenometrics” category. Four different subcategories were identified: simple threshold (e.g., Chen et al. [19], Luus and Lin [167]), fitting models (e.g., Gonsamo et al. [135,157]), smoothing functions (e.g., Madani et al. [152], Swanson [159]), and derivatives (Wu et al. [158], Swanson [159]).
The “change detection” category includes methods to derive changes of vegetation vigour without classifying the land-cover type and is therefore a distinct method category and not part of the classification methods. The two subcategories are image post classification (e.g., Lin et al. [79], Kravtsova and Loshkareva [143]) and change detection algorithms (Wang et al. [142], Potter and Alexander [173]).
Figure 14 displays the distribution of the different method subcategories per publication year. Most articles based their analysis on some form of regression, with a total of 110 occurrences depicted in green. A much smaller subset of articles used a machine-learning (ML) approach for their regression analysis (n = 11). “Statistical association” shown in orange colours includes all studies that found statistical relationships between VI trends and vegetation or environmental parameters using correlations (n = 78), analysis of variance (n = 14), or principal component analysis (PCA) in eight articles. One article in 2024 applied a causal method. The most frequent approach to derive phenometrics, displayed in purple shades, was a simple threshold applied to a vegetation index (n = 22). Application of models that fit the vegetation index curve over the growing season period were less common, with seven counts, while smoothing functions were applied four times. The least common approach was based on calculating derivatives of VI curves to estimate phenological timings. Supervised machine learning (n = 25, pink colours) was the most common classification algorithm, followed by unsupervised and supervised classification, with 14 and 10 occurrences, respectively. Manual classification was the least common, with only four occurrences. The last category includes “change detection” methods, depicted in golden colours. The most common type, using change detection algorithms, was used nine times. Image post-classification algorithms that infer changes between satellite images were counted twice.
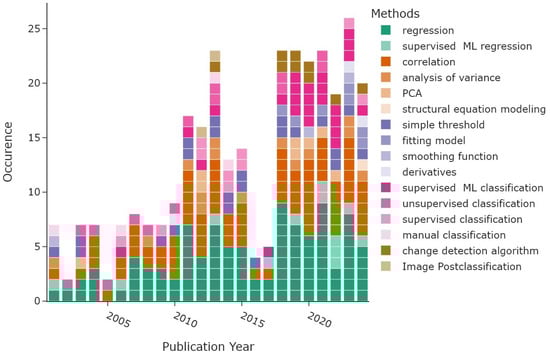
Figure 14.
Methods identified in the literature review grouped by publication year, with multiple counts per article. Machine-learning approaches are abbreviated as “ML”.
The methods belonging to the overarching categories “regression”, “statistical association”, and “phenometrics” are roughly equally distributed over time, with two peaks around 2011–2015 and 2018–2023, following the amount of reviewed articles displayed in Figure 14. The methods used to classify plant species and methods belonging to the “change detection” category, displayed in pink and golden shades, are more common since 2018. The two subcategories summarising machine-learning approaches, namely the supervised ML regression and the supervised ML classification, are more frequent since 2019. The earliest ML technique, support vector regression, was already applied in 2001 in a study by Tucker et al. [120]. More recent studies often apply a variation of random forest regression or RF classification, and only three studies applied deep neural networks (Kennedy et al. [42], Liu et al. [47], Zhu et al. [138]).
Figure 15 shows the methods used for each main research objective. In general, most methods were used for each main objective. Classification methods were more frequently applied to analyse “species composition” objectives. In addition, a large share of “phenometrics” methods was used to derive “plant phenology” objectives. The research objective category “VI trend” was mainly assessed by using regression and correlation methods. Classification methods also make up quite a large share, as many articles compare plant type specific VI developments (e.g., [65,72,92]). Research focusing on disturbance events and plant productivity exhibit a roughly equal share of the different methods, underlying the complexity of those research foci. The “literature review” category is an outlier, since most reviews focus on the central findings and might highlight newer developments like artificial-intelligence algorithms without discussing established methods in depth.
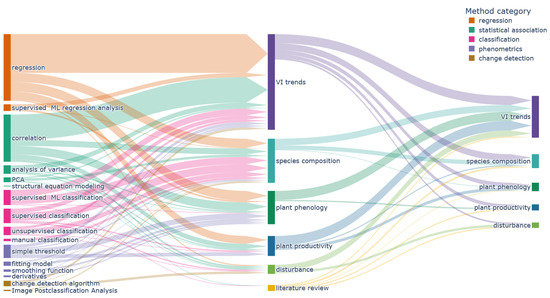
Figure 15.
Flowchart visualising the utilised methods for different main research objectives (center). The combinations of main research objectives and secondary objectives (right) are shown as well.
3.6. Circumpolar Trends and Their Drivers
Despite the lack of consistent circumpolar trends in the reviewed literature, the subsequent section provides an overview of general tendencies and common drivers for Arctic vegetation changes. The remark by Taylor et al. [4], addressing the changes of Focal Ecosystem Components (FECs) in the terrestrial Arctic, outlines a productive approach addressing circumpolar trends: “Rather than searching unsuccessfully for circumpolar trends, we should, perhaps, instead ask how, where, and why there is variation in the response of Arctic FECs to environmental changes”.
In general, greening trends are more common than browning trends. The location, vegetation type, and magnitude of greening trends vary greatly. Greening trends were found for shrubland [23,109], herbaceous [109], lichen [20], spare vegetation [109], and even barren land-cover types [109]. However, browning trends were also derived in sparse vegetation [109]. Both high Arctic [18,89,104,110,121] and low Arctic [89,101,104,110], as well as Oro Arctic [110] were found to be greening, especially in North America in general [96,106,110,113,137], particular in Alaska [3,25,37,56,59,94,100,117] and Canada [3,37,55,65,91,105,122]. Fewer accounts were found for Eurasia, with greening in northern Siberia [3,37,72,90,103,112,117,118,122,123] and Scandinavia [3,96,105,106,137]. Common environmental parameters linked to greening were the increase in temperature [18,24,111] and changes of vegetation type, in particular the increase of shrub cover [20,24,72,101,109]. These trends, however, are not uniform, as browning trends were also found in (central) Siberia [37,117,122,123,137], western Russia [126], and the Bering Straits [105], as well as coastal northern Canada [37,117], southwestern Canada [37,137], Alaska [117,122], and parts of northern Eurasia [126].
Studies focusing on the changes of species composition generally indicate a widespread decline in lichen coverage [15,21,42,43,63,67,69,147] and an increase of shrubby plants [15,43,44,47,57,78,146,148,149,150]. However, some studies found declining shrub cover [21] and no significant changes in species composition [142]. Studies focusing on the advancement of the boreal treeline into the tundra showed either no consistent general trend [62,70] or evidence for advancing [81,139,140,141] but also retracting treelines [139,140]. Common drivers linked to lichen decline are increasing herbivore pressure from caribou and reindeer, coinciding with an increase in shrubs [42,67,69]. Environmental parameters driving shrub expansion are less uniform. While some studies found correlations between increased temperature and shrub cover [45,149,150], others did not support this connection [44,78]. Shallow permafrost was found to hinder shrub expansion [51,57].
The plant productivity trends show a more consistent behaviour, with increasing productivity found in the entire circumpolar tundra [164,165,166,167,169,171], and specifically in Eurasia [77], Greenland [168], and Alaska and Canada [40,52,66]. Decreasing plant productivity was the exception, e.g., lichen biomass in Scandinavia [30]. A positive relationship between temperature and productivity increase was found by several studies [40,52,77,169], but also changes of vegetation cover [166], permafrost [41], and growing season length were found to be potential drivers [66,167].
The phenology of Arctic and sub-Arctic vegetation shows tendencies for an increase in vegetation growth [152] in the early growing season and an increased growing season length for some regions of the Arctic tundra [155,156,157] and sub-Arctic region [157]. Regional studies reveal diverse trends, with evidence for an earlier growing season start [46,159,160,162], a delayed end of season [19], or heterogeneous results [73,74].
Disturbance: the disturbance and recovery mechanisms in the tundra region are diverse, and the findings did not support a uniform disturbance cause or driver for the circumpolar tundra. Instead, permafrost thaw [172], wildfire [75,173], and winter warming events [26] often lead to small-scale disturbances, which will probably be more frequent with ongoing climate change.
4. Discussion
4.1. Limitations of the Review Design
The review design was largely constrained by a focus on English literature and the exclusion of short-term studies. Consequently, case studies that employed novel methodological approaches may have been excluded. In addition, studies conducted in the Eurasian region and published in the native language could not be included. The requirement of five years of satellite data did lead to the exclusion of short-term studies using Synthetic Aperture Radar (SAR) data, which contributes to the dominance of optical data. Long-term SAR studies might be conducted using data from Sentinel-1 (launched in April 2014), Envisat (operational from 2002 to 2012), or the Canadian RADARSAT Constellation Mission (launched in 2019).
Although the search string incorporates a range of keywords related to plant ecology, geographical regions, and satellite data, some articles were not identified. This was either because there was no mention of satellite data in the title or abstract, or because they did not pass the exclusion criteria. In order to ensure a comprehensive coverage of the processes linked to a changing Arctic, we included 16 relevant studies that were not selected by the research string.
The subjective definitions of the research objectives, method, and data categories might introduce some ambiguity; however, this generalization approach was deemed an adequate trade-off between retaining details and identifying overall connections.
4.2. Challenges of Monitoring Arctic and Sub-Arctic Vegetation
The reviews by Beamish et al. [10], Stow et al. [28], and Nelson et al. [176] already provide an excellent overview of fundamental challenges regarding optical remote sensing in the Arctic and sub-Arctic regions. The following summary highlights ongoing challenges and novel methodologies to address these challenges, as identified by the systematic review, along with previously acknowledged approaches.
4.2.1. Availability of Environmental Parameters and In Situ Data
The tundra ecosystem is composed of heterogeneous and discontinuous vegetation cover, with fine-scale variations of soil structure and moisture, as described in Section 1.1. Environmental parameters are necessary to understand the potential drivers of observed trend changes (e.g., warming as a driver for greening and shrub expansion [24,69]), identify causal links between disturbance events and shifts in the ecosystems (e.g., permafrost thaw resulting in thaw slumps connected to browning or abiotic drivers [24,172]), and validate classification results [90], as well as identify phenological stages [38]. However, the environmental parameters are often interpolated from a limited number of unevenly distributed measurement stations (e.g., phenological data based on the Fluxnet and PhenoCam networks [38,39]), based on coarse resolution satellite data (e.g., snow cover [90,158]), or collected in (small scale) field campaigns [43,44,91,98,101,129,143,144,149,150].
As highlighted by Beamish et al. [10], the increasing availability of digital photography data calls for the creation of a unified access point to facilitate collaborative efforts in data collection and sharing. It is anticipated that the advancement of Unmanned Aerial Vehicle (UAV) technology will result in an increase in the number of ground reference datasets. Nevertheless, the reviewed articles demonstrate a greater prevalence of airborne reference datasets. Initiatives to collect and combine various in situ datasets, e.g., by Zhu et al. [177] for the Alaskan tundra region, greatly aid research activities. Another example of an international initiative is the NASA Arctic-Boreal Vulnerability Experiment (ABoVE), which has the objective to mitigate the lack of in situ reference data for Alaska and western Canada. This is achieved by linking field data gathered since 2015 at various spatial scales with both airborne and satellite products [178].
4.2.2. Acquisition of Optical Data
The collection of optical imagery in the Arctic region is inherently challenging, primarily due to the regions’ short growing season, the prevalence of low-level clouds, and the low sun angle increasing the signal attenuation in the atmosphere [54,55,74,133,136]. All factors contribute to increased uncertainty in the measurement of radiative surface fluxes.
Dedicated correction algorithms for, e.g., haze [42] or simply aggregating multiple satellite images into an integrated vegetation index measurement [170] mitigate the data sparsity. Although there seems to be a broad consensus that the most effective method for addressing optical data sparsity is to merge multiple datasets and combine different sensor types [10,176], only a limited number of the reviewed articles attempted this approach (e.g., [142,148,168]). Notably absent from this review are studies utilising SAR data. This may be explained, at least in part, by the exclusion of studies focusing on short-term observations during the literature selection process. It is notable that some short-term studies are only employing SAR data, e.g., Duguay et al. [179] investigated the potential of multi-polarized SAR data to study shrub growth, while A’Campo et al. [180] derived Kennaugh elements from SAR data in order to classify tundra vegetation on the Beaufort Coast. While the availability of open-source satellite data, both optical and non-optical, is generally expanding with the archives hosted by Google Earth Engine and the increasing capabilities of the ESA Copernicus services based on the Sentinel fleet, the potential of combining different sensor types has not been fully utilised.
4.2.3. Poor Comparability of Vegetation Index Trends
The factors influencing the vegetation index include the different spectral bandwidths and different geometric and radiometric calibrations, in addition to sensor drift and varying spatial and temporal resolutions [74]. These effects were known to lead to unreliable AVHRR trends, particular due to the difficult sensor inter-calibration [96].
Trends are also influenced by the time-series length, in addition to the applied trend and significance tests [16], of which there were 27 different tests identified during this review, with the level of significance varying from to . Table 3 offers insights into the differences between various greening trends. The combination of these factors leads to discrepancies between commonly used remote-sensing products, e.g., inconsistent greening and browning trends between Landsat-NDVI, AVHRR-NDVI, MOIDS-NDVI, and SPOT-NDVI [96,110,137] or inconsistent phenological metrics based on AVHRR, MODIS, and SPOT data, as described in Zeng et al. [74].
The use of a common terminology and standards regarding a minimum time-series length and significance thresholds would probably mitigate some of the inconsistencies, e.g., by adapting the clear terminology used in the study by Myers-Smith et al. [16], which also provides a comprehensive overview over factors influencing vegetation index trends.
4.3. Dominance of NDVI
The vast majority of all studies conducted a trend analysis based on NDVI data (n = 66). The NDVI prevalence is probably due to the continuation of AVHRR data analysis as the base line, which also results in the use of NDVI for other sensor data to facilitate inter-comparison studies. However, NDVI might not be the best suited vegetation index for the tundra ecosystem. Dearborn and Danby [66], Seider et al. [92] argue that adapting the EVI has the advantages of reducing the influence of bare soil and stronger sensitivity to phenological changes. In addition, the saturation of NDVI above a leaf biomass exceeding leads to a non-linear relationship [19,169] and may be particularly influenced by changes in surface water and soil moisture in the NIR band [124]. In conclusion, research objectives besides the comparison of NDVI trends might benefit from using a different vegetation index.
4.4. Geographical Hotspots and Data Availability
Most studies were conducted on a local scale with clear agglomeration in the North Slope of Alaska and the Bathurst Caribou range in Canada. The combination of established local and national research institutes—published in English—and a variety of ecological changes in the high Arctic and the TTE results in continuous research activity in these hotspot areas. This is also reflected in the quantity of in situ data (e.g., the field survey database for the Alaskan tundra by Zhu et al. [177]). Research objectives which require a high degree of ecological information, like the “disturbance” and “species composition” categories, are mostly conducted on a local scale, further underlying the need for more accessible data about environmental parameters. Circumpolar studies both with and without the boreal area are very common, with 53 studies in total, and often rely on coarse resolution data, mainly AVHRR data. Many studies took advantage of the long continuous data length of this sensor constellation, often using the analysis-ready datasets starting from 1981/2. Some local studies in Russia expanded the temporal coverage even further by comparing de-classified reconnaissance satellite with modern satellite data. Generally, the temporal and spatial coverage of the Arctic region is impressive, especially when focusing on coarse-scale AVHRR data (n = 54 articles). However, medium-resolution satellite data like Landsat (n = 27) or MODIS (n = 33) are also commonly used across all regional scales. It is anticipated that the use of high- to medium-resolution data will increase with the continuation of ESA’s Sentinel programme, while very-high-resolution data are often limited in spatial scale (e.g., EnMAP) or not free of charge.
The widespread greening trends observed in Arctic vegetation can also be identified in other cold regions. For instance, the cryptogam vegetation of western Antarctica is undergoing a greening process, as mosses expand laterally. However, these trends are not uniform across Antarctica, with moss vitality observed to be decreasing in eastern Antarctica and sub-Antarctic islands [181]. The abundance and productivity of mountainous plant species have been observed to exhibit both increases and declines. The retreat of glaciers and a reduction in snow cover can result in an increase in plant abundance and productivity. This phenomenon has been observed in a number of mountain ranges, including the European Alps and Bhutan. In contrast, drought-stricken mountainous regions have been observed to exhibit a reduction in vegetation abundance and productivity. This is thought to be linked to alterations in snow cover and the timing of its melt, which in turn affects the availability of water for alpine-restricted species [182].
4.5. Methodological Development
The methodological development of the reviewed articles revealed a small increase of machine-learning research objectives over the years since 2019, whereas only three publications applied some form of deep-learning method, e.g., neural networks, for classification. The most common methods remain some form of classic regression and correlation analysis. While the latter is often used to identify possible drivers for changes in the Arctic vegetation, only one study was designed to derive causal relationships between vegetation changes and environmental parameters. In order to gain a deeper understanding of the impact of environmental factors on vegetation changes, causal discovery methods, such as Granger Causality [183] or structural equation modelling [161], can be leveraged to enhance the statistical analysis and identify the underlying drivers of change.
4.6. Outlook
Subsequent studies focused on observing ecological changes linked to Arctic greening could benefit from methodological advancements, such as improved data fusion algorithms. Merging optical satellite data to achieve a better temporal and spatial resolution would benefit all examined research objectives. The fusion of SAR and optical data (e.g., by merging the Sentinel-1 and Sentinel-2 data) might be beneficial for research objectives which do not require a continuous time series, like “plant productivity”, “disturbance”, and “species composition”. The application of machine-learning methods, and deep-learning methods in particular, is expected to increase in the future as more (open-source) models become available. Both “species composition” and “disturbance” research objectives will benefit from this development. Furthermore, the application of causal discovery methods could provide further insight into drivers for ecological changes.
The collection of high-quality in situ data should keep pace with advancements in satellite remote-sensing methodology. Currently, high-quality in situ data are limited to a few datasets and stations, which hinders the validation of remote-sensing products and also the application of artificial-intelligence algorithms due to the lack of comprehensive training datasets. Additionally, environmental parameters measured in field campaigns offer valuable insights into the potential drivers and causes of ecological change in the tundra region.
Several studies focus on the impact of changes in the Arctic region and their implications for the global climate, with a particular emphasis on the interaction between vegetation, snow cover, and permafrost. These elements are central to determining whether or not the Arctic will serve as a future carbon source or sink [44]. Increased shrub cover, accompanied by a thicker active layer, may influence the ecosystem to release excessive carbon [44]. However, the increased GHG emissions might be offset by the enhanced primary productivity of the tundra [51]. Increased shrub and tree cover reduces the albedo, thereby amplifying permafrost thaw and the subsequent release of greenhouse gases [7,122]. As the Arctic continues to change, studying the combinations of these processes will become increasingly important.
5. Conclusions
This review analysed the changes in Arctic and sub-Arctic vegetation based on 162 studies. The analysis focused on identifying the research objectives, the spatial distribution of the study areas, the spatio-temporal resolution of the employed satellites, and the applied methods. In the following, the main findings are summarised to address the research questions posed in Section 1.3:
- Spatial and temporal coverage: Most studies were conducted at a local scale (78), while 37 studies encompassed the circumpolar area, including the boreal zone. The majority of articles cover a study area within the sub-Arctic boundary, particularly the North Slope of Alaska and the Canadian Arctic regions. Fewer studies cover the Eurasian continent, with two hotspots in the Scandinavian and Russian Arctic regions. Notably, 75% of the studies used continuous time-series data, primarily from AVHRR (1981/82 onwards) and MODIS (2000 onwards).
- Sensors and satellites: A little over half of all studies were based on data from a single satellite, with multispectral sensor types dominating (∼93%). The most commonly utilised sensors are the AVHRR (NOAA, Aqua-Terra (MODIS) and Landsat satellites. Other sensor types were limited to specific research applications, e.g., using Camera footage from declassified reconnaissance satellites to derive changes of the treeline and shrub cover or thermal and hyperspectral data for vegetation classification. Notably absent are studies utilising Synthetic Aperture Radar (SAR) data. In general, the share of higher-resolution data declines with increasing study area size. All research objective categories, with the exception of phenology studie, are predominately using 10–80 m spatial resolution data. Fine-resolution data are confined to the articles analysing the species composition and VI trends.
- Research objectives: The majority of the 77 research articles that were focused on VI trends used NDVI as the radiometric index. VI trends were derived across all study area sizes. Species composition (35) was the second largest research objective category and conducted mostly on a local scale. Of these, 10 articles specifically addressed treeline changes, while 11 studies investigated the expansion of shrubs. The changes in plant phenology were examined in 17 articles at the local, regional, or circumpolar scales. The “plant productivity” category comprised 17 articles that focused on the estimation of primary productivity based on NPP and GPP, as well as one article that derived plant biomass as a primary objective. The smallest research objective category, with eight articles, focused on understanding the mechanism of disturbances and the subsequent vegetation recovery predominately on a local scale. As the Arctic continues to change, studying the combinations of vegetation, snow cover, and permafrost will become increasingly important. Moreover, it is of the great importance to maintain a unified effort to collect high-quality in situ data.
- Common (circumpolar) trends: most studies found evidence for Arctic greening in at least some parts of their study area (n = 27), or mixed trends with predominately greening (n = 26). Studies focusing on the changes of species composition generally indicate a widespread decline in lichen coverage, often accompanied by an increase in shrubs. In addition, the majority of articles derived positive productivity trends. The development of plant phenology indicates an increase in growing season length, but start and end-of-season dynamics are heterogeneous throughout the circumpolar Arctic. The disturbance and recovery mechanisms in the tundra region are diverse, and the review results did not show uniform trends for either research objective.
- Methods: Following the method categories defined in Section 3.5, we found that most articles applied some form of classic regression and correlation analysis. Machine-learning algorithms were used for classification and regression approaches, and a small increase was found since 2019. Only three articles applied a deep-learning method. Methods belonging to the “phenometrics”, “regression”, and “statistical association” category are roughly equally distributed over time, whereas “change detection” and “classification” methods are more common since 2018. It is anticipated that subsequent studies will benefit from methodological advancements in data fusion and causal analysis.
- Common ecological conditions: Although an increase in temperature has been linked to greening, shrub expansion, and increased plant productivity, the driving forces behind the diverse and localised ecological changes observed in the Arctic and sub-Arctic regions are numerous and complex.
This review complements recent and long-standing literature, with a comprehensive overview of dynamic changes occurring in the Arctic and sub-Arctic vegetation. It presents developments in methodology and research objectives, synthesises common circumpolar trends, and offers a prognosis for potential future research foci.
Supplementary Materials
The following supporting information can be downloaded at: https://www.mdpi.com/article/10.3390/rs16234509/s1, Table S1: Overview of Reviewed Publications; Table S2: Overview of Excluded Publications.
Author Contributions
Conceptualization, M.W. and C.K.; writing—original draft preparation, M.W.; writing—review and editing, M.W., C.K., C.A.B., and A.J.D.; visualization, M.W.; supervision, C.K. All authors have read and agreed to the published version of the manuscript.
Funding
This research received no external funding.
Data Availability Statement
Not applicable.
Acknowledgments
We would like to thank DLR for funding the Polar Monitor 2 project. We would also like to thank our colleague Kjirsten Coleman, a native English speaker, for proofreading our manuscript.
Conflicts of Interest
The authors declare no conflicts of interest.
References
- Esau, I.; Pettersson, L.H.; Cancet, M.; Chapron, B.; Chernokulsky, A.; Donlon, C.; Sizov, O.; Soromotin, A.; Johannesen, J.A. The Arctic Amplification and Its Impact: A Synthesis through Satellite Observations. Remote Sens. 2023, 15, 1354. [Google Scholar] [CrossRef]
- Rantanen, M.; Karpechko, A.Y.; Lipponen, A.; Nordling, K.; Hyvärinen, O.; Ruosteenoja, K.; Vihma, T.; Laaksonen, A. The Arctic Has Warmed Nearly Four Times Faster than the Globe since 1979. Commun. Earth Environ. 2022, 3, 168. [Google Scholar] [CrossRef]
- Piao, S.; Wang, X.; Park, T.; Chen, C.; Lian, X.; He, Y.; Bjerke, J.W.; Chen, A.; Ciais, P.; Tommervik, H.; et al. Characteristics, Drivers and Feedbacks of Global Greening. Nat. Rev. Earth Environ. 2020, 1, 14–27. [Google Scholar] [CrossRef]
- Taylor, J.J.; Lawler, J.P.; Aronsson, M.; Barry, T.; Bjorkman, A.D.; Christensen, T.; Coulson, S.J.; Cuyler, C.; Ehrich, D.; Falk, K.; et al. Arctic Terrestrial Biodiversity Status and Trends: A Synopsis of Science Supporting the CBMP State of Arctic Terrestrial Biodiversity Report. Ambio 2020, 49, 833–847. [Google Scholar] [CrossRef]
- University of Maryland Center for Environmental Science. IAN Symbol Libraries. Available online: https://ian.umces.edu/symbols/ (accessed on 15 July 2024).
- Freie Universität Berlin—RESEDA. Available online: https://blogs.fu-berlin.de/reseda/sentinel-2/ (accessed on 15 May 2024).
- Meltofte, M. Arctic Biodiversity Assessment: Status and Trends in Arcitc Biodiversity; The Conservation of Arctic Flora and Fauna: Akureyri, Iceland, 2013. [Google Scholar]
- Arctic Definitions Combined. Arctic Portal. Available online: https://arcticportal.org/maps/download/arctic-definitions/2426-arctic-definitions (accessed on 15 May 2024).
- Walker, D.A.; Raynolds, M.K.; Daniëls, F.J.; Einarsson, E.; Elvebakk, A.; Gould, W.A.; Katenin, A.E.; Kholod, S.S.; Markon, C.J.; Melnikov, E.S.; et al. The Circumpolar Arctic Vegetation Map. J. Veg. Sci. 2005, 16, 267–282. [Google Scholar] [CrossRef]
- Beamish, A.; Raynolds, M.K.; Epstein, H.; Frost, V.G.; Macander, M.J.; Bergstedt, H.; Bartsch, A.; Kruse, S.; Miles, V.; Tanis, C.M.; et al. Recent Trends and Remaining Challenges for Optical Remote Sensing of Arctic Tundra Vegetation: A Review and Outlook. Remote Sens. Environ. 2020, 246, 111872. [Google Scholar] [CrossRef]
- Corell, R. Arctic Climate Impact Assessment. Bull. Am. Meteorol. Soc. 2005, 86, 860–861. [Google Scholar]
- PhenoCam—An Ecosystem Phenology Camera Network. Available online: https://phenocam.nau.edu/webcam/network/map/ (accessed on 15 May 2024).
- Global Geo-Referenced Field Photo Library. Available online: https://www.ceom.ou.edu/photos/map/ (accessed on 15 May 2024).
- FLUXNET—The Data Portal Serving the FLUXNET Community. Available online: https://fluxnet.org/about/ (accessed on 15 May 2024).
- Nill, L.; Grunberg, I.; Ullmann, T.; Gessner, M.; Boike, J.; Hostert, P. Arctic Shrub Expansion Revealed by Landsat-derived Multitemporal Vegetation Cover Fractions in the Western Canadian Arctic. Remote Sens. Environ. 2022, 281, 113228. [Google Scholar] [CrossRef]
- Myers-Smith, I.H.; Kerby, J.T.; Phoenix, G.K.; Bjerke, J.W.; Epstein, H.E.; Assmann, J.J.; John, C.; Andreu-Hayles, L.; Angers-Blondin, S.; Beck, P.S.A.; et al. Complexity Revealed in the Greening of the Arctic. Nat. Clim. Chang. 2020, 10, 106–117. [Google Scholar] [CrossRef]
- Callaghan, V.T.; Gatti, R.C.; Phoenix, G. The Need to Understand the Stability of Arctic Vegetation during Rapid Climate Change: An Assessment of Imbalance in the Literature. Ambio 2022, 51, 1034–1044. [Google Scholar] [CrossRef]
- Vickers, H.; Hogda, K.A.; Solbo, S.; Karlsen, S.R.; Tommervik, H.; Aanes, R.; Hansen, B.B. Changes in Greening in the High Arctic: Insights from a 30 Year AVHRR Max NDVI Dataset for Svalbard. Environ. Res. Lett. 2016, 11, 105004. [Google Scholar] [CrossRef]
- Chen, W.; White, L.; Leblanc, S.G.; Latifovic, R.; Olthof, I. Elevation-Dependent Changes to Plant Phenology in Canada’s Arctic Detected Using Long-Term Satellite Observations. Atmosphere 2021, 12, 1133. [Google Scholar] [CrossRef]
- Olthof, I.; Pouliot, D.; Latifovic, R.; Chen, W. Recent (1986–2006) Vegetation-Specific NDVI Trends in Northern Canada from Satellite Data. Arctic 2008, 61, 381–394. [Google Scholar] [CrossRef]
- Magnusson, R.I.; Limpens, J.; Kleijn, D.; van Huissteden, K.; Maximov, T.C.; Lobry, S.; Heijmans, M.M.P.D. Shrub Decline and Expansion of Wetland Vegetation Revealed by Very High Resolution Land Cover Change Detection in the Siberian Lowland Tundra. Sci. Total. Environ. 2021, 782, 146877. [Google Scholar] [CrossRef]
- Li, J.; Holmgren, M.; Xu, C. Greening vs Browning? Surface Water Cover Mediates How Tundra and Boreal Ecosystems Respond to Climate Warming. Environ. Res. Lett. 2021, 16, 104004. [Google Scholar] [CrossRef]
- Potter, C. Regional Analysis of MODIS Satellite Greenness Trends for Ecosystems of Interior Alaska. Gisci. Remote Sens. 2014, 51, 390–402. [Google Scholar] [CrossRef]
- Pastick, N.J.; Jorgenson, M.T.; Goetz, S.J.; Jones, B.M.; Wylie, B.K.; Minsley, B.J.; Genet, H.; Knight, J.F.; Swanson, D.K.; Jorgenson, J.C. Spatiotemporal Remote Sensing of Ecosystem Change and Causation across Alaska. Glob. Chang. Biol. 2019, 25, 1171–1189. [Google Scholar] [CrossRef]
- Raynolds, M.K.; Walker, D.A.; Verbyla, D.; Munger, C.A. Patterns of Change within a Tundra Landscape: 22-Year Landsat NDVI Trends in an Area of the Northern Foothills of the Brooks Range, Alaska. Arct. Antarct. Alp. Res. 2013, 45, 249–260. [Google Scholar] [CrossRef]
- Bokhorst, S.; Tommervik, H.; Callaghan, T.V.; Phoenix, G.K.; Bjerke, J.W. Vegetation Recovery Following Extreme Winter Warming Events in the Sub-Arctic Estimated Using NDVI from Remote Sensing and Handheld Passive Proximal Sensors. Environ. Exp. Bot. 2012, 81, 18–25. [Google Scholar] [CrossRef]
- Magnusson, R.I.; Groten, F.; Bartholomeus, H.; van Huissteden, K.; Heijmans, M.M.P.D. Tundra Browning in the Indigirka Lowlands (North-Eastern Siberia) Explained by Drought, Floods and Small-Scale Vegetation Shifts. J. Geophys. Res.-Biogeosci. 2023, 128, e2022JG007330. [Google Scholar] [CrossRef]
- Stow, D.A.; Hope, A.; McGuire, D.; Verbyla, D.; Gamon, J.; Huemmrich, F.; Houston, S.; Racine, C.; Sturm, M.; Tape, K.; et al. Remote Sensing of Vegetation and Land-Cover Change in Arctic Tundra Ecosystems. Remote Sens. Environ. 2004, 89, 281–308. [Google Scholar] [CrossRef]
- Walker, D.A.; Leibman, M.O.; Epstein, H.E.; Forbes, B.C.; Bhatt, U.S.; Raynolds, M.K.; Comiso, J.C.; Gubarkov, A.A.; Khomutov, A.V.; Jia, G.J.; et al. Spatial and Temporal Patterns of Greenness on the Yamal Peninsula, Russia: Interactions of Ecological and Social Factors Affecting the Arctic Normalized Difference Vegetation Index. Environ. Res. Lett. 2009, 4, 045004. [Google Scholar] [CrossRef]
- Tommervik, H.; Johansen, B.; Riseth, J.A.; Karlsen, S.R.; Solberg, B.; Hogda, K.A. Above Ground Biomass Changes in the Mountain Birch Forests and Mountain Heaths of Finnmarksvidda, Northern Norway, in the Period 1957–2006. For. Ecol. Manag. 2009, 257, 244–257. [Google Scholar] [CrossRef]
- Jorgenson, M.T.; Grosse, G. Remote Sensing of Landscape Change in Permafrost Regions. Permafr. Periglac. Process. 2016, 27, 324–338. [Google Scholar] [CrossRef]
- Callaghan, T.V.; Tweedie, C.E.; Akerman, J.; Andrews, C.; Bergstedt, J.; Butler, M.G.; Christensen, T.R.; Cooley, D.; Dahlberg, U.; Danby, R.K.; et al. Multi-Decadal Changes in Tundra Environments and Ecosystems: Synthesis of the International Polar Year-Back to the Future Project (IPY-BTF). Ambio 2011, 40, 705–716. [Google Scholar] [CrossRef]
- Foster, A.C.; Wang, J.A.; Frost, V.G.; Davidson, S.J.; Hoy, E.; Turner, K.W.; Sonnentag, O.; Epstein, H.; Berner, L.T.; Armstrong, A.H.; et al. Disturbances in North American Boreal Forest and Arctic Tundra: Impacts, Interactions, and Responses. Environ. Res. Lett. 2022, 17, 113001. [Google Scholar] [CrossRef]
- Page, M.J.; McKenzie, J.E.; Bossuyt, P.M.; Boutron, I.; Hoffmann, T.C.; Mulrow, C.D.; Shamseer, L.; Tetzlaff, J.M.; Akl, E.A.; Brennan, S.E.; et al. The PRISMA 2020 statement: An updated guideline for reporting systematic reviews. Syst. Rev. 2021, 10, 89. [Google Scholar] [CrossRef]
- WMO Guidelines on the Calculation of Climate Normals (WMO-No. 1203). Available online: https://library.wmo.int/viewer/55797?medianame=1203_en_#page=1&viewer=picture&o=search&n=0&q=30 (accessed on 5 August 2024).
- CAFF Arctic Boundary. Available online: https://map.arcticportal.org/cesium-dev/ (accessed on 15 May 2024).
- Fensholt, R.; Proud, S.R. Evaluation of Earth Observation Based Global Long Term Vegetation Trends—Comparing GIMMS and MODIS Global NDVI Time Series. Remote Sens. Environ. 2012, 119, 131–147. [Google Scholar] [CrossRef]
- Chen, X.; Yang, Y.; Du, J. Distribution and Attribution of Earlier Start of the Growing Season over the Northern Hemisphere from 2001–2018. Remote Sens. 2022, 14, 2964. [Google Scholar] [CrossRef]
- Liu, H.; Gong, P.; Wang, J.; Clinton, N.; Bai, Y.; Liang, S. Annual Dynamics of Global Land Cover and Its Long-Term Changes from 1982 to 2015. Earth Syst. Sci. Data 2020, 12, 1217–1243. [Google Scholar] [CrossRef]
- Kimball, J.S.; Zhao, M.; McGuire, A.D.; Heinsch, F.A.; Clein, J.; Calef, M.; Jolly, W.M.; Kang, S.; Euskirchen, S.E.; McDonald, K.C.; et al. Recent Climate-Driven Increases in Vegetation Productivity for the Western Arctic: Evidence of an Acceleration of the Northern Terrestrial Carbon Cycle. Earth Interact. 2007, 11, 1–30. [Google Scholar] [CrossRef]
- Kimball, J.S.; McDonald, K.C.; Zhao, M. Terrestrial Vegetation Productivity in the Western Arctic Observed from Satellite Microwave and Optical Remote Sensing. Earth Interact. 2006, 10, 1–22. [Google Scholar]
- Kennedy, B.; Pouliot, D.; Manseau, M.; Fraser, R.; Duffe, J.; Pasher, J.; Chen, W.; Olthof, I. Assessment of Landsat-based Terricolous Macrolichen Cover Retrieval and Change Analysis over Caribou Ranges in Northern Canada and Alaska. Remote Sens. Environ. 2020, 240, 111694. [Google Scholar] [CrossRef]
- Macander, M.J.; Nelson, P.R.; Nawrocki, T.W.; Frost, V.G.; Orndahl, K.M.; Palm, E.C.; Wells, A.F.; Goetz, S.J. Time-Series Maps Reveal Widespread Change in Plant Functional Type Cover across Arctic and Boreal Alaska and Yukon. Environ. Res. Lett. 2022, 17, 054042. [Google Scholar] [CrossRef]
- Welch, A.M.; Pedron, S.A.; Jespersen, R.G.; Xu, X.; Martinez, B.; Khazindar, Y.; Fiore, N.M.; Goulden, M.L.; Czimczik, C.I. Implications of Alder Shrub Growth for Alpine Tundra Soil Properties in Interior Alaska. Arct. Antarct. Alp. Res. 2023, 55. [Google Scholar] [CrossRef]
- Andreu-Hayles, L.; Gaglioti, V.B.; Berner, L.T.; Levesque, M.; Anchukaitis, K.J.; Goetz, S.J.; D’Arrigo, R. A Narrow Window of Summer Temperatures Associated with Shrub Growth in Arctic Alaska. Environ. Res. Lett. 2020, 15, 105012. [Google Scholar] [CrossRef]
- Potter, C.; Alexander, O. Changes in Vegetation Phenology and Productivity in Alaska over the Past Two Decades. Remote Sens. 2020, 12, 1546. [Google Scholar] [CrossRef]
- Liu, Y.; Riley, W.J.; Keenan, T.F.; Mekonnen, Z.A.; Holm, J.A.; Zhu, Q.; Torn, M.S. Dispersal and Fire Limit Arctic Shrub Expansion. Nat. Commun. 2022, 13, 3843. [Google Scholar] [CrossRef]
- Stow, D.; Petersen, A.; Hope, A.; Engstrom, R.; Coulter, L. Greenness Trends of Arctic Tundra Vegetation in the 1990s: Comparison of Two NDVI Data Sets from NOAA AVHRR Systems. Int. J. Remote Sens. 2007, 28, 4807–4822. [Google Scholar] [CrossRef]
- Jia, G.J.; Epstein, H.E.; Walker, D.A. Controls over Intra-Seasonal Dynamics of AVHRR NDVI for the Arctic Tundra in Northern Alaska. Int. J. Remote Sens. 2004, 25, 1547–1564. [Google Scholar] [CrossRef]
- Jia, G.S.J.; Epstein, H.E.; Walker, D.A. Greening of Arctic Alaska, 1981–2001. Geophys. Res. Lett. 2003, 30, 1–4. [Google Scholar] [CrossRef]
- Duchesne, R.R.; Chopping, M.J.; Tape, K.D.; Wang, Z.; Schaaf, C.L.B. Changes in Tall Shrub Abundance on the North Slope of Alaska, 2000–2010. Remote Sens. Environ. 2018, 219, 221–232. [Google Scholar] [CrossRef]
- Beck, P.S.A.; Juday, G.P.; Alix, C.; Barber, V.A.; Winslow, S.E.; Sousa, E.E.; Heiser, P.; Herriges, J.D.; Goetz, S.J. Changes in Forest Productivity across Alaska Consistent with Biome Shift. Ecol. Lett. 2011, 14, 373–379. [Google Scholar] [CrossRef] [PubMed]
- Klaar, M.J.; Kidd, C.; Malone, E.; Bartlett, R.; Pinay, G.; Chapin, F.S.; Milner, A. Vegetation Succession in Deglaciated Landscapes: Implications for Sediment and Landscape Stability. Earth Surf. Process. Landf. 2015, 40, 1088–1100. [Google Scholar] [CrossRef]
- Stueve, K.M.; Isaacs, R.E.; Tyrrell, L.E.; Densmore, R.V. Spatial Variability of Biotic and Abiotic Tree Establishment Constraints across a Treeline Ecotone in the Alaska Range. Ecology 2011, 92, 496–506. [Google Scholar] [CrossRef]
- Ju, J.; Masek, J.G. The Vegetation Greenness Trend in Canada and US Alaska from 1984–2012 Landsat Data. Remote Sens. Environ. 2016, 176, 1–16. [Google Scholar] [CrossRef]
- Rocha, A.V.; Blakely, B.; Jiang, Y.; Wright, K.S.; Curasi, S.R. Is Arctic Greening Consistent with the Ecology of Tundra? Lessons from an Ecologically Informed Mass Balance Model. Environ. Res. Lett. 2018, 13, 125007. [Google Scholar] [CrossRef]
- Schore, A.I.G.; Fraterrigo, J.M.; Salmon, V.G.; Yang, D.; Lara, M.J. Nitrogen Fixing Shrubs Advance the Pace of Tall-Shrub Expansion in Low-Arctic Tundra. Commun. Earth Environ. 2023, 4, 421. [Google Scholar] [CrossRef]
- Stow, D.; Daeschner, S.; Hope, A.; Douglas, D.; Petersen, A.; Myneni, R.; Zhou, L.; Oechel, W. Variability of the Seasonally Integrated Normalized Difference Vegetation Index across the North Slope of Alaska in the 1990s. Int. J. Remote Sens. 2003, 24, 1111–1117. [Google Scholar] [CrossRef]
- Verbyla, D. The Greening and Browning of Alaska Based on 1982–2003 Satellite Data. Glob. Ecol. Biogeogr. 2008, 17, 547–555. [Google Scholar] [CrossRef]
- Bieniek, P.A.; Bhatt, U.S.; Walker, D.A.; Raynolds, M.K.; Comiso, J.C.; Epstein, H.E.; Pinzon, J.E.; Tucker, C.J.; Thoman, R.L.; Tran, H.; et al. Climate Drivers Linked to Changing Seasonality of Alaska Coastal Tundra Vegetation Productivity. Earth Interact. 2015, 19, 1–29. [Google Scholar] [CrossRef]
- Walker, D.A.; Epstein, H.E.; Jia, G.J.; Balser, A.; Copass, C.; Edwards, E.J.; Gould, W.A.; Hollingsworth, J.; Knudson, J.; Maier, H.A.; et al. Phytomass, LAI, and NDVI in Northern Alaska: Relationships to Summer Warmth, Soil pH, Plant Functional Types, and Extrapolation to the Circumpolar Arctic. J. Geophys. Res.-Atmos. 2003, 108, 1–18. [Google Scholar] [CrossRef]
- Masek, J.G. Stability of Boreal Forest Stands during Recent Climate Change: Evidence from Landsat Satellite Imagery. J. Biogeogr. 2001, 28, 967–976. [Google Scholar] [CrossRef]
- Olthof, I.; Pouliot, D. Treeline Vegetation Composition and Change in Canada’s Western Subarctic from AVHRR and Canopy Reflectance Modeling. Remote Sens. Environ. 2010, 114, 805–815. [Google Scholar] [CrossRef]
- Bonta, C.; King, G.M.; Danby, R.K. Greening on the Bathurst Caribou Range in Northern Canada: Are Erect Shrubs Responsible for Remotely Sensed Trends? Arct. Sci. 2023, 9, 581–599. [Google Scholar] [CrossRef]
- Bonney, M.T.; Danby, R.K.; Treitz, P.M. Landscape Variability of Vegetation Change across the Forest to Tundra Transition of Central Canada. Remote Sens. Environ. 2018, 217, 18–29. [Google Scholar] [CrossRef]
- Dearborn, K.D.; Danby, R.K. Remotely Sensed Trends in Vegetation Productivity and Phenology during Population Decline of the Bathurst Caribou (Rangifer tarandus groenlandicus) Herd. Arct. Sci. 2022, 8, 228–251. [Google Scholar] [CrossRef]
- Tommervik, H.; Johansen, B.; Tombre, I.; Thannheiser, D.; Hogda, K.A.; Gaare, E.; Wielgolaski, F.E. Vegetation Changes in the Nordic Mountain Birch Forest: The Influence of Grazing and Climate Change. Arct. Antarct. Alp. Res. 2004, 36, 323–332. [Google Scholar] [CrossRef]
- Hofgaard, A.; Tommervik, H.; Rees, G.; Hanssen, F. Latitudinal Forest Advance in Northernmost Norway since the Early 20th Century. J. Biogeogr. 2013, 40, 938–949. [Google Scholar] [CrossRef]
- Johansen, B.; Karlsen, S.R. Monitoring Vegetation Changes on Finnmarksvidda, Northern Norway, Using Landsat MSS and Landsat TM/ETM plus Satellite Images. Phytocoenologia 2005, 35, 969–984. [Google Scholar] [CrossRef]
- Franke, A.K.; Feilhauer, H.; Braeuning, A.; Rautio, P.; Braun, M. Remotely Sensed Estimation of Vegetation Shifts in the Polar and Alpine Tree Line Ecotone in Finnish Lapland during the Last Three Decades. For. Ecol. Manag. 2019, 454, 117668. [Google Scholar] [CrossRef]
- Auda, Y.; Lundin, E.J.; Gustafsson, J.; Pokrovsky, O.S.; Cazaurang, S.; Orgogozo, L. A New Land Cover Map of Two Watersheds under Long-Term Environmental Monitoring in the Swedish Arctic Using Sentinel-2 Data. Water 2023, 15, 3311. [Google Scholar] [CrossRef]
- Frost, G.V.; Epstein, H.E.; Walker, D.A. Regional and Landscape-Scale Variability of Landsat-observed Vegetation Dynamics in Northwest Siberian Tundra. Environ. Res. Lett. 2014, 9, 025004. [Google Scholar] [CrossRef]
- Heqing, Z.; Gensuo, J. Impacts of Snow Cover on Vegetation Phenology in the Arctic from Satellite Data. Adv. Atmos. Sci. 2013, 30, 1421–1432. [Google Scholar] [CrossRef]
- Zeng, H.; Jia, G.; Forbes, B.C. Shifts in Arctic Phenology in Response to Climate and Anthropogenic Factors as Detected from Multiple Satellite Time Series. Environ. Res. Lett. 2013, 8, 035036. [Google Scholar] [CrossRef]
- Kornienko, S.G. Radiometric Normalization of Landsat Thermal Imagery for Detection of Tundra Land Cover Changes: Experience from West Siberia. Int. J. Remote Sens. 2021, 42, 1420–1449. [Google Scholar] [CrossRef]
- Blok, D.; Schaepman-Strub, G.; Bartholomeus, H.; Heijmans, M.M.P.D.; Maximov, T.C.; Berendse, F. The Response of Arctic Vegetation to the Summer Climate: Relation between Shrub Cover, NDVI, Surface Albedo and Temperature. Environ. Res. Lett. 2011, 6, 035502. [Google Scholar] [CrossRef]
- Macias-Fauria, M.; Forbes, B.C.; Zetterberg, P.; Kumpula, T. Eurasian Arctic Greening Reveals Teleconnections and the Potential for Structurally Novel Ecosystems. Nat. Clim. Chang. 2012, 2, 613–618. [Google Scholar] [CrossRef]
- Frost, G.V.; Epstein, H.E. Tall Shrub and Tree Expansion in Siberian Tundra Ecotones since the 1960s. Glob. Chang. Biol. 2014, 20, 1264–1277. [Google Scholar] [CrossRef]
- Lin, D.H.; Johnson, D.R.; Andresen, C.; Tweedie, C.E. High Spatial Resolution Decade-Time Scale Land Cover Change at Multiple Locations in the Beringian Arctic (1948–2000s). Environ. Res. Lett. 2012, 7, 025502. [Google Scholar] [CrossRef]
- Myers-Smith, I.H.; Forbes, B.C.; Wilmking, M.; Hallinger, M.; Lantz, T.; Blok, D.; Tape, K.D.; Macias-Fauria, M.; Sass-Klaassen, U.; Levesque, E.; et al. Shrub Expansion in Tundra Ecosystems: Dynamics, Impacts and Research Priorities. Environ. Res. Lett. 2011, 6, 045509. [Google Scholar] [CrossRef]
- Kharuk, V.I.; Ranson, K.J.; Im, S.T.; Naurzbaev, M.M. Forest-Tundra Larch Forests and Climatic Trends. Russ. J. Ecol. 2006, 37, 291–298. [Google Scholar] [CrossRef]
- GIMMS NDVI From AVHRR Sensors (3rd Generation). Available online: https://developers.google.com/earth-engine/datasets/catalog/NASA_GIMMS_3GV0#description (accessed on 6 August 2024).
- Vermote, E. NOAA Climate Data Record (CDR) of AVHRR Leaf Area Index (LAI) and Fraction of Absorbed Photosynthetically Active Radiation (FAPAR); Version 5; NOAA National Centers for Environmental Information: Silver Spring, MD, USA, 2019. [Google Scholar] [CrossRef]
- sentinelhub—Remote Sensing Indices. Available online: https://custom-scripts.sentinel-hub.com/custom-scripts/sentinel/sentinel-2/#remote-sensing-indices (accessed on 15 May 2024).
- Tasseled Cap Transformation for Landsat 8 and 9. Available online: https://supportsi.hexagon.com/s/article/Tasseled-Cap-Transformation-for-Landsat-8?language=en_US (accessed on 15 May 2024).
- Sentinel-5p Innovation—Solar Induced Chlorophyll Fluorescence. Available online: https://s5p-troposif.noveltis.fr/ (accessed on 15 May 2024).
- Thematic Land Processing—Radiometric Indices. Available online: https://step.esa.int/main/wp-content/help/versions/10.0.0/snap-toolboxes/eu.esa.opt.opttbx.radiometric.indices.ui/OperatorsIndexList.html (accessed on 15 May 2024).
- Copernicus Service Catalogue—Satellite-Albedo. Available online: https://www.copernicus.eu/en/access-data/copernicus-services-catalogue/satellite-albedo (accessed on 15 May 2024).
- Jia, G.J.; Epstein, H.E.; Walker, D.A. Vegetation Greening in the Canadian Arctic Related to Decadal Warming. J. Environ. Monit. 2009, 11, 2231–2238. [Google Scholar] [CrossRef] [PubMed]
- Urban, M.; Forkel, M.; Eberle, J.; Huettich, C.; Schmullius, C.; Herold, M. Pan-Arctic Climate and Land Cover Trends Derived from Multi-Variate and Multi-Scale Analyses (1981–2012). Remote Sens. 2014, 6, 2296–2316. [Google Scholar] [CrossRef]
- Edwards, R.; Treitz, P. Vegetation Greening Trends at Two Sites in the Canadian Arctic: 1984–2015. Arct. Antarct. Alp. Res. 2017, 49, 601–619. [Google Scholar] [CrossRef]
- Seider, J.H.; Lantz, T.C.; Hermosilla, T.; Wulder, M.A.; Wang, J.A. Biophysical Determinants of Shifting Tundra Vegetation Productivity in the Beaufort Delta Region of Canada. Ecosystems 2022, 25, 1435–1454. [Google Scholar] [CrossRef]
- Davis, E.; Trant, A.; Hermanutz, L.; Way, R.G.; Lewkowicz, A.G.; Collier, L.S.; Cuerrier, A.; Whitaker, D. Plant-Environment Interactions in the Low Arctic Torngat Mountains of Labrador. Ecosystems 2021, 24, 1038–1058. [Google Scholar] [CrossRef]
- Forkel, M.; Carvalhais, N.; Verbesselt, J.; Mahecha, M.D.; Neigh, C.S.R.; Reichstein, M. Trend Change Detection in NDVI Time Series: Effects of Inter-Annual Variability and Methodology. Remote Sens. 2013, 5, 2113–2144. [Google Scholar] [CrossRef]
- Olafsson, H.; Rousta, I. Remote Sensing Analysis to Map Inter-Regional Spatio-Temporal Variations of the Vegetation in Iceland During 2001–2018. Acta Geogr. Slov.-Geogr. Zb. 2022, 62, 105–124. [Google Scholar] [CrossRef]
- Beck, H.E.; McVicar, T.R.; van Dijk, A.I.J.M.; Schellekens, J.; de Jeu, R.A.M.; Bruijnzeel, L.A. Global Evaluation of Four AVHRR-NDVI Data Sets: Intercomparison and Assessment against Landsat Imagery. Remote Sens. Environ. 2011, 115, 2547–2563. [Google Scholar] [CrossRef]
- Berner, L.T.; Assmann, J.J.; Normand, S.; Goetz, S.J. ‘LandsatTS’: An R Package to Facilitate Retrieval, Cleaning, Cross-Calibration, and Phenological Modeling of Landsat Time Series Data. Ecography 2023, 2023, e06768. [Google Scholar] [CrossRef]
- Nill, L.; Ullmann, T.; Kneisel, C.; Sobiech-Wolf, J.; Baumhauer, R. Assessing Spatiotemporal Variations of Landsat Land Surface Temperature and Multispectral Indices in the Arctic Mackenzie Delta Region between 1985 and 2018. Remote Sens. 2019, 11, 2329. [Google Scholar] [CrossRef]
- Zhang, Y.; Song, C.; Band, L.E.; Sun, G.; Li, J. Reanalysis of Global Terrestrial Vegetation Trends from MODIS Products: Browning or Greening? Remote Sens. Environ. 2017, 191, 145–155. [Google Scholar] [CrossRef]
- Arndt, K.A.; Santos, M.J.; Ustin, S.; Davidson, S.J.; Stow, D.; Oechel, W.C.; Tran, T.T.P.; Graybill, B.; Zona, D. Arctic Greening Associated with Lengthening Growing Seasons in Northern Alaska. Environ. Res. Lett. 2019, 14, 125018. [Google Scholar] [CrossRef]
- Chen, A.; Lantz, T.C.; Hermosilla, T.; Wulder, M.A. Biophysical Controls of Increased Tundra Productivity in the Western Canadian Arctic. Remote Sens. Environ. 2021, 258, 112358. [Google Scholar] [CrossRef]
- Huemmrich, K.F.; Gamon, J.; Campbell, P.; Mora, M.; Vargas, Z.S.; Almanza, B.; Tweedie, C. 20 Years of Change in Tundra NDVI from Coupled Field and Satellite Observations. Environ. Res. Lett. 2023, 18, 094022. [Google Scholar] [CrossRef]
- Anisimov, O.A.; Zhiltcova, Y.L.; Razzhivin, V.Y. Predictive Modeling of Plant Productivity in the Russian Arctic Using Satellite Data. Izv. Atmos. Ocean. Phys. 2015, 51, 1051–1059. [Google Scholar] [CrossRef]
- Jenkins, L.K.; Barry, T.; Bosse, K.R.; Currie, W.S.; Christensen, T.; Longan, S.; Shuchman, R.A.; Tanzer, D.; Taylor, J.J. Satellite-Based Decadal Change Assessments of Pan-Arctic Environments. Ambio 2020, 49, 820–832. [Google Scholar] [CrossRef]
- Bhatt, U.S.; Walker, D.A.; Raynolds, M.K.; Comiso, J.C.; Epstein, H.E.; Jia, G.; Gens, R.; Pinzon, J.E.; Tucker, C.J.; Tweedie, C.E.; et al. Circumpolar Arctic Tundra Vegetation Change Is Linked to Sea Ice Decline. Earth Interact. 2010, 14, 1–20. [Google Scholar] [CrossRef]
- Zhou, L.M.; Tucker, C.J.; Kaufmann, R.K.; Slayback, D.; Shabanov, N.V.; Myneni, R.B. Variations in Northern Vegetation Activity Inferred from Satellite Data of Vegetation Index during 1981 to 1999. J. Geophys. Res.-Atmos. 2001, 106, 20069–20083. [Google Scholar] [CrossRef]
- Liu, C.; Huang, H.; Liu, C.; Wang, X.; Wang, S. Comparative Evaluation of Vegetation Greenness Trends over Circumpolar Arctic Tundra Using Multi-Sensors Satellite Datasets. Int. J. Digit. Earth 2024, 17, 2328823. [Google Scholar] [CrossRef]
- Seo, M.; Kim, H.C. Arctic Greening Trends: Change Points in Satellite-Derived Normalized Difference Vegetation Indexes and Their Correlation with Climate Variables over the Last Two Decades. Remote Sens. 2024, 16, 1160. [Google Scholar] [CrossRef]
- Wang, J.A.; Friedl, M.A. The Role of Land Cover Change in Arctic-Boreal Greening and Browning Trends. Environ. Res. Lett. 2019, 14, 125007. [Google Scholar] [CrossRef]
- Berner, L.T.; Massey, R.; Jantz, P.; Forbes, B.C.; Macias-Fauria, M.; Myers-Smith, I.; Kumpula, T.; Gauthier, G.; Andreu-Hayles, L.; Gaglioti, B.V.; et al. Summer Warming Explains Widespread but Not Uniform Greening in the Arctic Tundra Biome. Nat. Commun. 2020, 11, 4621. [Google Scholar] [CrossRef]
- Urban, M.; Forkel, M.; Schmullius, C.; Hese, S.; Huettich, C.; Herold, M. Identification of Land Surface Temperature and Albedo Trends in AVHRR Pathfinder Data from 1982 to 2005 for Northern Siberia. Int. J. Remote Sens. 2013, 34, 4491–4507. [Google Scholar] [CrossRef]
- Berner, L.T.; Beck, P.S.A.; Bunn, A.G.; Goetz, S.J. Plant Response to Climate Change along the Forest-Tundra Ecotone in Northeastern Siberia. Glob. Chang. Biol. 2013, 19, 3449–3462. [Google Scholar] [CrossRef]
- Bunn, A.G.; Goetz, S.J. Trends in Satellite-Observed Circumpolar Photosynthetic Activity from 1982 to 2003: The Influence of Seasonality, Cover Type, and Vegetation Density. Earth Interact. 2006, 10, 1–19. [Google Scholar] [CrossRef]
- Lamchin, M.; Wang, S.W.; Lim, C.H.; Ochir, A.; Pavel, U.; Gebru, B.M.; Choi, Y.; Jeon, S.W.; Lee, W.K. Understanding Global Spatio-Temporal Trends and the Relationship between Vegetation Greenness and Climate Factors by Land Cover during 1982–2014. Glob. Ecol. Conserv. 2020, 24, e01299. [Google Scholar] [CrossRef]
- Xu, L.; Myneni, R.B.; Chapin, F.S., III; Callaghan, T.V.; Pinzon, J.E.; Tucker, C.J.; Zhu, Z.; Bi, J.; Ciais, P.; Tommervik, H.; et al. Temperature and Vegetation Seasonality Diminishment over Northern Lands. Nat. Clim. Chang. 2013, 3, 581–586. [Google Scholar] [CrossRef]
- Fraser, R.; Olthof, I.; Carriere, M.; Deschamps, A.; Pouliot, D. A Method for Trend-Based Change Analysis in Arctic Tundra Using the 25-Year Landsat Archive. Polar Rec. 2012, 48, 83–93. [Google Scholar] [CrossRef]
- Fu, D.; Su, F.; Wang, J.; Sui, Y. Patterns of Arctic Tundra Greenness Based on Spatially Downscaled Solar-Induced Fluorescence. Remote Sens. 2019, 11, 1460. [Google Scholar] [CrossRef]
- Liu, C.; Huang, H.; Sun, F. A Pixel-Based Vegetation Greenness Trend Analysis over the Russian Tundra with All Available Landsat Data from 1984 to 2018. Remote Sens. 2021, 13, 4933. [Google Scholar] [CrossRef]
- Brehaut, L.; Danby, R.K. Inconsistent Relationships between Annual Tree Ring-Widths and Satellite- Measured NDVI in a Mountainous Subarctic Environment. Ecol. Indic. 2018, 91, 698–711. [Google Scholar] [CrossRef]
- Tucker, C.J.; Slayback, D.A.; Pinzon, J.E.; Los, S.O.; Myneni, R.B.; Taylor, M.G. Higher Northern Latitude Normalized Difference Vegetation Index and Growing Season Trends from 1982 to 1999. Int. J. Biometeorol. 2001, 45, 184–190. [Google Scholar] [CrossRef]
- Dutrieux, L.P.; Bartholomeus, H.; Herold, M.; Verbesselt, J. Relationships between Declining Summer Sea Ice, Increasing Temperatures and Changing Vegetation in the Siberian Arctic Tundra from MODIS Time Series (2000–11). Environ. Res. Lett. 2012, 7, 044028. [Google Scholar] [CrossRef]
- Guay, K.C.; Beck, P.S.A.; Berner, L.T.; Goetz, S.J.; Baccini, A.; Buermann, W. Vegetation Productivity Patterns at High Northern Latitudes: A Multi-Sensor Satellite Data Assessment. Glob. Chang. Biol. 2014, 20, 3147–3158. [Google Scholar] [CrossRef]
- Pan, N.; Feng, X.; Fu, B.; Wang, S.; Ji, F.; Pan, S. Increasing Global Vegetation Browning Hidden in Overall Vegetation Greening: Insights from Time-Varying Trends. Remote Sens. Environ. 2018, 214, 59–72. [Google Scholar] [CrossRef]
- Campbell, T.K.F.; Lantz, T.C.; Fraser, R.H.; Hogan, D. High Arctic Vegetation Change Mediated by Hydrological Conditions. Ecosystems 2021, 24, 106–121. [Google Scholar] [CrossRef]
- Raynolds, M.; Magnusson, B.; Metusalemsson, S.; Magnusson, S.H. Warming, Sheep and Volcanoes: Land Cover Changes in Iceland Evident in Satellite NDVI Trends. Remote Sens. 2015, 7, 9492–9506. [Google Scholar] [CrossRef]
- Huettich, C.; Herold, M.; Schmullius, C.; Egorov, V.; Bartalev, S.A. Indicators of Northern Eurasia’s Land-Cover Change Trends from SPOT-VEGETATION Time-Series Analysis 1998–2005. Int. J. Remote Sens. 2007, 28, 4199–4206. [Google Scholar] [CrossRef]
- Mizuochi, H.; Sasagawa, T.; Ito, A.; Iijima, Y.; Park, H.; Nagano, H.; Ichii, K.; Hiyama, T. Creation and Environmental Applications of 15-Year Daily Inundation and Vegetation Maps for Siberia by Integrating Satellite and Meteorological Datasets. Prog. Earth Planet. Sci. 2024, 11, 9. [Google Scholar] [CrossRef]
- Olthof, I.; Latifovic, R. Short-Term Response of Arctic Vegetation NDVI to Temperature Anomalies. Int. J. Remote Sens. 2007, 28, 4823–4840. [Google Scholar] [CrossRef]
- Pattison, R.R.; Jorgenson, J.C.; Raynolds, M.K.; Welker, J.M. Trends in NDVI and Tundra Community Composition in the Arctic of NE Alaska between 1984 and 2009. Ecosystems 2015, 18, 707–719. [Google Scholar] [CrossRef]
- Olafsson, H.; Rousta, I. Influence of Atmospheric Patterns and North Atlantic Oscillation (NAO) on Vegetation Dynamics in Iceland Using Remote Sensing. Eur. J. Remote Sens. 2021, 54, 351–363. [Google Scholar] [CrossRef]
- Freemantle, V.; Freemantle, J.; Atkinson, D.; Treitz, P. A High Spatial Resolution Satellite Remote Sensing Time Series Analysis of Cape Bounty, Melville Island, Nunavut (2004–2018). Can. J. Remote Sens. 2020, 46, 733–752. [Google Scholar] [CrossRef]
- Reichle, L.M.; Epstein, H.E.; Bhatt, U.S.; Raynolds, M.K.; Walker, D.A. Spatial Heterogeneity of the Temporal Dynamics of Arctic Tundra Vegetation. Geophys. Res. Lett. 2018, 45, 9206–9215. [Google Scholar] [CrossRef]
- Khormizi, H.Z.; Malamiri, H.R.G.; Alian, S.; Stein, A.; Kalantari, Z.; Ferreira, C.S.S. Proof of Evidence of Changes in Global Terrestrial Biomes Using Historic and Recent NDVI Time Series. Heliyon 2023, 9, e18686. [Google Scholar] [CrossRef]
- Gaspard, A.; Boudreau, S. Climate Predicts NDVI Better Than Plant Functional Group Attributes Along a Latitudinal Gradient in Nunavik. J. Biogeogr. 2024, 1–13. [Google Scholar] [CrossRef]
- Gonsamo, A.; Ter-Mikaelian, M.T.; Chen, J.M.; Chen, J. Does Earlier and Increased Spring Plant Growth Lead to Reduced Summer Soil Moisture and Plant Growth on Landscapes Typical of Tundra-Taiga Interface? Remote Sens. 2019, 11, 1989. [Google Scholar] [CrossRef]
- Chen, X.; Jeong, S. Asymmetric Impacts of Surface Thaw Onset Change on Seasonal Vegetation Growth in Arctic Permafrost. Glob. Ecol. Biogeogr. 2024, 33, 131–140. [Google Scholar] [CrossRef]
- Cortes, J.; Mahecha, M.D.; Reichstein, M.; Myneni, R.B.; Chen, C.; Brenning, A. Where Are Global Vegetation Greening and Browning Trends Significant? Geophys. Res. Lett. 2021, 48, e2020GL091496. [Google Scholar] [CrossRef]
- Zhu, Z.; Bi, J.; Pan, Y.; Ganguly, S.; Anav, A.; Xu, L.; Samanta, A.; Piao, S.; Nemani, R.R.; Myneni, R.B. Global Data Sets of Vegetation Leaf Area Index (LAI)3g and Fraction of Photosynthetically Active Radiation (FPAR)3g Derived from Global Inventory Modeling and Mapping Studies (GIMMS) Normalized Difference Vegetation Index (NDVI3g) for the Period 1981 to 2011. Remote Sens. 2013, 5, 927–948. [Google Scholar] [CrossRef]
- Guo, W.; Rees, G. Correlation between the Dynamics and Spatial Configuration of the Circumarctic Latitudinal Forest-Tundra Ecotone. Int. J. Remote Sens. 2021, 42, 1250–1274. [Google Scholar] [CrossRef]
- Simms, E.L.; Ward, H. Multisensor NDVI-Based Monitoring of the Tundra-Taiga Interface (Mealy Mountains, Labrador, Canada). Remote Sens. 2013, 5, 1066–1090. [Google Scholar] [CrossRef]
- Liu, Z.; He, D.; Shi, Q.; Cheng, X. NDVI Time-Series Data Reconstruction for Spatial-Temporal Dynamic Monitoring of Arctic Vegetation Structure. Geo-Spat. Inf. Sci. 2024, 1–19. [Google Scholar] [CrossRef]
- Wang, J.A.; Sulla-Menashe, D.; Woodcock, C.E.; Sonnentag, O.; Keeling, R.F.; Friedl, M.A. Extensive Land Cover Change across Arctic-Boreal Northwestern North America from Disturbance and Climate Forcing. Glob. Chang. Biol. 2020, 26, 807–822. [Google Scholar] [CrossRef]
- Kravtsova, V.I.; Loshkareva, A.R. Dynamics of Vegetation in the Tundra-Taiga Ecotone on the Kola Peninsula Depending on Climate Fluctuations. Russ. J. Ecol. 2013, 44, 303–311. [Google Scholar] [CrossRef]
- Beck, I.; Ludwig, R.; Bernier, M.; Levesque, E.; Boike, J. Assessing Permafrost Degradation and Land Cover Changes (1986–2009) Using Remote Sensing Data over Umiujaq, Sub-Arctic Quebec. Permafr. Periglac. Process. 2015, 26, 129–141. [Google Scholar] [CrossRef]
- Rees, W.G.; Williams, M.; Vitebsky, P. Mapping Land Cover Change in a Reindeer Herding Area of the Russian Arctic Using Landsat TM and ETM+ Imagery and Indigenous Knowledge. Remote Sens. Environ. 2003, 85, 441–452. [Google Scholar] [CrossRef]
- Fraser, R.H.; Olthof, I.; Carriere, M.; Deschamps, A.; Pouliot, D. Detecting Long-Term Changes to Vegetation in Northern Canada Using the Landsat Satellite Image Archive. Environ. Res. Lett. 2011, 6, 045502. [Google Scholar] [CrossRef]
- Hobbie, J.E.; Shaver, G.R.; Rastetter, E.B.; Cherry, J.E.; Goetz, S.J.; Guay, K.C.; Gould, W.A.; Kling, G.W. Ecosystem Responses to Climate Change at a Low Arctic and a High Arctic Long-Term Research Site. Ambio 2017, 46, S160–S173. [Google Scholar] [CrossRef]
- Davis, E.L.; Trant, A.J.; Way, R.G.; Hermanutz, L.; Whitaker, D. Rapid Ecosystem Change at the Southern Limit of the Canadian Arctic, Torngat Mountains National Park. Remote Sens. 2021, 13, 2085. [Google Scholar] [CrossRef]
- Weijers, S. Declining Temperature and Increasing Moisture Sensitivity of Shrub Growth in the Low-Arctic Erect Dwarf-Shrub Tundra of Western Greenland. Ecol. Evol. 2022, 12, e9419. [Google Scholar] [CrossRef] [PubMed]
- Tape, K.D.; Hallinger, M.; Welker, J.M.; Ruess, R.W. Landscape Heterogeneity of Shrub Expansion in Arctic Alaska. Ecosystems 2012, 15, 711–724. [Google Scholar] [CrossRef]
- Forbes, B.C.; Macias Fauria, M.; Zetterberg, P. Russian Arctic Warming and ‘greening’ Are Closely Tracked by Tundra Shrub Willows. Glob. Chang. Biol. 2010, 16, 1542–1554. [Google Scholar] [CrossRef]
- Madani, N.; Parazoo, N.C.; Miller, C.E. Climate Change Is Enforcing Physiological Changes in Arctic Ecosystems. Environ. Res. Lett. 2023, 18, 074027. [Google Scholar] [CrossRef]
- Wang, L.; Tian, F.; Wang, Y.; Wu, Z.; Schurgers, G.; Fensholt, R. Acceleration of Global Vegetation Greenup from Combined Effects of Climate Change and Human Land Management. Glob. Chang. Biol. 2018, 24, 5484–5499. [Google Scholar] [CrossRef]
- de Beurs, K.M.; Henebry, G.M. A Land Surface Phenology Assessment of the Northern Polar Regions Using MODIS Reflectance Time Series. Can. J. Remote Sens. 2010, 36, S87–S110. [Google Scholar] [CrossRef]
- Ye, W.; van Dijk, A.I.J.M.; Huete, A.; Yebra, M. Global Trends in Vegetation Seasonality in the GIMMS NDVI3g and Their Robustness. Int. J. Appl. Earth Obs. Geoinf. 2021, 94, 102238. [Google Scholar] [CrossRef]
- Zeng, H.; Jia, G.; Epstein, H. Recent Changes in Phenology over the Northern High Latitudes Detected from Multi-Satellite Data. Environ. Res. Lett. 2011, 6, 045508. [Google Scholar] [CrossRef]
- Gonsamo, A.; Chen, J.M.; Ooi, Y.W. Peak Season Plant Activity Shift towards Spring Is Reflected by Increasing Carbon Uptake by Extratropical Ecosystems. Glob. Chang. Biol. 2018, 24, 2117–2128. [Google Scholar] [CrossRef] [PubMed]
- Wu, Y.; Xiao, P.; Zhang, X.; Liu, H.; Dong, Y.; Feng, L. Effects of Snow Cover on Spring Vegetation Phenology Vary with Temperature Gradient across the Pan-Arctic. J. Geophys. Res.-Biogeosci. 2023, 128, e2022JG007183. [Google Scholar] [CrossRef]
- Swanson, D.K. Trends in Greenness and Snow Cover in Alaska’s Arctic National Parks, 2000–2016. Remote Sens. 2017, 9, 514. [Google Scholar] [CrossRef]
- Li, C.; Zhuang, D.; He, J.; Wen, K. Spatiotemporal Variations in Remote Sensing Phenology of Vegetation and Its Responses to Temperature Change of Boreal Forest in Tundra-Taiga Transitional Zone in the Eastern Siberia. J. Geogr. Sci. 2023, 33, 464–482. [Google Scholar] [CrossRef]
- Liu, Y.; Wang, P.; Elberling, B.; Westergaard-Nielsen, A. Drivers of contemporary and future changes in Arctic seasonal transition dates for a tundra site in coastal Greenland. Glob. Chang. Biol. 2024, 30, e17118. [Google Scholar] [CrossRef]
- Karlsen, S.R.; Elvebakk, A.; Tommervik, H.; Belda, S.; Stendardi, L. Changes in Onset of Vegetation Growth on Svalbard, 2000–2020. Remote Sens. 2022, 14, 6346. [Google Scholar] [CrossRef]
- Karlsen, S.R.; Elvebakk, A.; Hogda, K.A.; Grydeland, T. Spatial and Temporal Variability in the Onset of the Growing Season on Svalbard, Arctic Norway—Measured by MODIS-NDVI Satellite Data. Remote Sens. 2014, 6, 8088–8106. [Google Scholar] [CrossRef]
- Zhang, K.; Kimball, J.S.; Hogg, E.H.; Zhao, M.; Oechel, W.C.; Cassano, J.J.; Running, S.W. Satellite-Based Model Detection of Recent Climate-Driven Changes in Northern High-Latitude Vegetation Productivity. J. Geophys. Res.-Biogeosci. 2008, 113, 1–13. [Google Scholar] [CrossRef]
- Park, T.; Ganguly, S.; Tommervik, H.; Euskirchen, E.S.; Hogda, K.A.; Karlsen, S.R.; Brovkin, V.; Nemani, R.R.; Myneni, R.B. Changes in Growing Season Duration and Productivity of Northern Vegetation Inferred from Long-Term Remote Sensing Data. Environ. Res. Lett. 2016, 11, 084001. [Google Scholar] [CrossRef]
- Zhang, K.; Kimball, J.S.; Zhao, M.; Oechel, W.C.; Cassano, J.; Running, S.W. Sensitivity of Pan-Arctic Terrestrial Net Primary Productivity Simulations to Daily Surface Meteorology from NCEP-NCAR and ERA-40 Reanalyses. J. Geophys. Res.-Biogeosci. 2007, 112, 1–14. [Google Scholar] [CrossRef]
- Luus, K.A.; Lin, J.C. The Polar Vegetation Photosynthesis and Respiration Model: A Parsimonious, Satellite-Data-Driven Model of High-Latitude CO2 Exchange. Geosci. Model Dev. 2015, 8, 2655–2674. [Google Scholar] [CrossRef]
- Tagesson, T.; Mastepanov, M.; Tamstorf, M.P.; Eklundh, L.; Schubert, P.; Ekberg, A.; Sigsgaard, C.; Christensen, T.R.; Strom, L. High-Resolution Satellite Data Reveal an Increase in Peak Growing Season Gross Primary Production in a High-Arctic Wet Tundra Ecosystem 1992–2008. Int. J. Appl. Earth Obs. Geoinf. 2012, 18, 407–416. [Google Scholar] [CrossRef]
- Marsh, H.; Zhang, W. Direct and Legacy Effects of Spring Temperature Anomalies on Seasonal Productivity in Northern Ecosystems. Remote Sens. 2022, 14, 2007. [Google Scholar] [CrossRef]
- Karlsen, S.R.; Anderson, H.B.; van der Wal, R.; Hansen, B.B. A New NDVI Measure That Overcomes Data Sparsity in Cloud-Covered Regions Predicts Annual Variation in Ground-Based Estimates of High Arctic Plant Productivity. Environ. Res. Lett. 2018, 13, 025011. [Google Scholar] [CrossRef]
- Beck, P.S.A.; Goetz, S.J. Satellite Observations of High Northern Latitude Vegetation Productivity Changes between 1982 and 2008: Ecological Variability and Regional Differences. Environ. Res. Lett. 2011, 6, 045501. [Google Scholar] [CrossRef]
- Potter, C. Changes in Vegetation Cover of the Arctic National Wildlife Refuge Estimated from MODIS Greenness Trends, 2000–2018. Earth Interact. 2019, 23, 1–18. [Google Scholar] [CrossRef]
- Potter, C.; Alexander, O. Changes in Vegetation Cover and Snowmelt Timing in the Noatak National Preserve of Northwestern Alaska Estimated from MODIS and Landsat Satellite Image Analysis. Eur. J. Remote Sens. 2019, 52, 542–556. [Google Scholar] [CrossRef]
- Fang, X.; Zhu, Q.; Ren, L.; Chen, H.; Wang, K.; Peng, C. Large-Scale Detection of Vegetation Dynamics and Their Potential Drivers Using MODIS Images and BFAST: A Case Study in Quebec, Canada. Remote Sens. Environ. 2018, 206, 391–402. [Google Scholar] [CrossRef]
- Chasmer, L.; Baker, T.; Carey, S.K.; Straker, J.; Strilesky, S.; Petrone, R. Monitoring Ecosystem Reclamation Recovery Using Optical Remote Sensing: Comparison with Field Measurements and Eddy Covariance. Sci. Total. Environ. 2018, 642, 436–446. [Google Scholar] [CrossRef]
- Nelson, P.R.; Maguire, A.J.; Pierrat, Z.; Orcutt, E.L.; Yang, D.; Serbin, S.; Frost, V.G.; Macander, M.J.; Magney, T.S.; Thompson, D.R.; et al. Remote Sensing of Tundra Ecosystems Using High Spectral Resolution Reflectance: Opportunities and Challenges. J. Geophys. Res.-Biogeosci. 2022, 127, e2021JG006697. [Google Scholar] [CrossRef]
- Zhu, X.; Chen, D.; Kogure, M.; Hoy, E.; Berner, L.T.; Breen, A.L.; Chatterjee, A.; Davidson, S.J.; Frost, G.V.; Hollingsworth, T.N.; et al. A synthesized field survey database of vegetation and active-layer properties for the Alaskan tundra (1972–2020). Earth Syst. Sci. Data 2024, 16, 3687–3703. [Google Scholar] [CrossRef]
- Intro to the Arctic-Boreal Vulnerability Experiment—ABoVE. Available online: https://above.nasa.gov/about.html? (accessed on 13 November 2024).
- Duguay, Y.; Bernier, M.; Levesque, E.; Tremblay, B. Potential of C and X Band SAR for Shrub Growth Monitoring in Sub-Arctic Environments. Remote Sens. 2015, 7, 9410–9430. [Google Scholar] [CrossRef]
- A’Campo, W.; Bartsch, A.; Roth, A.; Wendleder, A.; Martin, V.S.; Durstewitz, L.; Lodi, R.; Wagner, J.; Hugelius, G. Arctic Tundra Land Cover Classification on the Beaufort Coast Using the Kennaugh Element Framework on Dual-Polarimetric TerraSAR-X Imagery. Remote Sens. 2021, 13, 4780. [Google Scholar] [CrossRef]
- International Panel on Climate Change. Polar Regions. In Climate Change 2022—Impacts, Adaptation and Vulnerability: Working Group II Contribution to the Sixth Assessment Report of the Intergovernmental Panel on Climate Change; Cambridge University Press: Cambridge, UK, 2023; pp. 2319–2368. [Google Scholar]
- International Panel on Climate Change. High Mountain Areas. In The Ocean and Cryosphere in a Changing Climate: Special Report of the Intergovernmental Panel on Climate Change; Cambridge University Press: Cambridge, UK, 2022; pp. 131–202. [Google Scholar]
- Kovács, D.D.; Amin, E.; Berger, K.; Reyes-Muñoz, P.; Verrelst, J. Untangling the Causal Links between Satellite Vegetation Products and Environmental Drivers on a Global Scale by the Granger Causality Method. Remote Sens. 2023, 15, 4956. [Google Scholar] [CrossRef]
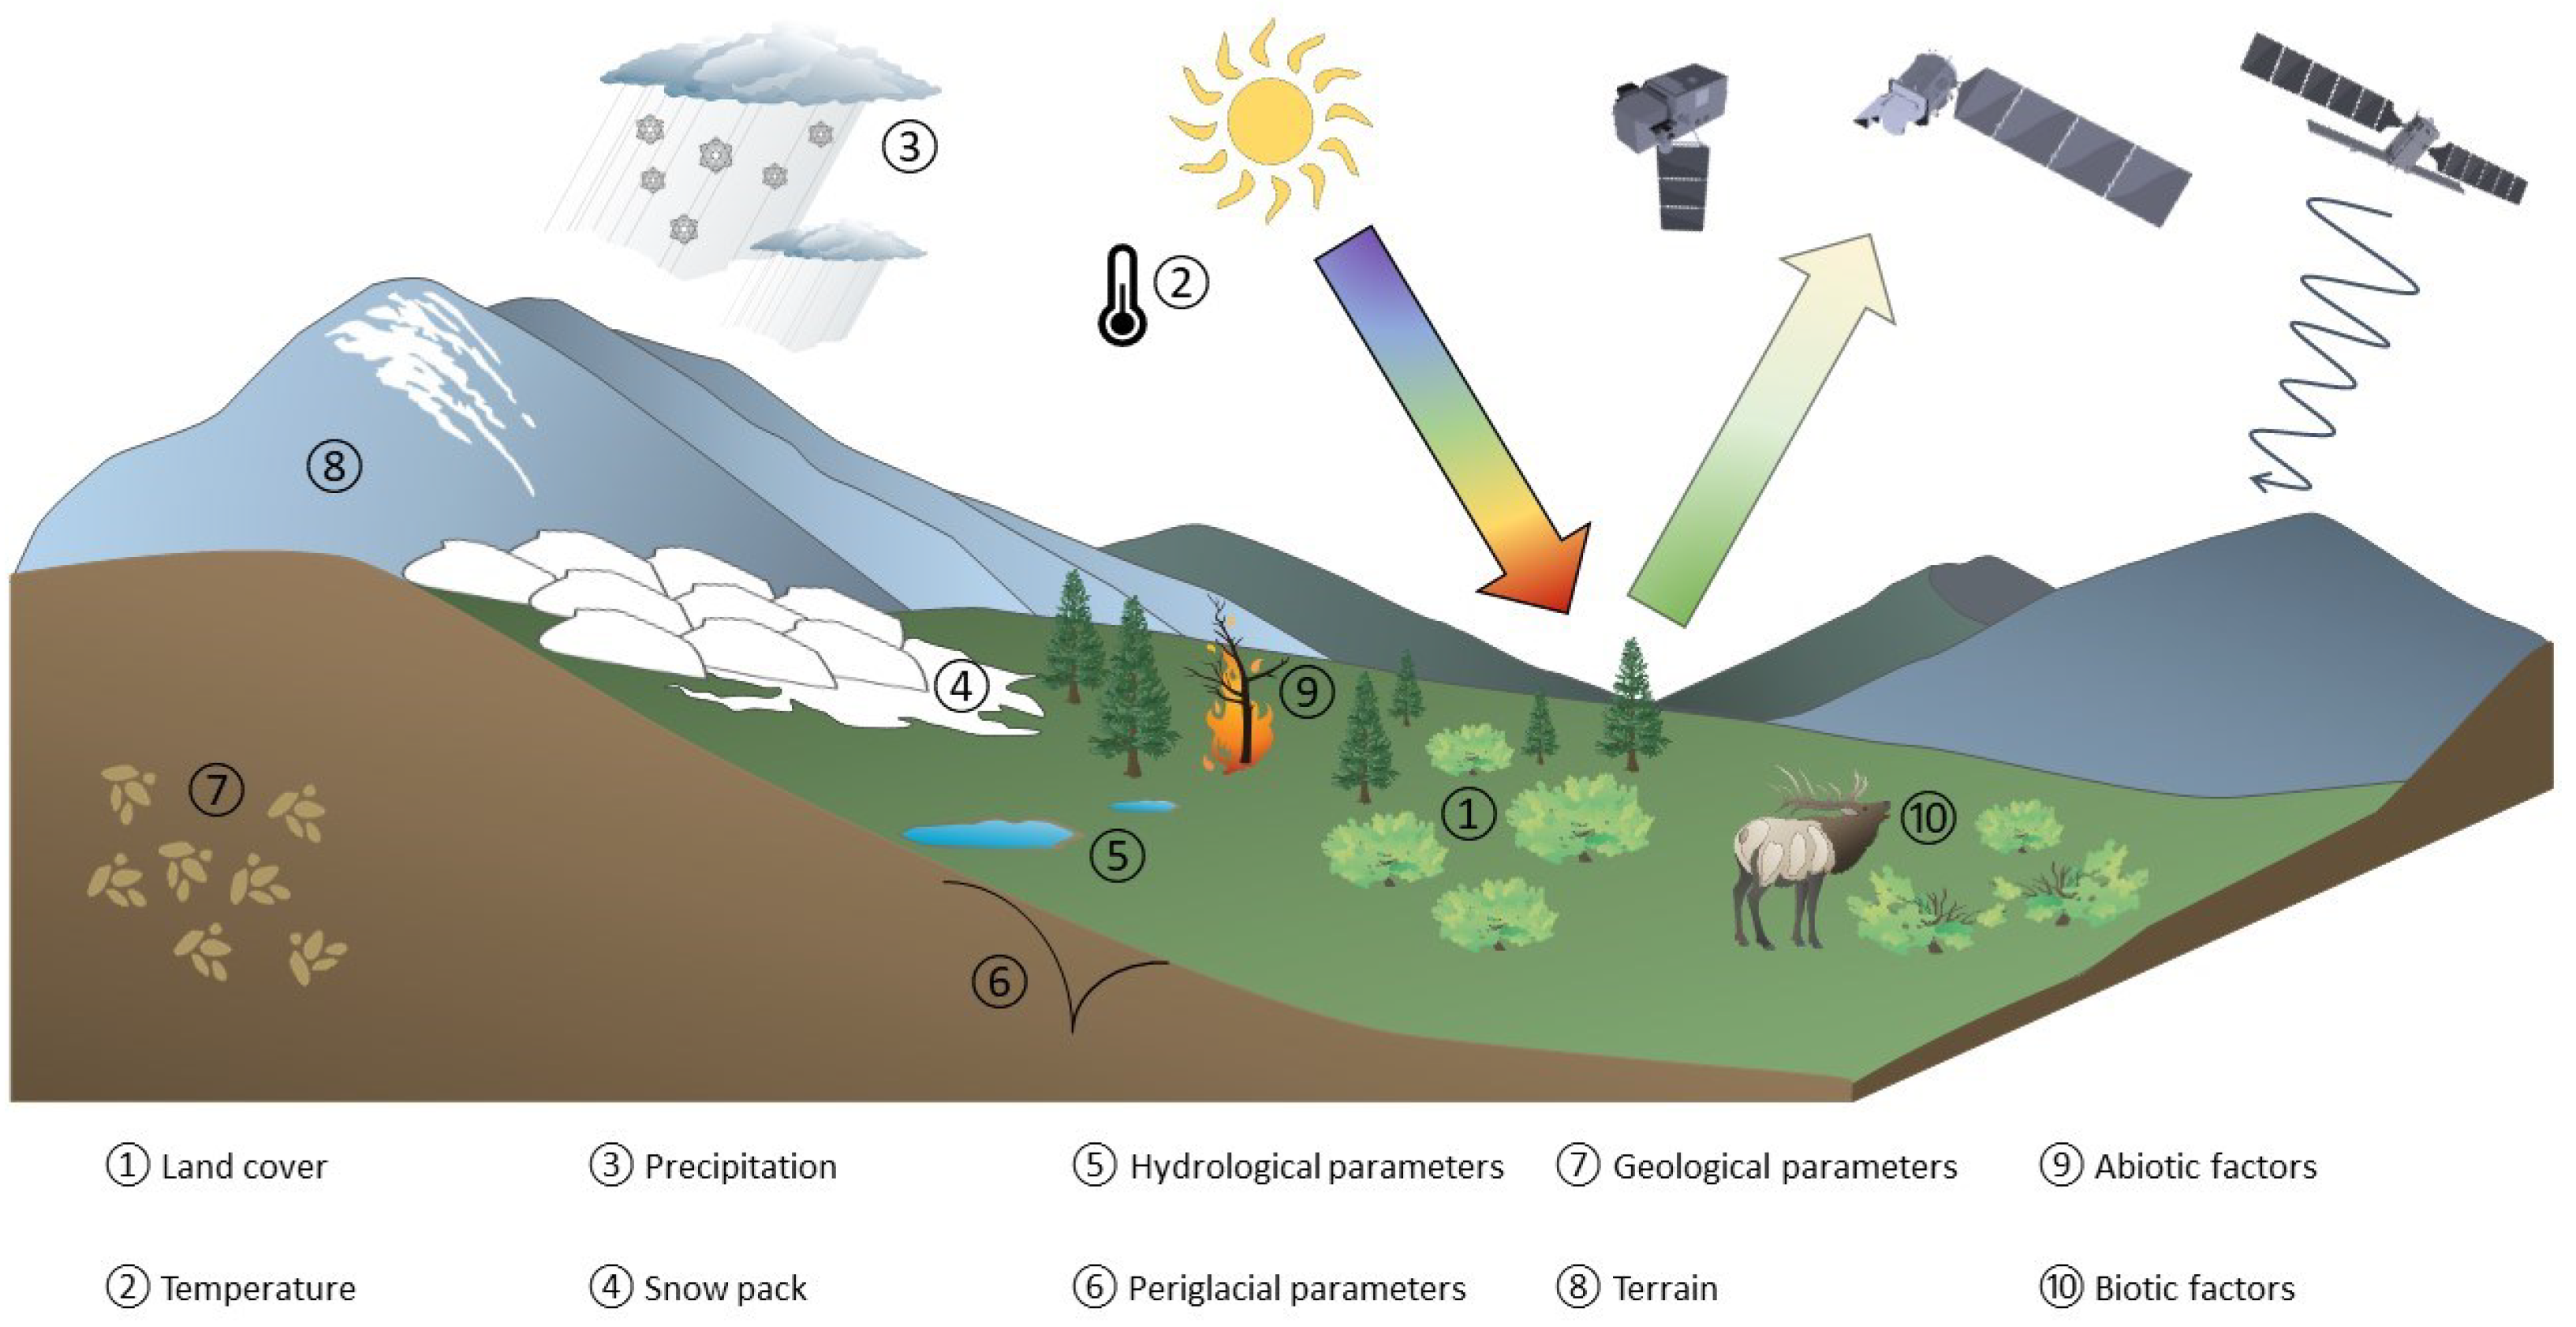
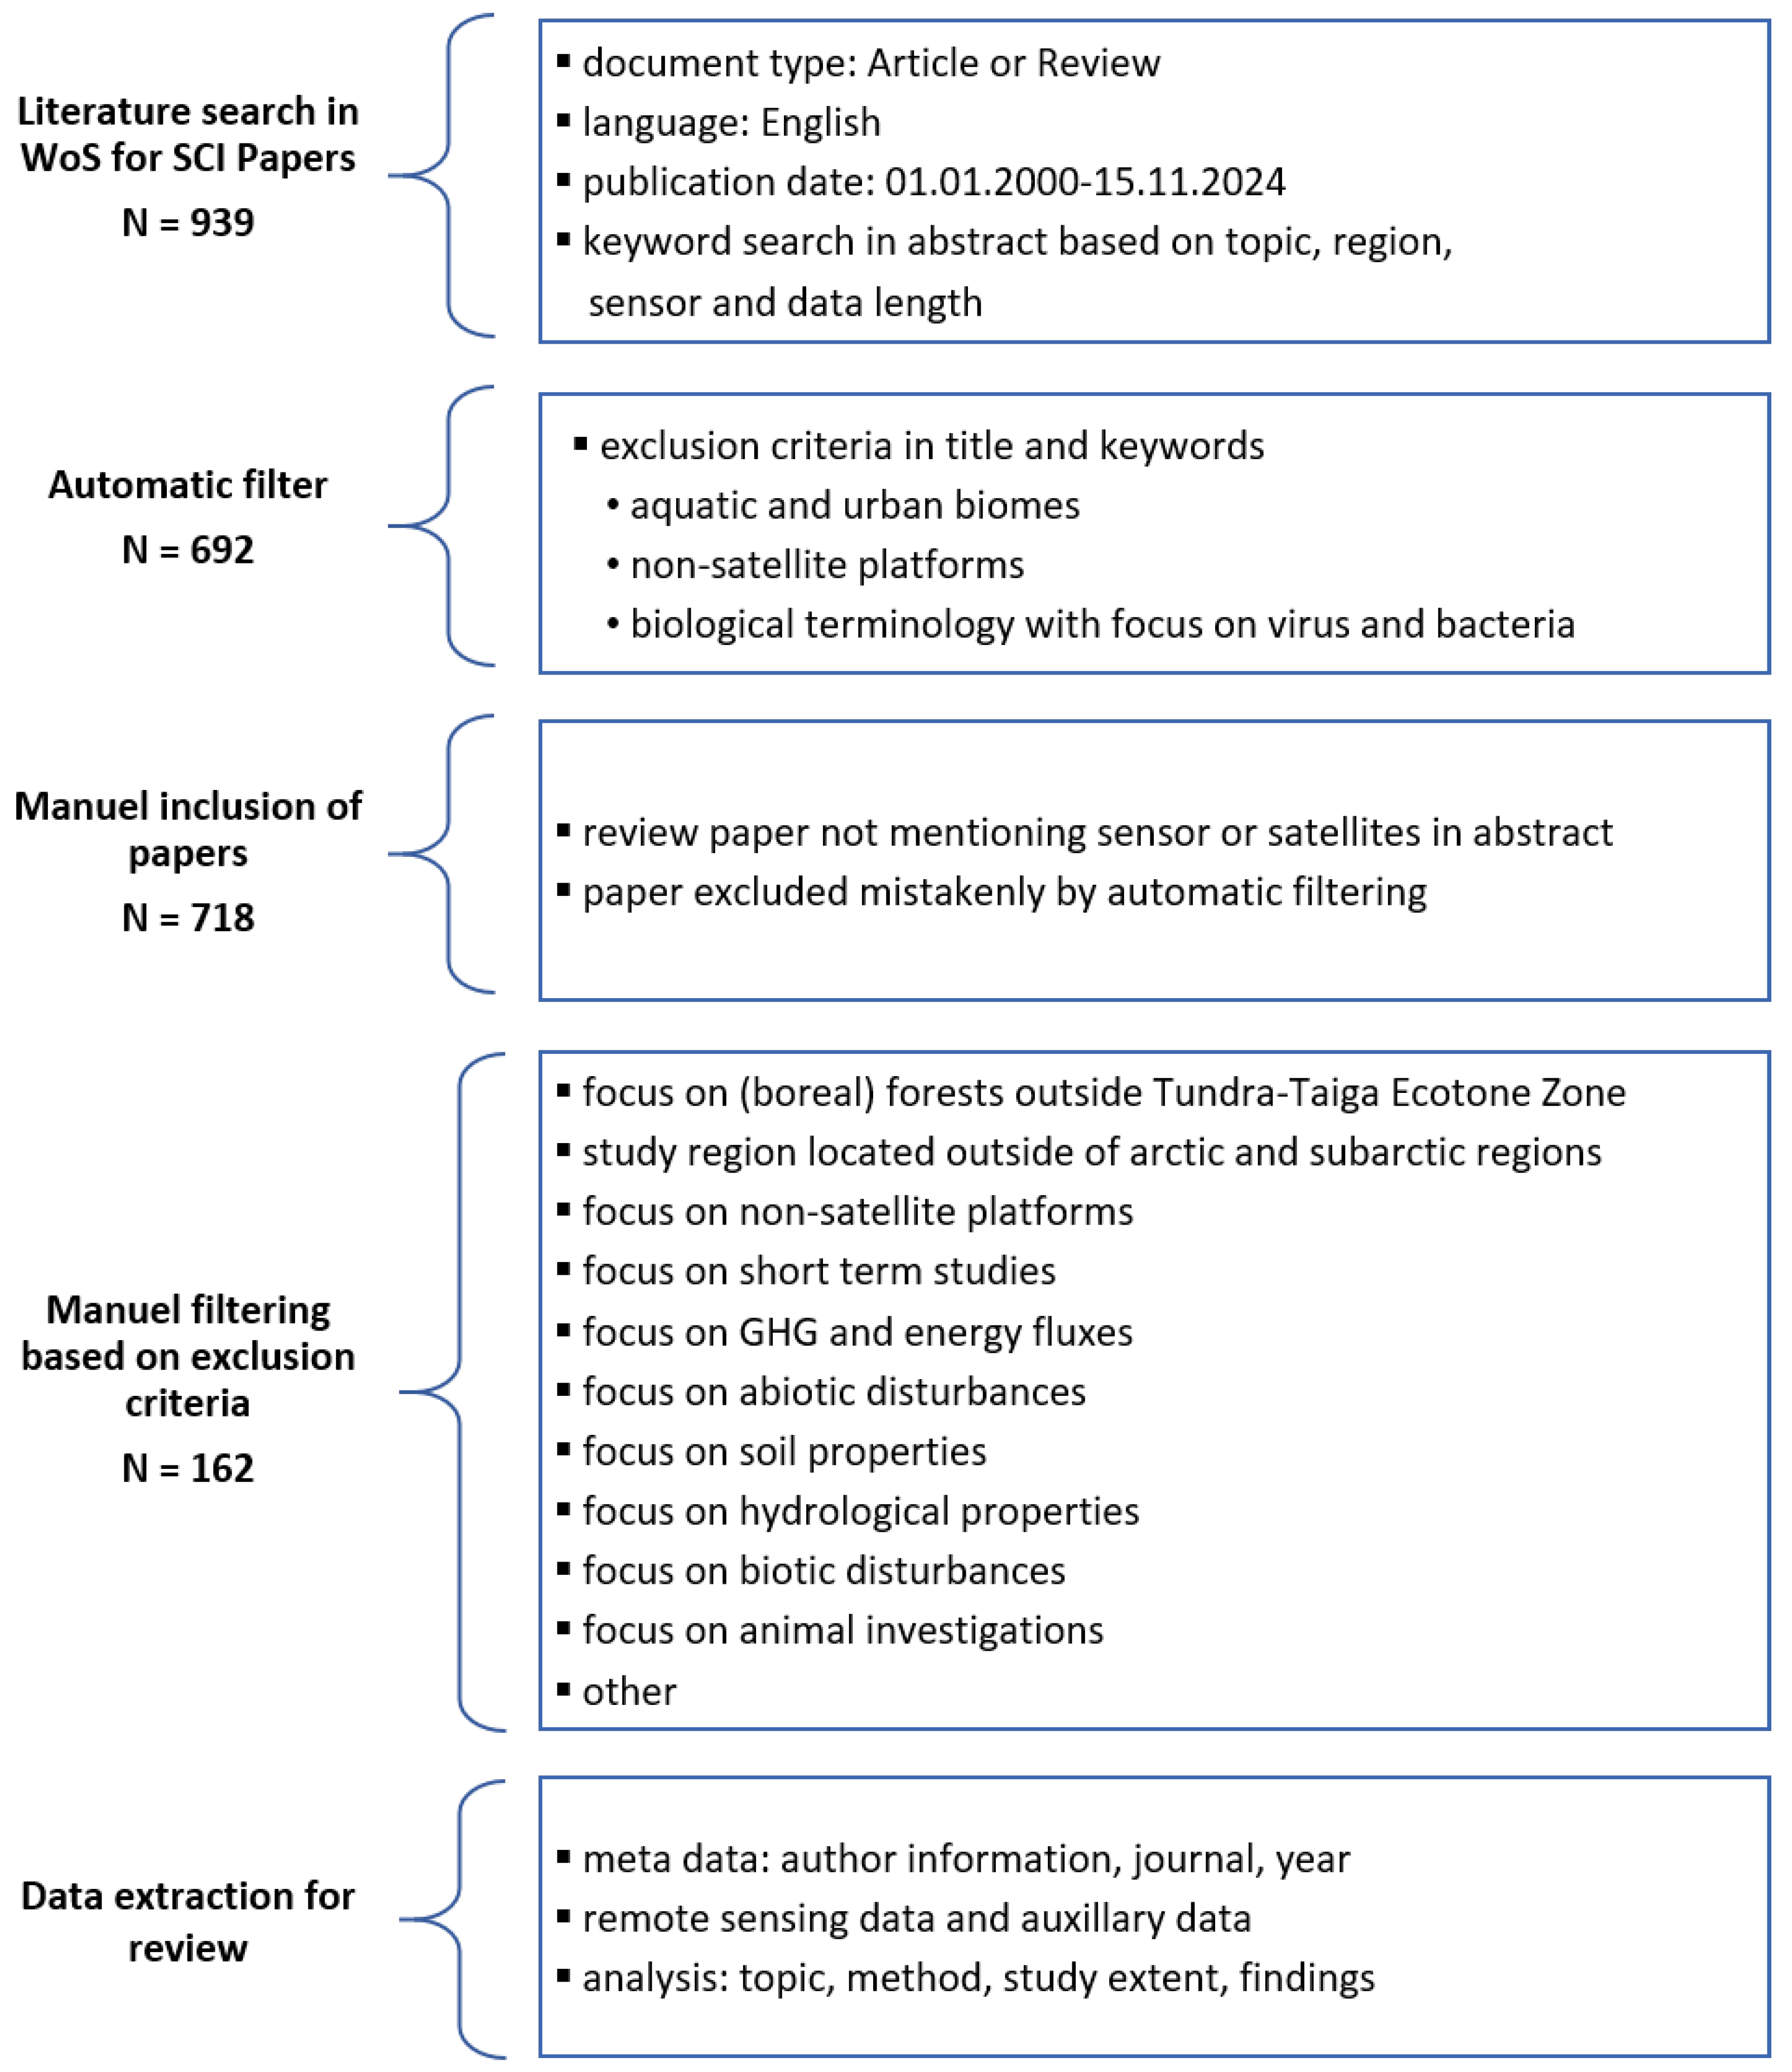
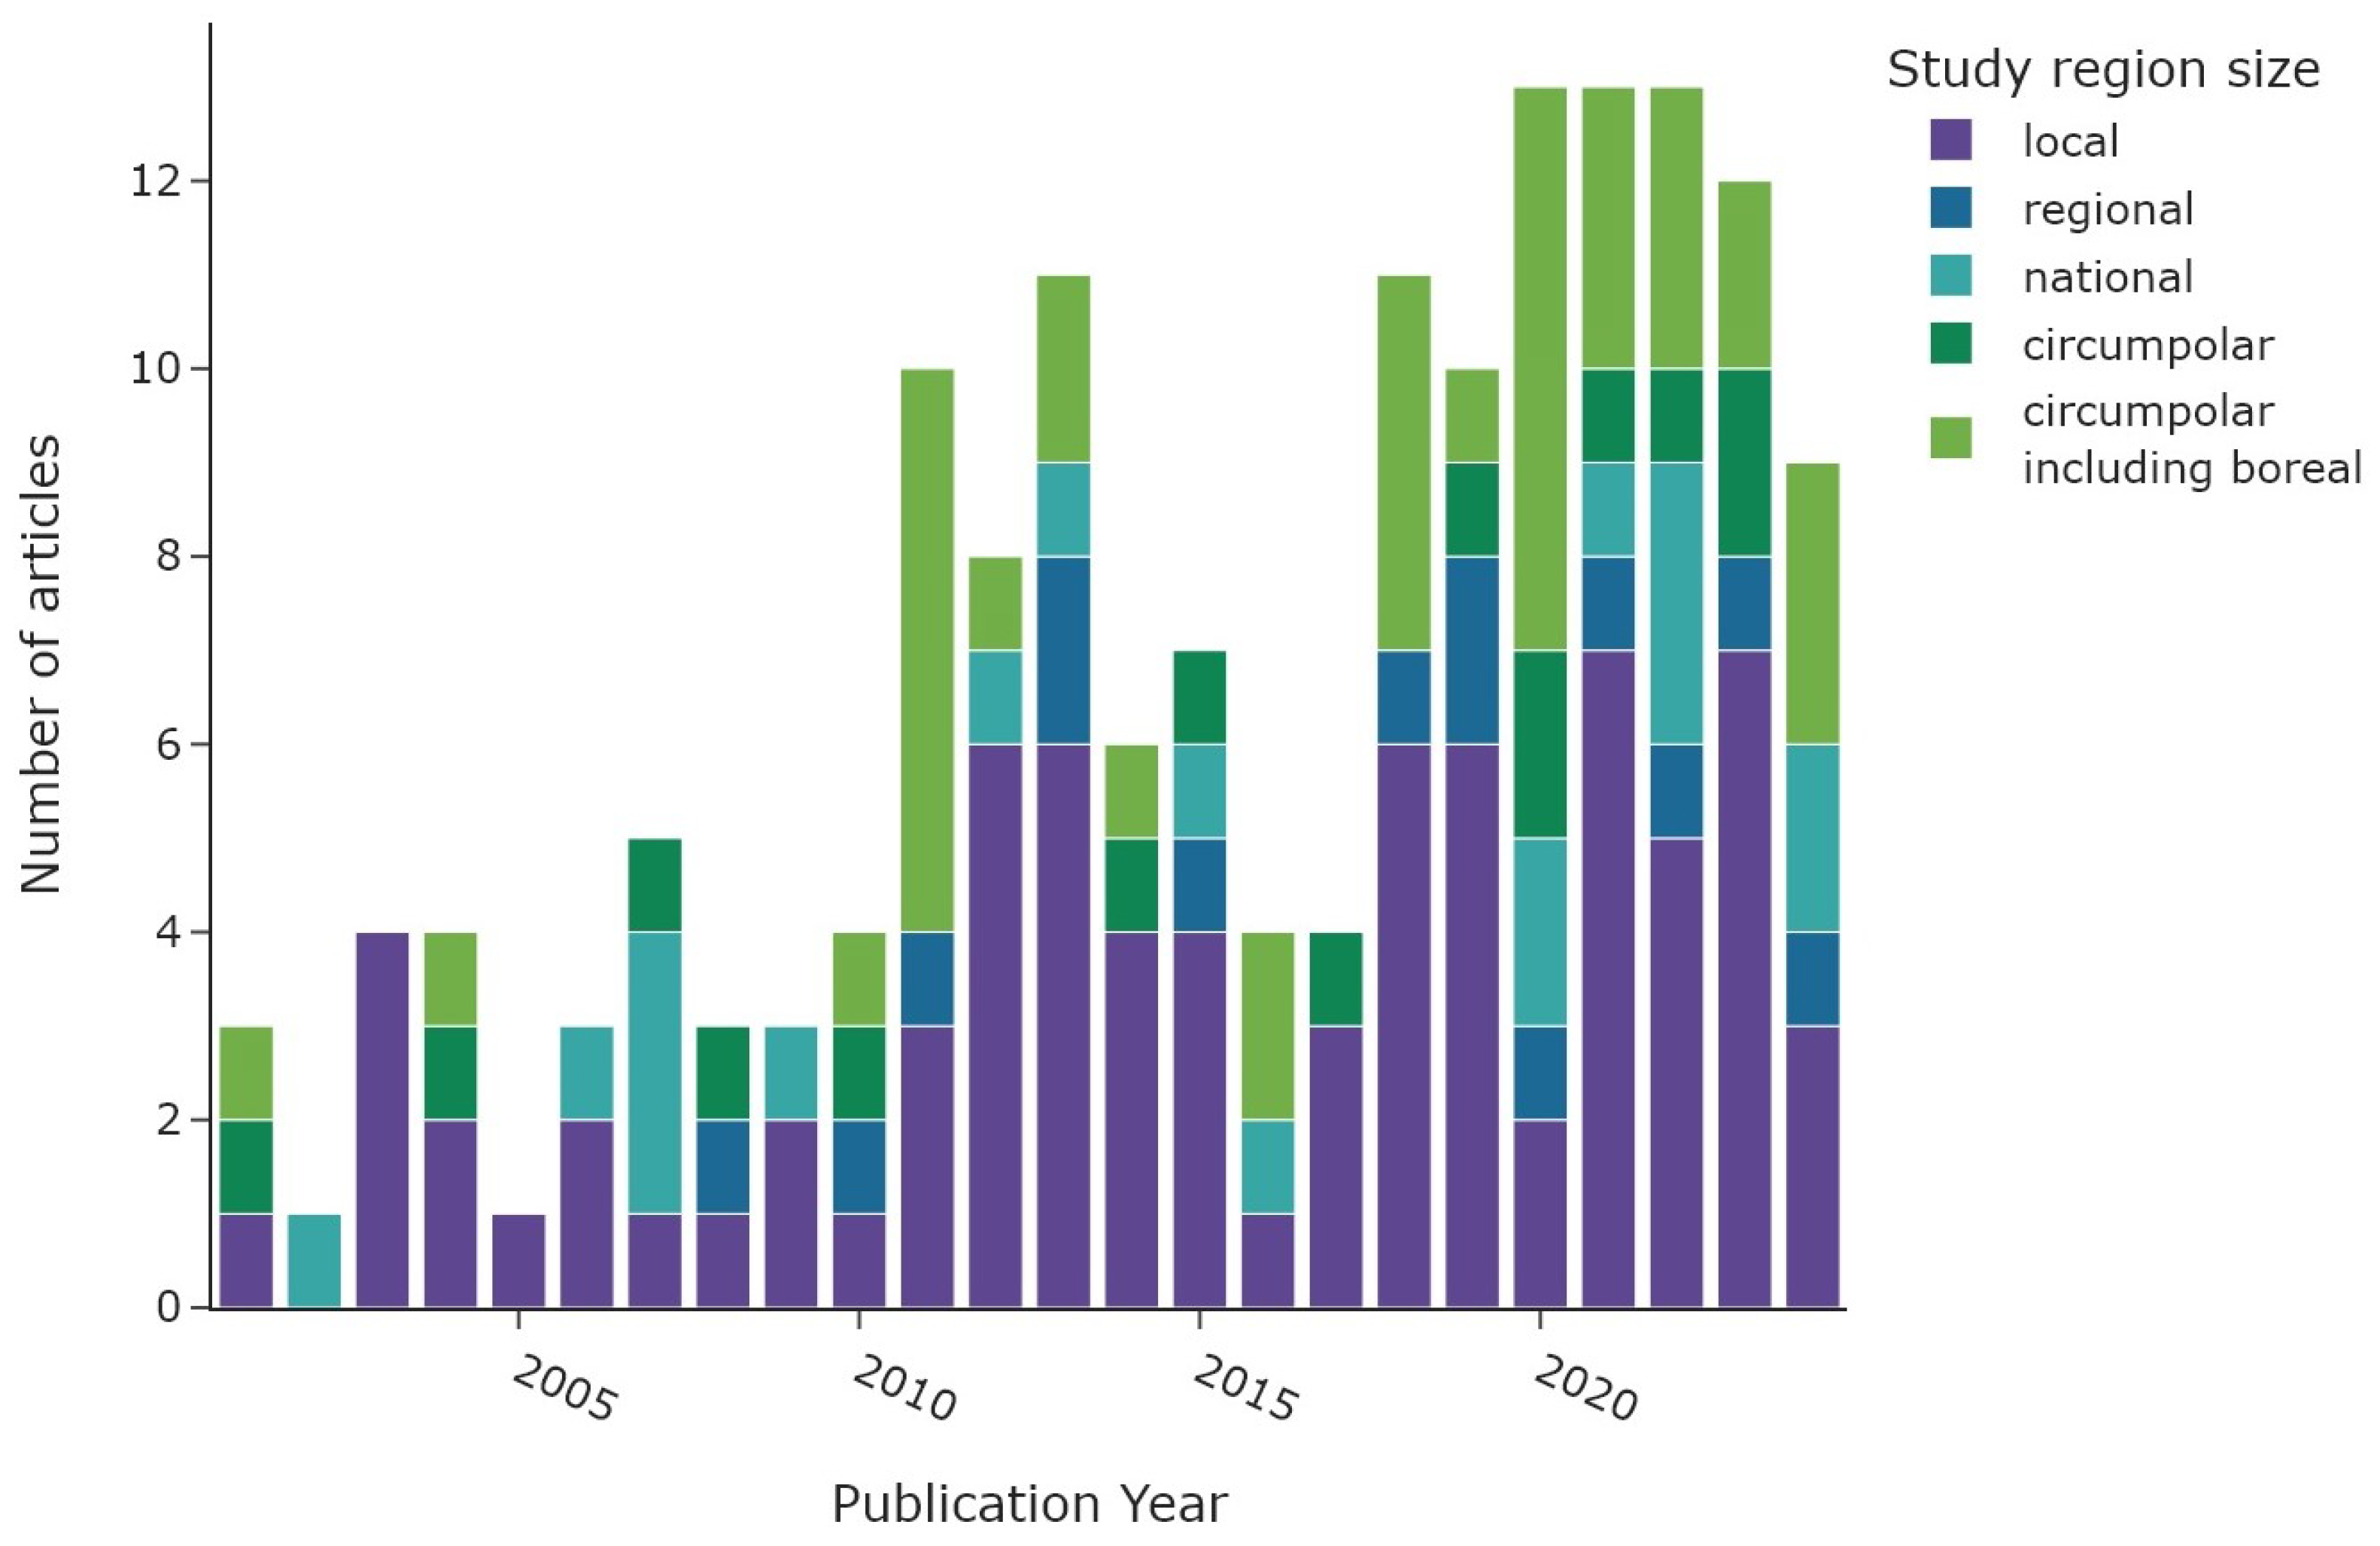


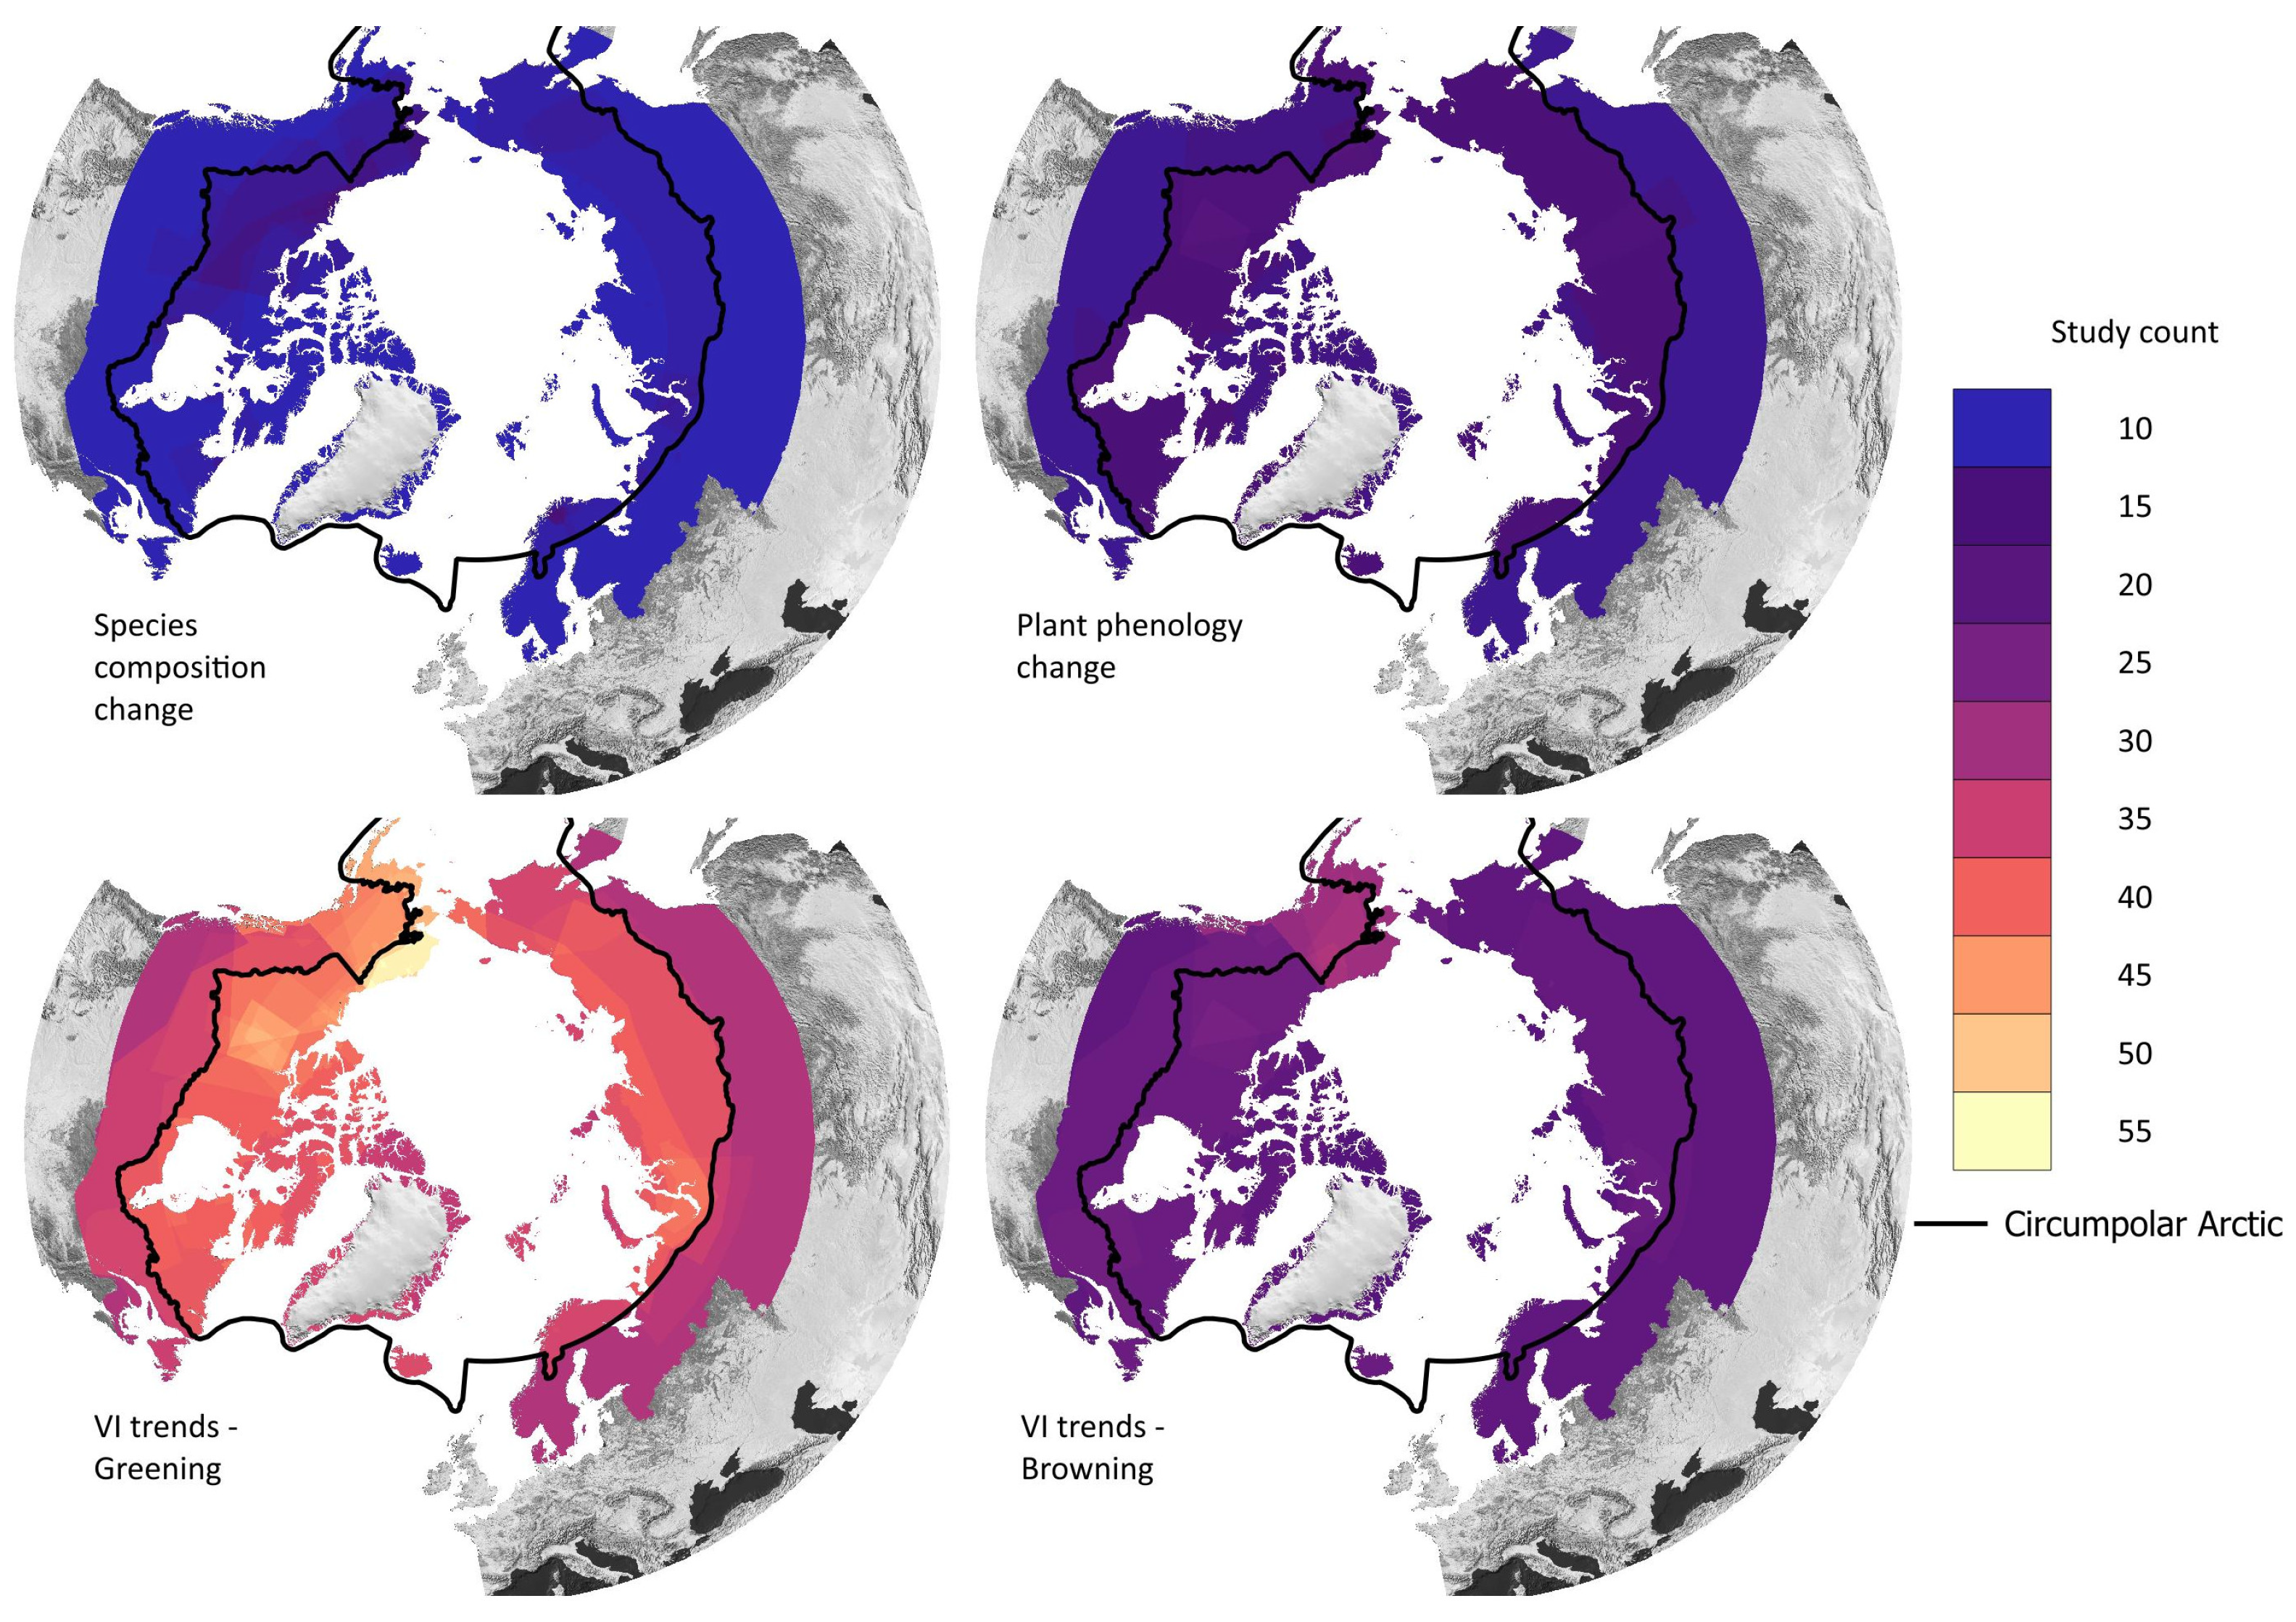
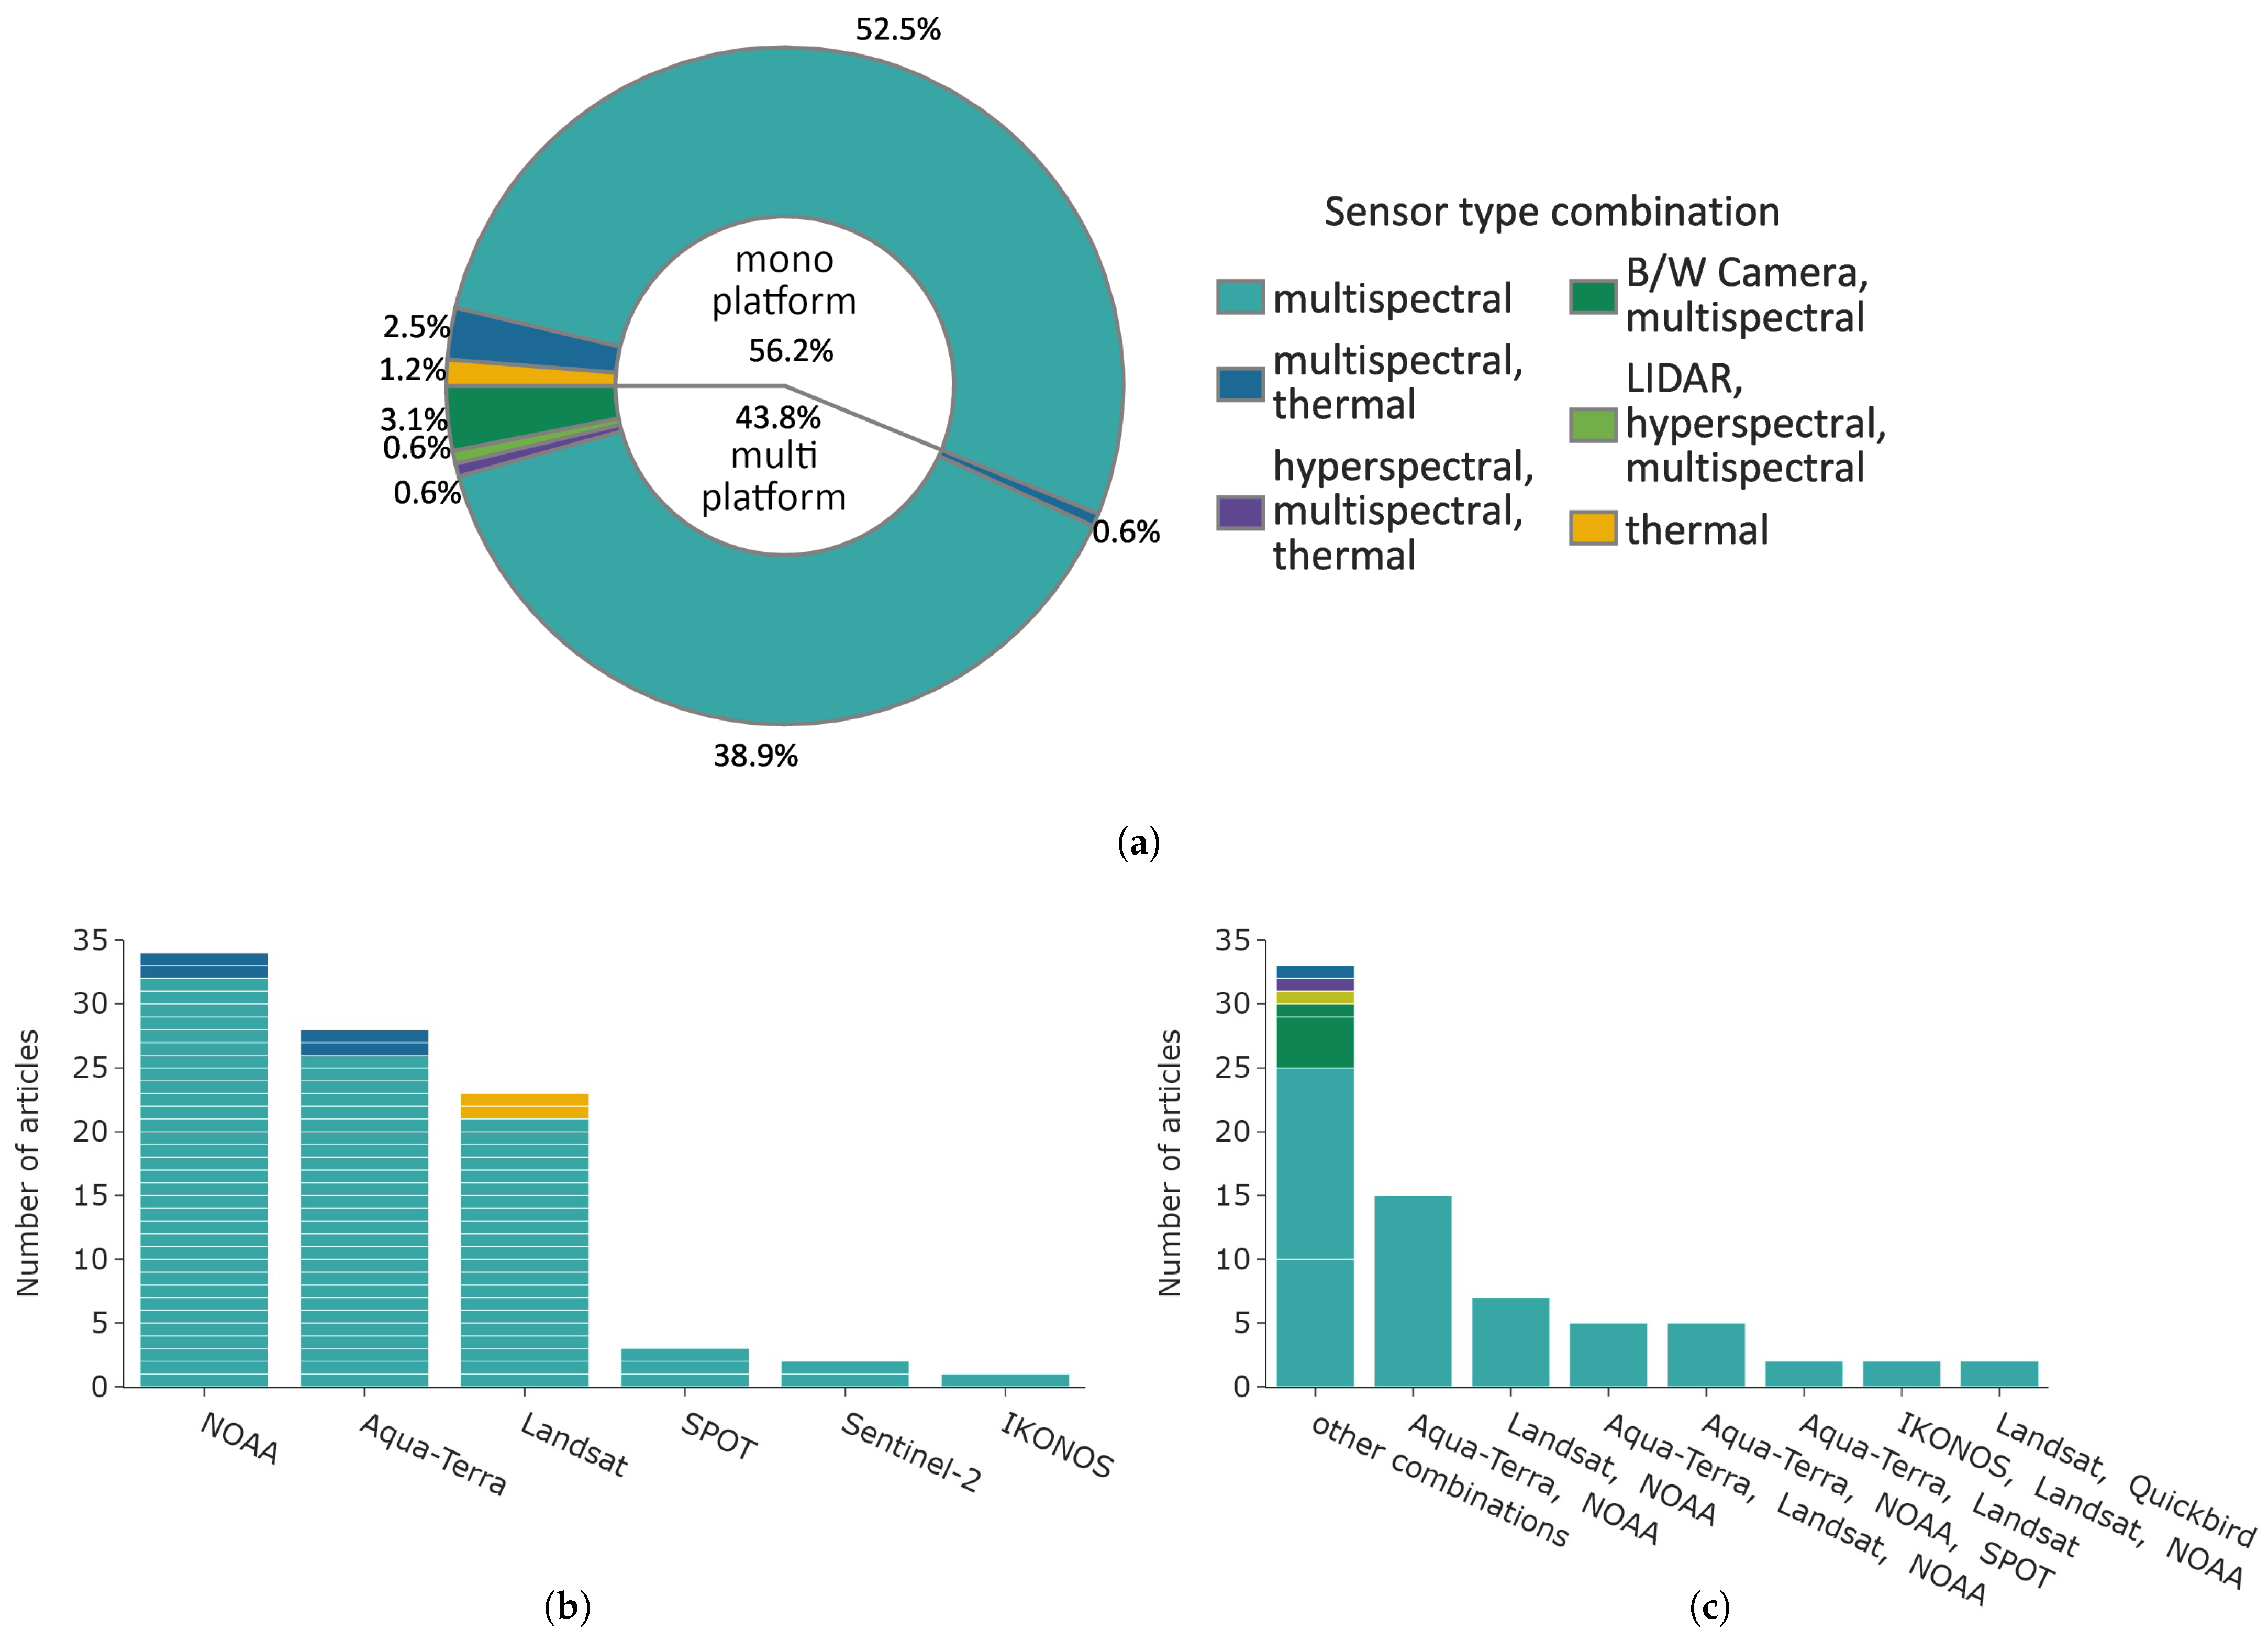
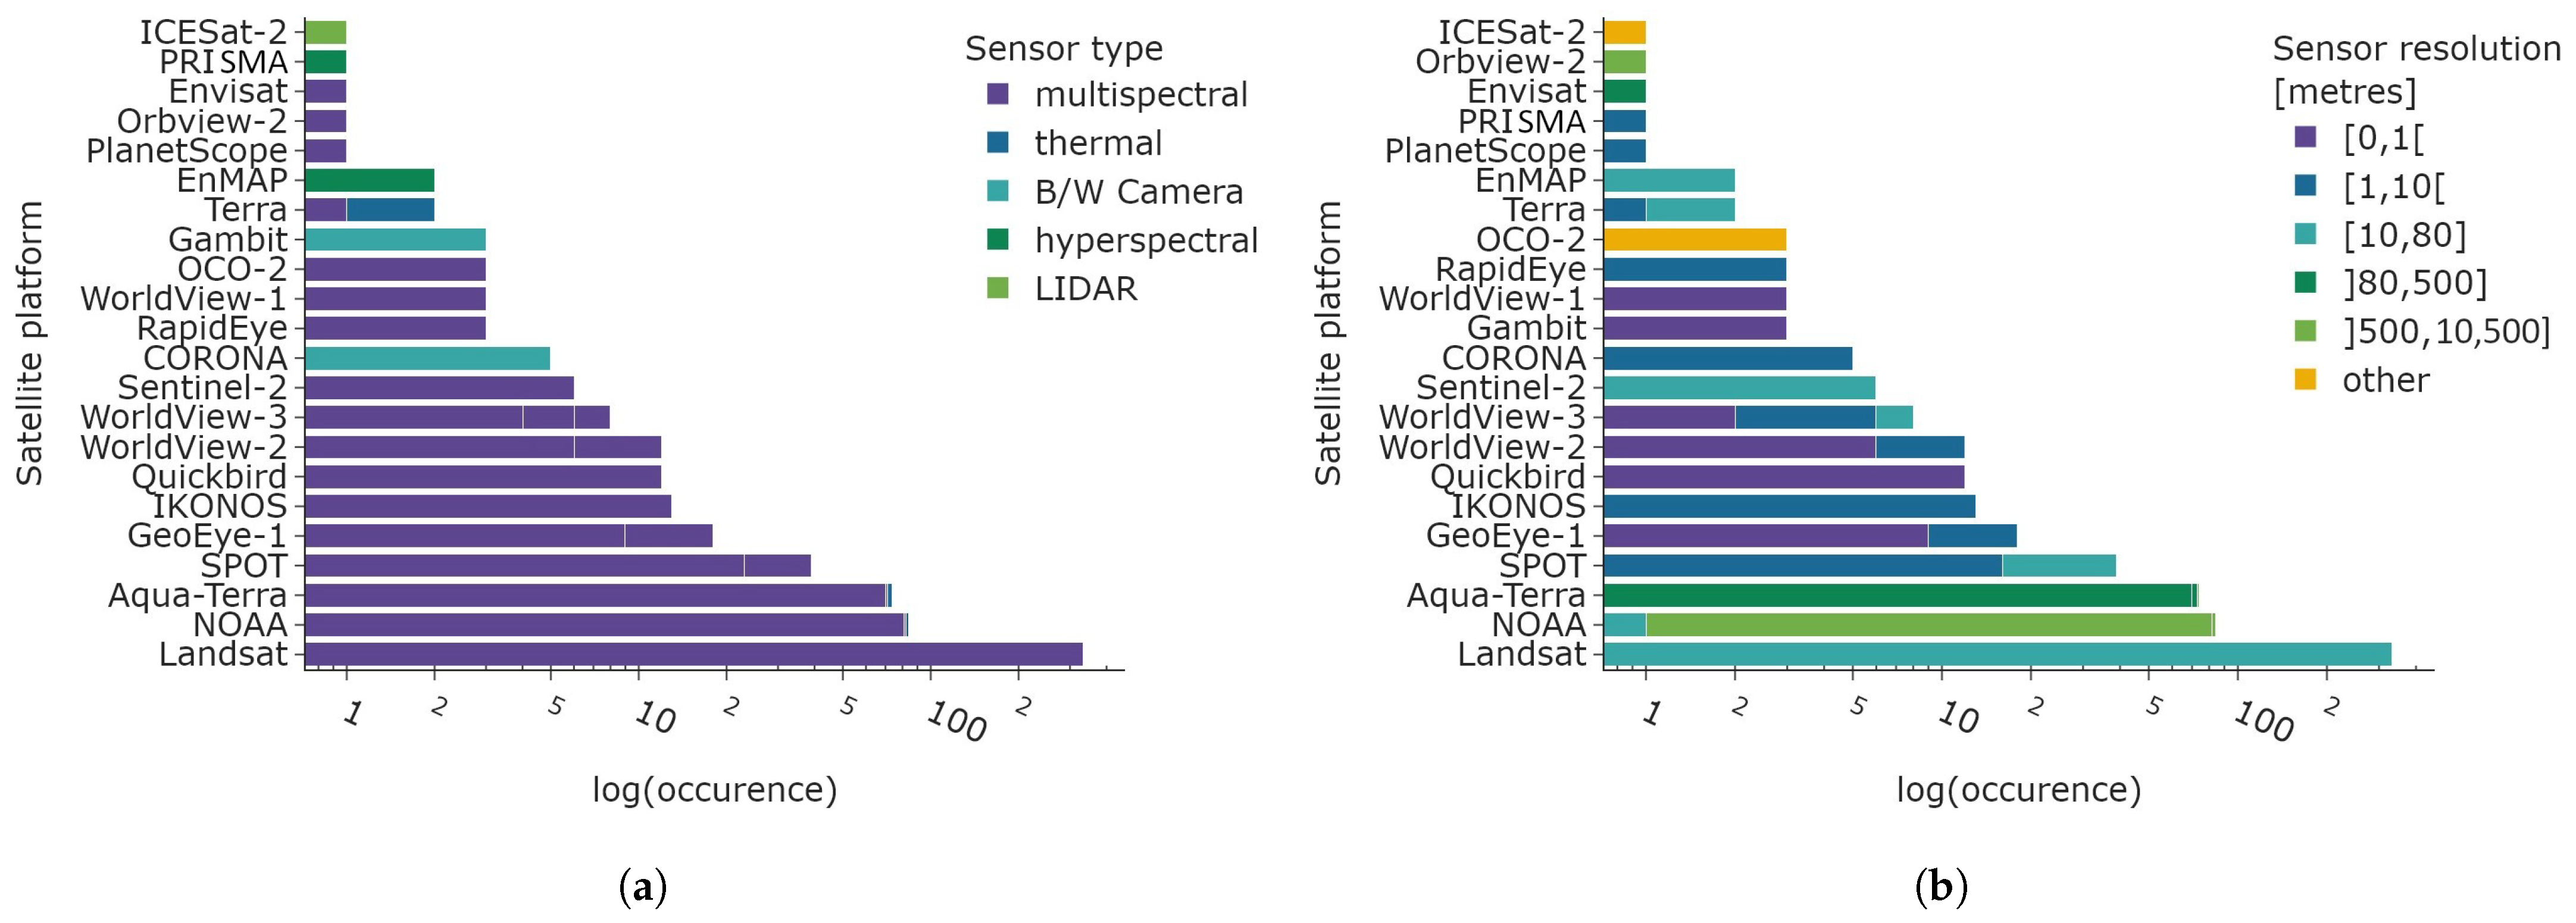

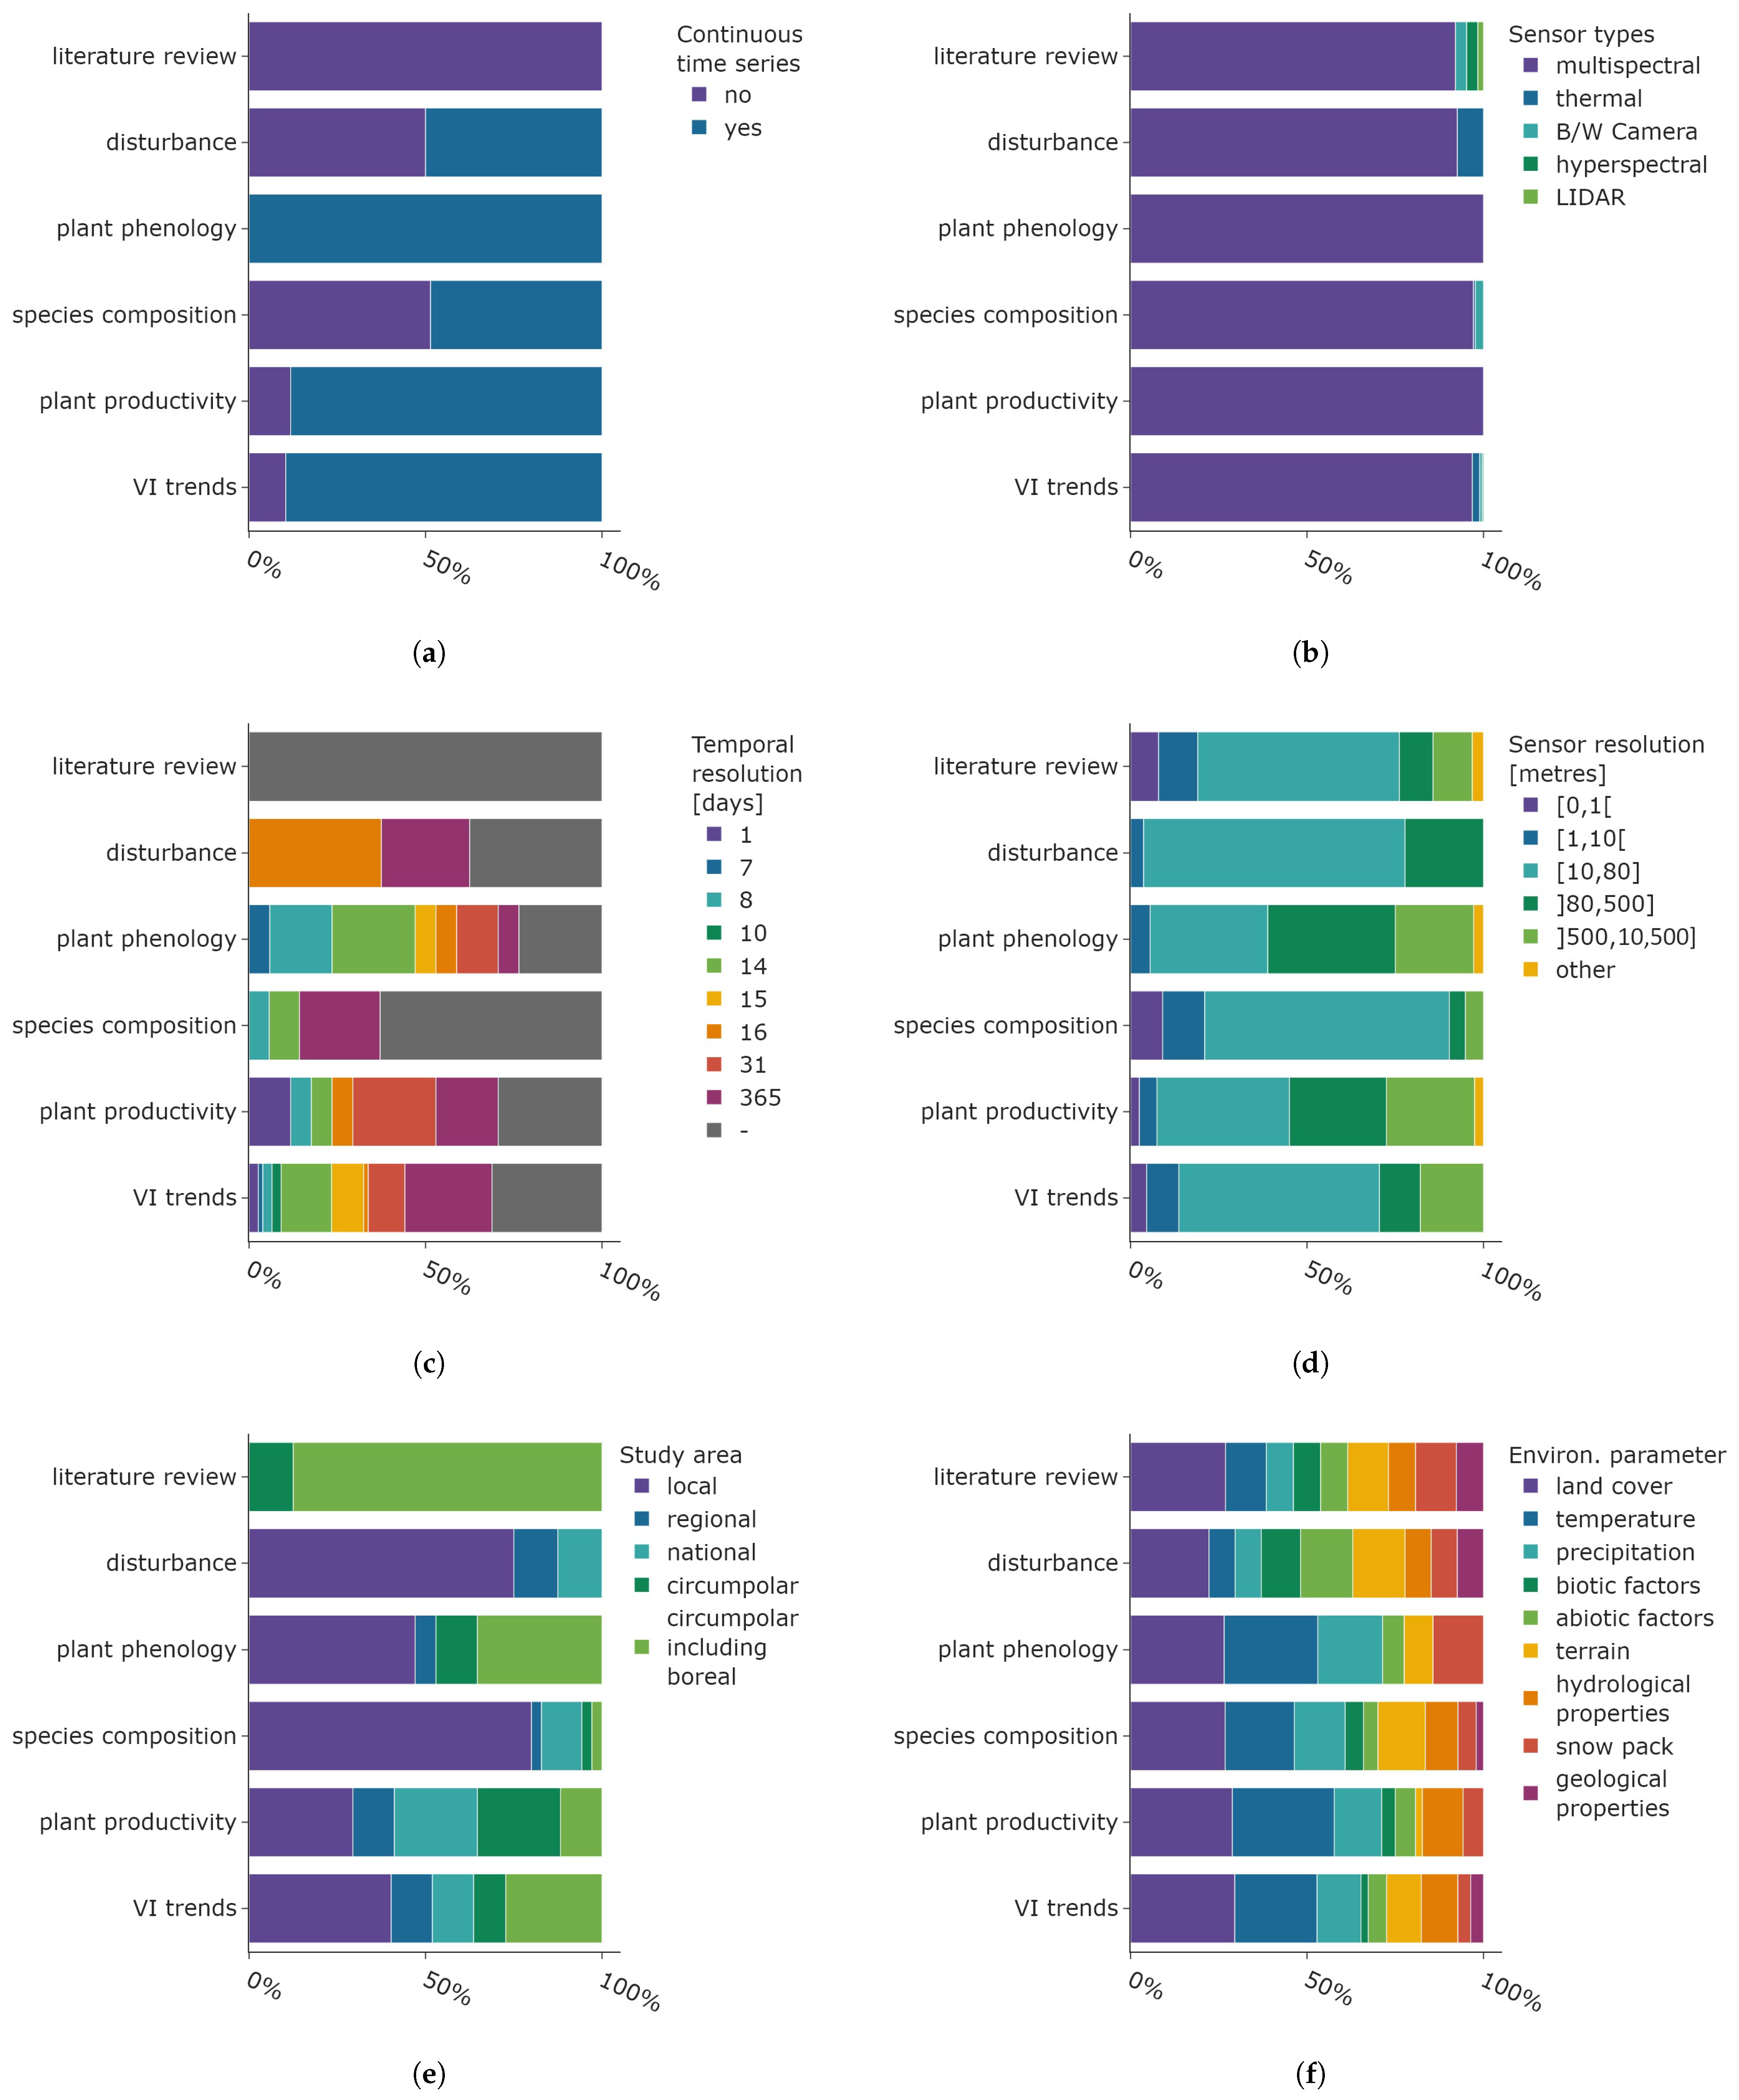


Disclaimer/Publisher’s Note: The statements, opinions and data contained in all publications are solely those of the individual author(s) and contributor(s) and not of MDPI and/or the editor(s). MDPI and/or the editor(s) disclaim responsibility for any injury to people or property resulting from any ideas, methods, instructions or products referred to in the content. |
© 2024 by the authors. Licensee MDPI, Basel, Switzerland. This article is an open access article distributed under the terms and conditions of the Creative Commons Attribution (CC BY) license (https://creativecommons.org/licenses/by/4.0/).