Article

Identification of a Potential Rare Earth Element Deposit at Ivanpah Dry Lake, California Through the Bastnäsite Indices

Department of Earth and Atmospheric Sciences, University of Houston, Houston, TX 77204, USA
*
Author to whom correspondence should be addressed.
Remote Sens. 2024, 16(23), 4540; https://doi.org/10.3390/rs16234540
Submission received: 30 September 2024 / Revised: 28 November 2024 / Accepted: 2 December 2024 / Published: 4 December 2024
(This article belongs to the Section Environmental Remote Sensing)

Abstract

:
A groundbreaking remote sensing approach that uses three Bastnäsite Indices (BI) to detect rare earth elements (REEs) was initially developed using ore samples from the Sulfide Queen mine in California and later applied to various well-studied ground-based, drone-based, airborne, and spaceborne imaging spectrometers across a wide range of scales, from micrometers to tens of meters. In this work, those same innovative techniques have revealed the existence of a potential site for extracting REEs. Data from AVIRIS-NG, AVIRIS-Classic, HISUI, DESIS, EnMAP, EO-1 Hyperion, PRISMA, and EMIT were utilized to map Ivanpah Dry Lake, which is located fourteen kilometers northeast of the Sulfide Queen mine. Although this area was not previously associated with REE deposits, BI maps have indicated the presence of a site that has remained enriched in REEs for decades, suggesting an opportunity for further exploration and mining. Historically, a pipeline transported wastewater from facilities at the Sulfide Queen mine to evaporation ponds on or near Ivanpah Dry Lake, where wastewater may have contained concentrated REEs. This research highlights imaging spectroscopy not only as a valuable tool for rapidly identifying and efficiently extracting REEs, but also as a means of recovering REEs from supposed waste.

Graphical Abstract

1. Introduction

An innovative approach to locating critical minerals has recently been developed, involving spectral indices based on reflectance measurements of ore samples enriched in rare earth elements (REEs) from the Sulfide Queen mine in Mountain Pass, California [1,2]. These Bastnäsite Indices (BIs) were then applied to data collected by eight airborne and spaceborne imaging spectrometers over the Sulfide Queen mine, with the results proving that these indices can effectively detect REEs in rock formations where rare earth fluorocarbonates have accumulated. Independent geochemical analyses confirmed that an REE ore grade of 3.253 wt% or greater is sufficient for detection using these indices [2].
A follow-up study was later conducted with a drone-based imaging spectrometer, which yielded highly detailed BI maps that displayed the distribution of bastnäsite within subsections of the carbonatite dykes of the Birthday shonkinite stock and the Sulfide Queen mine pit [3].
In both studies, the use of spectral indices has demonstrated the simplicity and effectiveness of hyperspectral data for remote exploration of rock formations in which critical minerals may be found. A mining company could use this novel tool to make informed decisions about the optimal locations for conducting REE extraction operations, thus achieving significantly more efficient management of the time, money, and energy spent on exploration efforts.
For this current work, data from eight airborne and spaceborne imaging spectrometers, namely AVIRIS-NG, AVIRIS-Classic, HISUI, DESIS, EnMAP, EO-1 Hyperion, PRISMA, and EMIT, have once again been employed to yield BI maps of the Ivanpah Valley region near the Sulfide Queen mine in Mountain Pass, California. The aim of the project is to expand upon previous work and investigate an area that has not been previously associated with but may potentially contain economically viable REE deposits.
Ivanpah Dry Lake is an elongate (19 km long by 2 to 3 km wide (12 miles long by 1 to 2 miles wide)) playa immediately east of the Mescal and Clark Mountain Ranges, in extreme eastern California about 50 km south of Las Vegas, Nevada. Interstate 15 (I-15) crosses it on an elevated berm, entering Nevada at the northeastern end of the playa (Figure 1). The playa’s narrow and sinuous shape is due to large alluvial fans encroaching on its margins from the northeast (the Lucy Gray fan) and from the west (the Wheaton Wash fan) [4].
In the 1980s, Union Oil Company of California (Unocal) began constructing a 23-km-long (14-miles-long) pipeline that would transfer wastewater from facilities at the Sulfide Queen mine to evaporation ponds on or near Ivanpah Dry Lake, east of I-15 near Nevada. This pipeline repeatedly ruptured during cleaning operations to remove mineral deposits called scale. This scale is radioactive because of the presence of thorium and radium, which occur naturally in REE ores. A federal investigation later found that over 40 spills—some unreported—occurred between 1984 and 1993. Since the existing plan of the operations of the mine had expired, the pipeline and chemical processing at the mine were placed in a temporary state of partial shutdown in 1996 before shutting down completely by 1998. About 2,752,000 L (727,000 gal) of radioactive and other hazardous waste flowed onto the desert floor, according to federal authorities. A cleanup plan was then prepared, and an extensive environmental study followed suit [5].
This led to Unocal winning approval for a county permit in 2004 that allowed the mine to continue operations for 30 years. After Unocal shut the mine down in 2015, the mine was acquired in 2017 and now resumes operations under the control of MP Materials Corp.

2. Materials and Methods

2.1. Airborne and Spaceborne Reflectance Measurements

2.1.1. Common Preprocessing Steps

If an airborne or spaceborne hyperspectral image has been acquired in its original form prior to orthorectification, then it should be corrected prior to analysis. Some preprocessing steps may be skipped or added, depending on whether or not orthorectification has already been performed on the image prior to its retrieval, but such details are listed in each subsection corresponding to one of the eight hyperspectral sensors.
First, radiometric calibration is performed to ensure that all bands are properly expressed in radiance units of W/(m2·sr·μm). For some sensors, the gain and offset values required for radiometric calibration are already included in the metadata of their images, while for other sensors, gains and offsets are instead tabulated in text files that are provided along with the hyperspectral images. If the hyperspectral image has already been orthorectified prior to retrieval, then any pixels with null (“NaN” or “NoData”) values must be excluded during data preparation at this point. A Region of Interest (ROI) can also be created and used to spatially subset the data if necessary.
Second, atmospheric correction must be applied to convert radiance values to reflectance. For this study, this reflectance conversion was achieved via the QUick Atmospheric Correction (QUAC) algorithm in ENVI 5.7. QUAC determines atmospheric correction parameters directly and solely from the observed pixel spectra in a scene, based on the empirical finding that the average reflectance of diverse material spectra does not depend on the scene. While it is more approximate than physics-based first-principles methods of atmospheric correction, it generally produces reasonably accurate reflectance spectra—within 10% of the ground truth—at a much faster processing speed than those methods and allows for any view angle or solar elevation angle [6]. If the hyperspectral image has already been orthorectified prior to retrieval, then an additional step of creating a mask is performed to exclude any pixels that have either null values or values of exactly 0 at any band. This same mask can be repeatedly applied to the input data during the following preprocessing steps.
Third, a Minimum Noise Fraction (MNF) transform was applied to the reflectance data. The noise in the data is estimated through a correlation matrix, before being decorrelated and rescaled by its variance. The resulting output is a form of reflectance data where the first several bands, which contain coherent spectral information, can be easily separated from bands dominated by noise. An inverse MNF transform can be performed on a subset of only the first several bands in order to restore the dataset to the spectral domain and reduce its noise. However, care must be taken to avoid leaving too many bands out of the subset, as this can irreversibly distort the shapes of spectral features in the data. It is worth mentioning that the optimal number of bands to retain in the subset will always vary from image to image. Before applying this inverse MNF transform, a Fast Fourier Transform (FFT) is applied to the data so that a filter can be created and used to eliminate image artifacts—which appear as stripes—in the along-track direction of the sensor’s scanning path. After this filter is applied, the inverse FFT and MNF operations are then carried out in that order [7]. It should be mentioned that the FFT filtering step was skipped entirely if the hyperspectral image had already been orthorectified prior to retrieval since the aforementioned artifacts would no longer be linear but instead sinuous in shape.
Fourth, spectral smoothing via a Savitzky–Golay filter is an optional step that can be applied to suppress any extraneous spikes in the spectra [8,9]. The ENVI implementation of this operation allows the user to specify values for three parameters that control the intensity of the smoothing: the filter width, the order of the derivative, and the degree of the polynomial. A larger width and smaller degree both lead to greater smoothing. Care must be taken to avoid oversmoothing the denoised reflectance spectra, as this, like the MNF band subset step, can irreversibly distort the shapes of spectral features in the data. For this study, if spectral smoothing was performed on data, then only an order of 0 and a maximum degree of 4 were chosen to preserve the narrow absorption features associated with REEs. Meanwhile, the optimal width can vary from sensor to sensor, and even from image to image; such details are listed in their corresponding subsections. It is worth mentioning that the filter assumes that all bands are contiguous and equally spaced apart. If bad spectral bands are excluded from the QUAC reflectance conversion output prior to the forward MNF transform step, then bands at the edges of the new gaps (usually centered near 1400 and 1900 nm) will yield erroneous reflectance values that result in partially inaccurate spectra after spectral smoothing. These were simply excluded from preprocessing after this point and have no impact on the detection of REEs beyond a cosmetic change to the SWIR portion of the reflectance spectra.
The literature presents various preparation methods for reflectance data products, but the four major steps listed above were chosen as the common foundation for preprocessing in this study. Fifth, a super Geographic Lookup Table (GLT) can be created for the hyperspectral image using the provided latitude and longitude bands to orthorectify the image accurately with north oriented up. All airborne and spaceborne datasets in this study that were retrieved along with these aforementioned bands were orthorectified with respect to the projected coordinate system UTM Zone 11N and datum WGS 84.
Sixth, since QUAC yields reflectance values between 0 and 10,000, band math can be used to apply the following changes to the data: if a specific pixel for a given band has a reflectance value lower than 0 (higher than 1), then it will instead be assigned a value of 0 (1), and if the pixel has a value between 0 and 10,000, then that value will be divided by 10,000. This has the overall effect of rescaling and constraining reflectance values to being between 0 and 1.
Seventh, one final mask was created to exclude any shaded or oversaturated pixels that meet any of the following criteria: reflectance values of 0.05 or below at the Visible-Near Infrared (VNIR) band with the shortest wavelength (usually found near 400 nm for most sensors), reflectance values of exactly 1 at any band, null reflectance values at any band, and reflectance values of half the image average or below at the highest Shortwave Infrared (SWIR) band (usually found in the 1610–1650 nm range).

2.1.2. AVIRIS-NG

The Airborne Visible InfraRed Imaging Spectrometer-Next Generation (AVIRIS-NG) was developed by NASA’s Jet Propulsion Laboratory (JPL) [10,11]. An image of Ivanpah Dry Lake with 4.1 m spatial resolution was acquired on 27 September 2017.
Bands 195–210, 286–317, and 422–424 (band centers corresponding to the wavelengths 1348.54–1423.67, 1804.33–1959.60, and 2485.51–2495.53 nm, respectively) in the QUAC conversion output were deemed bad, resulting in a spectral subset of 374 bands out of the original total of 425. After the forward MNF transform was performed, the first 283 bands out of the original 374 were chosen for further preprocessing. Spectral smoothing with a filter width of 4 was applied but only to bands outside of the 497.07–902.77 nm range. The image is normally available online as a georeferenced (L1B) product, but upon special request, the original non-orthorectified image, complete with latitude and longitude bands, was obtained so it could undergo the common preprocessing workflow mentioned earlier.

2.1.3. AVIRIS-Classic

This predecessor of AVIRIS-NG is one of the earliest and most well-studied airborne imaging spectrometers in history [12]. On 24 February 2021, an image of Ivanpah Dry Lake was acquired with 15.7 m spatial resolution. Unlike AVIRIS-NG, no latitude and longitude bands were available, so, instead, a georeferenced at-sensor radiance (L1B) product was obtained directly via online data portal so it could undergo the appropriately modified steps of the common preprocessing workflow mentioned earlier.
Bands 1, 2, 104, 107–113, 146, 154–167, and 174–176 (band centers corresponding to the wavelengths 365.9298, 375.5940, 1322.577, 1352.490–1412.308, 1741.153, 1820.834–1926.298, and 1996.584–2016.645 nm, respectively) in the QUAC conversion output were deemed bad, resulting in a spectral subset of 196 bands out of the original total of 224. After the forward MNF transform was performed, the first 48 bands out of the original 196 were chosen for further preprocessing. No spectral smoothing was performed.

2.1.4. HISUI

The Hyperspectral Imaging Suite (HISUI) is a modern spaceborne imaging spectrometer developed by the Ministry of Economy, Trade and Industry (METI) [13]. A non-orthocorrected at-sensor radiance (L1R) data product was collected on 2 May 2021. It provides 64 VNIR bands and 128 SWIR bands separately at a minimum spatial resolution of 20 m. Although a maximum total of 192 bands is available, VNIR Bands A, B, C, D, Y, and Z (band centers corresponding to the wavelengths 365, 375, 385, 395, 985, and 995 nm, respectively) and SWIR Band S (band center corresponding to the wavelength 889 nm) are typically excluded from preprocessing and spectral analysis due to poor calibration and severe atmospheric absorption effects, leaving only 185 usable bands. Unlike other sensors, latitude and longitude bands associated with the hyperspectral images are not available for HISUI, so orthorectification was performed manually using estimated coordinates for each of the four corners of each dataset.
Since VNIR and SWIR bands are delivered as two separate datasets with overlapping wavelength ranges, the two datasets went through the first four steps of the common preprocessing workflow independently of each other. After Bands A, B, C, D, Y, Z, and S were removed, the VNIR and SWIR datasets were left with 58 and 127 bands remaining. Bands 135–139 (band centers corresponding to the wavelengths 1850.255–1900.215 nm) in the QUAC conversion output for the SWIR dataset were deemed bad, resulting in a spectral subset of 122 bands out of the original total of 127. After the forward MNF transform was performed on the VNIR (SWIR) dataset, the first 51 (68) bands out of the original 58 (122) were chosen for further preprocessing.
After manual orthorectification, spectral subsetting was performed to order the bands by wavelength during layer stacking. This step combined them into a single complete dataset that needed to be masked and spatially subsetted to exclude the portions of the VNIR and SWIR datasets that did not intersect. The combined dataset then underwent spectral smoothing to suppress any large discontinuities in reflectance values between the VNIR and SWIR bands. This smoothing was applied with a filter width of 4 to Bands 1–16, 21–31, 68–74, 82–89, 109–125, and 152–185 (band centers corresponding to the wavelengths 405–555, 605–705, 1013.425–1088.365, 1188.285–1275.715, 1525.515–1725.355, and 2062.585–2474.755 nm, respectively) and with a filter width of 16 to Bands 49–66 (band centers corresponding to the wavelengths 885–988.445 nm).

2.1.5. DESIS

The DLR Earth Sensing Imaging Spectrometer (DESIS) is a new spaceborne imaging spectrometer developed through a collaboration between the DLR (German Aerospace Center) and Teledyne Brown Engineering (TBE) [14,15]. On 2 April 2023, a non-orthocorrected at-sensor radiance (L1B) data product was collected, consisting of only VNIR bands across the 401.43–999.98 spectral range with 30 m spatial resolution.
Bands 1–9, 18, 19, 139–144, 187, 188, and 207–235 (band centers corresponding to the wavelengths 401.43–421.91, 444.92, 447.66, 755.07–767.47, 878.66, 881.42, and 929.56–999.98 nm, respectively) in the QUAC conversion output were deemed bad, resulting in a spectral subset of 187 bands out of the original total of 235. After the forward MNF transform was performed, the first 162 bands out of the original 187 were chosen for further preprocessing. Spectral smoothing with a filter width of 4 was applied to Bands 10–14, 23–65, 67–69, 73–132, 149–155, 158–168, 172–183, and 192–206 (band centers corresponding to the wavelengths 424.54–434.88, 458.08–565.69, 570.90–576.00, 586.13–736.80, 780.49–795.80, 803.98–829.08, 839.97–867.87, and 890.82–926.97 nm, respectively). Normally, latitude and longitude bands are not available, but upon special request, they were obtained for this study so the original non-orthorectified image could undergo the common preprocessing workflow mentioned earlier.

2.1.6. EnMAP

The Environmental Mapping and Analysis Program (EnMAP), like DESIS, is a German-based hyperspectral satellite mission, overseen by the DLR on behalf of the BMWK (Federal Ministries for Economic Affairs and Climate Action) [16]. A non-orthocorrected at-sensor radiance (L1B) data product was collected on 12 July 2022, offering 91 VNIR and 133 SWIR bands as two separate datasets.
The two datasets underwent the first four steps of the common preprocessing workflow independently of each other. Bands 56, 57, 61, 62, 69–71, and 78–91 (band centers corresponding to the wavelengths 720.282, 727.324, 756.124, 763.472, 816.367–831.901, and 887.478–993.083 nm, respectively) (Bands 95–100, 111–116, 128–141, 158–178, and 220–224 (band centers corresponding to the wavelengths 931.512–982.851, 1105.17–1163.81, 1307.27–1519.22, 1707.20–2069.24, and 2414.45–2445.53 nm, respectively)) in the QUAC conversion output for the VNIR (SWIR) dataset were deemed bad, resulting in a spectral subset of 70 (81) bands out of the original total of 91 (133). After the forward MNF transform was performed on the VNIR (SWIR) dataset, the first 58 (28) bands out of the original 70 (81) were chosen for further preprocessing.
The VNIR and SWIR datasets from EnMAP then underwent orthorectification through rational polynomial coefficients (RPCs) saved in their respective metadata files, as well as a reference digital elevation model (DEM) created by NASA’s Shuttle Radar Topography Mission (SRTM) with a spatial resolution of 1 arc-second (approximately 30 m). As in the case of HISUI, these two separate datasets overlap in wavelength, so spectral subsetting and band reordering were required during layer stacking, followed by masking and spatial subsetting to exclude portions of the VNIR and SWIR datasets that did not intersect. The combined dataset lastly underwent spectral smoothing. This smoothing was applied with a filter width of 4 to Bands 1–30, 35–54, 73–75, 77, and 182–219 (band centers corresponding to the wavelengths 418.240–560.947, 587.997–706.401, 847.601–863.455, 879.442, and 2104.86–2407.85 nm, respectively) and with a filter width of 32 to Bands 92–94 (band centers corresponding to the wavelengths 902.257–921.624 nm).

2.1.7. EO-1 Hyperion

The Earth Observing-1 (EO-1) Hyperion is an imaging spectrometer on a spacecraft that took pictures of various geologically interesting locations from its launch in 2000 until it was retired in 2017 [17]. It flew over Ivanpah Dry Lake in a long, narrow pattern at irregular intervals. A total of three images with slightly overlapping footprints were captured with 30 m spatial resolution on different dates: 10 August 2001; 9 March 2003; and 1 September 2011. However, Bands B1–B7, B58–B70, B71–B76, and B225–242 (band centers corresponding to the wavelengths 355.59–416.64, 935.58–1057.68, 851.92–902.36, and 2405.60–2577.08 nm, respectively) are not calibrated and have no valid values, so only 198 bands have useful data. Similar to AVIRIS-Classic, georeferenced at-sensor radiance (L1T) products were obtained directly via online data portal so they could undergo the appropriately modified steps of the common preprocessing workflow.
For all three EO-1 Hyperion images, Bands B119–B134, B165–B186, and B221–B224 (band centers corresponding to the wavelengths 1336.15–1487.53, 1800.29–2012.15, and 2365.20–2395.50 nm, respectively) in the QUAC conversion output were deemed bad, resulting in a spectral subset of 156 bands out of the original total of 198. After the forward MNF transform was performed, the first 125, 110, and 133 bands out of the original 156 were chosen for the 2001, 2003, and 2011 images, respectively, for further preprocessing. Spectral smoothing with a filter width of 8 and degree of 2 (instead of the default value of 4) was applied to Bands B54–B57 and B77–B83 (band centers corresponding to the wavelengths 894.88–925.41 and 912.45–972.99 nm, respectively).

2.1.8. PRISMA

The Hyperspectral Precursor of the Application Mission (PRISMA) is an imaging spectroscopy mission developed by the Italian Space Agency (ASI) and launched on 22 March 2019 [18]. Using up to 66 VNIR bands and 171 SWIR bands, it collects data at a spatial resolution of 30 m. Some bands overlap in wavelength with others and/or suffer from a severe lack of coherent data, so they are typically automatically removed by the online data portal that delivers the hyperspectral images. Since the bands by default are numbered starting from 1 at the shortest wavelength after other bands have been taken out and the number of bands taken out can vary from image to image, it is difficult to know which band corresponds to which wavelength simply by its number. Therefore, only for this subsection, all bands will be named according to their center wavelength in nanometers. A non-orthocorrected surface radiance (L2B) dataset was obtained from the online data portal, dated 28 October 2022. This dataset contained 234 bands spanning the 406.9934–2497.1155 nm spectral range.
VNIR and SWIR bands are delivered as two separate datasets with overlapping wavelength ranges, requiring spectral subsetting and band reordering during band stacking. Unlike in the cases of HISUI and EnMAP, however, the two datasets, which are retrieved as products that have already been radiometrically calibrated and coregistered, can be fused first before following the second step and beyond the common preprocessing workflow. The bands at and within the 1339.1294–1491.4292 nm range, at and within the 1784.7173–2027.7287 nm range, and at and within the 2407.6045–2497.1155 nm range in the QUAC conversion output were deemed bad, resulting in a spectral subset of 177 bands out of the original total of 234. After the forward MNF transform was performed, the first 160 bands out of the original 177 were chosen for further preprocessing.
Spectral smoothing with a filter width of 4 was applied to bands at and within the 468.0984–559.0203 nm range, at 754.4696 nm, at 764.8565 nm, at 923.9502 nm, at and within the 998.9082–1099.2776 nm range, at and within the 1174.7142–1306.2180 nm range, at and within the 1512.6333–1765.5127 nm range, and at and within the 2036.2607–2469.6272 nm range. Latitude and longitude bands are provided via online data portal and can be used for super GLT creation and orthorectification.

2.1.9. EMIT

The Earth Surface Mineral Dust Source Investigation (EMIT) is a new imaging spectroscopy mission overseen by NASA’s JPL [19]. This technology was also used for the airborne imaging spectroscopy mission, AVIRIS-3, which was scheduled for testing flights in Fall 2023 [20]; recently, AVIRIS-3 data products have started being publicly released. A non-orthocorrected at-sensor radiance (L1B) dataset was collected with 60-m spatial resolution on 20 February 2023.
Bands 1–7, 75–81, 98–107, 125–157, 181–225, and 279–285 (band centers corresponding to the wavelengths 381.0056–425.4721, 932.2162–976.9883, 1103.8184–1170.9459, 1305.1603–1543.5454, 1722.1030–2048.8650, and 2448.6064–2492.9238 nm, respectively) in the QUAC conversion output were deemed bad, resulting in a spectral subset of 176 bands out of the original total of 285. After the forward MNF transform was performed, the first 92 bands out of the original 176 were chosen for further preprocessing. No spectral smoothing was performed. Latitude and longitude bands, which were also included in the data product, were used for super GLT creation and georeferencing at the end of preprocessing.

2.2. Bastnäsite Index Mapping

BI maps were generated from each of the eight imaging spectrometers’ datasets by using band math in ENVI 5.7, focusing on four narrow absorption features linked to the presence and abundance of rare earth elements (REEs) according to [1,2,21,22,23,24,25,26].
Three BI band math expressions, with a similar effectiveness for the detection of REEs as suggested by [2] and listed in Equations (1)–(3), were used. At the edges of the absorption features, five relative “peak” bands were chosen and labeled P1, P2, P3, P4, and P5, while four relative “trough” bands were chosen in the middle of the aforementioned absorption features and labeled T1, T2, T3, and T4. Their corresponding wavelengths are given in Table 1.
Values for the first two BIs span from −1 to 1, and for the third BI, they span from −4 to 4. The minimum REE confirmation thresholds are set at values of 0.040, 0.055, and 0.221 for Indices 1, 2, and 3, respectively, as per [2]. Since each of the eight hyperspectral sensors uses a different number of bands as well as different bandwidths from other sensors, the band math expressions were simply approximated from the nearest bands available in this study.
The equations for the three BIs are written as follows:
B I 1 = P 1 + P 2 + P 3 + P 4 T 1 + T 2 + T 3 + T 4 P 1 + P 2 + P 3 + P 4 + T 1 + T 2 + T 3 + T 4
B I 2 = P 1 + P 5 2 + P 2 + P 3 + P 4 T 1 + T 2 + T 3 + T 4 P 1 + P 5 2 + P 2 + P 3 + P 4 + T 1 + T 2 + T 3 + T 4
B I 3 = P 1 + P 2 2 T 1 P 1 + P 2 2 + T 1 + P 2 + P 3 2 T 2 P 2 + P 3 2 + T 2 + P 3 + P 4 2 T 3 P 3 + P 4 2 + T 3 + P 4 + P 5 2 T 4 P 4 + P 5 2 + T 4

3. Results

3.1. Representative Spectra and Peak Bastnäsite Index Values of the Ivanpah Dry Lake

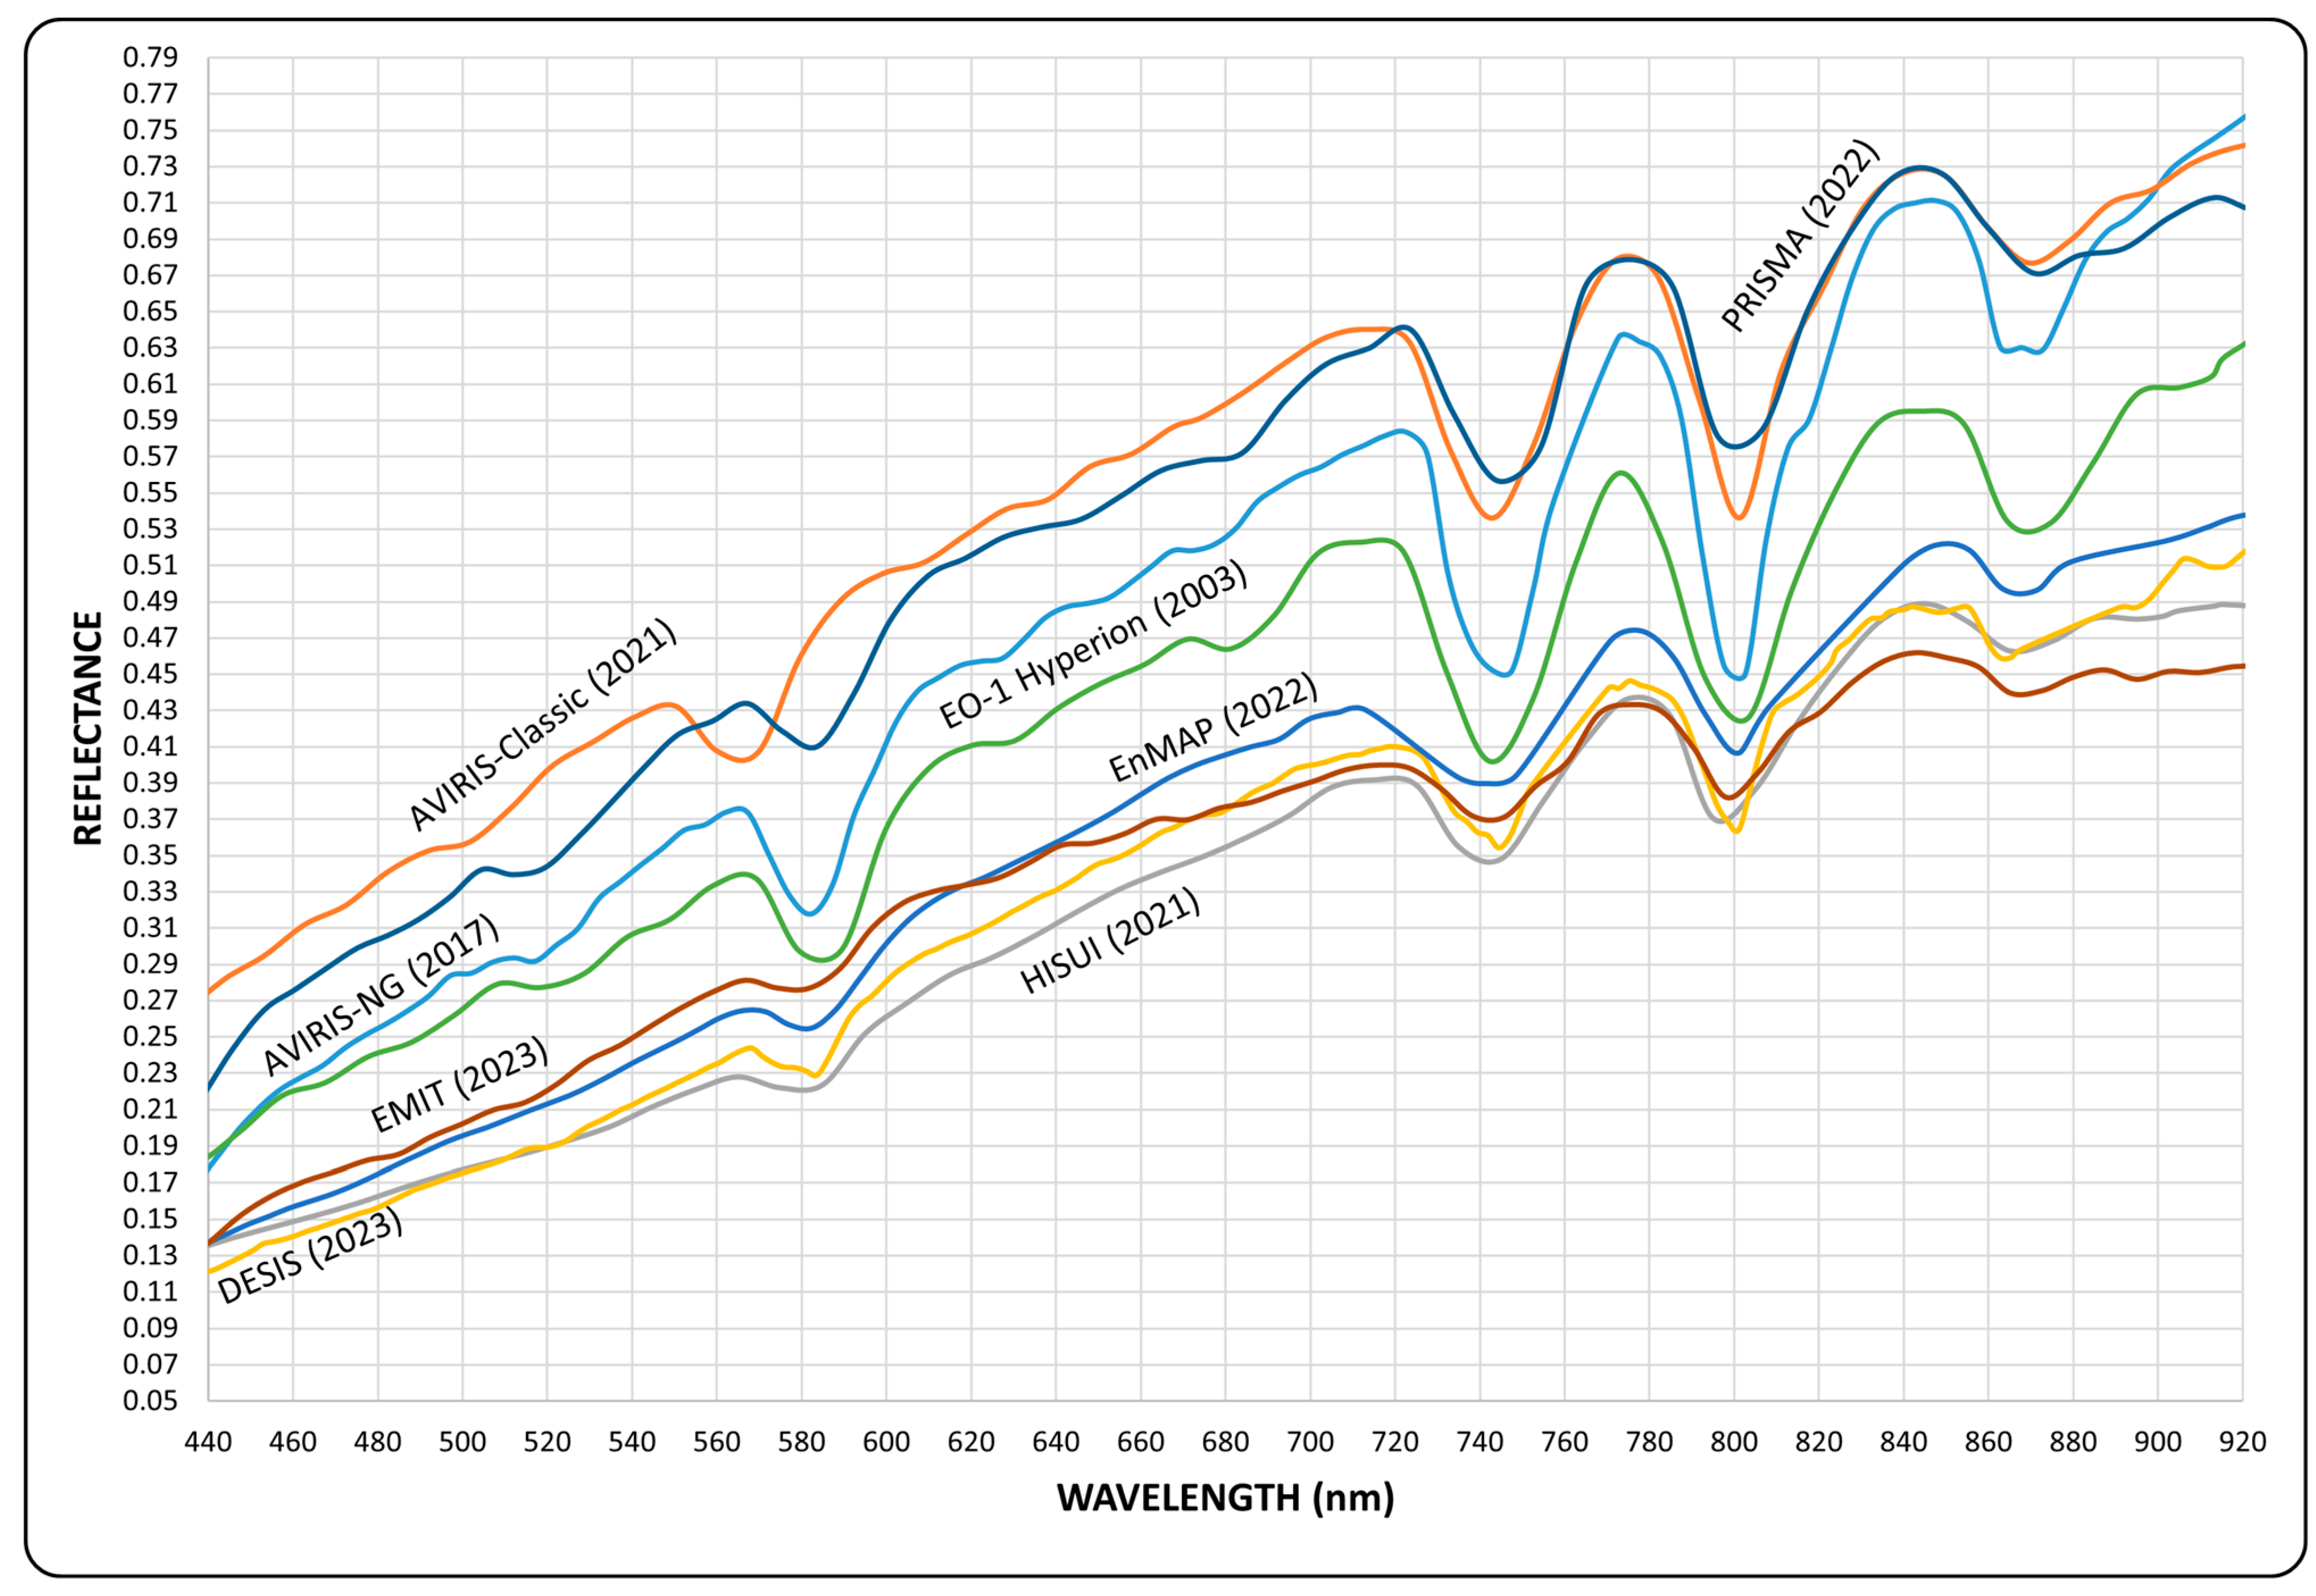
From the northern end of the Ivanpah Dry Lake near Primm, Nevada to the southern end’s entrance to the Mojave National Preserve, there were no detectable traces of REEs, except for a lone racetrack that is traditionally used for recreational land sailing. Spectra were collected from pixels on the southern flank of this racetrack (Figure 2), and strikingly, the BI values of this area (Table 2) were found to be comparable to those of the Sulfide Queen mine’s most REE-rich zones [2].

3.2. Bastnäsite Index Maps of the Ivanpah Dry Lake

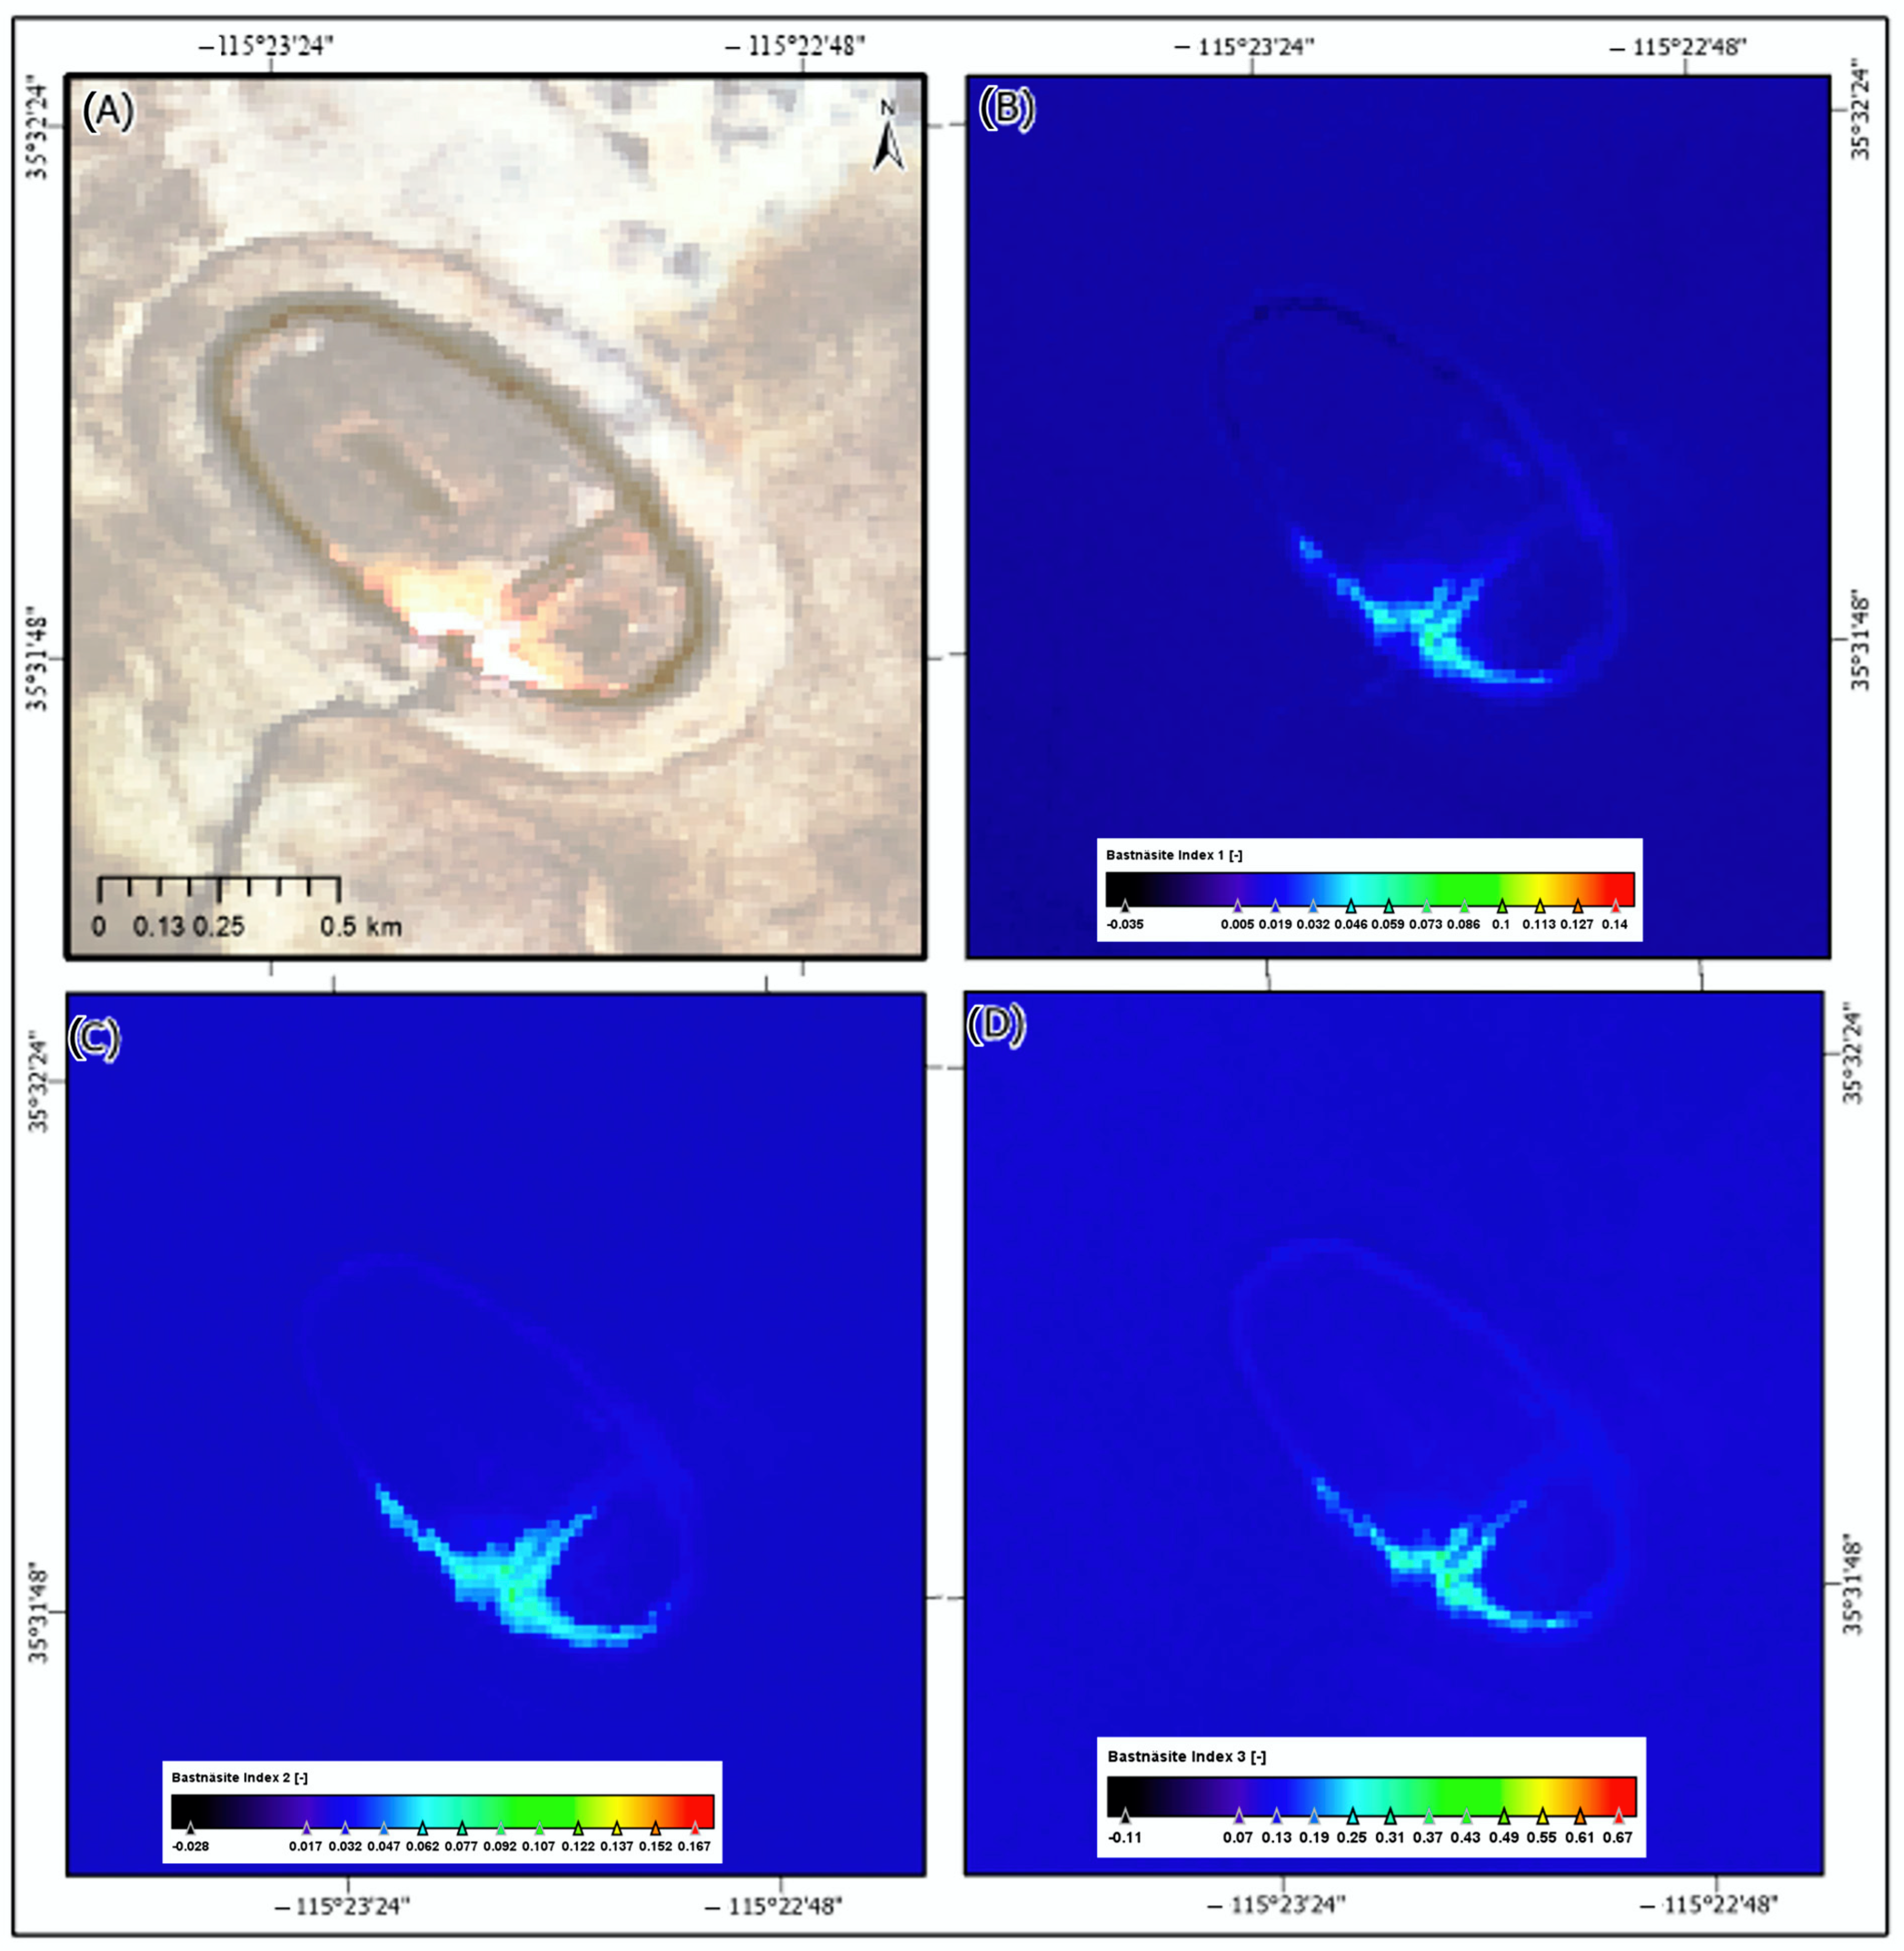
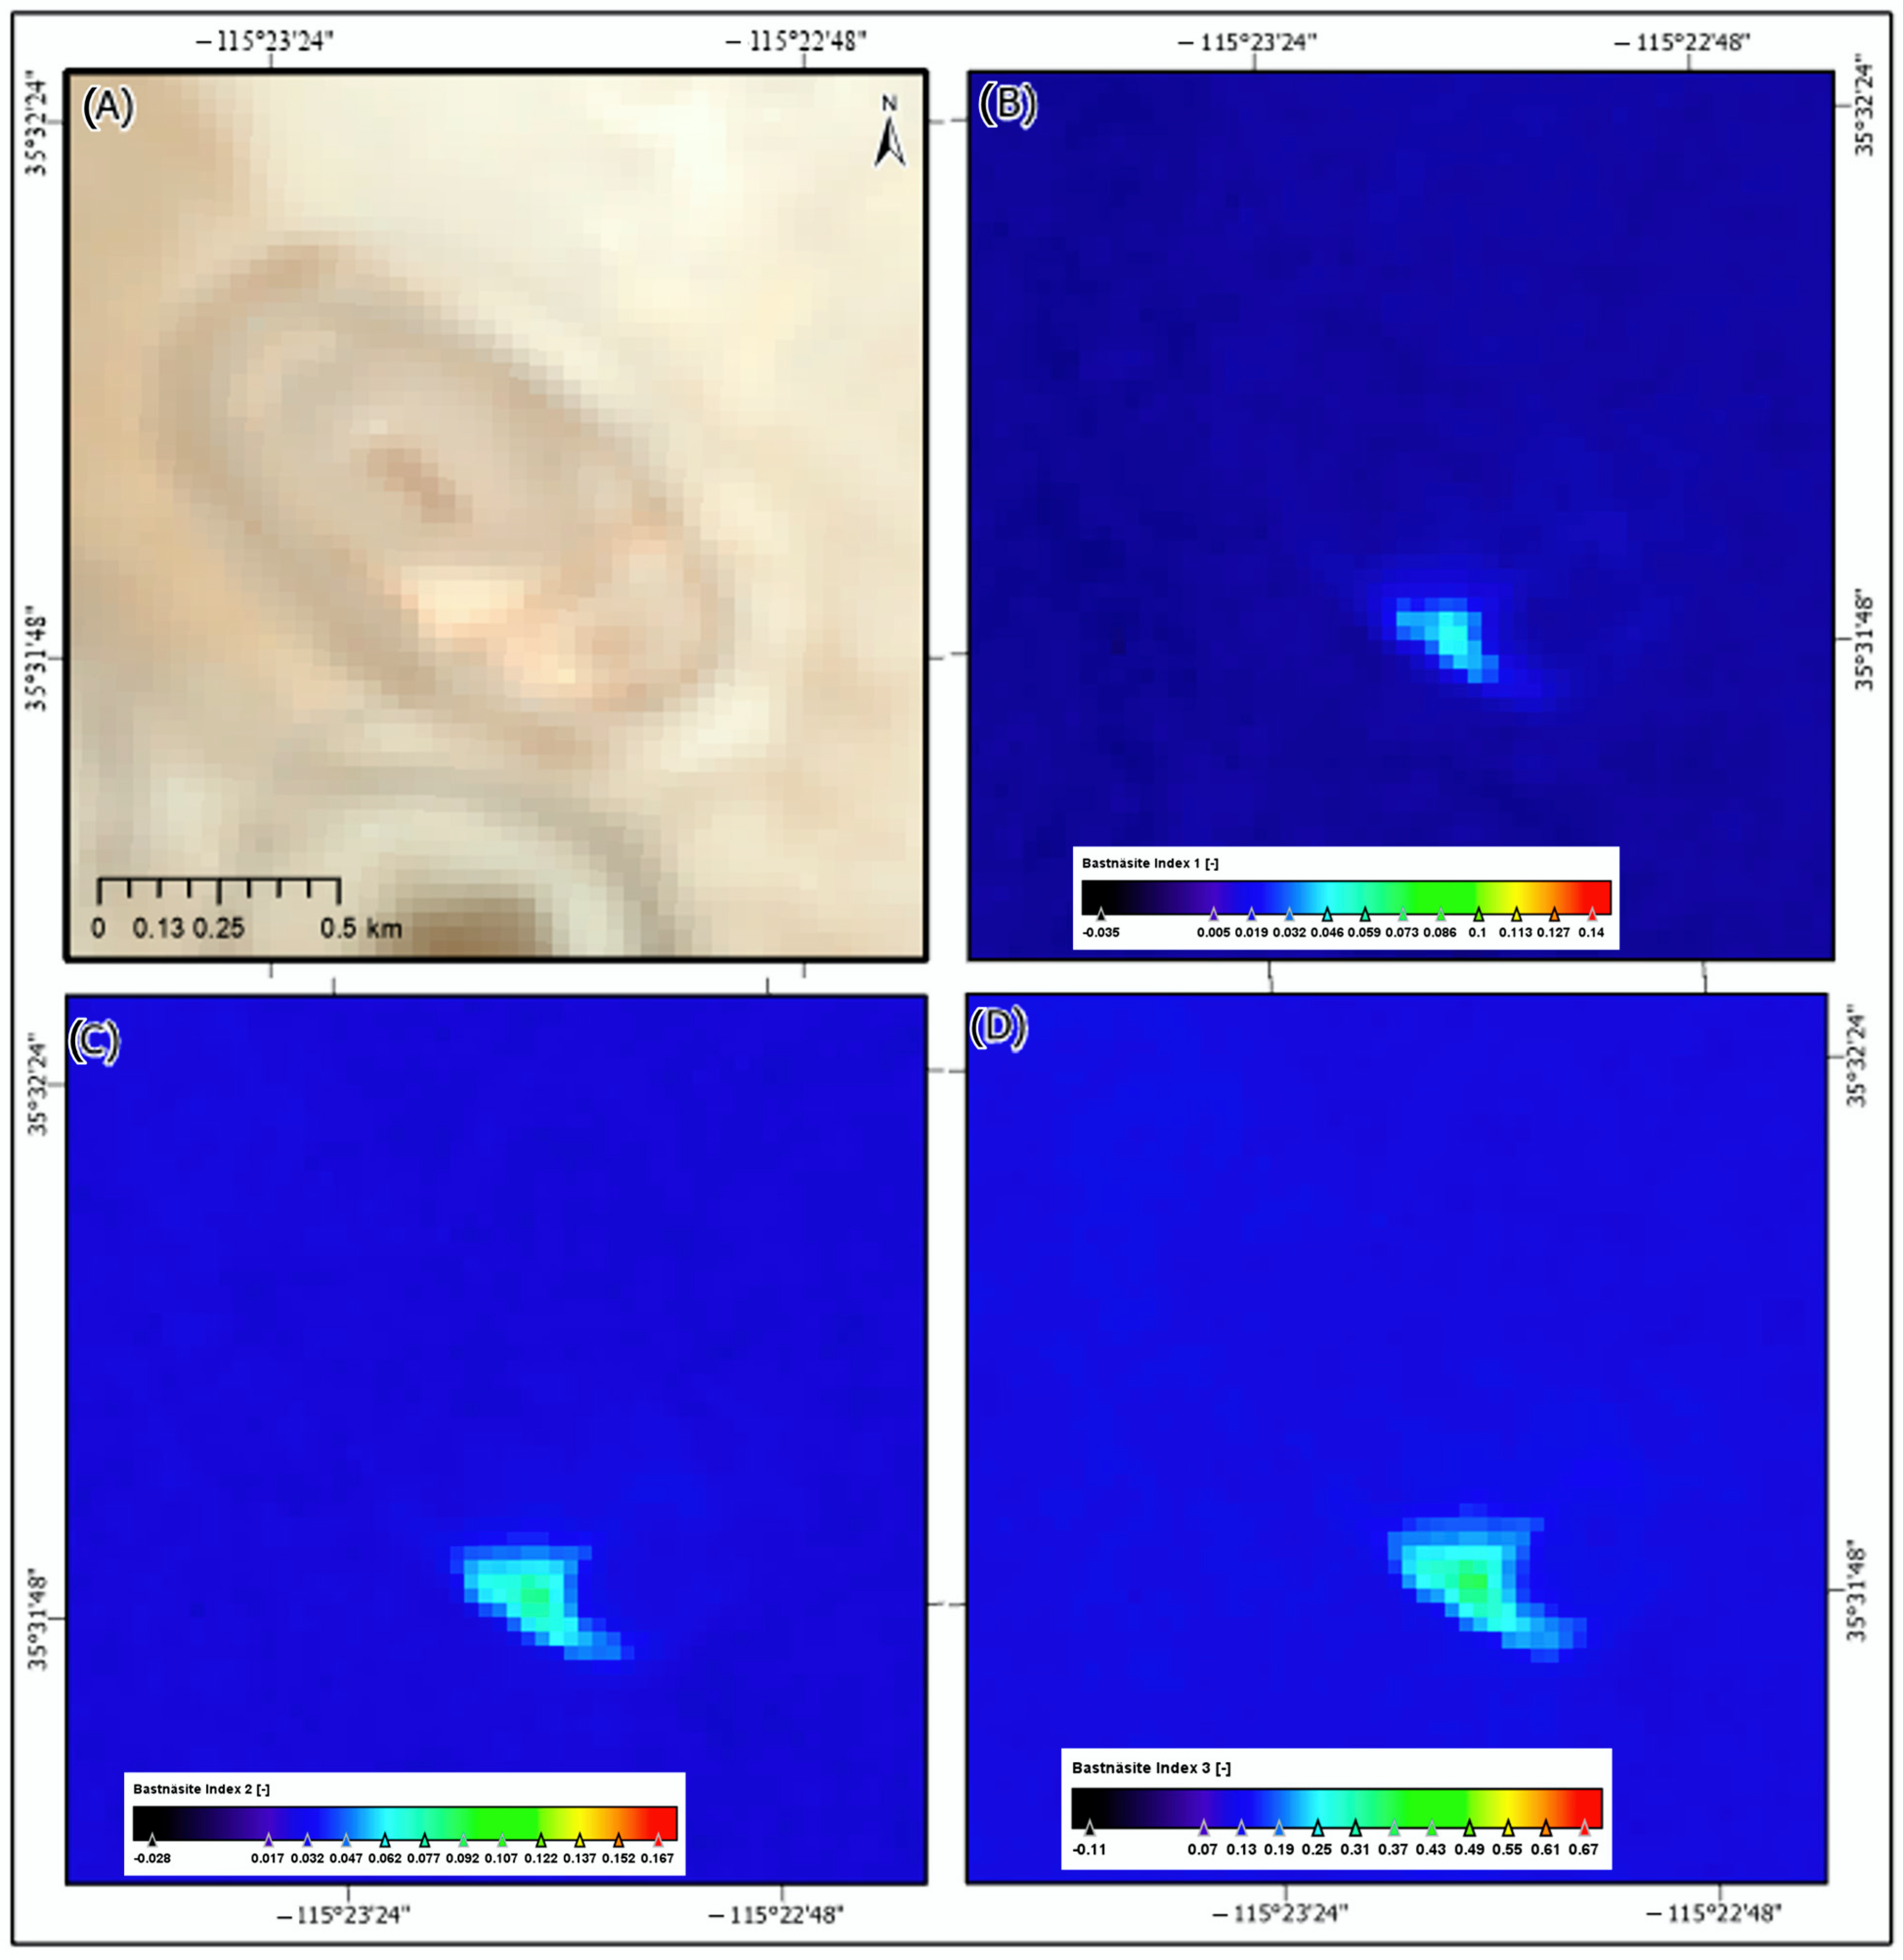
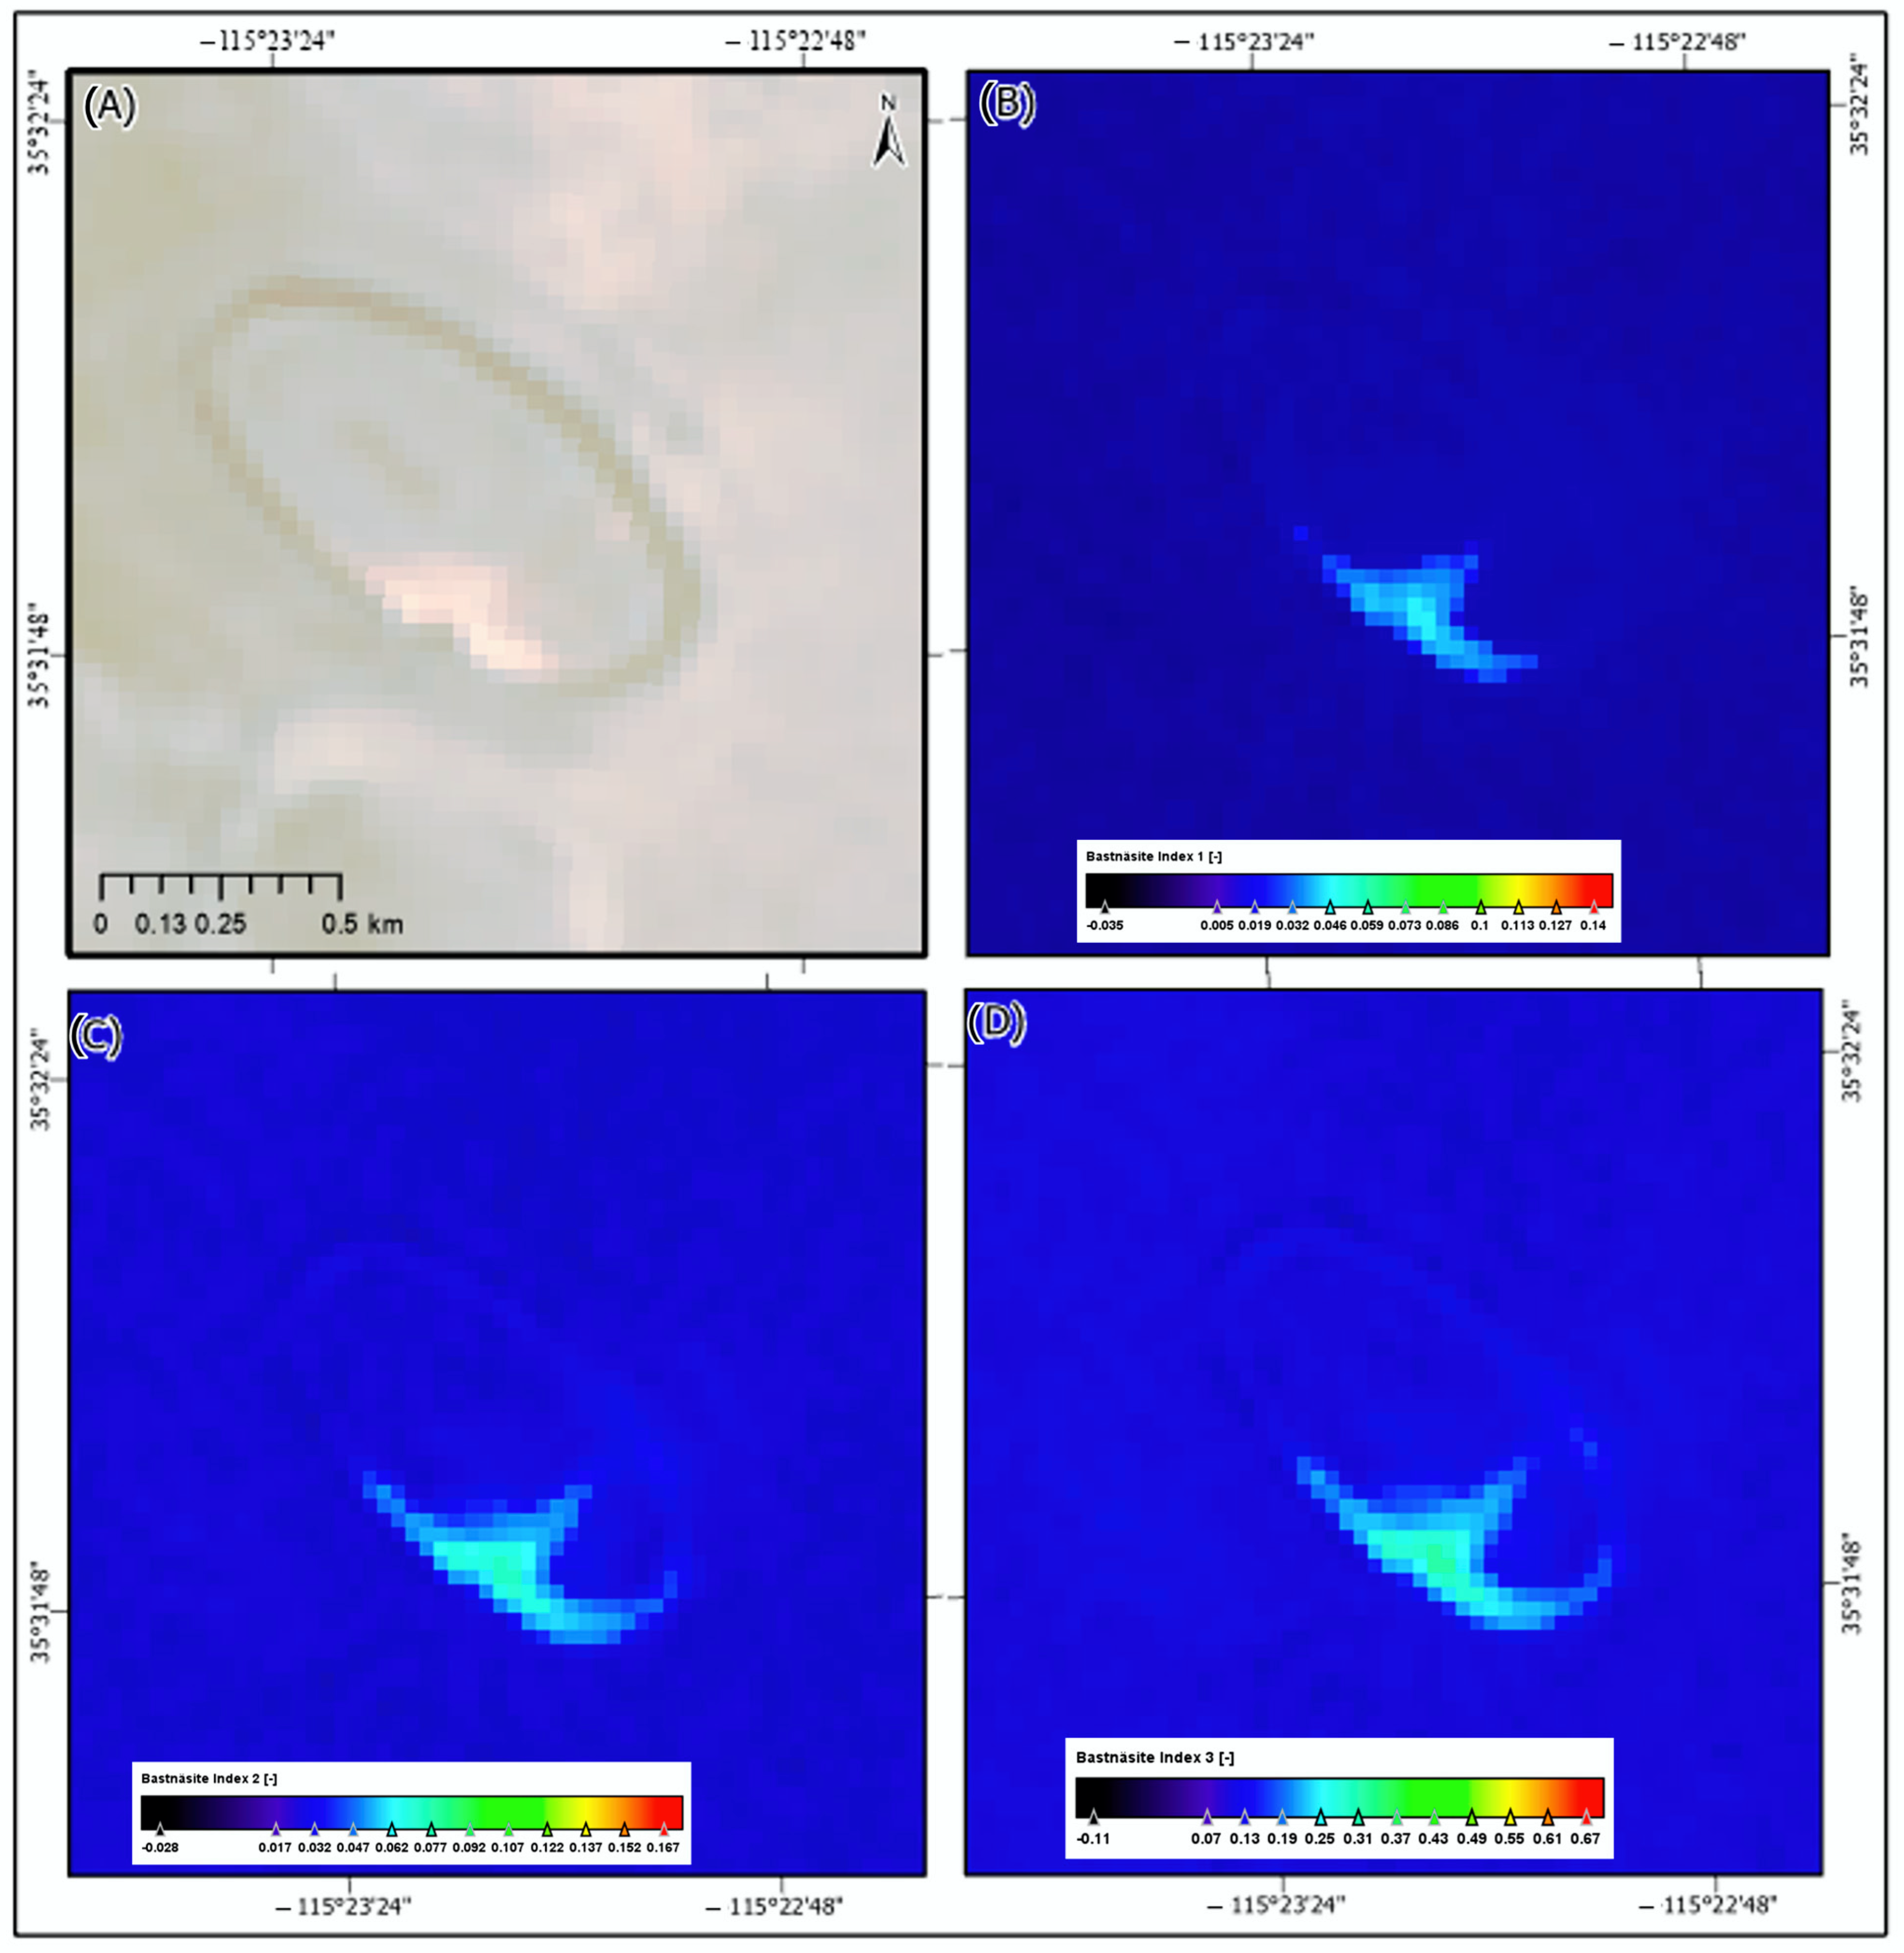
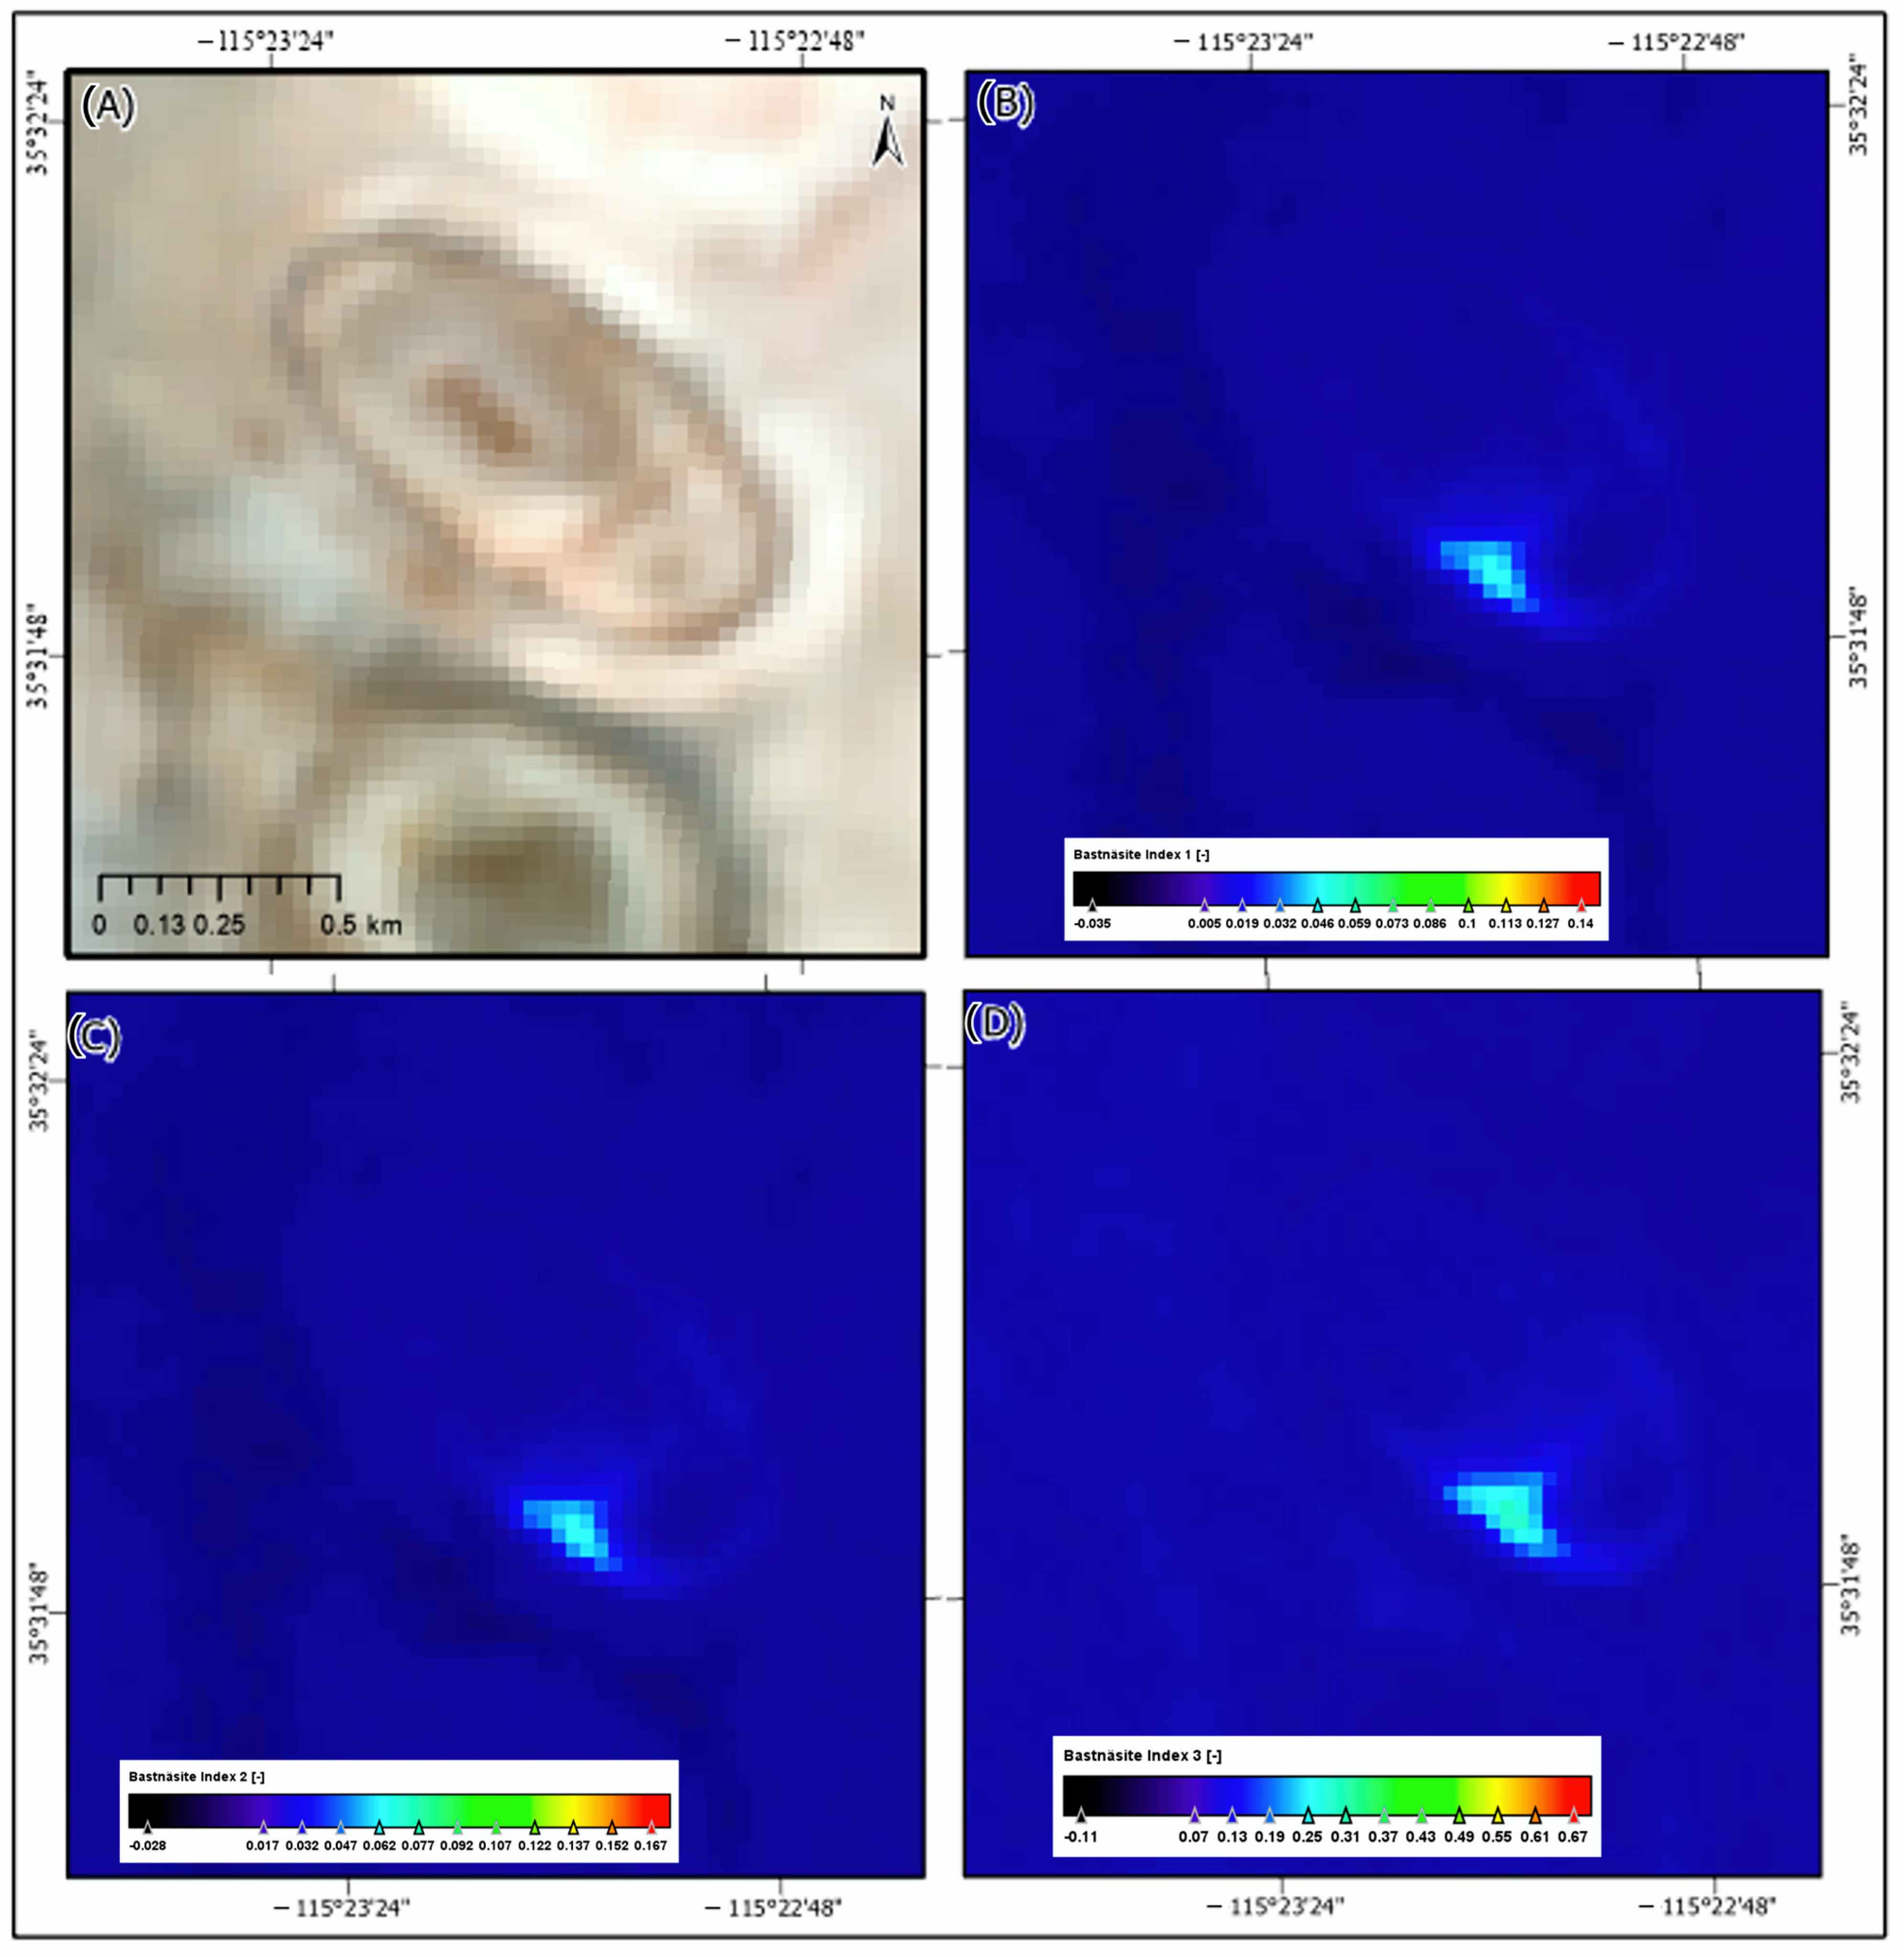
Three BI maps were created for each of the aforementioned eight imaging spectrometers and are displayed alongside their respective true-color RGB composites (Figure 3, Figure 4, Figure 5, Figure 6, Figure 7, Figure 8, Figure 9 and Figure 10). Throughout all of the images, a single REE-rich zone located on the southern flank of the Ivanpah Dry Lake racetrack is consistently visible.

4. Discussion

4.1. Representative Spectra and Peak Bastnäsite Index Values of the Ivanpah Dry Lake

Spectra in Figure 2 were collected from approximately the same geographic location, presenting an opportunity for a more direct comparison between the eight imaging spectrometers. One can observe the effect of spectral mixing suppressing the absorption features used for BI measurements as the spatial resolution becomes progressively coarser when looking at the spectra of AVIRIS-NG and EMIT.
Spectral mixing is a well-known phenomenon in remote sensing where spectra of different materials can become superimposed as the spatial resolution becomes coarser. Naturally, this implies that the spectra of REE-enriched material can be superimposed with the spectra of surrounding material that is comparatively REE deficient. In other words, the prominent absorption features that form the crux of the detection method used in this study become shallower. Much of the literature cited in this work frequently notes that the depth of an absorption feature is directly correlated with the apparent relative abundance of a given material [25], so the BIs serve to gauge the abundance of REEs semi-quantitatively. Simply put, increasing the spatial resolution artificially lowers the values of BIs. This can be directly observed in Table 2, where values are provided from different sensors for approximately the same geolocation. EMIT, being the sensor with the coarsest resolution, gave the lowest reported BI values for this site. EO-1 Hyperion is the only exception to this trend by possessing the highest BI values out of the eight, but this may be because its dataset was collected over 20 years prior to the others, when erosion via wind and occasional flooding had not yet affected the site’s concentration of REEs. By contrast, some datasets were collected within a year of each other, so a more direct case for the effects of spectral mixing can be made through their BI values.
In addition to this trend, the spectra of AVIRIS-Classic and PRISMA also show an overall higher reflectance than that of AVIRIS-NG, suggesting that fine-grained dust with high silicate content may have blown in through the area of interest and partially obscured the unknown substance at the times that those two datasets were collected. Moreover, two major differences can be made between the spectra from the Sulfide Queen mine and the Ivanpah Dry Lake racetrack.
Firstly, the deepest points of the neodymium absorption features in Figure 2 are offset towards longer wavelengths by approximately 5–10 nm when compared to the deepest points of those same features in representative spectra from the Sulfide Queen Mine [2]. This has the overall effect of reducing the apparent BI values of the unknown substance at the Ivanpah Dry Lake racetrack.
Secondly, with the exceptions of DESIS—which was limited to providing only VNIR data—and EO-1 Hyperion—whose SWIR bands were unusable after 2300 nm due to severe noise—all spectra from the Sulfide Queen mine shared the characteristic asymmetric absorption feature of carbonates near 2330–2340 nm, albeit the depth and width of this feature varied from sensor to sensor. This was notably more prominent in the spectra from HISUI, EnMAP, and EMIT [2]. Meanwhile, carbonate and hydroxyl absorption features were generally absent in all spectra in Figure 2 confirming that the unknown substance at the racetrack is different in chemical composition from the bastnäsite found at several locations across the Sulfide Queen mine.

4.2. Bastnäsite Index Maps of the Ivanpah Dry Lake

When one interprets the results of the BI maps, it is crucial to consider a few caveats. The first BI appears to be highly sensitive to noise in dark pixels, occasionally giving anomalously high values independent of REE content in regions where high relief casts large shadows. This can be avoided through one of two methods: 1. correcting the apparent reflectance of mountainous terrain through Lambert’s cosine law of illumination [27] or 2. applying a mask to pixels if any of their bands falls below a specified reflectance threshold.
The former should only be conducted through a reference DEM with a spatial resolution similar to that of the hyperspectral data, which may not necessarily be available in the case of the airborne sensors, and additional geometric correction may be required to align the data with the aforementioned DEM before a cosine correction can be performed, which could take considerable time depending on the extent and topographic complexity of the data.
Bearing this in mind, the latter was deemed to be more straightforward and was chosen as the method for countering dark pixels in this study. It was expected that, in the case of the first BI, bluer materials—that is, materials where reflectance is higher towards the shorter wavelengths of the visible spectrum—would have a bias towards higher values due to how the band math expression relies on peaks located only at shorter wavelengths relative to the troughs. However, this did not appear to be an issue for any of the eight imaging spectrometers presented in this study.
The second and third indices do not have the same weakness for dark pixels, most likely due to the inclusion of the P5 peak in their band math expressions, as mentioned earlier during the discussion of the laboratory data. However, the P5 peak appears to be the reason why the third index is biased towards redder materials—that is, materials where reflectance is higher towards the longer wavelengths of the visible spectrum. Relying on a peak that is further in the near-infrared portion of the electromagnetic spectrum renders the third index especially susceptible to mistaking a pixel containing dense vegetation for an REE-rich zone due to the prominent “red edge” of its spectrum. This could potentially be resolved by approximating the NDVI through band math and masking out pixels with values above a specified threshold. However, given that the Ivanpah Dry Lake is in an arid environment with easily identifiable patches of vegetation, it was not deemed necessary for this study.
Despite using the P5 peak, the second index does not appear to be susceptible to this kind of error, suggesting that it may in fact be the most reliable out of the three. However, though no material has been found yet that has yielded false positives in a map derived from the second BI, such material could still exist elsewhere.
Atmospheric absorption occurs at wavelength regions too far away to be considered detrimental to the creation of any BI maps from airborne and spaceborne hyperspectral images since the important absorption features associated with neodymium lie within the 550–900 nm wavelength range. With that in mind, to ensure the utmost confidence in determining the presence of detectable REEs, a given target should evoke a similar response from all three indices.
As of the inception date of this study, there have been no previous reports of undiscovered carbonatite formations in Ivanpah Dry Lake. In fact, visitors who have gone in person have marked the entirety of Ivanpah Dry Lake on geological maps as a topographically flat, purely alluvial deposit since 1954 [4], so it is highly likely that the unknown substance that appears to be enriched in REEs is a new addition to the region. Given that alkaline igneous rocks surround the carbonatite body at the Sulfide Queen mine with a thick shell of granite and gneiss [4,21,28,29], as well as the fact that such types of rocks are very resistant to erosion, it is unlikely that rainfall and wind alone could have carried the unknown substance 14.7 km (9.13 miles) away from the carbonatite body to its current location in a matter of mere decades.
Given the mine’s history with improper waste disposal as was briefly mentioned at the beginning of this work [5], it is plausible that the unknown substance could be a manmade deposit that may consist, at least partially, of residual mineral scale left behind and forgotten by cleaning efforts at the turn of the century. After ores are mixed with chemical reagents for the purpose of isolating REEs, mineral scale could be dumped for one of two reasons: 1. either the REE concentrations of the resulting slurry were deemed too low to be worth further processing at the mine or 2. the radioactivity of uranium, thorium, and radium embedded within the ores as they were mixed into the slurry was high enough to be deemed unsafe.
The depths of the neodymium absorption features and the BI values resulting from them given by the eight imaging spectrometers suggest that the former could be ruled out. The latter implies that further investigation may be warranted to validate a potential health risk for anyone who remains near the racetrack for an extended period of time.
As for the performance of the BI maps themselves, out of the eight imaging spectrometers, EO-1 Hyperion appears to be the most sensitive to REEs and gives higher values overall. Despite its very coarse spatial resolution, EMIT shows enough visual contrast in its BI maps to locate REE-rich terrain adequately for this racetrack. The remarkable persistence of the unknown substance, which has remained in the same location and maintained similar BI values after 20 years, indicates that it is likely insoluble in water and will not be easily washed away by rainfall, even on the rare occasions when Ivanpah Dry Lake experiences flooding. Over the next coming decades, BI maps like these produced by airborne and spaceborne imaging spectrometers will become an effective long-term tool for environmental monitoring near prospective sites for REE mining projects.

5. Conclusions

This study used the newly developed Bastnäsite Indices to examine an area near the Sulfide Queen mine in California that has not yet been investigated in the context of economically viable rare earth element deposits. These spectral indices have identified a zone in Ivanpah Dry Lake where a substance that appears to be enriched in rare earth elements has accumulated into a new deposit with significant potential for recovery efforts. Furthermore, the extensive time frame of the data presented in this work suggests that this substance exhibits considerable resistance to erosion after 20 years. If the substance is indeed composed of hazardous material left over from past mining operations, this work therefore also highlights a newfound potential for sophisticated techniques involving imaging spectroscopy to aid in long-term environmental monitoring near rare earth mines.

Author Contributions

Conceptualization, methodology, validation, formal analyses, investigation, and writing—original draft preparation, O.C.A.G.; writing—review and editing, and visualization, O.C.A.G. and S.D.K.; supervision and funding acquisition, S.D.K. All authors have read and agreed to the published version of the manuscript.

Funding

This research was partially funded by the American Chemical Society, Petroleum Research Fund grant number 66708-ND8.

Data Availability Statement

The data presented in this study are available on request from the corresponding author due to ongoing research.

Acknowledgments

We thank: John W. Chapman from NASA’s JPL for providing the original AVIRIS-NG image acquired over Ivanpah Dry Lake; Japan Space Systems for providing upon request HISUI data for the study area; Uta Heiden from the DLR for providing guidance through the DESIS data acquisition and georeferencing process; Rupert Müller from the DLR for generating the latitude and longitude bands required for the DESIS georeferencing step; Nicole Pinnel from the DLR for providing guidance through the EnMAP data acquisition and georeferencing process.

Conflicts of Interest

The authors declare no conflicts of interest.

References

  1. Gadea, O.C.A.; Khan, S.D. Detection of bastnäsite-rich veins in rare earth element ores through hyperspectral imaging. IEEE Geosci. Remote. Sens. Lett. 2023, 20, 5502204. [Google Scholar] [CrossRef]
  2. Gadea, O.C.A.; Khan, S.D.; Sisson, V.B. Estimating rare earth elements at various scales with Bastnäsite Indices for Mountain Pass. Ore. Geol. Rev. 2024, 173, 106254. [Google Scholar] [CrossRef]
  3. Qasim, M.; Khan, S.D.; Sisson, V.; Greer, P.; Xia, L.; Okyay, Ü.; Franco, N. Identifying rare earth elements using a tripod and drone-mounted hyperspectral camera: A case study of the Mountain Pass Birthday Stock and Sulphide Queen Mine Pit, California. Remote Sens. 2024, 16, 3353. [Google Scholar] [CrossRef]
  4. Olson, J.C.; Shawe, D.R.; Pray, L.C.; Sharp, W.N. Rare-Earth Mineral Deposits of the Mountain Pass District, San Bernardino County, California; Technical Report 261; USGS: Reston, VA, USA, 1954. [Google Scholar] [CrossRef]
  5. Nystrom, E.C. Chapter eight: Resource management. In From Neglected Space to Protected Space: An Administrative History of Mojave National Preserve: National Park Service; U.S. Department of the Interior: Washington, DC, USA, 2003; Available online: https://npshistory.com/publications/moja/adhi.pdf (accessed on 30 September 2024).
  6. NV5 Geospatial Solutions. QUAC Background. Available online: https://www.nv5geospatialsoftware.com/docs/backgroundquac.html (accessed on 30 September 2024).
  7. Pande-Chhetri, R.; Abd-Elrahman, A. Filtering high-resolution hyperspectral imagery in a maximum noise fraction transform domain using wavelet-based de-striping. Int. J. Remote Sens. 2013, 34, 2216–2235. [Google Scholar] [CrossRef]
  8. Savitzky, A.; Golay, M.J.E. Smoothing and differentiation of data by simplified least squares procedures. Anal. Chem. 1964, 36, 1627–1639. [Google Scholar] [CrossRef]
  9. Bromba, M.U.A.; Ziegler, H. Application hints for Savitzky-Golay digital smoothing filters. Anal. Chem. 1981, 53, 1583–1586. [Google Scholar] [CrossRef]
  10. Guha, A.; Ghosh, U.K.; Sinha, J.; Pour, A.B.; Bhaisal, R.; Chatterjee, S.; Baranval, N.K.; Rani, N.; Kumar, K.V.; Rao, P.V.N. Potentials of airborne hyperspectral AVIRIS-NG data in the exploration of base metal deposit—A study in the parts of Bhilwara, Rajasthan. Remote Sens. 2021, 13, 2101. [Google Scholar] [CrossRef]
  11. Lundeen, S. Airborne Visible/Infrared Imaging Spectrometer-Next Generation: Platform. 2024. Available online: https://avirisng.jpl.nasa.gov/platform.html (accessed on 30 September 2024).
  12. Lundeen, S. Airborne Visible/Infrared Imaging Spectrometer: Overview. 2024. Available online: https://aviris.jpl.nasa.gov/aviris/index.html (accessed on 30 September 2024).
  13. Japan Space Systems. Hyper-Spectral Imager SUIte (HISUI). 2021. Available online: https://www.jspacesystems.or.jp/en/project/observation/hisui/ (accessed on 30 September 2024).
  14. Eckardt, A.; Horack, J.; Lehmann, F.; Krutz, D.; Drescher, J.; Whorton, M.; Soutullo, M. DESIS (DLR Earth Sensing Imaging Spectrometer for the ISS-MUSES platform). In Proceedings of the Institute of Electrical and Electronics Engineers International Geoscience and Remote Sensing Symposium, Milan, Italy, 26–31 July 2015; pp. 1457–1459. [Google Scholar] [CrossRef]
  15. Carmona, E.; Alonso-González, K.; Bachmann, M.; Cerra, D.; Dietrich, D.; Heiden, U.; Knodt, U.; Krutz, D.; Müller, R.; De los Reyes, R.; et al. First results of the DESIS imaging spectrometer on board the International Space Station. In Proceedings of the Institute of Electrical and Electronics Engineers International Geoscience and Remote Sensing Symposium, Yokohama, Japan, 28 July–2 August 2019; pp. 4499–4502. [Google Scholar] [CrossRef]
  16. Guanter, L.; Kaufmann, H.; Segl, K.; Foerster, S.; Rogass, C.; Chabrillat, S.; Kuester, T.; Hollstein, A.; Rossner, G.; Chlebek, C.; et al. The EnMAP spaceborne imaging spectroscopy mission for Earth observation. Remote Sens. 2015, 7, 8830–8857. [Google Scholar] [CrossRef]
  17. Berrick, S. EO-1 Hyperion. 2024. Available online: https://cmr.earthdata.nasa.gov/search/concepts/C1220567951-USGS_LTA.html (accessed on 30 September 2024).
  18. ASI. Hyperspectral Satellite, Capable of Observing from the Optical to the Near Infrared. 2019. Available online: https://www.asi.it/en/earth-science/prisma/ (accessed on 30 September 2024).
  19. Velev, K. Earth Surface Mineral Dust Source Investigation (EMIT). 2024. Available online: https://earth.jpl.nasa.gov/emit/ (accessed on 30 September 2024).
  20. Green, R.O.; Schaepman, M.E.; Mouroulis, P.; Geier, S.; Shaw, L.; Hueini, A.; Bernas, M.; McKinley, I.; Smith, C.; Wehbe, R.; et al. Airborne Visible/Infrared Imaging Spectrometer 3 (AVIRIS-3). In Proceedings of the Institute of Electrical and Electronics Engineers Aerospace Conference, Big Sky, MT, USA, 5–12 March 2022; p. 1. [Google Scholar] [CrossRef]
  21. Rowan, L.C.; Mars, J.C. Lithologic mapping in the Mountain Pass, California area using Advanced Spaceborne Thermal Emission and Reflection Radiometer (ASTER) data. Remote Sens. Environ. 2003, 84, 350–366. [Google Scholar] [CrossRef]
  22. Turner, D.J.; Rivard, B.; Groat, L.A. Visible and short-wave infrared reflectance spectroscopy of REE fluorocarbonates. Am. Mineral. 2014, 99, 1335–1346. [Google Scholar] [CrossRef]
  23. Boesche, N.K.; Rogass, C.; Lubitz, C.; Brell, M.; Herrmann, S.; Mielke, C.; Tonn, S.; Appelt, O.; Altenberger, U.; Kaufmann, H. Hyperspectral REE (rare earth element) mapping of outcrops—applications for neodymium detection. Remote Sens. 2015, 7, 5160–5186. [Google Scholar] [CrossRef]
  24. Neave, D.A.; Black, M.; Riley, T.R.; Gibson, S.A.; Ferrier, G.; Wall, F.; Broom-Fendley, S. On the feasibility of imaging carbonatite-hosted rare earth element deposits using remote sensing. Econ. Geol. 2016, 111, 641–665. [Google Scholar] [CrossRef]
  25. Krupnik, D.; Khan, S.D. High-resolution hyperspectral mineral mapping: Case studies in the Edwards Limestone, Texas, USA and sulfide-rich quartz veins from the Ladakh Batholith, Northern Pakistan. Minerals 2020, 10, 967. [Google Scholar] [CrossRef]
  26. Koerting, F.; Koellner, N.; Kuras, A.; Boesche, N.K.; Rogass, C.; Mielke, C.; Elger, K.; Altenberger, U. A solar optical hyperspectral library of rare-earth-bearing minerals, rare-earth oxide powders, copper-bearing minerals and Apliki mine surface samples. Earth Syst. Sci. Data 2021, 13, 923–942. [Google Scholar] [CrossRef]
  27. Rogelj, L.; Simončič, U.; Tomanič, T.; Jezeršek, M.; Pavlovčič, U.; Stergar, J.; Milanič, M. Effect of curvature correction on parameters extracted from hyperspectral images. J. Biomed. Opt. 2021, 26, 096003. [Google Scholar] [CrossRef] [PubMed]
  28. Castor, S.B. Rare earth deposits of North America. Resour. Geol. 2008, 58, 337–347. [Google Scholar] [CrossRef]
  29. Poletti, J.E.; Cottle, J.M.; Hagen-Peter, G.A.; Lackey, J.S. Petrochronological constraints on the origin of the Mountain Pass ultrapotassic and carbonatite intrusive suite, California. J. Petrol. 2016, 57, 1555–1598. [Google Scholar] [CrossRef]
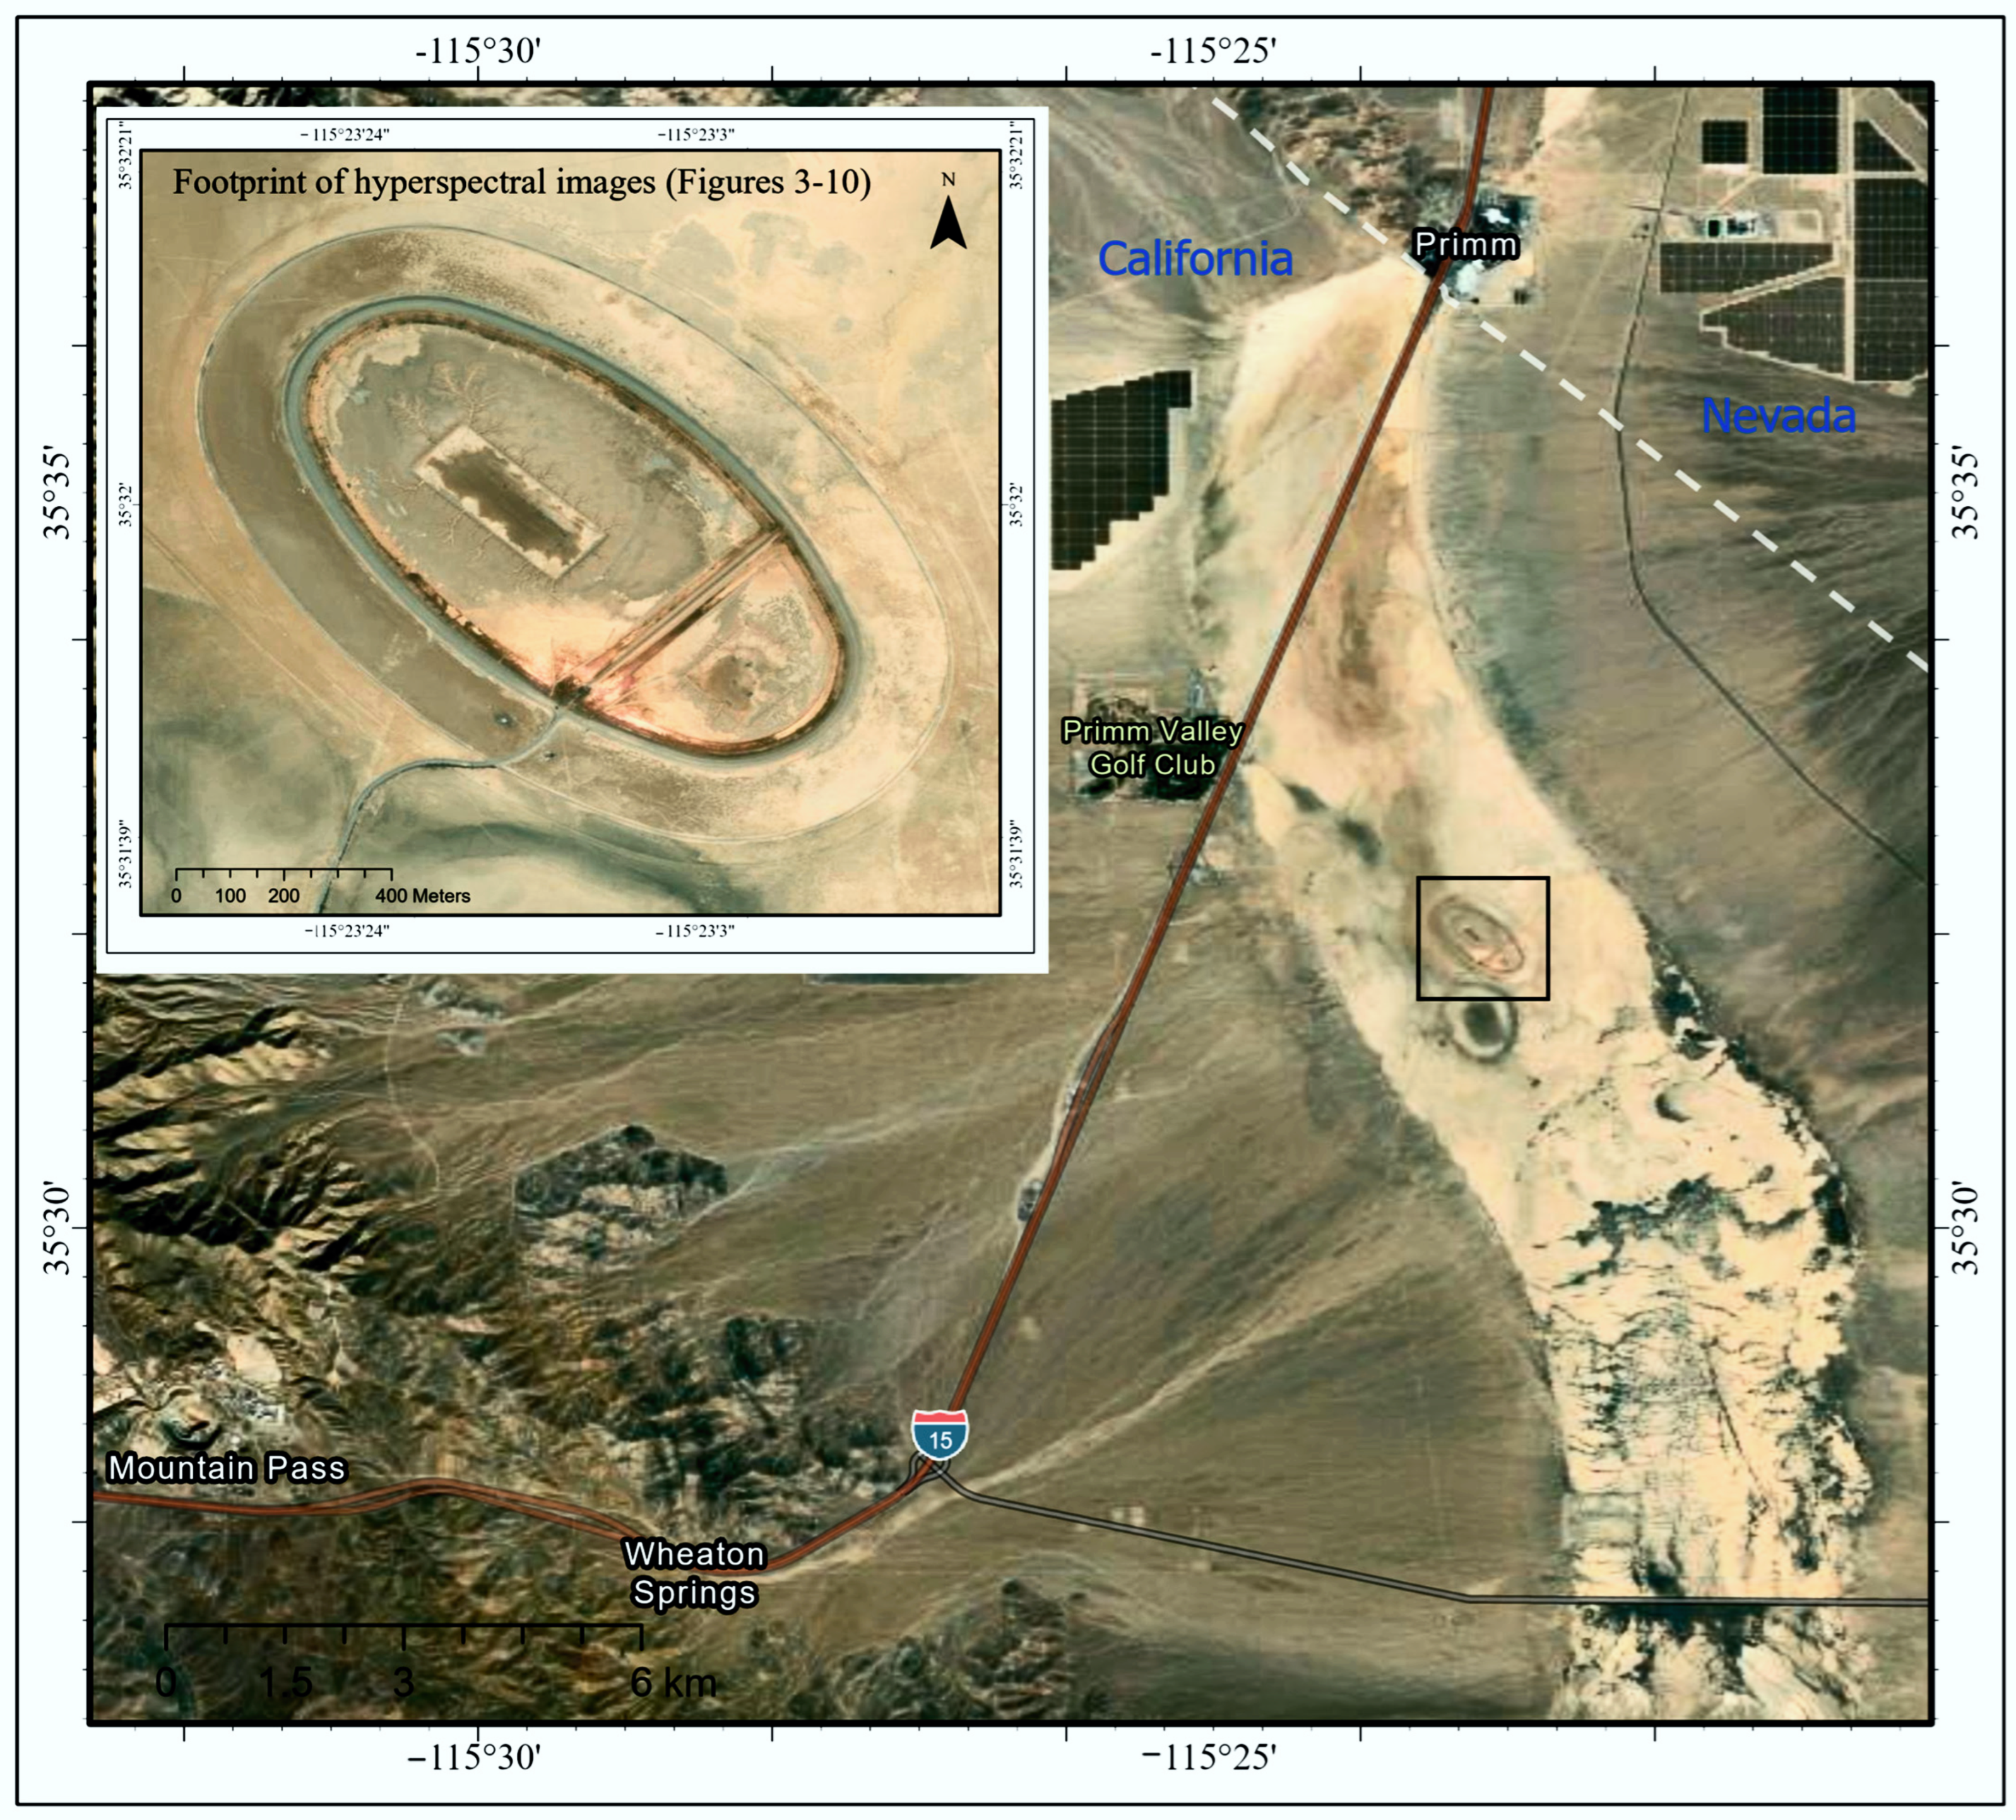
Figure 1. The figure displays the location of Ivanpah Dry Lake in the Mojave Desert. The Sulfide Queen Mine is situated southwest in Mountain Pass. A zoomed-in view of Ivanpah Dry Lake is shown in the top left, displaying the region covered in hyperspectral data from various sensors. The background image is from the Maxar Vivid Imagery Basemap Layer. The images for this layer were captured by the WorldView-2 Satellite on 31 March 2023 (ESRI, 2024).
Remotesensing 16 04540 g001
Figure 2. Spectra of terrain containing high concentrations of rare earth elements, scanned by airborne and spaceborne imaging spectrometers over the Ivanpah Dry Lake racetrack; the exact year when each dataset was collected is listed beside the name of its corresponding spectrometer.
Remotesensing 16 04540 g002
Figure 3. Hyperspectral images of terrain containing high concentrations of rare earth elements, scanned by AVIRIS-NG over the Ivanpah Dry Lake racetrack: (A) true-color RGB composite of the area of interest; rare earth element detection maps of the same area according to Bastnäsite Indices (B) 1, (C) 2, and (D) 3, respectively.
Remotesensing 16 04540 g003
Figure 4. Hyperspectral images of terrain containing high concentrations of rare earth elements, scanned by AVIRIS-Classic over the Ivanpah Dry Lake racetrack: (A) true-color RGB composite of the area of interest; rare earth element detection maps of the same area according to Bastnäsite Indices (B) 1, (C) 2, and (D) 3, respectively.
Remotesensing 16 04540 g004
Figure 5. Hyperspectral images of terrain containing high concentrations of rare earth elements, scanned by HISUI over the Ivanpah Dry Lake racetrack: (A) true-color RGB composite of the area of interest; rare earth element detection maps of the same area according to Bastnäsite Indices (B) 1, (C) 2, and (D) 3, respectively.
Remotesensing 16 04540 g005
Figure 6. Hyperspectral images of terrain containing high concentrations of rare earth elements, scanned by DESIS over the Ivanpah Dry Lake racetrack: (A) true-color RGB composite of the area of interest; rare earth element detection maps of the same area according to Bastnäsite Indices (B) 1, (C) 2, and (D) 3, respectively.
Remotesensing 16 04540 g006
Figure 7. Hyperspectral images of terrain containing high concentrations of rare earth elements, scanned by EnMAP over the Ivanpah Dry Lake racetrack: (A) true-color RGB composite of the area of interest; rare earth element detection maps of the same area according to Bastnäsite Indices (B) 1, (C) 2, and (D) 3, respectively.
Remotesensing 16 04540 g007
Figure 8. Hyperspectral images of terrain containing high concentrations of rare earth elements, scanned by EO-1 Hyperion over the Ivanpah Dry Lake racetrack: (A) true-color RGB composite of the area of interest; rare earth element detection maps of the same area according to Bastnäsite Indices (B) 1, (C) 2, and (D) 3, respectively.
Remotesensing 16 04540 g008
Figure 9. Hyperspectral images of terrain containing high concentrations of rare earth elements, scanned by PRISMA over the Ivanpah Dry Lake racetrack: (A) true-color RGB composite of the area of interest; rare earth element detection maps of the same area according to Bastnäsite Indices (B) 1, (C) 2, and (D) 3, respectively.
Remotesensing 16 04540 g009
Figure 10. Hyperspectral images of terrain containing high concentrations of rare earth elements, scanned by EMIT over the Ivanpah Dry Lake racetrack: (A) true-color RGB composite of the area of interest; rare earth element detection maps of the same area according to Bastnäsite Indices (B) 1, (C) 2, and (D) 3, respectively.
Remotesensing 16 04540 g010
Table 1. Wavelengths in nanometers for REE detection using imaging spectrometers.
Sensor NameP1T1P2T2P3T3P4T4P5
AVIRIS-NG567.0577.1712.3742.3772.4797.4837.5867.6922.7
AVIRIS-Classic550.3560.0713.6742.9772.1801.3840.2869.3927.4
HISUI565575715735775795835865915
DESIS568.3578.5721.4741.9777.9798.3832.1865.3916.5
EnMAP566.2577.0706.4741.6770.9801.0847.6871.4921.6
EO-1 Hyperion559.1579.5711.7742.3772.8803.3844.0864.4932.6
PRISMA567.2583.8713.7744.1775.3796.1849.2870.7924.0
EMIT566.8581.7723.3745.7775.5797.9835.2872.5917.3
Table 2. Geolocations of pixels containing high concentrations of rare earth elements from the Ivanpah Dry Lake racetrack and Bastnäsite Index measurements by airborne and spaceborne imaging spectrometers.
Sensor NameSpatial
Resolution
Latitude of
Pixel Center
Longitude of
Pixel Center
Bastnäsite
Index 1
Bastnäsite
Index 2
Bastnäsite
Index 3
AVIRIS-NG4.1 m35°31′49.53″N115°23′10.01″W0.1090.1490.626
AVIRIS-Classic15.7 m35°31′48.86″N115°23′9.31″W0.0730.0980.400
HISUI20 m35°31′49.54″N115°23′9.47″W0.0430.0830.371
DESIS30 m35°31′48.95″N115°23′7.51″W0.0520.0920.400
EnMAP30 m35°31′49.68″N115°23′8.72″W0.0430.0790.345
EO-1 Hyperion30 m35°31′48.97″N115°23′10.20″W0.1810.1960.806
PRISMA30 m35°31′53.62″N115°23′4.73″W0.0490.0760.319
EMIT60 m35°31′49.97″N115°23′7.64″W0.0320.0590.251
Disclaimer/Publisher’s Note: The statements, opinions and data contained in all publications are solely those of the individual author(s) and contributor(s) and not of MDPI and/or the editor(s). MDPI and/or the editor(s) disclaim responsibility for any injury to people or property resulting from any ideas, methods, instructions or products referred to in the content.