Article

Radar Signal Sorting Method with Mimetic Image Mapping Based on Antenna Scan Pattern via SOLOv2 Network

1
College of Information and Communication Engineering, Harbin Engineering University, Harbin 150001, China
2
Key Laboratory of Advanced Marine Communication and Information Technology, Ministry of Industry and Information Technology, Harbin 150001, China
*
Author to whom correspondence should be addressed.
Remote Sens. 2024, 16(24), 4639; https://doi.org/10.3390/rs16244639
Submission received: 26 October 2024 / Revised: 29 November 2024 / Accepted: 8 December 2024 / Published: 11 December 2024

Abstract

:
Aiming at the problems, in which the traditional radar signal sorting method has high requirements for manual experience and poor adaptability, and considering the differences in received power caused by radar beam scanning under long-term observation, an end-to-end signal sorting method based on the instance segmentation network SOLOv2 and using an antenna scan pattern (ASP) is proposed in this letter. Firstly, the interleaved pulse sequences of multiple radar signals with various inter-pulse modulation types, scan patterns, and gain patterns are simulated, mimetic image mapping is constructed to visualize the interleaved pulse sequences as mimetic point graphs, and the index relationship between pulses and pixel points is recorded. Subsequently, the SOLOv2 instance segmentation network is used to segment the mimetic point graph at the pixel level, thereby clustering the discrete pixel points in the image. Finally, based on the index relationship recorded during the construction of the mimetic image mapping, the clustering results of points in the image are traced back to the clustering of pulses, achieving end-to-end intelligent radar signal sorting. Through simulation experiments, it was verified that, compared with YOLOv8-based, U-Net-based, and traditional signal sorting methods, the sorting accuracy of the proposed method increased by 9.26%, 11.17%, and 24.55% in the scenario of five signals with 30% missing pulse ratio (MPR), and increased by 13.33%, 18.88%, and 23.94% in the scenario of five signals with 30% spurious pulse ratio (SPR), respectively. The results show that by introducing the stable parameter, namely ASP, the proposed method can achieve signal sorting with highly overlapping parameters and adapt to non-ideal conditions with measurement errors, missing pulses, and spurious pulses.

1. Introduction

In electronic support measurement (ESM) systems, pulse deinterleaving is an important step in intercepting and analyzing radar signals from non-cooperating parties in order to provide basic support [1,2]. Through pulse deinterleaving processing (i.e., radar signal sorting), densely interleaved pulse sequences are clustered, according to different radar individuals, to distinguish different emitters for subsequent identification, positioning, tracking, interference, and other measures. With the advent of the scientific information age, the electromagnetic environment has become increasingly complex, posing greater challenges to radar signal sorting. Traditional radar signal sorting follows the pattern of pre-sorting and main sorting, and the front and rear structures are mutually constrained, resulting in a lack of flexibility. The method relies on the characteristics of inter-pulse modulation types and requires manual setting of threshold parameters, making it difficult to adapt to complex and changing modulation types. Radar signal sorting (RSS) is mainly based on pulse description word (PDW), consisting of time of arrival (TOA), direction of arrival (DOA), carrier frequency (CF), pulse amplitude (PA), and pulse width (PW). Among these parameters, DOA is rarely considered due to its difficulty in accurately obtaining broadband systems. However, with the development of multi-functional phased array radar technology, the modulation parameters (such as CF, PW, PRI, etc.) can be flexibly changed with the switching of work modes, which poses a great challenge to most current parameter-based sorting methods [3]. The current research on pulse deinterleaving can be summarized into three categories: pulse repetition interval (PRI)-based [4,5,6,7,8,9,10], clustering-based [11,12,13,14,15,16,17], and neural network-based methods [18,19,20,21,22,23,24,25,26].
As the most important parameter, PRI-based methods have made significant progress. Sequential difference histogram (SDIF) is a classic algorithm for estimating possible PRI values, but it requires setting thresholds based on experience and cannot adapt to conditions of missing or spurious pulses [4,5]. In order to solve the difficulties of pulse jitter and parameters missing in the deinterleaving of multiple radar pulses, ref. [8] proposed a recursive deinterleaving method based on blind signal separation and deep learning. The method can accurately predict the number of radar transmitters and adapt to scenarios with unknown PRI values. To improve the performance of PRI deinterleaving, a directed acyclic graph-based search method was proposed to transform a pulse search into a problem of extracting the longest path [9]. For the deinterleaving of the short and missing interleaved pulse stream, a pulse deinterleaving method based on the extended Farey dictionary and improved generalized orthogonal matching pursuit (igOMP) was proposed [10]. However, the deinterleaving of PRI heavily relies on the measurement accuracy of TOA, and, as a result, the pulse modulation type becomes increasingly unknown and complex, so sorting based solely on a single parameter is limited.
In addition, the clustering-based deinterleaving follows machine learning methods, which use multidimensional parameters to increase the accuracy and stability of signal sorting, including k-means clustering [11], density peak clustering [12,13], incremental clustering [14], and self-supervised clustering [15]. To investigate methods suitable for pulse-to-pulse incremental deinterleaving, Scholl et al. [14] proposed three deinterleaving algorithms based on incremental DBSCAN, leader approach, and fuzzy adaptive resonance theory (FART) in order to adapt to application scenarios with faster reaction times for new emitters. In order to solve the problem of unsupervised clustering methods, which occupy a large amount of computation, and supervised classification methods, which require numerous labeled samples, Dai et al. [15] proposed a signal sorting method for synthetic aperture radar (SAR) based on self-supervised clustering. Clustering-based methods tend to be adaptive and not limited to prior knowledge, but the reduced similarity of radar signal parameters remains a challenge with increasing pulse stream density. In addition, simultaneous position estimation and pulse deinterleaving were also investigated, and the performance of subsequent pulse deinterleaving could be improved by combining the estimated positions [16,17].
With the development of deep learning technology, numerous pulse deinterleaving methods based on neural networks have emerged, which include autoencoder [18], semantic segmentation [19,20,22], object detection [21,23], recurrent neural network [24], graph convolutional network [25], and transformer model [26]. To overcome the challenges brought by inaccurate pre-sorting to the subsequent main sorting process, Wan et al. [21] constructed a scenario involving an unmanned aerial vehicle (UAV) swarm in order to monitor reconnaissance areas and proposed a new signal-sorting method based on deep transfer learning. By collecting more complete signal pulses in the time and space domains through a UAV swarm, the problem of missing and interference pulses at the receiver can be reduced, thereby improving the accuracy of signal sorting. In order to improve the performance of signal sorting in complex and variable electromagnetic environments, a semi-supervised learning-based pulse deinterleaving method using a residual graph convolutional network (ResGCN-RSS) was proposed, which effectively enhances the ability of signal sorting models in small sample scenarios [25]. Liu et al. [26] proposed a method based on a modulation-hypothesis-augmented Transformer model, which utilizes a single PDW parameter for end-to-end pulse deinterleaving. The method adopted a novel multi-parameter embedding method, which extends the discriminative features of the signal and improves the accuracy of signal sorting. Most of these methods focus on TOA single information, time-frequency information, or CF-PW information. However, these parameters have parameter agility, making it increasingly urgent to explore signal sorting methods from a new perspective.
Due to the differences in PA envelope generated by different antenna scan patterns (ASPs) and spatial positions and the regularity of beam scanning of the same emitter [27], some methods use pulse amplitude parameters for deinterleaving. An unsupervised, underdetermined blind source separation method based on discrete wavelet transform is proposed [28], which uses pulse amplitude for signal sorting. The algorithm requires manually setting threshold parameters and lacks generalization. And the deinterleaving of signals with multiple different radar scan types and side lobe signals still needs to be studied. Ref. [29] proposes a deinterleaving method for mechanical-scanning radar signals based on PRI and PA parameters. But there is no discussion on the deinterleaving of signals with different radar antenna radiation patterns and PRI modulation modes. An object detection-based signal sorting method utilizes amplitude patterns, which are caused by radar beam motions, to deinterleave MFR signals [30]. However, the method only detects the approximate positions of points belonging to the object in the image and does not provide the specific emitter category to which each pulse belongs.
Considering the outstanding ability of instance segmentation networks to segment the same object and distinguish different objects [31,32,33,34], and inspired by deep clustering algorithms in other fields [35,36], the PA envelope over time is visualized as a two-dimensional (2D) mimetic image, and then pixel-level deep clustering is performed to complete RSS. This letter proposes an end-to-end pulse deinterleaving method using an antenna scan pattern based on an instance segmentation network, which improves the performance of RSS in highly overlapping parameter scenarios as evidenced by long-term observations. Each feature point in the mimetic image represents a radar pulse, and the pulse stream is separated into multiple independent radar emitter categories by segmenting the image. The characteristics of differences in scanning modes among different emitters in long-term observation can be used to deinterleave the pulse stream. The framework of the proposed method is shown in Figure 1. A mimetic point graph is, firstly, constructed from interleaved radar pulse sequences based on mimetic image mapping, and the mapping index is recorded. Then, the SOLOv2 network [32] is used to perform instance segmentation on discrete points in the mimetic image. Finally, the pulse flow is deinterleaved by the mapping index. The simulation was conducted in non-ideal environments such as overlapping parameters, measurement errors, missing pulses, and spurious pulses, and the results verified the effectiveness of the proposed method.
The main contributions of this letter can be summarized as follows:
1.
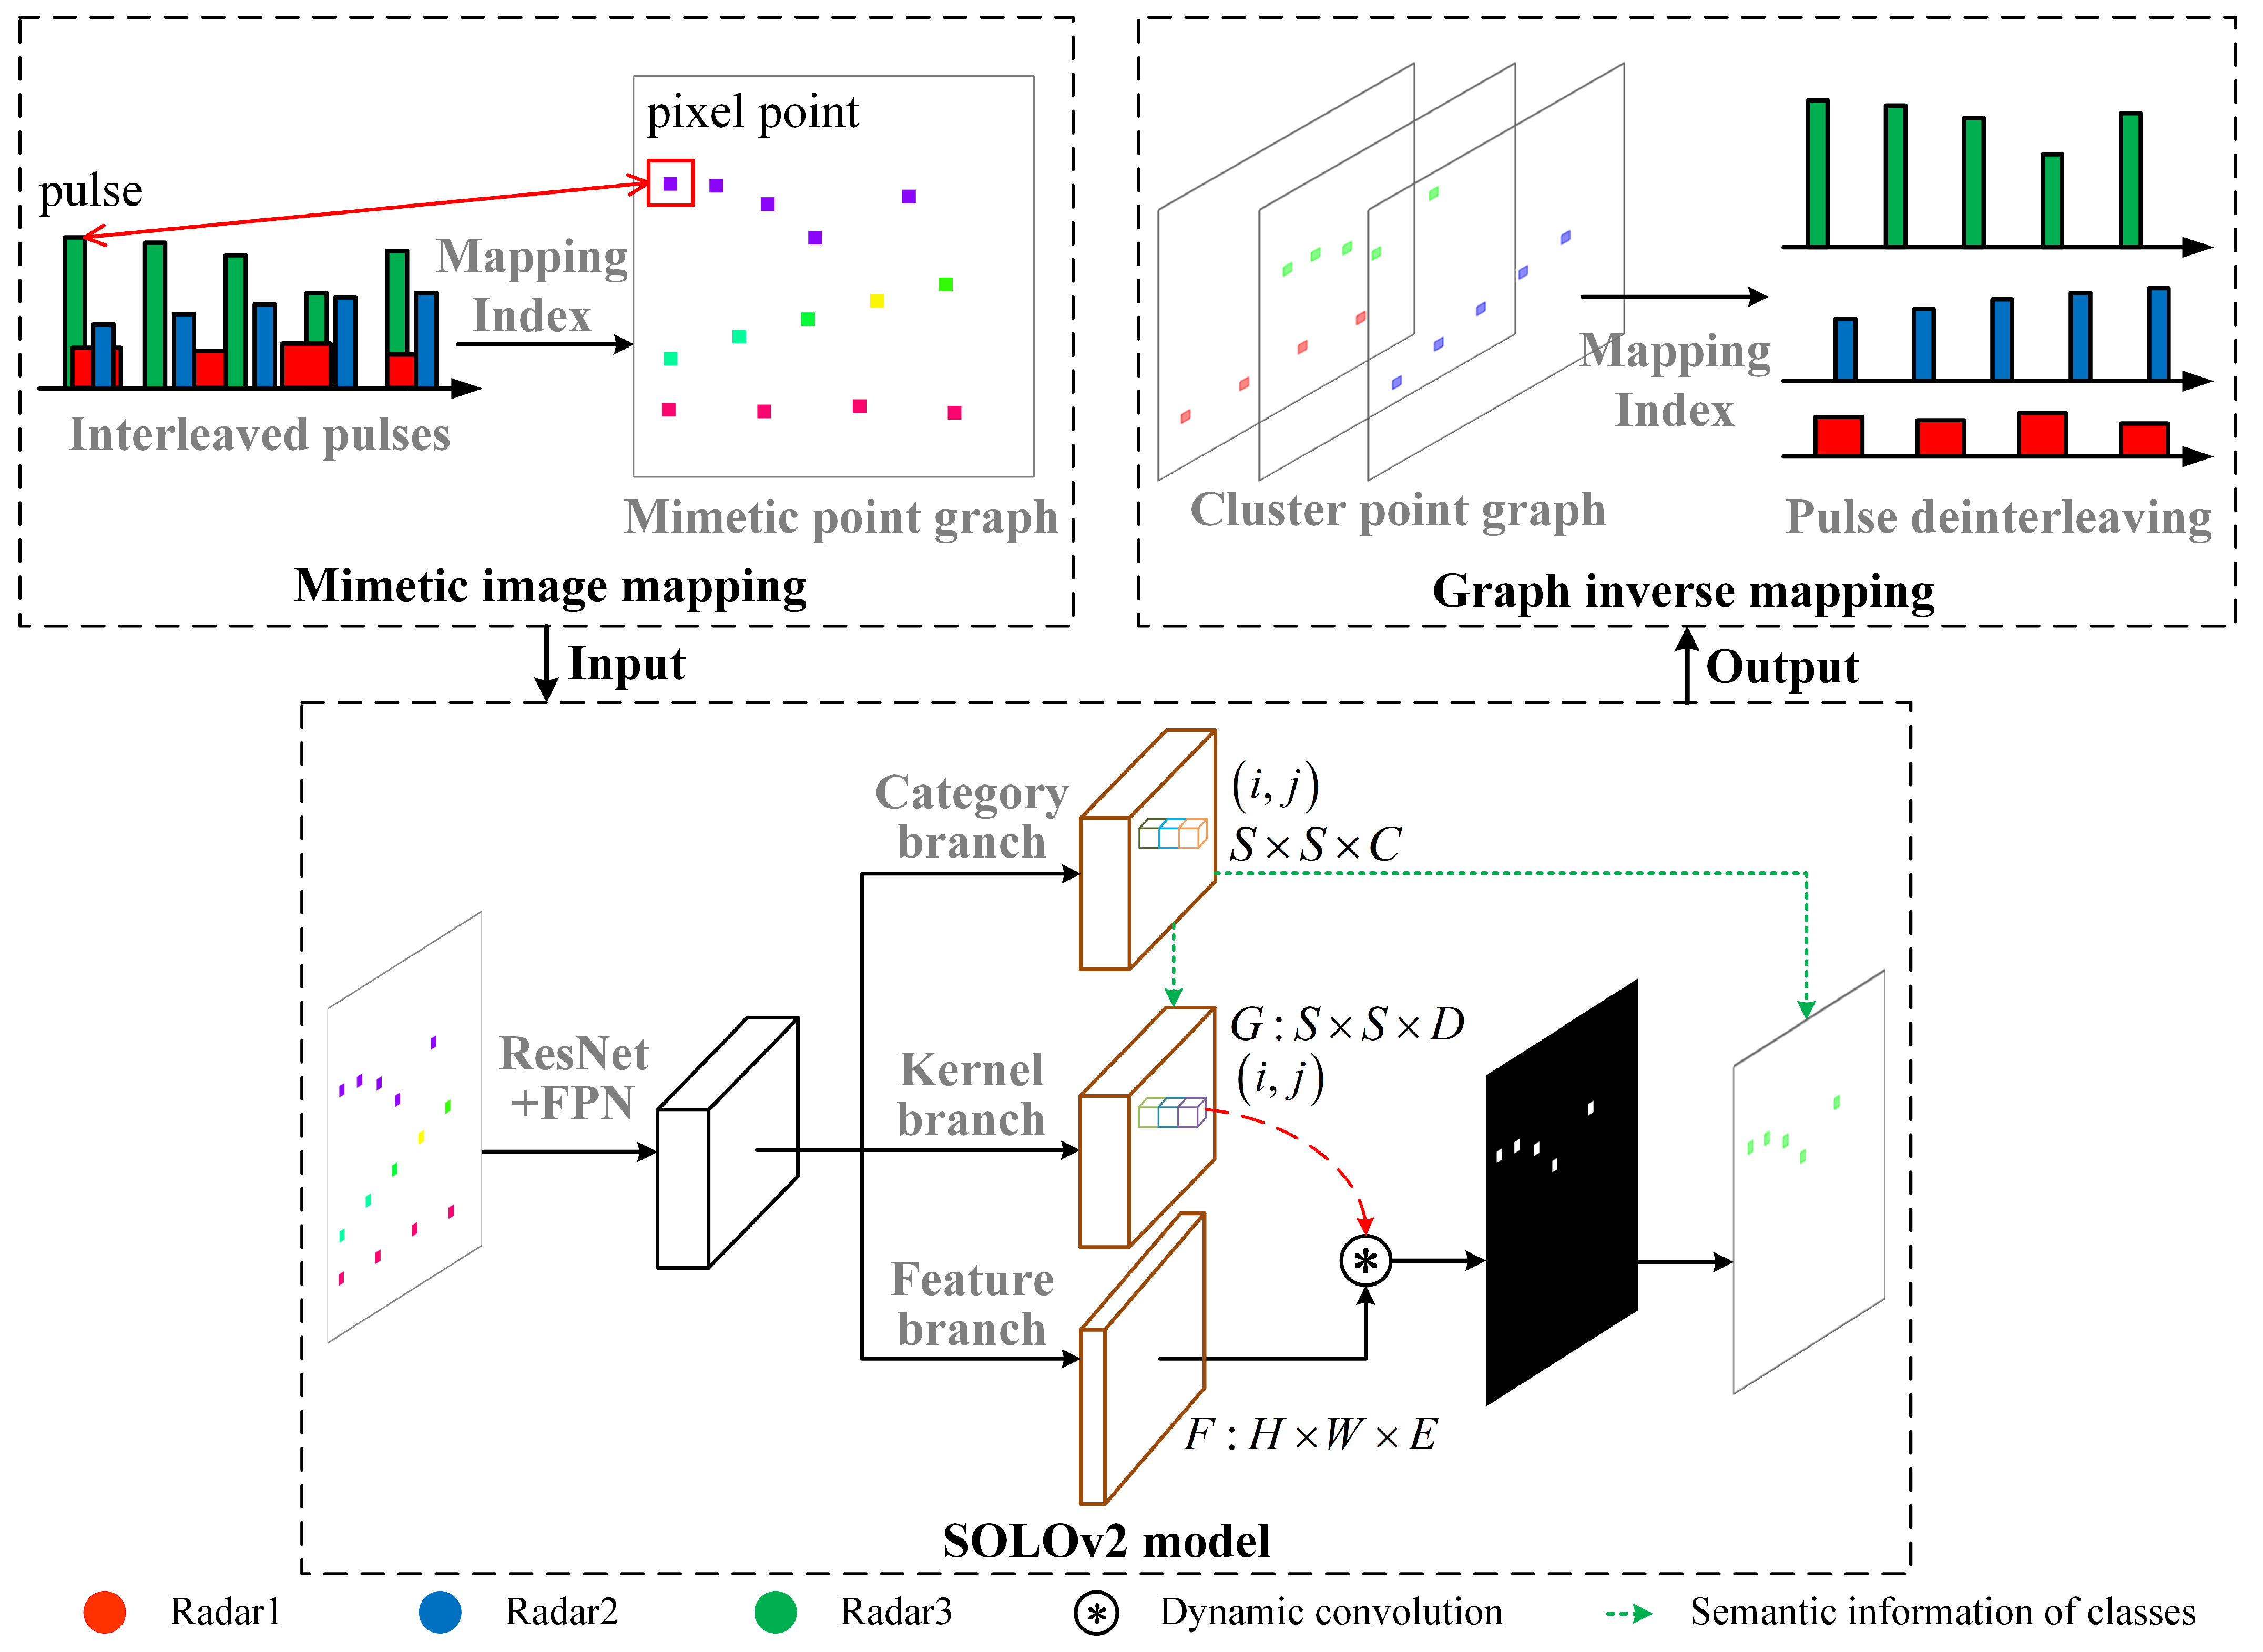
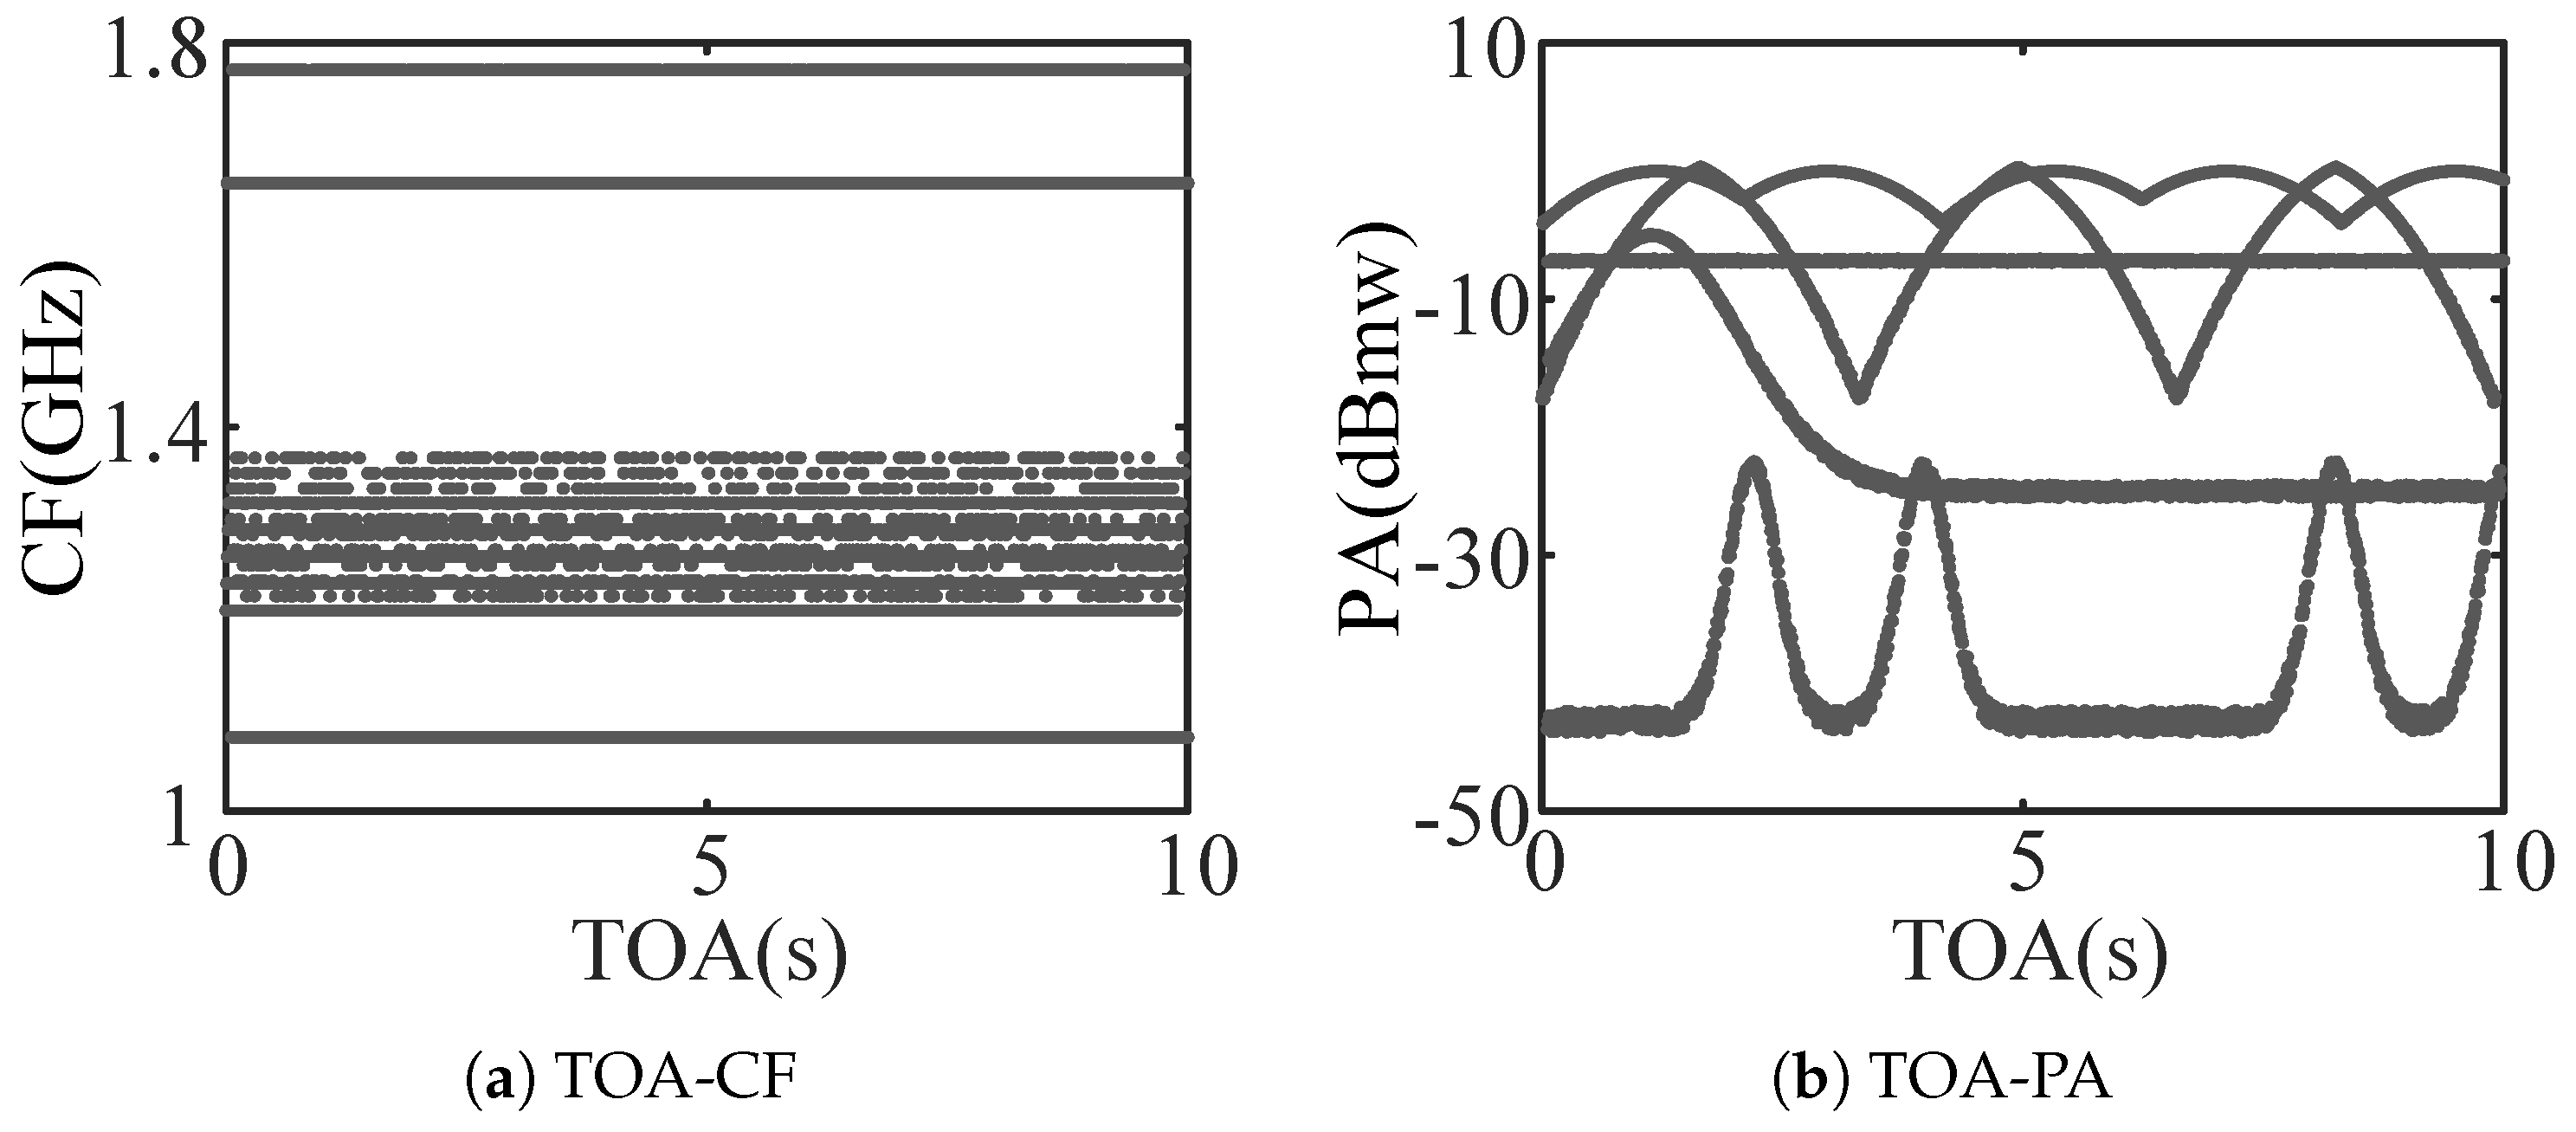
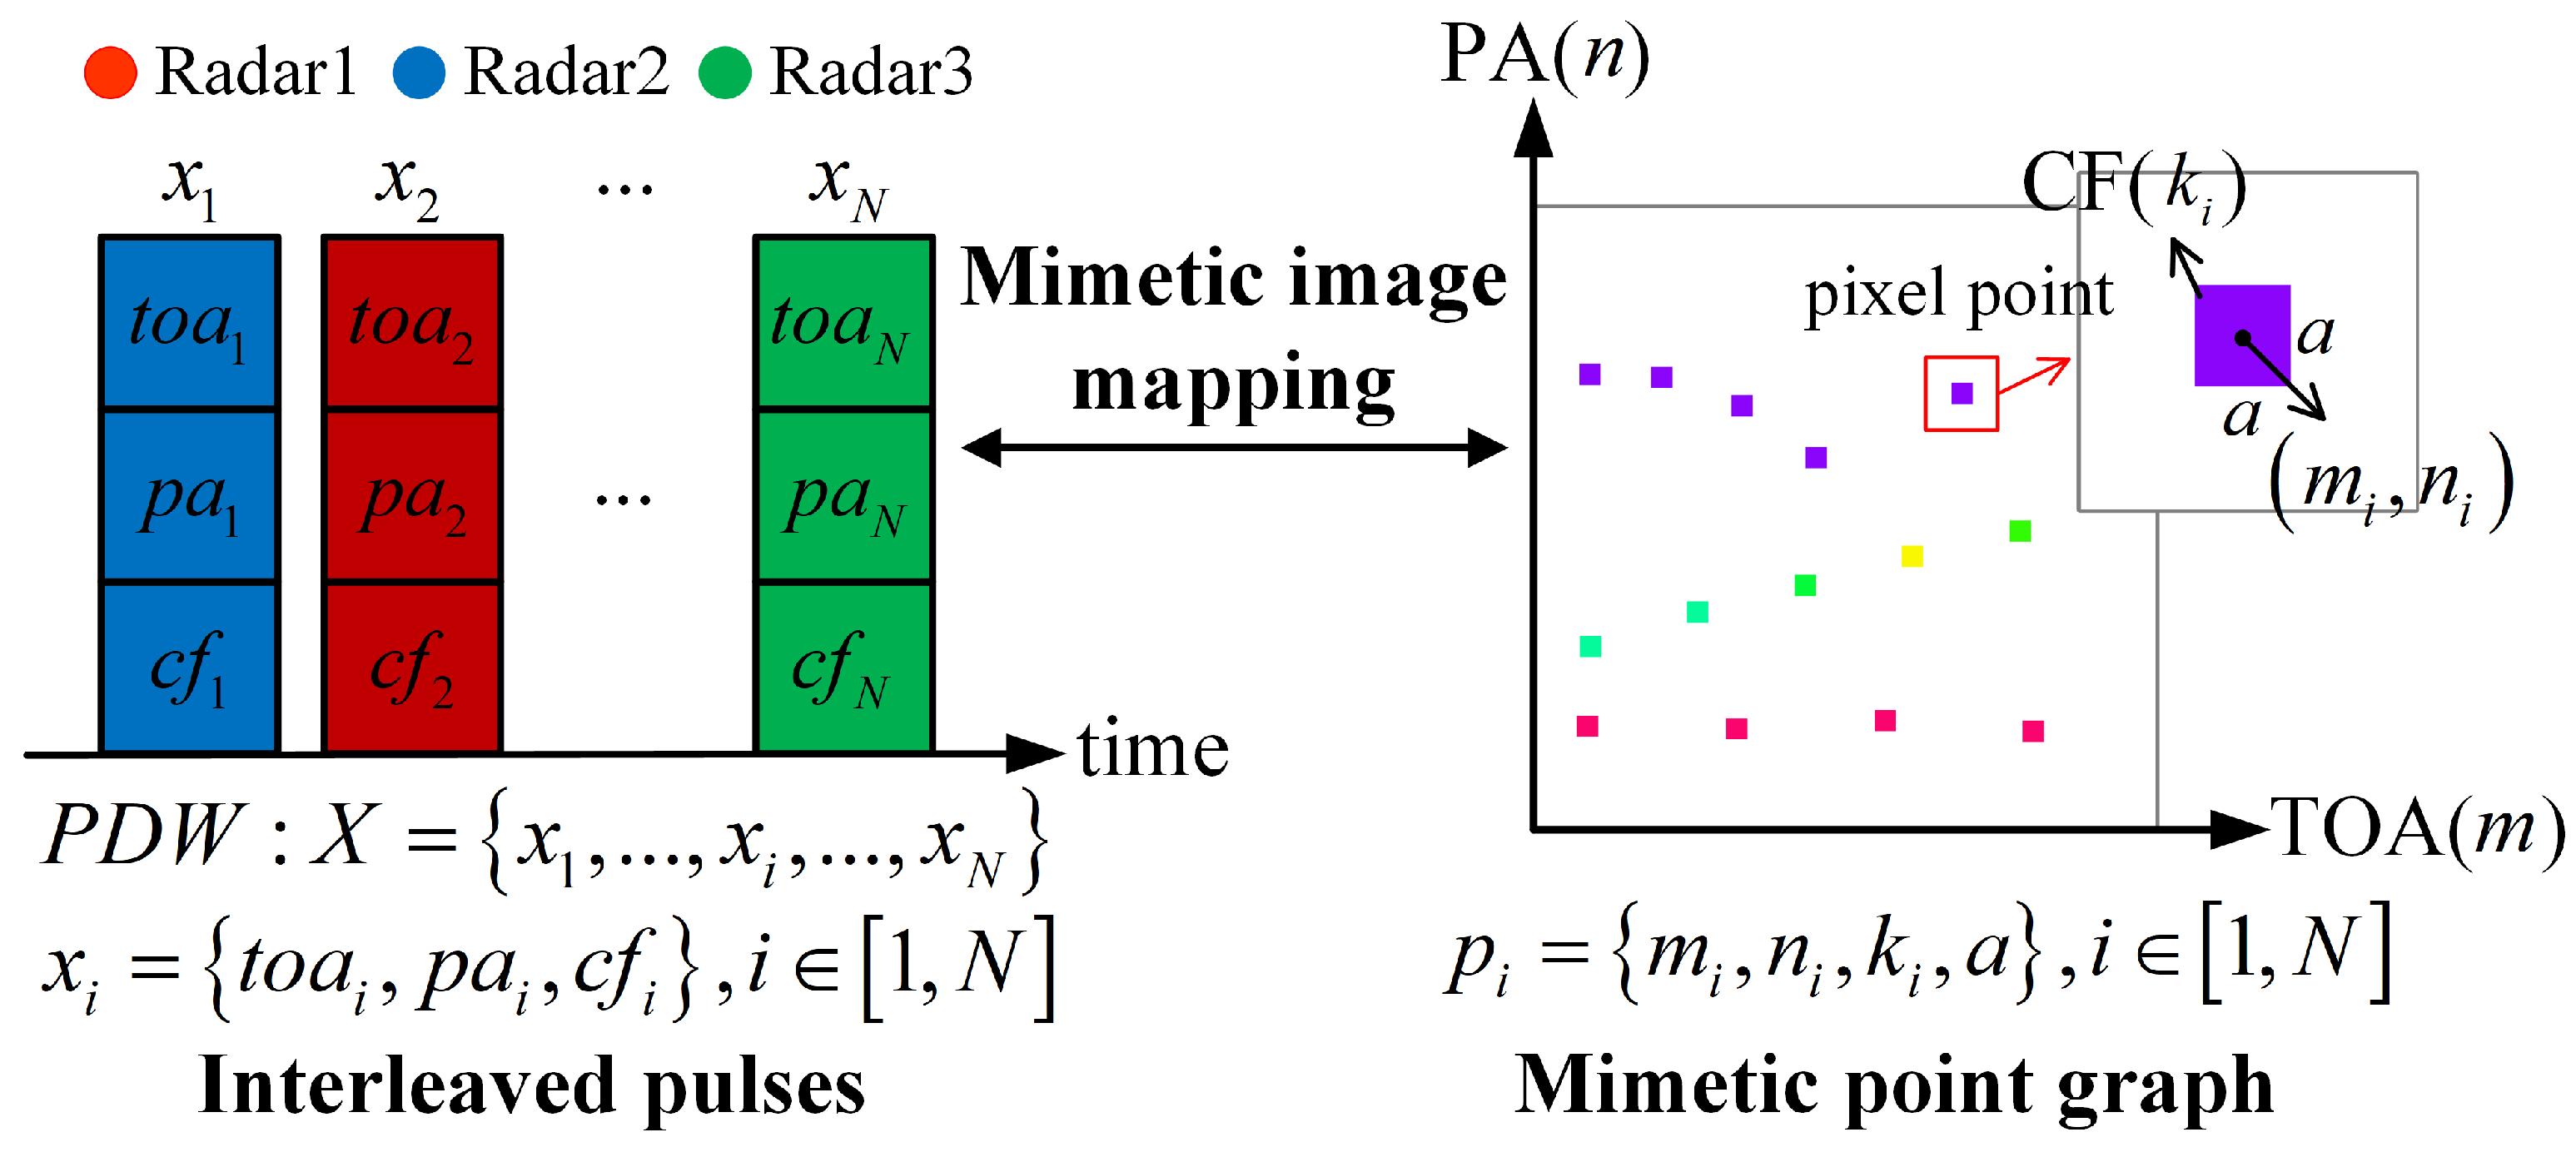
To globally visualize the changes in PA over the long term, mimetic image mapping, which simulates human vision, is utilized to map PDW to a mimetic point graph (i.e., 2D image). Moreover, the index is reversible.
2.
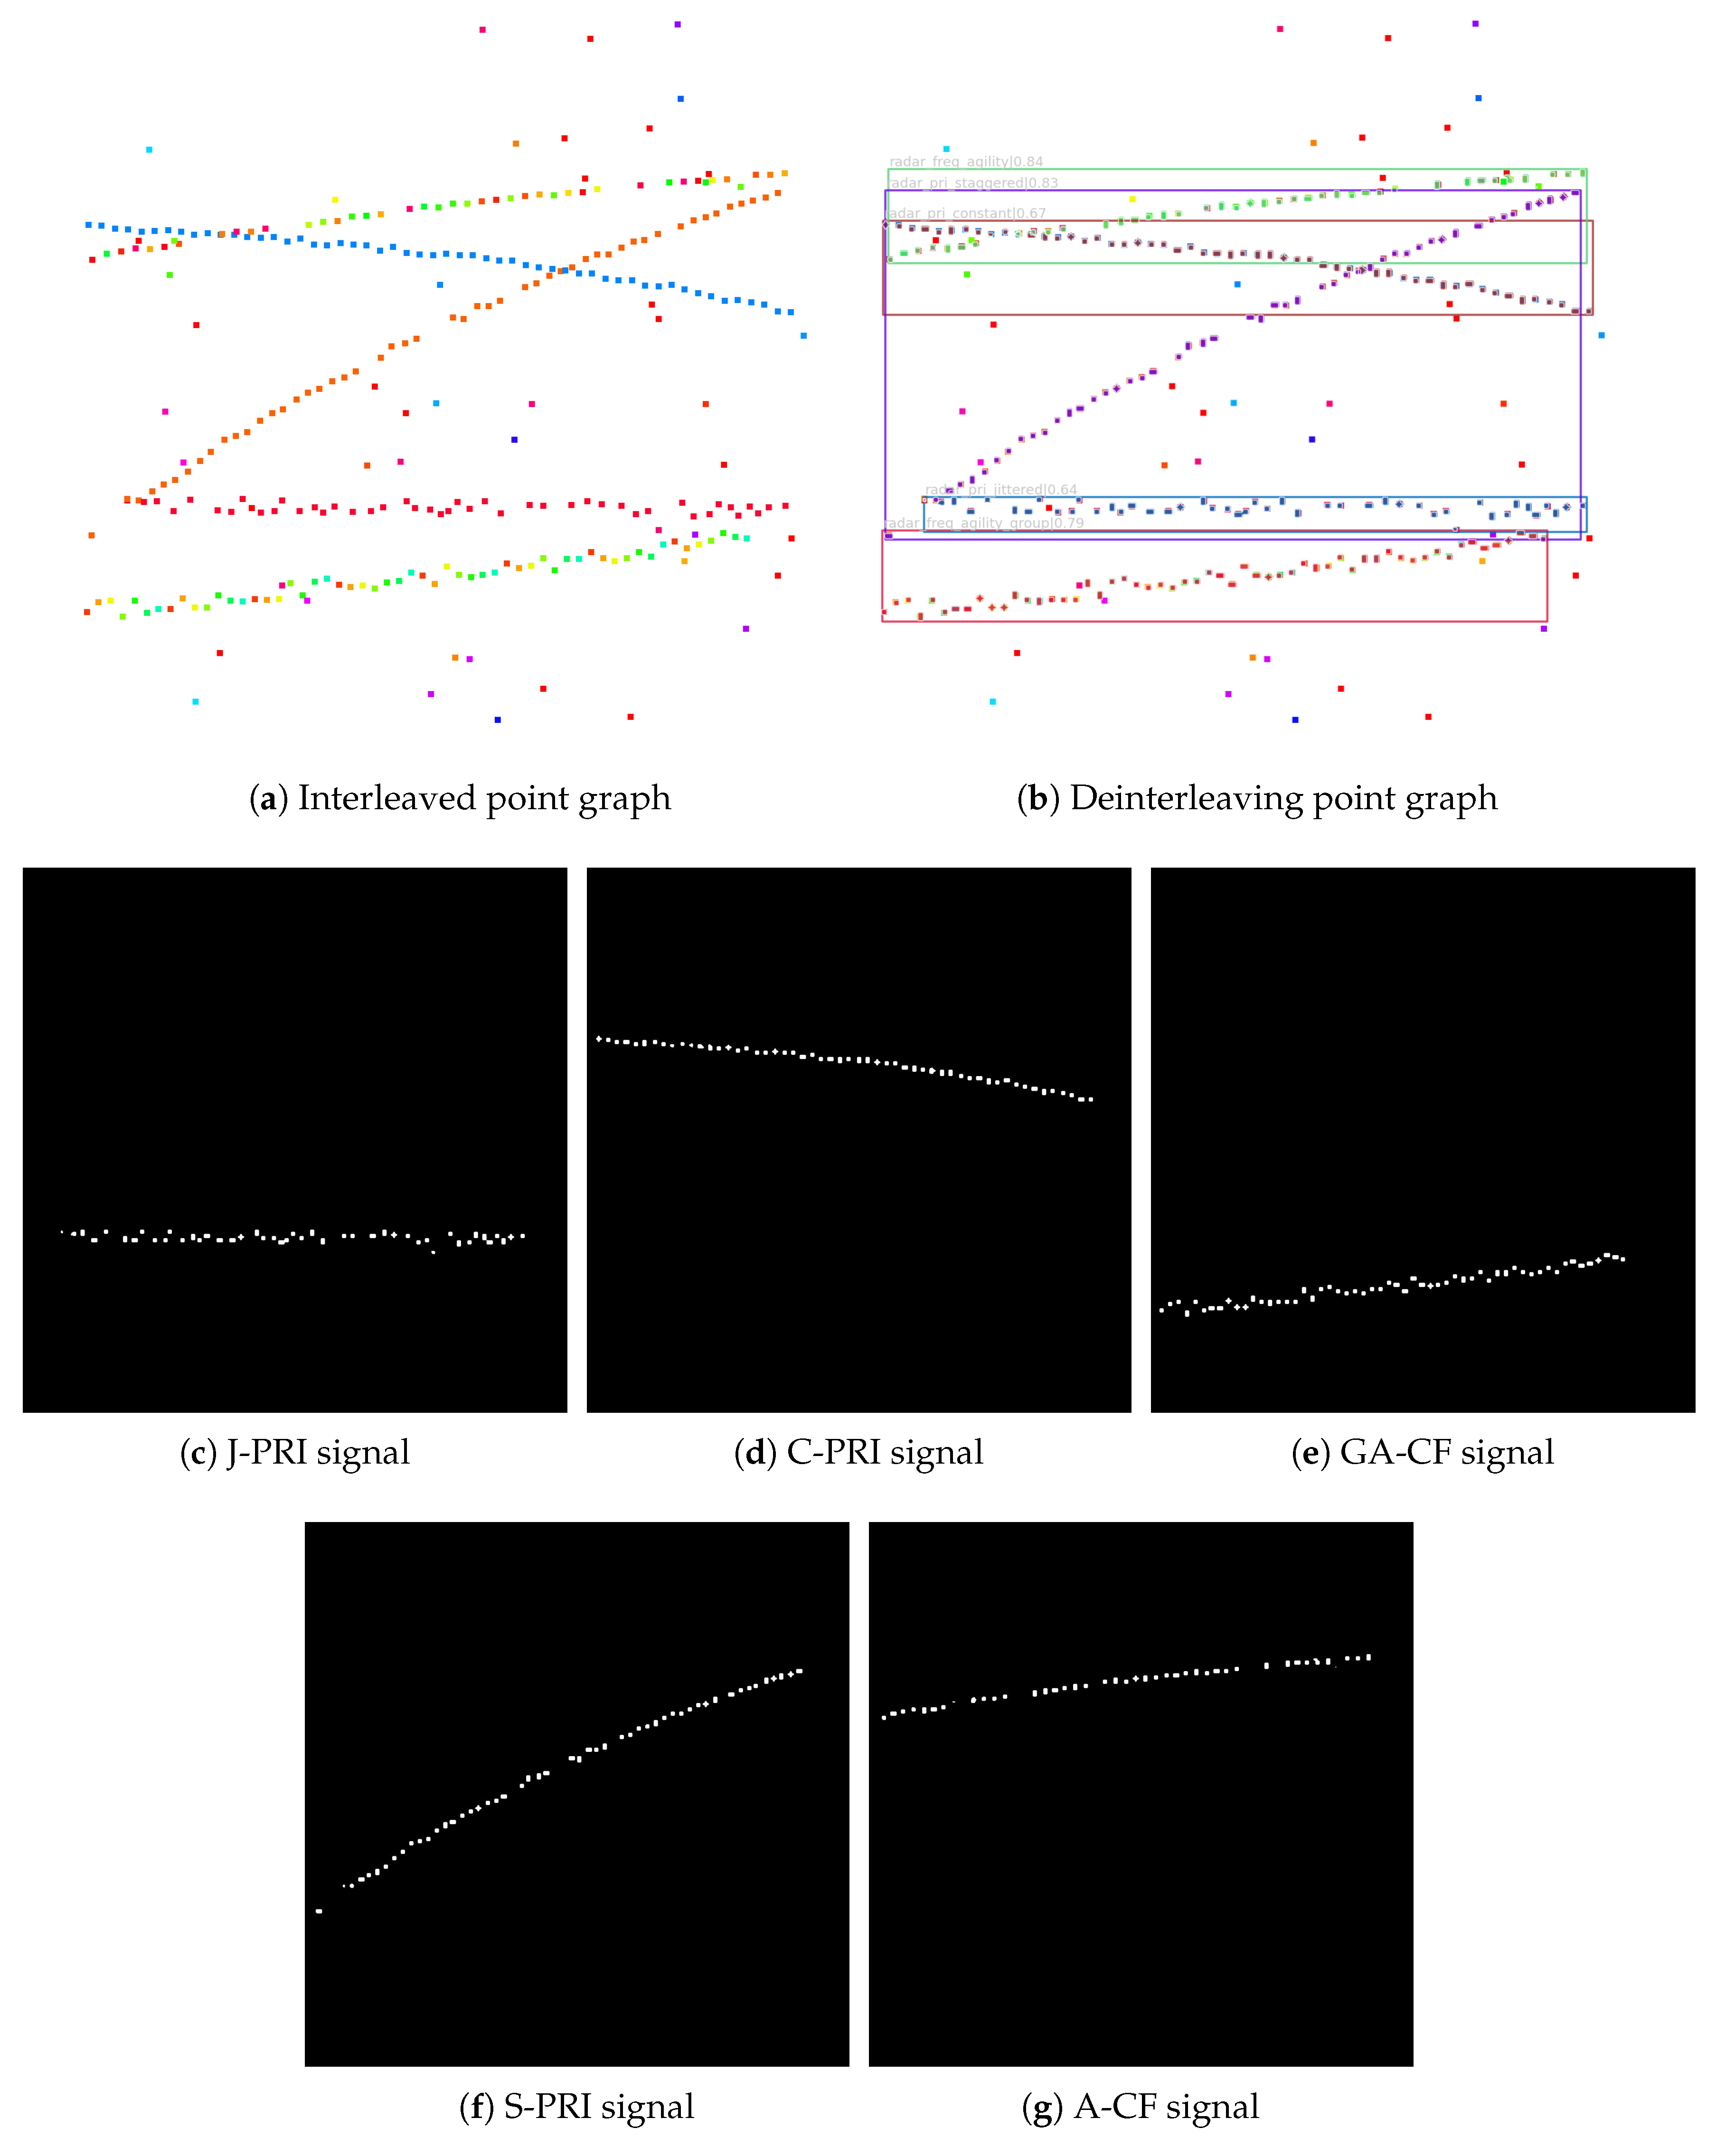
Starting from a new perspective of antenna scan pattern, pulse deinterleaving can be achieved through instance segmentation of point images, which can automatically divide pulses with almost identical parameters (such as CF) from different emitters into different groups, thereby alleviating the problem of “parameter overlap”.

2. Methodology

2.1. Problem Formulation

Generally, X = x 1 , , x i , , x N R N × d can be used to represent the interleaved radar pulse sequence, where x i R d × 1 denotes parameters for each pulse, d is the dimension of a parameter vector, N is the number of radar pulses. CF and PW, as commonly used sorting parameters, have obvious patterns with changes in modulation methods but are also easily changed. As a stable parameter, DOA needs to be obtained through collaborative detection and analysis by multiple receivers. Therefore, a new parameter antenna scan pattern from the power domain for pulse deinterleaving should be added to alleviate the difficulty of sorting using conventional parameters. The parameter is determined by the envelope of the received signal power over time, and the amplitude combines the characteristics of the radar signal in terms of time, frequency, and spatial domain.
Due to the mature development of deep segmentation algorithms in the field of image vision, the method visualizes antenna scan pattern as the mimetic image. In order to connect the PDW data with a two-dimensional point graph, the set P = p 1 , , p i , , p N R N × r is constructed to represent the pixels of the graph, where r represents the dimensions of pixel features, such as the coordinate, color, and size.
Therefore, pulse deinterleaving is transformed into the problem of pixel segmentation by constructing a reversible relationship between the set X and P, which can be expressed as follows:
Y = g θ f X
where P = f X is the set of pixels after reversible mapping of pulse parameters, f(·) is the mimetic image mapping transformation. Y R M × l × t is the output of the segmentation network, i.e., the result of signal sorting, M is the number of sorted radar signals, l is the pulse number, t denotes the mask coordinates and category, and g θ (·) represents the potential parameters of the model.

2.2. Mimetic Image Mapping Construction Based on ASP

The visualization of PDW with different parameter dimensions is shown in Figure 2. Human vision can easily capture the relationship between radar signal pulses from different emitters through PA envelope changes in Figure 2b, but the pattern is very ambiguous in the CF parameter. The method utilizes the antenna scan pattern for signal sorting, and therefore mainly uses TOA and PA as mimetic mapping parameters. Considering that TOA and CF are the main inter-pulse modulation parameters, TOA and CF parameters are added to represent the characteristics of time-frequency domain changes. In a two-dimensional image, the position of points can contain two-dimensional information, while the color of points in RGB or HSV color space can contain three-dimensional information. In this paper, TOA and PA are used to represent the position of points, and CF is used to represent the hue of points. However, the mapping relationship between PDW and images is not absolute. If PW and DOA are additionally used for signal sorting, they can be mapped to the other two channels of color. The process of PDW visualization mapping can be understood as normalizing PDW data to the parameter range of the image and storing the data in the form of an image for subsequent network processing. As shown in Figure 3, the mimetic image mapping establishes a one-to-one relationship between radar pulses and image pixel points. The mimetic image mapping is proposed to visualize PDW as a 2D mimetic image, thereby achieving pulse-pixel point correspondence, and deep segmentation clustering is performed to learn the processing method of human vision.
Specifically, in order to effectively perform mimetic mapping based on antenna scan pattern, the PDW directly corresponds to the row coordinate, column coordinate, and color of the pixel point. To enlarge the trend change in received amplitude over time, TOA and PA are used to correspond to the column and row coordinates of the point center separately, simultaneously using CF corresponding to the point color. In order to simplify the correspondence between CF and the point color, the two-dimensional mimetic image adopts the HSV color space. In the HSV color space, CF corresponds to the H parameter, and S and V are set to fixed values. The radar PDW parameters are normalized to the image parameters based on certain transformation coefficients. The transformation coefficients can be calculated based on the ranges of mapping parameters (TOA, PA, and CF) and the intervals of image size and color. The specific formulas for the transformation coefficients corresponding to TOA, PA, and CF are calculated as follows:
α = w t o a m a x t o a m i n β = h p a m a x p a m i n γ = H m a x c f m a x c f m i n
According to fixed scale coefficients, PDW parameters can be plotted as different points in the image to complete the transformation of the information domain. Mimetic image mapping between radar parameters and pixel point parameters is reversible, which can be represented as follows:
m i , n i , k i = i n t α · t o a i t o a m i n , β · p a i p a m i n , γ · c f i c f m i n
where t o a m i n , t o a m a x , p a m i n , p a m a x and c f m i n , c f m a x respectively represent the interval ranges of received TOA, PA, and CF parameters. w , h is the size of the mimetic image, H m a x is equal to 255. Equation (3) describes the mapping index between the points and pulses. m i , n i , k i denotes the column coordinate, row coordinate and hue of the i-th point, t o a i , p a i and c f i represent the TOA, PA and CF values of the i-th pulse.
By using a reversible transformation, Equation (3), the mimetic mapping maps each pulse in the interleaved pulse sequence to a point in the mimetic graph. The mimetic image mapping index table is shown in Table 1. In theory, each pulse in the interleaved pulse flow corresponds to a point in the mimetic image. However, due to the limitations of fixed image resolution and similar radar parameter values, multiple pulses may correspond to one point in the experiment. For example, ( m 2 , n 2 ) corresponds to two pulses (i.e., x 2 and x 3 ) in Table 1. A single pixel point mapped to multiple pulses can only carry the CF of one of the pulses. When performing mimetic image mapping, pixel points are drawn one by one in the mimetic image according to the ascending order of TOA. The point ( m 2 , n 2 ) mapped to two pulses should take the CF value with the larger TOA value in x 2 and x 3 . The case where multiple pulses correspond to one point is rare, so L is slightly smaller than N.
The selection of fixed values for pixel point size and image size in mimetic image mapping is worth considering. The resolution of the mimetic image determines the TOA and PA precision represented by column and row coordinates. When the sampling time and PA range are fixed, a larger image size can carry higher TOA and PA precision, thereby achieving more accurate sorting results. However, with a TOA resolution of 10 ns and a sampling time of 0.5 s, the image size can reach up to 50 million. At present, the image segmentation network is unable to process such large images. And there are fewer effective pixels (i.e., pixels corresponding to signal pulses) in excessively large images, which increases redundant information. As for the selection of pixel point size, considering the difficulty of instance segmentation networks in segmenting small-sized objects and the discreteness of pulse points from the same emitter in the mapped image, the pixel point size (i.e., a × a ) of 1 × 1 is very challenging. Smaller values prevent successful segmentation of pixels, while larger values result in overlapping points in the image. When the point size, TOA accuracy, and PA accuracy are fixed, higher-resolution images contain more signal pulses, resulting in more obvious patterns of pulse parameters. Based on multiple attempts and experiences, the image size (i.e., w and h) is set to 1024 and the pixel point size (i.e., a) is set to 8 in the paper.
The proposed mimetic point graph contains features of the antenna scan pattern, so the selection of sampling time is crucial. Due to the fixed size of the mimetic point graph, excessive sampling time can lead to severe pixel overlap and increased computational complexity. However, if the sampling time is too small, the amplitude pattern caused by antenna scanning is not obvious, which cannot reflect the superiority of the proposed method under long-term observation. Therefore, the values of sampling time and antenna scan period should be of the same order of magnitude. In this paper, the antenna scan period is set to 2∼7 s, and the sampling time is set to 0.5 s.

2.3. Single-Stage-Based Instance Segmentation Network

Mimetic image mapping establishes the connection between interleaved pulse sequences and mimetic point graphs, thereby transforming pulse clustering into pixel-level segmentation, i.e., instance segmentation. The single-stage instance segmentation network adopts an end-to-end structure, directly segmenting instances while improving inference speed. Considering the discrete points of the same signal and the overlapping areas of different signals in the mimetic image, SOLOv2 [32] network (a classic single-stage method) is used for deep segmentation. The SOLOv2 network framework is shown in Figure 1.
The SOLOv2 network follows the viewpoint of ‘segmenting objects by locations’ [33]. Compared to SOLO, SOLOv2 is more simplified and effective by only predicting dynamic conv kernel and sharing public features. It divides the input image into a uniform grids of S × S size, and the grid that contains the center of the object is responsible for predicting the semantic category and segmenting the object instance. The network is mainly composed of a feature extraction module, category branch, and mask branch. The feature extraction module utilizes ResNet and FPN networks to extract multi-scale features of the mimetic point graph. For each grid cell, the category branch predicts a C-dimensional output, indicating the semantic class probabilities of the object located at the grid. The output shape in the category branch is S × S × C , where C is the number of classes. For example, the center of the upper signal (i.e., radar 3) in the input image falls into the i , j position in the grid, and the predicted category obtained in the C-class channels belongs to the foreground. SOLOv2 optimizes the original mask branch into the kernel branch and feature branch. The principles of these two branches can be written in the following form:
M i , j = G i , j F
where the G i , j R 1 × 1 × E is the conv kernel in the kernel branch, the F R H × W × E is the shared feature in the feature branch, and the M i , j R H × W is the mask containing only one instance whose center is at location i , j . The shape of G is S × S × E , which means that the corresponding convolution kernel for each grid cell is used to generate a mask for the object centered on that grid. In this way, the model outputs a mask for a certain instance only when predicting different convolutional kernel weights for the corresponding object is needed.
The category branch and mask branch are connected by the position of grid cells. The output of the category branch can predict the semantic classes of objects corresponding to different grids. If the grid is predicted as a signal class, the mask of the object is obtained by dynamically convolving the G and F generated by kernel and feature branches. And redundant masks are removed through matrix non-maximum suppression (NMS). The final output of the network is binary masks of different instances, and the semantic class of the instance is obtained in the category branch.
The output of the SOLOv2 network is a multi-channel binary mask, with each channel corresponding to an object instance. Figure 4 shows an example of a typical simulated signal sample processed by the SOLOv2 network. In Figure 4a, the input mimetic point graph contains five radar signals, and the corresponding output is a five-channel mask (i.e., Figure 4c–g). As shown in Figure 4b, the predicted multi-channel mask is plotted on the input image, and the modulation type (i.e., C-PRI, S-PRI, J-PRI, A-CF, and GA-CF) of each signal is identified based on the predicted semantic class.

2.4. Pulse Clustering via Graph Inverse Mapping

By segmenting independent pixel points in the mimetic point graph, the clustering results of points can be obtained. Then, based on the mapping index recorded in the mimetic mapping, pulse deinterleaving can be completed. We expect to match pulses and points one-on-one. However, in actual data, the fixed resolution of images cannot adapt to changes in sampling time, resulting in insufficient time resolution or severe overlap of pixel parameters. These reasons may lead to different pulses being mapped to the same point.
To address the limitations of image mapping, a post-processing method of parameter matching is adopted. The steps of the method can be summarized as follows:
1.
Based on the pulse-pixel point mapping index relationship recorded during the construction of the mimetic image mapping (as shown in Table 1), determine whether each pixel point corresponds to multiple pulses or one pulse.
2.
Return the segmentation results of the points mapped by one pulse to the pulse clustering based on the mapping index. And count the parameters of each pulse in the clustering group to obtain the parameter range of each group, i.e., C F m i n , C F m a x and P W m i n , P W m a x . Since most pulses and points are one-on-one, pulse clustering is basically completed at this point. However, there are remaining pulses that are not clustered.
3.
Solve the situation where multiple pulses correspond to one point and unclassified pulses correspond to one point. Compare the multiple pulses corresponding to the same point and the remaining pulses corresponding to one point with the parameter range of the successfully sorted group one by one. If the CF and PW of a pulse are both within the parameter range of the group, then the pulse is assigned to the group. Until all remaining pulses undergo parameter matching once.

3. Experiments and Results

3.1. Experimental Setup

The experiments are conducted on Ubuntu 18.04.6 LTS with Intel® Xeon® Gold 6226R CPU (2.90 GHz) (Intel, Santa Clara, CA, USA), NVIDIA A10 (NVIDIA, Santa Clara, CA, USA), and RAM (64.0 GB). To verify the performance of the proposed method, a simulated dataset with a sampling time of 500ms is randomly generated according to Table 2. In the construction of the simulation dataset, potential parameters that affect sorting performance are considered, including different modulation types, antenna scan patterns, and antenna gain patterns. By referring to the simulation inter-pulse modulation signal dataset of existing advanced sorting methods [22,37], the modulation parameter range of the method is determined, including modulation type, PRI, CF, jitter rate, and interleaved PRI number. Because antenna scan parameters can affect the received signal power, different scan parameters are added to the simulation parameters. By referring to the scanning parameters of existing excellent signal sorting and recognition methods [29,38], the reasonable range of scanning parameters is set, mainly including the scan period, main lobe width, scan pattern and antenna gain pattern. The simulated signal samples contain five inter-pulse modulation types (i.e., conventional PRI, PRI jitter, staggered PRI, frequency agility and frequency pulse group agility), and the modulation parameters and antenna scan parameters of the radar signal are randomly selected within a certain range. In order to simulate the randomness and uncertainty of non-cooperative radar signals in the real world, each signal sample contains a random number of signals and unknown simulation parameters. And the simulated samples in the training set and the testing set are not the same.
Because the power threshold of most receiver sensors can reach −50 dBmW, the threshold value is used in the method. And CF is converted to intermediate frequency through frequency conversion processing. The antenna scan patterns contain circular scan and sector scan, and the antenna gain patterns contain sinc, Gaussian, quadratic, and uniform functions. Figure 5 shows the temporal variation of amplitude envelopes formed by different antenna scan patterns and antenna gain patterns (AGPs). The schematic diagram shows that the amplitude variation has a certain regularity due to the antenna scanning process. The experimental dataset contains 10,000 image samples and is divided into the training set and the test set at 9:1. Each image sample is formed by interleaving signal pulses from randomly 1 to 5 different emitters.
For the evaluation of sorting performance, the success sorting rate (SSR) is used:
S S R i = R i T i
where R i , T i and S S R i respectively represent the number of correctly sorted and recognized signals, the sum of signals, and accuracy for the i-th modulation category. The success rate of sorting and recognition for all categories is represented by the formula S S R c l a s s = R i T i . Since signal sorting focuses more on pulse clustering rather than modulation type recognition, the total sorting accuracy formula is given, which is S S R s o r t = R T . R and T respectively represent the number of correctly deinterleaved signals and total signals, without considering the correctness of modulation type recognition.
A classic example of sorting five ideal signals with five modulation types is shown in Figure 6. In Figure 6b, the deinterleaving point graph is a visual representation of the instance mask of pixel points obtained by the SOLOv2 network, indicating that the proposed method can achieve pixel-level segmentation. And the predicted modulation type and confidence are displayed above the box of each signal. Confidence is the probability that a segmented set of pixel points belongs to this modulation type of signal. The presence of the signal can be determined by setting a confidence threshold. The confidence of the proposed method is set to 0.35. Experimental results show that when the PA parameters of the five signals partially overlap, the deinterleaving of radar pulses can be achieved.

3.2. Performance Analysis of the Proposed Algorithm in Non-Ideal Conditions

Due to the presence of missing pulses, spurious pulses, and measurement errors in the actual electromagnetic environment, the accuracy of signal sorting methods may be greatly affected. In order to verify the effectiveness and reliability of the proposed method in non-ideal environments, experimental analysis is conducted on the method under three scenarios: missing pulses, spurious pulses and the PA measurement error. The antenna scan pattern is a key sorting parameter in the proposed method, and its receiving accuracy is crucial. Therefore, the impact of PA measurement error on the performance of the proposed signal sorting method is considered. The PA measurement error is set as a percentage of the actual value, with an interval of 0.5% from 0% to 3%. The number of emitters is randomly selected from 1 to 5, with the missing pulse ratio (MPR) and spurious pulse ratio (SPR) of 0%. As shown in Figure 7a, as the PA measurement error increases, the success sorting rate (SSR) of each modulation type signal does not change much, but the overall sorting accuracy (Total-Sort) and overall recognition accuracy (Total-Class) slowly decrease. Although the PA measurement error reaches 3%, the overall sorting accuracy is higher than 96%, and the overall recognition accuracy can reach 94%.
The received radar pulses are usually missing, and some noise or interference can cause spurious pulses. Missing pulses and spurious pulses pose significant challenges to signal sorting, so they are considered. The missing pulse ratio and spurious pulse ratio in the experiment vary from 0% to 50% at 10% intervals. The number of signals ranges from 1 to 5, and the other influencing parameters are 0%. As shown in Figure 7b,c, with the increase in the SPR and MPR, the total sorting accuracy and total recognition accuracy gradually decrease, but when the SPR is 50% or the MPR is 40%, the total sorting accuracy is higher than 91%. The downward trend shows that missing pulses have a greater impact on the performance of the proposed method. Because spurious pulses are difficult to accurately interfere with the trend of PA envelope changes, but the loss of information in the signal itself is fatal.
A typical example of pulse deinterleaving for multiple signals under non-ideal conditions of spurious pulse ratio = 30%, missing pulse ratio = 30%, and PA measurement error = 3% is shown in Figure 8. Although different signals have overlapping amplitude regions and spurious pulse points are mixed with real pulse points in the mapped mimetic image, the proposed method is effective and reliable.

3.3. Generalization Analysis of the Proposed Method

In addition to non-ideal electromagnetic environment scenarios, in order to verify the generalization and scalability of the proposed method, experimental analysis is conducted on the method in untrained unknown signal scenarios. The model trained on the dataset shown in Table 2 is tested under the extremely similar CF signal sample, unknown environmental signal data and real radar data, respectively. In addition to TOA and PA parameters, the method also uses CF as an auxiliary parameter for signal sorting. Therefore, the influence of the CF parameter on the proposed method is worth analyzing. An example of a radar pulse train deinterleaving under a 20% spurious pulse ratio, 20% missing pulse ratio, and 2% PA measurement error is shown in Figure 9. As shown in Figure 9a, due to the presence of spurious and missing pulses, the pulse points severely overlap, and the PA envelope is ambiguous. From the segmentation results, it can be seen that when CF is almost the same, the method can complete signal sorting based on the mimetic trend of PA.
In addition, the model trained on simulated signal samples is used to cluster radar pulses in unknown environments. The parameter range of the unknown radar signal is different from that of the simulated dataset, and the modulation type and scan mode are unknown. In the experiment, an unknown PDW with a duration of 40 ms is intercepted, with a CF range of 1200∼9600 MHz and a PA range of −40∼−10 dBmw. Figure 10 shows that the PA characteristics of signals in the unknown environment exhibit significant jitter and regional overlap. Experimental results indicate that despite unknown and complex signal data, the model without corresponding training can still achieve accurate sorting.
Due to the large CF range and different frequency values of multiple unknown signals in the Figure 10, the proposed method is further tested in the unknown radar signal scenario with similar CF values. As shown in Figure 11, although the CF values of the unknown PDW are almost the same, the performance of signal sorting is basically not affected, further verifying that the proposed method is mainly based on the scanning characteristics of radar antennas for pulse deinterleaving.
Furthermore, in order to enhance the practical relevance of the proposed method, the training model performs signal sorting on real signal data. In the experiment, 45 ms of PDW data are intercepted for signal processing. The CF range of the signal data is 3000∼9500 MHz, and the PA range is −40∼−5 dBmw. As shown in Figure 12, the amplitude pattern of the real signal data is not completely consistent with the simulation data. Although there is a certain regularity in the amplitude of the signal pulses, the amplitude variation has stronger jitter and flexibility. And the time intervals between adjacent pulses of different signals are different, which is reflected in the sparse and dense point distribution in the mimetic image. The experimental results show that although the proposed method uses the simulated dataset for training, it can correctly cluster the real radar PDW. This indicates that the simulated dataset may have different parameter ranges from the real signal, but it can help the model learn the potential variation patterns of parameters, thus enabling the model to have the ability of human visual judgment.

3.4. Applicability of the Proposed Method in Multiple Scan Patterns

The proposed method is mainly based on the radar pulse amplitude characteristic patterns caused by antenna scanning for intelligent signal sorting. The regularity of radar pulse amplitude is caused by different antenna scan patterns and antenna gain patterns. Compared to agile modulation parameters such as CF and PW, the regular variation of PA is more reliable. Therefore, the paper previously discussed the effectiveness of the proposed method under common scan patterns, such as circular and sector. However, considering the complex scan pattern scenarios, it is necessary to discuss the applicability and reliability of the proposed method in various antenna scan patterns such as raster, spiral, and conical.
Figure 13 shows the temporal variation characteristics of PA in three scan patterns, i.e., raster, spiral, and conical. In a raster scan, the antenna scans a specific angular sector in azimuth and increments its elevation after completing the sector. Due to the stepwise increase in elevation angle during azimuth scanning, the amplitude of the main lobe signal varies within one period. In a conical scan, the radar attempts to keep the antenna aligned with the target by cyclically scanning the beam around the target. The received PA over time is similar to a sine function. In a spiral scan, the antenna beam starts scanning at the center of the circular area and moves outward, and it returns to its initial position to continue scanning after the area is scanned. The received signal power is sinusoidal, and the depth of the sine wave varies with the increase in the scanning radius.
In order to evaluate the effectiveness of the proposed method in complex antenna scan pattern scenarios, the section conducts experiments on other scan patterns such as raster, spiral, and conical. And for the situation where the side lobe signal power is too small to be received, the proposed method is experimentally verified. The antenna scan patterns of the test set are circular, sector, raster, spiral, and conical, while the other modulation parameters remain unchanged. The number of signals ranges from 1 to 5. The overall sorting accuracy is experimentally tested under different missing pulse ratios and spurious pulse ratios with a PA error of 0%, as shown in Table 3. The experimental results show that for multiple scan patterns, the success sorting rate is higher than 90% at a 10% missing pulse ratio or 20% spurious pulse ratio. As the number of missing pulses and spurious pulses increases, the sorting accuracy decreases. Due to the complex PA changes caused by different scan patterns, the sorting performance of this experiment slightly decreased compared to that of the experiment for circular scan and sector scan in Figure 7.
Figure 14 shows a representative example of pulse deinterleaving with circular, raster, spiral, and conical scan patterns, where two signals only have the main lobe. Although different scan patterns can cause various changes in PA, and signals with missing side lobes exhibit discontinuity in the time domain, the proposed method is still effective in these complex situations.

3.5. Comparison with Other Method

The section compares the performance of the proposed method (using SOLOv2 networks, Mask R-CNN network [31], and QueryInst network [34]) with the YOLOv8-based [30], U-Net-based [22], and classical deinterleaving methods, which combine K-means and SDIF algorithms. To verify the effectiveness and usability of the proposed method in instance segmentation networks, except for the SOLOv2 network, we conducted experiments based on the Mask R-CNN network and QueryInst network. U-Net-based and traditional sorting methods utilize modulation parameters (such as CF, PW, etc.) for pulse deinterleaving. The parameter settings for the K-means+SDIF method are shown in Table 4.
The test data are randomly generated based on the parameter settings in Table 2. In Figure 15a, the number of emitters ranges from 1 to 10. The missing pulse ratio (MPR) is 10% and the spurious pulse ratio (SPR) and PA error are 0%. In Figure 15b,c, the number of emitters is fixed at 5. When the MPR or SPR are set to different values, the other two parameters are set to 0%. As shown in Figure 15, the sorting accuracies of the YOLOv8-based, U-Net-based, and traditional algorithms are obviously lower than that of the proposed algorithm. As the complexity of deinterleaving scenarios increases, including the number of radar signals, missing pulses, and spurious pulses, the performance of various sorting methods decreases.
The comparison experiment analyzes the sorting performance of the research method based on the SOLOv2 network, Mask R-CNN network, and QueryInst network under different scenarios. As shown in Figure 15, under the scenario of multiple radar signals, missing pulses, and spurious pulses, the sorting accuracy of the SOLOv2-based method is effectively improved compared to the Mask R-CNN-based and QueryInst-based methods. Given the randomness and uniqueness of the constructed datasets, there are substantial individual differences between the signal objects in the training set and the test set. Mask R-CNN network is effective for tasks with clear targets and simple backgrounds, but it may face inherent limitations in radar signal sorting tasks due to the framework design. Mask R-CNN network first generates potential proposals based on the region proposal network (RPN) structure and further modifies them to produce the final bounding box prediction. Then, the network estimates the polygonal area of the object mask within the bounding box to obtain the accurate position of the object. If the initial proposal prediction is not good, it can result in cumulative errors in subsequent mask prediction steps. Similarly, considering the diversity of the simulation dataset, it is difficult to establish a robust set of shared queries for the QueryInst network, which may introduce additional noise and reduce model performance. In contrast, the SOLOv2 network provides a simpler and more effective solution by utilizing dynamic convolution to generate masks. The method enables the model to adaptively create segmentation masks based on the input features, achieving high efficiency and strong adaptability requirements, making it particularly suitable for radar signal sorting tasks.
Through comparative experiments with existing excellent signal sorting methods, the sorting performance of the proposed method, YOLOv8-based method, U-Net-based method, and traditional method in different scenarios is analyzed. As shown in Figure 15a, under the scenario of 10 radar signals, the proposed method improves sorting accuracy by about 8.72%, 10.39%, and 15.72% compared to YOLOv8-based, U-Net-based, and traditional methods, respectively. The experimental results show that the proposed method can adapt to scenarios with multiple emitters and dense pulse streams, and the sorting performance is relatively accurate. This can provide a potential solution for complex electronic reconnaissance of multiple targets with overlapping parameter ranges in the real world. Because the proposed method is based on a new stable parameter (e.g., antenna scan pattern) for signal sorting. Although the scanning parameters and modulation parameters of two radars may be similar, their dynamic scan patterns cannot overlap at all times because they cannot occupy exactly the same spatial position. The U-Net-based and traditional methods only use modulation parameters (e.g., TOA, CF, and PW) for signal sorting. Due to the complexity and variability of modulation types, signal modulation parameters have flexibility. When the modulation type becomes complex, and when the number of signals increases, the pattern of sorting parameters becomes flexible, and the parameter overlap becomes severe, resulting in a steeper decline in accuracy. The traditional signal sorting method adopts a framework that combines pre-sorting and main sorting. The two structures at the front and back mutually constrain each other. The errors in pre-sorting directly affect the accuracy of the main sorting, while the errors in the main sorting affect the performance of the entire algorithm. And the algorithm heavily relies on prior experience and artificially set thresholds, lacking generalization and flexibility. The proposed method utilizes antenna scan patterns under long-term observation for signal sorting. The amplitude pattern as a sorting parameter is more stable, and the decrease in accuracy is relatively slow. Although the sorting method based on the YOLOv8 object detection network utilizes amplitude patterns for pulse deinterleaving, pixel-level image processing is not employed. A bounding box may contain multiple signals, especially in scenarios with dense pulse streams.
As shown in Figure 15b, in the scenario of 5 radar signals with a 30% missing pulse ratio, the proposed method improves sorting accuracy by about 9.26%, 11.17%, and 24.55% compared to YOLOv8-based, U-Net-based, and traditional methods, respectively. The experimental results show that the proposed method significantly improves the sorting accuracy in missing pulse scenarios, highlighting the advantage of using an antenna scan pattern as the sorting parameter. Due to the analysis of the power envelope of the received signal under long sampling times, a certain amount of missing pulses cannot cause serious damage to the power envelope shape. In many practical applications, the integrity and continuity of pulse signals are affected by various factors, such as signal attenuation, interference, etc. This method can effectively address this challenge and has stronger tolerance and robustness to signal incompleteness. In the scenario of missing pulses, the performance of the traditional method deteriorates the fastest. K-means and SDIF algorithms perform deinterleaving based on the characteristics of pulse parameters. As the number of missing pulses increases, the continuity of the received pulses from the same emitter deteriorates, posing a great challenge to predicting potential PRI values. Due to the use of deep learning for pulse deinterleaving, the YOLOv8 and U-Net-based methods have a better ability to capture parameter patterns. The U-Net-based method mainly determines the position of pulse points in the mapped image based on TOA and CF. When the inter-pulse modulation rules are complex, and the signal parameter values are similar, the discrete pulse points of different emitters interweave with each other, causing great difficulties in pulse deinterleaving. In this case, the presence of missing pulses makes the pulse parameter patterns of different emitters unclear, greatly disrupting the patterns of TOA and CF. The YOLOv8-based method uses an object detection framework for signal sorting. This method mainly detects the regions of potential radar signal objects in the mapped image and determines the bounding boxes but cannot perform pixel-level learning on pulse point patterns and determine specific mask positions. Therefore, the proposed method has more outstanding performance.
As shown in Figure 15c, in the scenario of 5 radar signals with a 30% spurious pulse ratio, the proposed method improves sorting accuracy by about 13.33%, 18.88%, and 23.94% compared to YOLOv8-based, U-Net-based, and traditional methods, respectively. The experimental results show that the proposed method can achieve reliable and accurate signal sorting in scenarios containing false signals and interference signals. Due to the specific signal power envelope caused by antenna scanning and the regular variation of parameters for the same emitter, it is difficult for the parameters of spurious pulses to fully match the parameter ranges of signal pulses, especially in the PA parameter. In real electronic reconnaissance, the signal environment is becoming increasingly complex, and the identification between spurious and real pulses is crucial for ensuring information security and data authenticity. The precise sorting ability of this method in spurious pulse scenarios can avoid decision errors caused by false alarm information. The pre-clustering process of the traditional method can remove some spurious pulses, and the performance is slightly improved compared to that in the case of missing pulses. However, due to the fixed tolerance values, some spurious pulses and real pulses are mixed together, which increases the difficulty of deinterleaving. In the U-Net-based method, the frequency-modulated signal occupies a certain frequency width, which is reflected in the mapped image as discrete points distributed regularly in a certain rectangular area. When there are many spurious pulses, they are easily mixed with scattered signal points that occupy a large area. In this case, the pulse parameter pattern is greatly affected, causing difficulties in signal sorting, especially for agile modulation signals. For the YOLOv8-based method, it can only detect rectangular bounding box areas with potential radar signals and cannot achieve precise differentiation between spurious and real pulses within the boxes. When the pulse extraction of corresponding pixels is not performed, the method does not have the ability to segment pulse points within the bounding box, which means that spurious pulses have not been completely removed.

4. Conclusions

In this paper, a pulse deinterleaving method, based on an antenna scan pattern through an instance segmentation network, is proposed. By mimetically visualizing the scanning mode of the transmitted beam, a novel solution is provided for the sorting challenge brought by the agility of conventional radar parameters. The experimental results on simulated and unknown data indicate that the method has adaptability to non-ideal conditions and generalization to unknown signals. Through comparative experiments with YOLOv8-based, U-Net-based, and classical deinterleaving methods, it was verified that the proposed method has superior performance in scenarios involving multiple radar signals, missing pulses, and spurious pulses.
This paper provides a basic verification and analysis of the signal sorting method, using instance segmentation networks based on the antenna scan pattern. There are many potential future research directions that can be explored. The research points are mainly summarized as follows:
1.
In order to effectively extract the envelope of received power changes, the research method performs signal sorting on PDW under long-term observation. Long-term observation helps to analyze the patterns of antenna scanning. However, the excessively long sampling time can lead to increased computational complexity and prolonged processing time. In order to take advantage of different signal sorting methods, it is worth considering combining the sorting method for short sampling time with this method. At the small processing time scale, the characteristics of inter-pulse modulation of signals are more easily captured. However, at the large processing time scale, the characteristics of scan types and work modes are more pronounced.
2.
The proposed method has achieved relatively good results, but there are still some limitations in real-world electronic reconnaissance scenarios. Especially in real-time systems, the processing of complex scan patterns by the method may require higher computing resources, and the real-time requirements of the system are difficult to meet. In order to overcome the problems of large memory consumption and long processing time, the method can be optimized through hardware implementation of the field programmable gate array (FPGA) in the future.
3.
With the development of multi-functional phased array radar technology, corresponding electronic reconnaissance processing technology is crucial. By introducing antenna scanning into the field of radar signal sorting, radar signal sorting, antenna scan type recognition, and work mode recognition can be further linked together. Under different work modes, a radar adopts different antenna scan patterns and modulation parameter ranges. Thus, the combination of signal sorting and recognition steps can provide support for the acquisition of multifunctional radar information.
4.
In cognitive electronic reconnaissance scenarios, non-cooperative emitters may be completely unknown. The complete absence of signal samples poses a serious challenge to deep learning-based signal sorting methods. The establishment of radar databases and real-time learning and updating of models may be the processing methods. Radar signal sorting based on continuous massive data models may be one of the research directions.

Author Contributions

Conceptualization, X.G. and T.C.; methodology, X.G.; software, X.G.; validation, X.G., T.C. and J.L.; formal analysis, X.G. and J.L.; investigation, X.G. and T.C.; resources, T.C.; data curation, X.G. and T.C.; writing—original draft preparation, X.G.; writing—review and editing, X.G., T.C. and J.L.; visualization, X.G.; supervision, T.C.; project administration, T.C. All authors have read and agreed to the published version of the manuscript.

Funding

This research received no external funding.

Data Availability Statement

The datasets presented in this article are not readily available because data are part of an ongoing study or due to technical limitations. Requests to access the datasets should be directed to chentao@hrbeu.edu.cn.

Conflicts of Interest

The authors declare no conflicts of interest.

References

  1. Whittall, N. Signal sorting in ESM systems. IEE Proc. Part F Commun. Radar Signal Process. 1985, 132, 226–228. [Google Scholar] [CrossRef]
  2. Haigh, K.; Andrusenko, J. Cognitive Electronic Warfare: An Artificial Intelligence Approach; Artech House: London, UK, 2021. [Google Scholar]
  3. Weber, M.E.; Cho, J.Y.; Thomas, H.G. Command and control for multifunction phased array radar. IEEE Trans. Geosci. Remote Sens. 2017, 55, 5899–5912. [Google Scholar] [CrossRef]
  4. Mardia, H. New techniques for the deinterleaving of repetitive sequences. IEE Proc. Part F Commun. Radar Signal Process. 1989, 136, 149–154. [Google Scholar] [CrossRef]
  5. Milojević, D.; Popović, B.M. Improved algorithm for the deinterleaving of radar pulses. IEE Proc. Part F Commun. Radar Signal Process. 1992, 139, 98–104. [Google Scholar] [CrossRef]
  6. Young, J.; Høst-Madsen, A.; Nosal, E.M. Deinterleaving of mixtures of renewal processes. IEEE Trans. Signal Process. 2018, 67, 885–898. [Google Scholar] [CrossRef]
  7. Liu, Z.M.; Philip, S.Y. Classification, denoising, and deinterleaving of pulse streams with recurrent neural networks. IEEE Trans. Aerosp. Electron. Syst. 2018, 55, 1624–1639. [Google Scholar] [CrossRef]
  8. Xiang, H.; Shen, F.; Zhao, J. Deep ToA mask-based recursive radar pulse deinterleaving. IEEE Trans. Aerosp. Electron. Syst. 2022, 59, 989–1006. [Google Scholar] [CrossRef]
  9. Xie, M.; Zhao, C.; Han, X.; Wang, Z.; Hu, D. Separation of Interleaved Pulse Stream Based on Directed Acyclic Graphs. IEEE Signal Process. Lett. 2023, 30, 613–617. [Google Scholar] [CrossRef]
  10. Guo, Q.; Huang, S.; Qi, L.; Wang, Y.; Kaliuzhnyi, M. A radar pulse train deinterleaving method for missing and short observations. Digit. Signal Process. 2023, 141, 104162. [Google Scholar] [CrossRef]
  11. Su, S.; Fu, X.; Zhao, C.; Yang, J.; Xie, M.; Gao, Z. Unsupervised k-means combined with SOFM structure adaptive radar signal sorting algorithm. In Proceedings of the 2019 IEEE International Conference on Signal, Information and Data Processing (ICSIDP), Chongqing, China, 11–13 December 2019; pp. 1–4. [Google Scholar]
  12. Chi, K.; Shen, J.; Li, Y.; Li, Y.; Wang, S. Multi-function radar signal sorting based on complex network. IEEE Signal Process. Lett. 2020, 28, 91–95. [Google Scholar] [CrossRef]
  13. Lang, P.; Fu, X.; Cui, Z.; Feng, C.; Chang, J. Subspace decomposition based adaptive density peak clustering for radar signals sorting. IEEE Signal Process. Lett. 2021, 29, 424–428. [Google Scholar] [CrossRef]
  14. Scholl, S.; Brüggenwirth, S. Incremental deinterleaving of radar emitters. IEEE Aerosp. Electron. Syst. Mag. 2023, 38, 26–36. [Google Scholar] [CrossRef]
  15. Dai, D.; Qiao, G.; Zhang, C.; Tian, R.; Zhang, S. A Sorting Method of SAR Emitter Signal Sorting Based on Self-Supervised Clustering. Remote Sens. 2023, 15, 1867. [Google Scholar] [CrossRef]
  16. Qu, M.; Liu, R.; Zhang, Y.; Si, W. DOA estimation and signal sorting methods of multi-baseline polarized interferometer. Digit. Signal Process. 2024, 148, 104434. [Google Scholar] [CrossRef]
  17. Sabeti, M.; Norouzi, Y.; Bahabadi, M.A. Simultaneous direct position determination and pulse deinterleaving by a moving receiver. Digit. Signal Process. 2019, 93, 13–21. [Google Scholar] [CrossRef]
  18. Li, X.; Liu, Z.; Huang, Z. Deinterleaving of pulse streams with denoising autoencoders. IEEE Trans. Aerosp. Electron. Syst. 2020, 56, 4767–4778. [Google Scholar] [CrossRef]
  19. Gasperini, S.; Paschali, M.; Hopke, C.; Wittmann, D.; Navab, N. Signal clustering with class-independent segmentation. In Proceedings of the ICASSP 2020—2020 IEEE International Conference on Acoustics, Speech and Signal Processing (ICASSP), Barcelona, Spain, 4–8 May 2020; pp. 3982–3986. [Google Scholar]
  20. Chao, W.; Liting, S.; Zhangmeng, L.; Zhitao, H. A radar signal deinterleaving method based on semantic segmentation with neural network. IEEE Trans. Signal Process. 2022, 70, 5806–5821. [Google Scholar] [CrossRef]
  21. Wan, L.; Liu, R.; Sun, L.; Nie, H.; Wang, X. UAV swarm based radar signal sorting via multi-source data fusion: A deep transfer learning framework. Inf. Fusion 2022, 78, 90–101. [Google Scholar] [CrossRef]
  22. Fuyue, L.; Jinxin, L. End-to-end radar signal sorting based on deep segmentation. Syst. Eng. Electron. 2023, 45, 1351–1358. [Google Scholar]
  23. Wang, Y.; Liao, H.; Yuan, S.; Liu, N. A learning-based signal parameter extraction approach for multi-source frequency-hopping signal sorting. IEEE Signal Process. Lett. 2023, 30, 1162–1166. [Google Scholar] [CrossRef]
  24. Li, X.; Liu, Z.; Huang, Z.; Liu, W. Radar emitter classification with attention-based multi-RNNs. IEEE Commun. Lett. 2020, 24, 2000–2004. [Google Scholar] [CrossRef]
  25. Lang, P.; Fu, X.; Dong, J.; Yang, H.; Yang, J. A Novel Radar Signals Sorting Method via Residual Graph Convolutional Network. IEEE Signal Process. Lett. 2023, 30, 753–757. [Google Scholar] [CrossRef]
  26. Liu, H.; Wang, L.; Wang, G. Emitter Signal Deinterleaving Based on Single PDW with Modulation-Hypothesis-Augmented Transformer. Remote Sens. 2024, 16, 3830. [Google Scholar] [CrossRef]
  27. Zhang, X.; Hao, C.; Zhang, S.; Zheng, L. Characterization and identification of active electronically scanned array radar. In Proceedings of the 2017 IEEE International Geoscience and Remote Sensing Symposium (IGARSS), Fort Worth, TX, USA, 23–28 July 2017; pp. 2318–2321. [Google Scholar]
  28. Dutt, R.; Baloria, A.; Prasad V, R.C.; ESMP, R.; Acharyya, A. Discrete wavelet transform based unsupervised underdetermined blind source separation methodology for radar pulse deinterleaving using antenna scan pattern. IET Radar Sonar Navig. 2019, 13, 1350–1358. [Google Scholar] [CrossRef]
  29. Wang, C.; Wang, Y.; Li, X.; Ke, D. A deinterleaving method for mechanical-scanning radar signals based on deep learning. In Proceedings of the 2022 7th International Conference on Intelligent Computing and Signal Processing (ICSP), Xi’an, China, 15–17 April 2022; pp. 138–143. [Google Scholar]
  30. Kocamış, M.B.; Orduyılmaz, A.; Taşcıoğlu, S. Object detection based deinterleaving of radar signals using deep learning for cognitive EW. Signal Image Video Process. 2024, 18, 7789–7800. [Google Scholar] [CrossRef]
  31. He, K.; Gkioxari, G.; Dollár, P.; Girshick, R. Mask r-cnn. In Proceedings of the IEEE International Conference on Computer Vision, Venice, Italy, 22–29 October 2017; pp. 2961–2969. [Google Scholar]
  32. Wang, X.; Zhang, R.; Kong, T.; Li, L.; Shen, C. Solov2: Dynamic and fast instance segmentation. Adv. Neural Inf. Process. Syst 2020, 33, 17721–17732. [Google Scholar]
  33. Wang, X.; Kong, T.; Shen, C.; Jiang, Y.; Li, L. Solo: Segmenting objects by locations. In Computer Vision—ECCV 2020, Proceedings of the 16th European Conference, Glasgow, UK, 23–28 August 2020; Proceedings, Part XVIII 16; Springer: Cham, Switzerland, 2020; pp. 649–665. [Google Scholar]
  34. Fang, Y.; Yang, S.; Wang, X.; Li, Y.; Fang, C.; Shan, Y.; Feng, B.; Liu, W. Instances as queries. In Proceedings of the IEEE/CVF international Conference on Computer Vision, Montreal, BC, Canada, 11–17 October 2021; pp. 6910–6919. [Google Scholar]
  35. Xu, X.; Zhang, L.; Cheong, L.F.; Li, Z.; Zhu, C. Learning clustering for motion segmentation. IEEE Trans. Circuits Syst. Video Technol. 2021, 32, 908–919. [Google Scholar] [CrossRef]
  36. Karim, M.R.; Beyan, O.; Zappa, A.; Costa, I.G.; Rebholz-Schuhmann, D.; Cochez, M.; Decker, S. Deep learning-based clustering approaches for bioinformatics. Brief. Bioinform. 2021, 22, 393–415. [Google Scholar] [CrossRef]
  37. Chen, T.; Yang, B.; Guo, L. Radar Pulse Stream Clustering Based on MaskRCNN Instance Segmentation Network. IEEE Signal Process. Lett. 2023, 30, 1022–1026. [Google Scholar] [CrossRef]
  38. Ayazgok, S.; Erdem, C.; Ozturk, M.T.; Orduyilmaz, A.; Serin, M. Automatic antenna scan type classification for next-generation electronic warfare receivers. IET Radar Sonar Navig. 2018, 12, 466–474. [Google Scholar] [CrossRef]
Figure 1. The framework of radar signal sorting based on antenna scan pattern via SOLOv2 network.
Remotesensing 16 04639 g001
Figure 2. PDW visualization from different perspectives.
Remotesensing 16 04639 g002
Figure 3. The schematic diagram of mimetic image mapping. X = x 1 , , x i , , x N is used to represent the interleaved PDW data, where x i denotes TOA, PA, and CF parameters for each pulse. N is the number of radar pulses and also the number of pixel points. p i represents the point parameter corresponding to pulse parameter x i , where m i , n i , k i and a represent the center column coordinates, center row coordinates, color, and size of the point, respectively. And TOA is mapped to the center column coordinate of the point, PA is mapped to the center row coordinate of the point, and CF is mapped to the color of the point.
Remotesensing 16 04639 g003
Figure 4. Visualization of output mask for SOLOv2 network.
Remotesensing 16 04639 g004
Figure 5. Radar antenna scan pattern and antenna gain pattern.
Remotesensing 16 04639 g005
Figure 6. A classic sorting example of sample with five types of signals. The interleaved point graph is a mimetic point graph obtained after PDW visualization mapping processing. The deinterleaving point graph is the clustering and recognition result of signal points obtained by segmenting the mimetic point graph. For each signal, the mask of each point and the box of the signal are marked. And the modulation type and confidence value of each signal are displayed. Radar_pri_constant, radar_pri_staggered, radar_pri_jittered, radar_freq_agility, and radar_freq_agility_group correspond to C-PRI, S-PRI, J-PRI, A-CF, and GA-CF modulation types, respectively.
Remotesensing 16 04639 g006
Figure 7. Success sorting rate in non-ideal conditions.
Remotesensing 16 04639 g007
Figure 8. A sorting example of sample with seven interleaved signals (SPR = 30%, MPR = 30%, and PA measurement error = 3%).
Remotesensing 16 04639 g008
Figure 9. Performance of the proposed algorithm under almost identical CF.
Remotesensing 16 04639 g009
Figure 10. Generalization of the proposed algorithm in unknown PDW data.
Remotesensing 16 04639 g010
Figure 11. Performance of the proposed algorithm in unknown PDW data with almost identical CF.
Remotesensing 16 04639 g011
Figure 12. Performance of the proposed algorithm in real radar data.
Remotesensing 16 04639 g012
Figure 13. Additional radar antenna scan patterns.
Remotesensing 16 04639 g013
Figure 14. A representative test example with multiple scan patterns.
Remotesensing 16 04639 g014
Figure 15. Performance comparison of different sorting methods.
Remotesensing 16 04639 g015
Table 1. Mimetic image mapping index table.
Point Center Coordinates x 1 2 x 2 x 3 x N
( m 1 , n 1 ) 1 { t o a 1 , p a 1 , c f 1 } ---
( m 2 , n 2 ) - { t o a 2 , p a 2 , c f 2 } { t o a 3 , p a 3 , c f 3 } -
{ t o a i , p a i , c f i }
( m L , n L ) --- { t o a N , p a N , c f N }
1 ( m 1 , n 1 ) represents the column and row coordinates of the center pixel of the first point in the mimetic graph, L is the total number of points in the graph. 2 x 1 represents the PDW of the first pulse, including { t o a 1 , p a 1 , c f 1 } . N is the total number of pulses.
Table 2. Radar signal parameter settings.
Modulation TypePRI/msPA/dBmwCF/MHzPRI NumberJitter Rate/%CF Interval/
MHz
CF Range/
MHz
Scan PatternGain PatternScan Cycle/sMainlobe Width/
C-PRI 16.5∼10−50∼101000∼2000----0∼1 20∼3 22∼72∼30
J-PRI 16.5∼10−50∼101000∼2000-20∼40--0∼1 20∼3 22∼72∼30
S-PRI 17∼10−50∼101000∼20003∼5---0∼1 20∼3 22∼72∼30
A-CF 16.5∼10−50∼101000∼2000--20∼30300∼6000∼1 20∼3 22∼72∼30
GA-CF 16.5∼10−50∼101000∼2000--40∼60300∼5000∼1 20∼3 22∼72∼30
1 C-PRI represents conventional PRI modulation, and the carrier frequency is not mentioned as conventional. J-PRI indicates PRI jitter. S-PRI indicates staggered PRI. A-CF represents frequency agility and PRI is fixed. GA-CF represents frequency pulse group agility. 2 Moreover, 0∼1 indicates circular scan and sector scan, respectively. Additionally, 0∼3 indicates sinc, Gaussian, quadratic and uniform functions respectively.
Table 3. Success sorting rate in complex scan pattern scenarios.
Pulse Ratio00.10.20.30.40.5
Missing-SSR (%) 192.2591.4689.8688.6685.2068.35
Spurious-SSR (%) 292.2591.6990.8889.7589.4288.99
1 Success sorting rate under different missing pulse ratios. 2 Success sorting rate under different spurious pulse ratios.
Table 4. Parameter setting of traditional K-means + SDIF method.
Algorithm StepParameterClustering ToleranceSDIF Tolerance (PRI)
Routine ProcessingCF3 MHz5 μ s
PW0.5 μ s
Jitter AnalysisCF3 MHz0.4 times 1
PW0.5 μ s
Frequency Agile AnalysisCF0.6 times 15 μ s
PW0.5 μ s
1 The numerical value indicates that the threshold is dynamic. Moreover, 0.4 times indicates that the PRI tolerance is 0.4 times the center value of each PRI group for the SDIF algorithm. Additionally, 0.6 times indicates that the CF tolerance is 0.6 times the center value of each CF group for the K-means algorithm.
Disclaimer/Publisher’s Note: The statements, opinions and data contained in all publications are solely those of the individual author(s) and contributor(s) and not of MDPI and/or the editor(s). MDPI and/or the editor(s) disclaim responsibility for any injury to people or property resulting from any ideas, methods, instructions or products referred to in the content.

