Article

Classification of Karst Rocky Desertification Levels in Jinsha County Using a Feature Space Method Based on SDGSAT-1 Multispectral Data

1
College of Geomatics and Geoinformation, Guilin University of Technology, Guilin 541004, China
2
International Research Center of Big Data for Sustainable Development Goals, Beijing 100094, China
3
Hainan Aerospace Technology Innovation Center, Wenchang 571399, China
4
State Key Laboratory of Space-Earth Integrated Information Technology, Beijing Institute of Satellite Information Engineering, Beijing 100094, China
5
Key Laboratory of Earth Observation of Hainan Province, Hainan Aerospace Information Research Institute, Wenchang 571399, China
6
Beijing Tsinghua Tongheng Planning and Design Institute Co., Ltd., Beijing 100094, China
7
Key Laboratory of Digital Earth Sciences, Aerospace Information Research Institute, Chinese Academy of Sciences, Beijing 100094, China
*
Author to whom correspondence should be addressed.
Remote Sens. 2024, 16(24), 4786; https://doi.org/10.3390/rs16244786
Submission received: 24 October 2024 / Revised: 10 December 2024 / Accepted: 18 December 2024 / Published: 22 December 2024

Abstract

:
Karst rocky desertification (KRD) is a significant issue that affects the ecological and economic sustainability of southwest China. Obtaining the accurate distribution of different levels of KRD can provide decision-making support for the effective management of KRD. The Sustainable Development Goals Science Satellite 1 (SDGSAT-1) is the world’s first scientific satellite serving the 2030 Agenda for Sustainable Development of the United Nations, and is dedicated to developing high-resolution, multi-scale, global public datasets to support policy and decision-making support systems for sustainable development. SDGSAT-1 multispectral data provide detailed ground information with a spatial resolution of 10 m and a rich spectral resolution. In this study, we combined the red-modified carbonate rock index (RCRI, an index that characterizes the degree of carbonate rock exposure) and the normalized difference red edge index (NDRE, an index that characterizes the degree of vegetation coverage) to propose a novel feature space method based on SDGSAT-1 multispectral data to classify the different levels of KRD in the Jinsha County of Guizhou Province, a representative region with significant KRD in southwest China. This method effectively identified different levels of KRD with an overall classification accuracy of 87%. This was 20% higher than that of the grading index method, indicating that SDGSAT-1 multispectral data have promising potential for KRD classification. In this study, we offer a new insight into the classification of KRD and a greater quantity of remote-sensing data to monitor KRD over a wider area and for a longer period of time, contributing to the economic development and environmental protection of KRD areas.

1. Introduction

Karst rocky desertification (KRD) is a form of land degradation that refers to the degradation process caused by severe soil erosion and inappropriate human activities in the fragile karst environment of subtropical regions [1]. KRD is a global issue that affects many karst landscape regions, including western Canada, southern Italy, and southwest China [2,3,4]. Southwest China is one of the world’s three major karst regions [5]. KRD can cause a series of ecological and environmental problems, including soil erosion, frequent droughts and floods, and the formation of barren land [6]. These significantly affect both the socioeconomic development and ecological health of KRD areas [7,8].
The various levels of KRD exhibit distinct landscape characteristics and necessitate different management strategies. Regions without KRD possess a favorable ecological environment characterized by minimal soil erosion. Areas exhibiting potential KRD display mild soil erosion and a tendency toward rock exposure. Those with mild KRD demonstrate emerging rock exposure, noticeable soil erosion, and sparse vegetation. Moderate KRD regions exhibit evident soil erosion along with exposed rocks and shallow soil layers. Severe KRD areas experience pronounced soil erosion and significant rock exposure; they may entirely lack soil, leading to extensive rock exposure [9,10]. Obtaining an accurate distribution of the different levels of KRD and applying diverse management strategies can improve the efficiency of KRD areas as well as control and reduce management costs [11], playing a vital role in land-degradation management and sustainable development. This aligns with Sustainable Development Goal 15 to promote the sustainable use of terrestrial ecosystems.
The use of remote-sensing data is of significant value in the monitoring of land degradation, offering a rapid method with which to study surface features and phenomena covering large areas and enabling the capture of changing trends over a long period of time [12]. Examples include the monitoring of desertification [13], land salinization [14], and land-use changes [15]. Field investigations and remote-sensing technology are both common methods used to investigate KRD. Field investigations often demand substantial workforces and resources, with significant time costs [16]. A combination of remote-sensing technology and GIS (geographic information system) technology can provide advantages, such as extensive observation coverage, high data-acquisition efficiency, and the acquisition of rich spectral information, resulting in a more efficient and convenient method of monitoring KRD in extensive regions [17].
Different remote-sensing indices can reflect different surface features and can obtain land information more effectively [18,19]. Grading index [20,21,22] and feature space [23,24,25] are the two main methods used to classify the levels of KRD; both employ remote-sensing indices. The grading index method uses KRD characterization indices, such as exposed bedrock fractions, fractional vegetation cover, and slopes, to construct a decision tree to classify the different levels of KRD based on corresponding classification standards [20]. This method is a simple and fast approach to obtaining the distribution of different KRD levels, but it does not adequately consider the effects of interactions between different KRD characterization indices and is unsuitable for the classification of KRD under different environmental conditions [21,26]. The feature space method constructs a two-dimensional surface based on two KRD characterization indices; a KRD monitoring index (KRDI) is calculated according to the linear relationship between these two indices [27]. The thresholds of the KRDI for each level of KRD are then customized based on the sample points of each level of KRD to classify the KRD. Compared with the grading index method, the feature space method can effectively reflect the interactions between different KDR characterization indices and adapt the KRD classification to different environmental conditions.
The Sustainable Development Goals Science Satellite 1 (SDGSAT-1) is the world’s first scientific satellite dedicated to serving the 2030 Agenda for Sustainable Development of the United Nations. The satellite is equipped with a multispectral imager (MSI), a glimmer imager (GLI), and a thermal infrared spectrometer (TIS). It can conduct dynamic and macroscopic observations of the earth’s surface as well as provide coordinated multi-payload day-and-night detection. SDGSAT-1 aims to explore the patterns of environmental change and evolution primarily caused by human activities [28]. SDGSAT-1 data have been applied to various research fields. The GLI data have been used to detect ships [29] and identify human-built areas [30]. The TIS data have been used to identify industrial heat-source regions [31] and granite ranges [32]. The MSI payload can acquire images with a spatial resolution of 10 m and a wide coverage of 300 km. Its data show distinct advantages for coastal monitoring such as the monitoring of red tides [33] and suspended sediment concentrations in the Yellow River Estuary and the waters in its vicinity [34]. SDGSAT-1 data have also been used for desertification monitoring, demonstrating the satellite’s efficacy at land-degradation monitoring [35].
In this study, we created a feature space method based on the red-modified carbonate rock index (RCRI) and the normalized difference red edge index (NDRE) to classify different KRD levels in the Jinsha County of Guizhou Province using SDGSAT-1 MSI data. Our aim was to investigate the potential of SDGSAT-1 MSI data for KRD classification with a view to broadening the application domains of the data. The results demonstrate that the RCRI–NDRE feature space method is an efficacious approach to assessing the extent of KRD. The accuracy rate is 87%, indicating the potential of SDGSAT-1 MSI data for the remote-sensing monitoring of KRD. This provides a greater quantity of remote-sensing data to support the observation of KRD over a wider area and for a longer period of time.
The structure of this paper is as follows. Section 2 provides an overview of the study area and the data employed, along with a description of data pre-processing techniques. Section 3 presents the methods employed for the construction of the RCRI–NDRE feature space model. Section 4 and Section 5 comprise analyses of the results and a discussion of the experimental results, respectively. Finally, the research is summarized in Section 6.

2. Study Area and Data
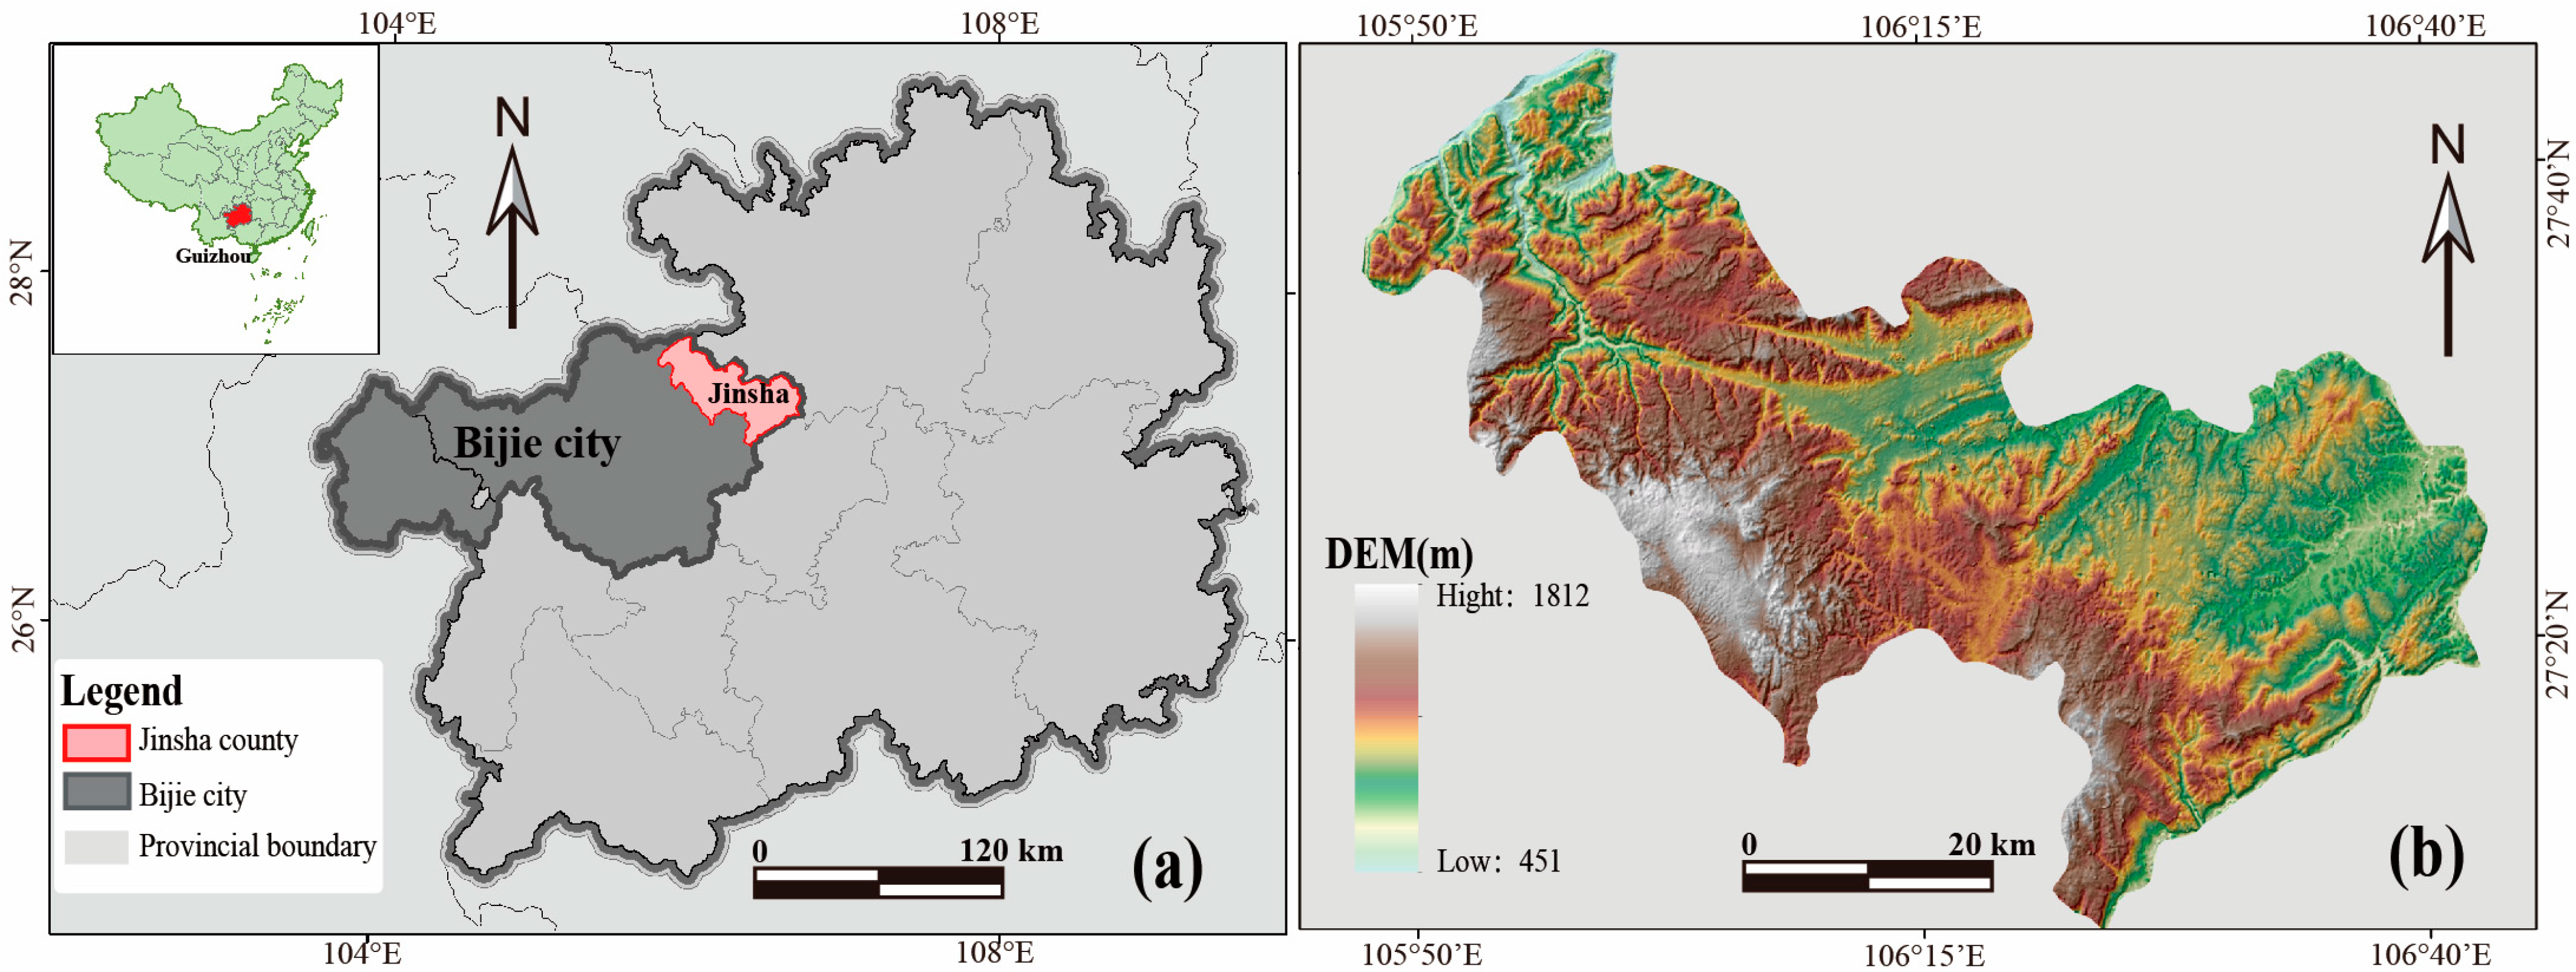
2.1. Study Area

The study area was Jinsha County, which is located in the eastern part of Bijie City, Guizhou Province, between 105°47′E and 106°44′E and 27°07′N and 27°46′N (Figure 1a). Jinsha County has a total area of 2524 km2, and the main terrain types are mountains and hills. The terrain of Jinsha County is higher in the southwest and lower in the northeast (Figure 1b), with elevations ranging from 800 to 1500 m. The region has a subtropical monsoon humid climate and widely displays typical karst landforms such as karst funnels, peak clusters, and karst depressions [36].

2.2. Data and Pre-Processing
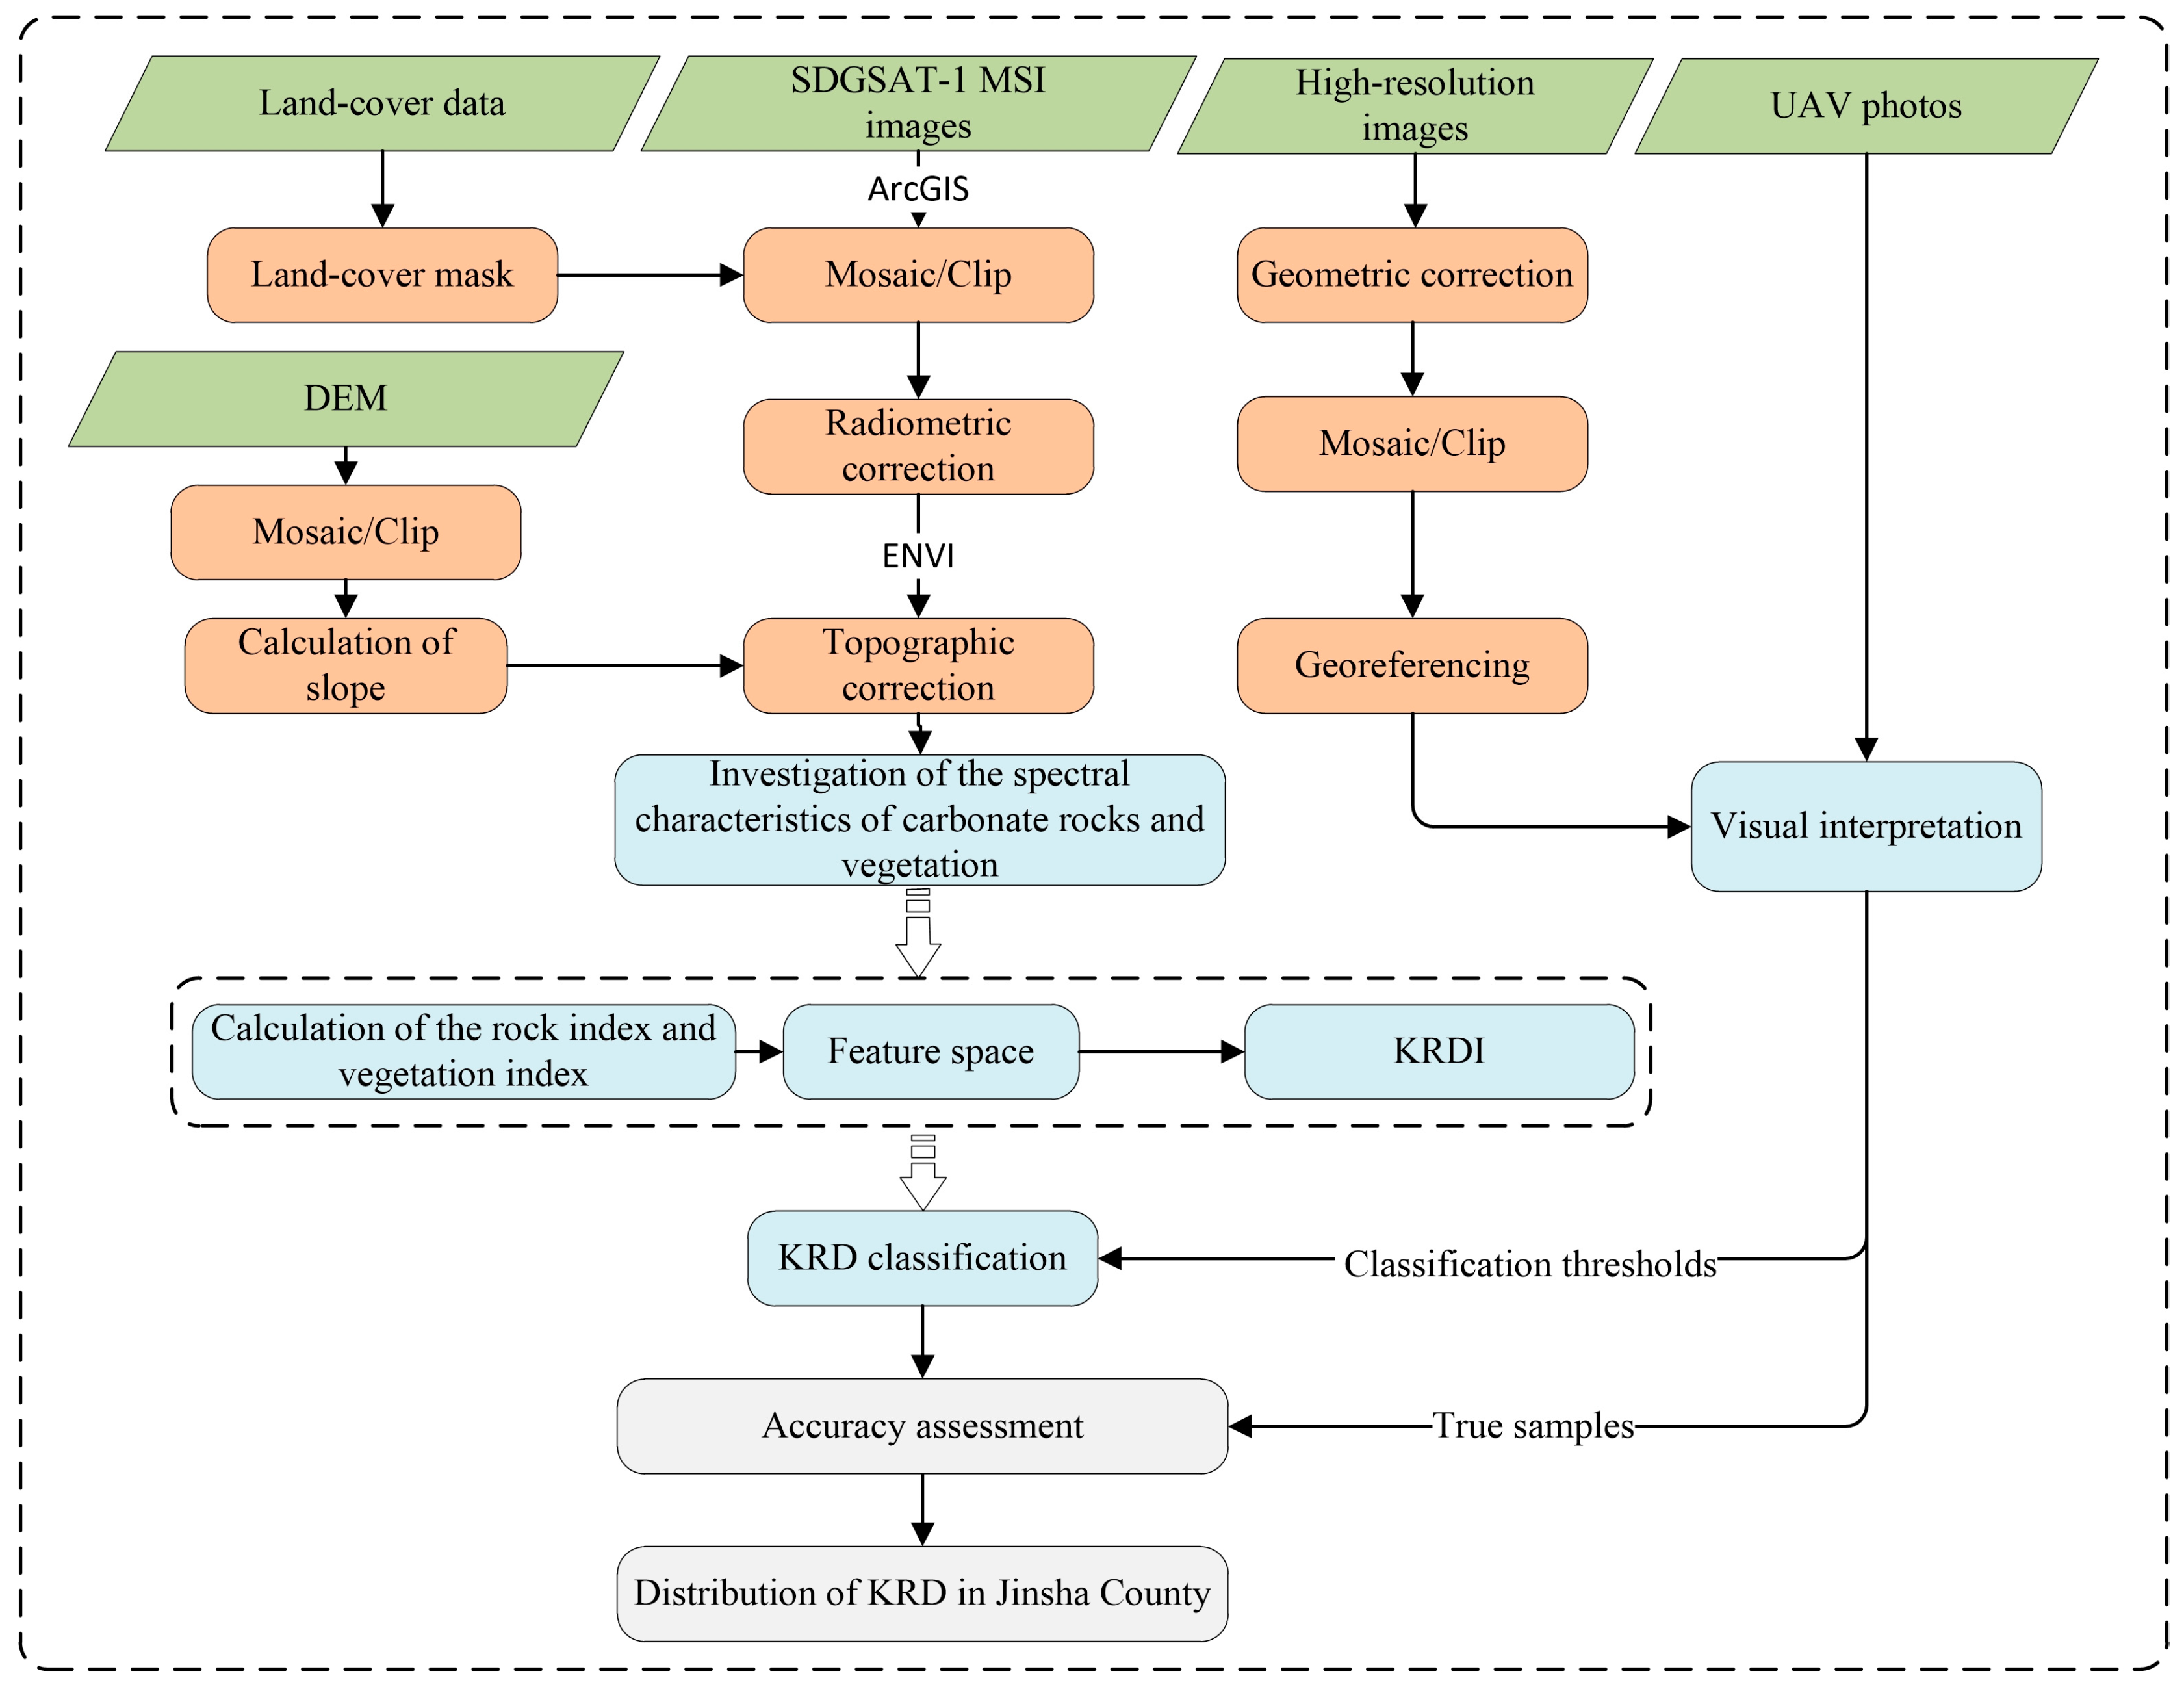
Table 1 presents all the data used in this study. The SDGSAT-1 MSI data used in this study as the primary data source comprised a Level 4B user product obtained on 19 August 2022, that had undergone geometric corrections and relative radiometric corrections. The digital elevation model (DEM) data were obtained from the Advanced Spaceborne Thermal Emission and Reflection Radiometer Global Digital Elevation Model (ASTER GDEM), which has a spatial resolution of 30 m, and is used for topographic corrections. The other data used in this study included land-cover data, high-resolution remote-sensing images, and administrative division data. Gaofen data were employed for visual interpretations, with the objective of obtaining samples of KRD. These data were also employed to rectify the land-cover data. Land-cover data were used to mask non-karst areas such as impermeable surfaces, water bodies, and farmland.
The L4B level SDGSAT-1 MSI data were relatively radiometrically corrected DN values, which lacked a physical meaning and required an absolute radiometric correction to obtain the reflectance data necessary for the remote-sensing index inversion. This process involved both absolute radiometric calibration and atmospheric corrections. First, the MSI image underwent absolute radiometric calibration to convert the digital number (DN) into radiance, as per Equation (1), as follows:
L = D N × G a i n + B i a s
where L represents radiance at the sensor entrance pupil, and D N represents the digital number of the image after relative radiometric calibration. The Gain and Bias both originate from the handbook of the SDGSAT-1 data product (Table 2) [42].
The fast line-of-sight atmospheric analysis of spectral hypercubes (FLAASH) atmospheric correction was then applied to obtain the surface reflectance.
The topographic correction was completed for the reflectance image using the sun-canopy-sensor C-correction (SCS + C) model to eliminate the errors caused by terrain factors [43]. The model equation is as follows:
ρ H = ρ T ( c o s θ P × c o s θ Z + C i ) / ( c o s γ i + C i )
c o s γ i = c o s θ P × c o s θ Z + s i n θ P × s i n θ Z × c o s ( ϕ a ϕ o )
where ρ H represents the reflectance after correction, ρ T represents the raw reflectance, C i represents the semi-empirical coefficient of band i, and c o s γ i represents the solar insolation coefficient. θ P , θ Z , ϕ a , and ϕ o represent the slope, solar zenith, solar azimuth, and aspect, respectively. In this study, we employed ENVI 5.3’s (the Environment for Visualizing Images) topographic correction plug-in for the topographic correction. The solar azimuth and solar zenith angles in the image metafile were used as the input parameters for the topographic correction.
The Gaofen data underwent geometrical correction and image fusion, followed by a geo-alignment with the SDGSAT-1 MSI data.
The land-cover data were visually corrected according to the Gaofen-2 and Gaofen-7 data.

3. Methods

In this study, we created an RCRI–NDRE feature space method to classify the different levels of KRD in Jinsha County based on SDGSAT-1 MSI data. First, remote-sensing images of the study area were acquired and pre-processed using ArcGIS 10.3 and ENVI 5.3. Second, KRD characterization indices were constructed by investigating the spectral characteristics of rocks and vegetation from the SDGSAT-1 MSI images. Third, the feature space was established based on the KRD characterization indices and the KRDI was subsequently calculated. The classification thresholds for the different levels of KRD were then confirmed according to the sample points from the high-resolution, remote-sensing images and field investigation unmanned aerial vehicle (UAV) photos. Finally, the feature space was then used to classify the levels of KRD in Jinsha County and the classification accuracy was evaluated using a confusion matrix. The detailed process is illustrated in Figure 2.

3.1. Inversion of KRD Characterization Indices
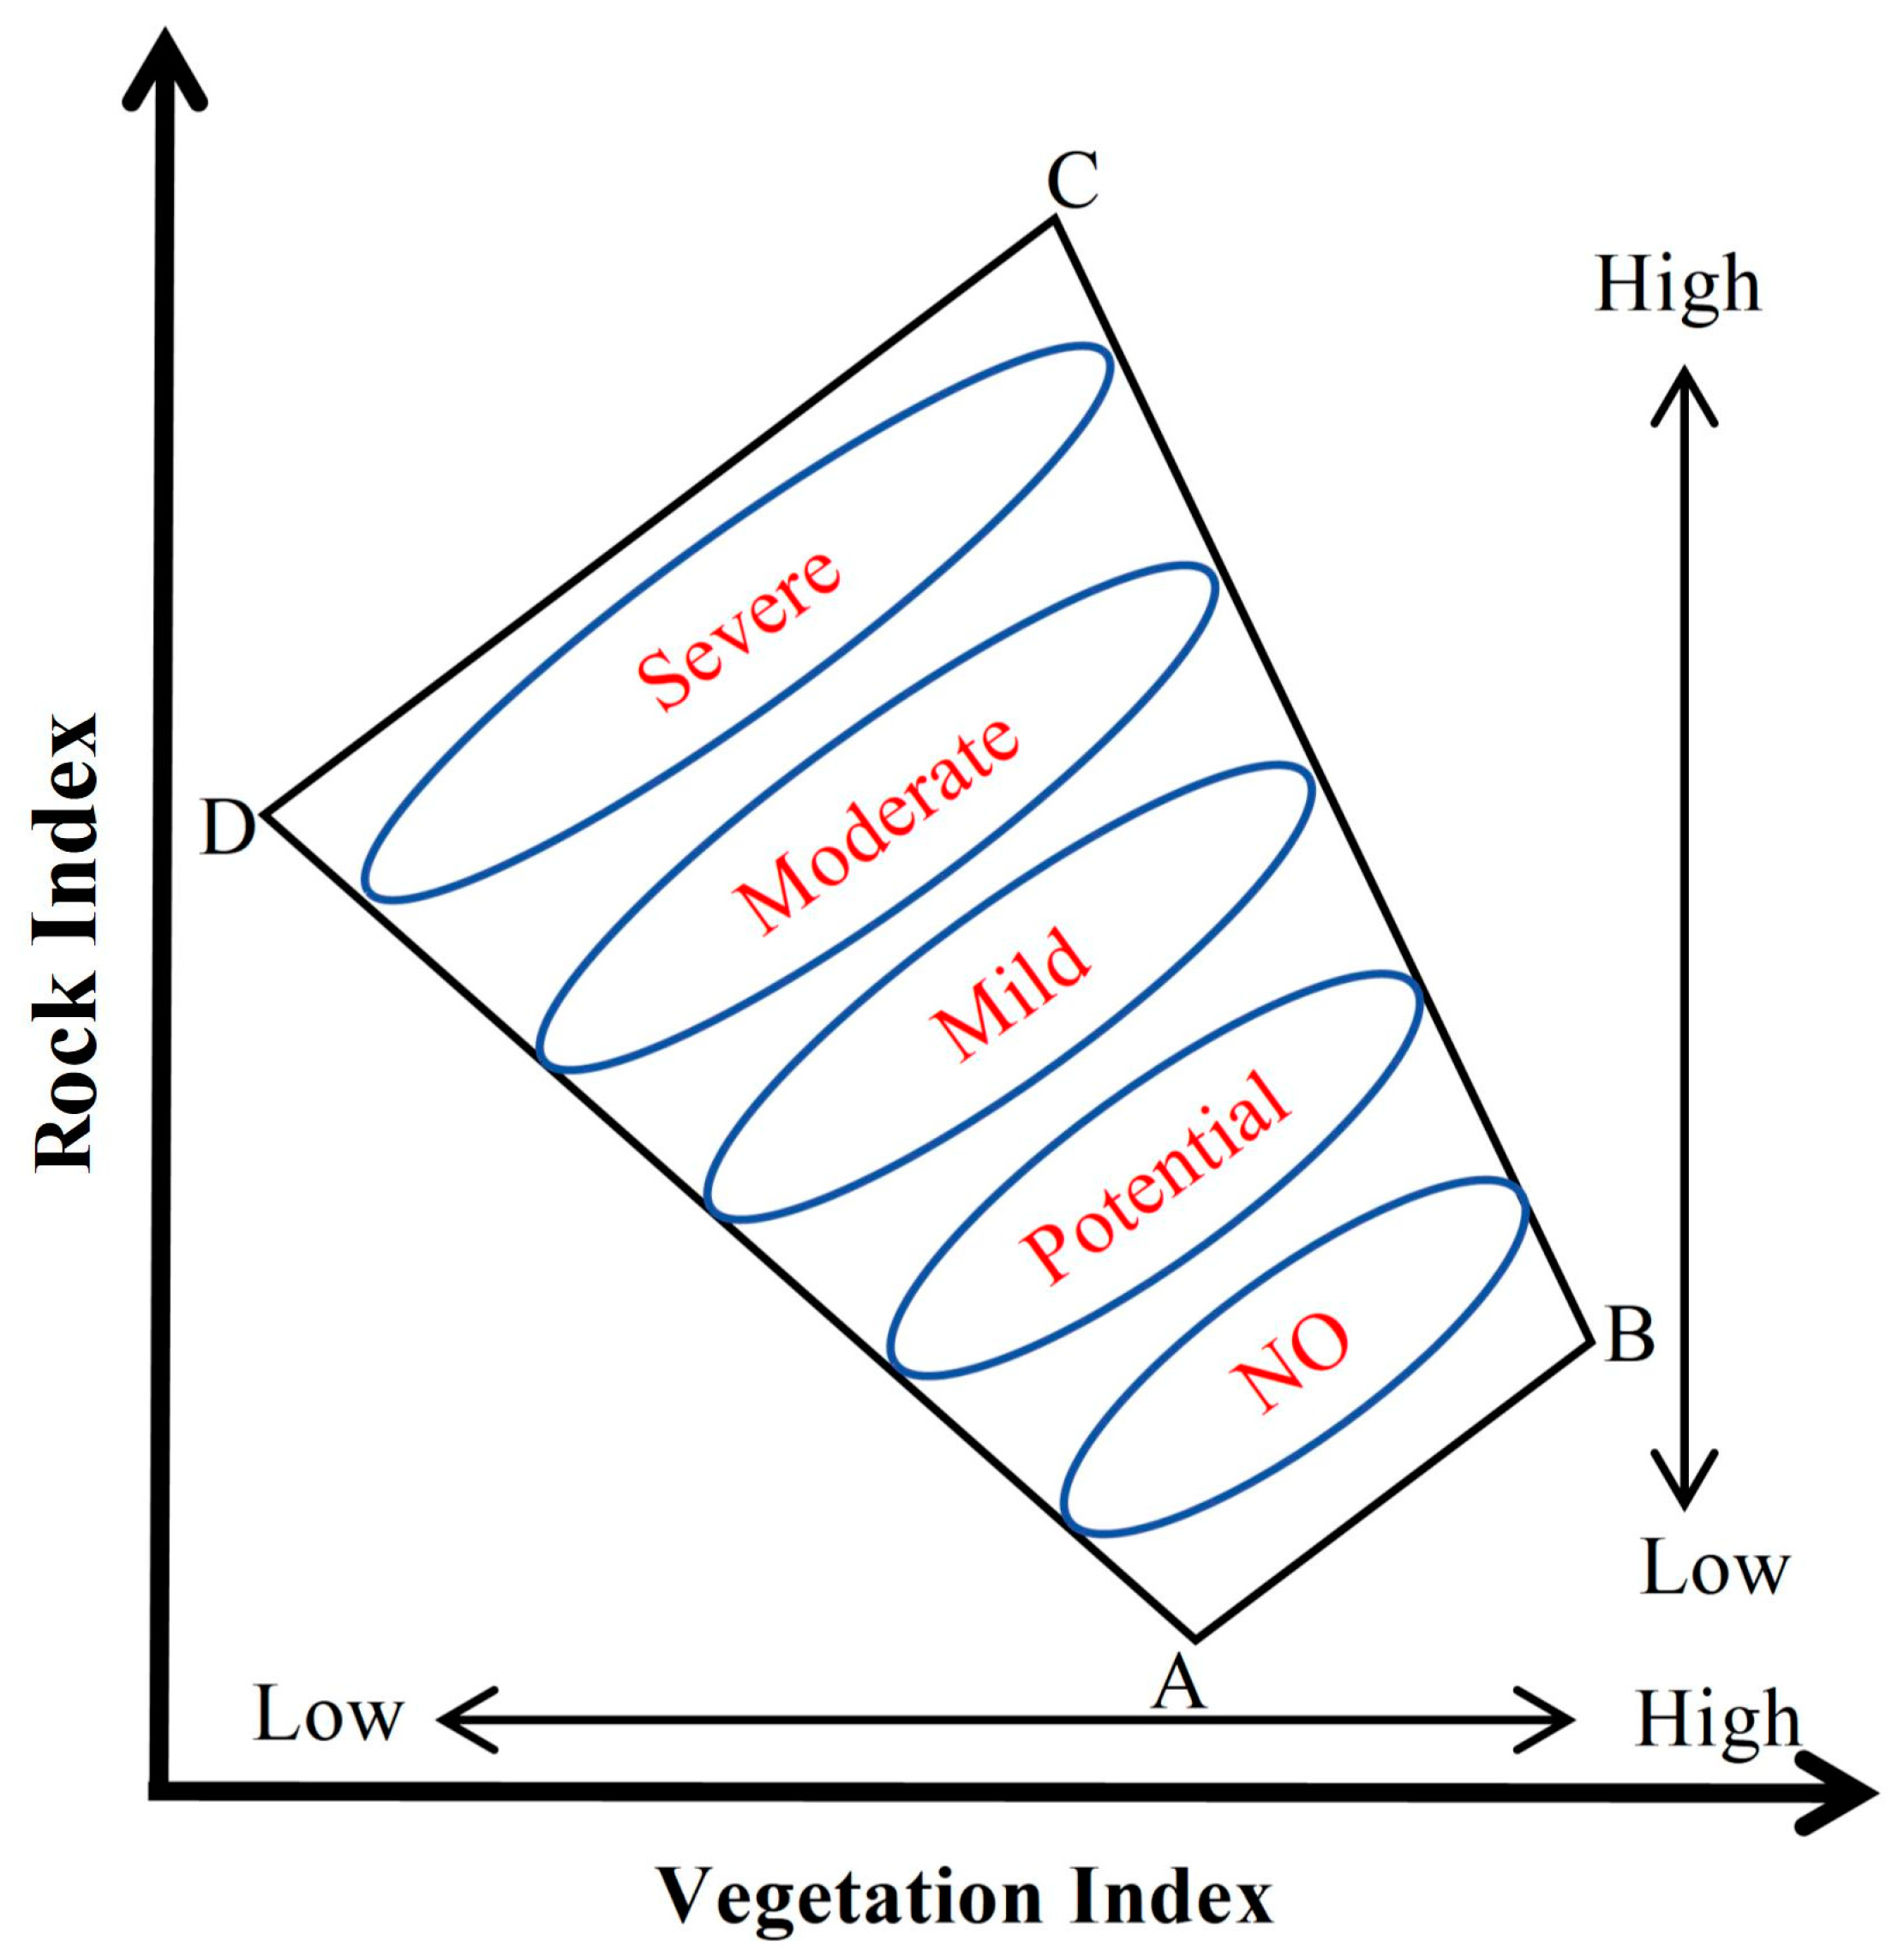
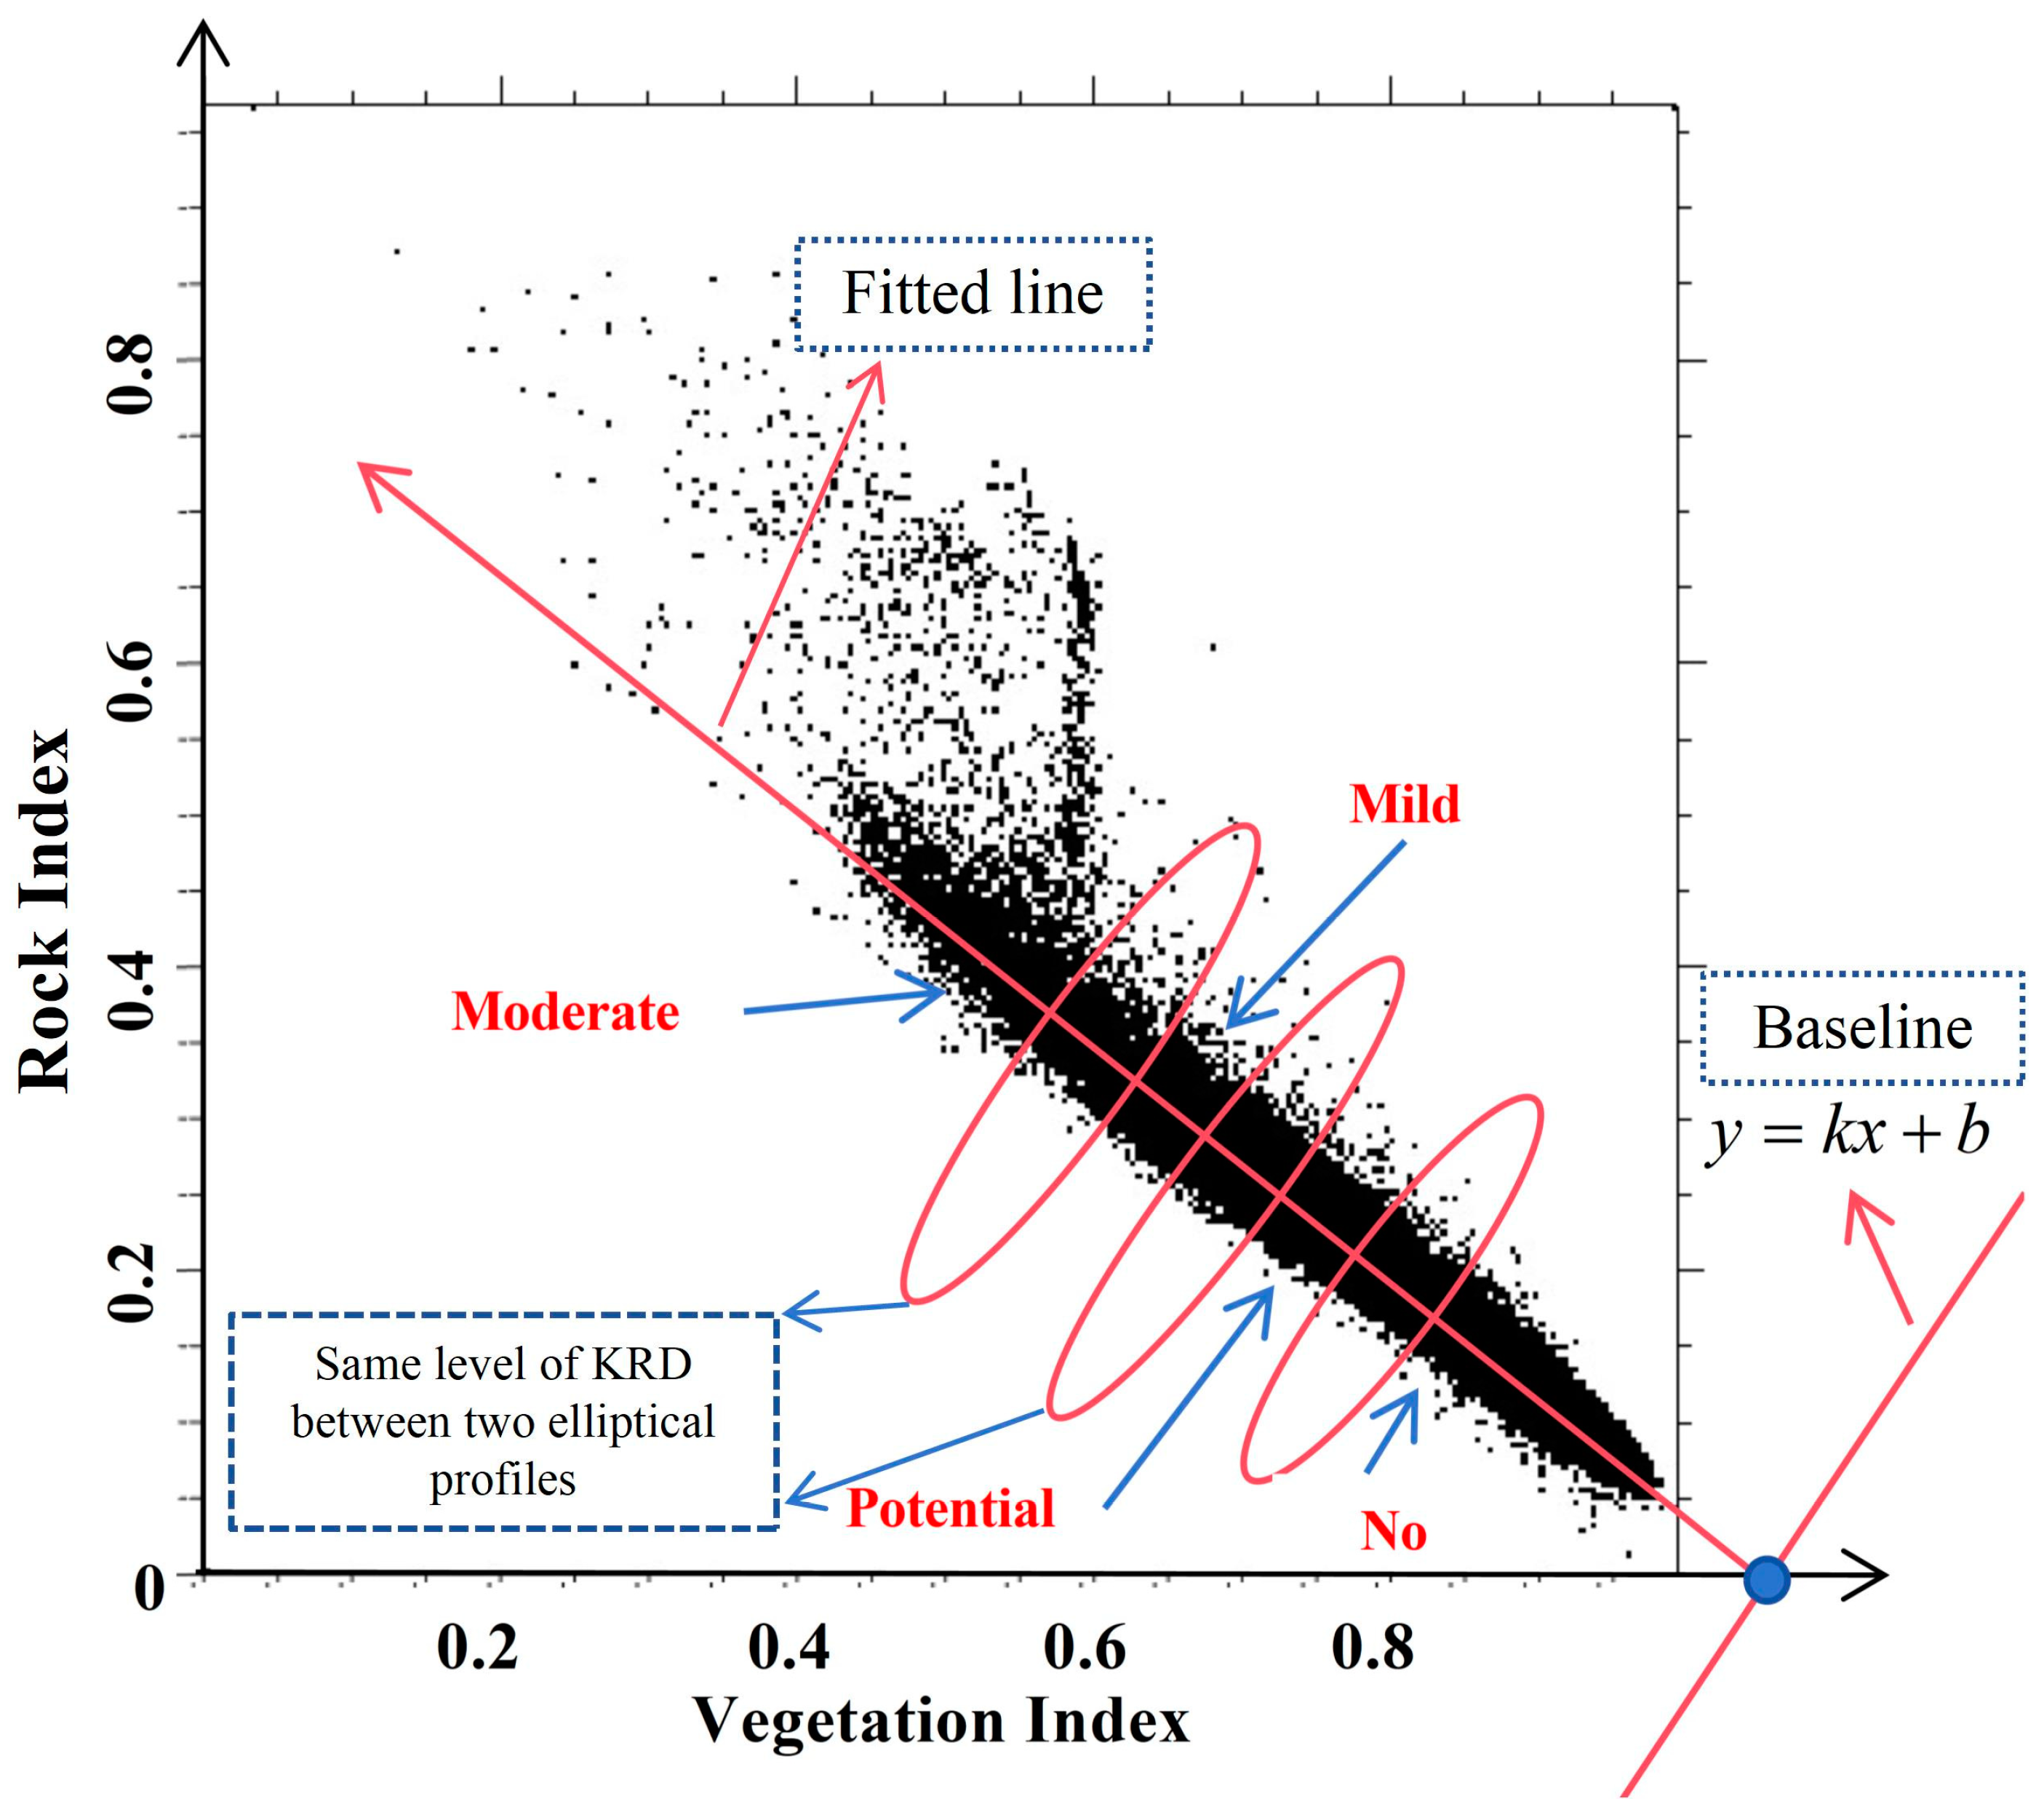
The exposed bedrock fraction (EBF) and fractional vegetation cover (FVC) are two important indices that characterize the levels of KRD [21]. This study selected vegetation and rocks sample points from the reflectance image that had been atmospherically corrected and then used ArcGIS 10.3 software to obtain the reflectance values of these sample points in different bands. These values were used as the vertical coordinate; different bands were used as the horizontal coordinate to plot the reflectance curves of vegetation and carbonate rocks from the SDGSAT-1 MSI images shown in Figure 3. It was evident that the vegetation significantly absorbed electromagnetic radiation in the red band, resulting in a reflection valley [7]. In contrast, the reflectance rapidly increased in the red edge band, leading to a reflection peak [26]. The reflectance of carbonate rocks also increased between the red and red edge bands; however, the increase in the slope of the carbonate rocks was smaller than that of the vegetation. The reflectance of carbonate rocks was lower than that of vegetation in the red edge and near infrared bands, whereas the relationship was reversed in the other bands.
We calculated multiple indices to characterize carbonate rocks and vegetation by combining different bands based on the aforementioned spectral reflectance characteristics of the carbonate rocks and vegetation. Subsequently, feature spaces were constructed using combinations of different rock and vegetation indices to obtain an optimal combination with the highest accuracy. The carbonate rock characterization indices included the carbonate rock index (CRI) [44] as well as R I   ( r o c k   i n d e x ) 1 , R I 2 , R I 3 , R I 4 , R I 5 , R C R I , and R C R I 2 . The vegetation characterization indices included the normalized difference vegetation index (NDVI) [20] and the N D R E [26]. The calculation equations for these indices are as follows:
C R I = ( B L U E N I R ) / ( B L U E + N I R )
R I 1 = ( D B 1 N I R ) / ( D B 1 + N I R )
R I 2 = ( D B 2 N I R ) / ( D B 2 + N I R )
R I 3 = ( G R E E N N I R ) / ( G R E E N + N I R )
R I 4 = ( R E D N I R ) / ( R E D + N I R )
R I 5 = ( B L U E R E ) / ( B L U E + R E )
R C R I = ( B L U E + R E D N I R ) / ( B L U E + N I R )
R C R I 2 = ( B L U E + R E D R E ) / ( B L U E + R E )
N D V I = ( N I E R E D ) / ( N I R + R E D )
N D R E = ( R E R E D ) / ( R E + R E D )
where D B 1 , D B 2 , BLUE, GREEN, RED, RE, and NIR represent the spectral reflectance of deep blue band 1, deep blue band 2, the blue band, the green band, the red band, the red edge band, and the near infrared band of the SDGSAT-1 data, respectively.
In this study, we standardized the rock index and vegetation index to a range from 0 to 1 using a binary pixel model (DPM), which was then used to represent the EBF and FVC, respectively. These standardized rock and vegetation indices were used to construct the feature space and decision tree used to classify the KRD levels. According to the principle of the DPM, a pixel is composed of two parts. These are rocks and non-rocks or vegetation and non-vegetation [45]. The proportion of the pixel occupied by rocks represents the EBF of the pixel, whereas the proportion of pixels occupied by vegetation is indicative of the FVC of the pixel. In this study, we used confidence interval values of 5% and 95% to represent the minimum and maximum values, respectively [46]. The standardized formula is shown in Equation (14), as follows:
I m = ( I I m a x ) / ( I m a x I m i n )
where I m represents the index value after standardization, I represents the original index value, I m a x represents the value with a 95% confidence interval, and I m i n represents the value with a 5% confidence interval.

3.2. Feature Space

3.2.1. Principles of Feature Space

A feature space is a two-dimensional plane consisting of two typical parameters that can effectively reflect the interaction between these two parameters [47]. The vegetation and rock indices for different levels of KRD exhibited distinct characteristics in the feature space. Lighter levels of KRD indicated greater vegetation coverage and fewer exposed bedrocks, resulting in higher vegetation indices and lower rock indices. Conversely, there was a decrease in the vegetation index and an increase in the rock index as the level of KRD increased [25]. Figure 4 demonstrates the significant negative correlation between the rock index and vegetation index in the feature space. The lower rock indices and higher vegetation indices at A and B represent points with lower levels of KRD; the higher rock indices and lower vegetation indices at C and D represent points with higher levels of KRD [47]. The transition from line segment AB to line segment CD represents the transformation of KRD from mild to severe [24,25,26]. The levels of KRD for a point in the feature space can be determined by calculating the distance from the point to a baseline, which can be identified by analyzing the linear relationship between the rock index and the vegetation index.

3.2.2. Construction of the KRDI

Figure 5 is a schematic diagram of the feature space identified from SDGSAT-1 MSI data. The rock index and vegetation index were standardized and used as the vertical and horizontal coordinates of the feature space, respectively. A linear fit was obtained for these two indices by using the least squares principle for linear regression. A perpendicular line to the fitted line is represented by y = kx + b, which represents the baseline. This line passes through the intersection of the fitted line and the horizontal coordinates. Consequently, the points in the feature space are located in the upper left of the straight line of y. The slope and intercept of the fitted line were obtained using linear fitting. Subsequently, K and b were calculated from the mathematical relationship between the two perpendicular lines and the intersection of the fitted line with the x-axis. The different levels of KRD can be distinguished by calculating the distances of different points to line y. The rock index increased, and the vegetation index decreased in the feature space as the KRD worsened. Conversely, the opposite trend was observed as the KRD improved. Thus, the elliptical profile that is perpendicular to line y can be used as the boundary to distinguish between the different levels of KRD. Points representing the same level of KRD lie between adjacent elliptical profiles, which range from no, potential, and mild-to-moderate KRD from the lower right to the upper left. The field investigation indicated that the area of severe KRD in Jinsha County is relatively limited, rendering the sample size insufficient to draw meaningful conclusions. Consequently, severe KRD was excluded from the classification of KRD in Jinsha County in this study.
The KRD monitoring index can be calculated using the distance from a point in the feature space to the baseline y, as illustrated in Equation (15), as follows:
K R D I = ( k × V I R I + b ) / k 2 + 1 2
where VI represents the vegetation index, RI represents the rock index, k represents the slope of the baseline y, and b represents the baseline y-intercept.
In total, 50 sample points for each level of KRD were selected according to the high-resolution, remote-sensing images from Gaofen-2, Gaofen-7, Google Earth, and the field investigation UAV photos to calculate the average KRDI for each level. The median values of the average KRDIs between each two adjacent KRD levels were used as the threshold to distinguish between these two levels of KRD.

3.3. Grading Index Method

The decision tree method is a well-established and frequently used approach for the classification of KRD. In this study, we integrated the EBF and FVC to structure the decision tree classification method and classify the levels of KRD in Jinsha County. The classification criteria were based on those outlined in previous research, as presented in Table 3 [21].

3.4. Precision Evaluation Method

3.4.1. Sample Point Acquisition

We conducted a field investigation in Jinsha County from October to November in 2023 to collect sample photos of different KRD levels by a DJI Mavic 2 drone. The sample points, as illustrated in Figure 6, were evenly distributed in the northwest, central, and southeast areas of Jinsha County, where KRD is widespread.
A visual interpretation was used to estimate the levels of KRD based on the proportion of rocks in the photos and to obtain the ground-truth sample points of different levels of KRD in Jinsha County by combining high-resolution, remote-sensing images from Gaofen-2, Gaofen-7, and the field investigation UAV photos. The visual interpretation criteria are outlined in Table 4. A total of 548 KRD sample points were interpreted, including 218 points of no KRD, 84 points of potential KRD, 130 points of mild KRD, and 116 points of moderate KRD.

3.4.2. Confusion Matrix

A confusion matrix is a frequently employed methodology in the field of remote-sensing image classification. In the matrix, user accuracy (UA) represents the percentage of correct classifications in the classification results, indicating the reliability of the results. Producer accuracy (PA) represents the percentage of correct classifications in the true samples, indicating the effectiveness of the classification method. Overall accuracy (OA) represents the percentage of all correctly classified samples in the overall sample. The kappa coefficient is a measure of the consistency of the classification results compared with the actual results [48].

4. Results

This section presents a comparison of the classification accuracy of different feature space methods for the different levels of KRD in Jinsha County, with the objective of selecting an optimal feature space method. A comparison is made between the optimal feature space method and the grading index method to demonstrate the effectiveness of our method. The distribution of different levels of KRD in Jinsha County is analyzed.

4.1. Classification of KRD Levels

We used different combinations of rock and vegetation indices, as mentioned above, to construct multiple feature spaces and calculate the corresponding KRDIs. The classification of KRD in Jinsha County was completed by calculating the KRD classification threshold for each feature space. The accuracy results for the KRD classification of different feature spaces are presented in Table 5. The results indicate that the average accuracy of the KRD classification obtained from the NDRE was higher than that from NDVI, and the RCRI–NDRE feature space model achieved the highest accuracy. The classification result of the RCRI–NDRE feature space model was selected for the distribution of different levels of KRD in Jinsha County, with the following classification thresholds: no KRD (0~0.28); potential KRD (0.28~0.37); mild KRD (0.37~0.45); and moderate KRD (0.45~max).

4.2. Accuracy Assessment

A decision tree was constructed using the grading index method combined with the RCRI and NDRE to classify the KRD in Jinsha County and assess the classification accuracy of the RCRI–NDRE feature space method. Confusion matrices were calculated for the RCRI–NDRE feature space and the grading index methods, respectively, based on the aforementioned KRD sample points. The accuracy evaluation metrics were then calculated, as shown in Table 6 and Table 7.
Table 6 and Table 7 demonstrate that the RCRI–NDRE feature space method achieved an OA of 86.9% and a kappa coefficient of 0.87 for KRD, which are both higher than those of the grading index method. This demonstrates that the classification results of the RCRI–NDRE feature space method proposed in this paper are in greater agreement with the actual distribution of KRD in Jinsha County. Our method more effectively reflects the distribution of different levels of KRD in Jinsha County compared with the grading index method. The accuracy of the potential and mild levels of KRD was lower than that of no and moderate KRD, which may have been the result of misclassification and omissions caused by mixed pixels composed of carbonate rocks, vegetation, and bare soil in the potential and mild KRD types [49]. The simultaneous presence of multiple features in mixed pixels can lead to a blurring of the boundaries between different features, which in turn affects the accuracy of KRD classification [50].

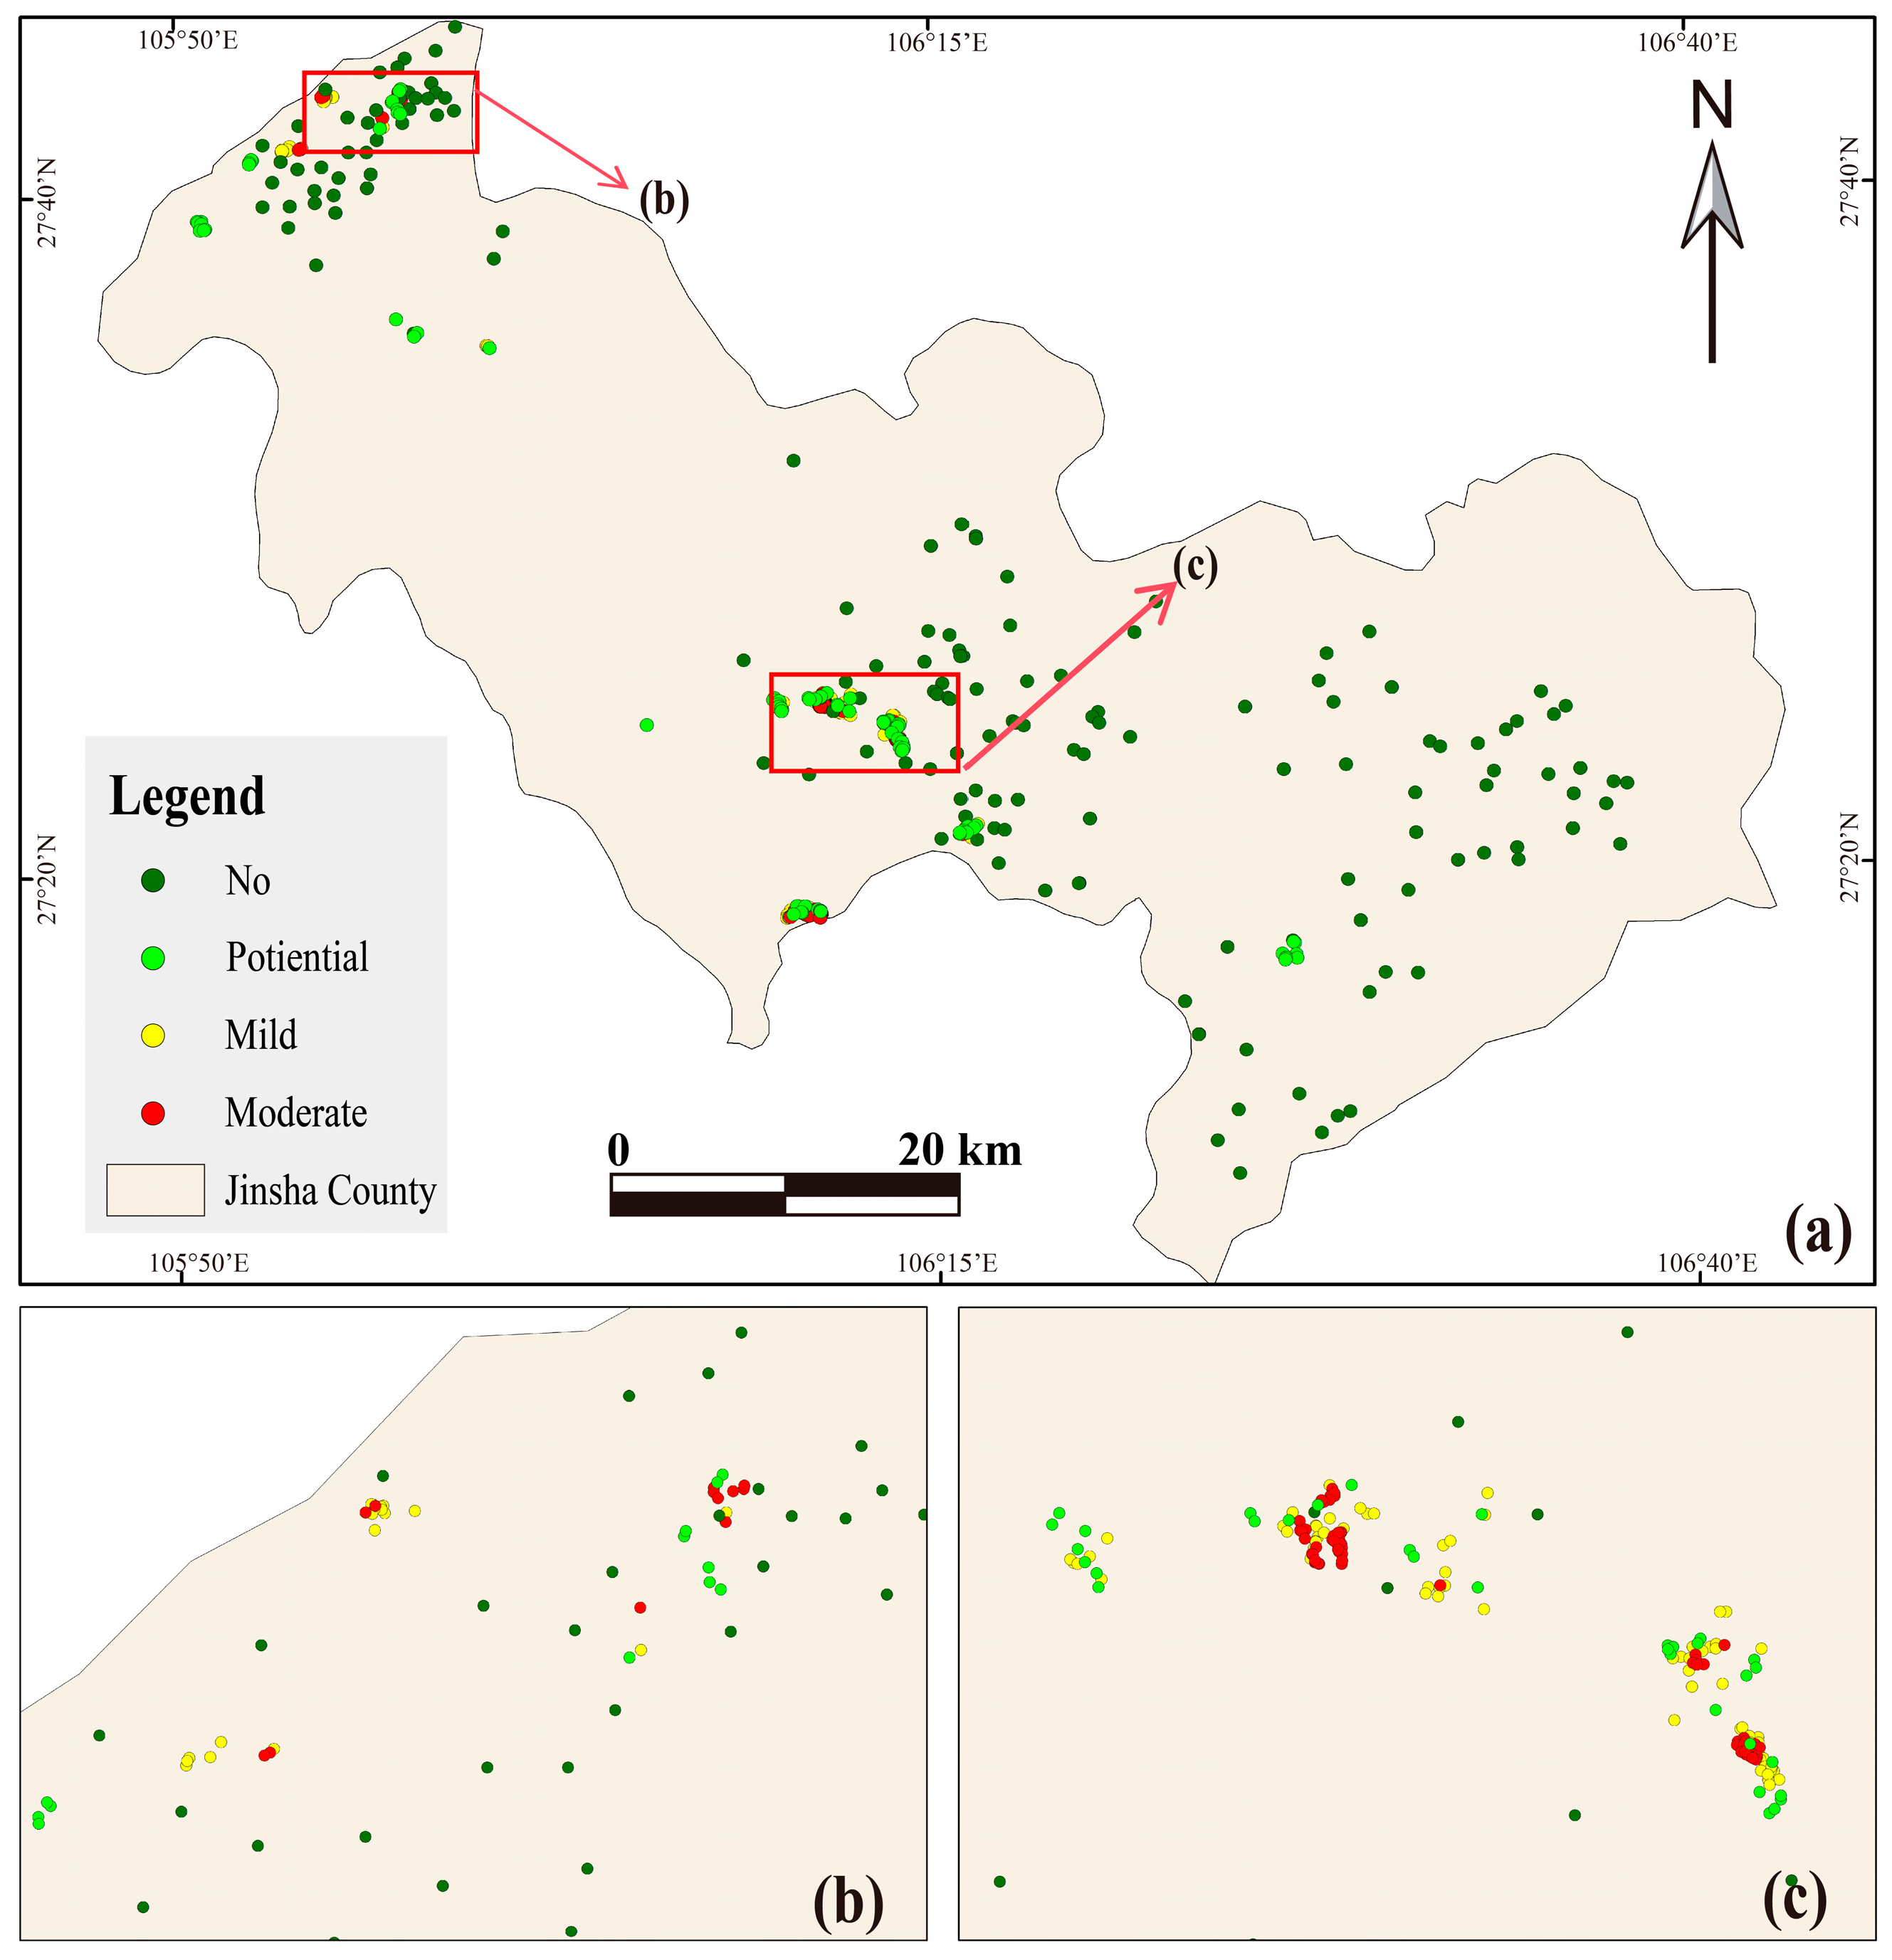
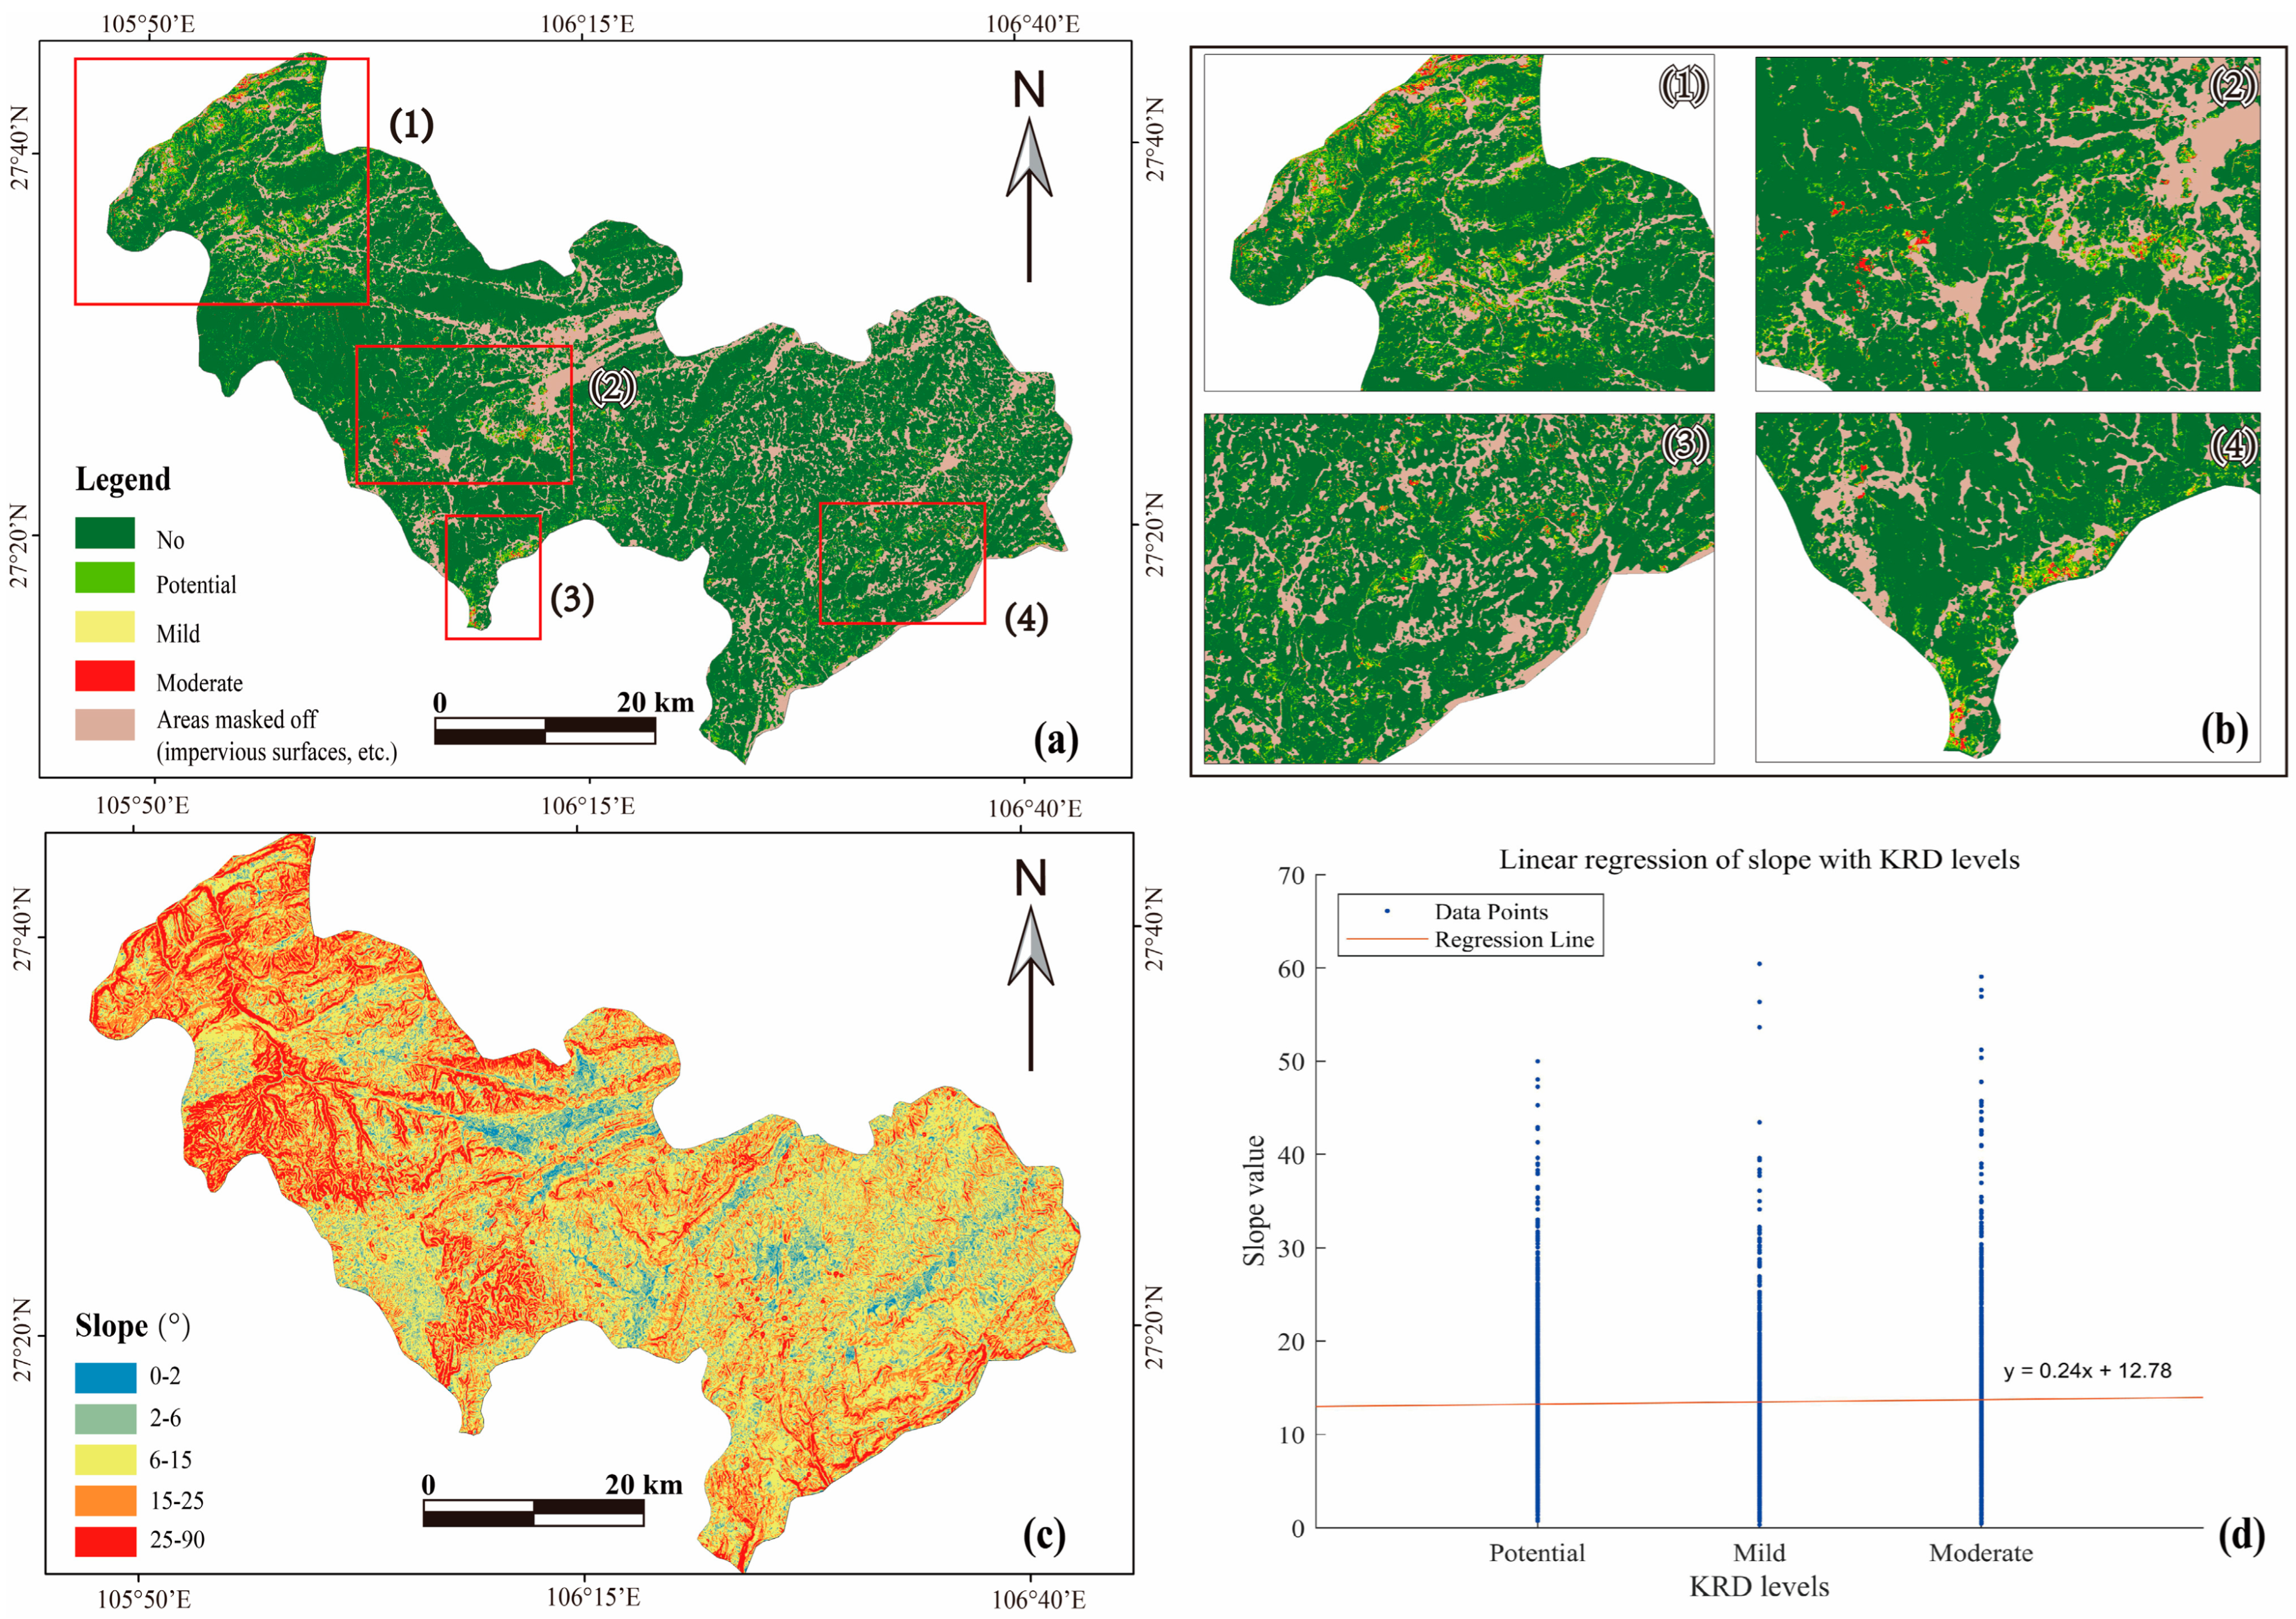
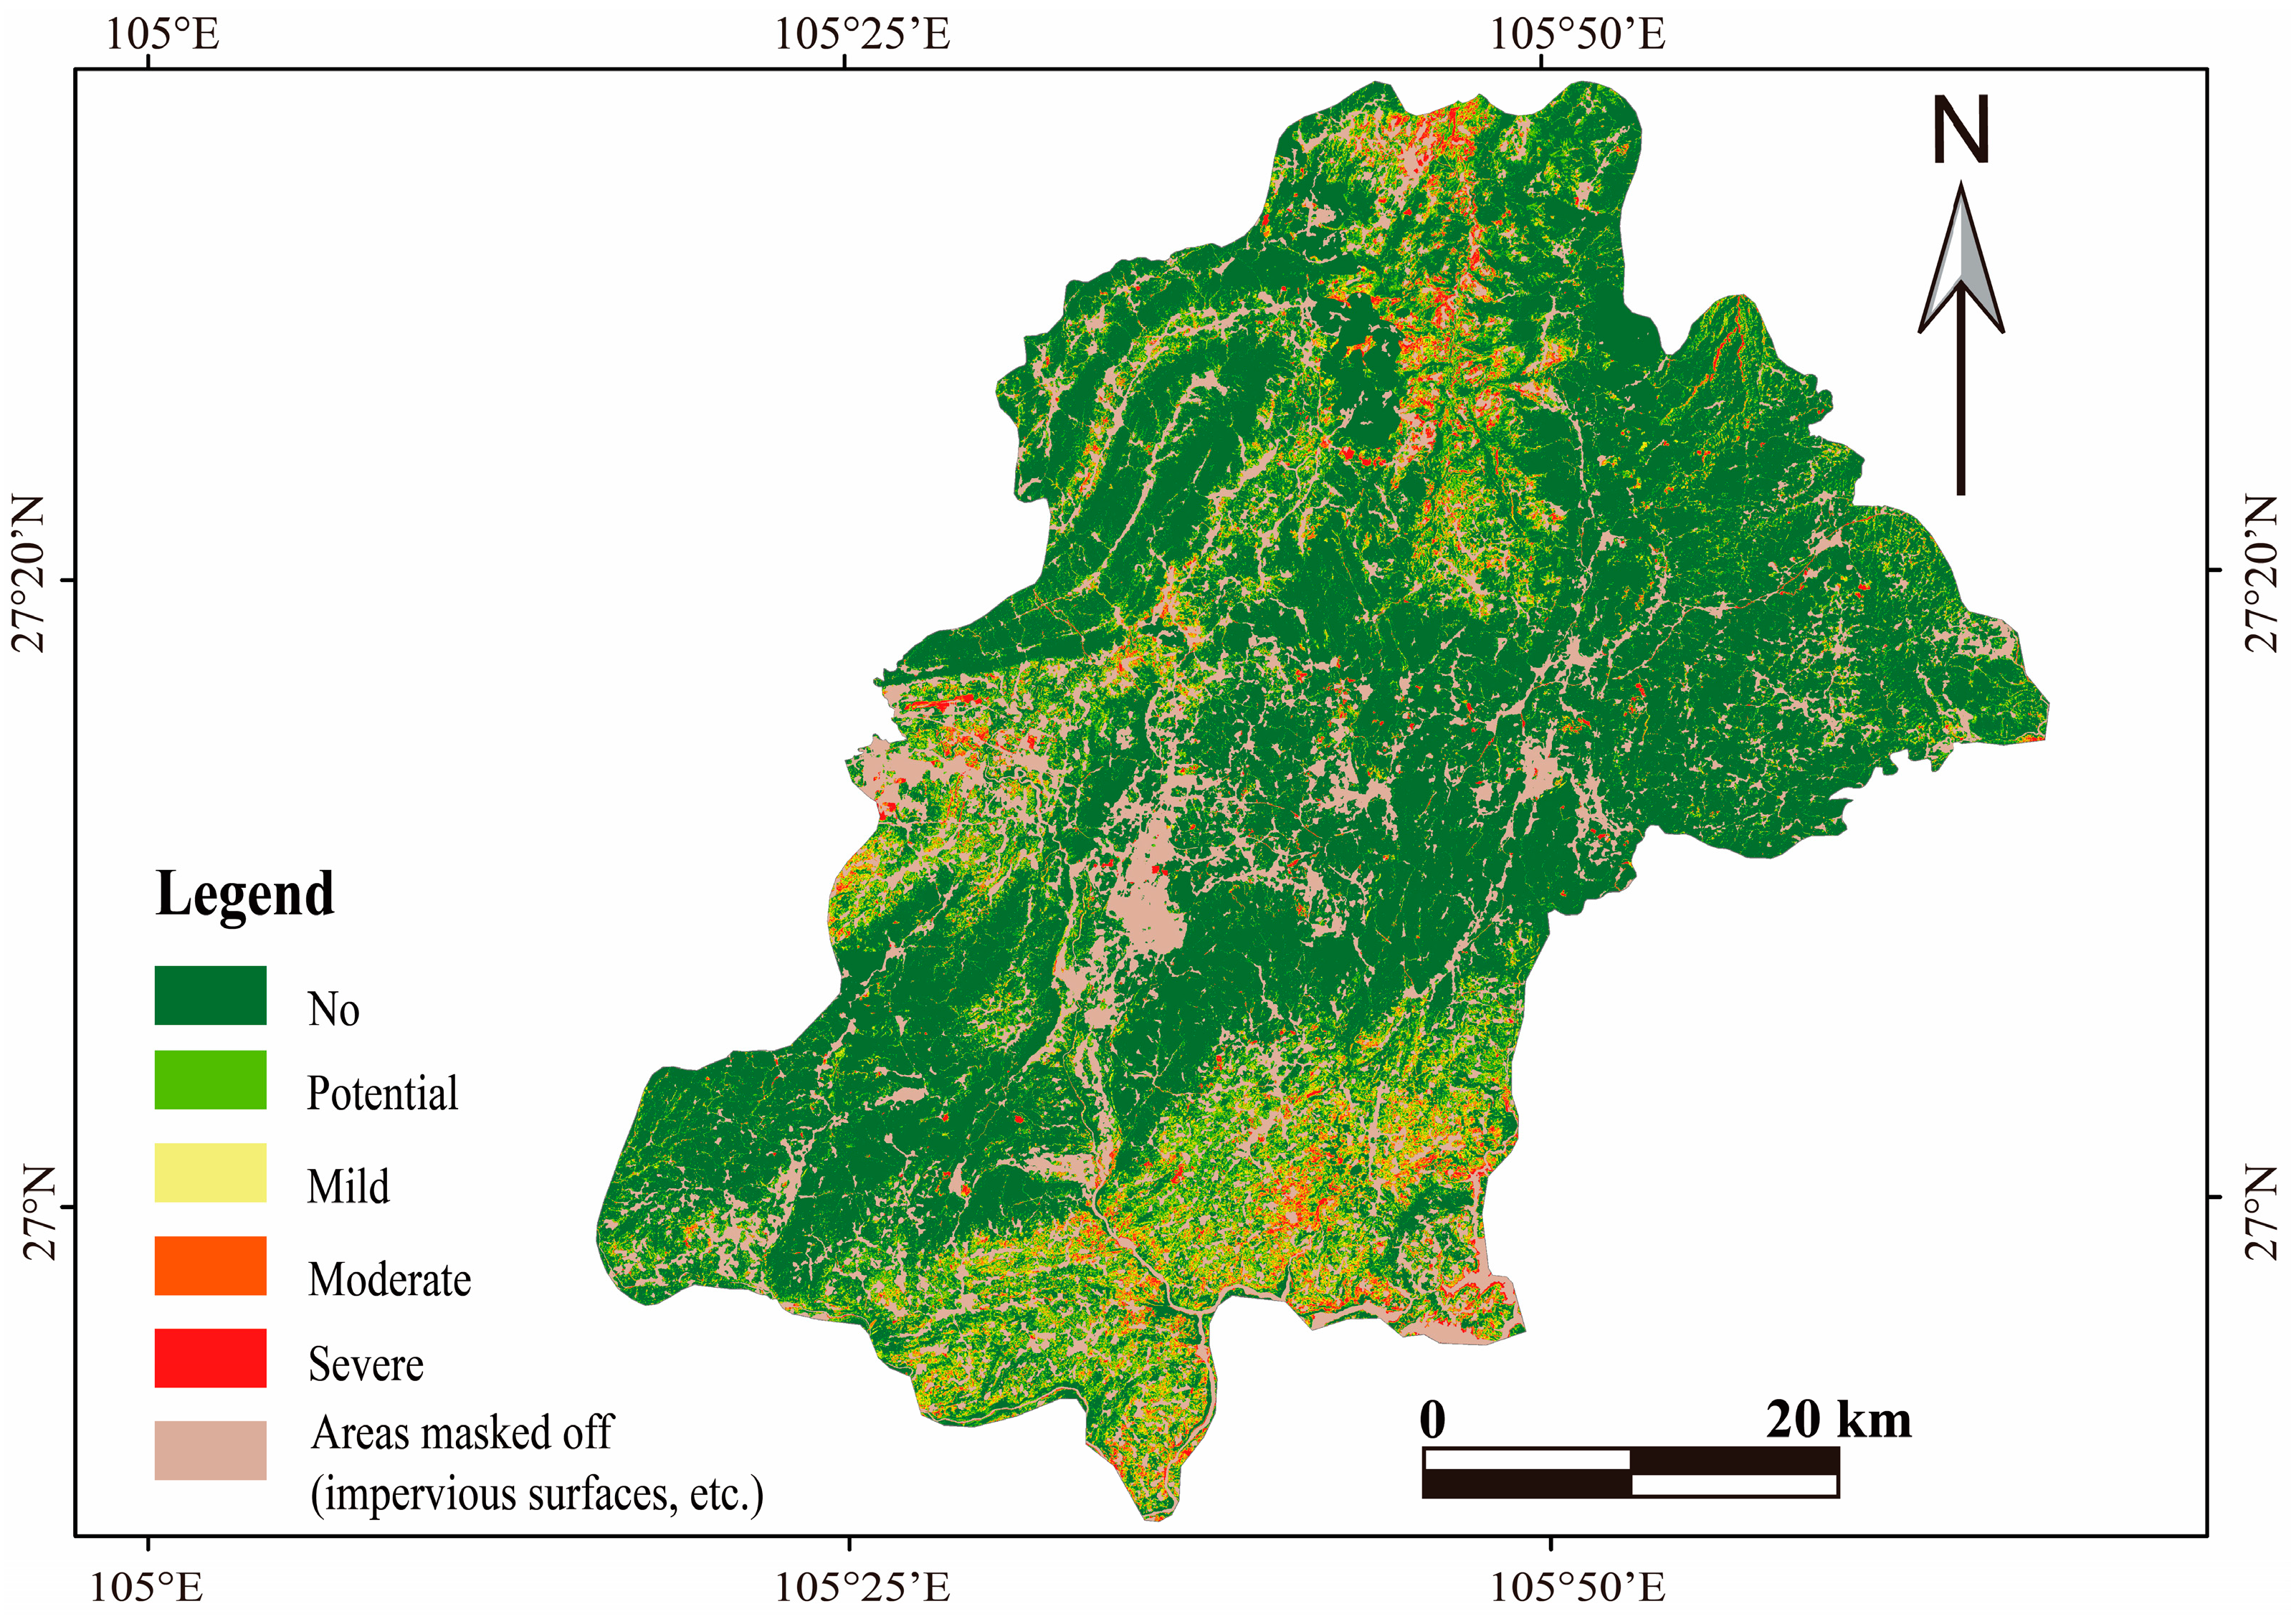
4.3. Spatial Distribution of KRD in Jinsha County

The distribution of different levels of KRD in Jinsha County obtained using the RCRI–NDRE feature space method is shown in Figure 7a. The KRD in Jinsha County is clearly distributed in patches and primarily concentrated in the northwest, with a scattered distribution in the central and eastern parts of the county. Figure 8 shows the statistical area of the different levels of KRD in Jinsha County. The KRD area in Jinsha County is approximately 221.6 km2, which covers 8.7% of the county’s total area. The potential KRD area is the largest, accounting for 70% of the total KRD area.
From the distribution of the different levels of KRD, the slope, and the linear regression between the two (Figure 7a–c), we concluded that KRD is concentrated in areas with steep slopes, and that the KRD and slopes are positively correlated. These areas experience severe soil erosion because of their steep terrain and shallow soil depth, which further promotes the occurrence and development of KRD. We also discovered that inappropriate human disturbances, such as steep slope cultivation and mining, hindered the recovery of fragile ecosystems in Jinsha County during the field investigation.

5. Discussion

5.1. The Applicability of SDGSAT-1 MSI Data for KRD Classification

The results demonstrated that SDGSAT-1 MSI data can be used to effectively distinguish between different levels of KRD. In previous studies on KRD classification based on satellite observations, Landsat data were widely exploited for KRD monitoring because they are long-term series data [18,51,52]. However, the spatial resolution of 30 m may have affected the presence of different land-cover types within individual pixels, thereby affecting the accuracy of the KRD classification [53]. The SDGSAT-1 MSI data have a spatial resolution of 10 m, enabling us to separate different land-cover types more effectively, thus improving the accuracy of the KRD classification. The SDGSAT-1 MSI data include a red edge band that can be used to detect the growth of terrestrial vegetation [28], thereby improving the accuracy of the KRD classification. Despite the lack of a short-wave infrared (SWIR) band in the SDGSAT-1 MSI data for the inversion of rock indices, we demonstrated that the effective classification of KRD could still be achieved using a linear combination of the blue, red, and near infrared bands for an inversion of the rock index. Thus, the SDGSAT-1 MSI data have potential for the classification of KRD.
In comparison to currently available optical remote-sensing data, the SDGSAT-1MSI data are deficient in terms of the presence of the SWIR band, which is provided in Sentinel-2 data. However, SDGSAT-1 MSI data have the advantage of a large bandwidth and are also capable of achieving good accuracy in the classification of KRD. Additionally, they have a higher spatial resolution (10 m) than the Landsat series and a greater number of spectral bands than the Gaofen series. The SDGSAT-1 MSI data particularly excel at vegetation classification because of the red edge bands [18]. The superior spatial resolution of the SDGSAT-1 MSI data is crucial for the monitoring of KRD, which often occurs in areas with complex terrain. Because of the susceptibility of optical remote-sensing images to weather conditions, such as clouds and rain, it is hoped that a broader range of remote-sensing data can be employed for KRD monitoring to enhance the spatial and temporal coverage, providing essential data support for the monitoring of KRD across larger areas and over extended periods of time.

5.2. The Advantage of the RCRI–NDRE Feature Space Method for KRD Classification

In this research, we constructed multiple indices to characterize rocks and vegetation by combining different bands based on the spectral reflectance characteristics of rocks and vegetation from SDGSAT-1 MSI data. A reflectance valley was formed in the red band because of the strong absorption of chlorophyll in vegetation and the red edge band exhibited high reflectance because of multiple internal reflections from leaf tissue [53]. Consequently, the addition of the red edge band enhanced the inversion capability of the vegetation index. Incorporating the red band into the Carbonate Rock Index can effectively enhance its inversion capability because there is a significant difference in reflectance between rocks and vegetation in the red band. This resulted in the combination of the RCRI and NDRE performing the best when classifying the different levels of KRD.
The constructed RCRI–NDRE feature space method achieved an OA of 87% in the KRD classification of the study area, outperforming the grading index method. This is because the feature space method more effectively considers the complex interactions among the different KRD characterization indices compared with the grading index method. The feature space method uses customized classification thresholds for different levels of KRD, making it more suitable for KRD classification in different environmental conditions.

5.3. The Universality of the RCRI–NDRE Feature Space Method

In this study, the RCRI–NDRE feature space method was applied to Dafang County, Guizhou Province—an area with severe KRD—to verify its applicability. The distribution of KRD in Dafang County is illustrated in Figure 9. The KRD in Dafang County is predominantly concentrated in the southeastern and northwestern regions, with a relatively low prevalence in the central area. This is in accordance with the results of Guo et al. [44]. Using a visual interpretation of the Gaofen images, sample points with different levels of KRD were identified for accuracy validation (Table 8). The overall accuracy of the KRD classification was 86.5% in Dafang County. This experiment demonstrates that the method is applicable to diverse KRD areas, with high accuracy and robustness for KRD classification.

5.4. Improvements for the Future

In this study, we created an RCRI–NDRE feature space method for use in KRD level classification studies based on SDGSAT-1 MSI data. The proposed method offers a novel approach to the remote-sensing monitoring of KRD and a theoretical foundation for the monitoring and prevention of KRD in karst areas. Certain aspects of the study could be improved. First, the absence of SWIR bands in the SDGSAT-1 MSI data may have been a reason why higher accuracy could not be obtained. One potential solution is to combine multi-source remote-sensing data with a greater number of bands to enhance the accuracy of the KRD classification. Second, KRD is a complex land-degradation landscape influenced by multiple factors; we only considered rock and vegetation factors in this study [26]. A greater number of influencing factors should be considered in future research.

6. Conclusions

In this study, we analyzed the potential of SDGSAT-1 MSI data and assessed the applicability of feature space in KRD classification. An RCRI–NDRE feature space method was proposed to classify the different KRD levels based on SDGSAT-1 as a new MSI data source. The main conclusions are presented below:
(1)
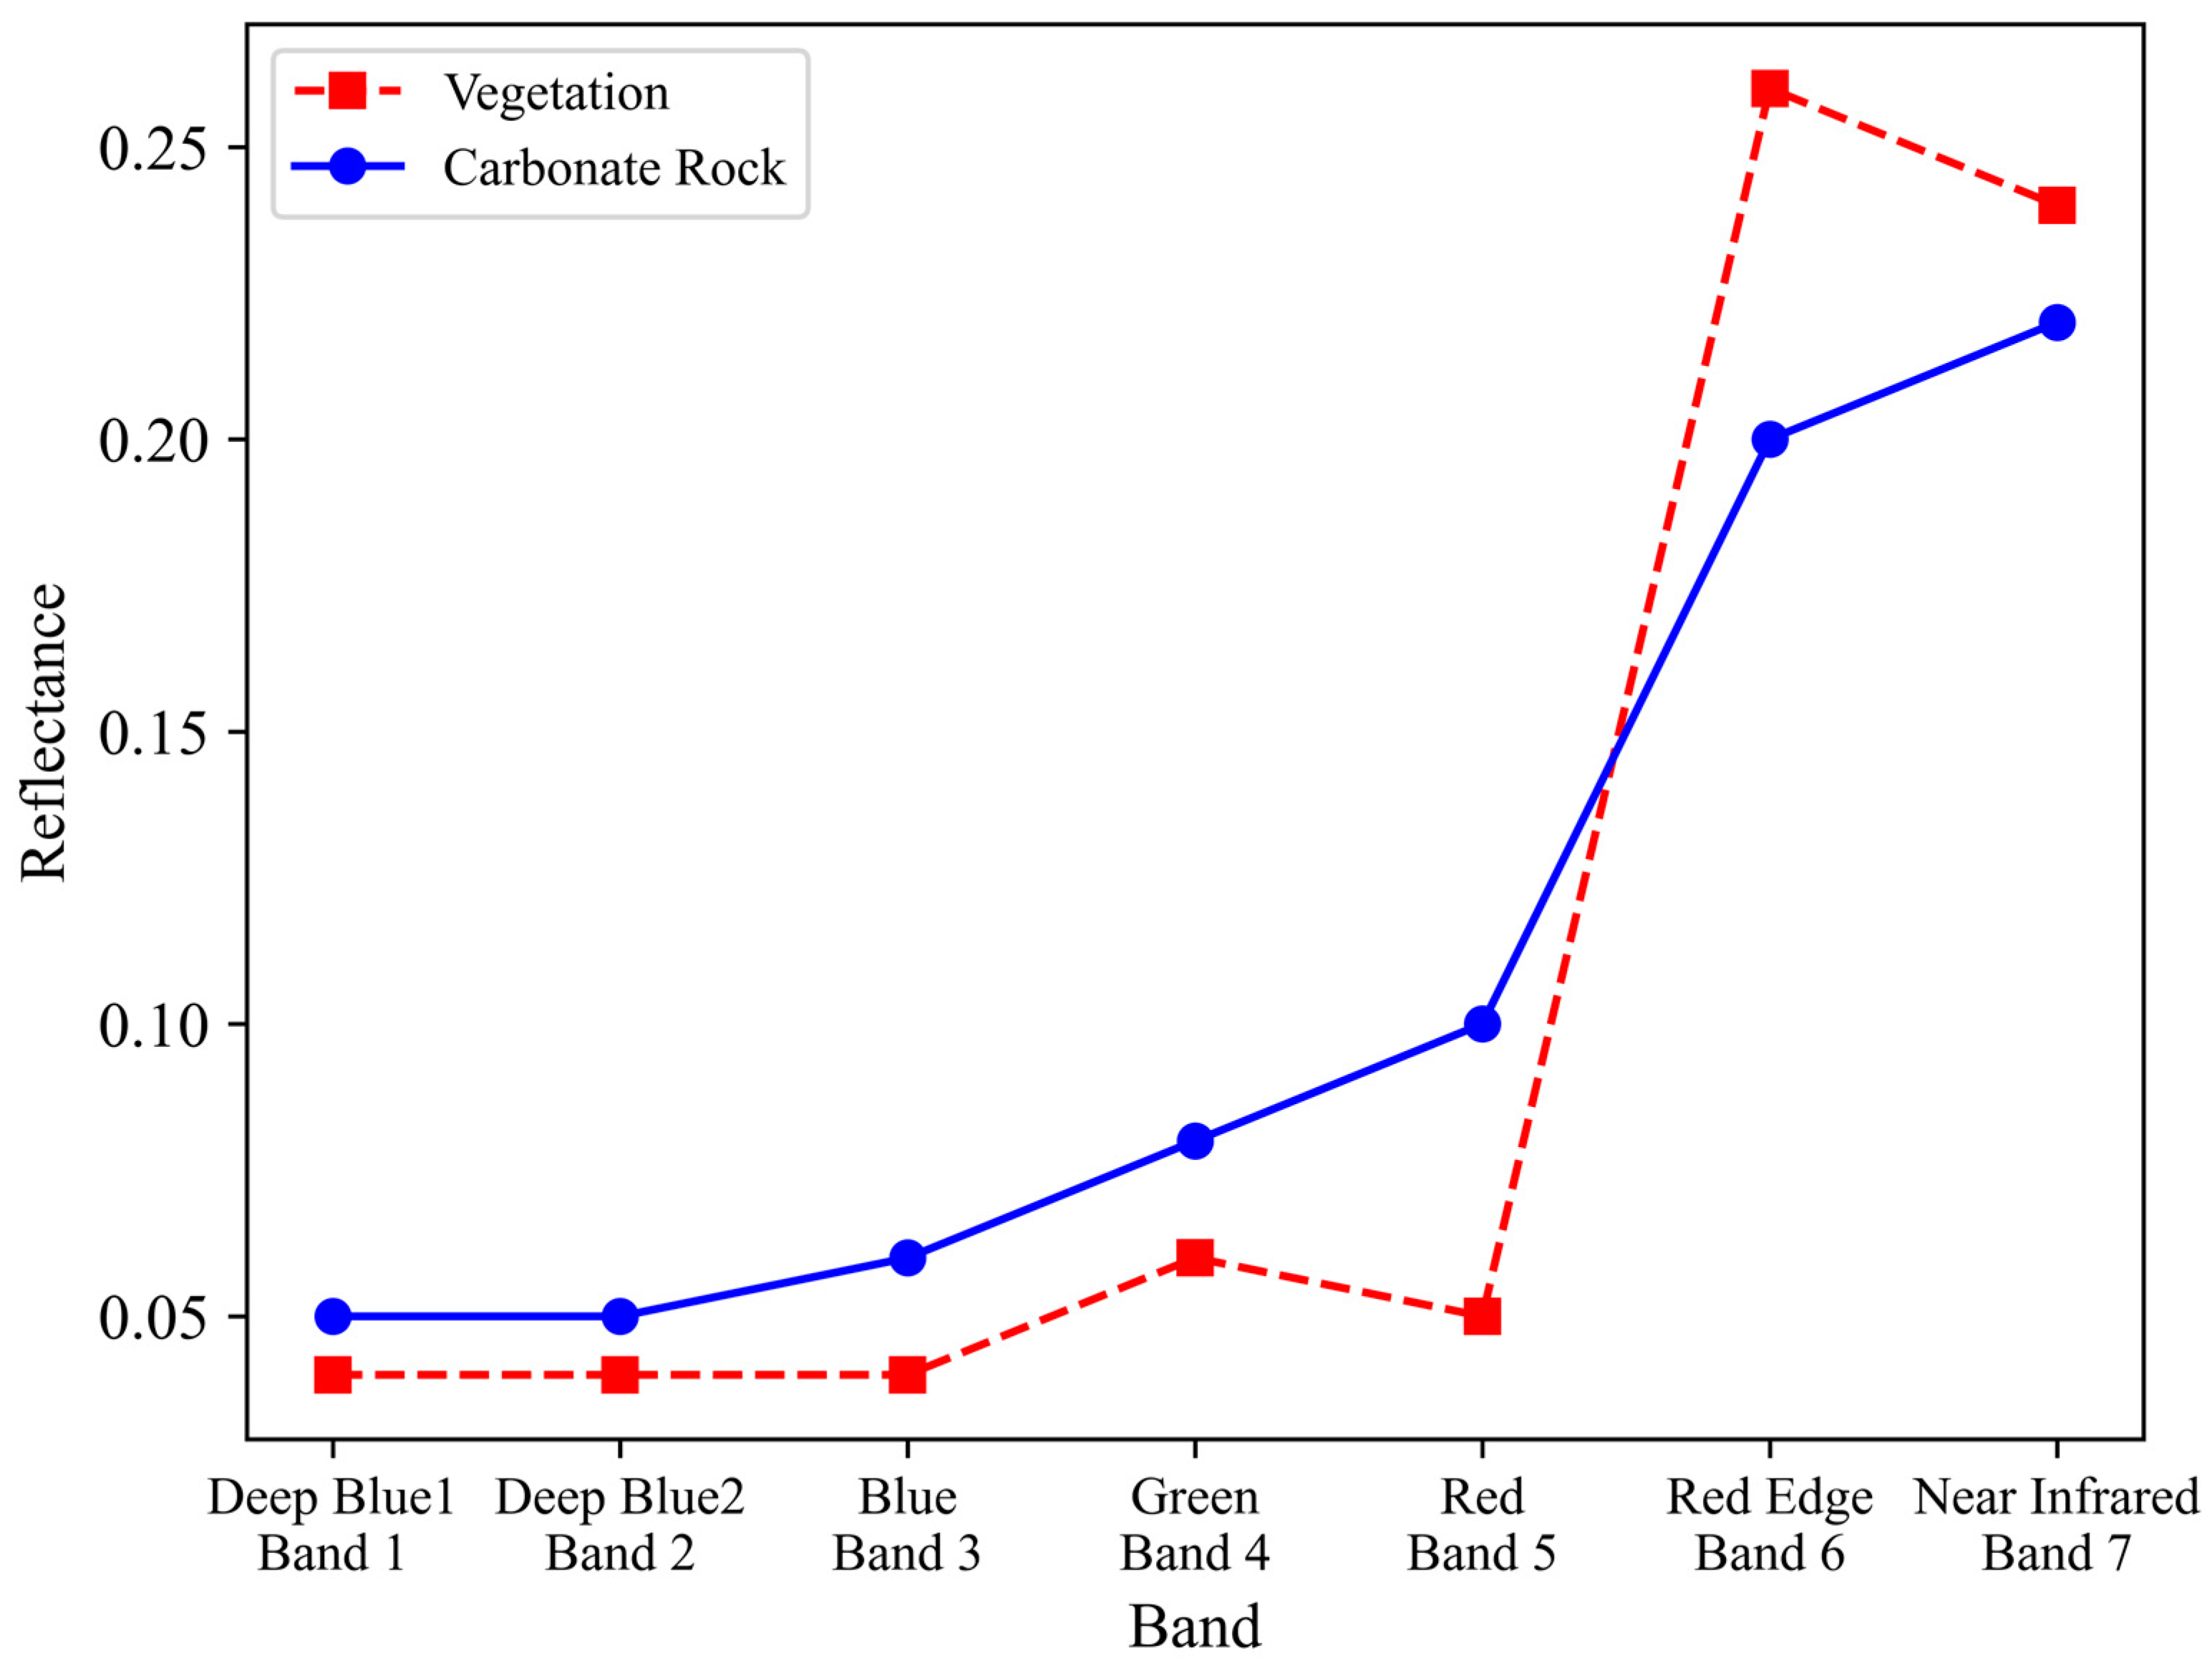
SDGSAT-1 MSI data can effectively distinguish between rocks and vegetation based on the blue band, red band, red edge band, and near infrared band, making it a potential remote-sensing data source for the classification of different levels of KRD;
(2)
The proposed RCRI–NDRE feature space method based on SDGSAT-1 MSI data achieved an overall accuracy of 87%, which was 20.7% higher than the grading index method, as well as a kappa coefficient of 0.87. It proved to be an effective method for the classification of different levels of KRD. This could provide a greater quantity of remote-sensing data with which to support the observation of KRD over a wider area and a longer period of time;
(3)
KRD in Jinsha County was primarily concentrated in the northwest and had a scattered distribution in the central and eastern parts of the county. The predominant level of KRD was potential KRD.
The classification accuracy of the KRD levels was influenced by reliable data sources and appropriate classification methods. The method proposed in this study demonstrated high accuracy in KRD classification, substantiating the applicability of the RCRI–NDRE feature space method and SDGSAT-1 MSI data in this research field. In the future, more abundant data sources will provide greater KRD remote-sensing monitoring with the launch of the Sustainable Development Goals satellite series. Developing more suitable KRD indices or constructing a higher-dimensional feature space by integrating a greater number of KRD characterization factors to validate their applicability for a larger range of KRD monitoring methods are future directions for KRD classification research.

Author Contributions

Conceptualization, H.F. and Q.C.; methodology, Q.C., H.F. and X.L.; formal analysis, Q.C. and H.F.; writing—original draft preparation, Q.C.; writing—review and editing, H.F., X.L., X.Q., L.Y. and Q.C.; supervision, H.F. and X.L.; funding acquisition, H.F. and X.L. All authors have read and agreed to the published version of the manuscript.

Funding

This research was funded by the National Nature Science Foundation of China (42201421) and the Hainan Province Science and Technology Special Fund (Grant No. ATIC2023010001).

Data Availability Statement

The MSI data of SDGSAT-1 used in this study can be obtained from the International Research Center of Big Data for Sustainable Development Goals at https://www.sdgsat.ac.cn/ (accessed on 14 September 2022). The DEM data can be acquired from the Geospatial Data Cloud Platform at https://www.gscloud.cn/ (accessed on 20 September 2022). Land cover data can be obtained from Sentinel-2 Land Cover Explorer at https://livingatlas.arcgis.com/landcoverexplorer/ (accessed on 25 September 2022). The Gaofen-2 data and Gaofen-7 data can be obtained from http://ids.ceode.ac.cn/ (accessed on 23 October 2022). Google Earth images can be acquired from Google Earth at https://www.google.cn/intl/zh-en/earth/ (accessed on 23 October 2022). Administrative division data can be obtained from the National Catalogue Service for Geographic Information at https://www.webmap.cn/ (accessed on 10 September 2022).

Acknowledgments

We gratefully thank the International Research Center of Big Data for Sustainable Development Goals for providing the SDGSAT-1 data. We also thank Yongkuan Chi from Guizhou Normal University for his help with the field data collection.

Conflicts of Interest

Author Xiaochuan Qin was employed by the company Beijing Tsinghua Tongheng Planning and Design Institute. The remaining authors declare that the research was conducted in the absence of any commercial or financial relationships that could be construed as a potential conflict of interest.

References

  1. Wang, S. Concept derivation and scientific connotation of karst rock desertification. China Karst 2002, 21, 101–105. [Google Scholar] [CrossRef]
  2. Stokes, T.R.; Griffiths, P.A. An Overview of the Karst Areas in British Columbia, Canada. Geosci. Can. 2019, 49–66. [Google Scholar] [CrossRef]
  3. Parise, M.; Pascali, V. Surface and subsurface environmental degradation in the karst of Apulia (southern Italy). Environ. Geol 2003, 44, 247–256. [Google Scholar] [CrossRef]
  4. Jiang, M.; Lin, Y.; Chan, T.O.; Yao, Y.; Zheng, G.; Luo, S.; Zhang, L.; Liu, D. Geologic factors leadingly drawing the macroecological pattern of rocky desertification in southwest China. Sci. Rep. 2020, 10, 1440. [Google Scholar] [CrossRef] [PubMed]
  5. Wang, S.; Liu, Q.; Zhang, D. Karst rocky desertification in southwestern China: Geomorphology, landuse, impact and rehabilitation. Land Degrad. Dev. 2004, 15, 115–121. [Google Scholar] [CrossRef]
  6. Jiang, Z.; Lian, Y.; Qin, X. Rocky desertification in Southwest China: Impacts, causes, and restoration. Earth-Sci. Rev. 2014, 132, 1–12. [Google Scholar] [CrossRef]
  7. Pei, J.; Wang, L.; Huang, N.; Geng, J.; Cao, J.; Niu, Z. Analysis of Landsat-8 OLI Imagery for Estimating Exposed Bedrock Fractions in Typical Karst Regions of Southwest China Using a Karst Bare-Rock Index. Remote Sens. 2018, 10, 1321. [Google Scholar] [CrossRef]
  8. Yue, Y.; Wang, K.; Zhang, B.; Liu, B.; Chen, H.; Zhang, M. Uncertainty in remote sensing information extraction of karst rocky desertification. Adv. Earth Sci. 2011, 26, 266. [Google Scholar] [CrossRef]
  9. Wu, Q.; Zheng, W.; Rao, C.; Wang, E.; Yan, W. Soil Quality Assessment and Management in Karst Rocky Desertification Ecosystem of Southwest China. Forests 2022, 13, 1513. [Google Scholar] [CrossRef]
  10. Ying, B.; Xiao, S.-Z.; Xiong, K.-N.; Cheng, Q.-W.; Luo, J.-S. Comparative studies of the distribution characteristics of rocky desertification and land use/land cover classes in typical areas of Guizhou province, China. Environ. Earth Sci. 2013, 71, 631–645. [Google Scholar] [CrossRef]
  11. Chen, S.; Zhu, N.; Zhou, G.; Yuan, X.; Shang, H.; Wang, Y. Vegetation and soil physical characteristics of artificial forests in different degrees of rocky desertification environments. J. Ecol. Environ. Sci. 2022, 31, 52–61. [Google Scholar] [CrossRef]
  12. Pu, J.; Zhao, X.; Dong, P.; Wang, Q.; Yue, Q. Extracting Information on Rocky Desertification from Satellite Images: A Comparative Study. Remote Sens. 2021, 13, 2497. [Google Scholar] [CrossRef]
  13. Chen, X.; Wang, N.; Peng, S.; Meng, N.; Lv, H. Analysis of Spatiotemporal Dynamics of Land Desertification in Qilian Mountain National Park Based on Google Earth Engine. ISPRS Int. J. Geo-Inf. 2024, 13, 117. [Google Scholar] [CrossRef]
  14. Wang, T.; Shen, X.; Luan, W. Quantitative Inversion of Soil Salinity in Different Seasons in Huinong District, Ningxia based on Sentinel-2 satellite. Acad. J. Sci. Technol. 2024, 10, 100–105. [Google Scholar] [CrossRef]
  15. Zhu, Y.; Lu, L.; Li, Z.; Wang, S.; Yao, Y.; Wu, W.; Li, Q. Monitoring Land Use Changes in the Yellow River Delta Using Multi-Temporal Remote Sensing Data and Machine Learning from 2000 to 2020. Remote Sens. 2024, 16, 1946. [Google Scholar] [CrossRef]
  16. Kuang, S.; Dai, C.; Wang, S.; Li, Z.; Wang, M.; Liu, J. Discussion on the enhancement technology of remote sensing information for karst rocky desertification. Guizhou Geol. 2009, 26, 5. [Google Scholar] [CrossRef]
  17. Cheng, Y.; Shen, L.; Mo, Y.; Sun, Y. Research status and prospect of remote sensing extraction methods for karst rocky desertification information. J. Guilin Univ. Technol. 2015, 35, 839–844. [Google Scholar]
  18. Li, S.; Wu, H. Mapping karst rocky desertification using Landsat 8 images. Remote Sens. Lett. 2015, 6, 657–666. [Google Scholar] [CrossRef]
  19. Kumar, B.P.; Anusha, B.N.; Babu, K.R.; Sree, P.P. Identification of climate change impact and thermal comfort zones in semi-arid regions of AP, India using LST and NDBI techniques. J. Cleaner Prod. 2023, 407, 137175. [Google Scholar] [CrossRef]
  20. Jing, J.; Wang, Y. Evolution characteristics of karst rocky desertification in Guangxi based on MODIS NDVI. Res. Soil Water Conserv. 2015, 22, 123–128. [Google Scholar]
  21. Wang, M.; Wang, S.; Bai, X.; Li, S.; Li, H.; Cao, Y.; Xi, H. Characteristics and key factors of karst rocky desertification evolution in a typical small watershed. Acta Ecol. Sin. 2019, 39, 6083–6097. [Google Scholar]
  22. Cao, J.; Wen, X.; Zhang, M.; Luo, D.; Tan, Y. Information Extraction and Prediction of Rocky Desertification Based on Remote Sensing Data. Sustainability 2022, 14, 13385. [Google Scholar] [CrossRef]
  23. Zhang, J.; Liu, M.; Liu, X.; Luo, W.; Wu, L.; Zhu, L. Spectral analysis of seasonal rock and vegetation changes for detecting karst rocky desertification in southwest China. Int. J. Appl. Earth Obs. Geoinf 2021, 100, 102337. [Google Scholar] [CrossRef]
  24. Cai, J.; Yu, W.; Fang, Q.; Zi, R.; Fang, F.; Zhao, L. Extraction of Rocky Desertification Information in the Karst Area Based on the Red-NIR-SWIR Spectral Feature Space. Remote Sens. 2023, 15, 3056. [Google Scholar] [CrossRef]
  25. Guo, B.; Yang, F.; Fan, J.; Lu, Y. The Changes of Spatiotemporal Pattern of Rocky Desertification and Its Dominant Driving Factors in Typical Karst Mountainous Areas under the Background of Global Change. Remote Sens. 2022, 14, 2351. [Google Scholar] [CrossRef]
  26. Guo, B.; Yang, F.; Li, J.; Lu, Y. A novel-optimal monitoring index of rocky desertification based on feature space model and red edge indices that derived from sentinel-2 MSI image. Geomatics Nat. Hazards Risk. 2022, 13, 1571–1592. [Google Scholar] [CrossRef]
  27. Guo, B.; Xu, M.; Zhang, R.; Lu, M. Dynamic monitoring of rocky desertification utilizing a novel model based on Sentinel-2 images and KNDVI. Geomat. Nat. Hazards Risk 2024, 15, 2399659. [Google Scholar] [CrossRef]
  28. Guo, H.; Dou, C.; Chen, H.; Liu, J.; Fu, B.; Li, X.; Zou, Z.; Liang, D. SDGSAT-1: The world’s first scientific satellite for sustainable development goals. Sci. Bull. 2023, 68, 34–38. [Google Scholar] [CrossRef]
  29. Song, W.; Yan, D.; Yan, J.; Hu, C.; Wu, W.; Wang, X. Ship detection and identification in SDGSAT-1 glimmer images based on the glimmer YOLO model. Int. J. Digital Earth 2023, 16, 4687–4706. [Google Scholar] [CrossRef]
  30. Wang, L.; Ye, C.; Chen, F.; Wang, N.; Li, C.; Zhang, H.; Wang, Y.; Yu, B. CG-CFPANet: A multi-task network for built-up area extraction from SDGSAT-1 and Sentinel-2 remote sensing images. Int. J. Digital Earth 2024, 17, 2310092. [Google Scholar] [CrossRef]
  31. Wang, D.; Xie, Y.; Ma, C.; Zhao, Y.; Yan, D.; Chen, H.; Fu, B.; Wan, G.; Hou, X. Identification of Industrial Heat Source Production Areas Based on SDGSAT-1 Thermal Infrared Imager. Appl. Sci. 2024, 14, 2450. [Google Scholar] [CrossRef]
  32. Yuan, B.; Wang, Q.; Yang, J.; Xu, W.; He, C. Granite Extraction Based on the SDGSAT-1 Satellite Thermal Infrared Spectrometer Imagery. Sensors 2024, 24, 1750. [Google Scholar] [CrossRef]
  33. Wu, J.; Ye, H.; Liu, Y.; Shi, J.; Wang, F.; Chen, C.; Tang, S. The Evaluation of MII/SDGSAT-1 in Red Tide Detection Along the Guangdong Middle Coast. IEEE Geosci. Remote Sens. Lett 2024, 21, 1500305. [Google Scholar] [CrossRef]
  34. Hou, Y.; Xing, Q.; Zheng, X.; Sheng, D.; Wang, F. Monitoring Suspended Sediment Concentration in the Yellow River Estuary and Its Vicinity Waters on the Basis of SDGSAT-1 Multispectral Imager. Water 2023, 15, 3522. [Google Scholar] [CrossRef]
  35. Yang, Z.; Li, X.; Shen, T.; Kabo-bah, A.T.; Cui, H.; Dong, X.; Huang, L. Sandy desertification monitoring with the Relative Normalized Silica Index (RNSI) based on SDGSAT-1 thermal infrared image. Remote Sens. Environ. 2024, 308, 114177. [Google Scholar] [CrossRef]
  36. Sun, L. Analysis of Land Use/Cover Changes and Driving Forces in Jinsha County; Guizhou Normal University: Guizhou, China, 2019. [Google Scholar]
  37. The Geospatial Data Cloud Platform. Available online: https://www.gscloud.cn/ (accessed on 20 September 2022).
  38. Sentinel-2 Land Cover Explorer. Available online: https://livingatlas.arcgis.com/landcoverexplorer/ (accessed on 25 September 2022).
  39. CAS Internal Data Sharing Website. Available online: http://ids.ceode.ac.cn/ (accessed on 23 October 2022).
  40. Google Earth. Available online: https://www.google.cn/intl/zh-en/earth/ (accessed on 23 October 2022).
  41. National Catalogue Service For Geographic Information. Available online: https://www.webmap.cn/ (accessed on 10 September 2022).
  42. The International Research Center of Big Data for Sustainable Development Goals. In Handbook of SDGSAT-1 Satellite Products (Version 1.0); Aerospace Information Research Institute, Chinese Academy of Sciences: Beijing, China, 2022.
  43. Soenen, S.A.; Peddle, D.R.; Coburn, C.A. SCS+C: A modified Sun-canopy-sensor topographic correction in forested terrain. IEEE Trans. Geosci. Remote Sens 2005, 43, 2148–2159. [Google Scholar] [CrossRef]
  44. Xie, X.; Du, P.; Xia, J.; Luo, J. Spectral Indices for Estimating Exposed Carbonate Rock Fraction in Karst Areas of Southwest China. IEEE Geosci. Remote Sens. Lett. 2015, 9, 1988–1992. [Google Scholar] [CrossRef]
  45. Yan, K.; Gao, S.; Chi, H.; Qi, J.; Song, W.; Tong, Y.; Mu, X.; Yan, G. Evaluation of the vegetation-index-based dimidiate pixel model for fractional vegetation cover estimation. IEEE Trans. Geosci. Remote Sens. 2021, 60, 4400514. [Google Scholar] [CrossRef]
  46. Zhang, X.; Gan, S. Research on the extraction of rocky desertification information based on the NDRI pixel bipartite model. New Technol. New Process 2014, 01, 72–75. [Google Scholar]
  47. Guo, B.; Yang, F.; Fan, Y.; Zang, W. The dominant driving factors of rocky desertification and their variations in typical mountainous karst areas of southwest China in the context of global change. Catena 2023, 220, 106674. [Google Scholar] [CrossRef]
  48. Zhao, Y. Principles and Methods of Remote Sensing Application Analysis, 2nd ed.; Science Press: Beijing, China, 2013; pp. 190–193. [Google Scholar]
  49. Guo, B.; Zhang, D.; Lu, Y.; Yang, F.; Meng, C.; Han, B.; Zang, W.; Wei, C.; Wu, H.; Hou, C. A novel-optimal monitoring model of rocky desertification based on feature space models with typical surface parameters derived from LANDSAT_8 OLI. Land Degrad. Dev. 2021, 32, 5023–5036. [Google Scholar] [CrossRef]
  50. Qi, X.; Zhang, C.; Wang, K. Comparing Remote Sensing Methods for Monitoring Karst Rocky Desertification at Sub-pixel Scales in a Highly Heterogeneous Karst Region. Sci. Rep. 2019, 9, 13368. [Google Scholar] [CrossRef] [PubMed]
  51. Yang, Q.; Jiang, Z.; Yuan, D.; Ma, Z.; Xie, Y. Temporal and spatial changes of karst rocky desertification in ecological reconstruction region of Southwest China. Environ. Earth Sci. 2014, 72, 4483–4489. [Google Scholar] [CrossRef]
  52. Liu, F.; He, B.; Kou, J. Investigation of karst rocky desertification in Pingguo County, Guangxi using Landsat thermal infrared remote sensing. Sci. Soil Water Conserv. 2017, 15, 7. [Google Scholar] [CrossRef]
  53. Xu, H.; Wang, Y.; Liu, Y.; Xiao, Y.; Zhou, L. Analysis of the spatial and temporal evolution and driving factors of Rocky Desertification in typical cluster depression areas in the past 30 years based on Google Earth Engine-Taking Xichou County as an example. Res. Soil Water Conserv. 2022, 29, 407–414. [Google Scholar]
Figure 1. Overview map of the study area: (a) location of Jinsha County; and (b) digital elevation model of Jinsha County [37].
Remotesensing 16 04786 g001
Figure 2. Overall workflow of this study. MSI: multispectral imager; UAV: unmanned aerial vehicle; DEM: digital elevation model; KRDI: karst rocky desertification monitoring index; KRD: karst rocky desertification.
Remotesensing 16 04786 g002
Figure 3. Reflectance spectral curves of carbonate rocks and vegetation ascertained from SDGSAT-1 MSI data.
Remotesensing 16 04786 g003
Figure 4. Principles of feature space [24,25,26]. Points A and B represent areas exhibiting low levels of KRD, whereas points C and D represent areas with high levels of KRD.
Remotesensing 16 04786 g004
Figure 5. Feature space from SDGSAT-1 MSI data. The straight line (y) represents the baseline, which is perpendicular to the line that was fitted to the rock and vegetation indices. The elliptical profiles represent the grading boundaries for different levels of KRD, with the same level of KRD lying between the two profiles.
Remotesensing 16 04786 g005
Figure 6. Distribution of sample points: (a) overall distribution of sample sites; and (b,c) local graphs of sampling points.
Remotesensing 16 04786 g006
Figure 7. KRD classification results: (a) classification result based on the RCRI–NDRE feature space method; (b) local magnification of the results of the KRD. (1), (2), (3) and (4) are the areas where KRD is more concentrated; (c) sketch map of the slope of Jinsha County; and (d) linear regression of the slope with KRD levels.
Remotesensing 16 04786 g007
Figure 8. Statistical results of areas of different levels of KRD in Jinsha County obtained using the RCRI–NDRE feature space method.
Remotesensing 16 04786 g008
Figure 9. Distribution of KRD in Dafang County with all six levels of KRD (No, Potential, Mild, Moderate, and Severe).
Remotesensing 16 04786 g009
Table 1. Data used in this study.
Band NumberBand InformationCenter Wavelength/nmRange of Wavelength/nmCloud Cover/%Spatial Resolution/m
SDGSAT-1 MSI dataBand 1Deep Blue 1400374–427<210
Band 2Deep Blue 2438410–467
Band 3Blue495457–529
Band 4Green553510–597
Band 5Red656618–696
Band 6Red Edge776744–813
Band 7Near Infrared854798–911
Data TypeSpatial Resolution/Scale
Other dataASTER GDEM [37]30 m
Land-cover data [38]10 m
Gaofen-2 data [39]3.2 m
Gaofen-7 data [39]2.6 m
Google Earth images [40]<1 m
Administrative division data [41]1:1,000,000
Table 2. Absolute radiometric calibration correction factors.
BandGainBias
Band 10.0515601330
Band 20.0362413530
Band 30.0233168350
Band 40.0158496660
Band 50.0160963810
Band 60.0197190390
Band 70.0138114580
Table 3. Decision tree classification criteria.
FVC (%)EBF (%)
<2020–3031–5051–70>71
>70NoNoPotentialPotentialPotential
51–70NoPotentialPotentialPotentialMild
36–50PotentialPotentialMildMildMild
21–35PotentialPotentialMildModerateModerate
<20PotentialPotentialMildModerateSevere
Table 4. Visual interpretation criteria for different levels of KRD.
LevelEBF (%)UAV PhotosScene Situation
No≤20Remotesensing 16 04786 i001
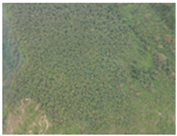
Good ecological environment, dense forest, irrigation, and grass vegetation, with no soil erosion or not serious soil erosion.
Potential20–30Remotesensing 16 04786 i002
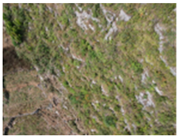
Sparsely vegetated forests, shrubs and grasslands; soil formation in good condition, but evident erosion with a tendency for rocks to be exposed.
Mild30–50Remotesensing 16 04786 i003
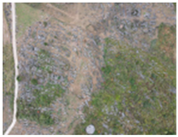
Rocks are beginning to be exposed, with evident erosion and a low vegetation structure that is mainly sparse scrub.
Moderate50–70Remotesensing 16 04786 i004Severe soil erosion, rocky outcrops, shallow soils, and low vegetation cover.
Table 5. Accuracy of KRD classification for different feature spaces.
Vegetation IndexRock IndexClassification Precision
Feature SpaceNDVICRI78.8%
RI180.2%
RI278.4%
RI377.3%
RI478.8%
RI578.3%
RCRI79.4%
RCRI280.0%
NDRECRI82.4%
RI177.2%
RI278.1%
RI377.3%
RI483.9%
RI582.3%
RCRI86.9%
RCRI285.5%
NDRE: normalized difference red edge index; NDVI: normalized difference vegetation index; CRI: carbonate rock index; R I i : i-th rock index; RCRI: red-modified carbonate rock index.
Table 6. Confusion matrix for the RCRI–NDRE feature space method.
NoPotentialMildModerateSumPA (%)
No207100121894.9
Potential5631518475.0
Mild081071513082.3
Moderate01169911685.3
Sum21283138116548
UA (%)97.676.877.585.3
OA (%)86.9
Kappa Coefficient0.87
Table 7. Confusion matrix for the grading index method.
NoPotentialMildModerateSumPA (%)
No178372121881.6
Potential2354258441.6
Mild01399013030.0
Moderate00511111695.6
Sum1807388207548
UA (%)98.847.944.353.6
OA (%)66.2
Kappa Coefficient0.64
Table 8. Confusion matrix for the RCRI–NDRE feature space method used for Dafang County.
NoPotentialMildModerateSevereSumPA (%)
No98800010691.5
Potential1273103284.4
Mild1325403375.7
Moderate0113133686.1
Severe0016313881.6
Sum10039304234245
UA (%)98.069.283.373.891.1
OA (%)86.5
Disclaimer/Publisher’s Note: The statements, opinions and data contained in all publications are solely those of the individual author(s) and contributor(s) and not of MDPI and/or the editor(s). MDPI and/or the editor(s) disclaim responsibility for any injury to people or property resulting from any ideas, methods, instructions or products referred to in the content.

