Article

A Lightweight SAR Image Ship Detection Method Based on Improved Convolution and YOLOv7

1
The College of Mechanical and Electrical Engineering, Chengdu University of Technology, Chengdu 610059, China
2
The School of Resources and Environment, University of Electronic Science and Technology of China, Chengdu 611731, China
*
Author to whom correspondence should be addressed.
Remote Sens. 2024, 16(3), 486; https://doi.org/10.3390/rs16030486
Submission received: 18 October 2023 / Revised: 18 January 2024 / Accepted: 22 January 2024 / Published: 26 January 2024
(This article belongs to the Special Issue Microwave Remote Sensing for Object Detection)

Abstract

:
The airborne and satellite-based synthetic aperture radar enables the acquisition of high-resolution SAR oceanographic images in which even the outlines of ships can be identified. The detection of ship targets from SAR images has a wide range of applications. Due to the density of ships in SAR images, the extreme imbalance between foreground and background clutter, and the diversity of target sizes, achieving lightweight and highly accurate multi-scale ship target detection remains a great challenge. To this end, this paper proposed an attention mechanism for multi-scale receptive fields convolution block (AMMRF). AMMRF not only makes full use of the location information of the feature map to accurately capture the regions in the feature map that are useful for detection results, but also effectively captures the relationship between the feature map channels, so as to better learn the relationship between the ship and the background. Based on this, a new YOLOv7-based ship target detection method, You Only Look Once SAR Ship Identification (YOLO-SARSI), was proposed, which acquires the abstract semantic information extracted from the high-level convolution while retaining the detailed semantic information extracted from the low-level convolution. Compared to the deep learning detection methods proposed by previous authors, our method is more lightweight, only 18.43 M. We examined the effectiveness of our method on two SAR image public datasets: the High-Resolution SAR Images Dataset (HRSID) and the Large-Scale SAR Ship Detection Dataset-v1.0 (LS-SSDD-V1.0). The results show that the average accuracy ( A P 50 ) of the detection method YOLO-SARSI proposed in this paper on the HRSID and LS-SSDD-V1.0 datasets is 2.6% and 3.9% higher than that of YOLOv7, respectively.

Graphical Abstract

1. Introduction

Synthetic aperture radar (SAR), with its all-weather, all-day, weather-independent imaging characteristics, has become one of the most important tools for terrestrial observation. SAR operates in an electromagnetic waveband that penetrates clouds and dust, which allows it to provide remote sensing images in complex weather environments. With airborne and satellite-based SAR, it is possible to obtain high-resolution SAR images of the ocean, and ship targets as well as the ship’s tracks are clearly visible in these images. Therefore, ship detection systems using SAR have been widely used in maritime surveillance activities and play an increasingly important role [1,2]. Among the ship target detection methods, Constant False Alarm Rate (CFAR) is one of the classical algorithms widely used for ship target detection; it detects ship targets by modelling the statistical distribution of background clutter [3]. A traditional algorithm is suitable for SAR images with simple backgrounds but not for images with complex backgrounds. In 2012, AlexNet, proposed by Alex Krizhevsky et al. [4], made a splash in the ImageNet image recognition competition, crushing the classification performance of the second place support vector machines (SVM). After this, convolutional neural networks (CNNs) have received renewed attention. It has been easy to encounter the problem of gradient disappearance in CNNs. In 2015, Kaiming He et al. proposed ResNet [5], a network with a residual block that alleviates the gradient disappearance and has had a profound impact on the design of subsequent deep neural networks. With the development of deep learning, current deep learning algorithms have far surpassed the performance of traditional machine learning algorithms. Applying deep learning to image processing can significantly improve detection accuracy and speed for tasks such as target detection and instance segmentation [4]. Currently, many authors have applied deep learning to SAR ship target detection. Jiao et al. [6] fused features of different resolutions through dense connections for solving the multi-scale and multi-scene SAR ship detection problem. Cui et al. [7] integrated feature pyramids with convolutional block attention modules to integrate salient features with global unambiguous features to improve the accuracy of ship detection in SAR images. To improve the detection speed of SAR image ship, Zhang et al. [8] proposed a high-speed ship detection method for SAR images based on grid convolutional neural network (G-CNN). Qu et al. [9] proposed an anchor-free detection model based on mask-guided features to reduce computational resources and improve the performance of ship detection in SAR images. Sun et al. [10] proposed a model based on a densely connected deep neural network with an attention mechanism (Dense-YOLOv4-CBAM) to enhance the transmission of image features. Liu et al. [11] carried out work based on YOLOv4, through feature pyramid network (FPN) [5], to obtain multi-scale semantic information and use scale-equalizing pyramid convolution (SEPC) to balance the correlation of multi-scale semantic information, and proposed SAR-Net. Wang et al. [12] added multi-scale convolution and a transformer module to YOLO-X to improve the performance of YOLO-X in detecting ships. Xu et al. [13] proposed a COCO-Net to detect the small dynamic ships on low-resolution optical satellite images. Chen et al. [14] presented an FPN model using anchor boxes obtained through Shape Similar Distance (SSD) K-means clustering for small object ship recognition in complex backgrounds. In the FBR-Net network proposed by Fu et al. [15], the designed ABP structure uses a layer-based attention approach and a spatial attention approach to balance the semantic information of the features in each layer, making the network more focused on small ships. A limited number of real-world samples of small ships may fail to train a learning method that can accurately detect small ships in most cases. To address this, a novel hybrid deep learning method that combines a modified Generative Adversarial Network (GAN) and a Convolutional Neural Network (CNN)-based detection approach was proposed by Chen et al. [16]. In order to improve the detection of small ships in complex background SAR images, Guo et al. [17] combined feature refinement, feature fusion, and head enhancement methods to design a high-precision detector called CenterNet++. Considering that contextual information is crucial for the detection of small and dense ships, Zhao et al. [18] proposed a new CNN-based method in which as many small ships as possible are first proposed and then combined with contextual information to exclude spurious ships from the predictions, improving the accuracy of ship detection in SAR images.
All of the above research contributed to the improvement of the accuracy of ship target detection in SAR images, but the following problems still exist:
  • Most of their SAR image ship target detection frameworks are designed for small ships in SAR images, and in the process of designing, the performance of recognizing large, medium, and small ships is not simultaneously well-considered. Therefore, the detection accuracy decreases for the presence of large, medium, and small ships in the SAR image.
  • Some networks use complex feature fusion in the neck part, and it is the fusion of features extracted from high-level convolutions of the backbone network, while the semantic details about the ship extracted from low-level convolutions are easily drowned out due to the stacking of the convolutions, which is not friendly to ship detection.
  • All of the above methods are mainly dedicated to the improvement of the detection accuracy of ship targets in SAR images, but do not consider the reduction in redundant parameters. Among the papers mentioned above that utilize the parameters to measure the model, the model with the least number of parameters also has 32.5 M [15]. The redundancy in the feature maps of convolutional neural networks leads to a large consumption of memory [19].
To address the above problems, we propose a new detection framework based on YOLOv7 [20]. The new detection method is more lightweight and works well for large, medium, and small ship target detection in SAR images. Our contributions can be summarized as follows.
  • A new convolutional block, which we name AMMRF, is proposed. For SAR images containing ships, it obtains feature information from different sensory fields and filters this feature information, making the network more focused on information useful for ship detection.
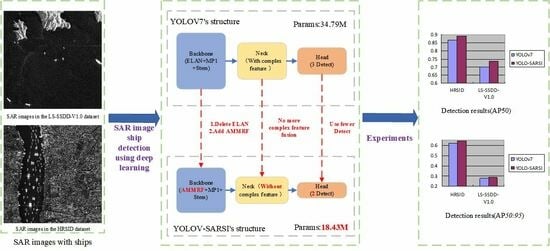
  • The addition of AMMRF to the backbone network of YOLOv7 makes the backbone network more dexterous. The addition of AMMRF makes the whole detection framework complete with feature fusion in the backbone network. Therefore, we modified the neck part of YOLOv7 by removing the complex feature fusion. We named the new detection framework YOLO-SARSI.
  • The number of parameters in YOLO-SARSI is very small, only 18.43 M, which is 16.36 M less compared to YOLOv7. Even so, the average precision of YOLO-SARSI in SAR images of ship targets is still higher than that of YOLOv7.

2. Material and Methods

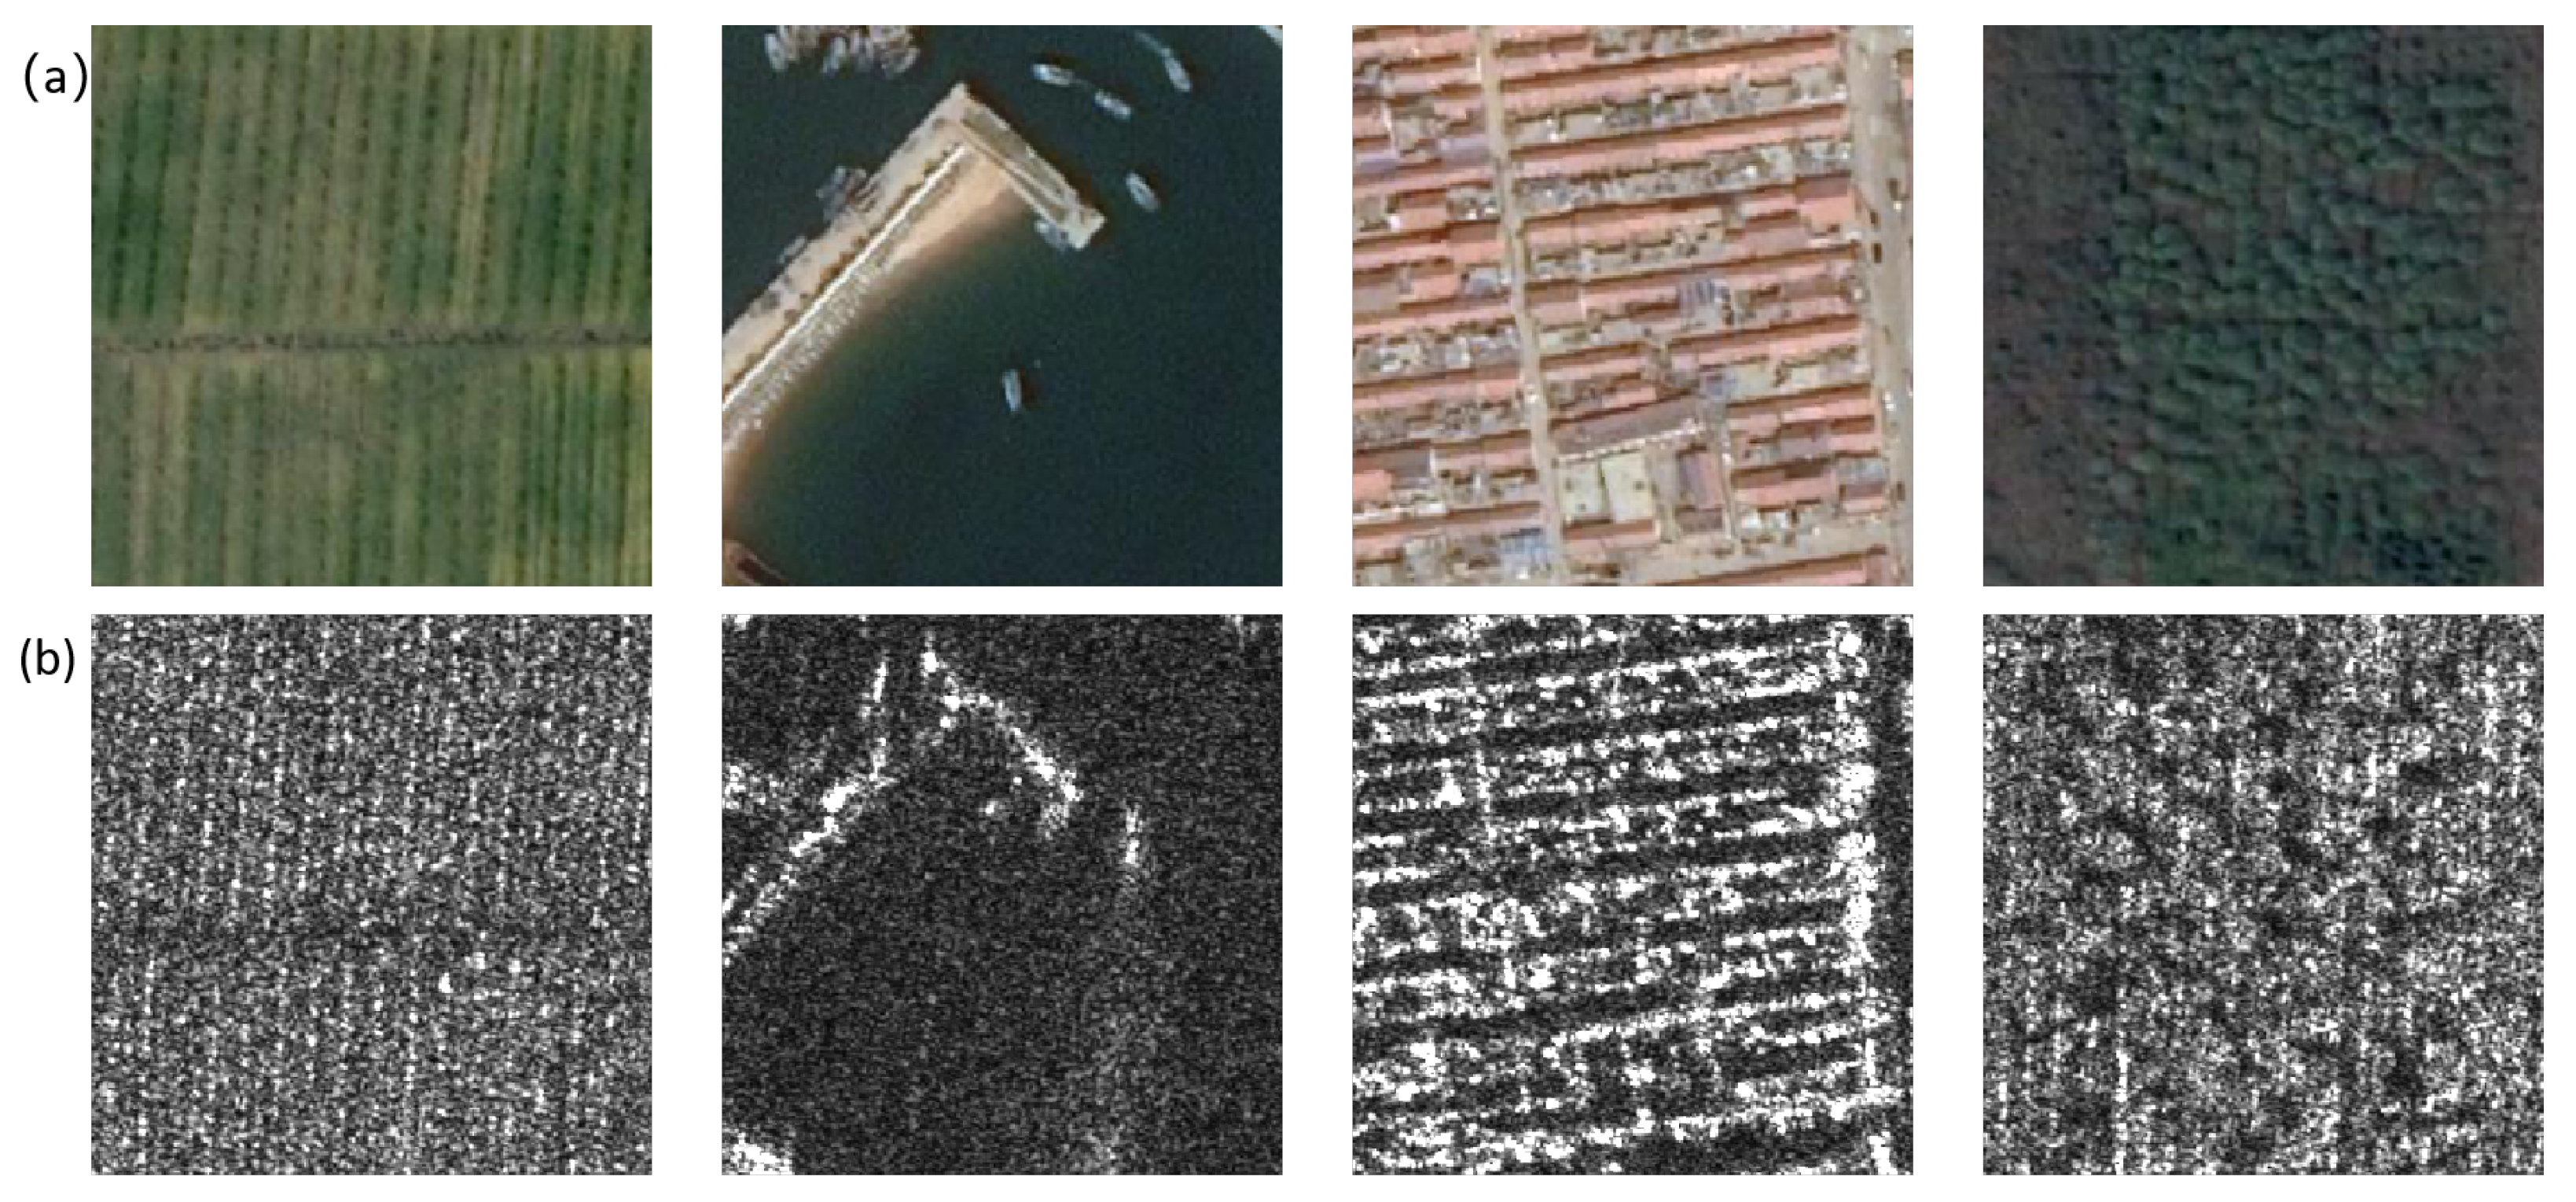
2.1. Analysis of SAR Image Features

The mainstream object detection frameworks proposed in the past, such as YOLO series, Fast-CNN [21], etc., use common objects in context (COCO) [22] or the PASCAL visual object classes (PASCAL VOC) [23] dataset to measure the performance of the recognition framework. Both the COCO dataset and the PASCAL VOC dataset are widely available object detection databases with a rich set of objects, containing 80 classes of objects in the COCO dataset and 20 classes of objects in the PASCAL VOC dataset.
Optical images are image data acquired by visible and partially infrared band sensors and will usually contain grayscale information in multiple bands to facilitate target identification and classification extraction. Figure 1 illustrates some SAR images and optical images of their corresponding regions in QXS-SAROPT dataset [24].
The high-resolution SAR image dataset [25] (HRSID) and large-scale SAR ship detection dataset-v1.0 [26] (LS-SSDD-V1.0) are grayscale images. They record only the echo information of one electromagnetic wave band. The pixel points on the SAR images are the reflections of the ground target to the radar wave, and the value of each pixel in the image is a sample, which only represents the energy of the electromagnetic wave reflected by the ground target received by SAR. Ship targets in polarimetric synthetic aperture radar images have fewer pixels than those in optical images [13]. In the radar system, rough ground targets have a higher backscatter. Smooth ground targets generally have almost no return signal. Thus, flat and smooth targets often appear as dark areas in the SAR image and rough targets appear as bright areas in the SAR image. For objects of metallic, high-dielectric-constant materials, the polarization direction of the incident wave is not necessarily parallel to the length direction of the target, but as long as there is an electric field component parallel to it, it will produce a resonance effect, forming a strong echo. In the HRSID and LS-SSDD-V1.0 datasets, ships are often shown as bright blocks or bright spots, water areas often behave as dark areas, and land areas are mostly bright areas.
There are a large number of small ships in both datasets. In Figure 2, the small ships are small in pixel size, carry less semantic information, and have fewer discriminative features.
Next, we analyze the process of human identification of ships in SAR images. Firstly the global information of the image is acquired and the areas of sea, harbor, and sea and river banks are identified. Secondly, we acquire the local information of the image to determine the bright spots or highlights in the sea, harbor, and river banks, and obtain more detailed information about these bright spots or highlights to determine whether they are ships. Some of the ships in the SAR image retain the ship’s shape, while others are simply bright blocks or bright spots. It is easy for a human to identify ships in the sea by picking up bright spots or highlights in the sea. In contrast, harbors and riverbanks have very poor visual effects and are difficult to identify, so a human needs to obtain more detailed information about the ships in these areas, such as the brightness of the ship, whether it has the shape of a ship, and the relationship between the surrounding pixels. When a human identifies a certain type of target in an image, they can easily understand the relationships between the image globally and image locally and between image localities, and unconsciously use the information reflected in these relationships when identifying such targets in that image. As can be seen, when a human identifies a ship in a SAR image, extracting information about the image globally and locally is essential for identifying the ship.
From the above analysis, it is clear that:
  • SAR images are grayscale images that carry less information than optical images. Complex detection frameworks are not necessarily suitable for SAR image ship target detection, and there may be redundancy of convolution when using these detection frameworks in recognizing ships.
  • There are many small ships in the SAR images, and the small ships carry less semantic information, which can easily be confused with other interference, leading to missed or wrong detection.
  • As can be seen from the human approach to ship detection, the network model requires global information about the image as well as high-quality semantic detail information about the ship itself.
Inspired by this, we consider that the low-level convolutional blocks should always retain the semantic information of the ship itself, while the global information of the image can be extracted through the superposition of the convolutional blocks. The entire recognition model should be as lightweight as possible, which means minimizing the number of convolutions in the model.

2.2. Improved Convolution Block: AMMRF

Our proposed convolution block is shown in Figure 3, named attention mechanisms for multi-scale receptive fields convolution block (AMMRF) for the convenience of exposition. It can be divided into three parts: 3 × 3 convolution for extracting features, 1 × 1 convolution mainly for reducing the number of feature map channels, and coordinate attention block [27] (CA) for enhancing the ability of the convolution block to learn feature representation.
GoogLeNet [28] made a big splash in the ImageNet competition in 2014, where the inception block was used to extract information from different spatial dimensions of the image by convolution of different sizes, thus allowing feature information to be extracted on different sensory fields. Figure 3 labels the five 3 × 3 convolutions in the AMMRF block as circle 1 to circle 5, which can extract feature information on different receptive fields. Convolution circle 1 has a receptive field of 3 × 3 on the input feature map. The stacking of convolutions Convolution circle 2 and circle 3 makes them have a receptive field of 5 × 5 on the input feature map. The stacking of convolutions circle 2, circle 4, and circle 5 makes them have a receptive field of 7 × 7 on the input feature map.
The residual structure of ResNet alleviates the problem of gradient disappearance to a certain extent, while the feature information extracted from the low-level convolution can be retained and output to the high-level convolution. The semantic information carried by the ship itself in the SAR image is relatively small, and the lack of feature information in the detection process can easily be confused with other interference, leading to missed and wrong detection and affecting the final results. In order to enable the lower-layer convolution to extract the semantic information of the ship itself to the higher layer, we introduced the shortcut connection in ResNet in the AMMRF. This enhances the information flow between the front and back layers, and the feature map information on the input side is also retained on the output side, which makes the weak information of the ship itself less likely to be overwhelmed, and mitigates the gradient disappearance, making the network training faster.
ResNet uses a summation method to sum up the feature maps in the channel direction, which results in a loss of dimensionality and feature information. DenseNet [29] uses a stitching method to superimpose all the feature maps in the channel direction, which can retain the feature information better than ResNet. Therefore, the output of the five 3 × 3 convolutions and the output of the shortcut concatenation was obtained using the Concat concatenation form of DenseNet. This form of concatenation superimposes different feature maps on the channels, enabling the fusion of features in the channel dimension, mapping the features to the interaction space, and better learning the relationship between the ship and the background.
Concat’s form of concatenation allows us to obtain a feature map with four times the number of channels as the input feature map X. To capture the relationships between these channels, Concat is followed by CA. CA not only makes full use of the captured location information so that the region of interest can be captured accurately, it is also effective in capturing the relationships between channels, which effectively enhances the ability of the AMMRF to learn feature representation.
In order to reduce the number of operations and parameters, we have reduced the number of channels in the feature map by using 1 × 1 convolution at the input and output.

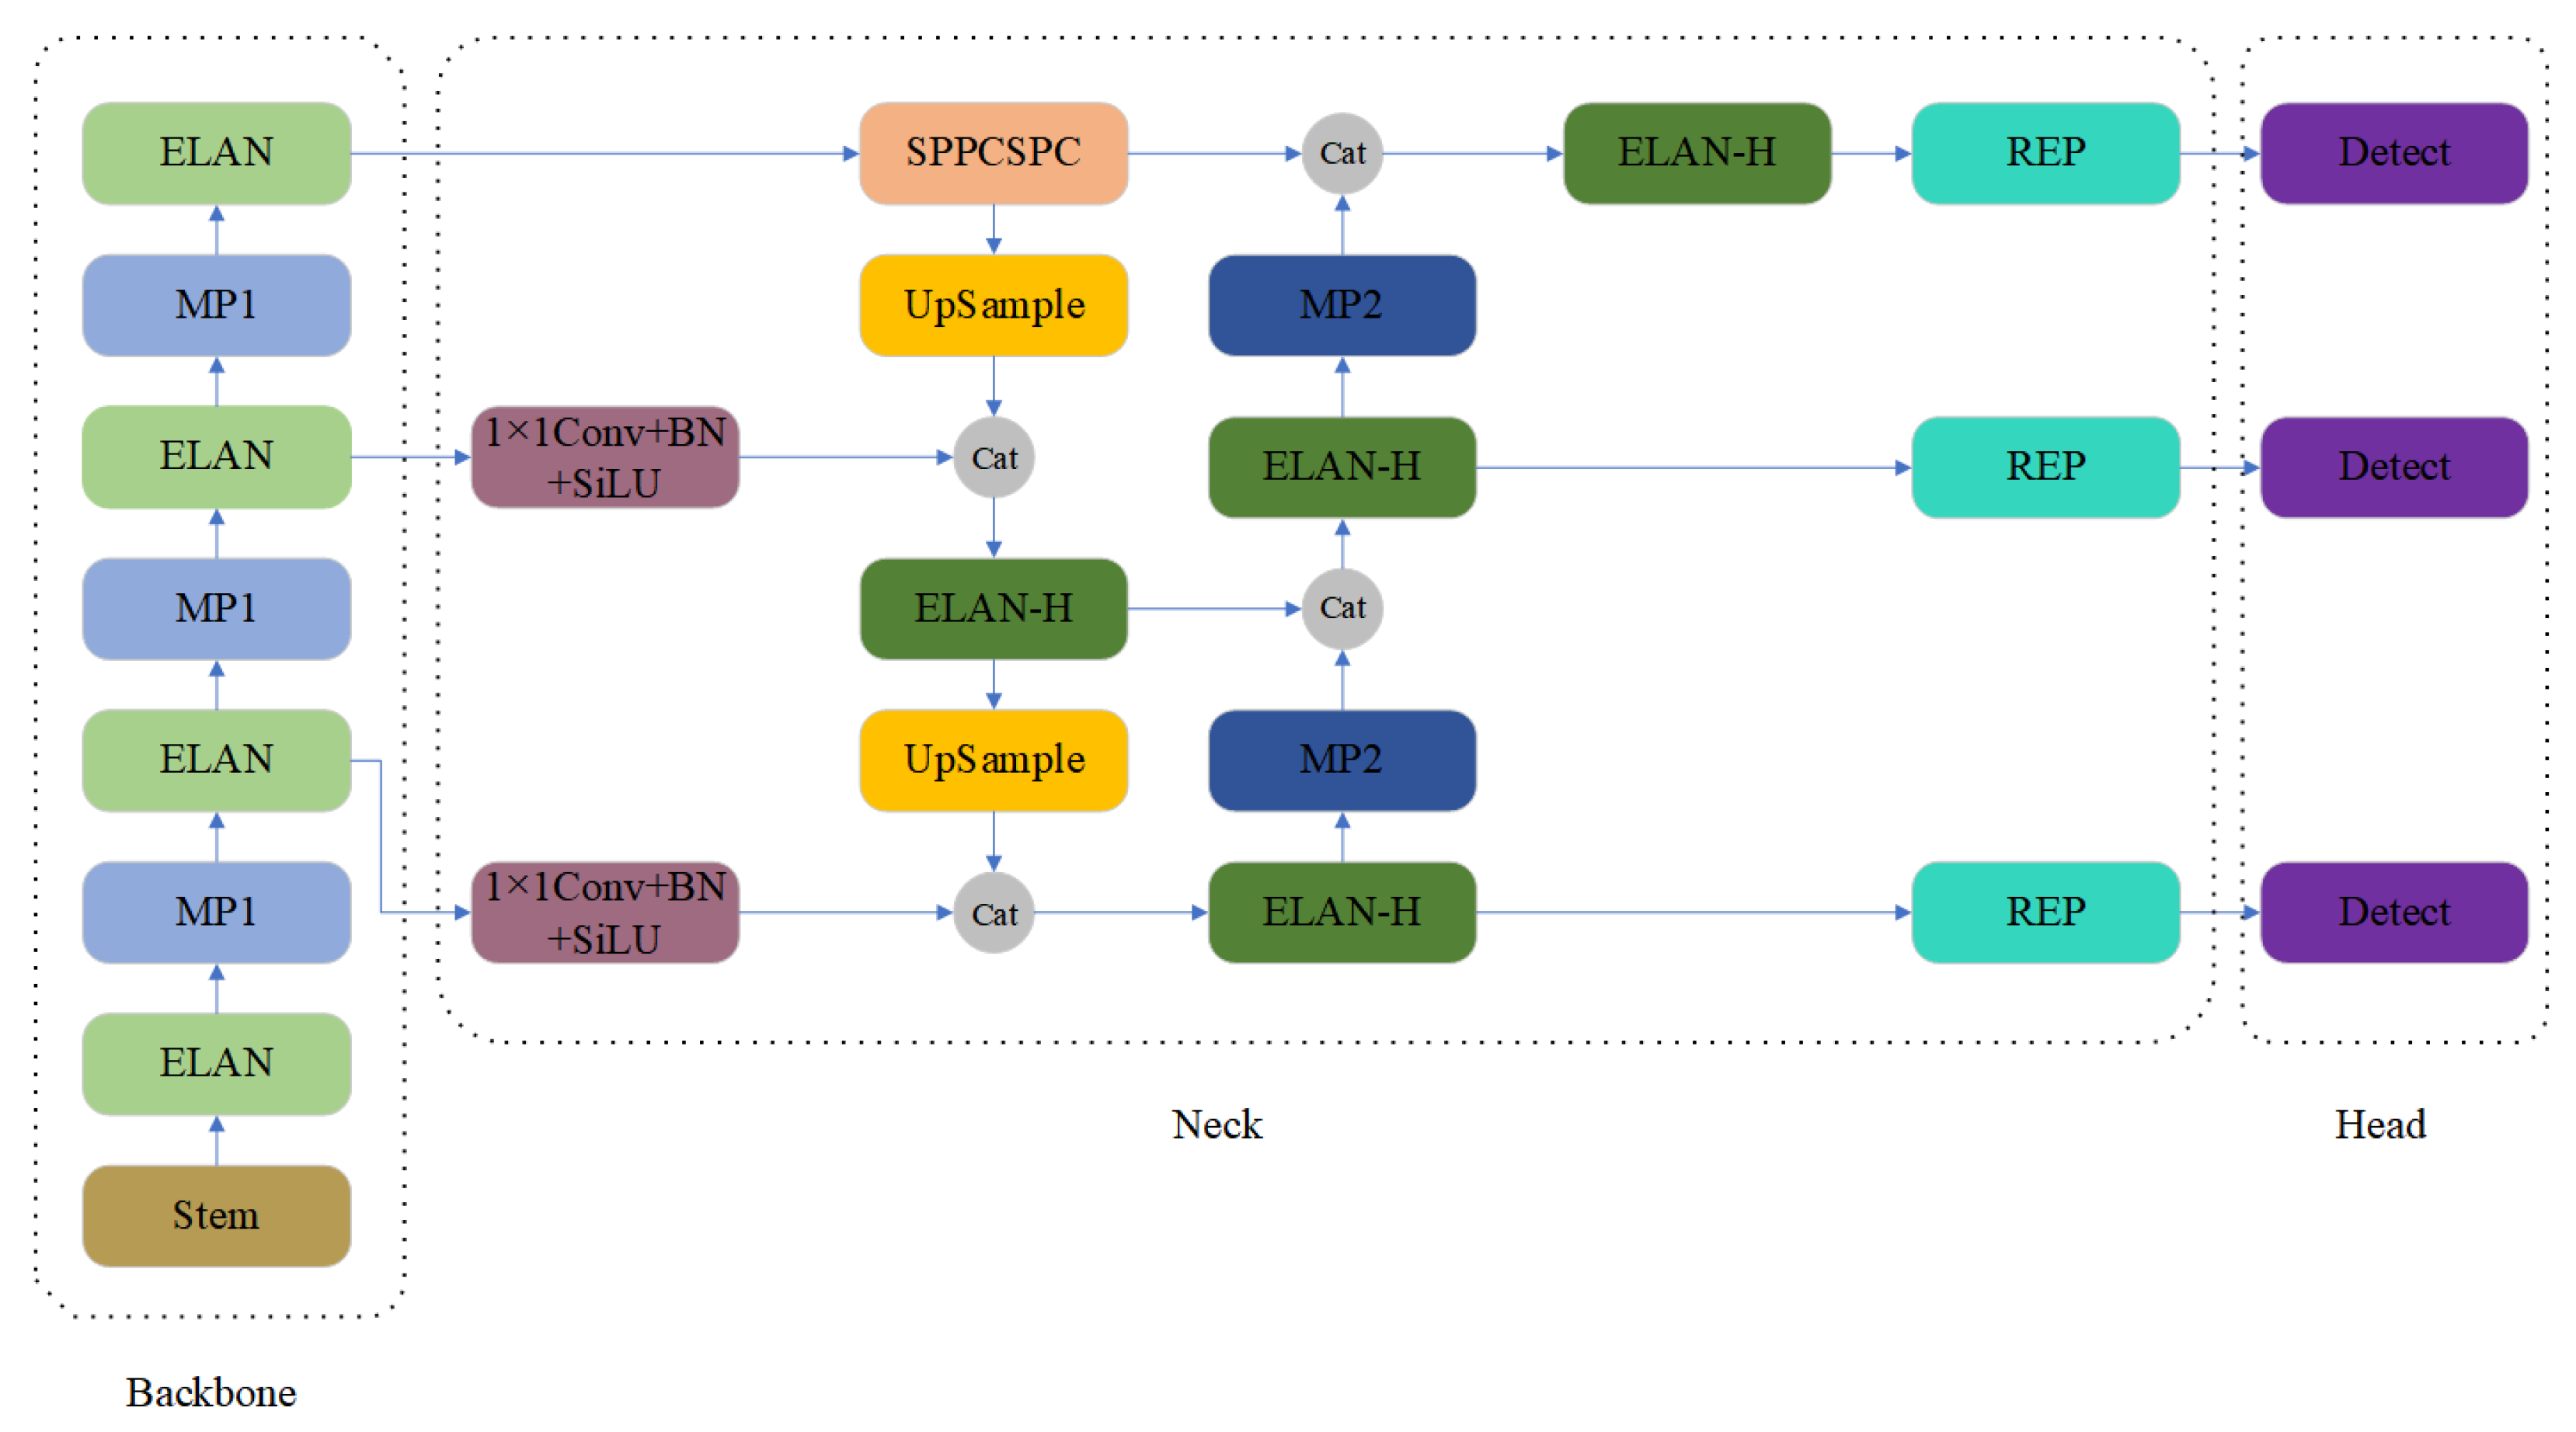
2.3. Network Structure

In this subsection, the differences between our network structure and YOLOv7 will be compared and then the advantages of YOLO-SARSI will be described. The network architecture of YOLOv7 [20] is shown in Figure 4. YOLOv7 is an anchor-based detection framework. The input image is fed into the backbone to extract features, and the backbone consists of Stem, ELAN, and MP1; the feature maps extracted from the backbone are processed by head to output three layers of feature maps with different sizes, and the neck consists of SPPCSPC, UpSample, ELAN-H, REP, and MP2. Finally, the output is processed by detecting prediction results.
Based on YOLOv7, we propose a new network architecture, as shown in Figure 5, which we named You Only Look Once-SAR image Ship Identification (YOLO-SARSI). It is also divided into three parts: the backbone for feature extraction, the neck for reprocessing and rationalizing the features extracted from the backbone network, and the head for final prediction detection.
In the backbone, we replaced the ELAN of YOLOv7 with AMMRF, while removing one layer of MP1 and ELAN. When stacking AMMRF to extract features from SAR images, the extracted feature maps always accept feature information of different convolutional layer depths, and the feature maps obtained by deep convolution always retain the details of the images extracted by shallow convolution feature information. Therefore, in the backbone, we use the stacking of AMMRF, so that the features extracted from the backbone incorporate information from different scales and different depths of convolution, and the presence of residual links in AMMRF can make the deep convolution also retain the features proposed by the shallow convolution. This means that the feature information extracted in the deep layer network retains both global and local information of the image, as well as fine-grained feature information of the image, such as the semantic information of the ship itself. YOLO-SARSI is still an anchor-based single-stage target detection model. In the backbone of YOLO-SARSI, four 3 × 3 convolutions form the Stem block, which extracts the detailed information of the image itself and reduces the size of the output to one quarter of the input, completing the downsampling operation, which reduces the number of parameters of the model.
In the neck, we still use the same convolutional block as in YOLOv7, except that we do not use any feature fusion in this part, and the number of feature maps output from the backbone network to the neck is reduced from three to two. SPPCSPC, ELAN-H, REP, and MP1 all use the blocks in YOLOv7. In YOLOv7, upsampling was used to fuse the small size features from the high-level convolution to the large size features from the low-level convolution, but upsampling often has some side effects, such as noise amplification. If downsampling is used to fuse the feature map obtained from the lower convolution to the small size feature map obtained from the higher convolution, there will be redundancy of features. Therefore, in the YOLO-SARSI neck, we do not use any feature fusion. This also allows the model to have a smaller number of parameters.
In the anchor-based YOLO series, the feature maps extracted from three different depths of convolutional layers of the backbone network are used to identify targets. The feature maps extracted from these three different convolutional layers have different sizes and are used to detect targets of three different sizes. In the two datasets HRSID and LS-SSDD-V1.0, the proportion of large targets is very small. In YOLO-SARSI, the output feature maps of the second AMMRF layer and the third AMMRF layer are used to detect small ships and large and medium-sized ships, respectively.

3. Experimental Results

In this paper, all experiments were carried out on a cloud server equipped with an NVIDIA V100-SXM2 (32 G graphics memory) graphics processing unit (GPU). The NVIDIA V100-SXM2 is manufactured by NVIDIA (NVIDIA Corporation, Santa Clara, CA, USA), an American company. We used the Python 3.8 compiled language to implement the training and CUDA 11.3 to accelerate the computations. In the experiments, the SDD300 [30], Cascade R-CNN [31], Faster R-CNN [32], Mask R-CNN [33], Retinanet [34], and Swin Transformer [35] are all based on the mmdetection platform [36], and YOLOv7 is derived from the publicly available source code by the authors of YOLOv7.
There are 5604 cropped SAR images and 16,951 ships in HRSID and 9000 cropped SAR images and 6015 ships in LS-SSDD-V1.0. The LS-SSDD-V1.0 dataset has more pure background images. The image size in both datasets is 800 × 800 pixels The ship pixel area in the image is used to measure the ship size, i.e., the relative pixel size, rather than the physical size. The average ship pixel area in LS-SSDD-v1.0 is only 381 pixels, while the average ship pixel area in HRSID is 1808 pixels. The dataset is divided into three types of ships based on their pixel area size: small ships (pixel area less than 482 pixels), medium ships (pixel area between 482 and 1452 pixels, and large ships (pixel area greater than 1452 pixels) [25,26]. The statistics of the number of ships of three sizes in the two datasets are shown in Figure 6.
No pre-trained models were used for any of the training. That is, all models were trained from scratch. In order to achieve the best performance of all models on the dataset, the number of iterations for the training cycle on the HRSID dataset was 60 and the LS-SSDD-V1.0 dataset had smaller ship targets and more complex images, so the number of iterations for the training cycle on the LS-SSDD-v1.0 dataset was 128. The dataset was provided with an image size of 800 × 800 and the input sizes in the recognition framework were all 800 × 800.

3.1. Evaluation Metrics

We adopt the precision, recall, average precision (AP), and the parameters of a convolutional layer (Params) to evaluate the detection performance. Precision and recall are two widely used evaluation metrics, and they are defined as
R e c a l l = N T P N T P + N F N
R e c a l l = N T P N T P + N F P
where N T P , N F N , and N F P denote the number of true positives (TP), false negatives (FN), and false positives (FP), respectively. TP represents the correctly detected ships. FP indicates the false alarms and FN is the missing ships.
The widely employed mean average precision (mAP) is the average of the accuracy of all categories. Since there is only one type in the HRSID and LS-SSDD-v1.0 (ship), the result obtained by calculating A P is the mAP. The derivation formula of A P is defined as
A P = 0 1 P ( R ) d R
where R represents recall and P represents precision. Generally speaking, the higher the AP corresponding to the model, the better the detection performance of this model. Since AP is obtained by integrating P(R) with R, the precision–recall curve can display the overall performance of algorithms.
Intersection over union (IOU) is an important and standard index to measure the accuracy of object detection in the dataset. Its calculation is defined as follows:
I O U = A B A B
where A represents ground truth for the real ship and B represents bounding box for the ship detected by the model.
According to different intersection of union (IOU) thresholds, average precision can be divided into A P 50 and A P 50 : 95 . Once the mentioned IOU threshold is set to 0.5, the result obtained by Formula (3) is A P 50 . In general, IoU ≥ 0.5 is considered a good prediction. In this paper, a model is considered successful in detecting a ship target when the IOU value between its prediction frame and the real target frame is higher than 0.5. If IoU gradually increases between 0.5 and 0.95 in steps of 0.05, the average of the ten values obtained is A P 50 : 95 .
The parameters of a convolutional layer can be obtained by Formula (5), and the parameters of the entire model can be obtained by adding the parameters of all layers. In Formula (5), k h and k w represent the size of the convolution kernel, C i n means the number of channels of the input feature map, and C o u t means the number of channels of the output feature map.
P a r a m s = ( k h · k w · C i n ) · C o u t

3.2. YOLO-SARSI Recognition Accuracy Evaluation

We tested state-of-the-art methods on the HRSID dataset and the LS-SSDD-V1.0 dataset for comparison with our method. Table 1 shows the experimental results of our method and other state-of-the-art methods. It can be seen that YOLO-SARSI has a significant advantage over the excellent two-stage detection algorithms Cascade R-CNN, Faster R-CNN, and Mask R-CNN, both in terms of A P 50 and the number of parameters of the model. Compared with YOLOv7, YOLO-SARSI improved 2.6% on A P 50 and 2.2% on A P 50 : 95 for the HRSID dataset. Most of the ships in LS-SSDD-V1.0 are small targets which have less information on themselves and are difficult to detect, and although they only improved 0.8% on A P 50 : 95 for this dataset, they improved significantly by 3.9% on A P 50 . YOLO-SARSI has fewer network parameters, which requires less hardware storage space when deployed in an embedded chip. Although the number of parameters in SDD300 is only 5.32 M more than the model presented in this paper, the A P 50 and A P 50 : 95 of YOLO-SARSI are much higher on both datasets. YOLO-SARSI is not only a lightweight model, but also a high-precision model.
In recent years, the Transformer-based target detection method has performed better compared to CNN-based target detection methods. The Transformer-based target detection method is the best model on computerized common target detection data such as COCO test-dev, COCO minival, and COCO-O datasets. For this reason, we replaced the backbone network of RetinaNet with Swin Transformer in our experiments, but the results were not as good as the original RetinaNet. In fact, the Transformer-based target detection method requires a large amount of data for training. Transformers lack some of the inductive biases inherent to CNNs, such as translation equivariance and locality, and therefore do not generalize well when trained on insufficient amounts of data [37]. Both HRSID and LS-SSDD-V1.0 are small sample datasets compared to the COCO dataset, and we believe that their data volumes are insufficient for the Transformer target detection method.
There are 2396 more images in the LS-SSDD-V1.0 dataset than in the HRSID dataset, but the detection results of the same model on the LS-SSDD-V1.0 dataset are not as good as those on the HRSID dataset. Compared to the HRSID dataset, the image quality of the LS-SSDD-V1.0 dataset was worse. The ships in the LS-SSDD-V1.0 dataset are basically small targets, which makes it very difficult for the model to identify the features that the ships themselves carry, such as the shape of the ship, from these small targets.
Meanwhile, there are only 0.67 ships per image on average in the LS-SSDD-V1.0 dataset, while there are 3.02 ships per image in the HRSID dataset. In the LS-SSDD-V1.0 dataset, the small number of ship targets tends to cause an imbalance between positive and negative samples of the data, which tends to lead to a large number of negative samples, making the training process ineffective, and the loss gradient of negative samples tends to dominate, leading to a decrease in the performance of the model.
Based on the experimental results, we plotted the precision–recall curves (PR curve) of each model on the HRISD dataset and LS-SSDD-V1.0 dataset, as shown in Figure 7.
The horizontal axis of the PR curve is recall and the vertical axis is precision, which reflects the relationship between precision and recall. The area between the curve and the two axes is the A P 50 . The higher the recall and precision, the better the model, i.e., the more convex the PR curve is, the better the model. The more convex the PR curve is, the better the model is. If the PR curve of one model is completely surrounded by the curve of another model, it can be concluded that the latter is better than the former. From Figure 7, it can be seen that the PR curve of YOLO-SARSI encompasses almost all other models.

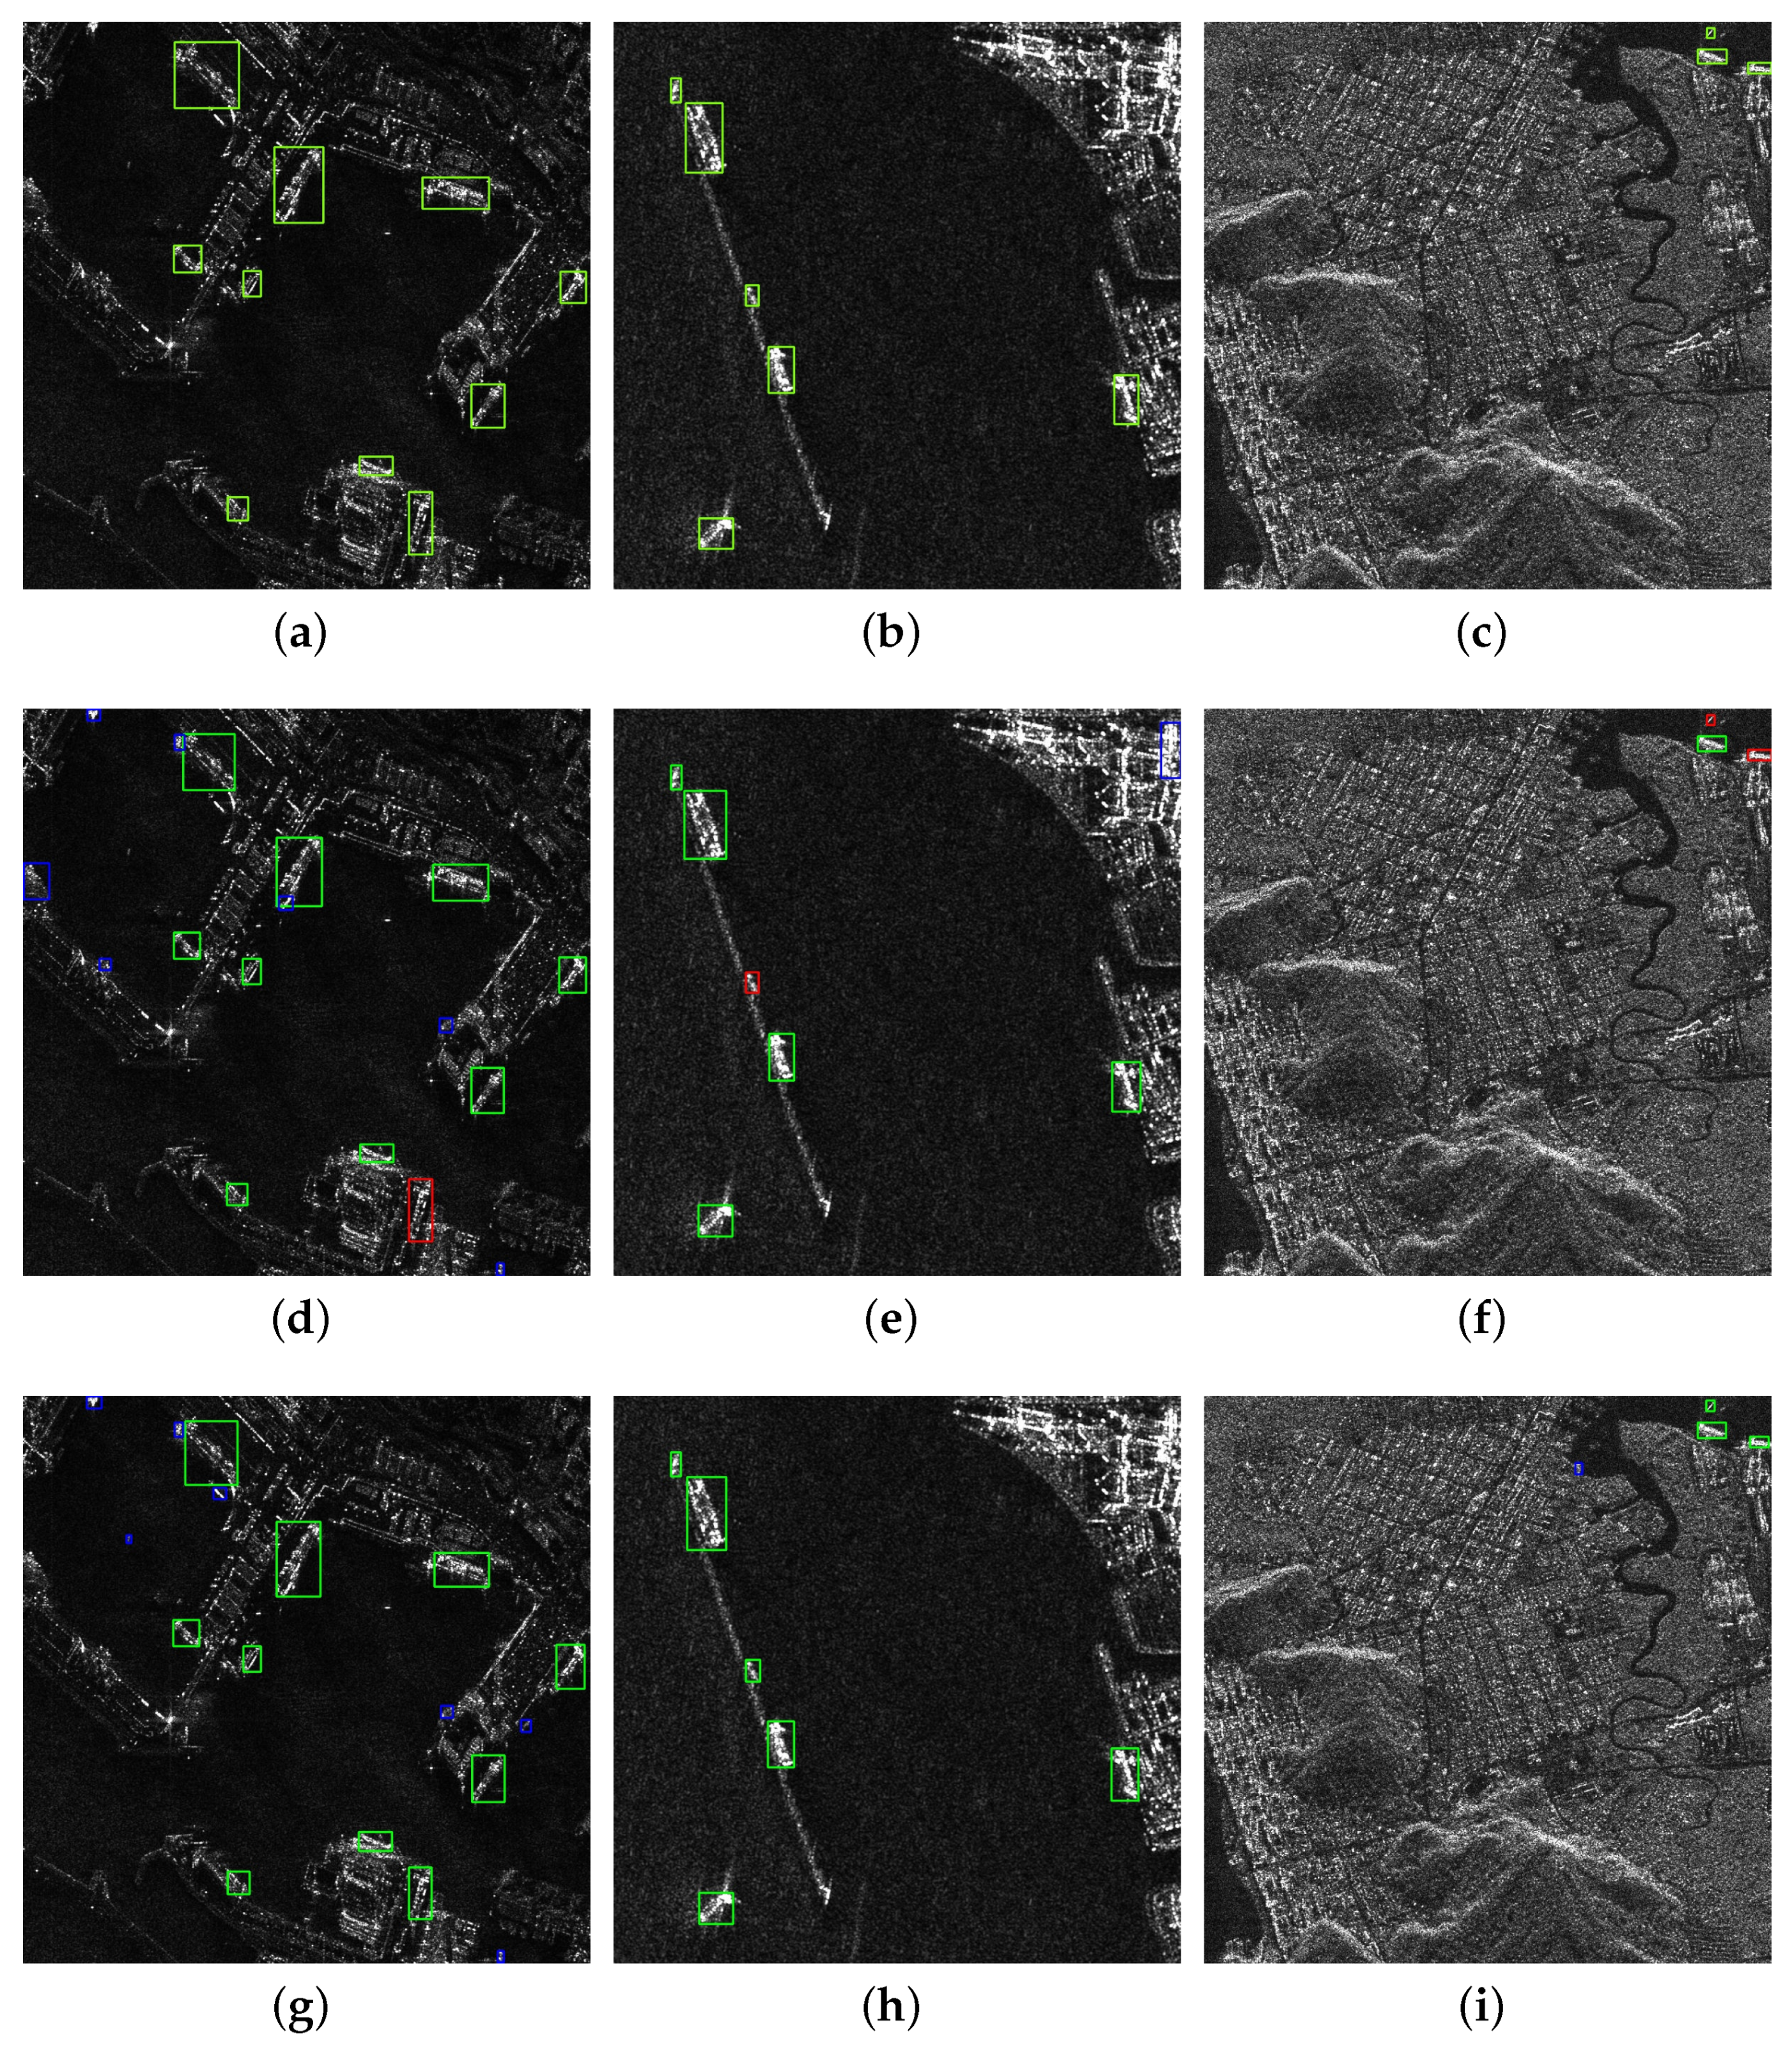
3.3. Instance Testing

In order to see the performance of YOLO-SARSI on specific images, we selected three images from the HRISD dataset and LS-SSDD-V1.0 dataset, respectively, for inference in YOLOv7 and YOLO-SARSI, and the inference results are shown in Figure 8 and Figure 9. Table 2 records the detailed data of YOLO-SARSI and YOLOv7 detection in Figure 8 and Figure 9, where correct indicates the number of ship targets successfully detected, wrong means the number of false detections, and missed means the number of missed detections.
In Figure 8a, the areas of land and water are almost the same, and the ships are close to the shore with a complex background. In Figure 8b, the ships are mainly in the water, but some of them have trailing noise. In Figure 8c, the water is mainly in the upper right and lower left corners, mostly land, and only three ships are in the upper right corner of the image. YOLOv7 has the phenomenon of identifying non-ship objects as ships in Figure 8a, while there are missed detections, and although YOLO-SARSI has false detections, there are no missed detections. In Figure 8b, YOLOv7 has missed and false detections, while YOLO-SARSI perfectly detects all the ships. The recognition accuracy of YOLOv7 in Figure 8c is only 33.3%. Although YOLO-SARSI also has a false detection in this image, it is not difficult to find that the target of the false detection is the prominent color spot on the shore, and YOLO-SARSI detects all the ships in Figure 8c.
In Figure 9a, there are many islands, some of which are even as large as the ship in the image. The ships in Figure 9b are mainly distributed in the water, but there are a large number of ships on shore which are difficult to identify because the ships are easily confused with background clutter. The land and water in Figure 9c have similar grayscale, while there are some bright spots on the land. YOLO-SARSI perfectly detected all the ships in Figure 9a,c. In Figure 9b, although there are missed ships, the ships they missed are basically shore-based ships.
In order to find out what features the model has learned, whether the features it has learned are what we expect, or whether the model has learned cheating information, a heat map visualization of the model’s gradient calculation results in the image is performed.
Gradient-weighted class activation mapping (Grad-CAM) [38] can help us to analyze the areas of focus of a network model on a particular class of targets, so that the areas of focus of the network can in turn be used to analyze whether the network has learned the correct information or features. Gradient information of the feature maps obtained from the second layer of the anchor in YOLOv7 and YOLO-SARSI for the three images selected from the HRSID dataset was plotted using Grad-CAM, as shown in Figure 10.
In Figure 10d–i, the color depth of the pixel points reflects the information of the area where the model focuses on the image. The brighter the color, the more the model focuses on the feature information at this location, which means that more information about the ship is extracted at this location as well. The redder it is, the more attention it gets. In Figure 10b,c, YOLOv7 is concerned with a lot of information that is not related to the ship. Combined with the real annotation frame, the feature gradient map of YOLO-SARSI is more vivid in color compared to YOLOv7 for a real ship at the same location in an image, which also shows that YOLO-SARSI can better focus on the pixel information of the ship itself.
Figure 11 plots the gradient information of the feature maps obtained from the first layer of the anchor in YOLOv7 and YOLO-SARSI for the three images in the LS-SSDD-V1.0 dataset using Grad-CAM. It can be seen that YOLOv7 focuses on more haphazard information for the images, which is particularly evident in Figure 11f. It even focuses a lot on objects in the land, which leads to it having a false detection. YOLO-SARSI focuses a lot on the ships, giving a lot of attention to the ships in the images.

4. Discussion

Data and features determine the upper limit of machine learning, while models and algorithms merely approximate this upper limit. It is also easy to realize through Figure 1 that optical images carry more information compared to SAR images. This also leads to the fact that SAR images make the upper limit of machine learning lower. We believe that this is the main reason why our model is not able to achieve the accuracy in SAR image ship recognition, as deep learning now achieves high accuracy in face recognition.
AMMRF can fuse the feature maps of different sensory fields, making full use of the captured position information so that the region of interest can be accurately captured, and at the same time, it can effectively capture the relationship between the channels, based on which it can improve the accuracy of the SAR image ship recognition. The 1 × 1 convolution of the inputs and outputs in AMMRF can effectively reduce the output feature map size, based on which the number of model parameters is reduced. Transformer, which has performed exceptionally well in deep learning in recent years, currently provides the best performance of Transformer-based target detection methods on general-purpose computerized target detection datasets. In our experiments, the performance of Transformer-based target detection methods on SAR image ship recognition, however, is not outstanding. This is because the Transformer-based target detection method has a larger number of parameters and a more complex model compared to the CNN-based target detection method, which makes the Transformer-based target detection method require a large amount of data for training. Compared with YOLOv7 (Figure 4), YOLO-SARSI (Figure 5) is more concise. YOLO-SARSI has fewer parameters and a simpler model, which means that the training of YOLO-SARSI does not require much data to achieve the same accuracy. Through experiments on two public datasets, we obtain the experimental results in Table 1. The experimental results show that compared with YOLOv7, YOLO-SARSI has a higher detection accuracy for SAR image ship targets with 16.36 M fewer parameters, which proves its advantage.

5. Conclusions

In this paper, we design a new convolutional block AMMRF, starting from dissecting the difference between SAR images and optical color images, and analyzing the way and basis for human identification of SAR images. Based on this, we propose a new network model for ship detection of SAR images based on YOLOv7, which we name YOLO-SARSI. The network model is used in HRISD and LS-SSDD-V1.0, two publicly available datasets, and the results show that YOLO-SARSI has a good performance in terms of average accuracy and model size metrics. The lightweight YOLO-SARSI means that our models can be more easily integrated into embedded systems. It is hoped that this paper can provide some guidance for developers and researchers exploring the field of SAR ship detection to obtain better detection performance in practical industrial applications.

Author Contributions

Conceptualization, H.T.; Data curation, H.T.; Formal analysis, H.T.; Funding acquisition, S.G.; Investigation, H.T. and S.L.; Methodology, H.T. and S.G.; Resources, H.T. and S.L.; Software, H.T. and S.W.; Supervision, S.G. and S.L.; Validation, H.T., P.W., J.L. and S.W.; Writing—original draft, H.T. and S.G.; Writing—review editing, H.T., S.G., J.L., S.W. and J.Q. All authors have read and agreed to the published version of the manuscript.

Funding

This work was supported by the National Natural Science Foundation of China (NSFC) under Grant No. 41930112.

Data Availability Statement

Data are contained within the article.

Conflicts of Interest

The authors declare no conflict of interest.

References

  1. Dai, H.; Du, L.; Wang, Y.; Wang, Z. A Modified CFAR Algorithm Based on Object Proposals for Ship Target Detection in SAR Images. IEEE Geosci. Remote Sens. Lett. 2016, 13, 1925–1929. [Google Scholar] [CrossRef]
  2. Tang, T.; Xiang, D.; Xie, H. Multiscale salient region detection and salient map generation for synthetic aperture radar image. J. Appl. Remote Sens. 2014, 8, 083501. [Google Scholar] [CrossRef]
  3. Hwang, S.I.; Ouchi, K. On a Novel Approach Using MLCC and CFAR for the Improvement of Ship Detection by Synthetic Aperture Radar. IEEE Geosci. Remote Sens. Lett. 2010, 7, 391–395. [Google Scholar] [CrossRef]
  4. Krizhevsky, A.; Sutskever, I.; Hinton, G.E. ImageNet Classification with Deep Convolutional Neural Networks. Adv. Neural Inf. Process. Syst. 2017, 60, 84–90. [Google Scholar] [CrossRef]
  5. He, K.; Zhang, X.; Ren, S.; Sun, J. Deep Residual Learning for Image Recognition. In Proceedings of the IEEE Conference on Computer Vision and Pattern Recognition, Las Vegas, NV, USA, 27–30 June 2016. [Google Scholar]
  6. Jiao, J.; Zhang, Y.; Sun, H.; Yang, X.; Gao, X.; Hong, W.; Fu, K.; Sun, X. A Densely Connected End-to-End Neural Network for Multiscale and Multiscene SAR Ship Detection. IEEE Access 2018, 6, 20881–20892. [Google Scholar] [CrossRef]
  7. Cui, Z.; Li, Q.; Cao, Z.; Liu, N. Dense Attention Pyramid Networks for Multi-Scale Ship Detection in SAR Images. IEEE Trans. Geosci. Remote Sens. 2019, 57, 8983–8997. [Google Scholar] [CrossRef]
  8. Zhang, T.; Zhang, X. High-Speed Ship Detection in SAR Images Based on a Grid Convolutional Neural Network. Remote Sens. 2019, 11, 1206. [Google Scholar] [CrossRef]
  9. Qu, H.; Shen, L.; Guo, W.; Wang, J. Ships Detection in SAR Images Based on Anchor-Free Model with Mask Guidance Features. IEEE J. Sel. Top. Appl. Earth Obs. Remote Sens. 2022, 15, 666–675. [Google Scholar] [CrossRef]
  10. Sun, B.; Wang, X.; Li, H.; Dong, F.; Wang, Y. Small-Target Ship Detection in SAR Images Based on Densely Connected Deep Neural Network with Attention in Complex Scenes. Appl. Intell. 2022, 53, 4162–4179. [Google Scholar] [CrossRef]
  11. Gao, S.; Liu, J.M.; Miao, Y.H.; He, Z.J. A High-Effective Implementation of Ship Detector for SAR Images. IEEE Geosci. Remote Sens. Lett. 2022, 19, 1–5. [Google Scholar] [CrossRef]
  12. Wang, S.; Gao, S.; Zhou, L.; Liu, R.; Zhang, H.; Liu, J.; Jia, Y.; Qian, J. YOLO-SD: Small Ship Detection in SAR Images by Multi-Scale Convolution and Feature Transformer Module. Remote Sens. 2022, 14, 5268. [Google Scholar] [CrossRef]
  13. Jin, K.; Chen, Y.; Xu, B.; Yin, J.; Wang, X.; Yang, J. A Patch-to-Pixel Convolutional Neural Network for Small Ship Detection with PolSAR Images. IEEE Trans. Geosci. Remote Sens. 2020, 58, 6623–6638. [Google Scholar] [CrossRef]
  14. Chen, P.; Li, Y.; Zhou, H.; Liu, B.; Liu, P. Detection of Small Ship Objects Using Anchor Boxes Cluster and Feature Pyramid Network Model for SAR Imagery. J. Mar. Sci. Eng. 2020, 8, 112. [Google Scholar] [CrossRef]
  15. Fu, J.; Sun, X.; Wang, Z.; Fu, K. An Anchor-Free Method Based on Feature Balancing and Refinement Network for Multiscale Ship Detection in SAR Images. IEEE Trans. Geosci. Remote Sens. 2021, 59, 1331–1344. [Google Scholar] [CrossRef]
  16. Chen, Z.; Chen, D.; Zhang, Y.; Cheng, X.; Zhang, M.; Wu, C. Deep learning for autonomous ship-oriented small ship detection. Saf. Sci. 2020, 130, 104812. [Google Scholar] [CrossRef]
  17. Guo, H.; Yang, X.; Wang, N.; Gao, X. A CenterNet++ model for ship detection in SAR images. Pattern Recognit. 2021, 112, 107787. [Google Scholar] [CrossRef]
  18. Zhao, J.; Guo, W.; Zhang, Z.; Yu, W. A coupled convolutional neural network for small and densely clustered ship detection in SAR images. Sci. China Inf. Sci. 2018, 62, 42301. [Google Scholar] [CrossRef]
  19. Qiu, J.; Chen, C.; Liu, S.; Zeng, B. SlimConv: Reducing Channel Redundancy in Convolutional Neural Networks by Weights Flipping. IEEE Trans. Image Process. 2021, 30, 6434–6445. [Google Scholar] [CrossRef]
  20. Wang, C.Y.; Bochkovskiy, A.; Liao, H.Y.M. YOLOv7: Trainable bag-of-freebies sets new state-of-the-art for real-time object detectors. arXiv 2022, arXiv:2207.02696. [Google Scholar]
  21. Girshick, R. Fast R-CNN. In Proceedings of the 2015 IEEE International Conference on Computer Vision (ICCV), Santiago, Chile, 7–13 December 2015; pp. 1440–1448. [Google Scholar] [CrossRef]
  22. Lin, T.Y.; Maire, M.; Belongie, S.; Bourdev, L.; Girshick, R.; Hays, J.; Perona, P.; Ramanan, D.; Zitnick, C.L.; Dollár, P. Microsoft COCO: Common Objects in Context. arXiv 2015, arXiv:1405.0312. [Google Scholar]
  23. Everingham, M.; Gool, L.; Williams, C.K.; Winn, J.; Zisserman, A. The Pascal Visual Object Classes (VOC) Challenge. Int. J. Comput. Vis. 2010, 88, 303–338. [Google Scholar] [CrossRef]
  24. Huang, M.; Xu, Y.; Qian, L.; Shi, W.; Zhang, Y.; Bao, W.; Wang, N.; Liu, X.; Xiang, X. The QXS-SAROPT Dataset for Deep Learning in SAR-Optical Data Fusion. arXiv 2021, arXiv:2103.08259. [Google Scholar]
  25. Wei, S.; Zeng, X.; Qu, Q.; Wang, M.; Su, H.; Shi, J. HRSID: A High-Resolution SAR Images Dataset for Ship Detection and Instance Segmentation. IEEE Access 2020, 8, 120234–120254. [Google Scholar] [CrossRef]
  26. Zhang, T.; Zhang, X.; Ke, X.; Zhan, X.; Shi, J.; Wei, S.; Pan, D.; Li, J.; Su, H.; Zhou, Y.; et al. LS-SSDD-v1.0: A Deep Learning Dataset Dedicated to Small Ship Detection from Large-Scale Sentinel-1 SAR Images. Remote Sens. 2020, 12, 2997. [Google Scholar] [CrossRef]
  27. Hou, Q.; Zhou, D.; Feng, J. Coordinate Attention for Efficient Mobile Network Design. arXiv 2021, arXiv:2103.02907. [Google Scholar]
  28. Szegedy, C.; Liu, W.; Jia, Y.; Sermanet, P.; Reed, S.; Anguelov, D.; Erhan, D.; Vanhoucke, V.; Rabinovich, A. Going Deeper with Convolutions. arXiv 2014, arXiv:1409.4842. [Google Scholar]
  29. Huang, G.; Liu, Z.; Van Der Maaten, L.; Weinberger, K.Q. Densely Connected Convolutional Networks. In Proceedings of the 2017 IEEE Conference on Computer Vision and Pattern Recognition (CVPR), Honolulu, HI, USA, 21–26 July 2017; pp. 2261–2269. [Google Scholar] [CrossRef]
  30. Liu, W.; Anguelov, D.; Erhan, D.; Szegedy, C.; Reed, S.; Fu, C.Y.; Berg, A.C. SSD: Single Shot MultiBox Detector. In Proceedings of the Computer Vision—ECCV 2016: 14th European Conference, Amsterdam, The Netherlands, 11–14 October 2016; Springer International Publishing: Cham, Switzerland, 2016; pp. 21–37. [Google Scholar] [CrossRef]
  31. Cai, Z.; Vasconcelos, N. Cascade R-CNN: Delving Into High Quality Object Detection. In Proceedings of the 2018 IEEE/CVF Conference on Computer Vision and Pattern Recognition, Salt Lake City, UT, USA, 18–23 June 2018; pp. 6154–6162. [Google Scholar] [CrossRef]
  32. Ren, S.; He, K.; Girshick, R.; Sun, J. Faster R-CNN: Towards Real-Time Object Detection with Region Proposal Networks. arXiv 2016, arXiv:1506.01497. [Google Scholar] [CrossRef] [PubMed]
  33. He, K.; Gkioxari, G.; Dollár, P.; Girshick, R. Mask R-CNN. arXiv 2018, arXiv:1703.06870. [Google Scholar]
  34. Lin, T.Y.; Goyal, P.; Girshick, R.; He, K.; Dollár, P. Focal Loss for Dense Object Detection. arXiv 2018, arXiv:1708.02002. [Google Scholar]
  35. Liu, Z.; Lin, Y.; Cao, Y.; Hu, H.; Wei, Y.; Zhang, Z.; Lin, S.; Guo, B. Swin Transformer: Hierarchical Vision Transformer Using Shifted Windows. arXiv 2021, arXiv:2103.14030. [Google Scholar]
  36. Chen, K.; Wang, J.; Pang, J.; Cao, Y.; Xiong, Y.; Li, X.; Sun, S.; Feng, W.; Liu, Z.; Xu, J.; et al. MMDetection: Open MMLab Detection Toolbox and Benchmark. arXiv 2019, arXiv:1906.07155. [Google Scholar]
  37. Dosovitskiy, A.; Beyer, L.; Kolesnikov, A.; Weissenborn, D.; Zhai, X.; Unterthiner, T.; Dehghani, M.; Minderer, M.; Heigold, G.; Gelly, S.; et al. An Image Is Worth 16 × 16 Words: Transformers for Image Recognition at Scale. arXiv 2021, arXiv:2010.11929. [Google Scholar]
  38. Selvaraju, R.R.; Cogswell, M.; Das, A.; Vedantam, R.; Parikh, D.; Batra, D. Grad-CAM: Visual Explanations from Deep Networks via Gradient-Based Localization. Int. J. Comput. Vis. 2019, 128, 336–359. [Google Scholar] [CrossRef]
Figure 1. Abundant pure backgrounds of SAR images in QXS-SAROPT dataset. (a) SAR images; (b) optical images. cropland; the surface of the water; residential building; forests. The QXS-SAROPT dataset under open access license CCBY is publicly available at https://github.com/yaoxu008/QXS-SAROPT (accessed on 17 October 2023) [24].
Remotesensing 16 00486 g001
Figure 2. Ships marked in green boxes in a complicated ocean background. Figure (a) shows the SAR image from the HRSID dataset and Figure (b) shows the SAR image from LS-SSDD-V1.0.
Remotesensing 16 00486 g002
Figure 3. The overall structure of SAR Detection Convolution (AMMRF). Concat’s form of concatenation allows us to obtain a feature map with four times the number of channels as the input feature map X. We numbered each of the five 3 × 3 convolutions in the figure from circle 1 to circle 5.
Remotesensing 16 00486 g003
Figure 4. The overall structure of YOLOv7. The overall structure of YOLOv7 is drawn from the code provided by the authors of YOLOv7.
Remotesensing 16 00486 g004
Figure 5. The overall structure of YOLO-SARSI.
Remotesensing 16 00486 g005
Figure 6. Comparison of the number of ships of three sizes in the two datasets.
Remotesensing 16 00486 g006
Figure 7. PR curves of different methods. (a): One-stage models with HRSID; (b): Two-stage models with HRSID; (c): One-stage models with LS-SSDD-V1.0; (d): Two-stage models with LS-SSDD-V1.0.
Remotesensing 16 00486 g007
Figure 8. Diagram of HRISD results. Green boxes are ships that were detected correctly or boxes marked true, blue boxes are ships that were detected incorrectly, and red boxes are ships that were missed. (ac): Ground truth; (df): YOLOv7; (gi): YOLO-SARSI.
Remotesensing 16 00486 g008
Figure 9. Diagram of LS-SSDD-V1.0 results. Green boxes are ships that were detected correctly, or boxes marked true, blue boxes are ships that were detected incorrectly, and red boxes are ships that were missed. (ac): Ground truth; (df): YOLOv7; (gi): YOLO-SARSI. Some of the ships in the figure have an IOU less than 0.5 between the blue box and the ground truth despite being surrounded by the blue box, and are therefore recognized as both misdetections and missed detections. Eventually, such ships will have rosy boxes.
Remotesensing 16 00486 g009
Figure 10. Diagram heat map of HRSID results. (ac): Ground truth; (df): YOLOv7; (gi): YOLO-SARSI.
Remotesensing 16 00486 g010
Figure 11. Diagram heat map of LS-SSDD-V1.0 results. (ac): Ground truth; (df): YOLOv7; (gi): YOLO-SARSI.
Remotesensing 16 00486 g011
Table 1. Experimental results for the datasets. Bolded numbers indicate the best indicators. The bolded method is the one proposed in this paper.
DatasetModel AP 50 (%) AP 50 : 95 (%)Params (M)
HRSIDCascade R-CNN65.141.268.93
Faster R-CNN69.843.641.12
Mask R-CNN69.943.941.12
SDD 30056.536.823.75
Swin Transformer57.132.636.82
RetinaNet70.945.536.10
YOLOv786.761.834.79
YOLO-SARSI89.364.018.43
LS-SSDD-V1.0Cascade R-CNN55.420.168.93
Faster R-CNN63.423.941.12
Mask R-CNN63.324.141.12
SDD 30032.510.123.75
Swin Transformer37.010.236.82
RetinaNet64.924.836.10
YOLOv769.827.734.79
YOLO-SARSI73.728.518.43
Table 2. Specific detection results of Figure 8 and Figure 9. Correct indicates the number of ship targets successfully detected, wrong means the number of false detections, and missed means the number of missed detections.
ModelFigure 8Figure 9
CorrectWrongMissedCorrectWrongMissed
Ground Truth19004400
YOLOv7158420524
YOLO-SARSI198034310
Disclaimer/Publisher’s Note: The statements, opinions and data contained in all publications are solely those of the individual author(s) and contributor(s) and not of MDPI and/or the editor(s). MDPI and/or the editor(s) disclaim responsibility for any injury to people or property resulting from any ideas, methods, instructions or products referred to in the content.

