

Anti-Interference Bottom Detection Method of Multibeam Echosounders Based on Deep Learning Models


Abstract
:
1. Introduction
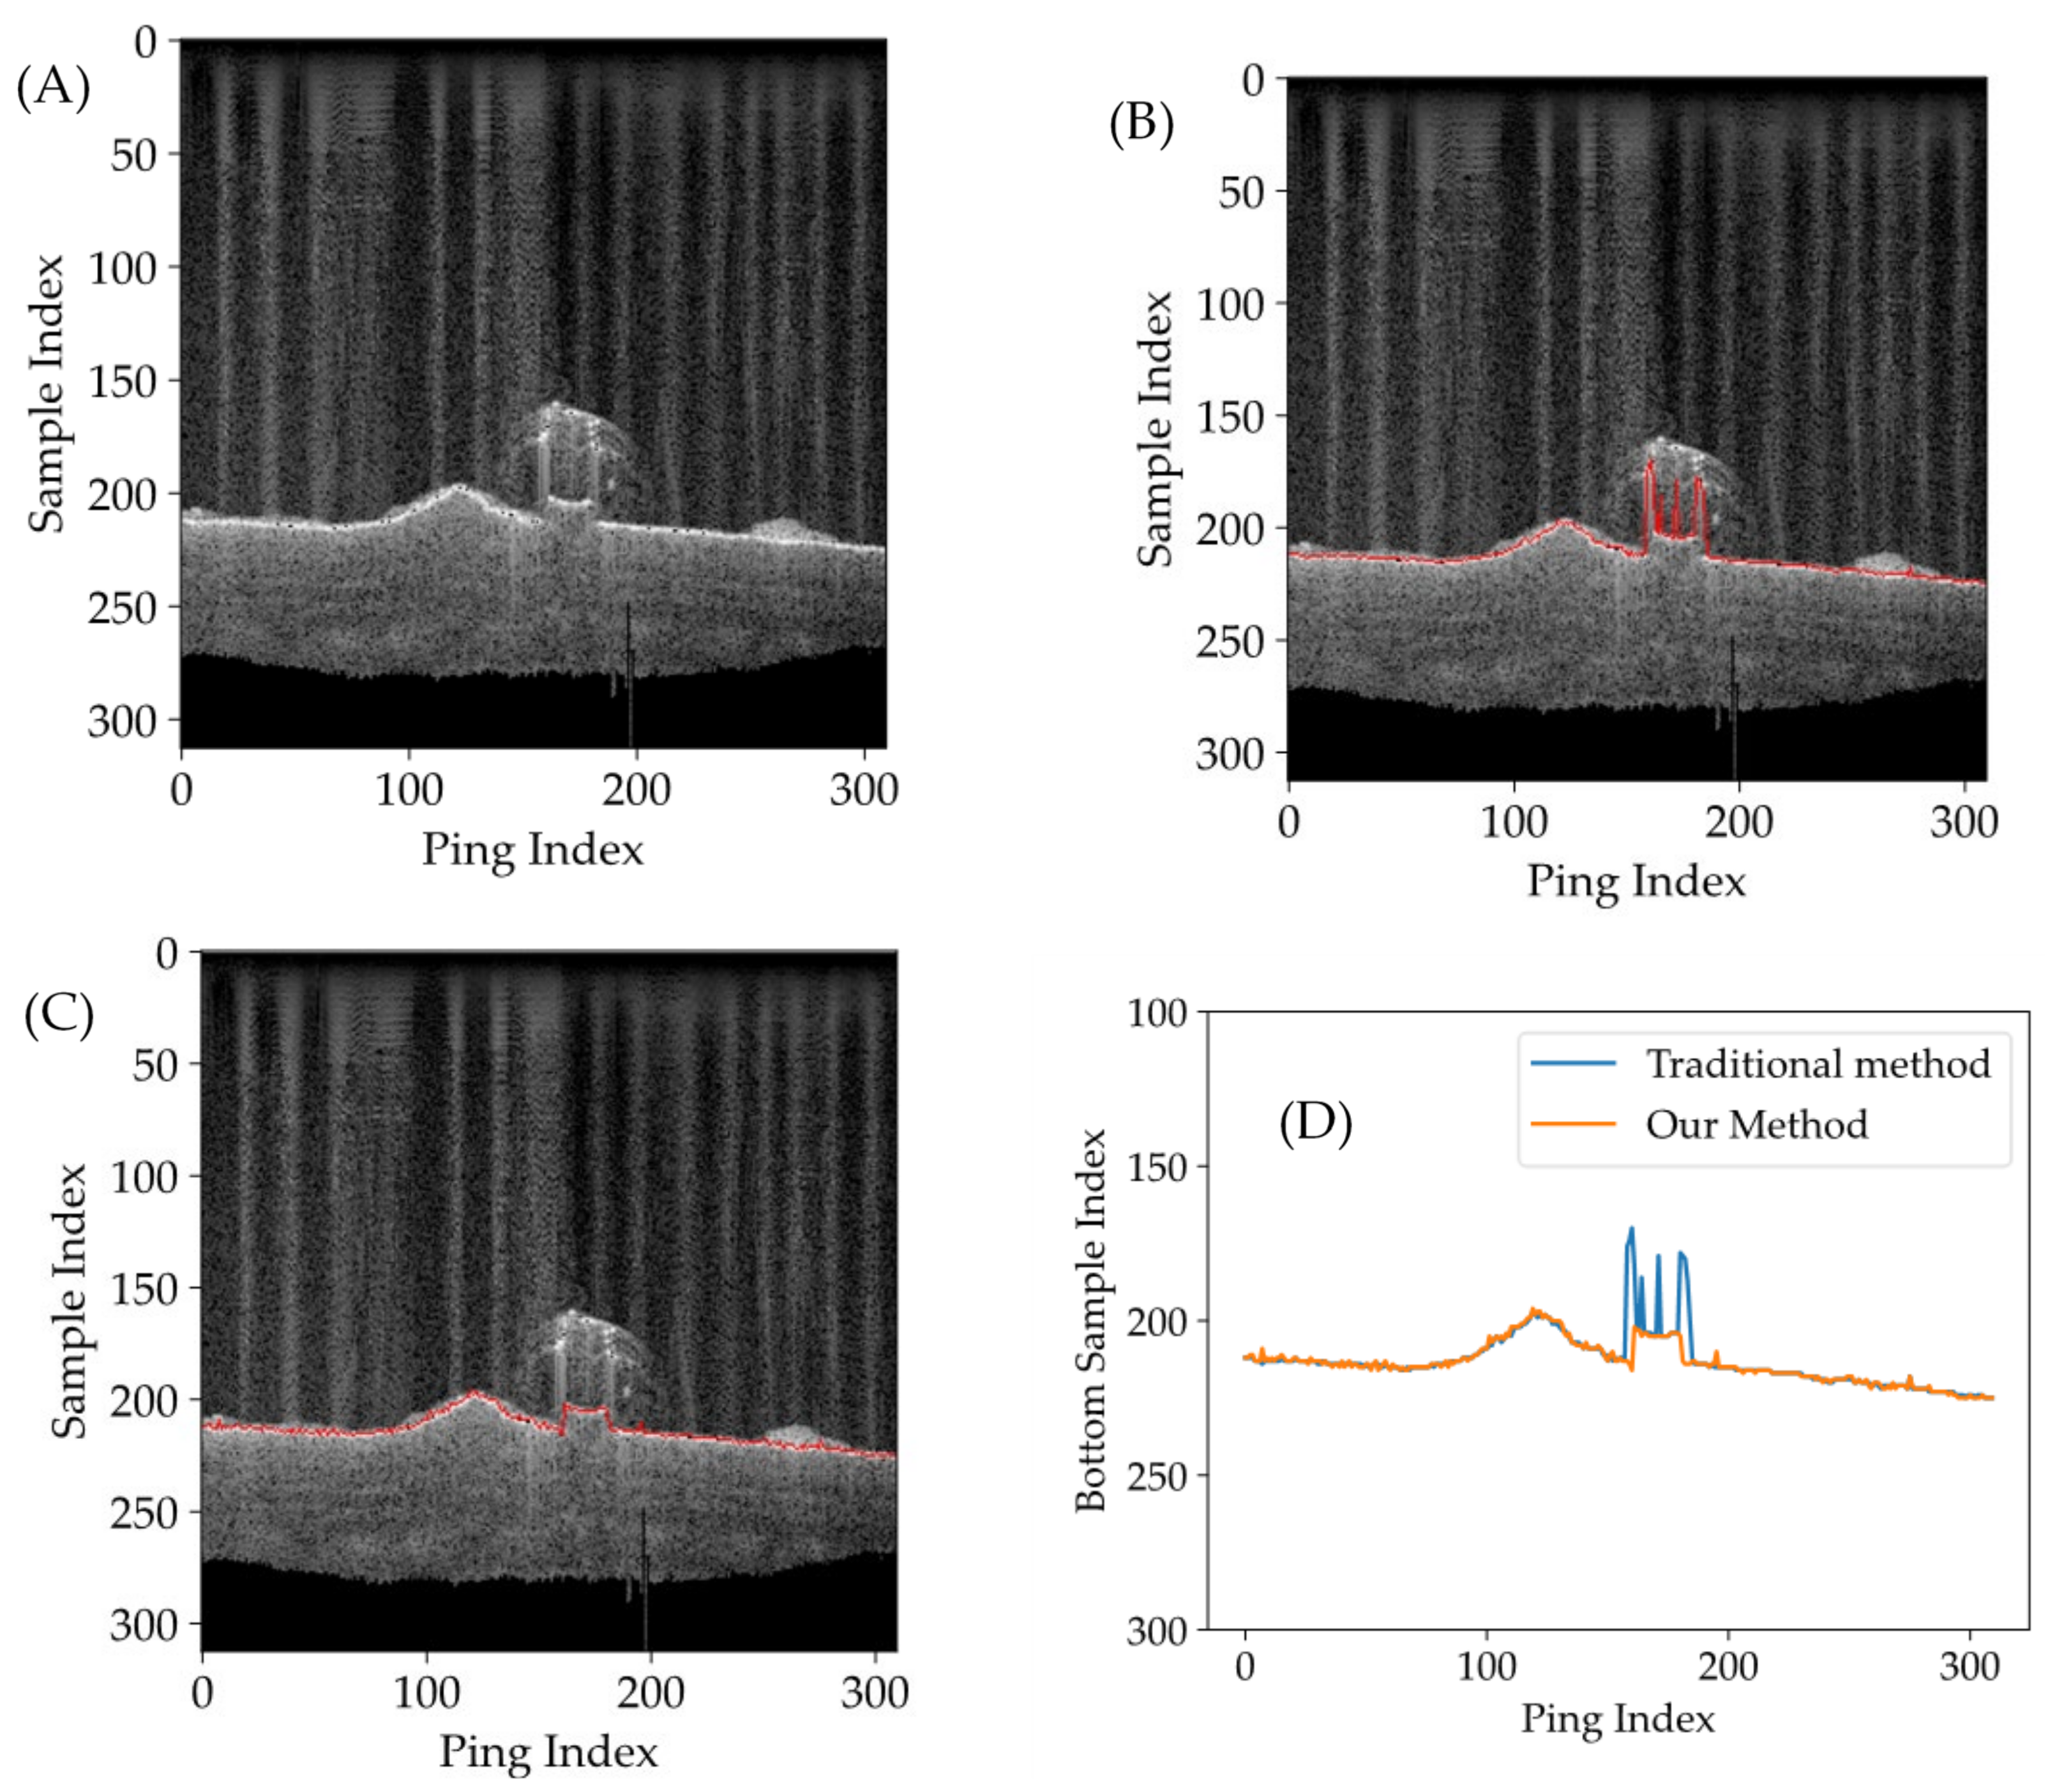
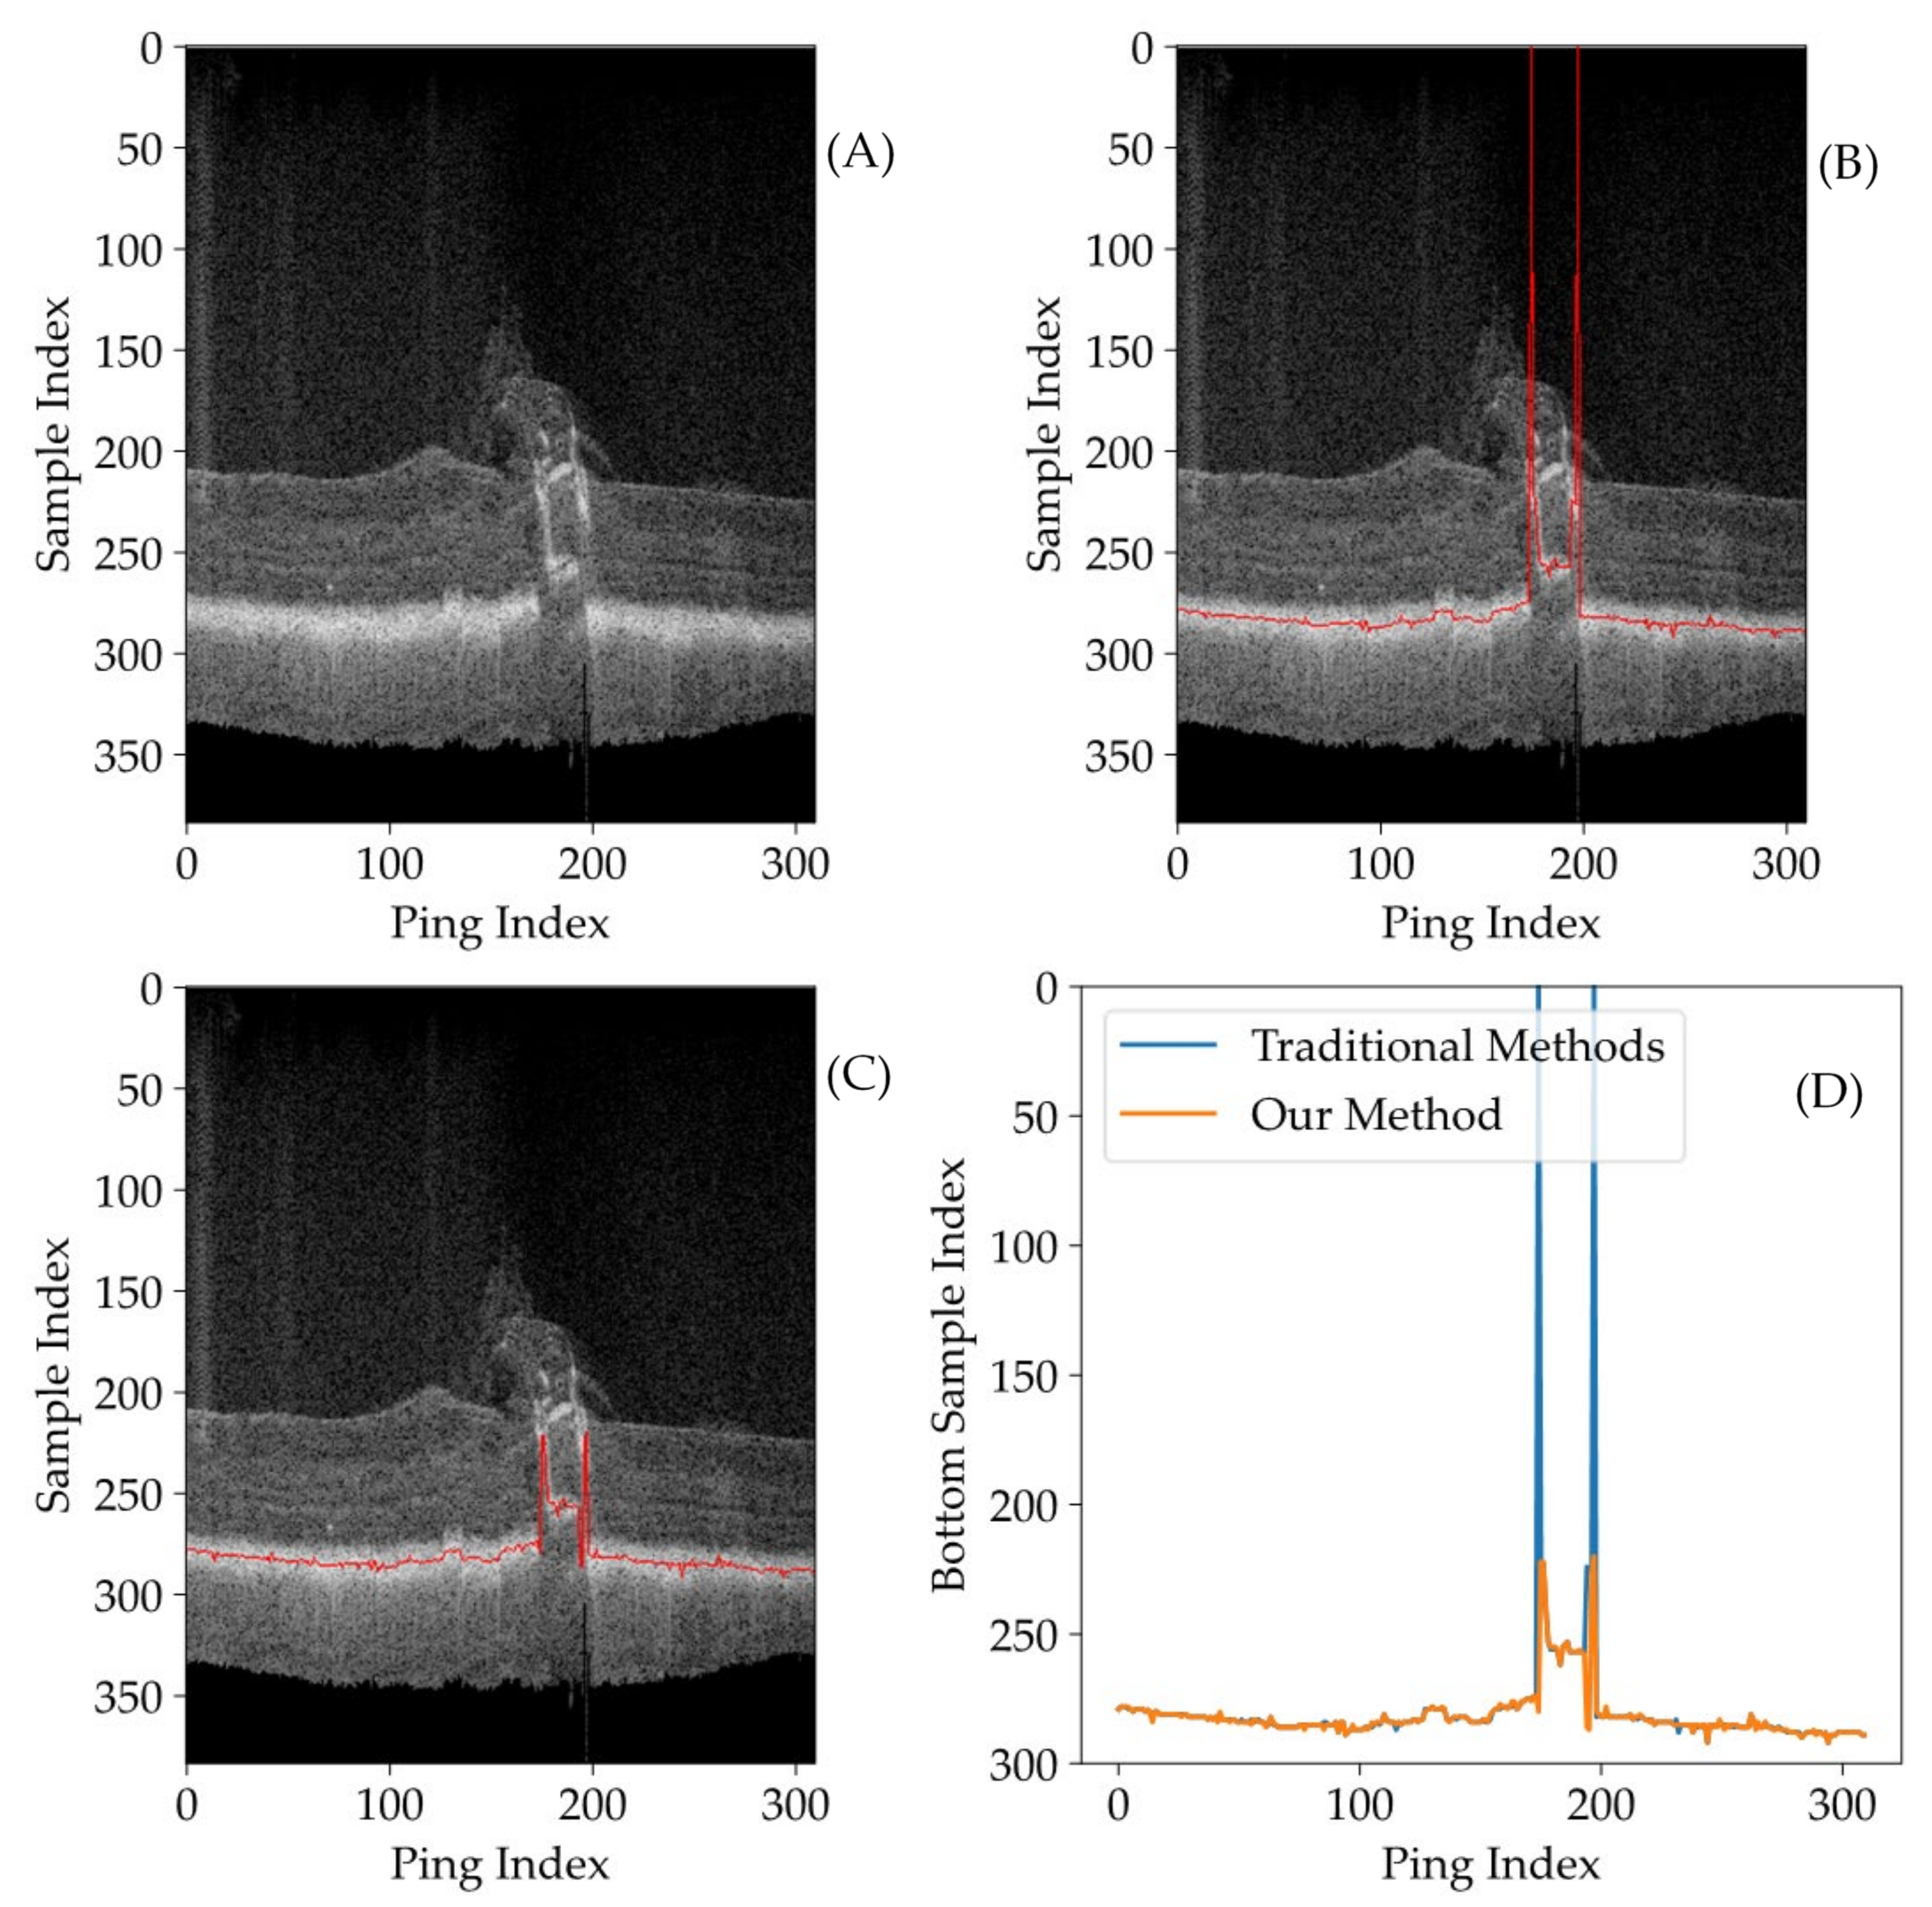
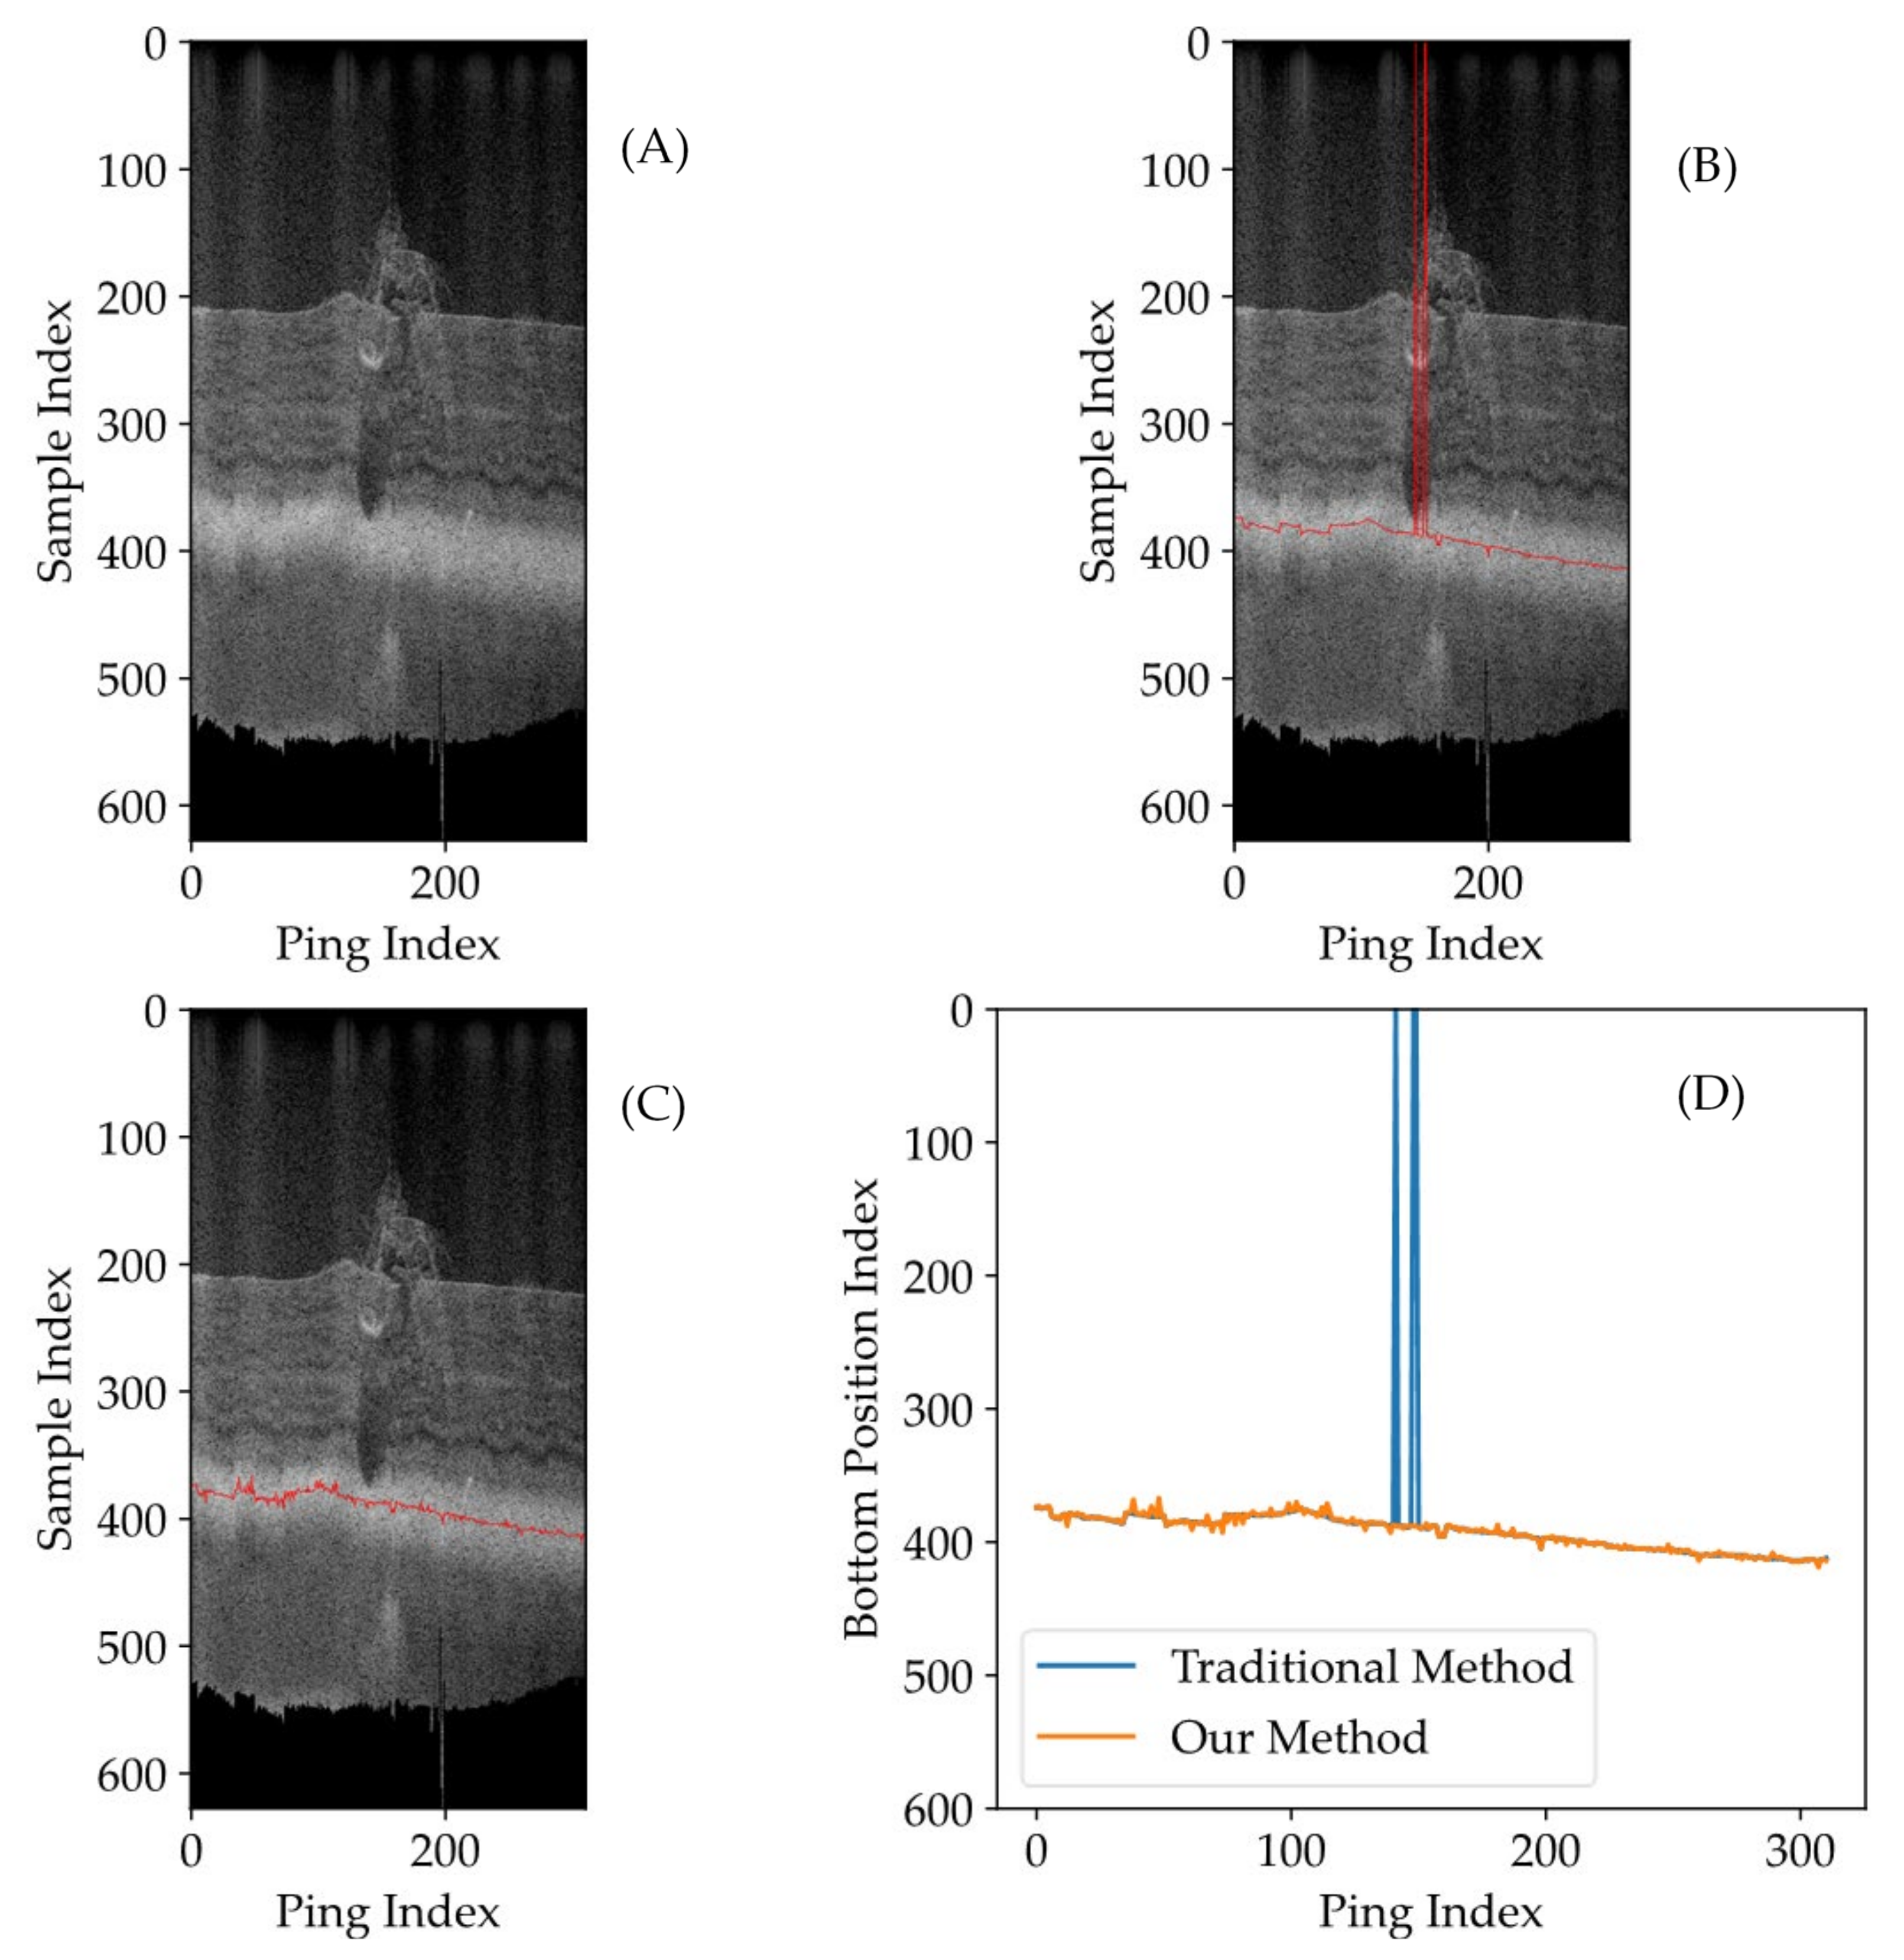
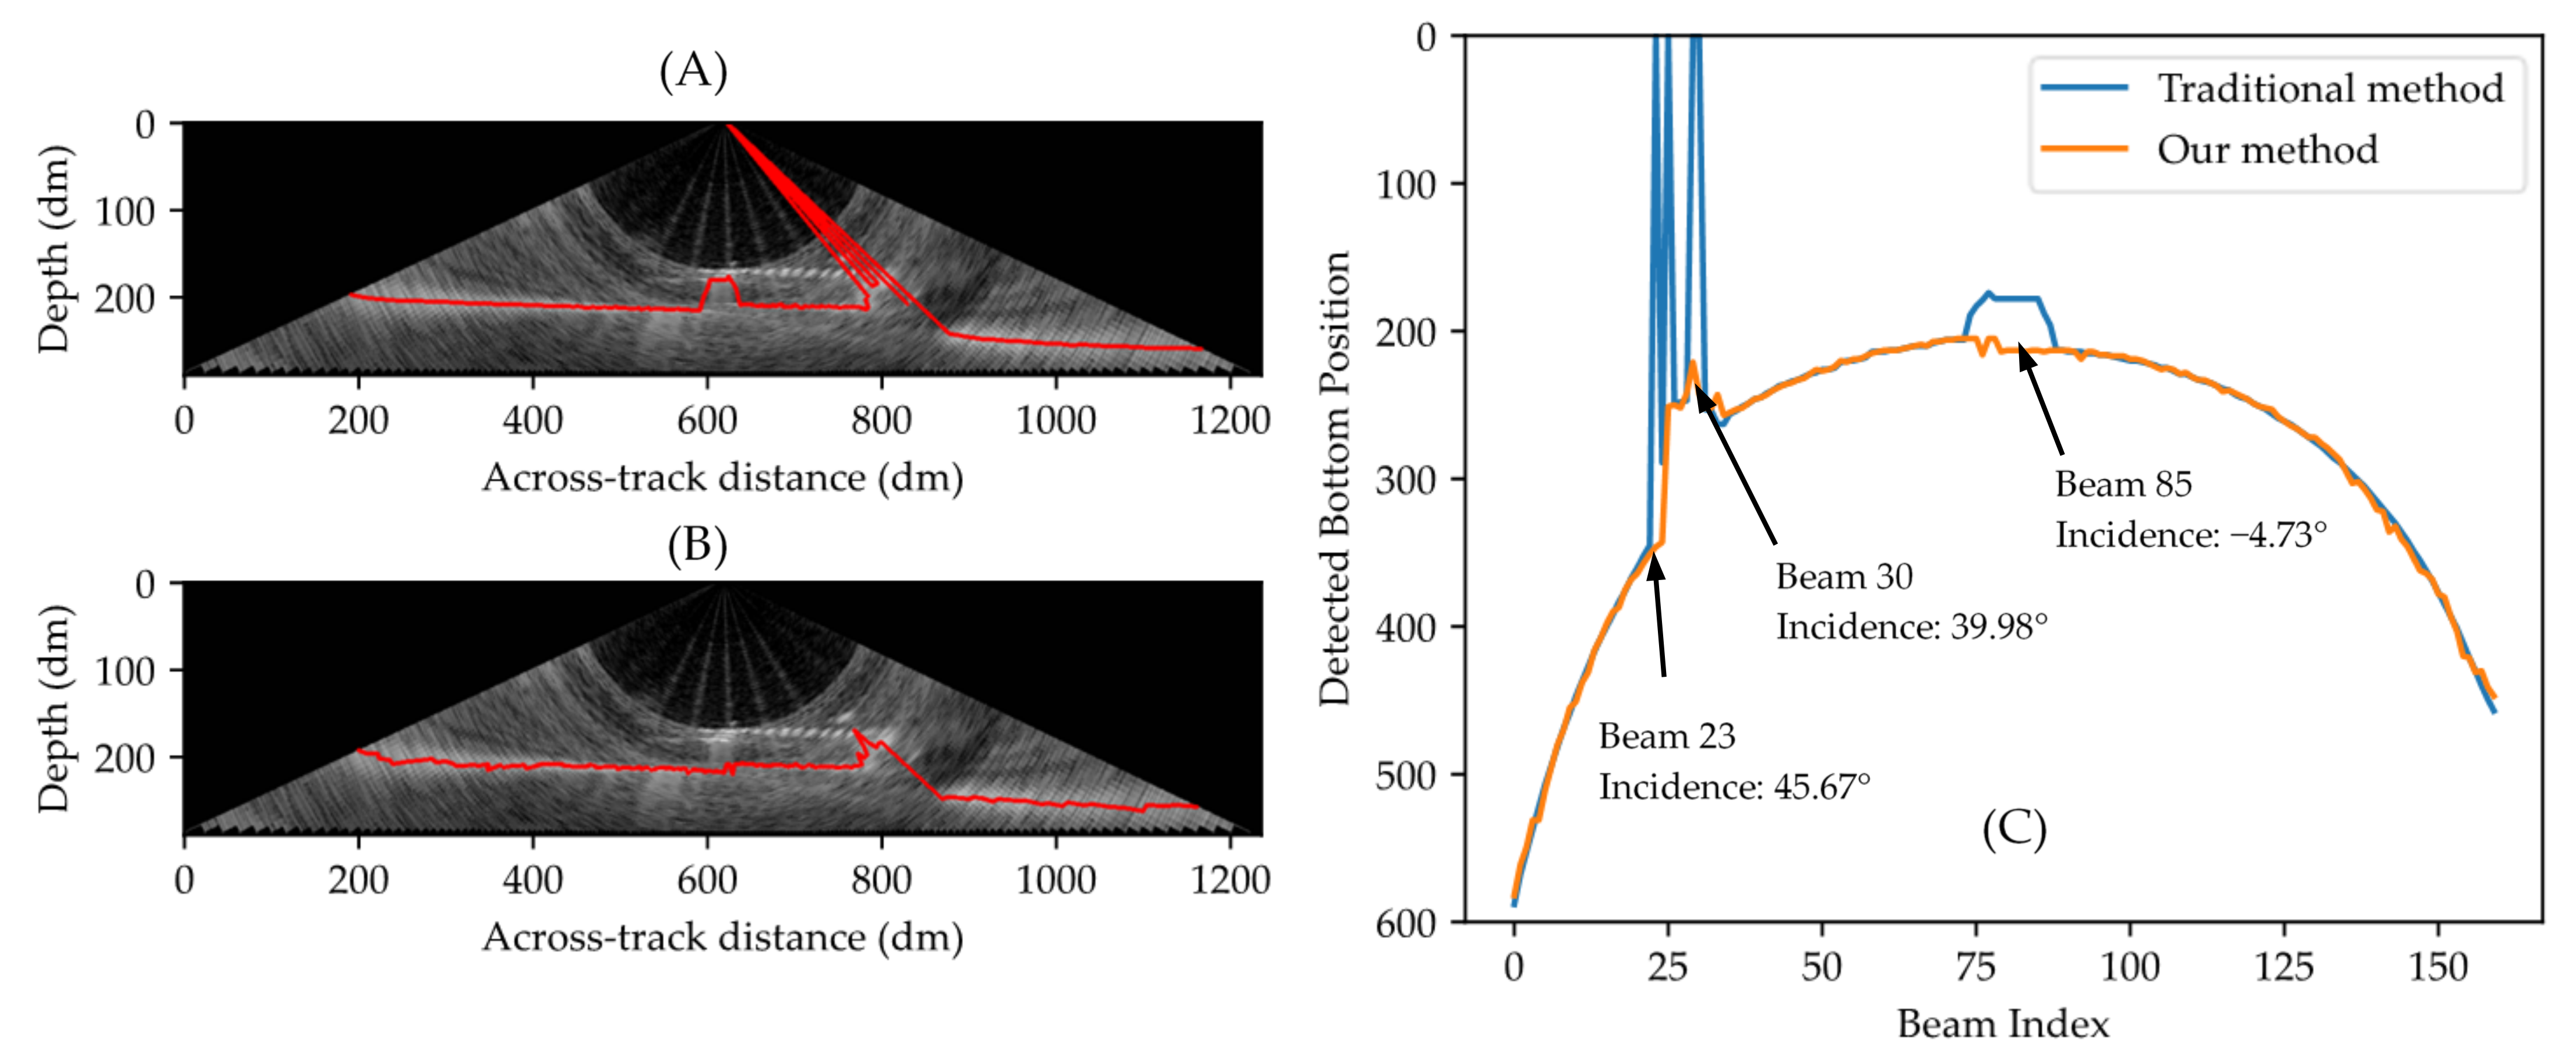
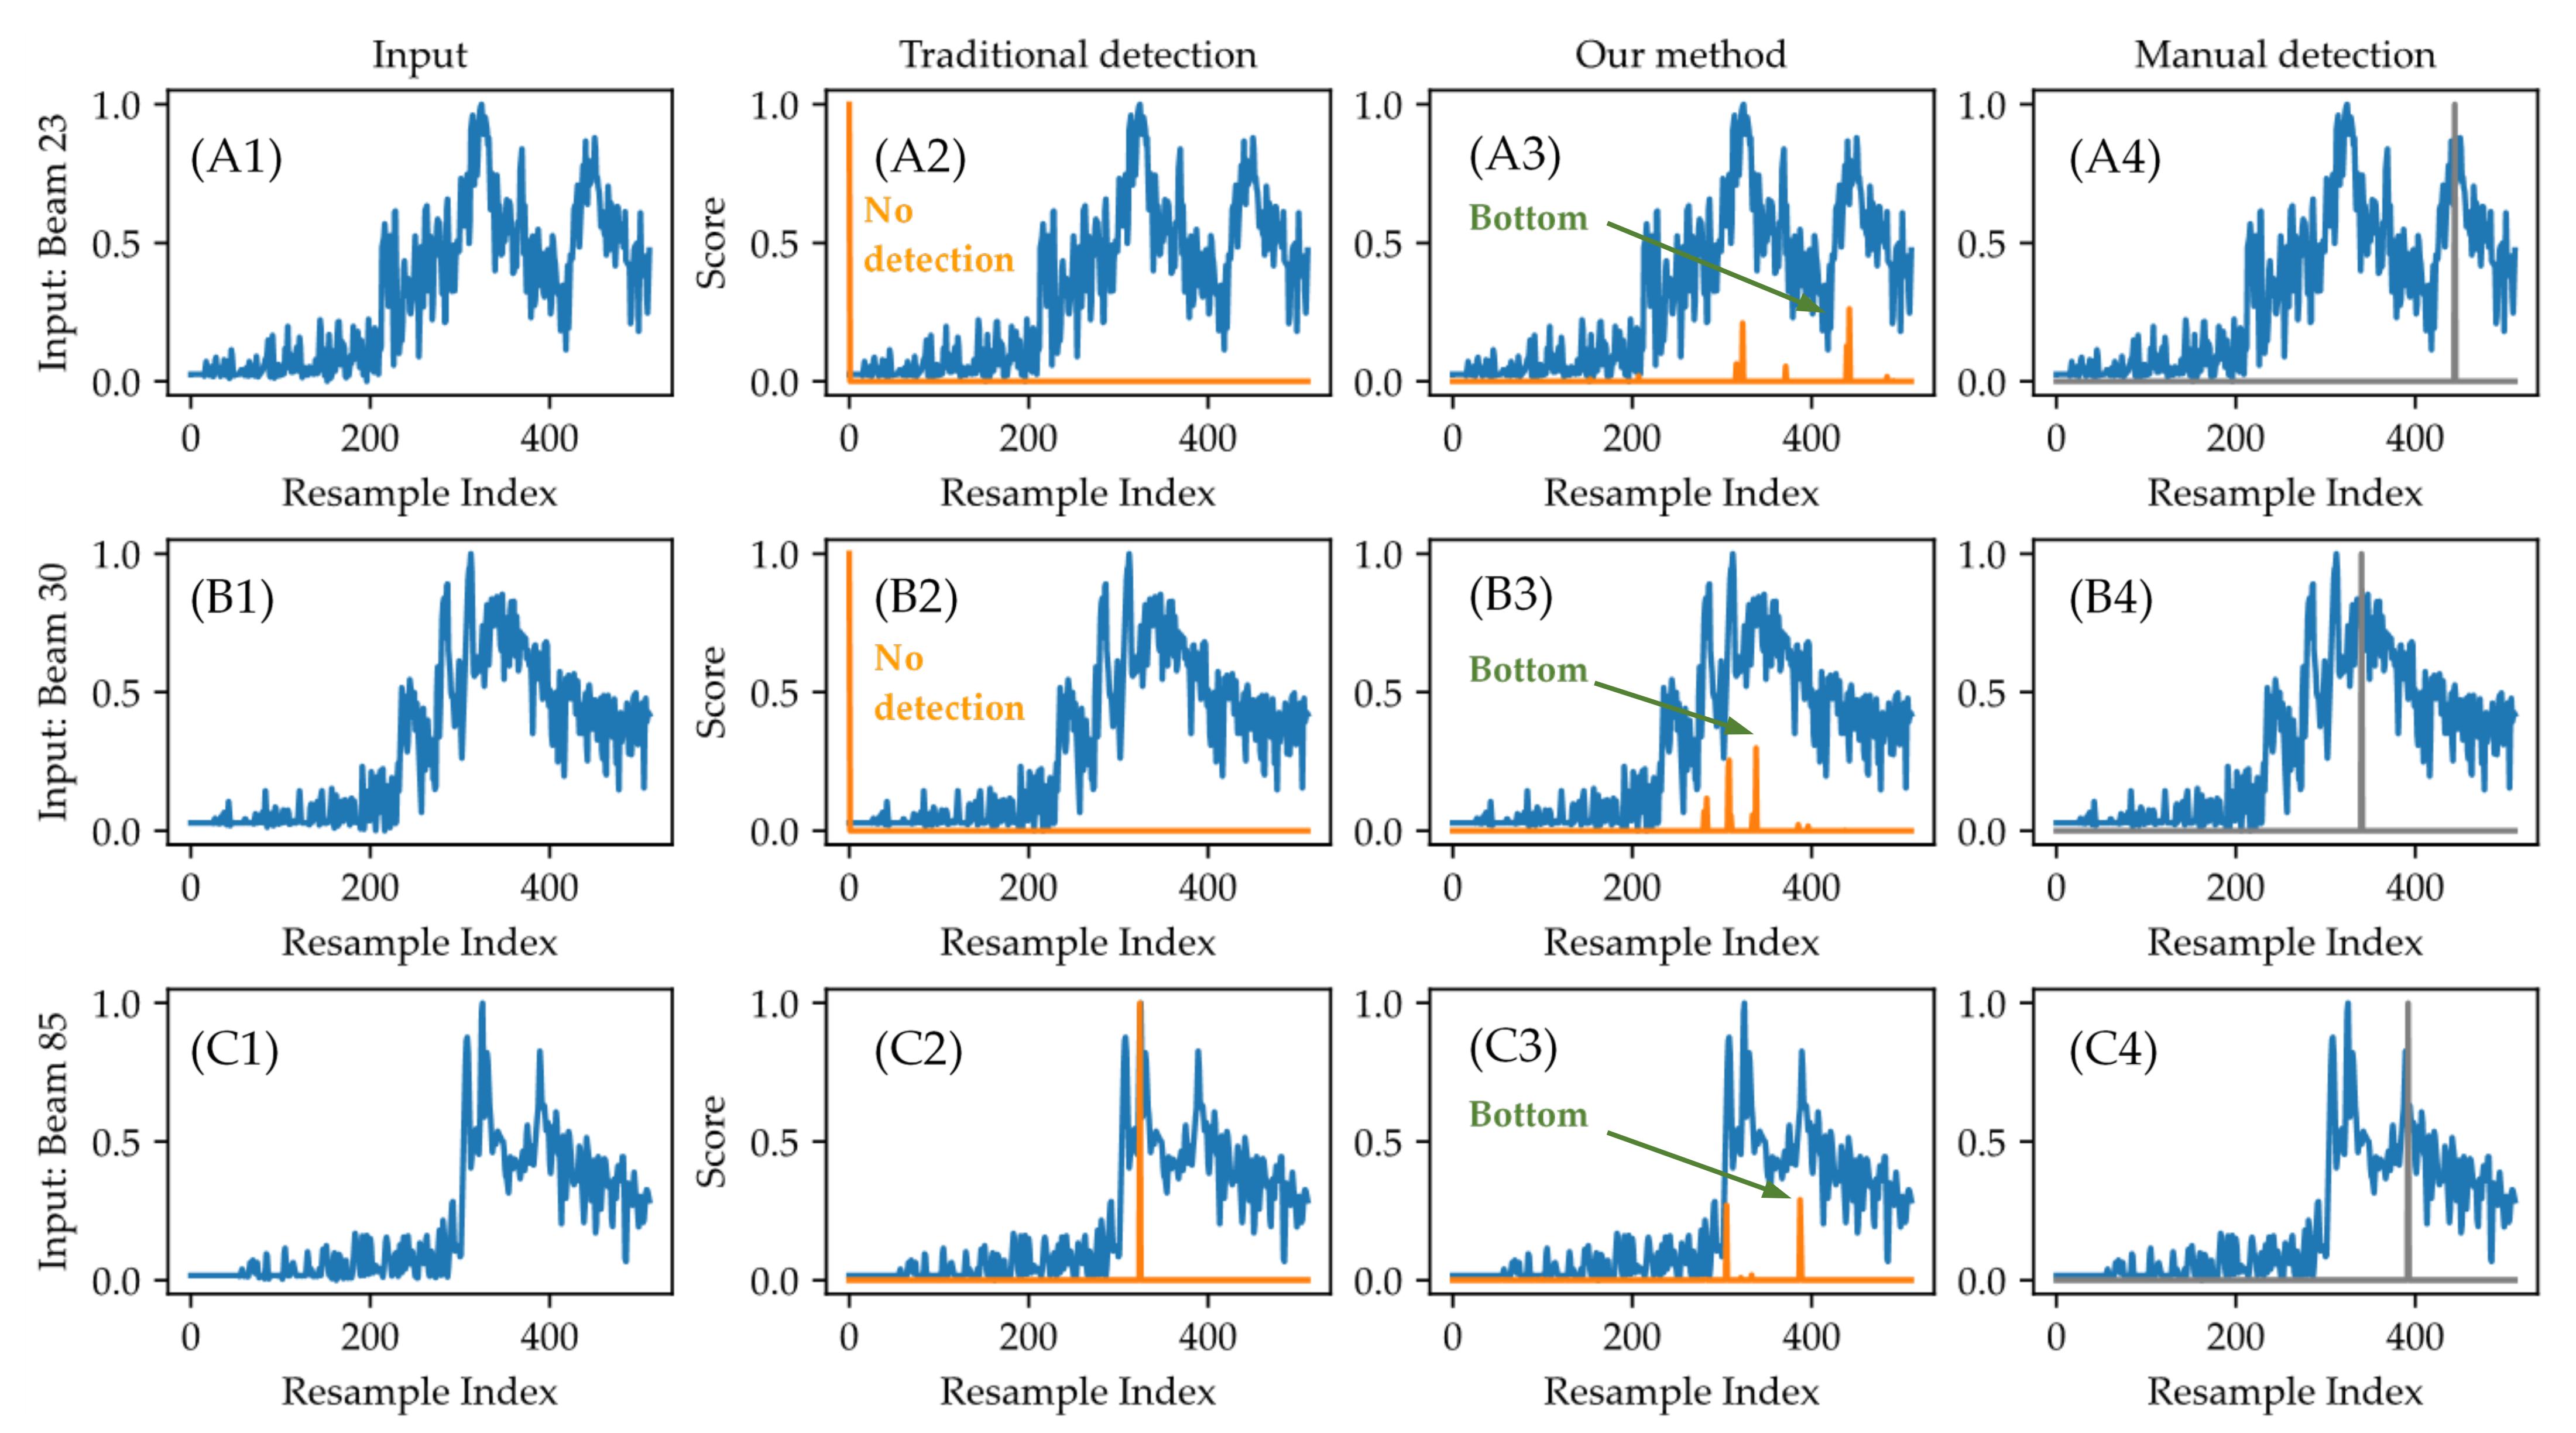
- When there are strong interferences exist in the water column, traditional methods may calculate incorrect detection results or even fail to perform detections. By contrast, the proposed method can obtain correct bottom detection results.
- On the basis of the characteristics of deep learning methods, our proposed method showed high generalizabilty for adapting to a variety of complex environments after sufficient performing sample training was conducted.
2. Theory and Method
2.1. Traditional Bottom Detection Methods
2.1.1. Amplitude and Phase Detection Methods
2.1.2. Failure Conditions
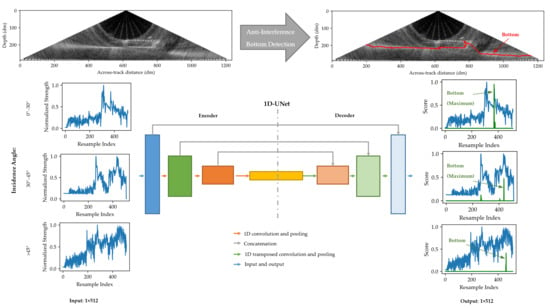
2.2. Deep Learning Model for Bottom Detection of Multibeam Echosounders
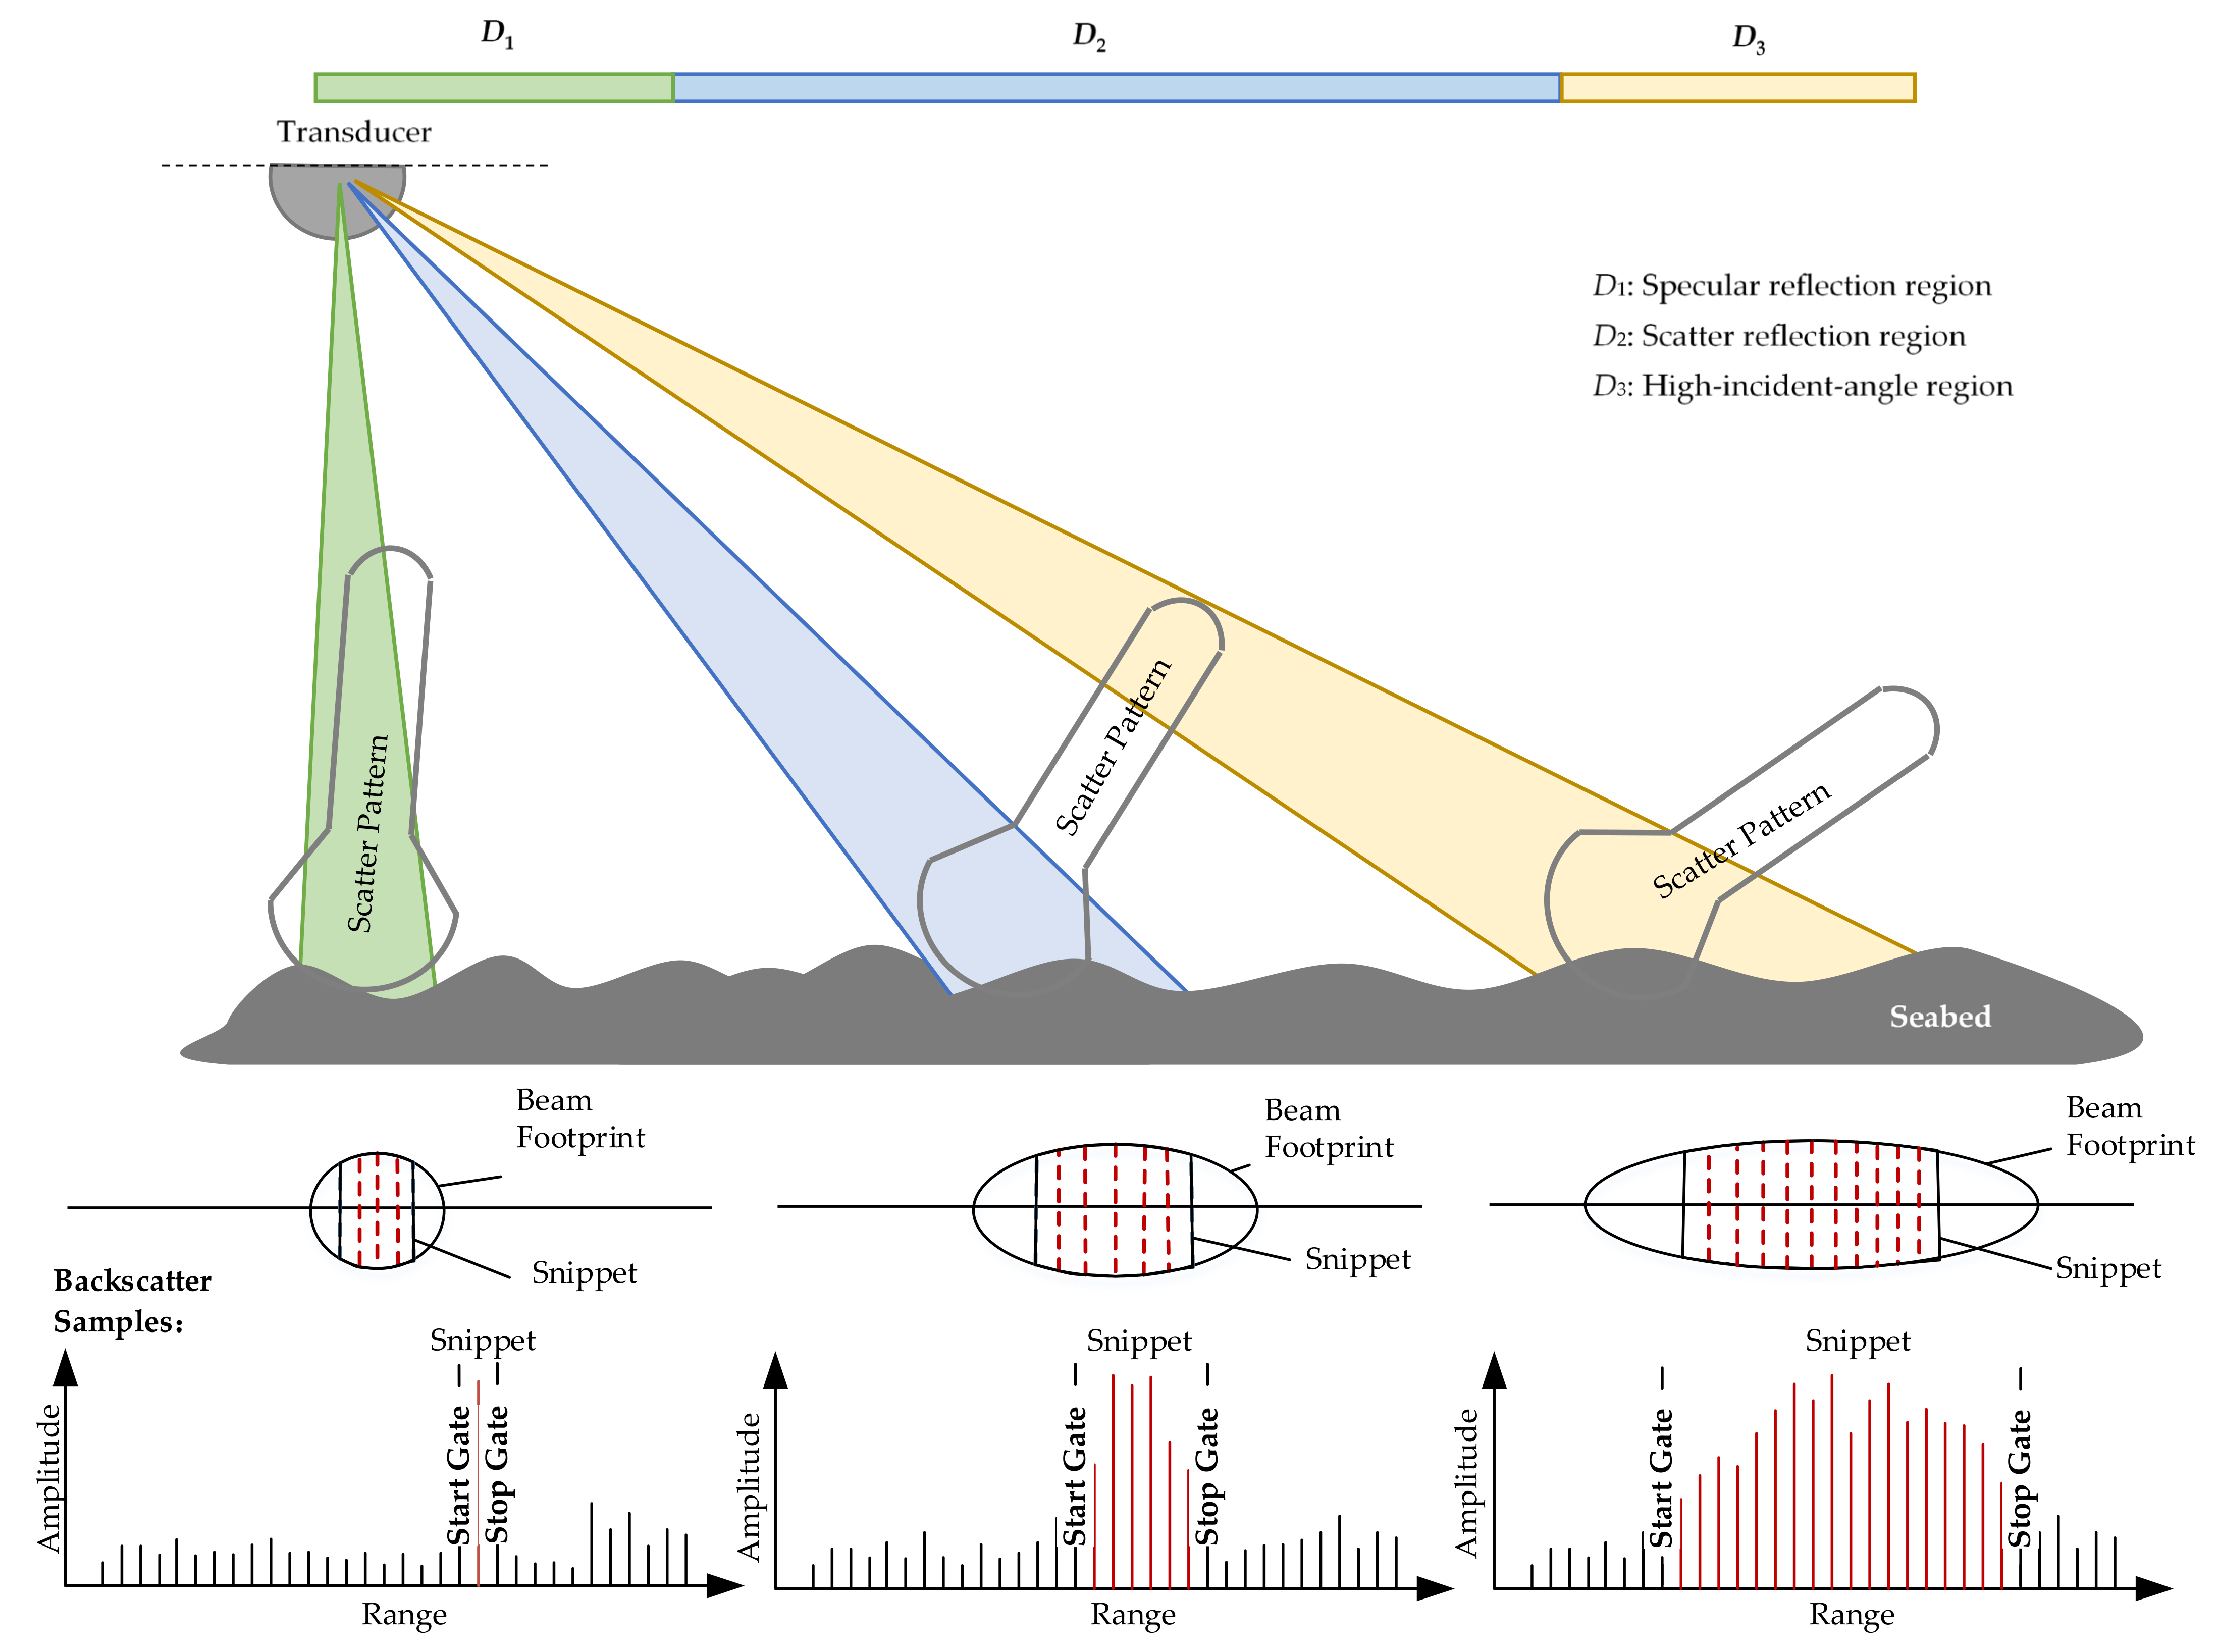
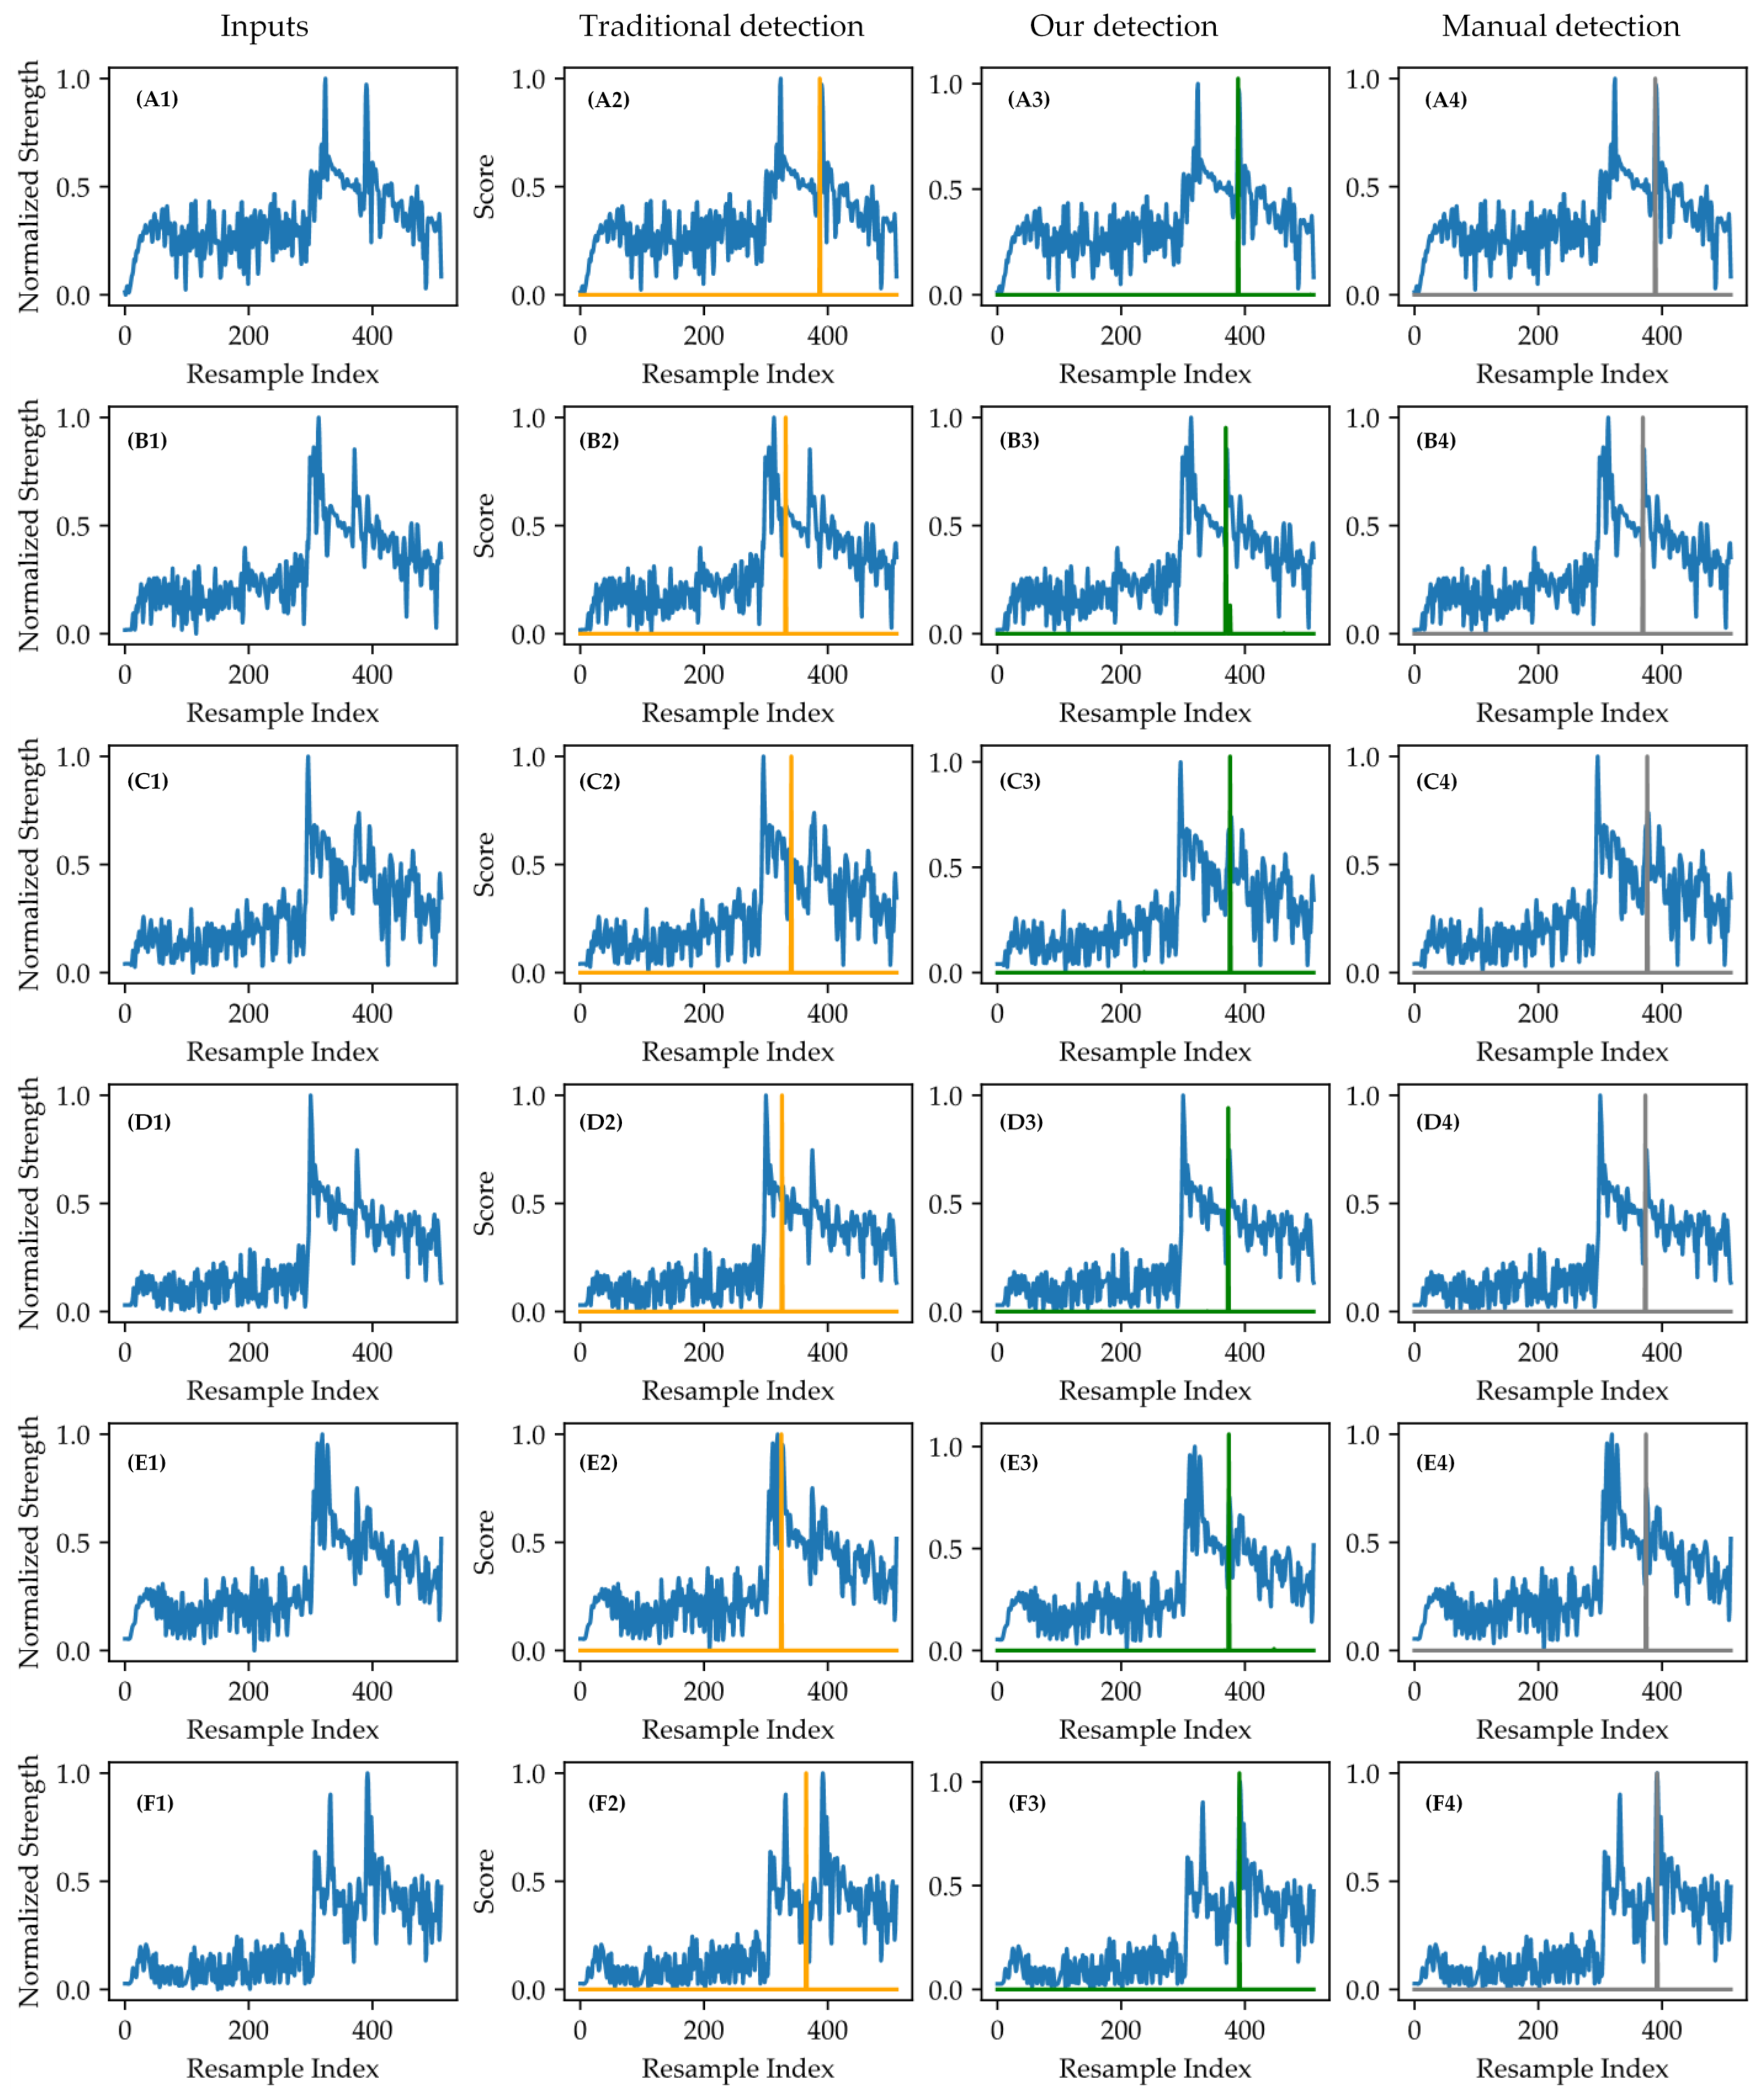
2.2.1. Samples of Normal Backscatter Data and Those with Interference
2.2.2. Details of the Models
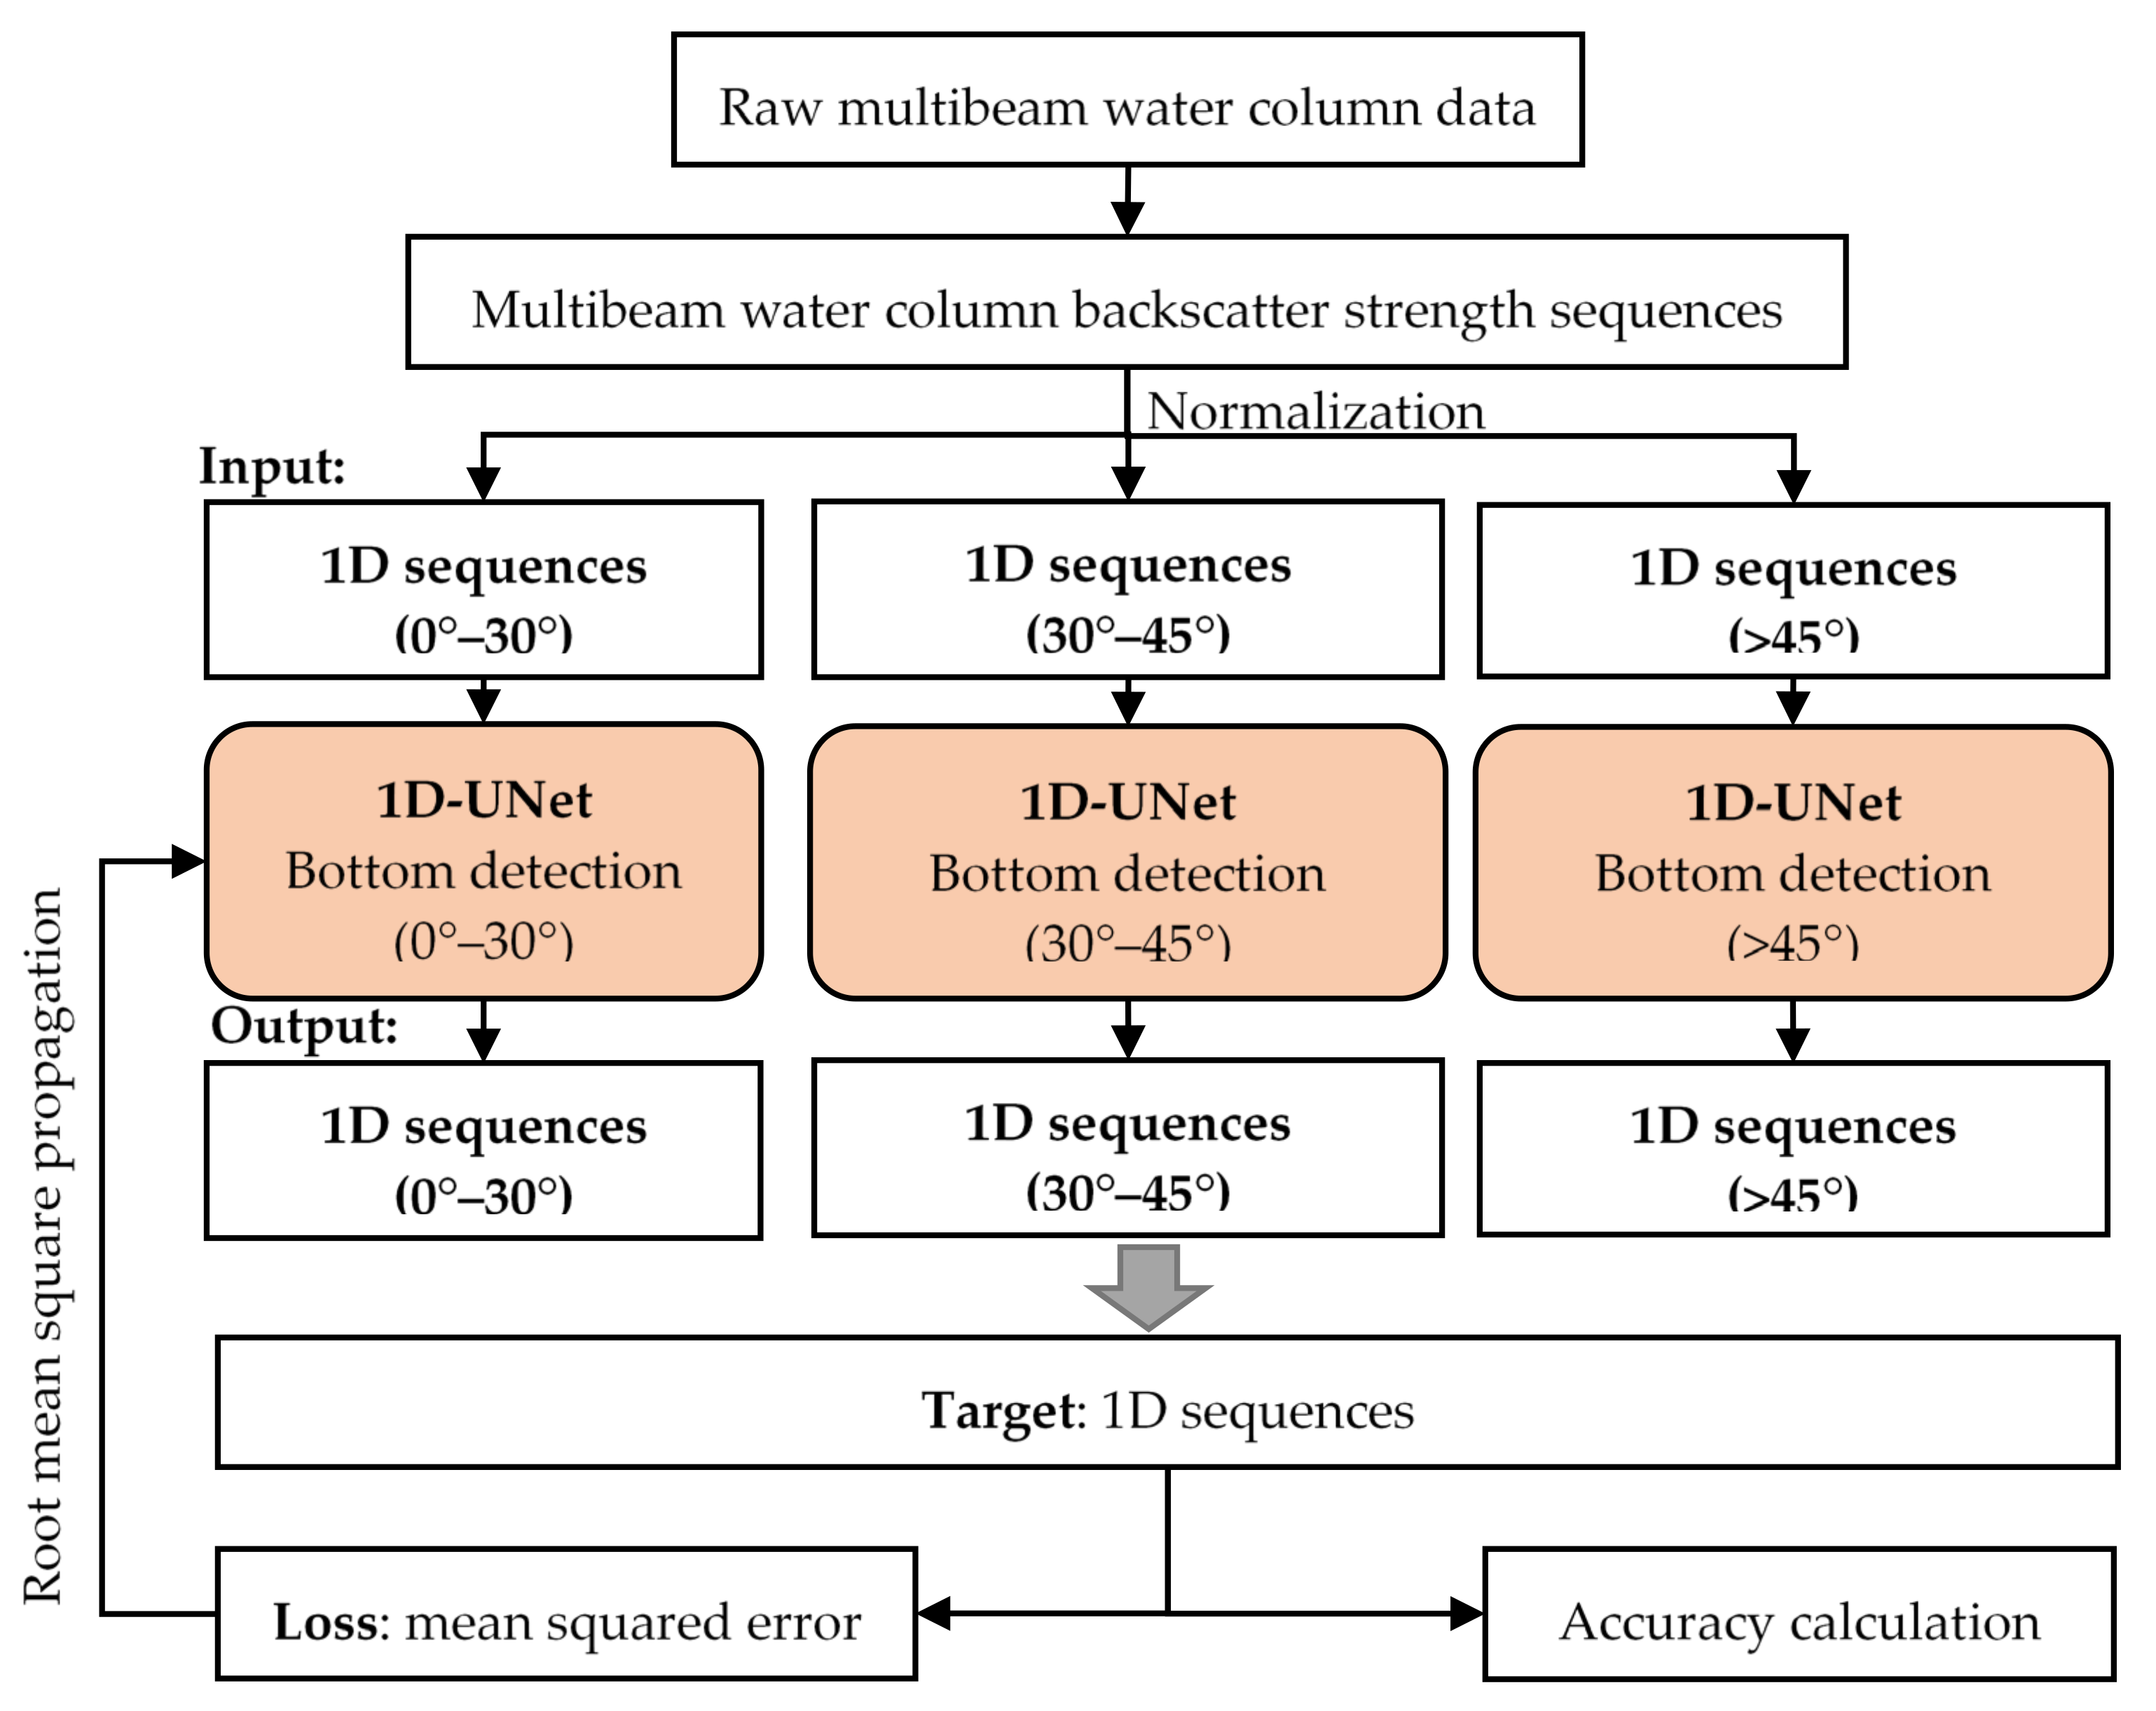
2.3. Bottom Detection of Multibeam Water Column Data
3. Experiment and Results
3.1. Bottom Detection of Along-Track Multibeam Water Column Data
3.1.1. Bottom Detection Results at an Incidence Angle of 0°
3.1.2. Bottom Detection Results at an Incidence Angle of 35°
3.1.3. Bottom Detection Results at an Incidence Angle of 60°
3.2. Bottom Detection of Across-Track Multibeam Water Column Data
4. Discussion
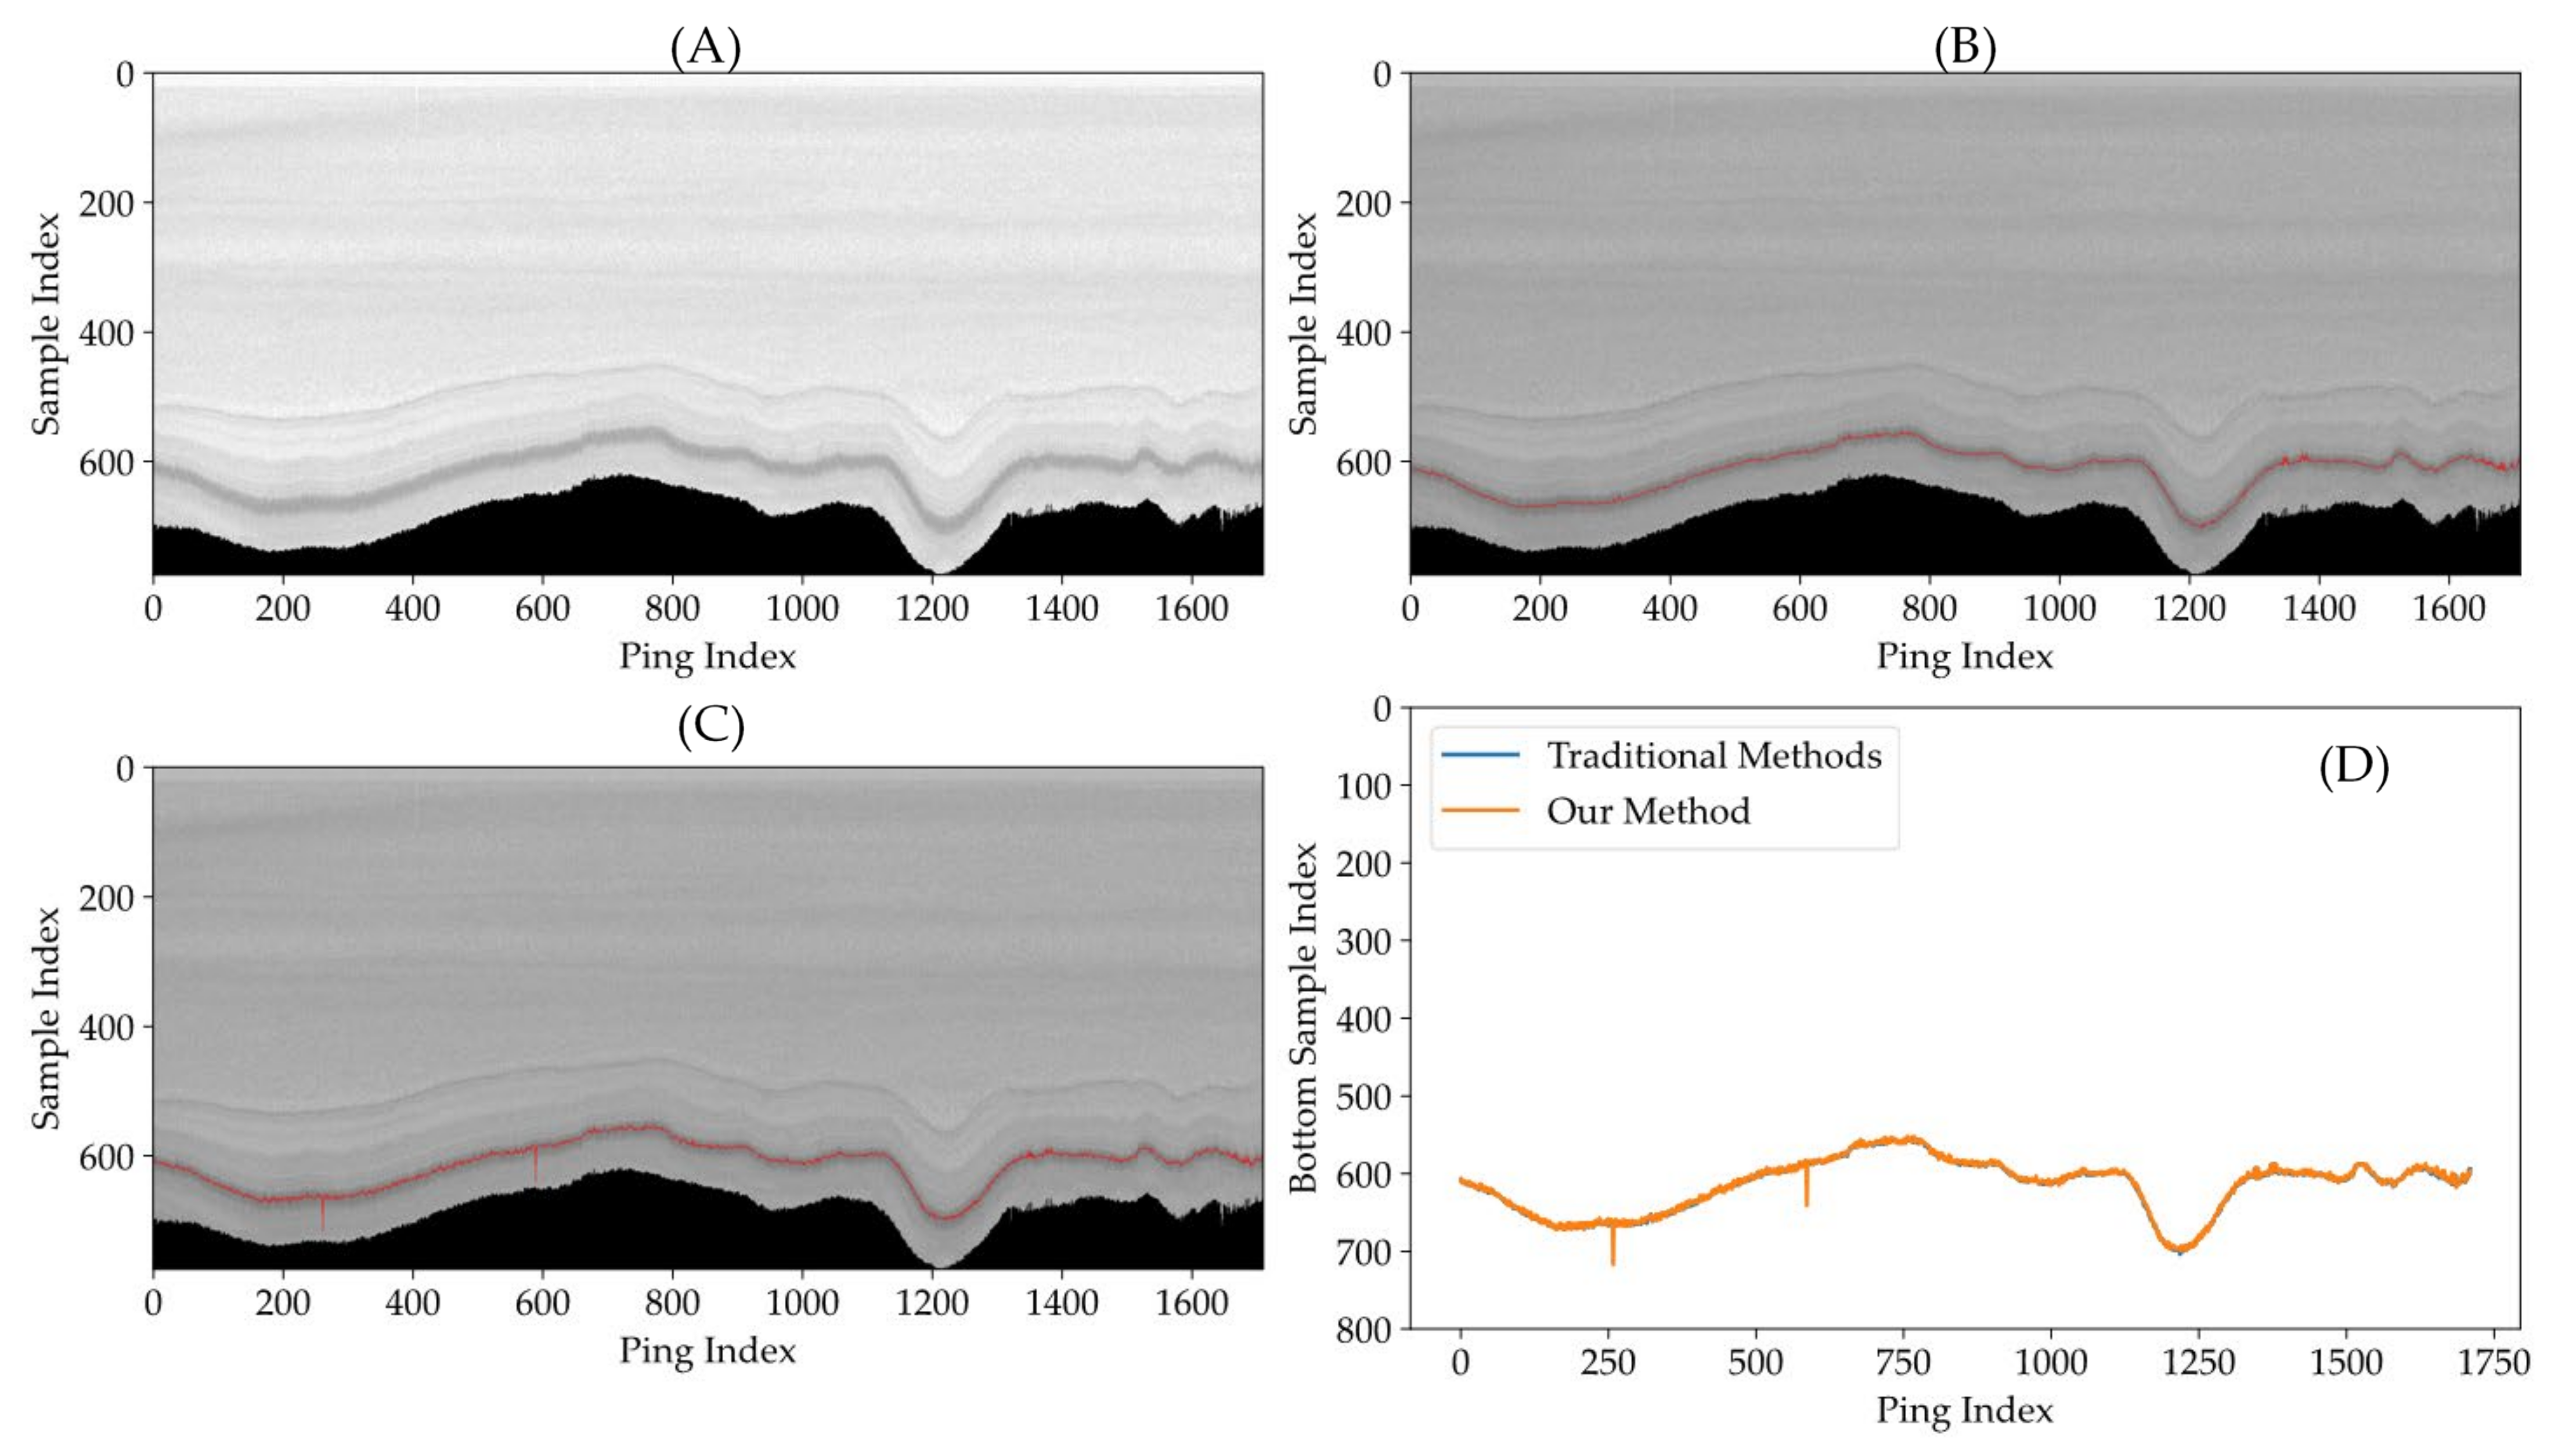
4.1. Applying the Trained Models to Other Multibeam Data
4.2. Solutions in Different Interference Situations
- Normal case: In this case, no obvious interferences exist, and the bottom echoes usually have very high signal-to-noise ratios. Traditional methods work sufficiently in this case, and our method can be used as an auxiliary verification tool.
- Interference case with semi-occluded seabed: In this case, traditional methods might fail to calculate the correct results; thus, our deep learning method can be regarded as a more effective solution for handling interference data.
- Interference case with a fully occluded seabed: In this case, the sound from the transducers cannot penetrate the interference. Thus, even manual methods cannot identify true sea bottom positions. Traditional methods may fail to perform detection. By contrast, our method takes the interferences as the bottoms, which is an acceptable approach.
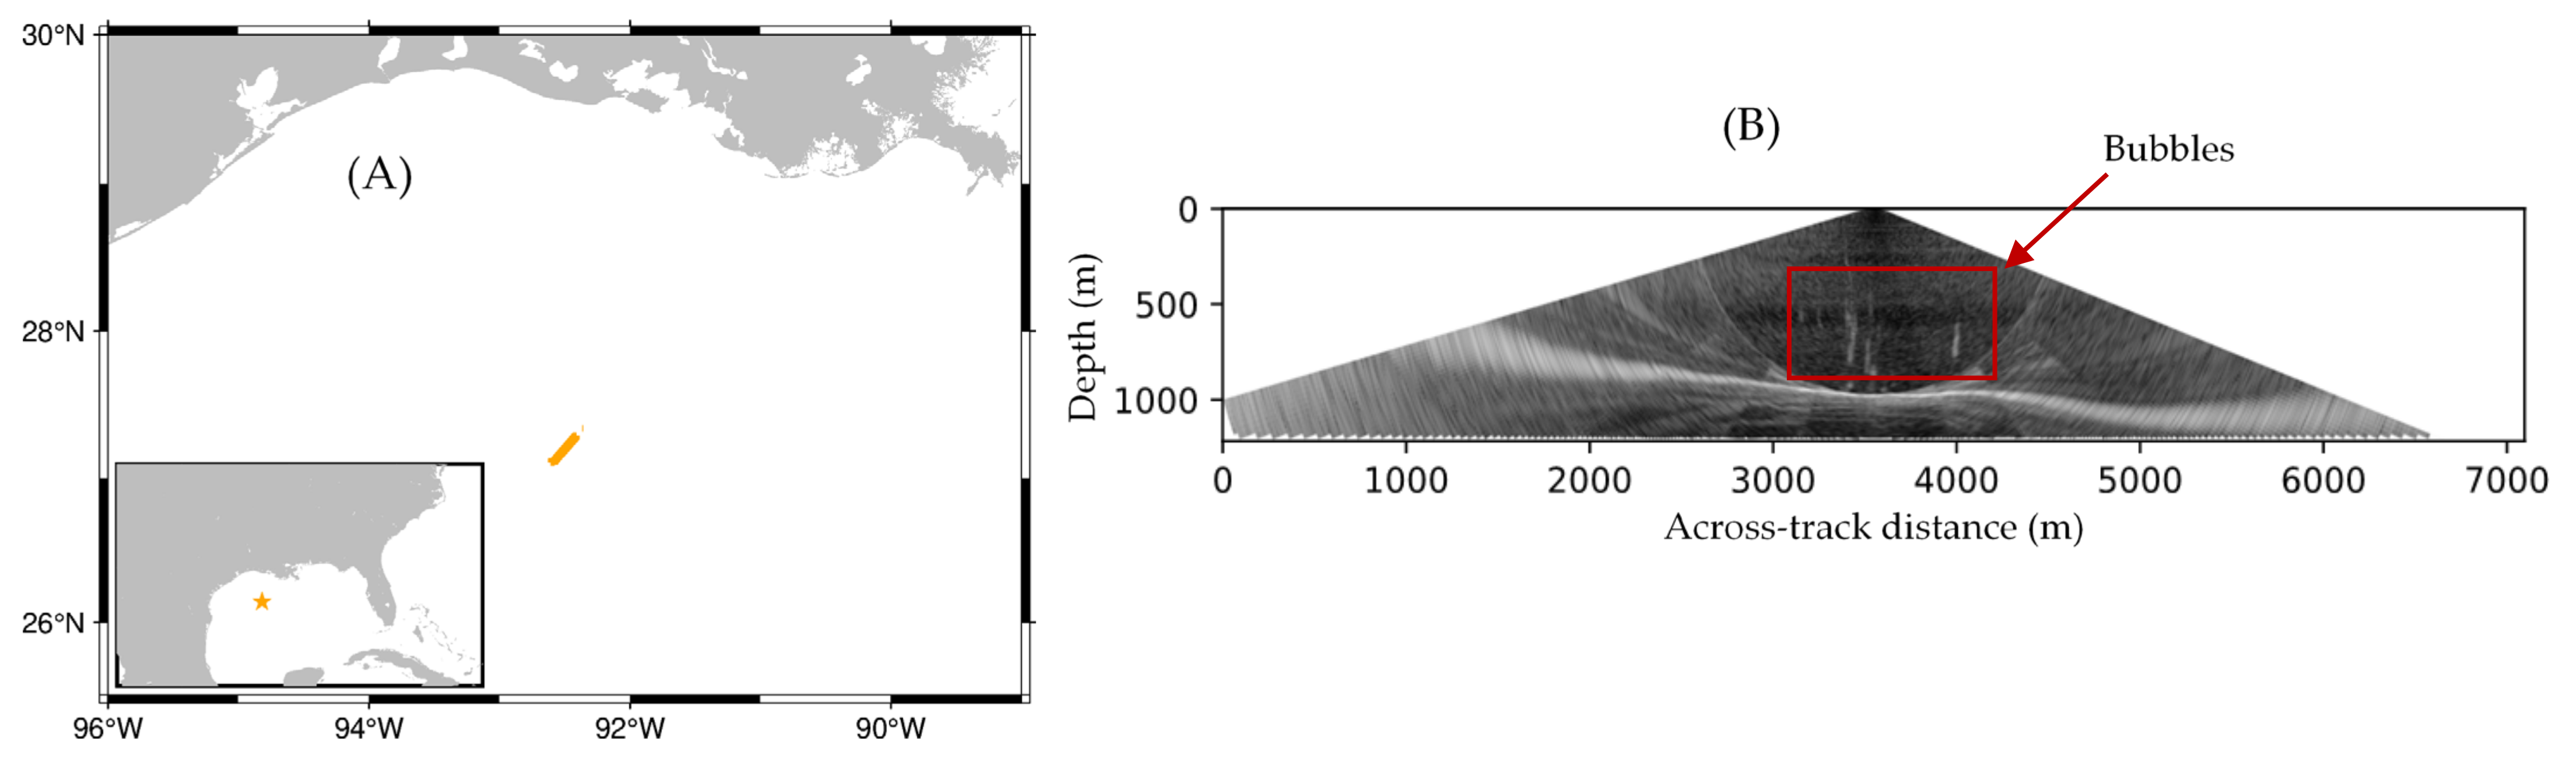
4.3. Strong Interferences Can Be Important Targets
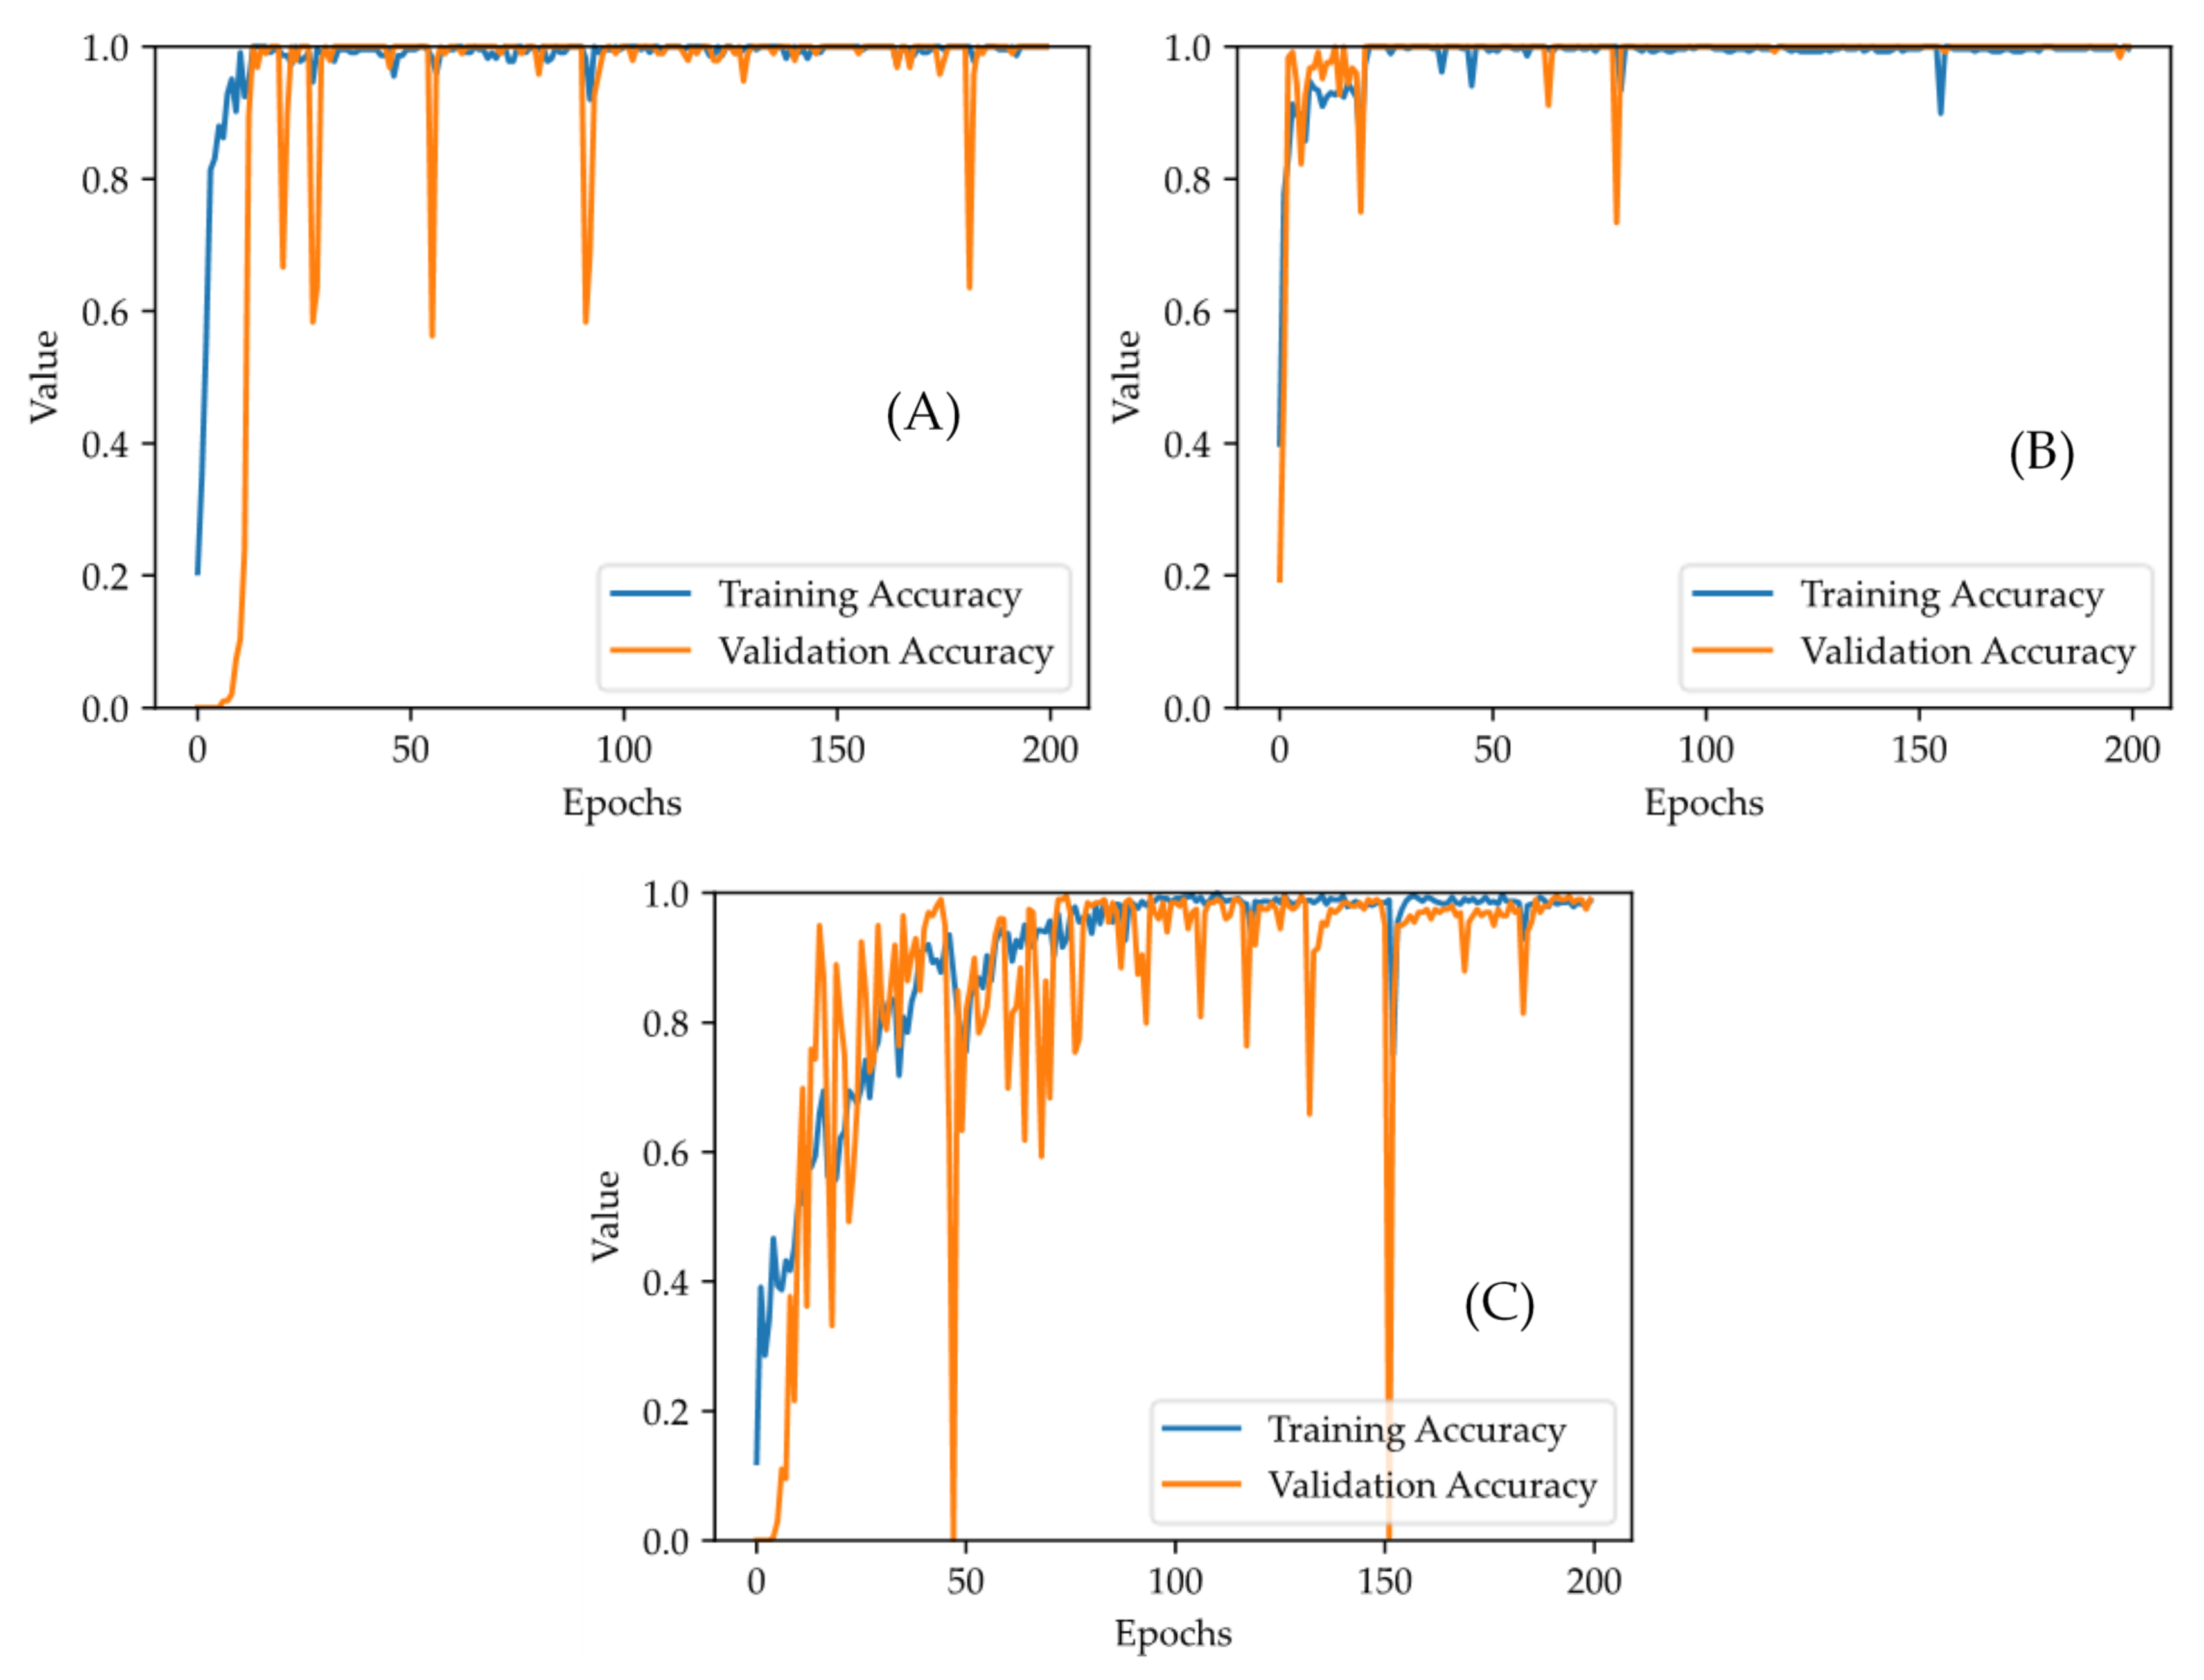
4.4. Training Processes in Figure 8
4.5. Future Work
5. Conclusions
Author Contributions
Funding
Data Availability Statement
Conflicts of Interest
References
- Hughes Clarke, J.E.; Mayer, L.; Wells, D. Shallow-water imaging multibeam sonars: A new tool for investigating seafloor processes in the coastal zone and on the continental shelf. Mar. Geophys. Res. 1996, 18, 607–629. [Google Scholar] [CrossRef]
- Hellequin, L.; Boucher, J.M.; Lurton, X. Processing of high-frequency multibeam echo sounder data for seafloor characterization. IEEE J. Ocean. Eng. 2003, 28, 78–89. [Google Scholar] [CrossRef]
- Cui, X.; Liu, H.; Fan, M.; Ai, B.; Ma, D.; Yang, F. Seafloor habitat mapping using multibeam bathymetric and backscatter intensity multi-features SVM classification framework. Appl. Acoust. 2021, 174, 107728. [Google Scholar] [CrossRef]
- Yu, X.; Zhai, J.; Zou, B.; Shao, Q.; Hou, G. A Novel Acoustic Sediment Classification Method Based on the K-Mdoids Algorithm Using Multibeam Echosounder Backscatter Intensity. J. Mar. Sci. Eng. 2021, 9, 508. [Google Scholar] [CrossRef]
- Philip, B.T.; Denny, A.R.; Solomon, E.A.; Kelley, D.S. Time-series measurements of bubble plume variability and water column methane distribution above Southern Hydrate Ridge, Oregon. Geochem. Geophys. Geosystems 2016, 17, 1182–1196. [Google Scholar] [CrossRef]
- Chen, Y.; Ding, J.; Zhang, H.; Tang, Q.; Zhou, X.; Liu, X. Multibeam water column data research in the Taixinan Basin: Implications for the potential occurrence of natural gas hydrate. Acta Oceanol. Sin. 2019, 38, 129–133. [Google Scholar] [CrossRef]
- Meng, J.; Yan, J.; Zhao, J. Bubble Plume Target Detection Method of Multibeam Water Column Images Based on Bags of Visual Word Features. Remote Sens. 2022, 14, 3296. [Google Scholar] [CrossRef]
- Colbo, K.; Ross, T.; Brown, C.; Weber, T. A review of oceanographic applications of water column data from multibeam echosounders. Estuar. Coast. Shelf Sci. 2014, 145, 41–56. [Google Scholar] [CrossRef]
- Hughes Clarke, J.E. Optimal Use of Multibeam Technology in the Study of Shelf Morphodynamics. In Sediments, Morphology and Sedimentary Processes on Continental Shelves; John Wiley & Sons: Hoboken, NJ, USA, 2012; pp. 1–28. [Google Scholar] [CrossRef]
- Jiang, Y.; Yang, Z.; Liu, Z.; Yang, C. High-resolution bottom detection algorithm for a multibeam echo-sounder system with a U-shaped array. Acta Oceanol. Sin. 2018, 37, 78–84. [Google Scholar] [CrossRef]
- L-3 Communications SeaBeam Instruments, Multibeam Sonar Theory of Operation. 2000. Available online: https://www3.mbari.org/data/mbsystem/sonarfunction/SeaBeamMultibeamTheoryOperation.pdf (accessed on 12 December 2023).
- Wu, Z.; Yang, F.; Tang, Y. Multi-beam Bathymetric Technology. In High-Resolution Seafloor Survey and Applications; Springer: Singapore, 2021; pp. 21–76. [Google Scholar] [CrossRef]
- Hughes Clarke, J.E. GGE 3353—Imaging and Mapping II: Submarine Acoustic Imaging Methods. Available online: http://www.omg.unb.ca/GGE/SE_3353.html (accessed on 12 December 2023).
- Yan, J.; Meng, J.; Zhao, J. Bottom Detection from Backscatter Data of Conventional Side Scan Sonars through 1D-UNet. Remote Sens. 2021, 13, 1024. [Google Scholar] [CrossRef]
- Acosta, G.G.; Villar, S.A. Accumulated CA–CFAR Process in 2-D for Online Object Detection from Sidescan Sonar Data. IEEE J. Ocean. Eng. 2015, 40, 558–569. [Google Scholar] [CrossRef]
- Villar, S.A.; Paula, M.D.; Solari, F.J.; Acosta, G.G. A Framework for Acoustic Segmentation Using Order Statistic-Constant False Alarm Rate in Two Dimensions from Sidescan Sonar Data. IEEE J. Ocean. Eng. 2018, 43, 735–748. [Google Scholar] [CrossRef]
- Zhao, J.; Meng, J.; Zhang, H.; Wang, S. Comprehensive Detection of Gas Plumes from Multibeam Water Column Images with Minimisation of Noise Interferences. Sensors 2017, 17, 2755. [Google Scholar] [CrossRef] [PubMed]
- Wang, J.; Li, H.; Huo, G.; Li, C.; Wei, Y. A Multi-Beam Seafloor Constant False Alarm Detection Method Based on Weighted Element Averaging. J. Mar. Sci. Eng. 2023, 11, 513. [Google Scholar] [CrossRef]
- Zhao, J.; Wang, X.; Zhang, H.; Wang, A. A Comprehensive Bottom-Tracking Method for Sidescan Sonar Image Influenced by Complicated Measuring Environment. IEEE J. Ocean. Eng. 2017, 42, 619–631. [Google Scholar] [CrossRef]
- Yan, J.; Meng, J.; Zhao, J. Real-Time Bottom Tracking Using Side Scan Sonar Data Through One-Dimensional Convolutional Neural Networks. Remote Sens. 2020, 12, 37. [Google Scholar] [CrossRef]
- Zheng, G.; Zhang, H.; Li, Y.; Zhao, J. A Universal Automatic Bottom Tracking Method of Side Scan Sonar Data Based on Semantic Segmentation. Remote Sens. 2021, 13, 1945. [Google Scholar] [CrossRef]
- Zhao, J.; Yan, J.; Zhang, H.; Meng, J. Two self-adaptive methods of improving multibeam backscatter image quality by removing angular response effect. J. Mar. Sci. Technol. 2017, 22, 288–300. [Google Scholar] [CrossRef]
- Ronneberger, O.; Fischer, P.; Brox, T. U-Net: Convolutional Networks for Biomedical Image Segmentation. In Proceedings of the Medical Image Computing and Computer-Assisted Intervention—MICCAI 2015, Munich, Germany, 5–9 October 2015; Springer: Berlin/Heidelberg, Germany, 2015; pp. 234–241. [Google Scholar] [CrossRef]
- Hughes Clarke, J.E.; Lamplugh, M.; Czotter, K. Multibeam water column imaging: Improved wreck least-depth determination. In Proceedings of the Canadian Hydrographic Conference, Halifax, Canada, 6–9 June 2006. [Google Scholar]
- NOAA Ocean Exploration. EM302 Water Column Sonar Data Collected During EX1402L3; NOAA National Centers for Environmental Information: Washington, DC, USA, 2014. [Google Scholar] [CrossRef]


| Incidence Angle | Normal Data and Default (Traditional) Seabed Detection | Data with Interference and Default (Incorrect) and Manual Seabed Detections |
|---|---|---|
| 0° | 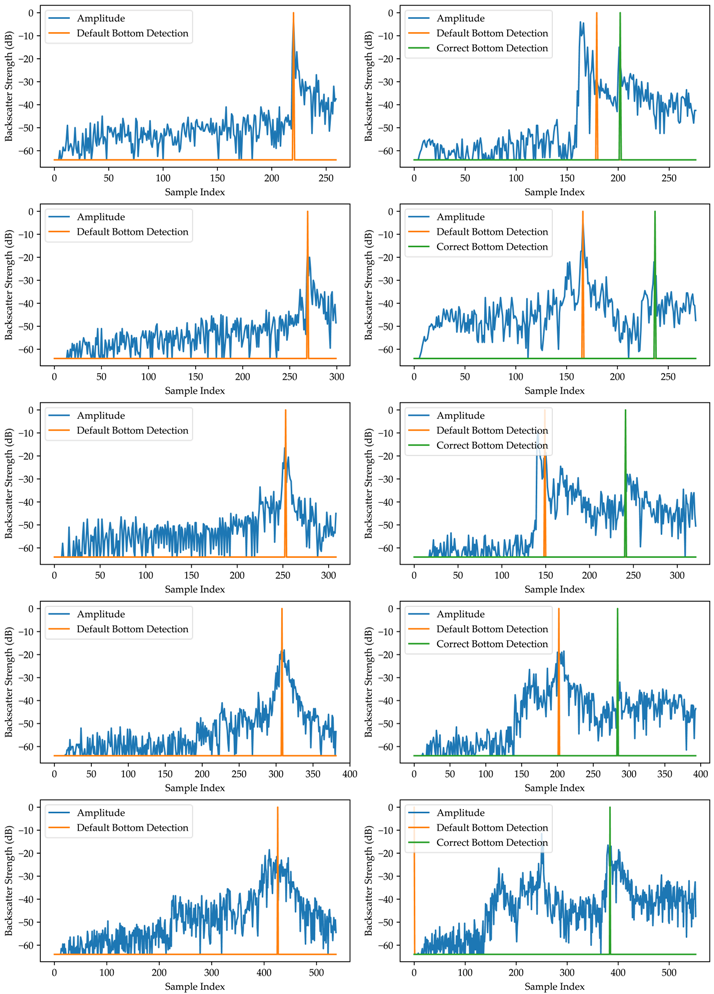 | |
| 15° | ||
| 30° | ||
| 45° | ||
| 60° | ||
Disclaimer/Publisher’s Note: The statements, opinions and data contained in all publications are solely those of the individual author(s) and contributor(s) and not of MDPI and/or the editor(s). MDPI and/or the editor(s) disclaim responsibility for any injury to people or property resulting from any ideas, methods, instructions or products referred to in the content. |
© 2024 by the authors. Licensee MDPI, Basel, Switzerland. This article is an open access article distributed under the terms and conditions of the Creative Commons Attribution (CC BY) license (https://creativecommons.org/licenses/by/4.0/).
Share and Cite
Meng, J.; Yan, J.; Zhang, Q. Anti-Interference Bottom Detection Method of Multibeam Echosounders Based on Deep Learning Models. Remote Sens. 2024, 16, 530. https://doi.org/10.3390/rs16030530
Meng J, Yan J, Zhang Q. Anti-Interference Bottom Detection Method of Multibeam Echosounders Based on Deep Learning Models. Remote Sensing. 2024; 16(3):530. https://doi.org/10.3390/rs16030530
Chicago/Turabian StyleMeng, Junxia, Jun Yan, and Qinghe Zhang. 2024. "Anti-Interference Bottom Detection Method of Multibeam Echosounders Based on Deep Learning Models" Remote Sensing 16, no. 3: 530. https://doi.org/10.3390/rs16030530
APA StyleMeng, J., Yan, J., & Zhang, Q. (2024). Anti-Interference Bottom Detection Method of Multibeam Echosounders Based on Deep Learning Models. Remote Sensing, 16(3), 530. https://doi.org/10.3390/rs16030530