Article

Anti-Interference Bottom Detection Method of Multibeam Echosounders Based on Deep Learning Models

1
College of Civil Engineering, Anhui Jianzhu University, Hefei 230601, China
2
School of Resources and Environmental Engineering, Anhui University, Hefei 230601, China
3
Engineering Center for Geographic Information of Anhui Province, Anhui University, Hefei 230601, China
4
State Key Laboratory of Deep Coal Mining Response and Disaster Prevention and Control, Anhui University of Science and Technology, Huainan 232001, China
5
School of Civil Engineering and Architecture, Anhui University of Science and Technology, Huainan 232001, China
*
Author to whom correspondence should be addressed.
Remote Sens. 2024, 16(3), 530; https://doi.org/10.3390/rs16030530
Submission received: 20 December 2023 / Revised: 14 January 2024 / Accepted: 23 January 2024 / Published: 30 January 2024
(This article belongs to the Special Issue Radar and Sonar Imaging and Processing IV)

Abstract

:
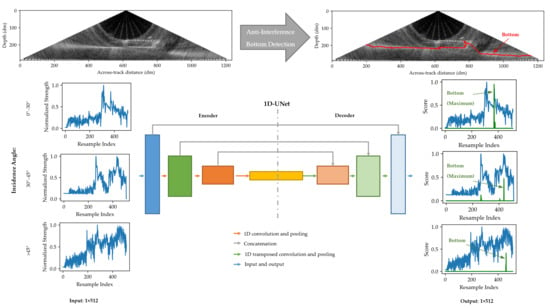
Multibeam echosounders, as the most commonly used bathymetric equipment, have been widely applied in acquiring seabed topography and underwater sonar images. However, when interference occurs in the water column, traditional bottom detection methods may fail, resulting in discontinuities in the bathymetry and distortion in the sonar images. To solve this problem, we propose an anti-interference bottom detection method based on deep learning models. First, the variation differences of backscatter strengths at different incidence angles and the failure conditions of traditional methods were analyzed. Second, the details of our deep learning models are explained. And these models were trained using samples in the specular reflection, scatter reflection, and high-incidence angle regions, respectively. Third, the bottom detection procedures of the along-track and across-track water column data using the trained models are provided. In the experiments, multibeam data with strong interferences in the water column were selected. The bottom detection results of the along-track water column data at incidence angles of 0°, 35°, and 60° and the across-track ping data validated the effectiveness of our method. By comparison, our method acquired the correct bottom position when the traditional methods had inaccurate or even no detection results. Our method can be used to supplement existing methods and effectively improve bathymetry robustness under interference conditions.

Graphical Abstract

1. Introduction

Multibeam echosounders offer the advantages of high-efficiency and high coverage rate bathymetry; thus, they are regarded as the most important equipment used in full water depth measurements, especially in oceanographic surveys, underwater resource exploration, and environmental research [1]. In addition to obtaining bathymetric data for constructing seabed topographies, multibeam echosounders can acquire seabed images for studying seabed geomorphology and surface sediments [2,3,4] and obtain water column data by recording echoes from the water column to the seabed [5,6,7]. With the development of modern storage and computing technology, most current multibeam echosounders can simultaneously acquire the aforementioned three kinds of measurement data, further expanding the application of multibeam sounders [8].
As the most basic ability of multibeam sounders, there are mature solutions for measuring water depth (bathymetry) [9]. The core algorithm of bathymetry is bottom detection [10]. At present, the bottom detection methods for multibeam echosounders include intensity detection and phase detection. The intensity detection methods are further divided into bearing direction indicator (BDI) and weighted mean time (WMT) methods. In the case of small incidence angles, combining WMT and BDI usually obtains accurate bottom detection results [11]; in the case of large incidence angles, the phase detection method usually obtains relatively accurate results. The combination of intensity and phase detection methods has become the bottom detection solution for current mainstream multibeam equipment [12,13].
However, when strong interferences (such as shipwrecks) exist in the water column, traditional bottom detection methods may yield incorrect results. When the traditional method take the interferences as the sea bottom they will fail to perform detections [14]. Incorrect bottom detections lead to discontinuous seabed topography, distorted seabed images, and incomplete water column images. Moreover, incorrect bottom detection brings many problems to the application of multibeam data.
Target detection is one of the main applications of underwater sonars, and noise interferences are common problems in sonar target detection. As a common method for target detection of radars and sonars, constant false alarm rate (CFAR) detectors and their derivatives have been widely studied and applied in underwater sonar target detection [15,16,17]. As the bottom is one of the most important targets, CFAR methods have been used in bottom detection of multibeam echosounders with background noise [18].
Similar to multibeam sounders, side-scan sonars will also meet the same problem in bottom tracking when there are interferences in the water column. Many related studies have been conducted. Researchers have combined multiple methods to establish a comprehensive side-scan sonar bottom tracking method [19]. Given the complexity of underwater environments and the randomness and uncertainty of interferences, modeling methods are usually effective only under certain conditions; modeling methods can hardly adapt to other complex conditions. Therefore, machine learning/deep learning methods have become effective alternatives or complementary techniques to traditional methods in all aspects of sonar data processing; they have also been studied in various related studies [14,20,21].
In previous research, the authors used a deep learning method to study bottom detection and tracking of side-scan sonar data. The deep learning method used in previous work has been proven effective in processing side-scan data, indicating its potential application to multibeam echosounders [14]. Whereas, the data variation features of side-scan sonars are much simpler than those of multibeam echosounders, and, especially in particular, the echoes of multibeam echosounders can be obtained from different incidence angles. In this study, we investigated the anti-interference bottom detection method of multibeam echosounders based on deep learning models.
The main contributions of our proposed method can be described as follows:
  • When there are strong interferences exist in the water column, traditional methods may calculate incorrect detection results or even fail to perform detections. By contrast, the proposed method can obtain correct bottom detection results.
  • On the basis of the characteristics of deep learning methods, our proposed method showed high generalizabilty for adapting to a variety of complex environments after sufficient performing sample training was conducted.
In the following sections, traditional bottom detection methods and problems that may occur under interference conditions are introduced. Second, the details of the proposed deep learning models, which include sampling from multibeam data, the model structures, and training and validation, are explained in detail. Third, the procedures for bottom detection of the along-track and across-track multibeam water column data by using the trained models are provided. In the experiments on measured multibeam water column data, the along-track data at incidence angles of 0°, 35°, and 60° and the across-track data were selected for verifying our bottom detection method.

2. Theory and Method

2.1. Traditional Bottom Detection Methods

2.1.1. Amplitude and Phase Detection Methods

According to the operating principle of multibeam echosounders, one ping can acquire over hundred and even more echoes at multiple incidence angles. By contrast, affected by the scatter pattern of the seabed, the amplitude variations of echoes at different incidence angles are quite different when the sound reaches the bottom (Figure 1). Moreover, according to the variation characteristics of backscatter strengths, regions at different incidence angles are usually divided into three regions, namely, the specular reflection, scatter reflection, and high-incidence angle regions [22].
Traditional bottom detection methods mainly involve amplitude and phase bottom detection and are used for beam echoes in different scatter-pattern regions (Figure 1). Amplitude bottom detections use the backscatter strength (amplitude) of each beam and operate best in the specular reflection area (near nadir, low incidence angle), whereas phase bottom detections use the phase information of each beam and perform best in the far range (high-incidence angle) [12].
Amplitude bottom detection can be realized in two ways, namely, via BDI and WMT. They are used to convert the per-time-slice angles and amplitudes to a set of beam angles or directions of arrivals (DOAs) and times of arrivals (TOAs) of bottom echoes [11]. The bottom detection results of both BDI and WMT jointly select the best DOA and TOA measurements, thereby increasing the overall accuracy of the system. In the specular regions, the BDI results generated more accurate DOA information. By contrast, in the non-specular regions for beams at large incidence angles, BDI calculations usually produce no results; therefore, WMT processing can be used. The new generation of multibeam echosounders introduces phase detection, which can effectively improve the efficiency of seabed detection in the scatter reflection and high-incidence angle regions. However, when strong interferences exist in the water column, both the amplitude and phase bottom detection methods may fail and produce incorrect bottom detection results.

2.1.2. Failure Conditions

When no interferences exist, sea bottom detection can often be achieved using traditional methods (Figure 2A). However, when strong interferences exist in the water column, the traditional detection method can hardly distinguish the interferences from the real seabed. This limitation can sometimes lead to misjudgment of the real seabed and cause detection failure (Figure 2B). The incorrect bottom detection would lead to discontinuities in bathymetry and affect the acquisition of seabed and water column images.
The complete backscatter strengths of each steered beam are recorded in the multibeam water column data. Furthermore, the variation features when the sound reaches the seabed can be extracted from the backscatter strength curves. The key to solving this problem is finding the method of detecting the strength variation features in each beam. Given the obvious differences in backscatter strength curves at different incidence angles (Figure 1), respectively processing of the backscatter strength curves at different incidence angles is necessary to obtain the true bottom of the seabed. To improve the bottom detection results with strong interference, we used deep learning models to detect the strength variation features of the seabed.

2.2. Deep Learning Model for Bottom Detection of Multibeam Echosounders

On the basis of the abovementioned theoretical analysis of multibeam seabed detection and deep learning models in our previous research, we propose a new bottom detection method for multibeam echosounders based on deep learning models.
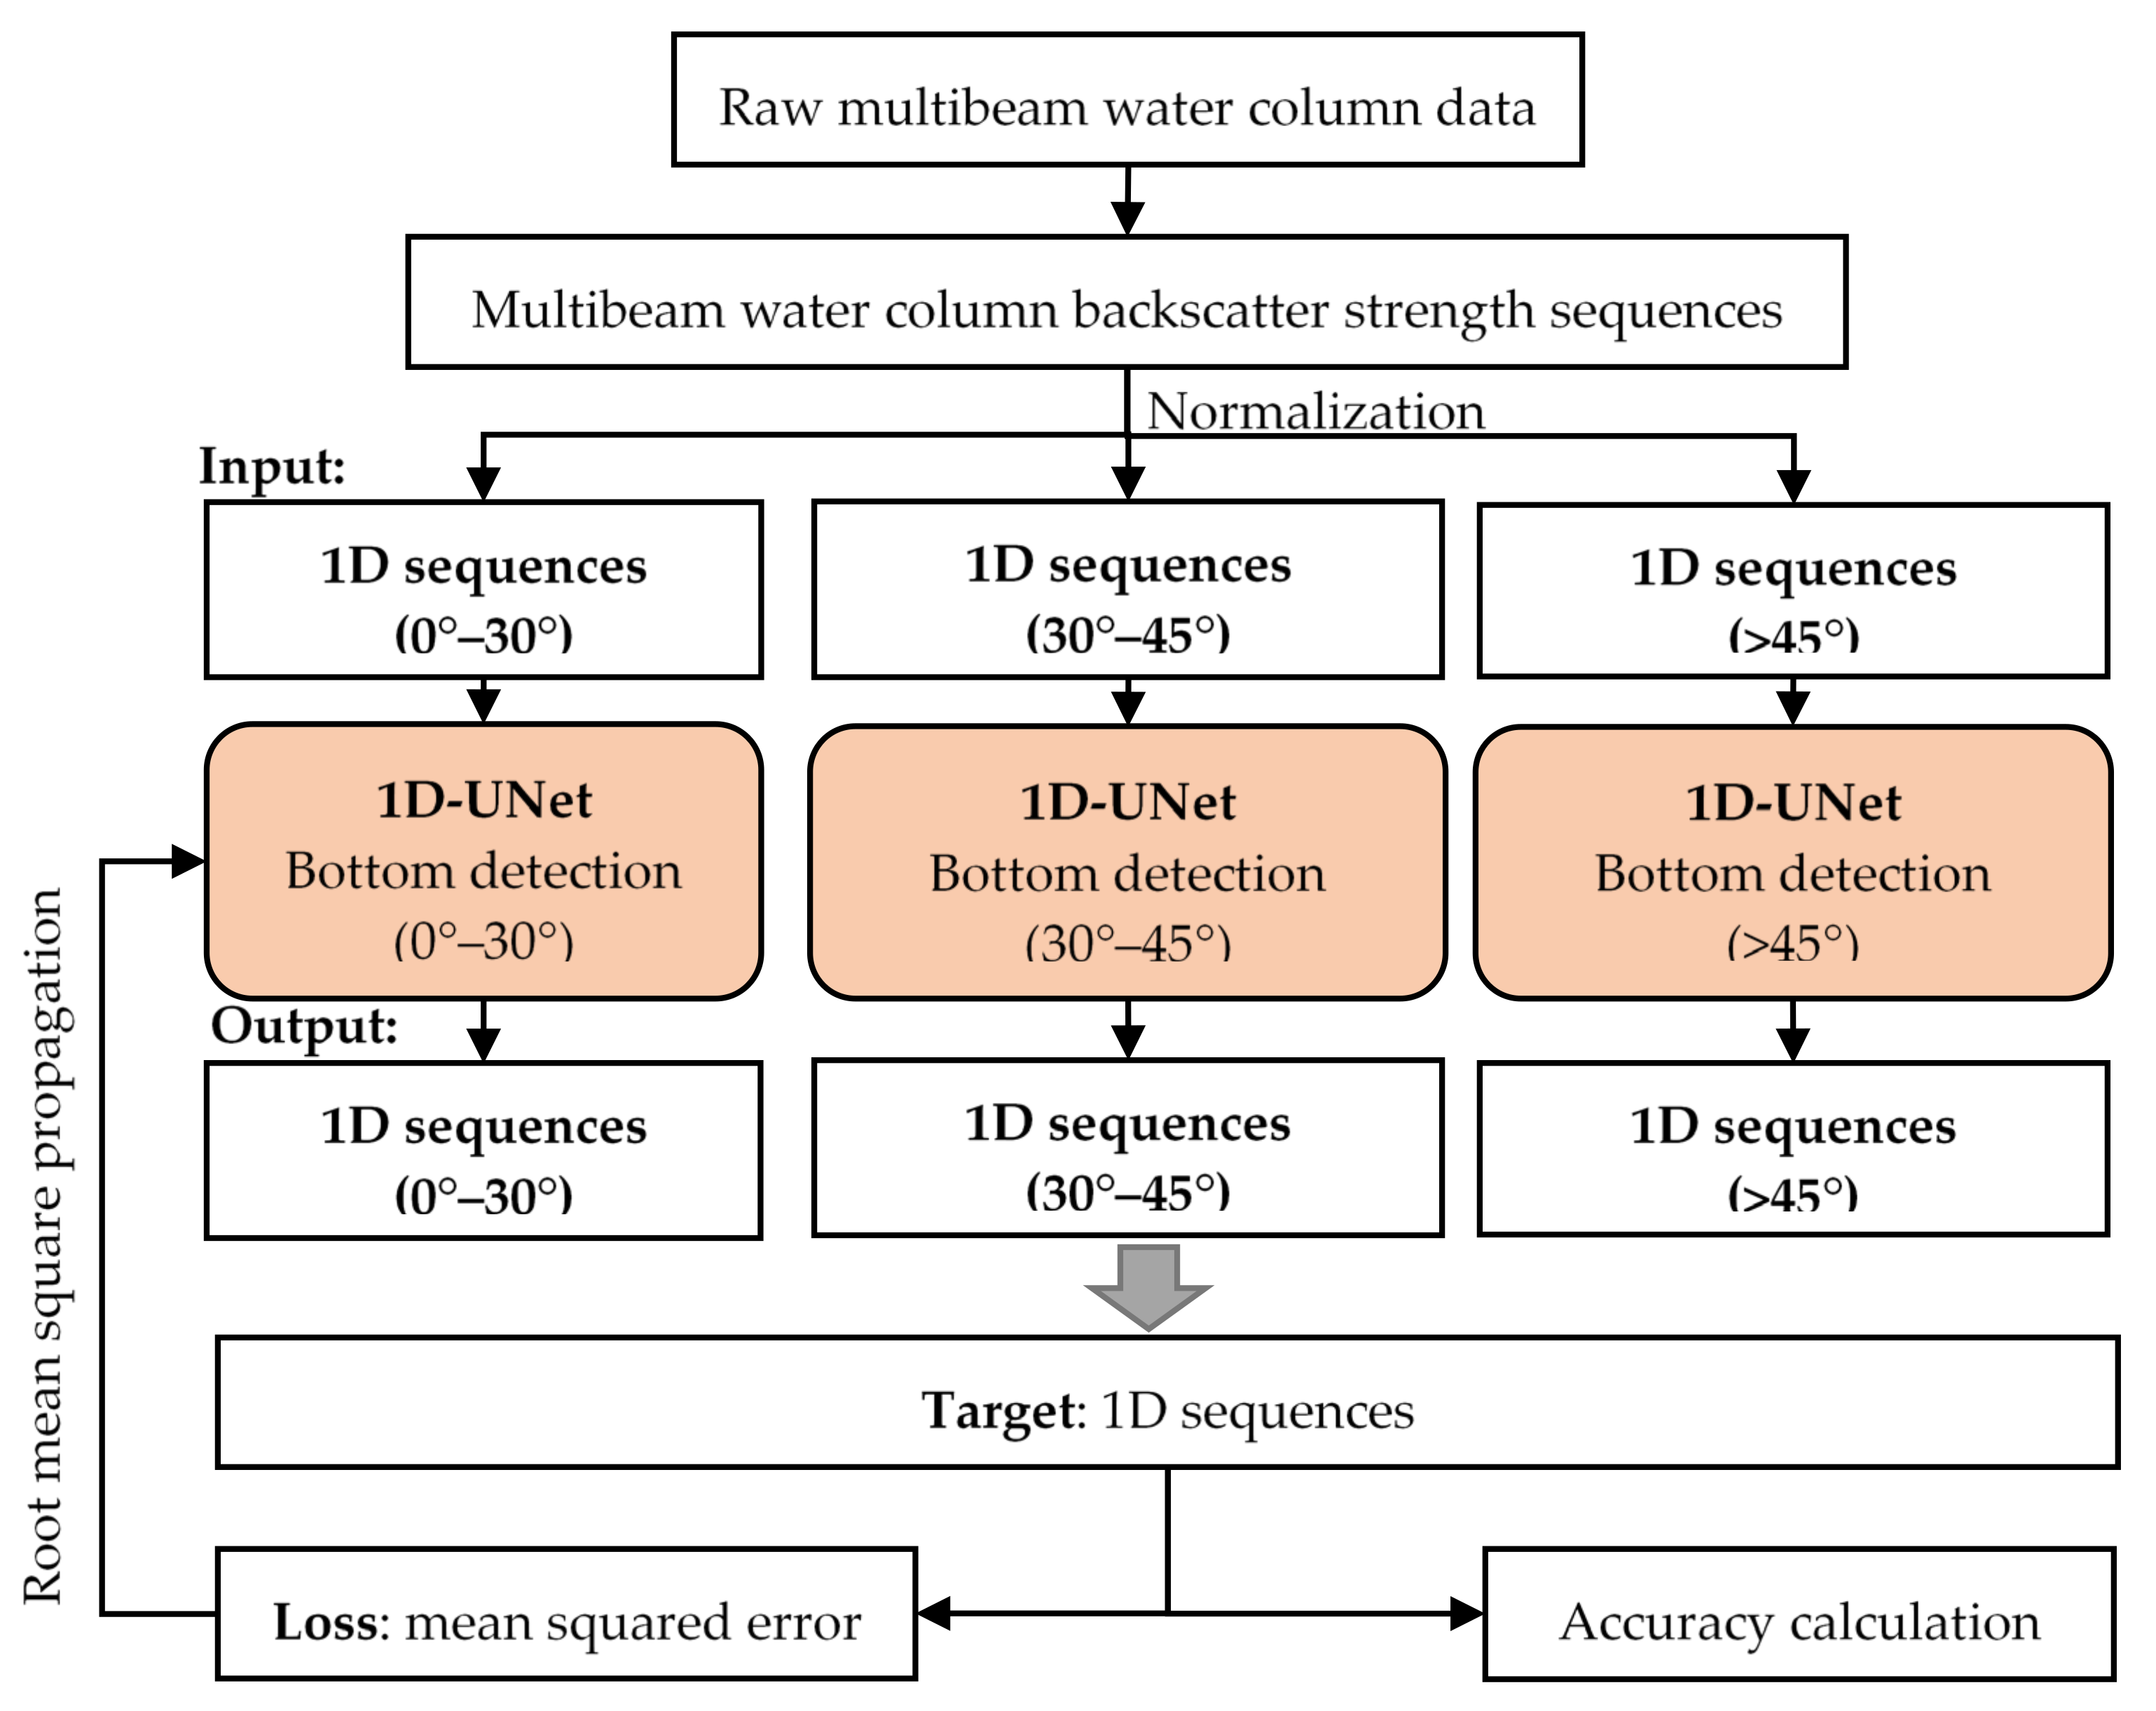
The training procedure of the deep learning models is shown in Figure 3. The procedure starts from decoding the raw binary water column data, followed extracting the backscatter strength sequence of each beam in each ping. Then, sampling and model training operations are performed in the three different reflection regions (specular reflection, scatter reflection, and high-incidence angle regions).

2.2.1. Samples of Normal Backscatter Data and Those with Interference

As shown in Figure 1, given the influence of scatter patterns at different incidence angles, the variation features of the backscatter strengths significantly vary. Thus, the influences of interference on these backscatter strength curves at different incidence angles should be studied separately. The accuracies of seabed detection at different incidence angles also differ from each other. As the incidence angle increases, the accuracy of seabed detection decreases.
The variation features of the backscatter strengths around the sea bottom position can be detected using deep learning models. Here, as a first step, we established a sample library of curves for normal backscatter strength and those with interference. The corresponding sea bottom positions at different incidence angles (labels) were also manually determined.
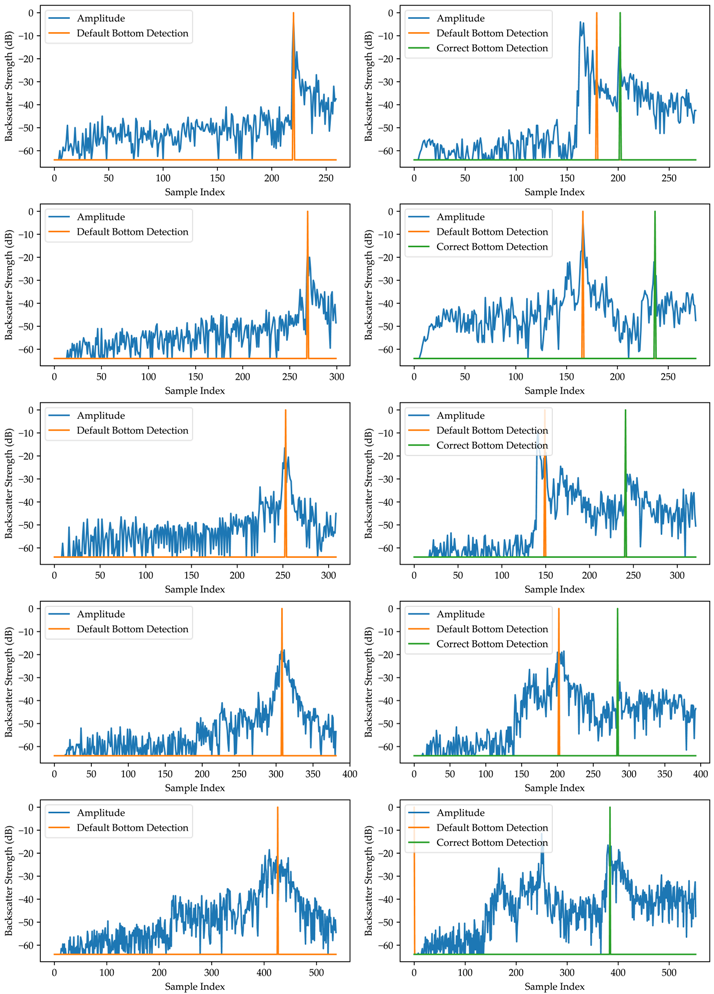
During sampling, the samples were required to contain bottom detection results of both normal data and those with interferences. Normal bottom detection results are typically obtained using traditional detection methods. By contrast, the abnormal bottom detection results need to be manually corrected. The backscatter strength curves with or without interference and the corresponding bottom detection positions are shown in Table 1. The sequence lengths of beams at different angles vary from each other. Thus, the sequences need to be normalized to the same length before training.
Table 1 lists the success and failure cases of adopting the traditional bottom detection method for multibeam echosounders at incidence angles ranging from 0° to 60°. The failure detection results of the traditional method were manually corrected (green lines). The default (traditional) detection results (orange lines) indicate that the traditional method can acquire the accurate position of the sea bottom in most cases when no obvious interferences exist. However, when strong interferences exist in the water column, traditional methods often cannot distinguish between interferences and the seabed. As a result, the interferences are taken as bottoms, or no detection results are recorded (failure case at 60°). The samples with inaccurate bottom detection results according to the traditional methods need to be corrected and marked via manual detection.
By randomly selecting the traditional detection results in the normal condition and the manually corrected bottom detection results in the interference condition, the sample library is obtained and can be used for model training.

2.2.2. Details of the Models

The model used in this study is based on the 1D-UNet model presented in our previous work; this model has been proven effective in bottom detection for side-scan sonars [14]. 1D-UNet, a one-dimensional version of the classical U-Net model [23], is suitable for target detection of sequences such as backscatter strengths of each beam. The 1D-UNet model contains two parts, namely, an encoder and a decoder. The encoder extracts features from multibeam backscatter strength sequences, whereas the decoder predicts sea bottom positions (Figure 4).
As 1D-UNet is a sequence-to-sequence model, the backscatter strength sequences are used as the inputs, while the same-length sequences containing the bottom position are used as the outputs. Before model training, the input sequence values need to be normalized between 0 and 1. In the labeled output sequences, the values at the sea bottom locations are set to 1, whereas the values at the other locations are set to 0.
Affected by the scatter pattern of the seabed, the backscatter strength sequences at different incidence angles are obviously different. During the training experiments, the training model of backscatter strength sequences at an incidence angle of 0° cannot effectively detect the bottom positions of backscatter strength sequences at 60°, and vice versa. As shown in Figure 1, the variation features of the backscatter strength sequence vary across the specular reflection, scatter reflection, and high-incidence angle regions. Therefore, with respect to the incidence angle of each beam, we divided the backscatter strength sequence into three parts (i.e., at incidence angles of 0°–30°, 30°–45°, and above 45°) for model training.
The mean-squared error (MSE) function, selected as the loss function, was used to calculate the differences between the predicted and target score sequences. The root mean-square propagation (RMSProp) optimizer, selected as the optimizer for 1D-UNet, was used to update the parameters. The details are shown in Figure 3.
The outputs of the models represent the prediction scores of all the corresponding locations. The location with the highest prediction score corresponds to the bottom location. Given the variation features of the backscatter strength sequences at different incidence angles and the allowable errors of manual detection results, the bottom detection accuracies in the three regions are not the same.
For sequences at an incidence angle of 0°–30°, whether the bottom detection is correct is determined by
correct y = t r u e ,   a b s ( i y i y ̑ ) 1 % × l y f a l s e , a b s ( i y i y ̑ ) > 1 % × l y ,
where y and ŷ are the predicted and target sequences, respectively; iy and iŷ are the indices of the maximum probabilities in the predicted and target sequences, respectively; ly is the length of the predicted sequence; and abs is the absolute value function.
For sequences at an incidence angle of 30°–45°, the evaluation criterion for correct bottom detection is
correct y = t r u e ,   a b s ( i y i y ̑ ) 2 % × l y f a l s e , a b s ( i y i y ̑ ) > 2 % × l y .
For sequences at incidence angles larger than 45°, the evaluation criterion is
correct y = t r u e ,   a b s ( i y i y ̑ ) 4 % × l y f a l s e , a b s ( i y i y ̑ ) > 4 % × l y .

2.3. Bottom Detection of Multibeam Water Column Data

After the parameters of the models were tuned by training and validation, the trained models were used for bottom detection of multibeam water column data at specific incidence angles. The multibeam water column images are usually displayed in the along-track and across-track directions. Thus, we employed bottom detection procedures in both directions by using the 1D-UNet models (Figure 5 and Figure 6).
The along-track bottom detection procedure for multibeam water column data is shown in Figure 5. For bottom detection of the along-track water column data, the corresponding 1D-UNet model needs to be selected according to the incidence angle of the along-track image. The bottom position of each beam can be successively predicted using the selected 1D-UNet model following the along-track direction, after which the continuous bottom detection results of the entire survey line can be obtained.
The procedure for across-track bottom detection of multibeam water column data is shown in Figure 6. To process the across-track water column data, we selected the corresponding 1D-UNet model for bottom detection on the basis of the incidence angle of each beam. The sea bottom position of each beam in the entire ping can be successively predicted using the corresponding 1D-UNet model following the direction from the port side to the starboard side. Consequently, continuous detection results of the entire ping can be obtained.

3. Experiment and Results

To verify the effectiveness of our proposed method, we selected multibeam water column data measured in Swartz Bay, Canada for the experiments. The surveyed water area and the coordinates of the track lines are shown in Figure 7. The multibeam data were measured by a Kongsberg EM3002 (operational frequency of 300 kHz) from 31 March to 2 April 2006 [24]. The average water depth in the survey area was approximately 20 m. This surveyed water area has an existing shipwreck. The body and mast of this wreck presented strong interference in the water column and led to incorrect bottom detection results. As the main focus of this research was about the bottom detection method, calibrations of the multibeam transducer and other sensors were not introduced.
The training samples were extracted from the multibeam data (Figure 7). First, the raw multibeam data were decoded in EM data format. Then, using our written program, we randomly selected the backscatters of beams in normal and interference conditions as the model inputs and manually checked the detection results as the model outputs. The training data of the three models were randomly selected from all 12 survey lines and contained 558, 772 and 664 samples. The ratio of the training to validation samples was 7:3.
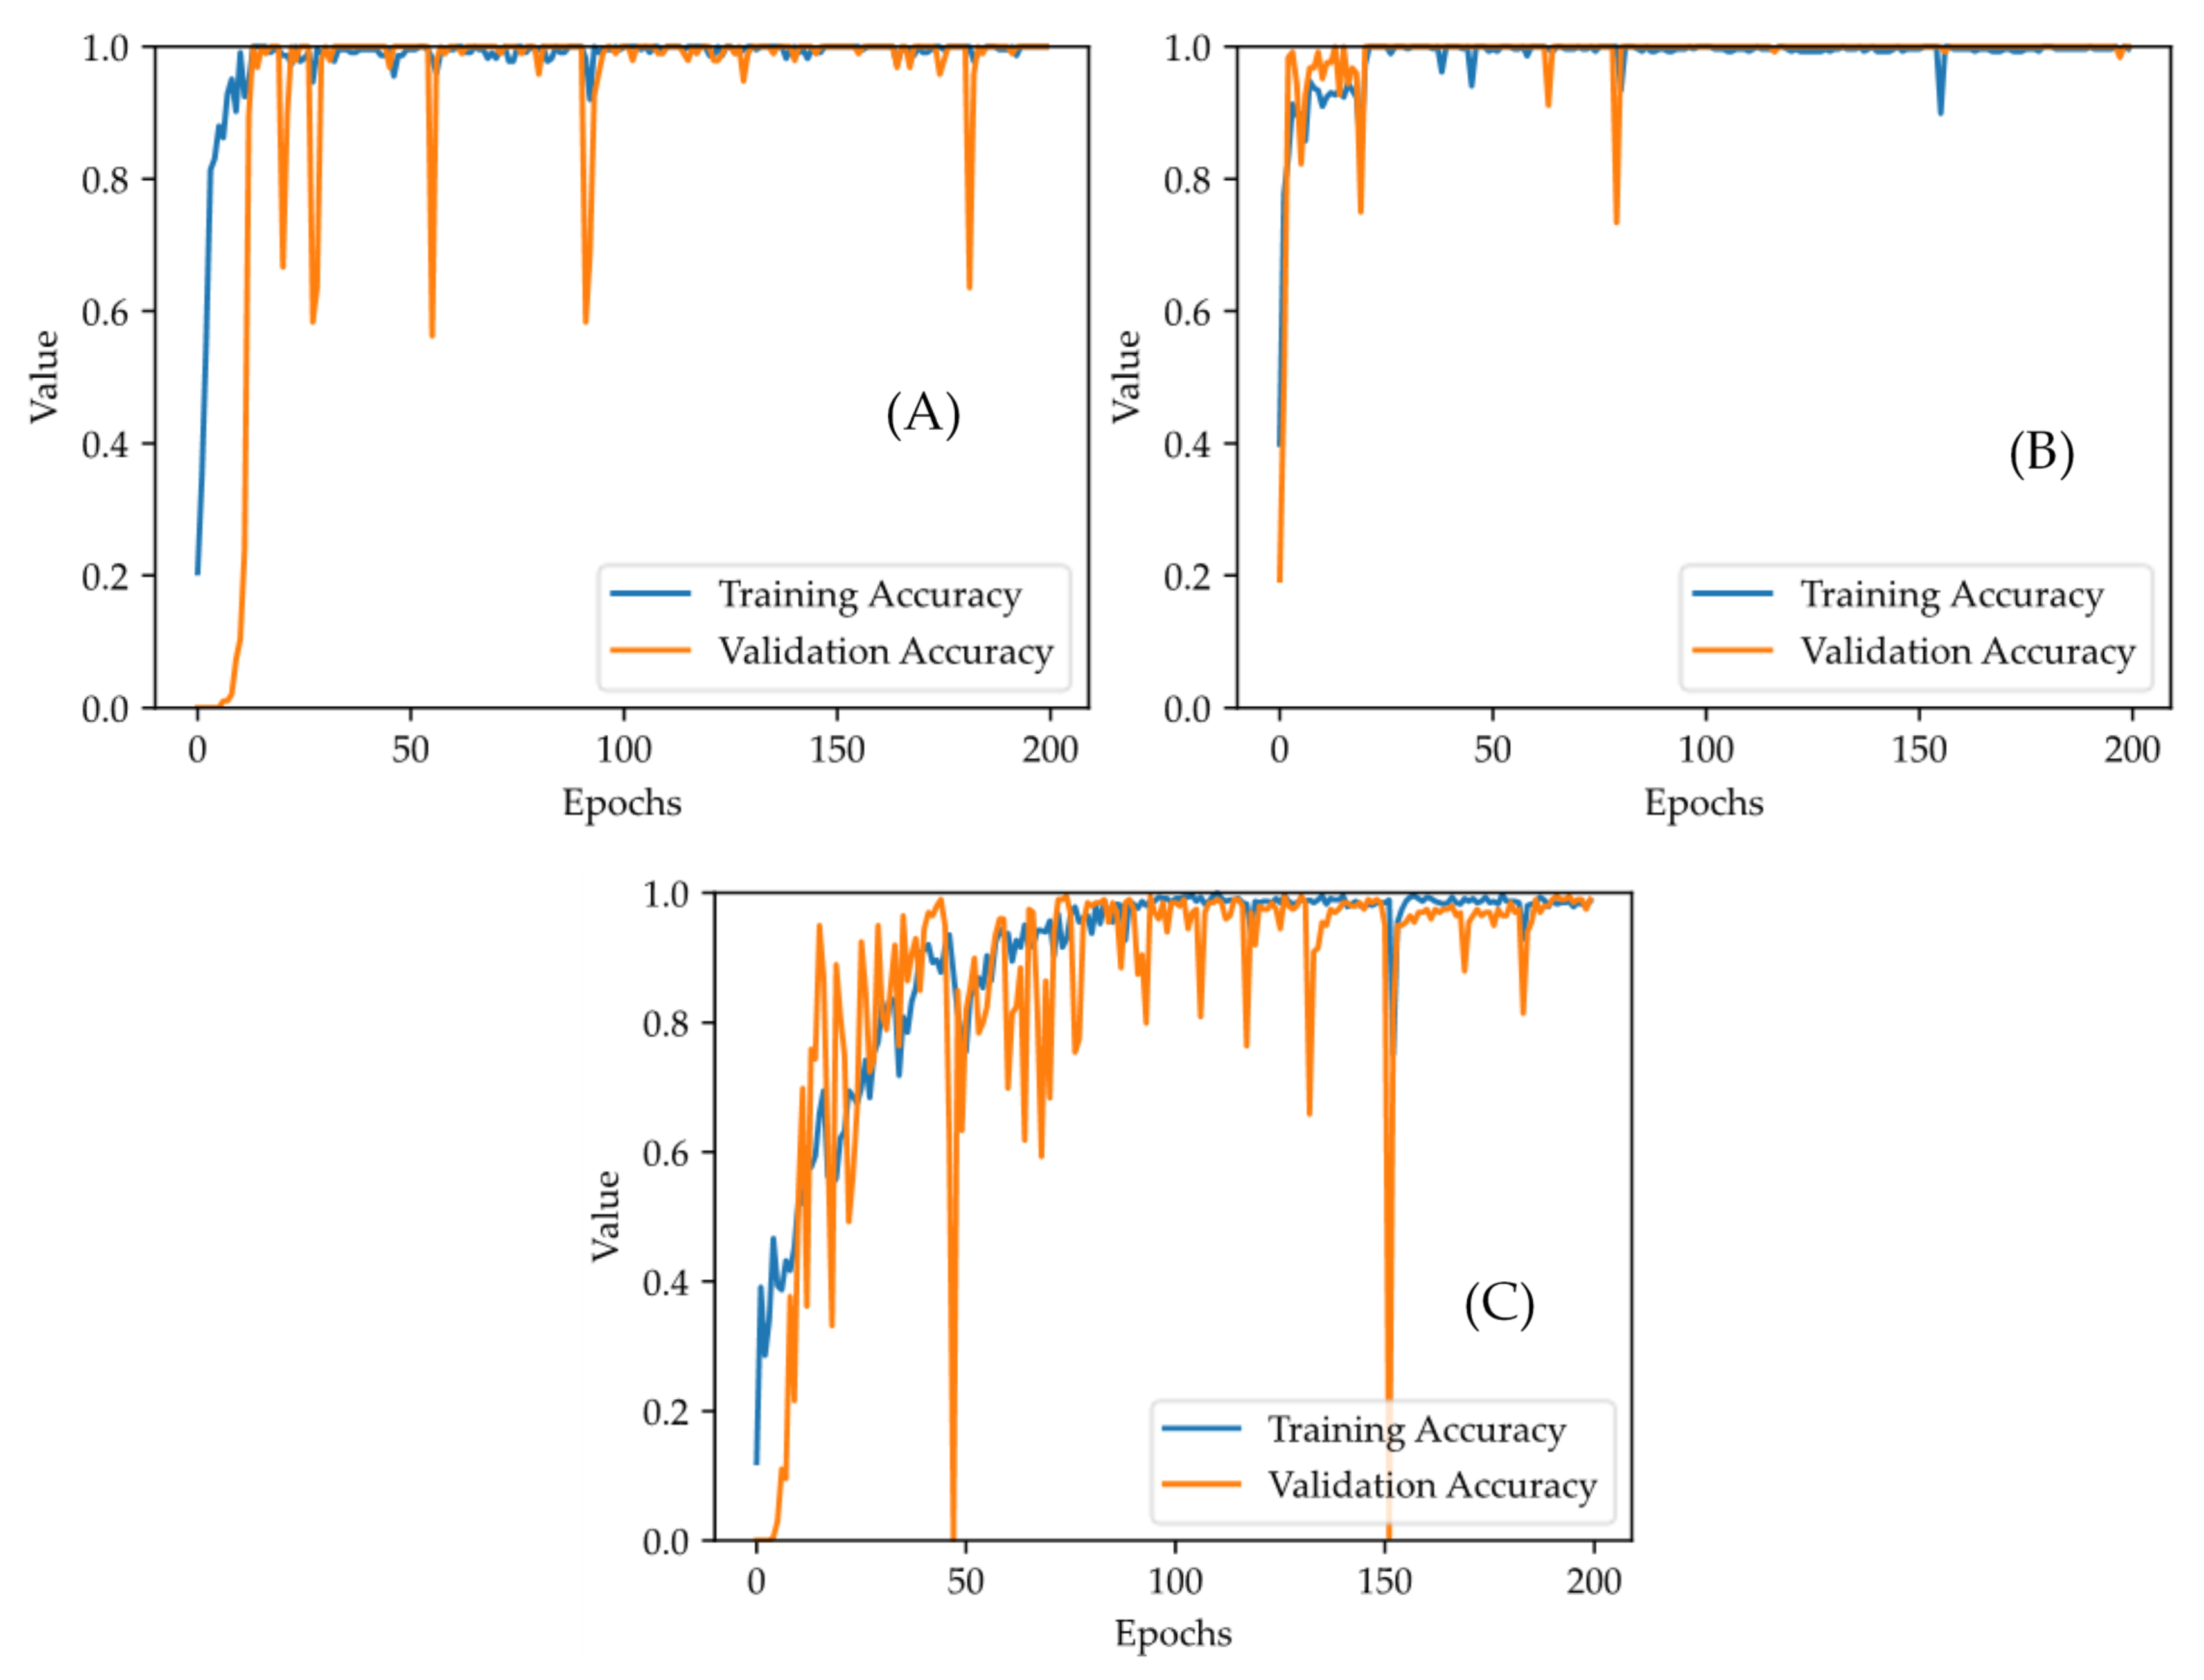
The sample normalization, model training and validation were performed as described in this work. After 200 epochs, the training and validation accuracies of all three models for data in the specular reflection, scatter reflection, and high-incidence angle regions approached stable values (Figure 8).
The training and validation accuracies of the three models ultimately reached 100%/100%, 99.7%/100%, and 98.7%/99.0% after 200 epochs. The results showed that the proposed models can effectively learn the variation features of the backscatter strengths of multibeam data. These trained models were used as the basis for the subsequent experiments.
Then, our bottom detection method was verified using the along-track and across-track multibeam water column data. The experiments were implemented on a desktop computer with an Intel i7-13700KF processor and an Nvidia RTX 4090 GPU. The experiment codes used were written using Python 3.9.12 and the PyTorch 1.12.0 library with CUDA 11.6 acceleration.

3.1. Bottom Detection of Along-Track Multibeam Water Column Data

In the experiments, the along-track multibeam water column data were first processed. The bottom detection of the along-track water column data at incidence angles of 0° (specular reflection region), 35° (scatter reflection region), and 60° (high-incidence angle region) was performed using our method.

3.1.1. Bottom Detection Results at an Incidence Angle of 0°

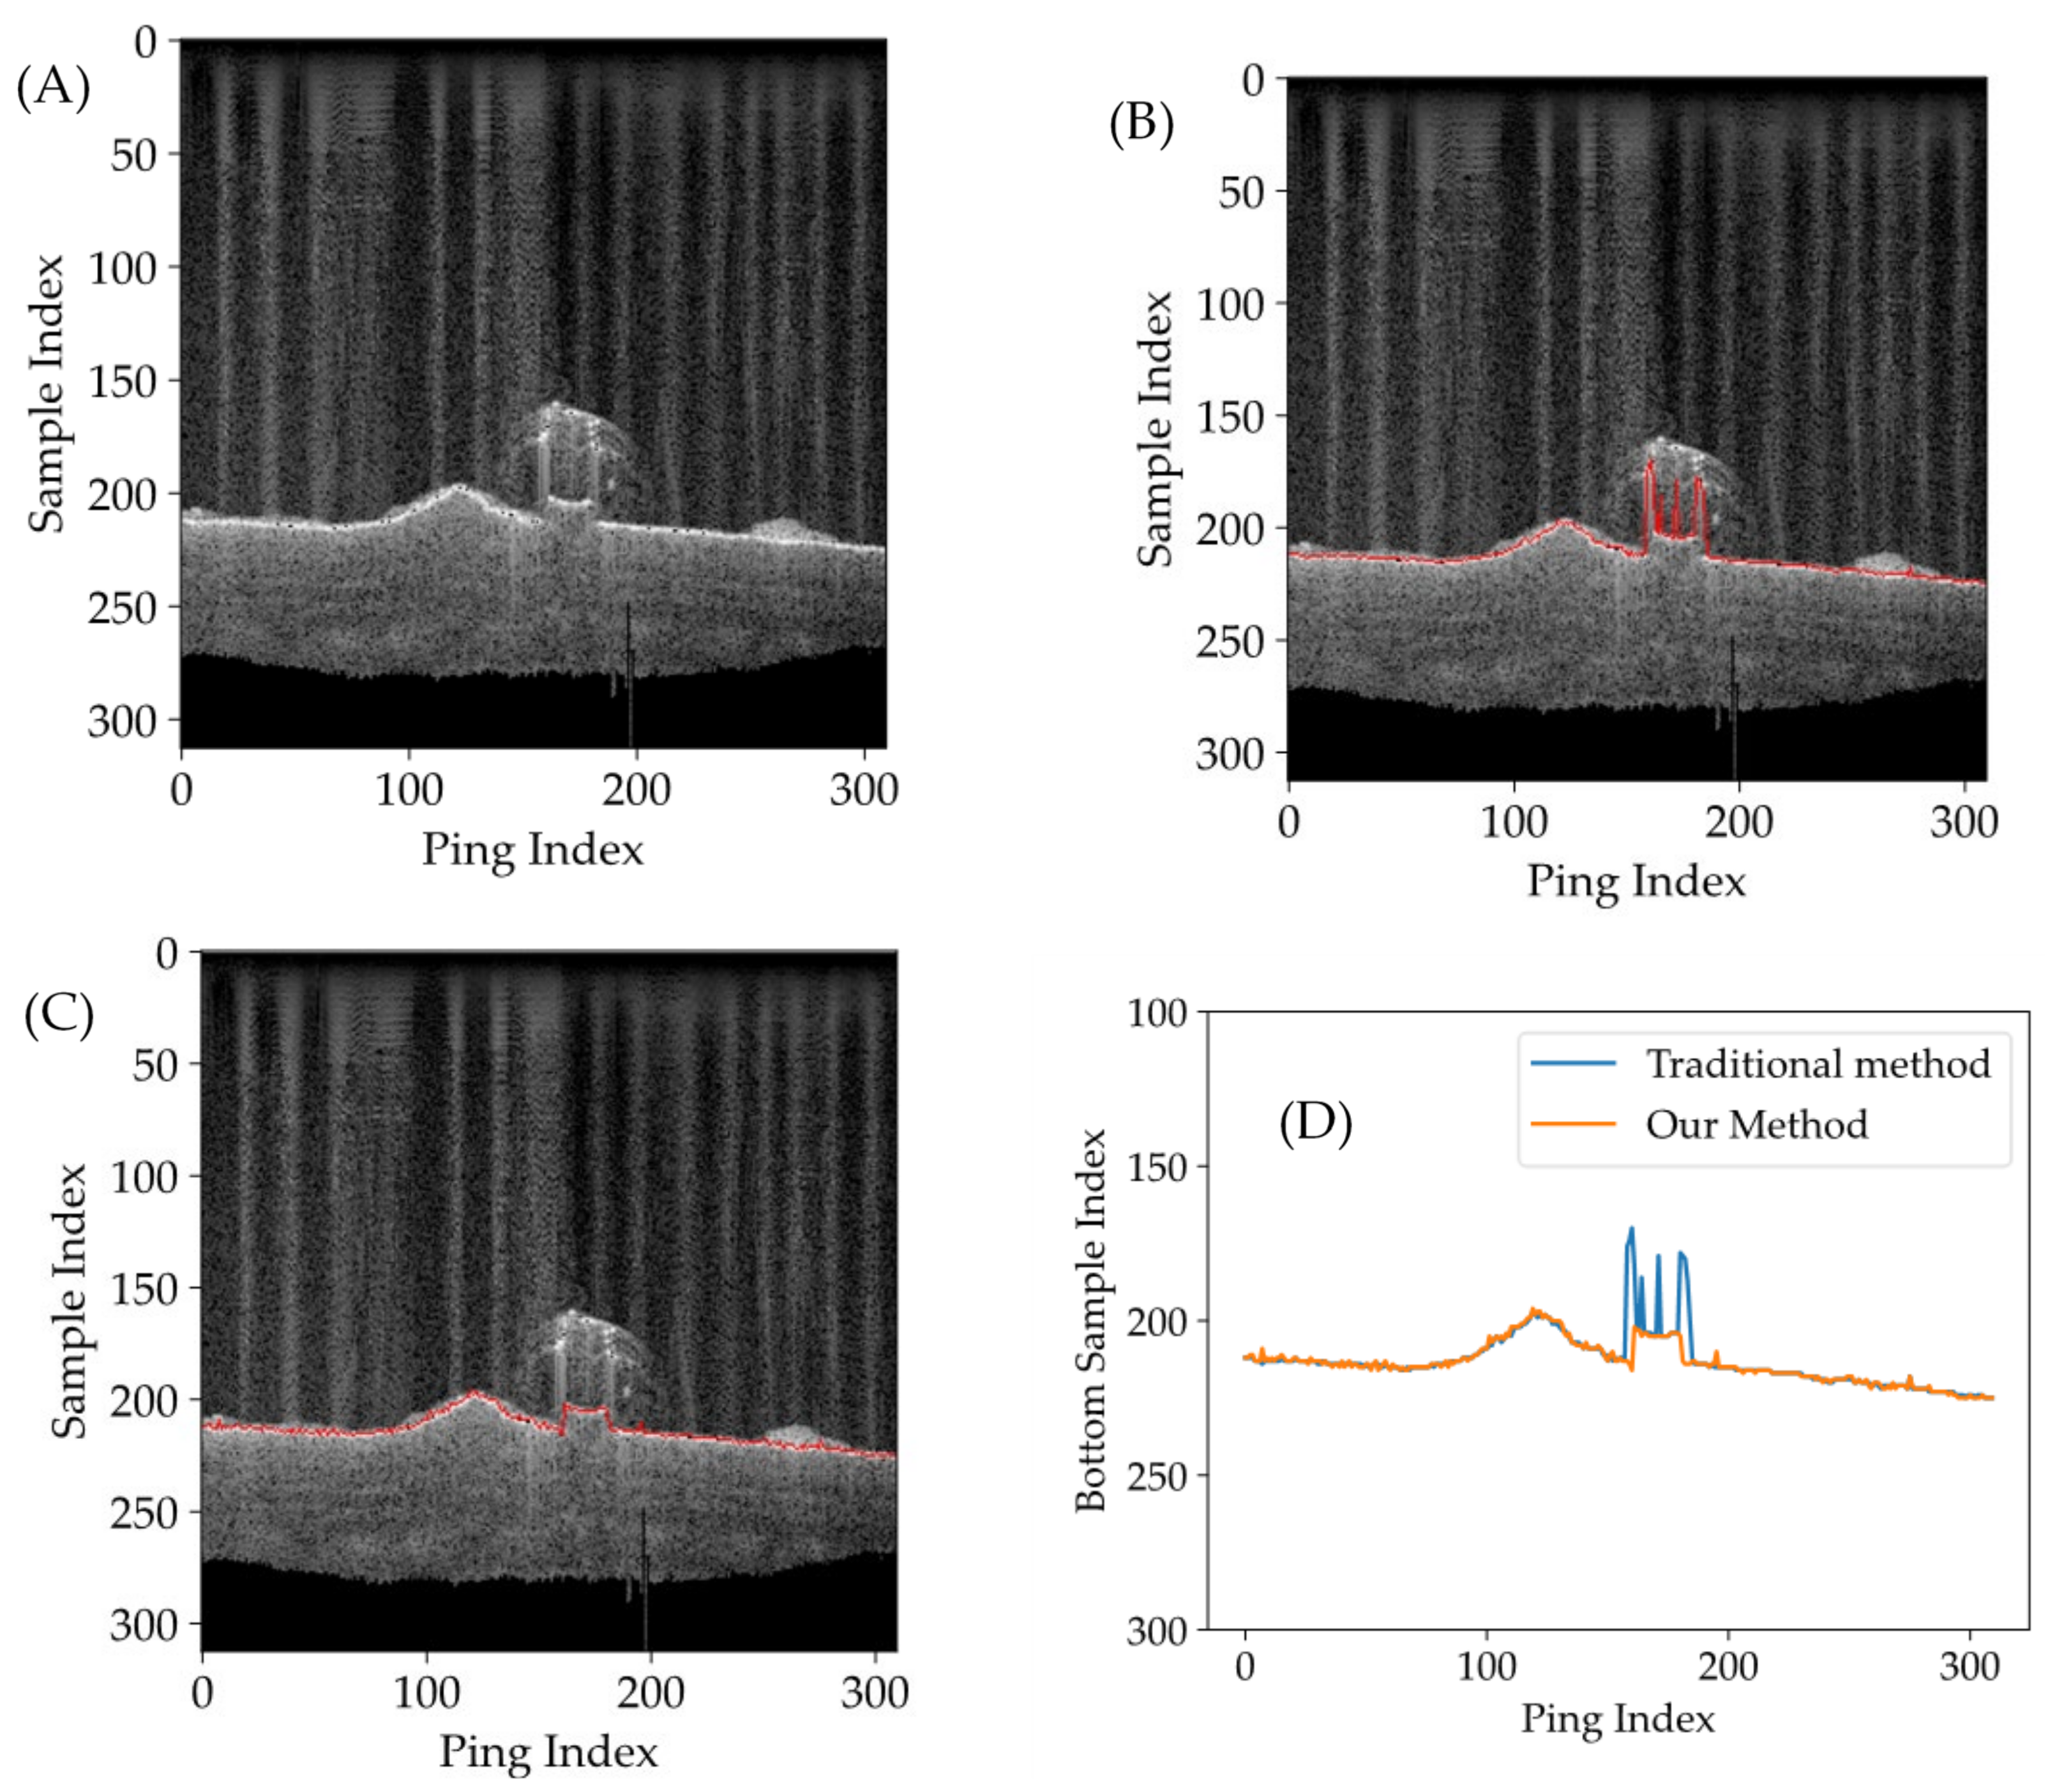
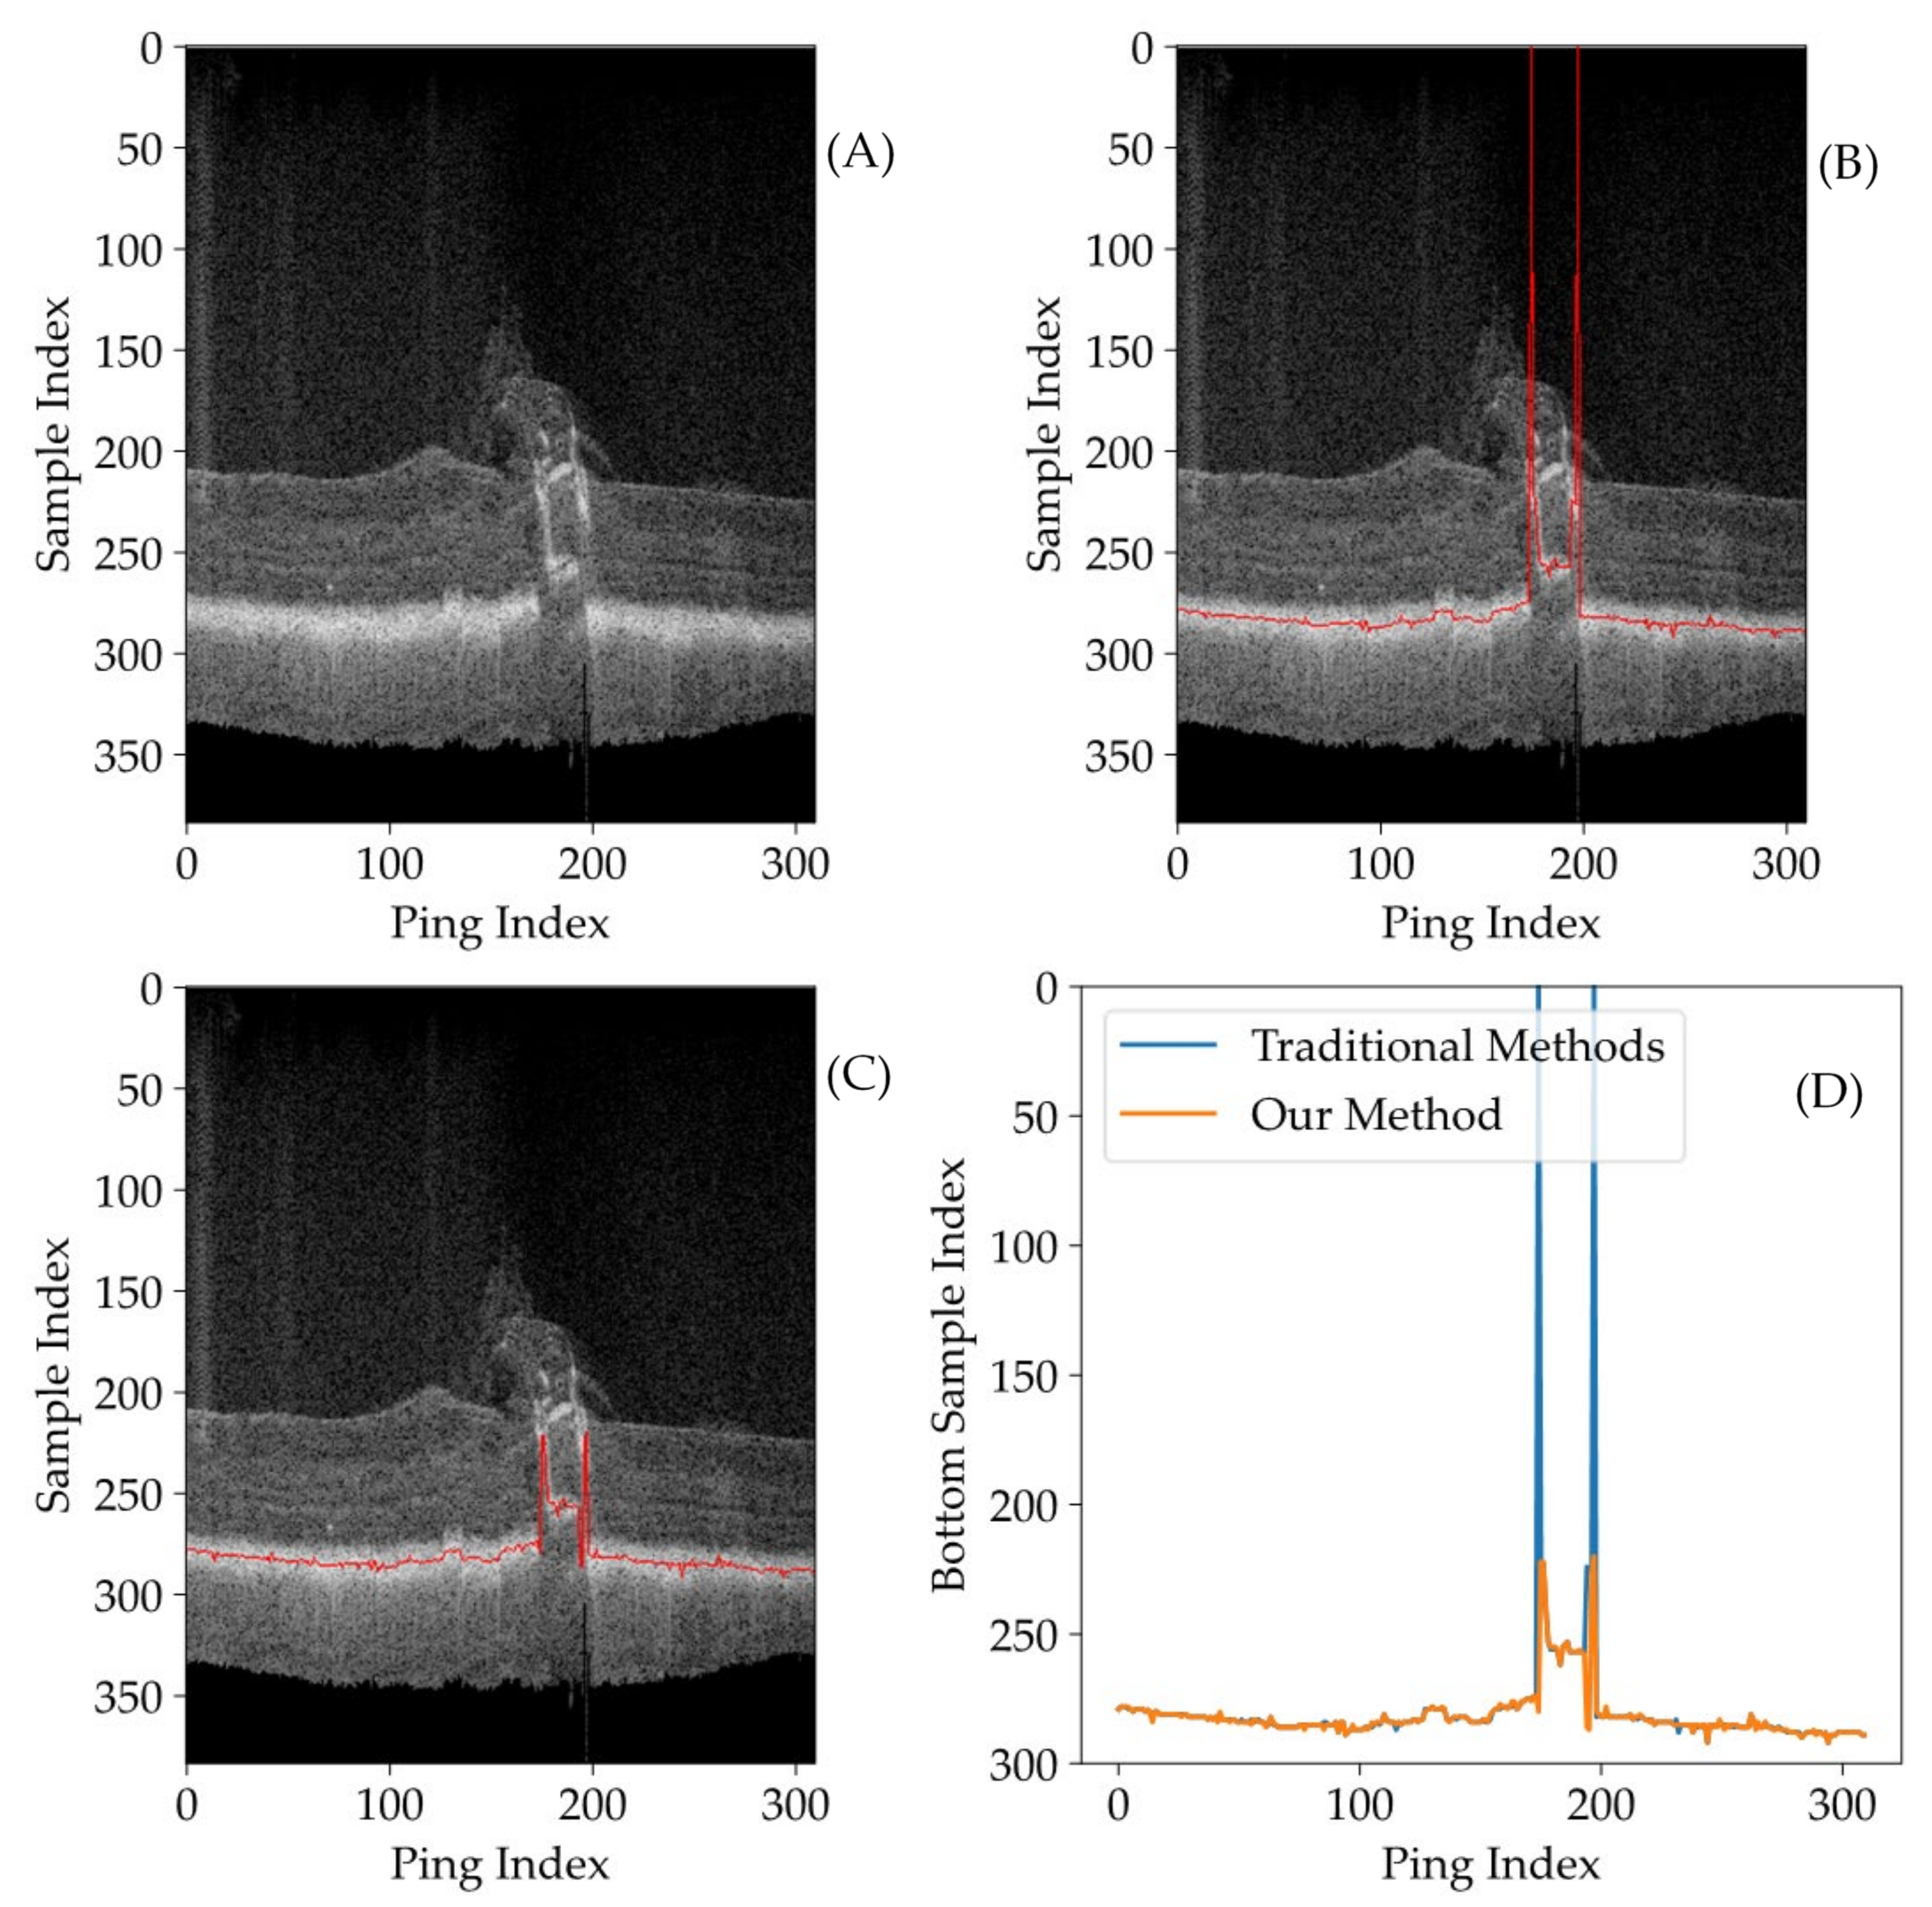
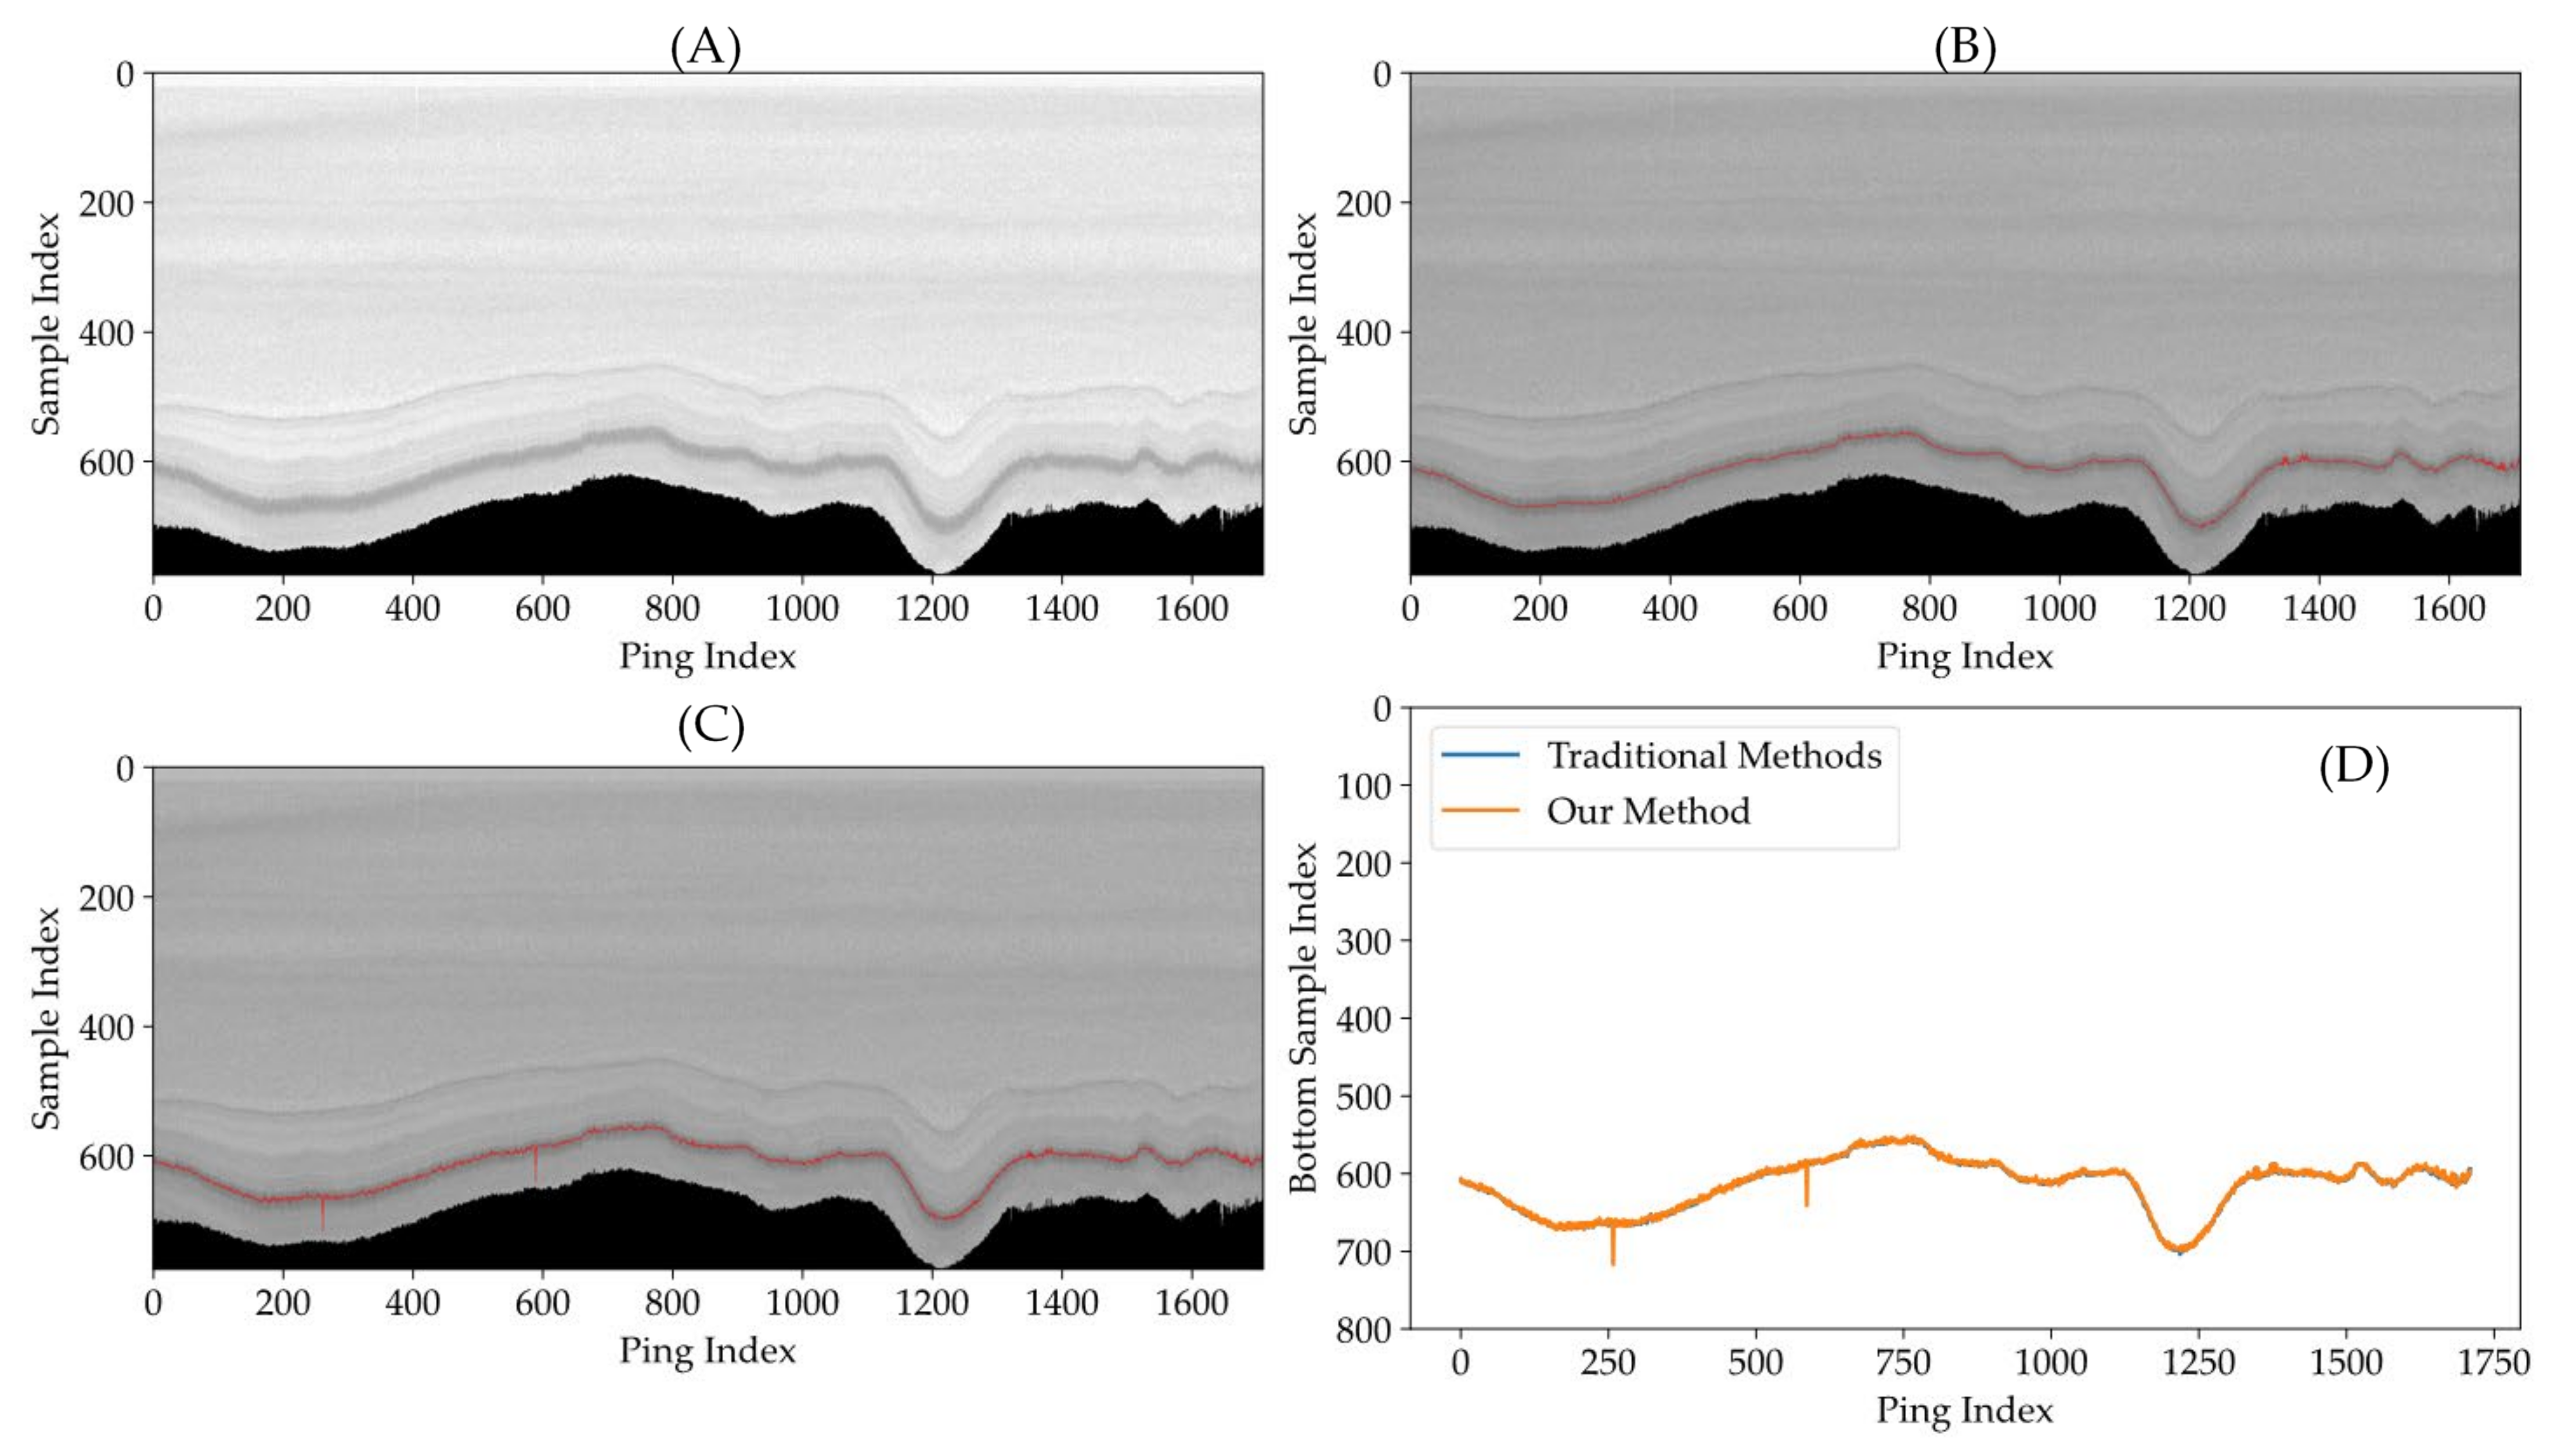
One of the survey lines in the measured water area (Figure 7) was selected for the bottom detection experiment. An along-track water column image at an incidence angle of 0° is shown in Figure 9A. The track line of this survey line passed the shipwreck directly overhead. Thus, the interference area was obvious in the along-track image at an incidence angle of 0°. A part of the shipwreck in the water column strongly interfered with the sea bottom detection.
Traditional bottom detection methods obtain accurate results in non-interference areas but had failure detection results in interference areas, causing discontinuities in the seabed (Figure 9B). The main reason is that the traditional bottom detection methods do not consider strong interference conditions or fail to distinguish strong interferences from the real seabed.
For comparison, the detection results of our deep learning method are shown in Figure 9C. Our method could effectively distinguish the differences between a real seabed and interference in the water column, avoid failure detection of the sea bottom, and obtain a continuous seabed. A comparison of the detection results between the traditional method and our proposed method is shown in Figure 9D.
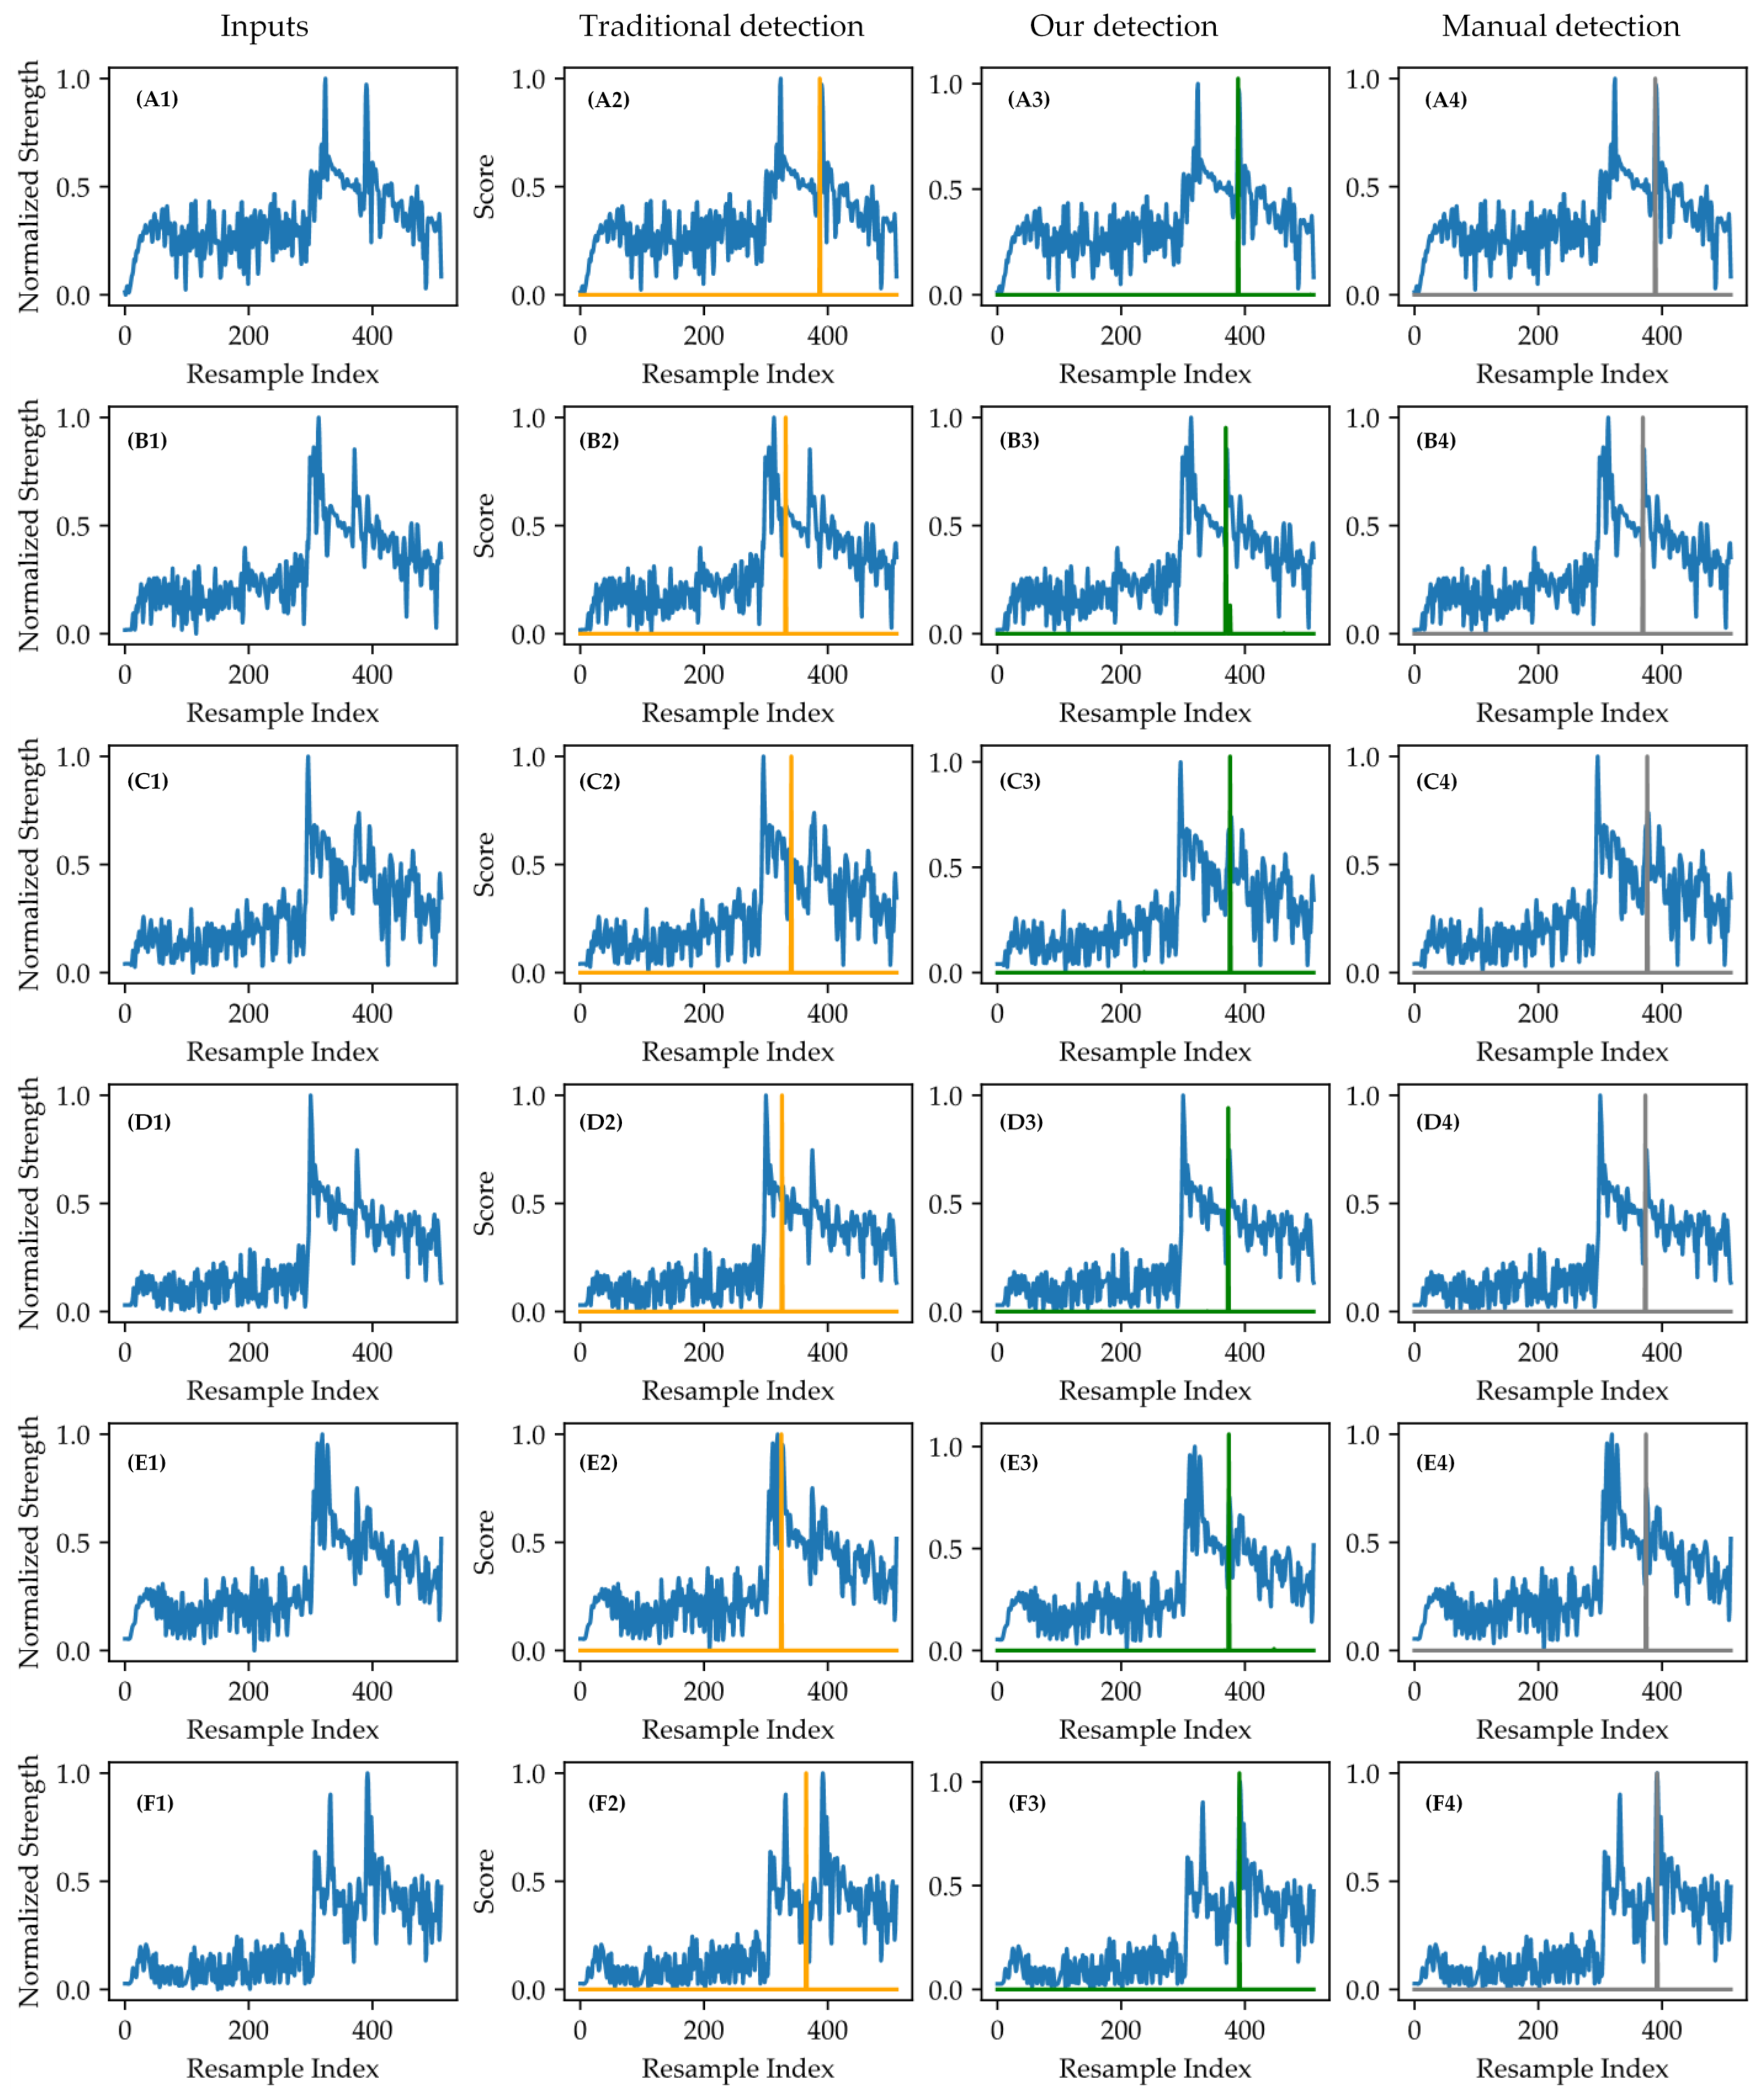
To further compare the differences in bottom detection methods, we compared the bottom detection results of six beams in the interference area (Figure 10). As shown in Figure 10A2, when the intensities of the bottom echoes are strong enough under interference, the traditional bottom detection method can still perform effectively. However, in most cases with strong interference, the traditional methods fail to conduct detection. For example, interferences were identified as false sea bottoms (Figure 10E2, obtained using the BDI method), or the middle positions of the interferences and real bottoms were selected as false bottoms (Figure 10B2,C2,D2,F2, obtained using the WMT method).
The deep learning method proposed in this work could effectively avoid the problems encountered by traditional methods in bottom detection. The bottom detection results (Figure 10A3–F3) of all the interference multibeam data obtained using our proposed method were generally consistent with the manual detection results (Figure 10A4–F4). The comparative results prove the advantage and effectiveness of our method for bottom detection of multibeam data under interference conditions.

3.1.2. Bottom Detection Results at an Incidence Angle of 35°

The second along-track experiment was on multibeam data from the scatter reflection region. The along-track multibeam water column data at an incidence angle of 35° were selected and processed using our method. The bottom detection results are shown in Figure 11.
As shown in Figure 11B, given the interference in the water column, the traditional bottom detection method fails multiple times at an incidence angle of 35°, causing the corresponding abnormal bottom positions to be 0. By contrast, our method effectively avoided failure detection and obtained relatively continuous seabed variation (Figure 11C).
Then, we selected the four interference beam data to analyze the differences between the traditional method and our method (Figure 12). Due to the interferences, the bottom detection result obtained using the traditional method (WMT) was incorrect, as the position between the interference and the real seabed (Figure 12A2). While in Figure 12B2–D2, the traditional method could not obtain the bottom detection results, namely neither WMT nor BDI could correctly obtain the detection results. Whereas, the bottom detection results could be obtained using our method, and the positions of the maximum prediction scores in the output sequences were the bottom locations. A comparison of our results (Figure 12A3–D3) with manual detection (Figure 12A4–D4) showed that the bottom positions of the maximum scores in Figure 12A3–D3 were consistent with the manually detected positions and could meet the accuracy requirements. These results prove the effectiveness of our proposed model at an incidence angle of 35°.

3.1.3. Bottom Detection Results at an Incidence Angle of 60°

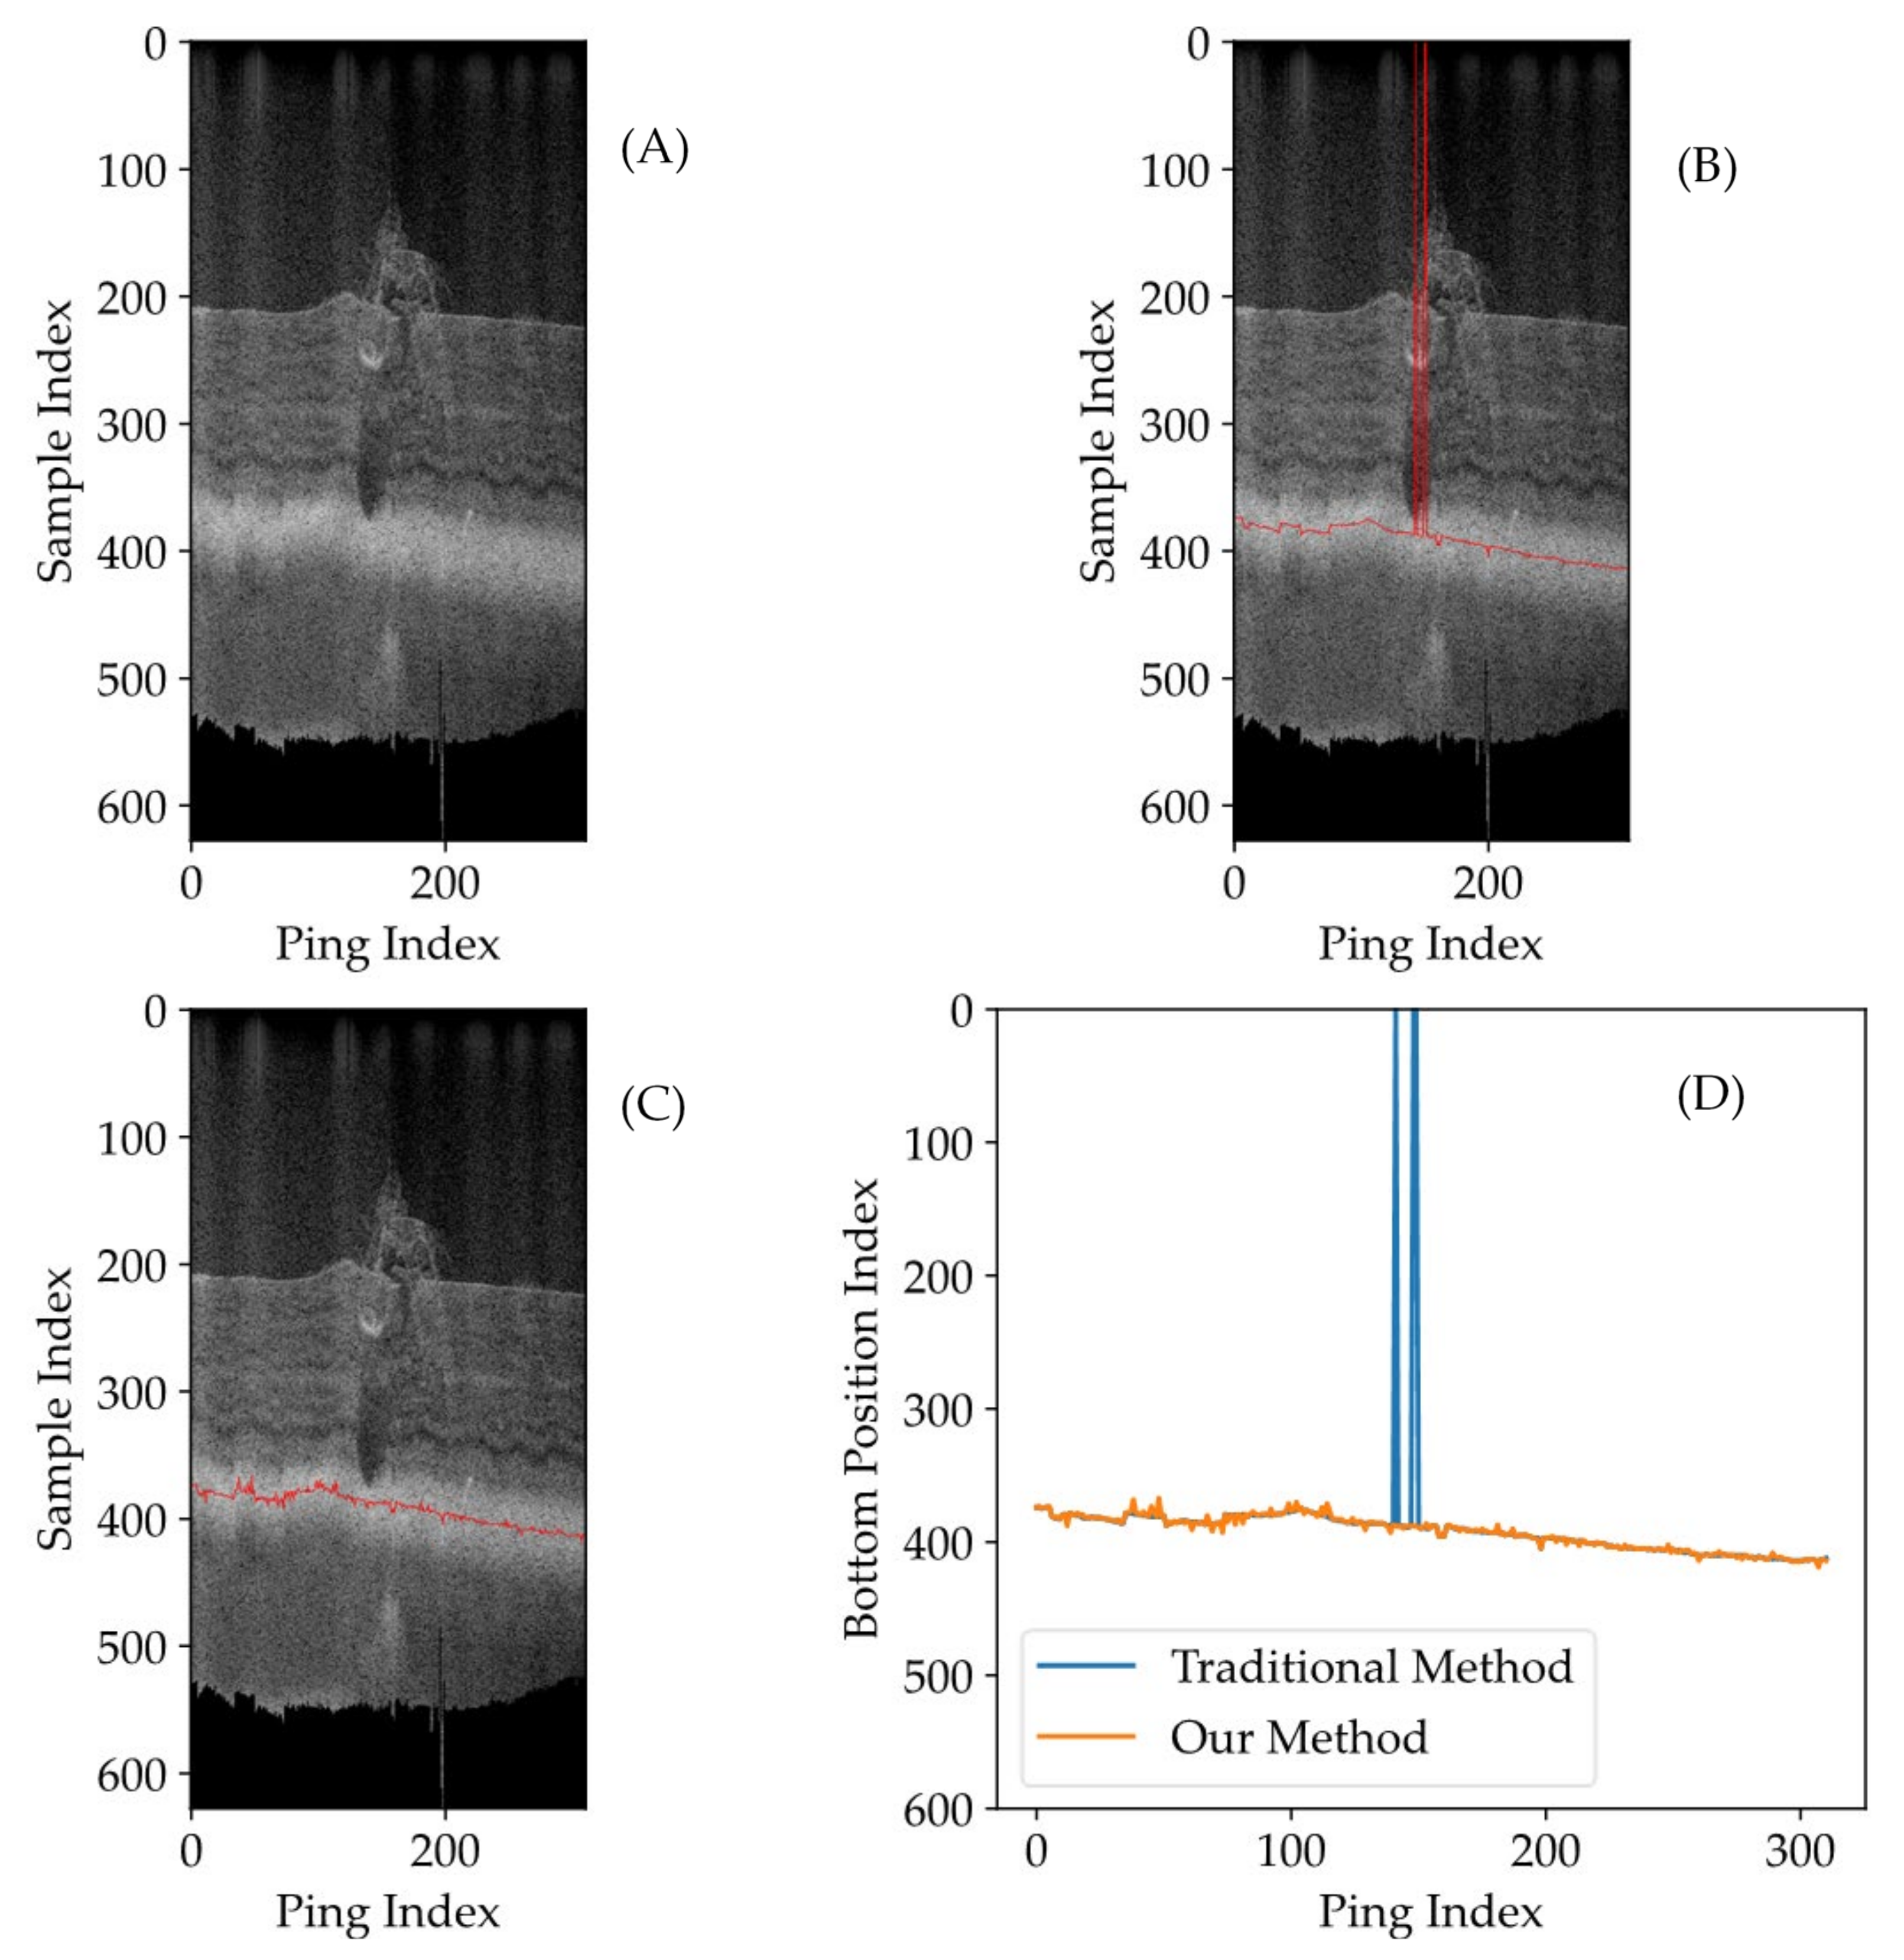
The final along-track experiment focused on multibeam data in the high-incidence angle region. The along-track water column data at an incidence angle of 60° were processed. The results are shown in Figure 13.
Similar to the previous experiment at an incidence angle of 35°, given the influence of interference in the water column, the bottom detection of multiple beams failed when traditional methods were used at an incidence angle of 60°. This issue further caused the corresponding bottom detection positions to be 0 (Figure 13B). By contrast, our deep learning method effectively avoided failure detection results and obtained a relatively continuous seabed (Figure 13C). Figure 13D shows a comparison between the seabed detected using the traditional method and our method. Our method effectively improved the bottom detection results under interference conditions.
The beams with failure detections obtained using the traditional methods are shown in Figure 14. As further illustrated in Figure 14A2–D2, bottom detection results cannot be obtained by traditional methods; neither WMT nor BDI can calculate the results properly. By contrast, the bottom detection results can still be obtained by our method, as shown in Figure 14A3–D3. The positions of the maximum prediction scores in Figure 14A3–D3 were consistent with the manually detected bottom position (Figure 14A4–D4). These results prove the effectiveness of our proposed model at an incidence angle of 60°.

3.2. Bottom Detection of Across-Track Multibeam Water Column Data

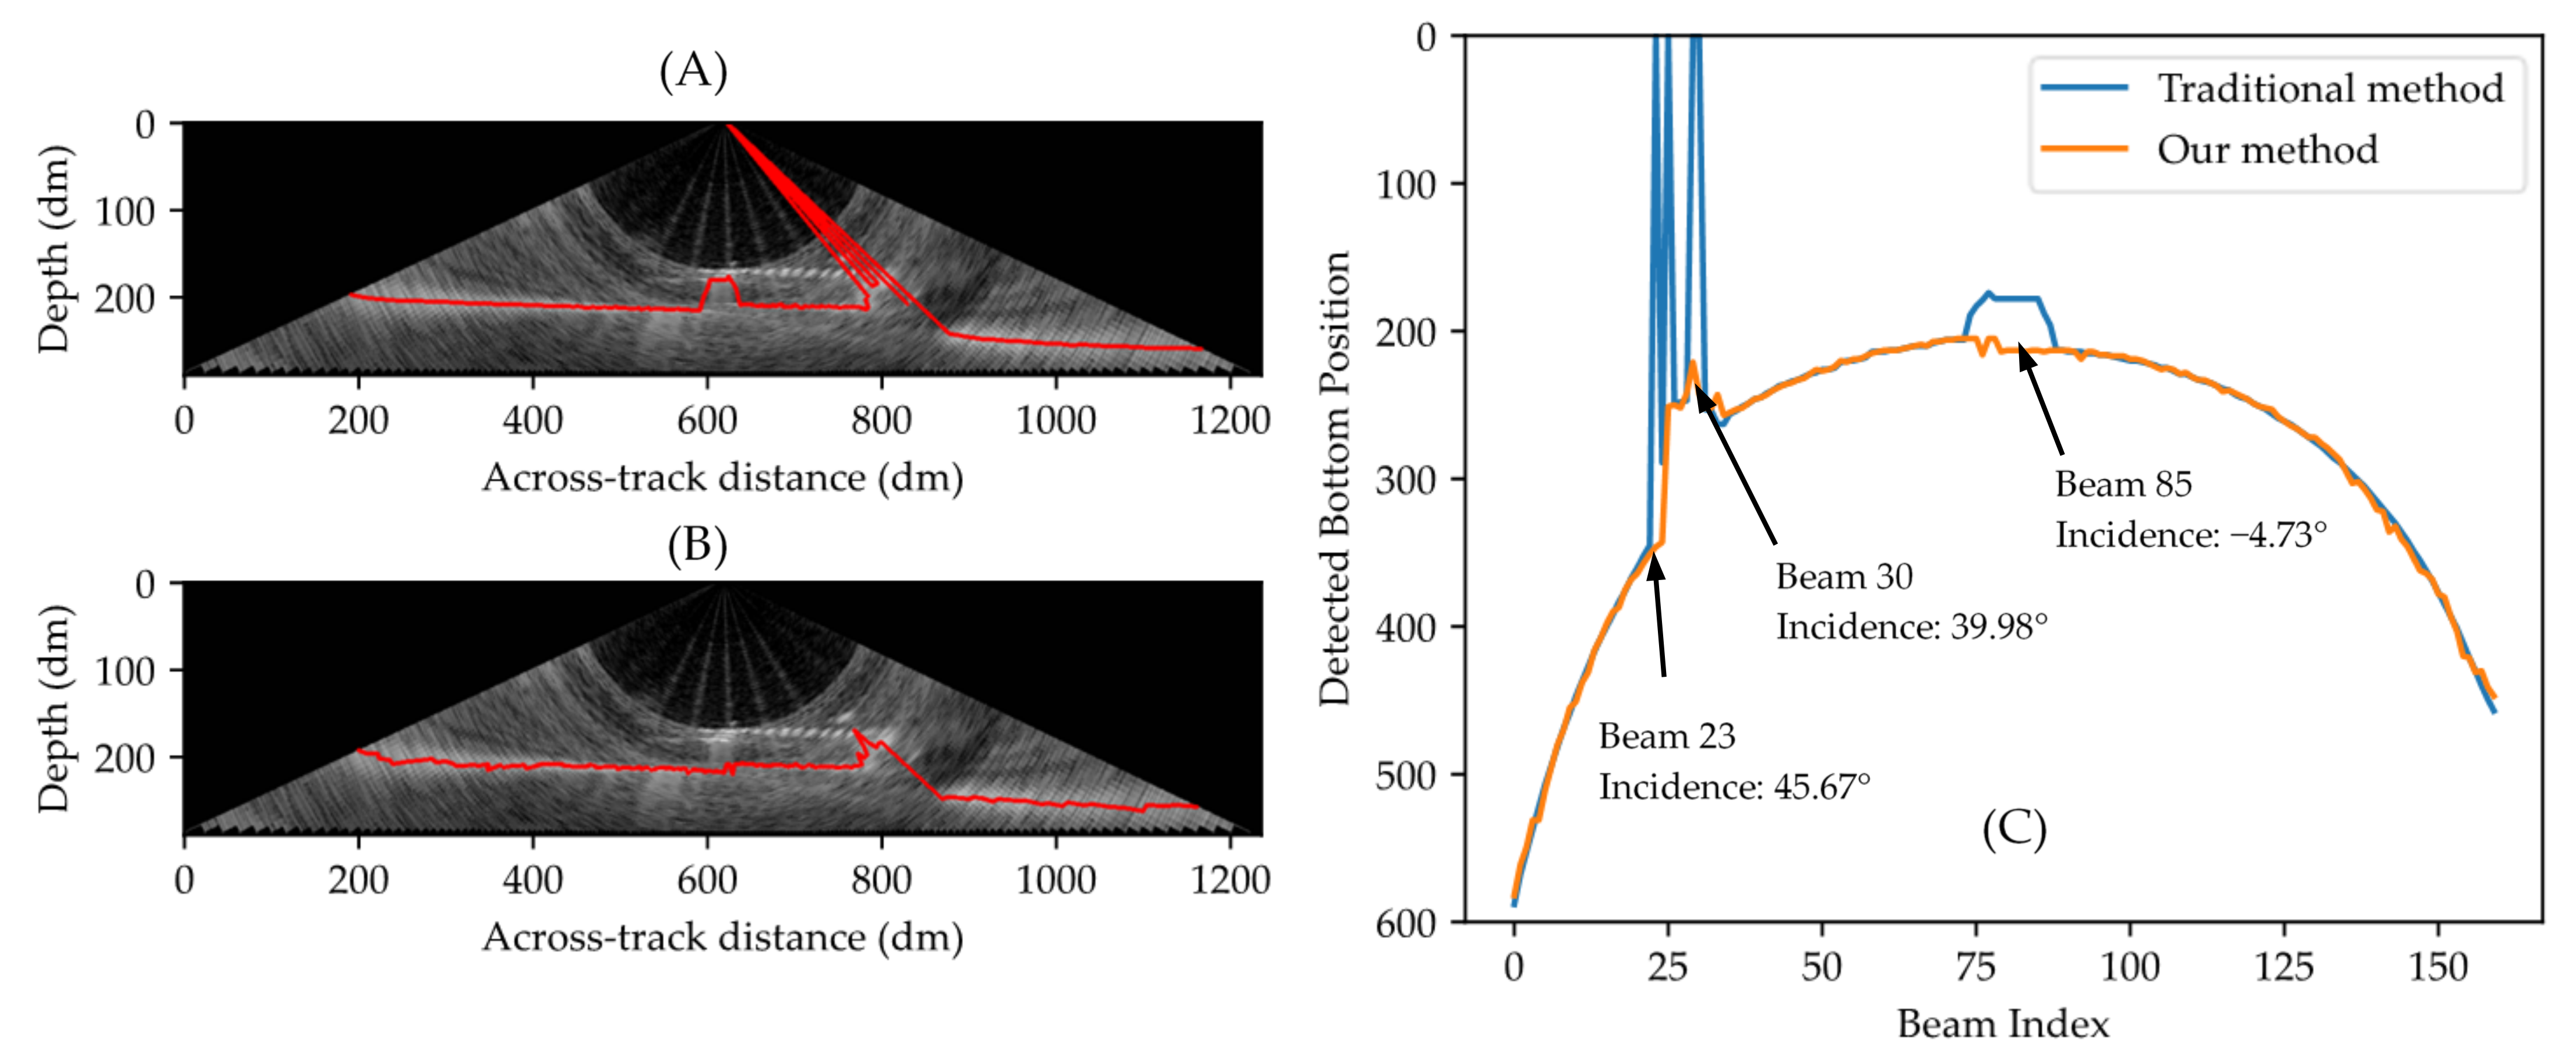
The abovementioned along-track experiments were conducted at three incidence angles of 0°, 35° and 60°. To further verify the generality and effectiveness of our proposed method at any incidence angle, we selected one-ping water column data of about 130° sector for the across-track bottom detection experiments. The bottom detection results of the traditional method and our method are shown in Figure 15A,B. The differences in the detection results between these two methods are shown in Figure 15C.
As shown in the bottom detection results of the traditional methods (Figure 15A), given the interference (shipwreck) in the water column, abnormal seabed heave was observed near the nadir (0°). Failure detections were also apparent over a large area around an incidence angle of 40°. However, these problems were effectively avoided by our bottom detection method based on deep learning. As shown in Figure 15B, a relatively continuous and flat seabed appears near the nadir (0°), and bottom detection can be effectively performed around an incidence angle of 40°. On this basis, a relatively continuous seabed of the whole ping was obtained.
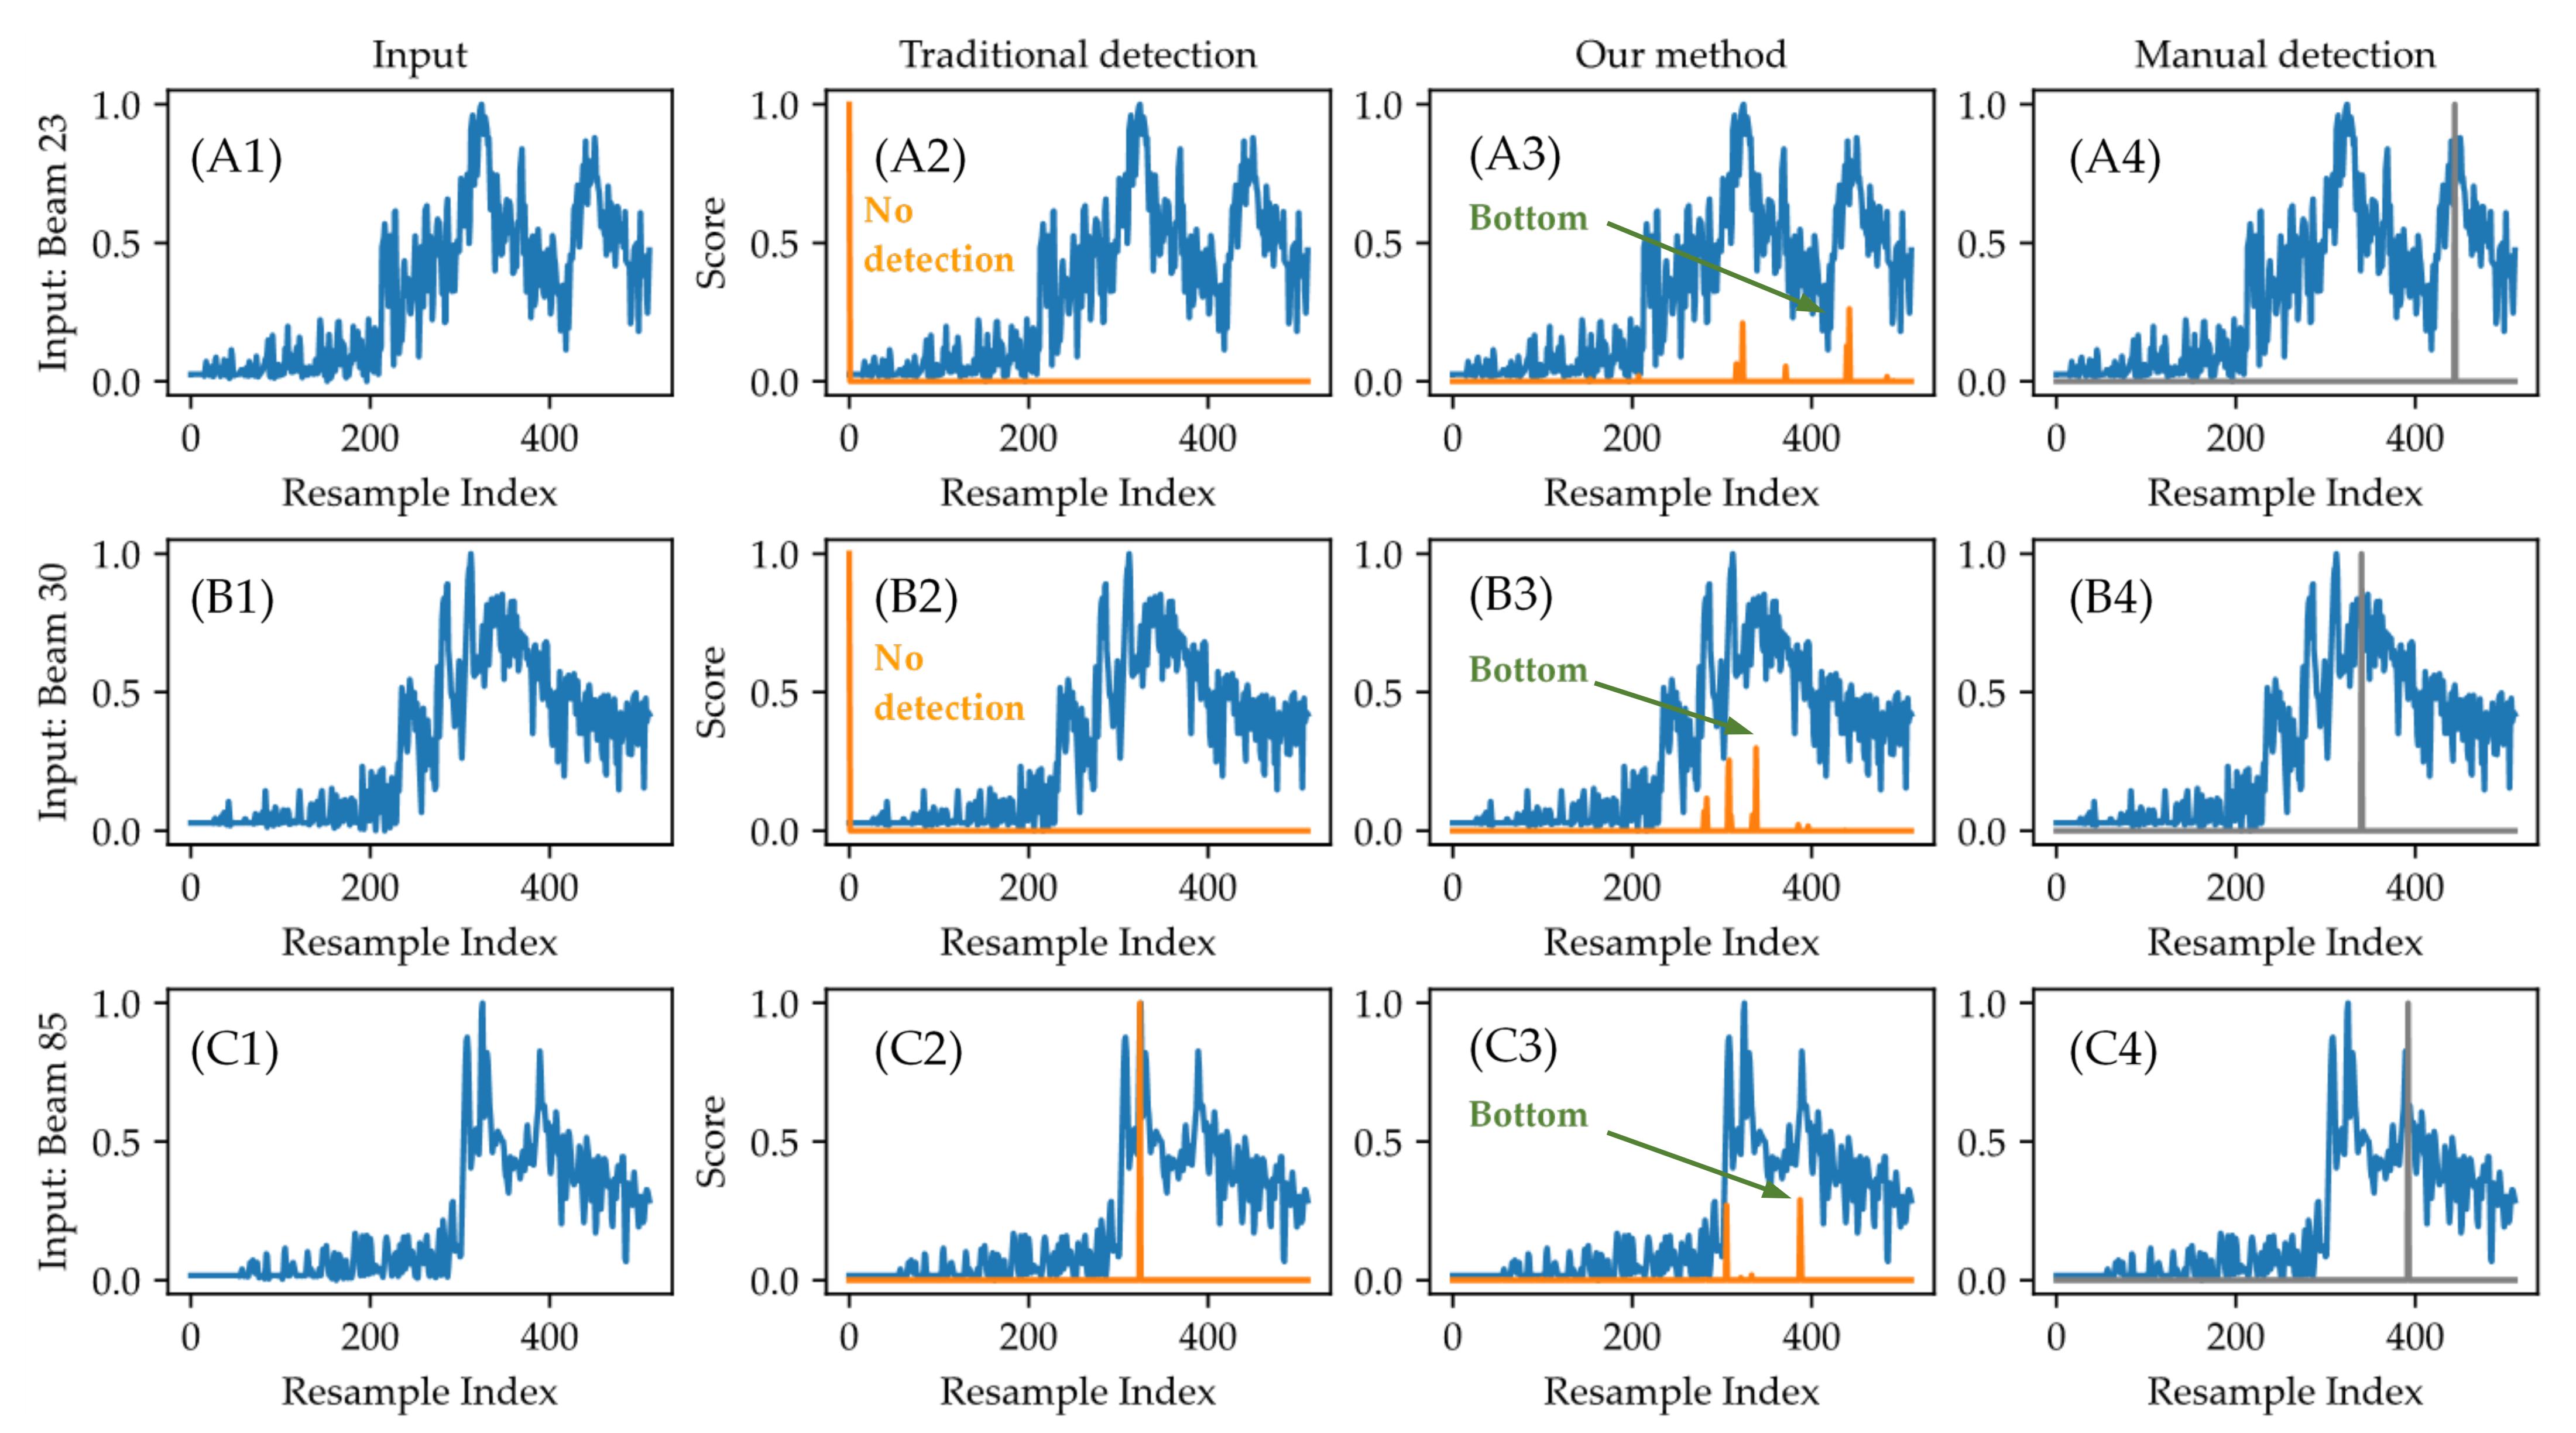
To analyze the differences in detection between our proposed method and the traditional methods, we selected three beams (beams 23, 30, and 85 in this ping) with obvious differences in results for comparison (Figure 16).
The backscatter strength sequence of beam 23 at an incidence angle of 45.67° is shown in Figure 16A1. The traditional detection methods fail to calculate the bottom location, resulting in the bottom position being marked as 0, as shown in Figure 16A2. By contrast, our proposed method detected multiple potential locations, including locations with abnormal interference in the water column and at the real sea bottom. Then, the location of the sea bottom was determined according to the maximum prediction score (Figure 16A3). Our results were consistent with the location of the manual detection results (Figure 16A4).
The backscatter strengths of beam 30 at the incidence angle of 39.98° are shown in Figure 16B1. Traditional methods fail to calculate the bottom location, and no detections are performed, as shown in Figure 16B2. By contrast, our deep learning method obtained correct prediction scores for both interferences and the sea bottom. Subsequently, the position with the highest score was taken as the bottom position (Figure 16B3). Our results were consistent with the manual detection results (Figure 16B4).
The backscatter strengths of beam 85 at the incidence angle of −4.73° are shown in Figure 16C1. The traditional method (BDI) uses the position of maximum intensity to obtain the bottom position, as shown in Figure 16C2. This result is inaccurate due to the existence of an interference. By contrast, on the basis of the maximum score of our deep learning model’s output, the bottom position obtained (Figure 16C3) was consistent with the manual detection result (Figure 16C4).
These abovementioned comparisons indicate that our proposed method can detect the sea bottom position at any incidence angle when interference occurs in the water column. Our method effectively improved the bottom detection results, whereas the traditional methods either obtained incorrect results or failed to perform detections. The experimental results prove the effectiveness of the proposed method.

4. Discussion

4.1. Applying the Trained Models to Other Multibeam Data

To demonstrate how to apply our models to other data, we selected the measured multibeam data by using a different multibeam model (EM 302) at different depths (about 1000 m) in different water areas in the Gulf of Mexico for further experiments (Figure 17A). The data were obtained from the EX1402L3_EM302 dataset of the National Oceanic and Atmospheric Administration (NOAA) [25]. The water depth was approximately 800 to 1200 m, and the sonar instrument used was an EM 302 with a frequency of 30 kHz. There were bubble plumes from seabed leakage in the water column (Figure 17B); however, bubbles usually do not cause problems in the existing methods. The selected data were used to verify the generality of our method for other datasets.
The three selected survey lines in Figure 17A were successively processed using our trained model from the previous experiment, which is based on EM 3002 data. The bottom detections of the first line (25th file in Dataset: EX1402L3_EM302) at an incidence angle of 0° are shown in Figure 18; the bottom detections of the second line (26th file in the dataset) at an incidence angle of 35° are shown in Figure 19; and the bottom detections of the third line (27th file in the dataset) at an incidence angle of 60° are shown in Figure 20.
The results in Figure 18 and Figure 19 indicate that our detection results were generally consistent with the traditional results, with only several errors observed. The accuracies of the bottom detections were 96.0% and 99.8%, respectively. As the trained models did not learn any data in the new datasets, the detection accuracies were lower than those in the previous experiments. Retraining the models with new datasets or simply adding new samples can help improve the detection accuracy.
The accuracy of the bottom detection results in Figure 20 reached 100%, proving the advantages of our method over traditional methods at an incidence angle of 60°. The traditional methods failed at multiple pings (Figure 20B,D). By contrast, our method always performs correct detections and obtains a continuous seabed. Notably, our model did not learn the data in the new dataset (Figure 20C,D).

4.2. Solutions in Different Interference Situations

The abovementioned experiments showed that traditional methods can obtain accurate bottom positions in most cases but often yield incorrect results or even fail to perform detections when obvious interferences existed in the water column. By contrast, our proposed anti-interference bottom detection method can deal with interferences in multibeam data. Consequently, we can select different solutions for different interference cases.
  • Normal case: In this case, no obvious interferences exist, and the bottom echoes usually have very high signal-to-noise ratios. Traditional methods work sufficiently in this case, and our method can be used as an auxiliary verification tool.
  • Interference case with semi-occluded seabed: In this case, traditional methods might fail to calculate the correct results; thus, our deep learning method can be regarded as a more effective solution for handling interference data.
  • Interference case with a fully occluded seabed: In this case, the sound from the transducers cannot penetrate the interference. Thus, even manual methods cannot identify true sea bottom positions. Traditional methods may fail to perform detection. By contrast, our method takes the interferences as the bottoms, which is an acceptable approach.

4.3. Strong Interferences Can Be Important Targets

In underwater acoustic measurements, strong interferences in the water column can be regarded as important targets. In our experiments, the interferences in the water column were actually the body of the shipwreck. Therefore, in addition to real sea bottoms, an accurate shipwreck detection is valuable for vessel navigation security and underwater archaeological research. Interferences in the water column are also important for ensuring the safety of navigation. Therefore, not only the sea bottom but also the interferences in the water column should be paid attention, especially in areas of shipping traffic.
As shown in Figure 12, Figure 14, and Figure 16, our proposed detection model can detect not only the sea bottom but also interferences in water columns. By adjusting the attention mechanism of our models (including relabeling and retraining), our models can also be adapted for interference detection in the water column. This feature indicates that our method has strong adaptability for different targets.

4.4. Training Processes in Figure 8

The training accuracies in the three images in Figure 8 gradually increase from 0 to 1. However, the validation accuracies intermittently decrease to a low accuracy value. This trend can be explained by the overfitting of the models to the training set; that is, the 1D-UNet models utilized more degrees of freedom than the necessary minimum number for fitting to the backscatter strength data of multibeam beams. Nevertheless, the overparameterization of our models is not an issue because fully fitting a model is impossible. Finding the exact boundary between underfitting and overfitting is most important to improve the generalizability of our models. This operation is usually called the early stopping of model training. In our experiments, the models trained after 200 epochs achieved good generalizability when testing on other new data.

4.5. Future Work

The effects of scatter patterns and bottom detection accuracies were different in the specular reflection, scatter reflection, and high-incidence angle regions. Thus, we used three models for training the data in these three regions. However, using three models may be less convenient than simply using a single comprehensive model. But, the scale of the single model would be large, and training and application would require much greater computing resources. In the future, we plan to study a single deep learning model for handling beam data at any incidence angle.

5. Conclusions

The deep-learning bottom detection method proposed in this work effectively solved the problems of inaccurate and failure detections encountered by traditional methods for water columns affected by interference. Three deep learning models were trained using data samples from three reflection regions, namely, the specular reflection, scatter reflection, and high-incidence angle regions; the validation accuracies were 100%, 100%, and 99.0%, respectively. Our bottom detection models were verified by experiments in which along-track water column data at incidence angles of 0°, 35°, and 60° were utilized. The experiments on the across-track water column data and the bottom detections of the whole ping proved the effectiveness and universality of our models. The proposed method was also proven to be an effective anti-interference bottom detection method and a useful supplement to the existing methods. Our method revised the incorrect detections and verified the uncertain bottom results of the traditional methods. This research is expected to effectively improve bathymetric accuracy and expand the applications of multibeam echosounders.

Author Contributions

Conceptualization: J.M. and J.Y. Methodology: J.Y. Software: J.Y and J.M. Validation: J.Y. and J.M. Formal analysis: J.M. and J.Y. Investigation: J.M. and J.Y. Resources: J.M. Data curation: J.M. Writing—original draft preparation: J.M and J.Y. Writing—review and editing: J.M., J.Y., and Q.Z. Visualization: J.Y. Supervision: J.M. Project administration: J.Y. Funding acquisition: J.Y, J.M. and Q.Z. All authors have read and agreed to the published version of the manuscript.

Funding

This research was funded by the National Natural Science Foundation of China (grant numbers 42104036 and 41906168), the Natural Science Foundation of Anhui Province (grant numbers 2308085MD124 and 1908085QD161), the University Synergy Innovation Program of Anhui Province (GXXT-2022-020), the University Natural Science Research Key Project of Anhui Province (grant numbers 2022AH050256 and KJ2019A0024), the Natural Science Residual Fund Project of Anhui Jianzhu University (grant number JZ202366), and the Key Research and Development Project of Anhui Province (grant number 2022l07020027).

Data Availability Statement

The experimental data in the discussion are available at https://www.ngdc.noaa.gov/ships/okeanos_explorer/EX1402L3_mb.html (accessed on 20 January 2024).

Conflicts of Interest

The authors declare no conflict of interest.

References

  1. Hughes Clarke, J.E.; Mayer, L.; Wells, D. Shallow-water imaging multibeam sonars: A new tool for investigating seafloor processes in the coastal zone and on the continental shelf. Mar. Geophys. Res. 1996, 18, 607–629. [Google Scholar] [CrossRef]
  2. Hellequin, L.; Boucher, J.M.; Lurton, X. Processing of high-frequency multibeam echo sounder data for seafloor characterization. IEEE J. Ocean. Eng. 2003, 28, 78–89. [Google Scholar] [CrossRef]
  3. Cui, X.; Liu, H.; Fan, M.; Ai, B.; Ma, D.; Yang, F. Seafloor habitat mapping using multibeam bathymetric and backscatter intensity multi-features SVM classification framework. Appl. Acoust. 2021, 174, 107728. [Google Scholar] [CrossRef]
  4. Yu, X.; Zhai, J.; Zou, B.; Shao, Q.; Hou, G. A Novel Acoustic Sediment Classification Method Based on the K-Mdoids Algorithm Using Multibeam Echosounder Backscatter Intensity. J. Mar. Sci. Eng. 2021, 9, 508. [Google Scholar] [CrossRef]
  5. Philip, B.T.; Denny, A.R.; Solomon, E.A.; Kelley, D.S. Time-series measurements of bubble plume variability and water column methane distribution above Southern Hydrate Ridge, Oregon. Geochem. Geophys. Geosystems 2016, 17, 1182–1196. [Google Scholar] [CrossRef]
  6. Chen, Y.; Ding, J.; Zhang, H.; Tang, Q.; Zhou, X.; Liu, X. Multibeam water column data research in the Taixinan Basin: Implications for the potential occurrence of natural gas hydrate. Acta Oceanol. Sin. 2019, 38, 129–133. [Google Scholar] [CrossRef]
  7. Meng, J.; Yan, J.; Zhao, J. Bubble Plume Target Detection Method of Multibeam Water Column Images Based on Bags of Visual Word Features. Remote Sens. 2022, 14, 3296. [Google Scholar] [CrossRef]
  8. Colbo, K.; Ross, T.; Brown, C.; Weber, T. A review of oceanographic applications of water column data from multibeam echosounders. Estuar. Coast. Shelf Sci. 2014, 145, 41–56. [Google Scholar] [CrossRef]
  9. Hughes Clarke, J.E. Optimal Use of Multibeam Technology in the Study of Shelf Morphodynamics. In Sediments, Morphology and Sedimentary Processes on Continental Shelves; John Wiley & Sons: Hoboken, NJ, USA, 2012; pp. 1–28. [Google Scholar] [CrossRef]
  10. Jiang, Y.; Yang, Z.; Liu, Z.; Yang, C. High-resolution bottom detection algorithm for a multibeam echo-sounder system with a U-shaped array. Acta Oceanol. Sin. 2018, 37, 78–84. [Google Scholar] [CrossRef]
  11. L-3 Communications SeaBeam Instruments, Multibeam Sonar Theory of Operation. 2000. Available online: https://www3.mbari.org/data/mbsystem/sonarfunction/SeaBeamMultibeamTheoryOperation.pdf (accessed on 12 December 2023).
  12. Wu, Z.; Yang, F.; Tang, Y. Multi-beam Bathymetric Technology. In High-Resolution Seafloor Survey and Applications; Springer: Singapore, 2021; pp. 21–76. [Google Scholar] [CrossRef]
  13. Hughes Clarke, J.E. GGE 3353—Imaging and Mapping II: Submarine Acoustic Imaging Methods. Available online: http://www.omg.unb.ca/GGE/SE_3353.html (accessed on 12 December 2023).
  14. Yan, J.; Meng, J.; Zhao, J. Bottom Detection from Backscatter Data of Conventional Side Scan Sonars through 1D-UNet. Remote Sens. 2021, 13, 1024. [Google Scholar] [CrossRef]
  15. Acosta, G.G.; Villar, S.A. Accumulated CA–CFAR Process in 2-D for Online Object Detection from Sidescan Sonar Data. IEEE J. Ocean. Eng. 2015, 40, 558–569. [Google Scholar] [CrossRef]
  16. Villar, S.A.; Paula, M.D.; Solari, F.J.; Acosta, G.G. A Framework for Acoustic Segmentation Using Order Statistic-Constant False Alarm Rate in Two Dimensions from Sidescan Sonar Data. IEEE J. Ocean. Eng. 2018, 43, 735–748. [Google Scholar] [CrossRef]
  17. Zhao, J.; Meng, J.; Zhang, H.; Wang, S. Comprehensive Detection of Gas Plumes from Multibeam Water Column Images with Minimisation of Noise Interferences. Sensors 2017, 17, 2755. [Google Scholar] [CrossRef] [PubMed]
  18. Wang, J.; Li, H.; Huo, G.; Li, C.; Wei, Y. A Multi-Beam Seafloor Constant False Alarm Detection Method Based on Weighted Element Averaging. J. Mar. Sci. Eng. 2023, 11, 513. [Google Scholar] [CrossRef]
  19. Zhao, J.; Wang, X.; Zhang, H.; Wang, A. A Comprehensive Bottom-Tracking Method for Sidescan Sonar Image Influenced by Complicated Measuring Environment. IEEE J. Ocean. Eng. 2017, 42, 619–631. [Google Scholar] [CrossRef]
  20. Yan, J.; Meng, J.; Zhao, J. Real-Time Bottom Tracking Using Side Scan Sonar Data Through One-Dimensional Convolutional Neural Networks. Remote Sens. 2020, 12, 37. [Google Scholar] [CrossRef]
  21. Zheng, G.; Zhang, H.; Li, Y.; Zhao, J. A Universal Automatic Bottom Tracking Method of Side Scan Sonar Data Based on Semantic Segmentation. Remote Sens. 2021, 13, 1945. [Google Scholar] [CrossRef]
  22. Zhao, J.; Yan, J.; Zhang, H.; Meng, J. Two self-adaptive methods of improving multibeam backscatter image quality by removing angular response effect. J. Mar. Sci. Technol. 2017, 22, 288–300. [Google Scholar] [CrossRef]
  23. Ronneberger, O.; Fischer, P.; Brox, T. U-Net: Convolutional Networks for Biomedical Image Segmentation. In Proceedings of the Medical Image Computing and Computer-Assisted Intervention—MICCAI 2015, Munich, Germany, 5–9 October 2015; Springer: Berlin/Heidelberg, Germany, 2015; pp. 234–241. [Google Scholar] [CrossRef]
  24. Hughes Clarke, J.E.; Lamplugh, M.; Czotter, K. Multibeam water column imaging: Improved wreck least-depth determination. In Proceedings of the Canadian Hydrographic Conference, Halifax, Canada, 6–9 June 2006. [Google Scholar]
  25. NOAA Ocean Exploration. EM302 Water Column Sonar Data Collected During EX1402L3; NOAA National Centers for Environmental Information: Washington, DC, USA, 2014. [Google Scholar] [CrossRef]
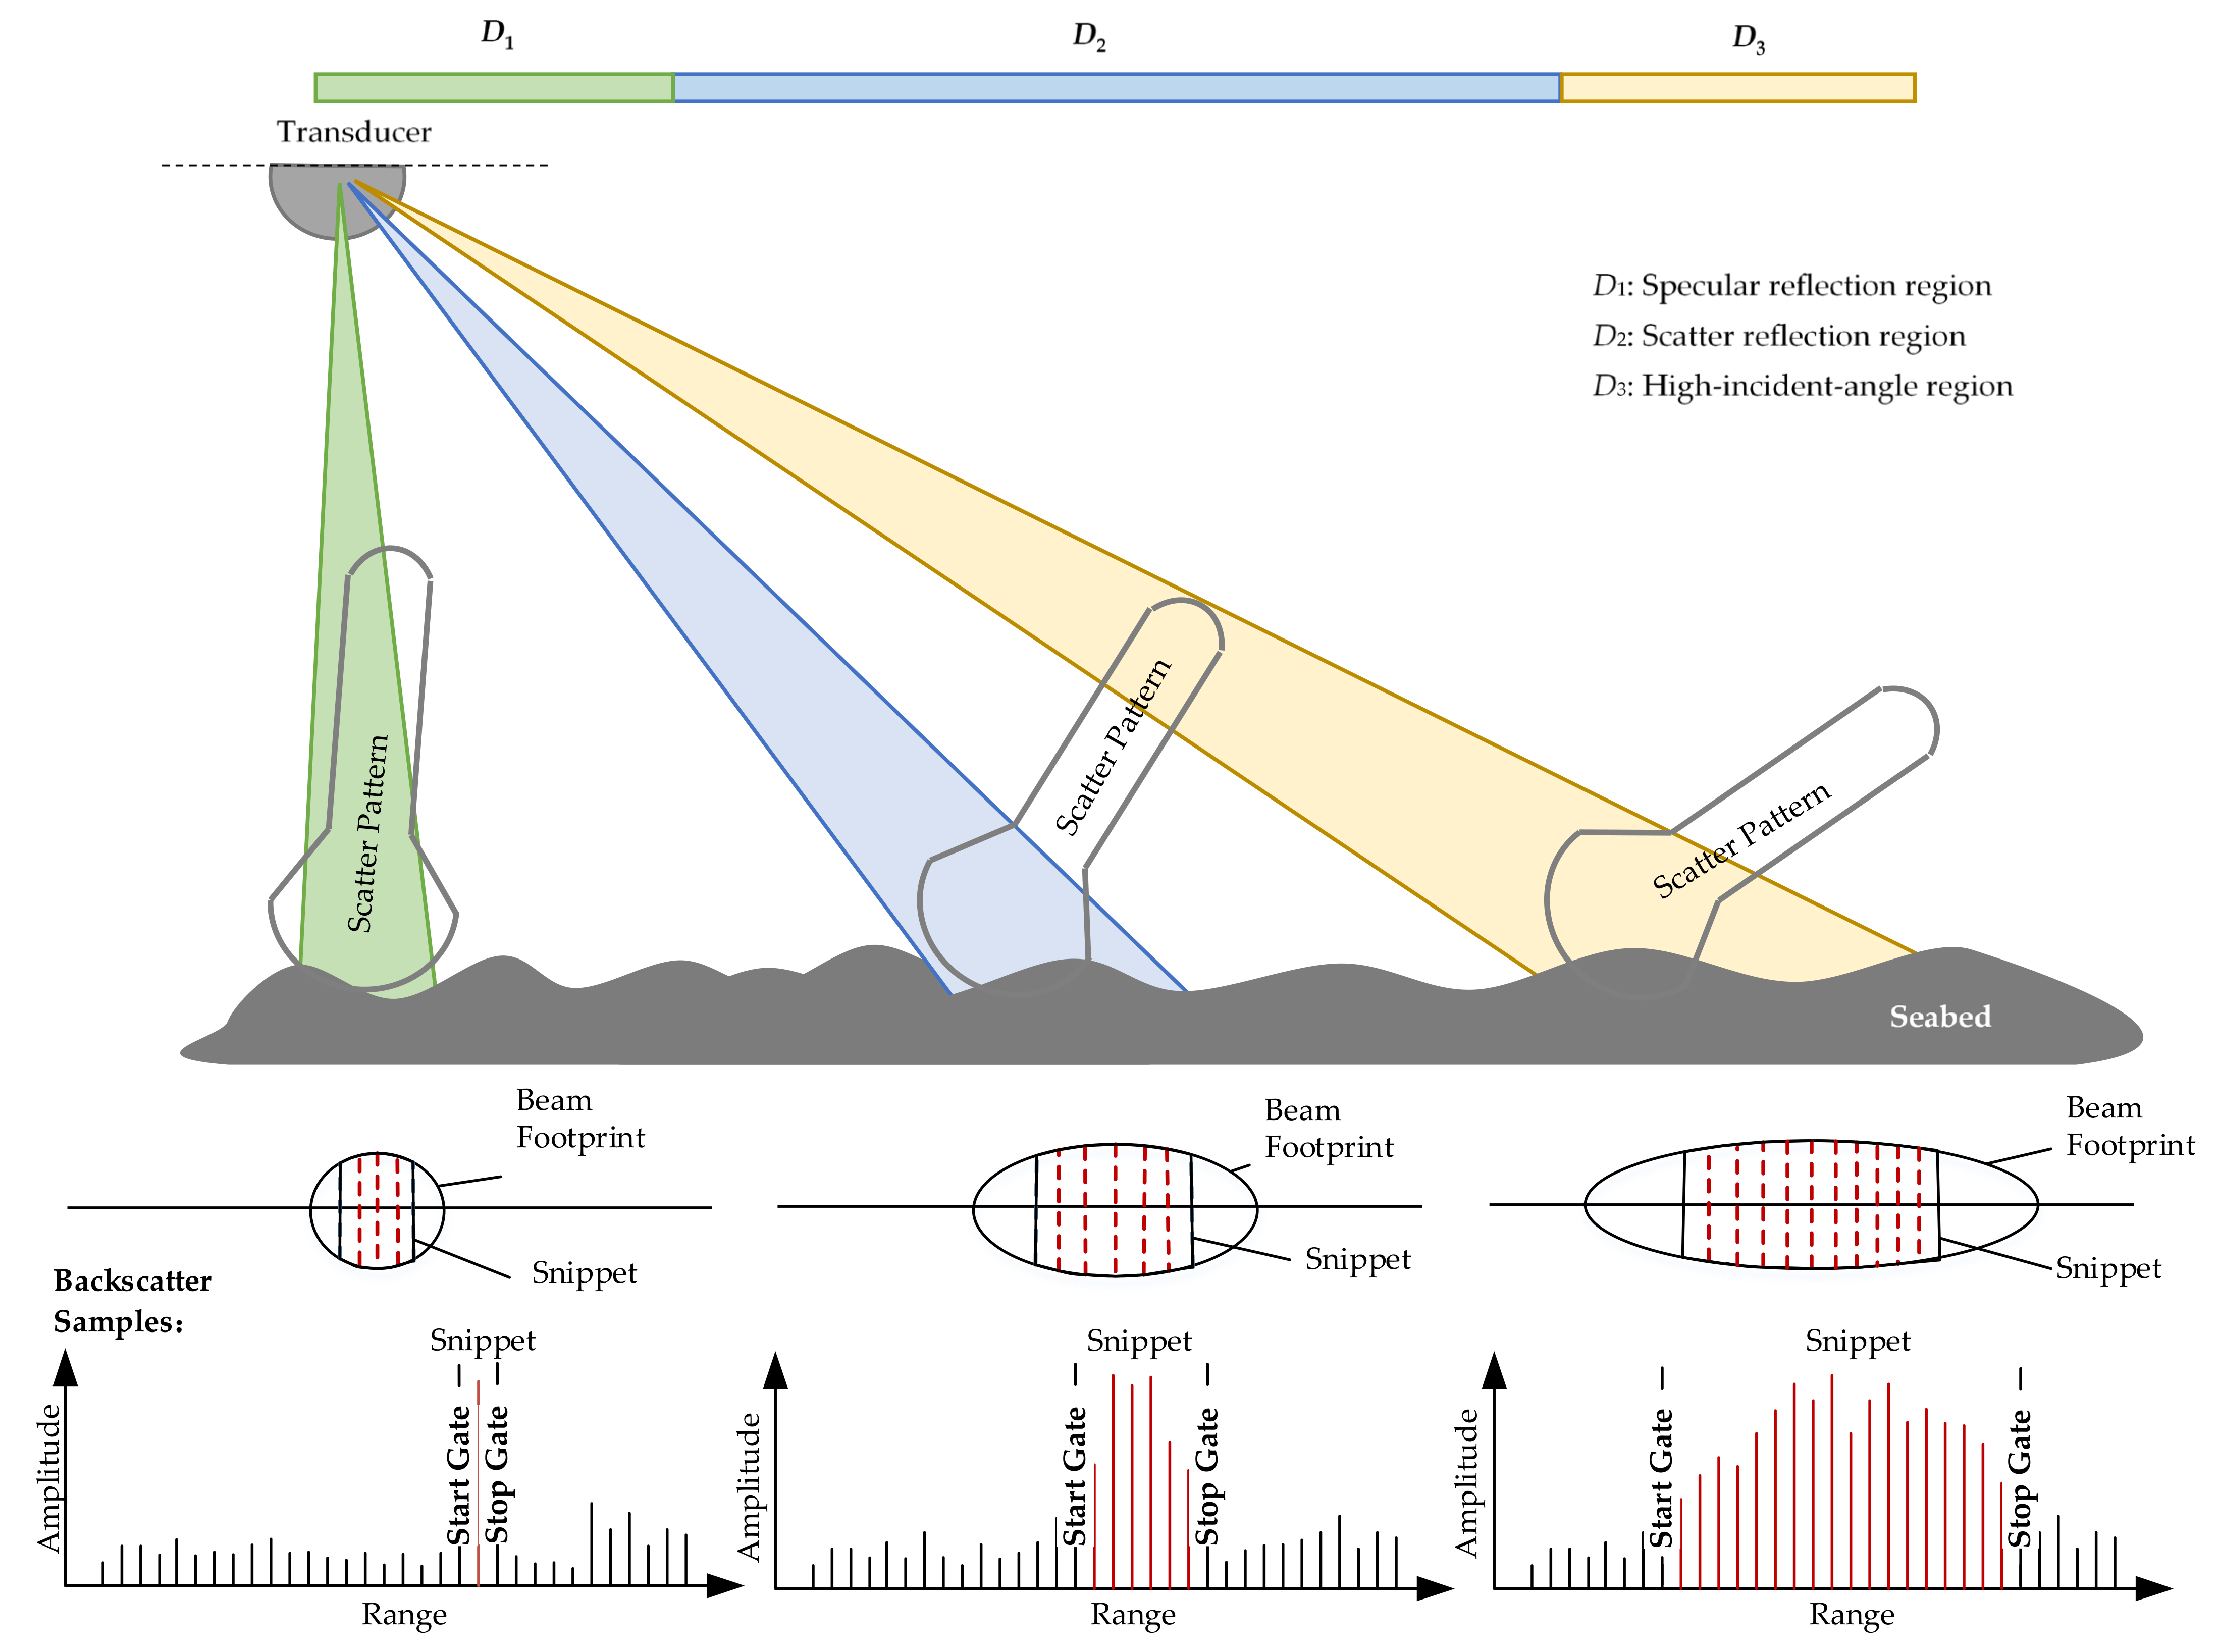
Figure 1. Schematic of the variations in the backscatter samples of multibeam echosounders at different incidence angles. In this work, the incidence angle intervals of D1/D2 and D2/D3 are set to 30° and 45°, respectively.
Remotesensing 16 00530 g001
Figure 2. Normal water column images (A) and water column images with interferences (B) and their corresponding backscatter strength curves.
Remotesensing 16 00530 g002
Figure 3. Procedure for training deep learning models for bottom detection of multibeam echosounders.
Remotesensing 16 00530 g003
Figure 4. 1D-UNet model structure for bottom detection of multibeam backscatter strength data at different incidence angles. The horizontal axes of the inputs and outputs represent the resampling indices, which range from 1 to 512. The vertical axes of the inputs and outputs represent the input strength and output prediction scores, which range from 0 to 1.
Remotesensing 16 00530 g004
Figure 5. Along-track bottom detection procedure for the multibeam water column data. The inputs and outputs of the model are the same as those in Figure 4.
Remotesensing 16 00530 g005
Figure 6. Across-track bottom detection procedure for the multibeam water column data. The inputs and outputs of the models are the same as those in Figure 4.
Remotesensing 16 00530 g006
Figure 7. Track lines of the measured multibeam data obtained from the surveyed water area. The green star and lines show the coordinates of these track lines.
Remotesensing 16 00530 g007
Figure 8. Training and validation accuracies at three different incidence regions: (A) specular reflection, (B) scatter reflection, and (C) high-incidence angle.
Remotesensing 16 00530 g008
Figure 9. Along-track bottom detection at an incidence angle of 0°: (A) along-track water column image; (B) traditional detection results (red line) of (A); (C) detection results (red line) of (A) by using our method; and (D) the differences between the traditional and our detection results.
Remotesensing 16 00530 g009
Figure 10. Comparison of bottom detections at an incidence angle of 0° between the traditional method, our method, and the manual method: (A1F1) normalized backscatter strengths taken as the inputs; (A2F2) bottom detections (orange lines) obtained using traditional methods; (A3F3) our detection results (green lines); and (A4F4) manual detection results (gray lines). Normalized strength means that the values of the backscatter strengths were normalized in the range of 0–1 for model training and prediction.
Remotesensing 16 00530 g010
Figure 11. Along-track bottom detections at an incidence angle of 35°: (A) along-track water column image; (B) traditional detection results (red line) of (A); (C) detection results (red line) of (A) by using our method; and (D) differences between the results obtained by the traditional method and our detection results.
Remotesensing 16 00530 g011
Figure 12. Comparison of bottom detections at the incidence angle of ±35° between the traditional method, our method, and the manual method: (A1D1) input sequences; (A2D2) traditional detection results (orange lines); (A3D3) our detection results (green lines); and (A4D4) manual detection results (gray lines).
Remotesensing 16 00530 g012
Figure 13. Along-track bottom detections at the incidence angle of 60°: (A) along-track water column image; (B) traditional detection results (red line) of (A); (C) our detection results (red line) of (A); and (D) differences between the detection results obtained by the traditional method and our method.
Remotesensing 16 00530 g013
Figure 14. Comparison of bottom detections at an incidence angle of ±60° between the traditional method, our method, and the manual method: (A1D1) input sequences; (A2D2) traditional detection results (orange lines); (A3D3) our detection results (green lines); and (A4D4) manual detection results (gray lines).
Remotesensing 16 00530 g014
Figure 15. Across-track seabed detection of one ping: (A) across-track water column image with traditional detections (red line); (B) across-track water column image with our detections (red line); and (C) differences between the traditional and our detections.
Remotesensing 16 00530 g015
Figure 16. Comparison of bottom detections at three different incidence angles by using the traditional method, our method, and the manual method: (A1C1) input sequences; (A2C2) traditional detection results (orange lines); (A3C3) our detection results (orange lines); and (A4C4) manual detection results (gray lines).
Remotesensing 16 00530 g016
Figure 17. Selected survey lines obtained from the EX1402L3_EM302 dataset: (A) coordinates of the selected track lines and (B) bubble targets in the water column. The orange star and lines show the coordinates of these track lines.
Remotesensing 16 00530 g017
Figure 18. Along-track bottom detections of the multibeam data (25th file in Dataset: EX1402L3_EM302) at an incidence angle of 0°: (A) along-track water column image; (B,C) results obtained by the traditional detections (red line in B) and our detections (red line in C); and (D) comparative results.
Remotesensing 16 00530 g018
Figure 19. Along-track bottom detections of the multibeam data (26th file in Dataset: EX1402L3_EM302) at an incidence angle of 35°: (A) along-track water column image; (B,C) results obtained by the traditional detections (red line in B) and our detection results (red line in C); and (D) comparative results.
Remotesensing 16 00530 g019
Figure 20. Along-track bottom detections of multibeam data (27th file in Dataset: EX1402L3_EM302) at an incidence angle of 60°: (A) along-track water column image; (B,C) results obtained by the traditional detections (red line in B) and our detection results (red line in C); and (D) comparative results.
Remotesensing 16 00530 g020
Table 1. Samples of normal backscatter strength (amplitude) and those with interference at different incidence angles.
Incidence AngleNormal Data and Default (Traditional) Seabed DetectionData with Interference and Default (Incorrect) and Manual Seabed Detections
Remotesensing 16 00530 i001
15°
30°
45°
60°
Disclaimer/Publisher’s Note: The statements, opinions and data contained in all publications are solely those of the individual author(s) and contributor(s) and not of MDPI and/or the editor(s). MDPI and/or the editor(s) disclaim responsibility for any injury to people or property resulting from any ideas, methods, instructions or products referred to in the content.