Abstract
Landslide susceptibility assessment (LSA) is an essential tool for landslide hazard warning. The selection of earthquake-related factors is pivotal for seismic LSA. In this study, Newmark displacement (Dn) is employed as the earthquake-related factor, providing a detailed representation of seismic characteristics. On the algorithmic side, a dual-channel convolutional neural network (CNN) model is built, and the last classification layer is replaced with two machine learning (ML) models to facilitate the extraction of deeper features related to landslide development. This research focuses on Beichuan County in Sichuan Province, China. Fifteen landslide predisposing factors, including hydrological, geomorphic, geological, vegetation cover, anthropogenic, and earthquake-related features, were extensively collected. The results demonstrate some specific issues. Dn outperforms conventional earthquake-related factors such as peak ground acceleration (PGA) and Arias intensity (Ia) in capturing seismic influence on landslide development. Under the same conditions, the OA improved by 5.55% and AUC improved by 0.055 compared to the PGA; the OA improved by 3.2% and AUC improved by 0.0327 compared to the Ia. The improved CNN outperforms ML models. Under the same conditions, the OA improved by 4.69% and AUC improved by 0.0467 compared to RF; the OA improved by 4.47% and AUC improved by 0.0447 compared to SVM. Additionally, historical landslides validate the reasonableness of the landslide susceptibility maps. The proposed method exhibits a high rate of overlap with the historical landslide inventory. The proportion of historical landslides in the very high and high susceptibility zones exceeds 87%. The method not only enhances accuracy but also produces a more fine-grained susceptibility map, providing a reliable basis for early warning of seismic landslides.
1. Introduction
The 2008 Wenchuan earthquake in China induced a large number of landslides, and it has always been a typical area for the study of seismic landslides. Seismic landslides are characterized by sudden onset, high-speed sliding, and long slip distances, making it difficult to meet the requirements for rapid early warning [1].
Seismic landslide susceptibility assessment (LSA) is a prominent research direction of earthquake-induced landslides. Numerous studies have demonstrated that the development of landslides is influenced by various factors, including topography, geomorphology, and hydrology [2,3]. Undeniably, the development of seismic landslides is not only related to environmental conditions but is also influenced by seismic activities. Therefore, selecting appropriate earthquake-related factors to express seismic characteristics is very important. Peak ground acceleration (PGA) [4,5,6] and Arias intensity (Ia) [7,8,9] are most widely used to capture the relationships between seismic landslides and earthquakes. However, the seismic features they characterize are relatively superficial. The Newmark model was first proposed by Newmark in 1965 [10]; it is a classical mechanical model in the field of seismic landslide hazard analysis. It effectively incorporates geological mechanics, physical principles, and seismic influences in its assessment of landslide trigger mechanisms. Accordingly, Newmark displacement (Dn) provides more detailed information in representing seismic characteristics. The model has been widely used to predict seismic landslides [11,12,13]. Regretfully, almost all these studies have solely utilized Dn to express the probability of landslides and do not consider the effects of other environmental factors such as hydrological factors, human activities, and geomorphological factors. There is a lack of studies that use Dn as an earthquake-related factor in LSA.
Studies of LSA have employed various statistical methods. Statistical modeling is employed to infer the probability of landslide occurrence based on historical landslide inventory maps. Classical statistical methods such as the frequency ratio, information quantity method, and weight of evidence method are easy to apply [14,15,16]. Nowadays, machine learning (ML) is widely used in LSA due to its good performance in nonlinear feature extraction. Prominent ML algorithms, such as random forest (RF) [17,18]), support vector machine (SVM) [19,20], and logistic regression (LR) [21,22] have been extensively employed. A comparison of different machine learning models, including LR, decision tree (DT), and RF, for evaluating landslide susceptibility in Lin’an, southeastern China was conducted [23]. The study highlighted that RF makes the most accurate predictions of landslides. Liu et al. adopted three models, including LR, SVM, and RF, to study the quality performance of the susceptibility distribution rule of earthquake-induced landslides [18]. The result shows that RF has a better performance quality in the susceptibility assessment of landslides induced by earthquakes. Despite that, some scholars suggest that these methods still have certain limitations, including suboptimal extraction of intricate nonlinear features and limited capacity for expressing spatial patterns [24].
In recent years, deep learning (DL) has gained significant popularity due to its exceptional capability in extracting nonlinear features between objects. The CNN is one of the most mature DL frameworks. A few scholars have applied CNNs to LSA so far. Chen et al. proposed an ensemble model based on a channel-expanded pretrained CNN and compared it with traditional ML [25]. The results show that the CNN can predict landslide occurrence with high reliability. Jiang et al. [26] compared the effectiveness of a CNN and conventional ML methods in LSA. The result of the CNN has higher accuracy and a stronger concentration, making it important for disaster prevention and mitigation. The potential of CNNs in landslide prediction is evident. Consequently, there is an urgent need to make adjustments to CNNs to improve their utility in LSA.
A few scholars have explored ways to combine the Newmark model and statistical analysis methods. For instance, the Newmark model was employed to establish a sample selection strategy by generating negative samples in very low displacement and low displacement areas [27]. However, the point of this work was to propose a Newmark-based sampling approach for seismic landslides. Among numerous studies, one scholar utilized Dn as an earthquake-related factor in LSA [28]. Nevertheless, it is limited by choosing only three additional factors related to landslides along with Dn. Other environmental factors that significantly impact landslide development are neglected. Moreover, the algorithm employed, LR, has a poor ability to extract features. Furthermore, there is no comparison with traditional earthquake-related factors. Few scholars can effectively combine the Newmark model (mechanical model) with the statistical model, and the field remains to be explored.
In conclusion, there is an urgent need to develop a new seismic LSA method that can comprehensively integrate the influence of environmental and earthquake-related factors on landslide development. In this study, the improved CNN is combined with the Newmark model to construct two hybrid models, namely, N_RF_CNN and N_SVM_CNN. Beichuan County was selected as the study area, wherein 15 landslide predisposing factors were chosen. In order to prove the superiority of Dn in expressing seismic features, we compare it with two traditional earthquake-related factors, PGA and Ia. In addition, to prove the superiority of the CNN in mining the deep features of the various predisposing factors, we compare the improved CNN model with two ML methods, RF and SVM.
2. Proposed Methods
The methodology adopted involves the following steps (Figure 1): Specifically, various landslide predisposing factors were collected and preprocessed. Simultaneously, the Newmark model was used to calculate the Dn. After that, all the landslide predisposing factors were input into the DL model to generate an LSA. Finally, the models were evaluated through overall accuracy (OA), area under curve (AUC), and mean absolute error (MAE).
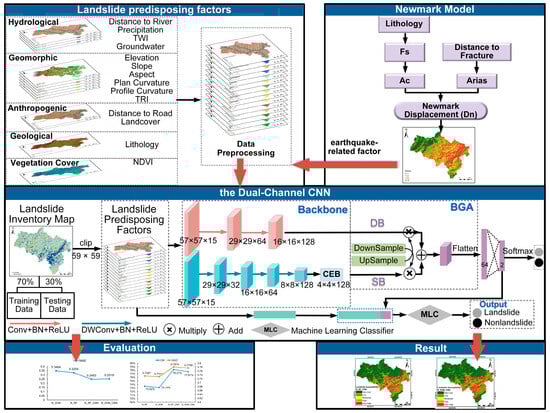
Figure 1.
Flowchart of methodology.
2.1. Newmark Model Theory
The theoretical basis of the Newmark model is the limit equilibrium theory. According to the theory, when the acceleration applied to the sliding block exceeds the critical acceleration (ac) in its limiting equilibrium state, the slider slides down the slope. Theoretically, Dn is estimated by conducting double integration of the earthquake acceleration time history components above the critical acceleration. The Dn can reflect the probability of landslide instability and can be taken as an earthquake-related factor. However, due to the huge amount of computation and often unavailable data, the simplified Newmark model is now commonly used to predict Dn. Newmark model mainly includes three steps (Figure 2): static factor of safety (Fs) calculation, critical acceleration (ac) calculation, and Dn calculation.
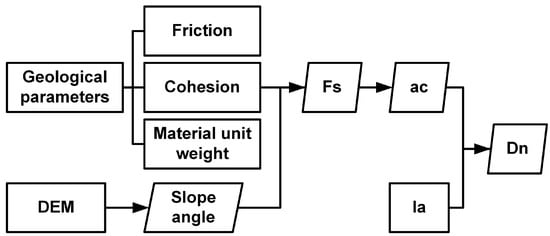
Figure 2.
Flowchart of Newmark model.
2.1.1. Static Factor of Safety (Fs) Calculation
The geological map of the study area was collected (Figure 3). Based on the standard for engineering classification of rock mass and previous experience [29,30], the rock–soil mass in the study area has been classified into four groups ranging from hard to soft. The equation of Fs is given below:
where is cohesion, is the friction angle, is the proportion of failure mass that is saturated, is the thickness of the failure rock block, is the slope angle, is the unit weight of material, and is the unit weight of water. Table 1 shows the specific parameters.
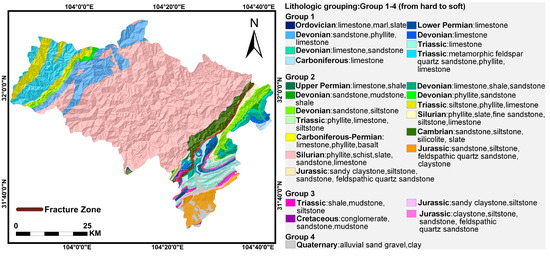
Figure 3.
Geological map.

Table 1.
Classification of lithologies and parameters.
2.1.2. Critical Acceleration (ac) Calculation
Critical acceleration (ac) represents the potential of slope instability, determined by the inherent properties of the slope. ac is expressed as follows:
where g is the acceleration of gravity; θ is the dipping angle of the slide surface.
2.1.3. Newmark Displacement (Dn) Calculation
Because of its universal applicability, we chose the Newmark logarithm regression equation established by Jibson [31]. The Dn equation as shown in Equation (3) was adopted. The Dn map is shown in Figure 4.
where Ia is a ground motion parameter obtained by integrating the square of the ground motion acceleration record over time, which is an important indicator, and can effectively capture the potential damage of earthquakes [32]. Ia encompasses the amplitude, spectral, and time-holding characteristics of the earthquake, and it can characterize the whole range of ground shaking properties. Particularly, it reflects the energy of broadband seismic signals, capturing the influence of the entire duration of the earthquake. It can usually be obtained through instrumental records. Nevertheless, during the Wenchuan earthquake, detailed ground motion data could not be collected due to the limited number of seismic stations and the destruction of some stations. Fortunately, we obtained Ia using the attenuation equation fitted to the Wenchuan ground motion records by Wang et al. [33]:
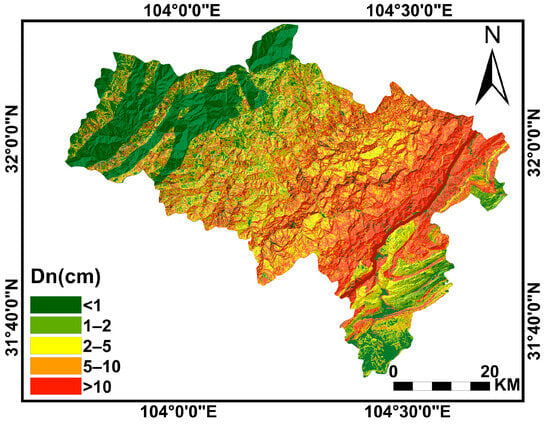
Figure 4.
Newmark displacement map.
2.2. Dual-Channel CNN
Seismic landslide predisposing factors contain a mass of geological, hydrological, human-related, and other geographic spatial features, along with deep semantic information. To achieve multiple factor inputs, the number of channels is set to 15. To make full use of spatial features and deep semantic information, a dual-channel model based on the traditional CNN method was constructed, and the structure is shown in Figure 1. The image data cropped from the sample point as the center are used as the training sample. After many trials and adjustments, images with a size of 57 × 57 are finally determined as the model inputs. The network consists of two branches: the detail branch (DB) and the semantic branch (SB). In the DB, spatial detail information is extracted through a limited number of convolutions. In the SB, a fast downsampling strategy using depthwise separable convolution is employed to expand the receptive field. Additionally, a context-embedding block (CEB) (Figure 5) is added to the SB to capture the relationship between the probability of landslide occurrence and the surrounding environment. The outputs of the two branches show different levels of features. The DB branch extracts shallow information, such as color, texture, and morphology, while the SB branch captures global semantic information related to the probability of landslide occurrence influenced by the surrounding environment. However, a simple fusion method (such as addition, concatenation, or multiplication) might overlook more effective information. Therefore, the BGA module is designed (Figure 6) to effectively fuse information from the two branches by integrating features at different scales through rich feature combinations.
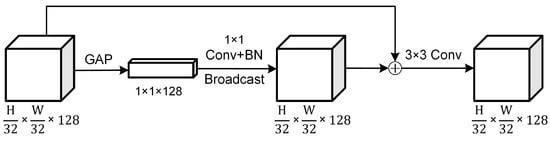
Figure 5.
Structure of CEB.
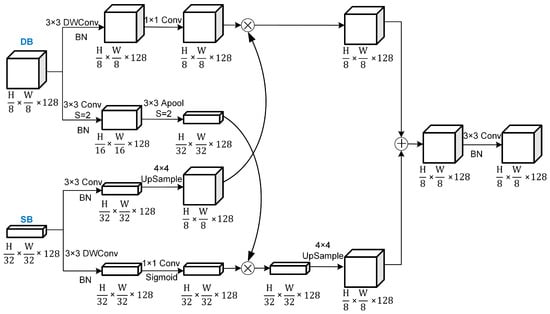
Figure 6.
Structure of BGA.
After CNN training is completed, the Softmax classifier outputs the probability. In this study, patch-based high-level features and point-based numerical landslide predisposing factors are fused into a one-dimensional feature vector, creating a hybrid feature representation of landslide predisposing factors. Finally, the traditional ML model is integrated into the CNN model, replacing the final classification layer. The hybrid features are fed into the ML classifier to predict the spatial probability. In this study, two classical ML methods, SVM and RF, are used as the final classifiers. SVM_CNN and RF_CNN are used to represent these two methods in the following.
2.3. Evaluation Indicators
AUC, OA, and MAE are adopted to evaluate the performance of the proposed methods quantitatively. AUC represents the area under the ROC curve, which ranges from 0.5 to 1. A higher AUC value indicates better predictive performance. OA measures the accuracy of correctly predicting sample points and can be calculated using Equation (5).
where (true positive) and (true negative) represent the number of correctly predicted landslide and non-landslide sample points, respectively. (false positive) and (false negative) represent the numbers of mispredicted landslide and non-landslide sample points.
MAE represents the average distance between the predicted values of the model and the true values and is expressed in Equation (6):
where is the th predicted value and is the th true value.
We counted the number of landslides at different susceptibility levels and compared them with the landslide inventory map to verify the accuracy of the prediction results. When the proportion of historical landslides is higher in high-susceptibility areas and lower in low-susceptibility areas, it indicates a high consistency between the susceptibility map and landslide inventory. We also calculated the percentage of areas with different susceptibility levels under different methods, which also illustrates the strengths and weaknesses of the methods.
3. Study Area and Data
3.1. Study Area
In 2008, an Ms 8.0 earthquake occurred in Wenchuan County, Sichuan Province, China, triggering many seismic landslides. Beichuan County (104°26′–104°29′E, 31°35′–31°38′N) is in the northeast of Wenchuan County and covers an area of 2868 km². The county suffered massive damage due to its location along the Beichuan–Yingxiu fault belt. In addition, Beichuan County exhibits typical conditions for landslide development, characterized by complex topography, diverse lithology and strata, and uneven distribution of precipitation. Figure 7a shows the location of Beichuan County.
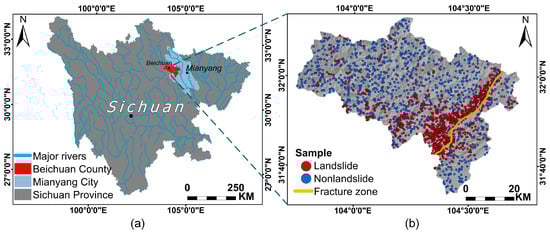
Figure 7.
(a) Location of Beichuan; (b) sample distribution.
3.2. Landslide Inventory Map
The availability of a reliable landslide inventory map is a basic requirement of LSA [34]. In this study, we utilized an inventory map generated by Chong Xu [35]. The map was obtained by visual interpretation using high-resolution remote sensing images and subsequently verified in the field. From this inventory map, we randomly selected 1102 representative landslides as positive samples. When generating negative samples, we aim to maintain a certain distance from the landslides, which ensures that the selected samples can truly reflect the characteristics of landslides and non-landslides. To meet the requirement of random selection and avoid the influence of subjective factors, we generated a 1 km buffer around landslides and selected an equal number of non-landslides randomly outside the buffer. The samples were then divided into training and testing datasets at a ratio of 7:3, which has been proven suitable for LSA [36,37,38]. Figure 7b illustrates the distribution of positive and negative samples.
3.3. Landslide Predisposing Factors
Landslide predisposing factors are composed of environmental factors and earthquake-related factors. We selected 14 environmental factors, including hydrological factors, geomorphic factors, geological factors, vegetation cover factors, and anthropogenic factors (Table 2, Figure 8). Distance to river, mean annual precipitation, topographic wetness index (TWI), and groundwater are hydrological factors. Generally, areas with dense water system distribution, high rainfall, and high surface humidity are more prone to landslides. Geomorphic factors also play a crucial role in LSA as the fundamental cause of landslides is slope instability. Factors such as elevation, slope, aspect, plan curvature, profile curvature, and topographic relief index (TRI) are geomorphic factors. The stability of lithology is different due to the fragility of the rock, making it an essential geological factor. Vegetation, known for its ability to stabilize water and soil, can reduce the likelihood of landslides. Areas with higher vegetation coverage usually have a lower probability of landslides, as represented by the normalized difference vegetation index (NDVI) factor. Anthropogenic factors, including distance to road and landcover, are also important considerations as human activities can increase the likelihood of landslides. All the factors were normalized to a range of 0–255 to maintain the same value range between each datum and avoid model misconvergence.
Table 2.
Landslide predisposing factors.
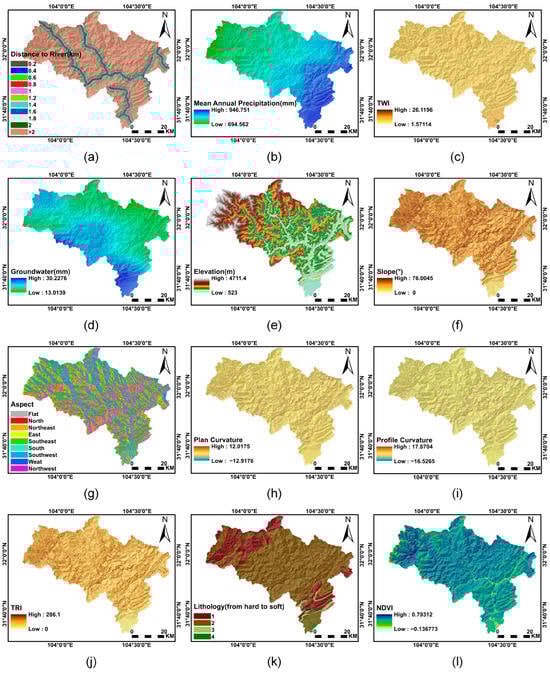
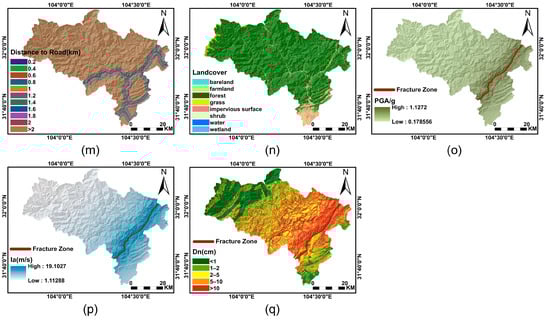
Figure 8.
Environmental predisposing factors: (a) distance to river; (b) mean annual precipitation; (c) TWI; (d) groundwater; (e) elevation; (f) slope; (g) aspect; (h) plan curvature; (i) profile curvature; (j) TRI; (k) lithology; (l) NDVI; (m) distance to road; (n) landcover; (o) PGA; (p) Ia; (q) Dn.
To highlight the superiority of Dn as an earthquake-related factor, we chose two traditional earthquake-related factors, Ia and PGA, for comparative experiments. Steps for the calculation of Ia are described in Equation (4). PGA represents the maximum acceleration of the ground due to the action of seismic waves. It was originally employed to assess the extent of earthquake damage to buildings. Due to its widespread availability, it has become the most used ground motion parameter for evaluating earthquake intensity. In this study, PGA was obtained using the attenuation equation fitted to the Wenchuan ground shaking records by Xie et al. [39]
where is seismogenic fault distance.
The three different earthquake-related factors are shown in Figure 8o–q. We calculated the distribution relationship between landslide density and different earthquake-related factors. As depicted in Figure 9, a significant relationship between landslide density and three distinct earthquake-related factors is evident, highlighting the significance of this study.
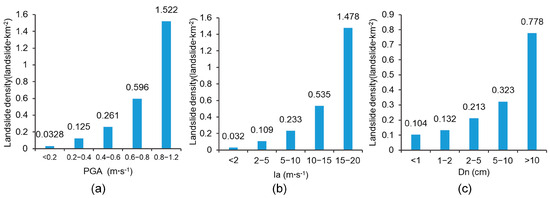
Figure 9.
Relationship between landslide density and different earthquake-related factors: (a) PGA; (b) Ia; (c) Dn.
4. Experiments and Result
The models we used are as follows: RF, random forest; SVM, support vector machine; RF_CNN, convolutional neural network combined with RF classifier; SVM_CNN, convolutional neural network combined with SVM classifier. N_, PGA_, and Ia_ represent the models that use Dn, PGA, and Ia as earthquake-related factors.
4.1. Multicollinearity Analysis
When there is a high correlation between factors, it is easy to lead to model distortion. To ensure that there is no linear correlation among the different landslide predisposing factors, a multicollinearity analysis was conducted using tolerance (TOL) and variance inflation factor (VIF) [40]. The results are shown in Table 3. The TOL is more than 0.1, and the VIF is close to 1, indicating that there is no multicollinearity among the factors and that the factors were selected reasonably.
Table 3.
Multicollinearity analysis.
4.2. Seismic Landslide Susceptibility Maps
The model’s final output is a probability map, ranging from 0 to 1. In this study, we chose an interval of 0.2 to categorize the entire study area into five susceptibility areas: very high, high, moderate, low, and very low.
Figure 10 shows the susceptibility maps of N_RF_CNN and N_SVM_CNN. Although there are some differences in detail between the models, the general trend remains consistent. Very high and high susceptibility areas are widely distributed in the area, mainly concentrated in the east and southeast, and the central region. The northern and northwest of the study area present a lower hazard. The overall hazard trend is closely related to the characteristics of roads, rivers, and the earthquake. Furthermore, we calculated the susceptibility area of N_RF_CNN and N_SVM_CNN (Figure 11). The areas classified as “very low” exhibited widespread distribution, accounting for 65.8% and 65.9% of the total area using the two methods, respectively. Following that are the areas classified as “very high” or “high”, the “very high” and “high” susceptibility areas are mainly concentrated near the fracture zone, with a decreasing trend towards the northwest and southeast sides.
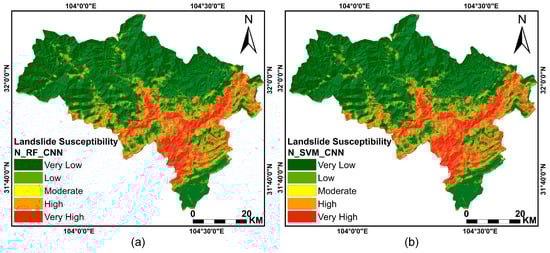
Figure 10.
Landslide susceptibility maps: (a) N_RF_CNN; (b) N_SVM_CNN.
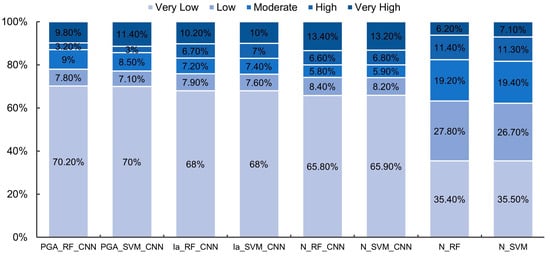
Figure 11.
Area proportion of each susceptibility class.
4.2.1. Comparison with Different Earthquake-Related Factors
To demonstrate the effectiveness of Dn as a representative earthquake characteristic, comparative experiments were conducted using PGA and Ia as the earthquake-related factor (the algorithm exclusively considers RF_CNN and SVM_CNN). The results are depicted in Figure 12. The proportions of different susceptibility areas were calculated (Figure 11). The different results show a higher concentration of very high susceptibility and high susceptibility areas when considering Dn as an earthquake-related factor. In the results obtained by employing PGA and Ia, the proportions of very high susceptibility and high-susceptibility areas are reduced. Conversely, moderate susceptibility areas account for a large proportion, indicating that the results exhibit limited predictive capability.
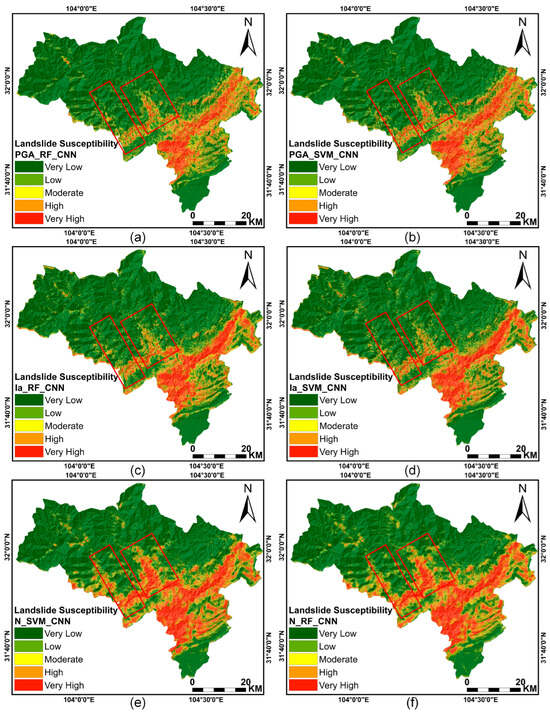
Figure 12.
Landslide susceptibility maps using different earthquake-related factors: (a) PGA_RF_CNN; (b) PGA_SVM_CNN; (c) Ia_RF_CNN; (d) Ia_SVM_CNN; (e) N_RF_CNN; (f) N_SVM_CNN.
In terms of details, in the susceptibility maps generated by N_RF_CNN and N_SVM_CNN, the western and central areas (highlighted by the red rectangles in Figure 12) exhibit higher levels of danger compared to the results obtained by other methods. The reasons for these conditions are as follows:
- These regions are traversed by the Tongkou River and other water systems.
- The terrain in these areas experiences significant fluctuations.
- The locations are situated within valleys and are densely populated with towns. The presence of human-made structures inevitably amplifies the degree of susceptibility.
4.2.2. Comparison with Different ML Algorithms
To establish the superiority of the improved CNN method, we conducted comparative experiments involving traditional SVM and RF algorithms (consider Dn as the sole seismic predisposing factor). Figure 13 shows the susceptibility maps. The proportions of different susceptibility areas were calculated, as illustrated in Figure 11. Under identical conditions, the results of N_RF indicate a notably higher proportion of moderate susceptibility areas, comprising 19.2%, in contrast to N_RF_CNN, which accounts for only 5.8% of moderate susceptibility areas. Similar trends are also observed for N_SVM and N_SVM_CNN. This indicates that when traditional RF and SVM are used to predict landslide susceptibility, the results are characterized by a high degree of ambiguity in many areas, rendering them of limited practical utility.
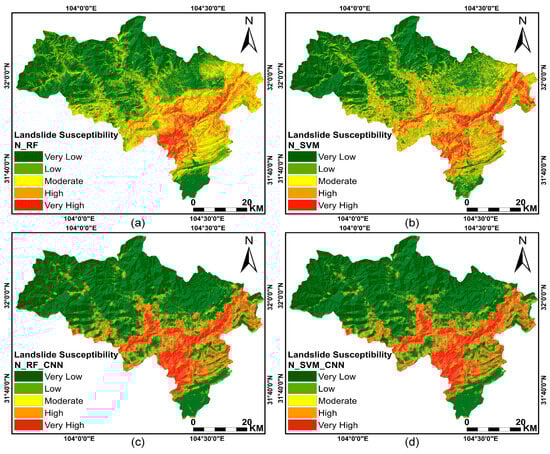
Figure 13.
Landslide susceptibility maps using different ML combined with Dn: (a) N_RF; (b) N_SVM; (c) N_RF_CNN; (d) N_SVM_CNN.
4.3. Evaluation and Validation
To assess model accuracy, quantitative evaluations were conducted utilizing the AUC, OA, and MAE. Additionally, to validate the method’s practical applicability, the percentage of historical landslides at different susceptibility levels was counted.
4.3.1. Comparison with Different Earthquake-Related Factors
As shown in Figure 14, the results using Dn are better than PGA and Ia in all indicators (the algorithm exclusively considers RF_CNN and SVM_CNN) and obtain a higher OA and AUC, and lower MAE. N_RF_CNN has the strongest ability to predict landslides with the highest OA (78.21%), AUC (0.7814), and lower MAE (0.2483).
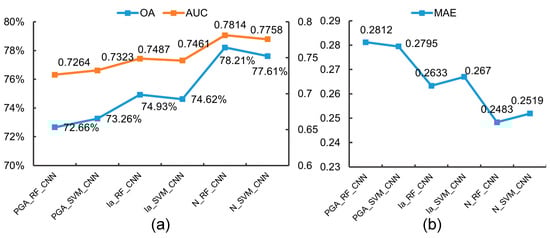
Figure 14.
Model evaluation results of different earthquake-related factors: (a) OA and AUC; (b) MAE.
The more landslides fall into low susceptibility areas, the poorer the ability to predict landslides. As shown in Table 4, the results obtained using Dn as the earthquake-related factor show that the proportion of historical landslides in the very high and high-susceptibility zones exceeds 87%. In contrast, when PGA is employed, this proportion does not surpass 70%. Likewise, when Ia is employed, this proportion remains below 82%. A higher number of historical landslides in low-susceptibility areas could have adverse implications for LSA. When PGA or Ia is employed, a considerable number of points are in very low and low-susceptibility areas. In contrast, when Dn is employed, the proportion of historical landslides in very low and low-susceptibility zones is lower, indicating better prediction results.
Table 4.
The percentage of historical landslide points in different susceptibility levels using different earthquake-related factors.
4.3.2. Comparison with Different ML Algorithms
As shown in Figure 15, all indicators show that the improved CNN outperforms RF and SVM (consider Dn as the sole seismic predisposing factor), achieving a higher OA and AUC, and lower MAE. From N_RF to N_RF_CNN resulted in a 4.69% increase in OA, a 0.047 increase in AUC, and a decrease in MAE to 0.2483. Similarly, N_SVM to N_SVM_CNN led to a 4.47% rise in OA accuracy, a 0.045 increase in AUC, and a decrease in MAE to 0.2519.
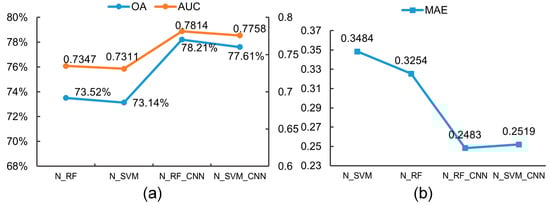
Figure 15.
Model evaluation results of different ML methods combined with Dn: (a) OA and AUC; (b) MAE.
Compared to N_RF_CNN and N_SVM_CNN (Table 4), both N_RF and N_SVM have lower proportions of historical landslides in very high and high-susceptibility areas, while demonstrating higher proportions in the very low and low-susceptibility areas.
5. Discussion
5.1. Feasibility of Dn as Earthquake-Related Factors for Seismic LSA
When previous studies used the Newmark model, they directly used Dn as the result to predict landslides. We innovatively apply Dn as the earthquake-related factor to the improved CNN model to generate landslide susceptibility maps, simultaneously taking advantage of the physical principles of the Newmark model and the powerful feature extraction capability of CNNs. As shown in Figure 16, compared to LSA (using the N_RF_CNN method as an example), the Dn map has a wider susceptibility area, and the prediction effect of landslides is poor. This is because the physical model does not consider the influence of the surrounding environment on landslide development.
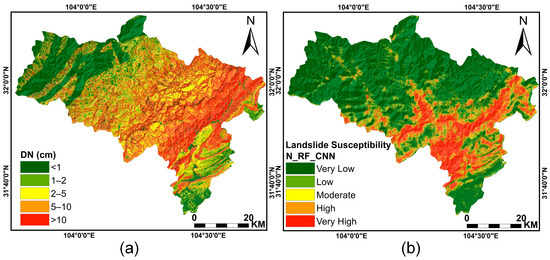
Figure 16.
Comparison of Dn map and LSA map: (a) Dn; (b) LSA.
As the earthquake-related factor in LSA, Dn contains more comprehensive seismic information, rather than just simple ground vibration parameters compared with Ia and PGA. When calculating Dn, various factors, such as ground motion parameters, physical mechanisms, and geotechnical mechanics, are included. As shown in Equations (1) and (3), shear parameters of the rock–soil mass and slope are used. The friction angle and cohesion are two mechanical indicators of the shear strength of rock–soil mass. The friction angle is physically the coefficient of friction, characterizing the ability to resist sliding between adjacent soil layers. Cohesion is the mutual attraction between adjacent parts within the same substance. These two properties characterize the stability of a geotechnical body under static conditions. For example, relatively hard limestone has a higher friction angle and cohesion, making it more stable. Unweathered mudstone, which is relatively soft, has a lower friction angle and cohesion and is less stable in comparison. Nevertheless, when ground motion parameters are different, the harder limestone may be destabilized, while the mudstone is more stable. Using Equation (3), the probability of destabilization of rock–soil mass with different properties under different ground motion parameters can be obtained. Several physical principles are involved. Dn contains richer physical and seismic information than simple ground motion parameters, enabling better LSA results using Dn as an earthquake-related factor. However, it is worth noting that previous studies have been limited to employing Dn for landslide prediction. For instance, Yuan et al. utilized the Newmark model to assess seismic landslides triggered by the 2013 Lushan earthquake in China, with the results applicable to future co-seismic landslide prediction [41]. Similarly, Gupta et al. applied the Newmark model in the Indian Himalayas for landslide prediction and validated the results using a landslide inventory [42]. While these studies yielded positive outcomes, they overlooked a crucial aspect—the intrinsic logic of landslide development intricately linked to the surrounding environment. Factors such as hydrological characteristics, geological features, and human influences cannot be disregarded. Therefore, using Dn as an earthquake-related factor to obtain a more comprehensive and reasonable seismic LSA can not only compensate for the shortcomings of the traditional earthquake-related factors in expressing seismic information but also take into account the various environmental factors affecting the development of landslides.
The results show that the performance of LSA with Dn is significantly better compared to LSA without Dn. Figure 17 illustrates that regardless of the algorithm used, the susceptibility maps generated by Dn exhibit a broader distribution and higher granularity. As shown in Table 5, the approaches using Dn consistently achieve a higher OA and AUC, as well as lower MAE, regardless of the algorithm used. PGA exhibits the lowest accuracy, while Ia demonstrates slightly better accuracy. This has practical implications. Since PGA is a crucial metric characterizing earthquake damage to buildings, it has limitations as an indicator of seismic hazard. Contrastingly, Ia can reflect the cumulative effect of the entire ground shaking time course and is more accurate than PGA in describing the potential damage caused by earthquakes. LSA results constrained by Dn exhibit fewer moderate and low-susceptibility areas, while high-susceptibility areas are more concentrated, primarily distributed around the Beichuan–Yingxiu fracture belt spanning Beichuan County. This distribution pattern demonstrates a trend of spreading from the center of the fracture zone toward the periphery. Previous studies have indicated that the landslides triggered by the 2008 Wenchuan earthquake are densely distributed along the seismogenic fracture zone and the junction of the fracture zone, with the landslide distribution sharply decreasing as the distance from the fracture belt increases [35,43]. The results show that the susceptibility maps obtained using Dn are more consistent with the historical landslide distribution, especially in high-susceptibility areas.
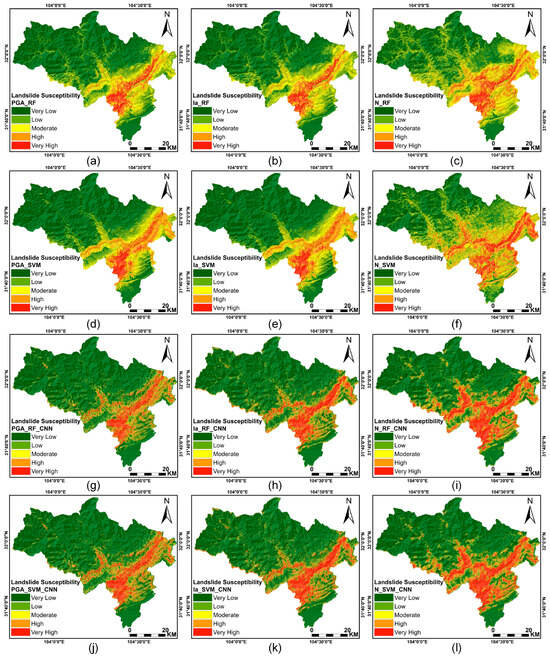
Figure 17.
Landslide susceptibility maps using all methods: (a) PGA_RF; (b) Ia_RF; (c) N_RF; (d) PGA_SVM; (e) Ia_SVM; (f) N_SVM; (g) PGA_RF_CNN; (h) Ia_RF_CNN; (i) N_RF_CNN; (j) PGA_SVM_CNN; (k) Ia_SVM_CNN; (l) N_SVM_CNN.
Table 5.
OA, AUC, and MAE of all methods.
5.2. Feasibility of Improved CNN Model for Seismic LSA
The conventional CNN, due to its single linear structure, sacrifices low-level features for image classification tasks. As the depth of the network increases, the richness of feature information decreases. Therefore, we have made some adjustments based on the conventional CNN. Specifically, the detail branch has fewer layers and a larger feature map size, and it is responsible for extracting spatial details such as geometric and color features of landslides and environment. The semantic branch has more layers and a larger receptive field, which helps analyze the correlation between landslides and the factors. To preserve low-level features, a residual connection structure in this branch is adopted, which can also solve the problem of gradient disappearance in deep networks. To improve network training efficiency, we use depthwise separable convolutions instead of the traditional convolution mode. Each convolution kernel is assigned to a feature map channel, which reduces the number of parameters while maintaining a certain receptive field. This approach contributes to the construction of deep networks and can effectively extract deep semantic information from source data. Finally, the traditional ML classifier is used as the final classifier for classifying the extracted feature maps after nonlinear alignment and combination. Compared to the linear computation of fully connected layers, the ML classifier achieves more efficient secondary classification of the classified feature layers.
By adopting the improved CNN model, we can comprehensively extract detailed information. It can be seen from Table 5 that regardless of the earthquake-related factors used, the improved CNN model consistently outperforms traditional ML in LSA, achieving higher accuracy. It is worth noting that the classification accuracy in this paper is not very high overall, with a maximum OA of 78.21%. This is because compared with other computer vision tasks, the natural environments that nurture landslides are complex and diverse, and the landslide samples are randomly distributed and of various sizes, making it difficult to achieve a high level of accuracy for the landslide classification task. Additionally, for an objective evaluation of the LSA, it is necessary to further calculate the overlap rate of historical landslides. As can be seen from the last four rows of Table 4, a higher percentage of historical landslides fall into very high and high susceptibility using the improved CNN model compared to traditional ML. Of historical landslides, 87% and 88% fall into the very high and high-susceptibility areas predicted by RF_RF_CNN and N_SVM_CNN methods, respectively. As seen in Figure 17, the susceptibility maps of traditional ML exhibit noticeable strip and block patterns. Nevertheless, under the same conditions, N_RF_CNN and N_SVM_CNN show superior prediction performance and exhibit greater ability in capturing details. The improved method effectively solves the limitations of traditional ML in capturing deep features, while also improving the landslide prediction ability of the CNN model through refinement.
5.3. Problems and Improvement Directions
Theoretically, the geotechnical parameters used to calculate the Dn are spatially variable, so it is not optimal to combine the parameters at the macroscopic scale. Furthermore, due to long-term geological activities and weathering, the rock–soil mass evolves correspondingly, which leads to certain errors between empirical and actual parameters. Therefore, our future research will focus on how to effectively use historical landslides to invert rock–soil mass parameters to provide reliable data support for LSA. Another problem that should not be ignored is that most landslides are concentrated around the Beichuan–Yingxiu fracture zone. There is no obvious heterogeneity between the locations of these landslides and environments due to the limitation of the spatial resolution, making it unfavorable for feature learning for both positive and negative samples.
6. Conclusions
In this study, a seismic LSA model based on the Newmark model and DL was established and employed in the hardest-hit areas of the 2008 Wenchuan earthquake. The aim is to assist in solving emergency responses for geological disasters after strong earthquakes. The work led to the following conclusions:
- Seismic landslides are the largest secondary hazards after earthquakes. Beichuan was chosen for the study to provide a rapid LSA in similar areas in the future. The seismic landslide susceptibility maps obtained using the methods proposed in this study reveal that the study area exhibits a very high level of landslide susceptibility with a concentrated distribution. The distribution of landslides is mainly influenced by the seismogenic fracture zone, posing a significant threat to human life and property, which requires attention.
- Traditional PGA and Ia contain limited seismic information and fail to fully convey the impact of earthquakes on landslides and may even underestimate the effects. In contrast, Dn can comprehensively convey the mechanical properties of rock–soil mass and the influence of earthquakes.
- It is evident that the improved dual-channel CNN effectively integrates the strengths of both traditional ML and CNNs when compared to traditional ML, providing a new approach for fusing high-level features with multiple predisposing factors in LSA.
- In this paper, a new seismic LSA method is proposed, which can comprehensively take the environmental predisposing factors and the earthquake-related factors into account. Globally, seismic landslides are frequent and have caused enormous damage to people. This method can provide timely and effective support for landslide early warning and landslide risk assessment in post-earthquake disaster areas, thus reducing the losses of people and property.
Author Contributions
Conceptualization, Y.L.; methodology, Y.L., D.M. and Y.C.; software, L.Z.; validation, Y.L.; investigation, Y.L. and Y.C.; resources, D.M.; data curation, L.Z.; writing—original draft preparation, Y.L. and L.Z.; writing—review and editing, Y.L. and Y.N.; supervision, D.M. and Y.N. All authors have read and agreed to the published version of the manuscript.
Funding
This research was funded by the National Key R&D Program of China (2022YFB3903604); China Geological Survey “Landslide monitoring technology and intelligent early warning application demonstration” (DD20211364); the “Deep-time Digital Earth” Science and Technology Leading Talents Team Funds for the Central Universities for the Frontiers Science Center for Deep-time Digital Earth, China University of Geosciences (Beijing) (Fundamental Research Funds for the Central Universities; grant number: 2652023001). These supports are gratefully acknowledged.
Data Availability Statement
Data will be made available upon request.
Conflicts of Interest
The authors declare no conflicts of interest.
References
- Shafique, M. Spatial and Temporal Evolution of Co-Seismic Landslides after the 2005 Kashmir Earthquake. Geomorphology 2020, 362, 107228. [Google Scholar] [CrossRef]
- Shahabi, H.; Ahmadi, R.; Alizadeh, M.; Hashim, M.; Al-Ansari, N.; Shirzadi, A.; Wolf, I.D.; Ariffin, E.H. Landslide Susceptibility Mapping in a Mountainous Area Using Machine Learning Algorithms. Remote Sens. 2023, 15, 3112. [Google Scholar] [CrossRef]
- Zhao, P.; Masoumi, Z.; Kalantari, M.; Aflaki, M.; Mansourian, A. A GIS-Based Landslide Susceptibility Mapping and Variable Importance Analysis Using Artificial Intelligent Training-Based Methods. Remote Sens. 2022, 14, 211. [Google Scholar] [CrossRef]
- Jin, J.; Cui, Y.; Xu, C.; Zheng, J.; Miao, H. Application of Logistic Regression Model for Hazard Assessment of Landslides Caused by the 2012 Yiliang Ms 5.7 Earthquake in Yunnan Province, China. J. Mt. Sci. 2023, 20, 657–669. [Google Scholar] [CrossRef]
- Mosaffaie, J.; Salehpour Jam, A.; Sarfaraz, F. Landslide Risk Assessment Based on Susceptibility and Vulnerability. Environ. Dev. Sustain. 2023, preview. [Google Scholar] [CrossRef]
- Zheng, H.; Liu, B.; Han, S.; Fan, X.; Zou, T.; Zhou, Z.; Gong, H. Research on Landslide Hazard Spatial Prediction Models Based on Deep Neural Networks: A Case Study of Northwest Sichuan, China. Environ. Earth Sci. 2022, 81, 258. [Google Scholar] [CrossRef]
- Karakas, G.; Kocaman, S.; Gokceoglu, C. Multi-Hazard Susceptibility Assessment with Hybrid Machine Learning Methods for Tut Region (Adiyaman, Turkiye). Int. Arch. Photogramm. Remote Sens. Spat. Inf. Sci. 2023, XLVIII-M-1, 529–536. [Google Scholar] [CrossRef]
- Song, Y.; Gong, J.; Gao, S.; Wang, D.; Cui, T.; Li, Y.; Wei, B. Susceptibility Assessment of Earthquake-Induced Landslides Using Bayesian Network: A Case Study in Beichuan, China. Comput. Geosci. 2012, 42, 189–199. [Google Scholar] [CrossRef]
- Li, X.; Xu, W.; Gao, M. Probabilistic Seismic Hazard Analysis Based on Arias Intensity in the North–South Seismic Belt of China. Bull. Seism. Soc. Am. 2022, 112, 1149–1160. [Google Scholar] [CrossRef]
- Newmark, N.M. Effects of Earthquakes on Dams and Embankments. Géotechnique 1965, 15, 139–160. [Google Scholar] [CrossRef]
- Gupta, K.; Satyam, N. Co-Seismic Landslide Hazard Assessment of Uttarakhand State (India) Based on the Modified Newmark Model. J. Asian Earth Sci. X 2022, 8, 100120. [Google Scholar] [CrossRef]
- Jin, K.P.; Yao, L.K.; Cheng, Q.G.; Xing, A.G. Seismic Landslides Hazard Zoning Based on the Modified Newmark Model: A Case Study from the Lushan Earthquake, China. Nat. Hazards 2019, 99, 493–509. [Google Scholar] [CrossRef]
- Shinoda, M.; Miyata, Y.; Kurokawa, U.; Kondo, K. Regional Landslide Susceptibility Following the 2016 Kumamoto Earthquake Using Back-Calculated Geomaterial Strength Parameters. Landslides 2019, 16, 1497–1516. [Google Scholar] [CrossRef]
- Lee, S.; Pradhan, B. Landslide Hazard Mapping at Selangor, Malaysia Using Frequency Ratio and Logistic Regression Models. Landslides 2007, 4, 33–41. [Google Scholar] [CrossRef]
- Shirzadi, A.; Chapi, K.; Shahabi, H.; Solaimani, K.; Kavian, A.; Ahmad, B.B. Rock Fall Susceptibility Assessment along a Mountainous Road: An Evaluation of Bivariate Statistic, Analytical Hierarchy Process and Frequency Ratio. Environ. Earth Sci. 2017, 76, 152. [Google Scholar] [CrossRef]
- Singh, K.; Kumar, V. Hazard Assessment of Landslide Disaster Using Information Value Method and Analytical Hierarchy Process in Highly Tectonic Chamba Region in Bosom of Himalaya. J. Mt. Sci. 2018, 15, 808–824. [Google Scholar] [CrossRef]
- He, Q.; Wang, M.; Liu, K. Rapidly Assessing Earthquake-Induced Landslide Susceptibility on a Global Scale Using Random Forest. Geomorphology 2021, 391, 107889. [Google Scholar] [CrossRef]
- Liu, R.; Li, L.; Pirasteh, S.; Lai, Z.; Yang, X.; Shahabi, H. The Performance Quality of LR, SVM, and RF for Earthquake-Induced Landslides Susceptibility Mapping Incorporating Remote Sensing Imagery. Arab. J. Geosci. 2021, 14, 259. [Google Scholar] [CrossRef]
- Wang, Y.; Duan, H.; Hong, H. A Comparative Study of Composite Kernels for Landslide Susceptibility Mapping: A Case Study in Yongxin County, China. Catena 2019, 183, 104217. [Google Scholar] [CrossRef]
- Yuan, X.; Liu, C.; Nie, R.; Yang, Z.; Li, W.; Dai, X.; Cheng, J.; Zhang, J.; Ma, L.; Fu, X.; et al. A Comparative Analysis of Certainty Factor-Based Machine Learning Methods for Collapse and Landslide Susceptibility Mapping in Wenchuan County, China. Remote Sens. 2022, 14, 3259. [Google Scholar] [CrossRef]
- Castro-Miguel, R.; Legorreta-Paulín, G.; Bonifaz-Alfonzo, R.; Aceves-Quesada, J.F.; Castillo-Santiago, M.Á. Modeling Spatial Landslide Susceptibility in Volcanic Terrains through Continuous Neighborhood Spatial Analysis and Multiple Logistic Regression in La Ciénega Watershed, Nevado de Toluca, Mexico. Nat. Hazards 2022, 113, 767–788. [Google Scholar] [CrossRef]
- Jin, J.; Chen, G.; Meng, X.; Zhang, Y.; Shi, W.; Li, Y.; Yang, Y.; Jiang, W. Prediction of River Damming Susceptibility by Landslides Based on a Logistic Regression Model and InSAR Techniques: A Case Study of the Bailong River Basin, China. Eng. Geol. 2022, 299, 106562. [Google Scholar] [CrossRef]
- Chen, C.; Shen, Z.; Weng, Y.; You, S.; Lin, J.; Li, S.; Wang, K. Modeling Landslide Susceptibility in Forest-Covered Areas in Lin’an, China, Using Logistical Regression, a Decision Tree, and Random Forests. Remote Sens. 2023, 15, 4378. [Google Scholar] [CrossRef]
- Mandal, K.; Saha, S.; Mandal, S. Applying Deep Learning and Benchmark Machine Learning Algorithms for Landslide Susceptibility Modelling in Rorachu River Basin of Sikkim Himalaya, India. Geosci. Front. 2021, 12, 101203. [Google Scholar] [CrossRef]
- Chen, Y.; Ming, D.; Ling, X.; Lv, X.; Zhou, C. Landslide Susceptibility Mapping Using Feature Fusion-Based CPCNN-ML in Lantau Island, Hong Kong. IEEE J. Sel. Top. Appl. Earth Obs. Remote Sens. 2021, 14, 3625–3639. [Google Scholar] [CrossRef]
- Jiang, Z.; Wang, M.; Liu, K. Comparisons of Convolutional Neural Network and Other Machine Learning Methods in Landslide Susceptibility Assessment: A Case Study in Pingwu. Remote Sens. 2023, 15, 798. [Google Scholar] [CrossRef]
- Xi, C.; Han, M.; Hu, X.; Liu, B.; He, K.; Luo, G.; Cao, X. Effectiveness of Newmark-Based Sampling Strategy for Coseismic Landslide Susceptibility Mapping Using Deep Learning, Support Vector Machine, and Logistic Regression. Bull. Eng. Geol. Environ. 2022, 81, 174. [Google Scholar] [CrossRef]
- Wang, Y.; Song, C.; Lin, Q.; Li, J. Occurrence Probability Assessment of Earthquake-Triggered Landslides with Newmark Displacement Values and Logistic Regression: The Wenchuan Earthquake, China. Geomorphology 2016, 258, 108–119. [Google Scholar] [CrossRef]
- GB/T 50218-2014; Ministry of Water Resources of the People’s Republic of China (2014) Standard for Engineering Classification of Rock Masses. Standards Press of China: Beijing, China, 2014. (In Chinese)
- Wang, T.; Wu, S.; Shi, J.; Xin, P. Case Study on Rapid Assessment of Regional Seismic Landslide Hazard Based on Simplified Newmark Displacement Model: Wenchuan MS 8.0 Earthquake. J. Eng. Geol. 2013, 21, 16–24. (In Chinese) [Google Scholar] [CrossRef]
- Jibson, R.W. Regression Models for Estimating Coseismic Landslide Displacement. Eng. Geol. 2007, 91, 209–218. [Google Scholar] [CrossRef]
- Arias, A. Measure of Earthquake Intensity. In Seismic Design for Nuclear Power Plants; Hansen Robert, J., Ed.; Massachusetts Institute of Technology Press: Cambridge, MA, USA, 1970; pp. 438–483. [Google Scholar]
- Wang, X.; Nie, G.; Ma, M. Evaluation Model of Landslide Hazards Induced by the 2008 Wenchuan Earthquake Using Strong Motion Data. Earthq. Sci. 2011, 24, 311–319. [Google Scholar] [CrossRef][Green Version]
- Pham, B.T.; Nguyen-Thoi, T.; Qi, C.; Phong, T.V.; Dou, J.; Ho, L.S.; Le, H.V.; Prakash, I. Coupling RBF Neural Network with Ensemble Learning Techniques for Landslide Susceptibility Mapping. Catena 2020, 195, 104805. [Google Scholar] [CrossRef]
- Xu, C.; Xu, X.; Yao, X.; Dai, F. Three (Nearly) Complete Inventories of Landslides Triggered by the May 12, 2008 Wenchuan Mw 7.9 Earthquake of China and Their Spatial Distribution Statistical Analysis. Landslides 2014, 11, 441–461. [Google Scholar] [CrossRef]
- Bui, D.T.; Tsangaratos, P.; Nguyen, V.-T.; Liem, N.V.; Trinh, P.T. Comparing the Prediction Performance of a Deep Learning Neural Network Model with Conventional Machine Learning Models in Landslide Susceptibility Assessment. Catena 2020, 188, 104426. [Google Scholar] [CrossRef]
- Panahi, M.; Gayen, A.; Pourghasemi, H.R.; Rezaie, F.; Lee, S. Spatial Prediction of Landslide Susceptibility Using Hybrid Support Vector Regression (SVR) and the Adaptive Neuro-Fuzzy Inference System (ANFIS) with Various Metaheuristic Algorithms. Sci. Total Environ. 2020, 741, 139937. [Google Scholar] [CrossRef]
- Thi Ngo, P.T.; Panahi, M.; Khosravi, K.; Ghorbanzadeh, O.; Kariminejad, N.; Cerda, A.; Lee, S. Evaluation of Deep Learning Algorithms for National Scale Landslide Susceptibility Mapping of Iran. Geosci. Front. 2021, 12, 505–519. [Google Scholar] [CrossRef]
- Xie, J.; Wen, Z.; Gao, M. Characteristics of near-fault vertical and horizontal ground motion from the 2008 Wenchuan earthquake. Chin. J. Ceophysics 2008, 53, 1796–1805. (In Chinese) [Google Scholar]
- Zhang, T.; Zhou, X.P.; Liu, X.F. Reliability Analysis of Slopes Using the Improved Stochastic Response Surface Methods with Multicollinearity. Eng. Geol. 2020, 271, 105617. [Google Scholar] [CrossRef]
- Yuan, R.; Deng, Q.; Cunningham, D.; Han, Z.; Zhang, D.; Zhang, B. Newmark Displacement Model for Landslides Induced by the 2013 Ms 7.0 Lushan Earthquake, China. Front. Earth Sci. 2016, 10, 740–750. [Google Scholar] [CrossRef]
- Gupta, K.; Satyam, N.; Gupta, V. Probabilistic Physical Modelling and Prediction of Regional Seismic Landslide Hazard in Uttarakhand State (India). Landslides 2023, 20, 901–912. [Google Scholar] [CrossRef]
- Peng, D.; Yueren, X.; Qinjian, T.; Weiheng, Z.; Shuang, L. The Spatial Distribution and Attribute Parameter Statistics of Landslides Triggered by the May 12th 2008 MW7. 9 Wenchuan Earthquake. Inst. Geol. China Earthq. Adm. 2020, 34, 29–49. [Google Scholar]
Disclaimer/Publisher’s Note: The statements, opinions and data contained in all publications are solely those of the individual author(s) and contributor(s) and not of MDPI and/or the editor(s). MDPI and/or the editor(s) disclaim responsibility for any injury to people or property resulting from any ideas, methods, instructions or products referred to in the content. |
© 2024 by the authors. Licensee MDPI, Basel, Switzerland. This article is an open access article distributed under the terms and conditions of the Creative Commons Attribution (CC BY) license (https://creativecommons.org/licenses/by/4.0/).