Article

A Multi-Feature Fusion-Based Method for Crater Extraction of Airport Runways in Remote-Sensing Images

School of Mechatronical Engineering, Beijing Institute of Technology, Beijing 100081, China
*
Author to whom correspondence should be addressed.
Remote Sens. 2024, 16(3), 573; https://doi.org/10.3390/rs16030573
Submission received: 6 December 2023 / Revised: 25 January 2024 / Accepted: 30 January 2024 / Published: 2 February 2024

Abstract

:
Due to the influence of the complex background of airports and damaged areas of the runway, the existing runway extraction methods do not perform well. Furthermore, the accurate crater extraction of airport runways plays a vital role in the military fields, but there are few related studies on this topic. To solve these problems, this paper proposes an effective method for the crater extraction of runways, which mainly consists of two stages: airport runway extraction and runway crater extraction. For the previous stage, we first apply corner detection and screening strategies to runway extraction based on multiple features of the runway, such as high brightness, regional texture similarity, and shape of the runway to improve the completeness of runway extraction. In addition, the proposed method can automatically realize the complete extraction of runways with different degrees of damage. For the latter stage, the craters of the runway can be extracted by calculating the edge gradient amplitude and grayscale distribution standard deviation of the candidate areas within the runway extraction results. In four typical remote-sensing images and four post-damage remote-sensing images, the average integrity of the runway extraction reaches more than 90%. The comparative experiment results show that the extraction effect and running speed of our method are both better than those of state-of-the-art methods. In addition, the final experimental results of crater extraction show that the proposed method can effectively extract craters of airport runways, and the extraction precision and recall both reach more than 80%. Overall, our research is of great significance to the damage assessment of airport runways based on remote-sensing images in the military fields.

1. Introduction

As an important support for the Air Force to carry out air strike missions, the airport is the primary target of military strikes. Over the years, extensive research has been carried out on the damage to airport runways caused by various weapons [1,2]. A blockade is an important sign of the destruction of an airport runway and the crater size on the surface of the runway is an important factor that affects the probability of blockade [3]. With the development of remote-sensing image processing, the damage information obtained from remote-sensing images improves the convenience of damage assessment [4,5].
In recent years, many scholars have carried out research on object detection and extraction based on remote-sensing images [6,7,8]. At the same time, airport runway extraction has gained increasing attention in remote-sensing image processing, because airport runway information accurately extracted from remote-sensing images is very useful for airport planning [9,10], airplane extraction [11], foreign object debris detection [12,13] and military applications (such as reconnaissance) [14]. Also, extracting airport runway information from remote-sensing data is helpful for extracting craters in the runway and the subsequent battle damage assessment. However, due to the influence of crater distribution, explosion dust coverage, ablation and other factors, the airport runway has incomplete characteristics; auxiliary features such as chevron markings at both ends of the runway are missing or unclear, the long line segment feature on the edge of the runway is missing, etc. All these factors bring challenges to the complete extraction of runways, and then make it difficult to extract craters inside the runway. Therefore, the complete extraction of damaged airport runways and the accurate extraction of craters inside runways are important prerequisites for assessing the functional damage effect of airport runways.
On the one hand, with the development of remote-sensing image processing, some scholars have recently conducted relevant research on airport runway extraction based on remote-sensing images. This paper roughly divides the research on runway extraction into two categories: based on the basic characteristics of airport runways such as runway markings [15], long line segment feature [16,17,18], texture feature [14,19], grayscale distribution characteristics [20,21], etc.; and based on deep learning methods [22,23,24,25,26]. Generally, the former method is relatively widely used, but the current method relies more on the high resolution of the image and the integrity of the runway. For example, based on high-resolution remote-sensing images, the author [15] positioned the runway through accurate detection of chevron markings at both ends of the runway, and used the minimum envelope rectangle of the straight line detection results as the final runway extraction result. The author [17] used the long line segment feature at the edge of the runway to initialize, constructed an energy functional function based on the gray level difference between the inner and outer areas of the runway, and approached the target edge to achieve a complete segmentation and extraction of the target area. These current methods make it difficult to achieve a complete and effective extraction of the damaged runway area. In recent years, deep learning methods have been widely used in the field of target detection and segmentation, and the accuracy has been greatly improved. However, due to the lack of a large number of public datasets, particularly the lack of airport runway datasets after damage, the further development of deep learning methods has been limited in the field of runway extraction.
On the other hand, research related to crater extraction from remote-sensing images mainly focuses on two fields: unexploded ordnances estimation [27,28,29,30,31,32,33,34] and meteor crater detection [35,36,37,38,39,40,41,42,43,44]. The methods used in the former field mainly include supervised learning methods [27,28,29,30,31] and active detection methods based on marked point processing [32,33], circular features [34], etc. The methods used in the field of meteor crater detection are divided into two categories: based on the basic characteristics of craters such as circular features [35,36,37], shadow-illuminated region features [38,39], etc.; and based on deep learning methods [40,41,42,43,44]. Generally, the feature-based active detection methods rely more on the shape characteristics of craters. For example, the author [32] used circles to represent the crater model, which was then embedded in the framework of marked point processes. By means of stochastic sampling, the most likely configuration of craters is determined. Based on circular features, author [34] and author [35] used edge constraints and chord midpoint Hough transform for circle detection to identify craters, respectively. However, due to the interference of small dark areas in the background and craters outside the runway, it is still difficult for the above methods to directly extract craters inside airport runways from RS images. As for the deep learning methods, due to the lack of a large amount of post-damage remote-sensing images of airport runways, their application in the field of crater detection is limited.
Therefore, to accurately extract craters inside runways, the main contributions and ideas of this paper can be summarized as follows: (1) We propose an accurate runway extraction method based on multiple techniques, such as line segment detection, runway edge line segment grouping, runway edge corner detection, runway endpoints screening, runway vertexes calculation, etc. (2) Compared with existing methods, the runway extraction method proposed in this paper has the advantage of running time while achieving complete extraction of runways. (3) Based on the runway extraction results, an effective crater extraction model is designed to extract craters inside runways. Eventually, four remote-sensing images with different runway structures and four post-damage remote-sensing images were selected to verify the effectiveness of the runway extraction method, and two of the post-damage images were selected to verify the final effectiveness of the proposed craters extraction method.
The rest of the article is organized as follows. In Section 2, the proposed method in this article is introduced in detail, including runway extraction and crater extraction. In Section 3, we introduce the datasets and evaluation metrics used in experiments and show the experimental results of our method and the comparison with state-of-the-art methods. In Section 4, we discuss the key and difficult points of the proposed method in this paper. In Section 5, we summarize the work of this paper.

2. Methodology

2.1. Runway Extraction

As the most important part of the proposed method in this paper, the contents of runway extraction mainly include region of interest extraction, feature extraction, and candidate runway recognition. The main purpose of the feature extraction module is to obtain the pairs of parallel line segments and the endpoints of the runway. In order to extract airport runways in images with complex runway structures more completely and accurately, we also adopt the parallel line segment grouping strategy in this paper. The flowchart of the proposed runway extraction method is shown in Figure 1.

2.1.1. Region of Interest Extraction

Affected by the complex background, there will be a large number of interfering short line segments, which will make it difficult to locate the center axis of the runway and then affect subsequent runway extraction. To reduce the interference of complex backgrounds, the region of interest containing the runway is first extracted before feature extraction. Specifically, the adaptive threshold fuzzy enhancement algorithm designed in our previous work [45] is used to process the image to enhance the contrast between the runway area and the background, and then the Otsu threshold segmentation method is used to complete the extraction of the region of interest containing the runway.

2.1.2. Feature Extraction

The main purpose of this part is to extract edge parallel line segment pairs and endpoint coordinates of the runway. Feature extraction mainly consists of three stages: (1) establishment of feature extraction model, (2) extraction of runway edge parallel line segment pairs, and (3) extraction of runway endpoints. The implementation process of feature extraction designed in this section is shown in Figure 2.
  • Model of the feature extraction
First, we use the classic Canny [46] edge detection operator with an adaptive threshold to extract edge points from the region of interest, and then extract the continuous edge contours based on the 8-neighbor boundary tracking algorithm from the edge map. Then, we use a Gaussian filter to smooth the curves to reduce the interference of image quantization and noise on the calculation of curvature. After the operation of the filter, the geometric features of continuous edges will be enhanced. Then, the short edges whose lengths are shorter than the given threshold are removed to reduce the interference of the background. Hence, the continuous contour can be presented as C = c m : ( u i , v i ) , m = 1 , 2 , n , and the curvature can be calculated as follows:
κ ( s ) = u ˙ i v ¨ i u ¨ i v ˙ i u ˙ i 2 + v ˙ i 2 3 / 2
where u i , v i respectively, represent the horizontal and vertical coordinates of the i-th pixel on the continuous contour. To simplify the calculation of the curvature, the derivative in Equation (1) can be approximated in the form of an intermediate difference. The form of intermediate difference can be expressed as:
u ˙ i = ( u i + 1 u i ) + ( u i u i 1 ) 2 = u i + 1 u i 1 2 v ˙ i = ( v i + 1 v i ) + ( v i v i 1 ) 2 = v i + 1 v i 1 2 u ¨ i = u ˙ i + 1 u ˙ i 1 2 = u i + 2 2 u i + u i 2 4 v ¨ i = v ˙ i + 1 v ˙ i 1 2 = v i + 2 2 v i + v i 2 4
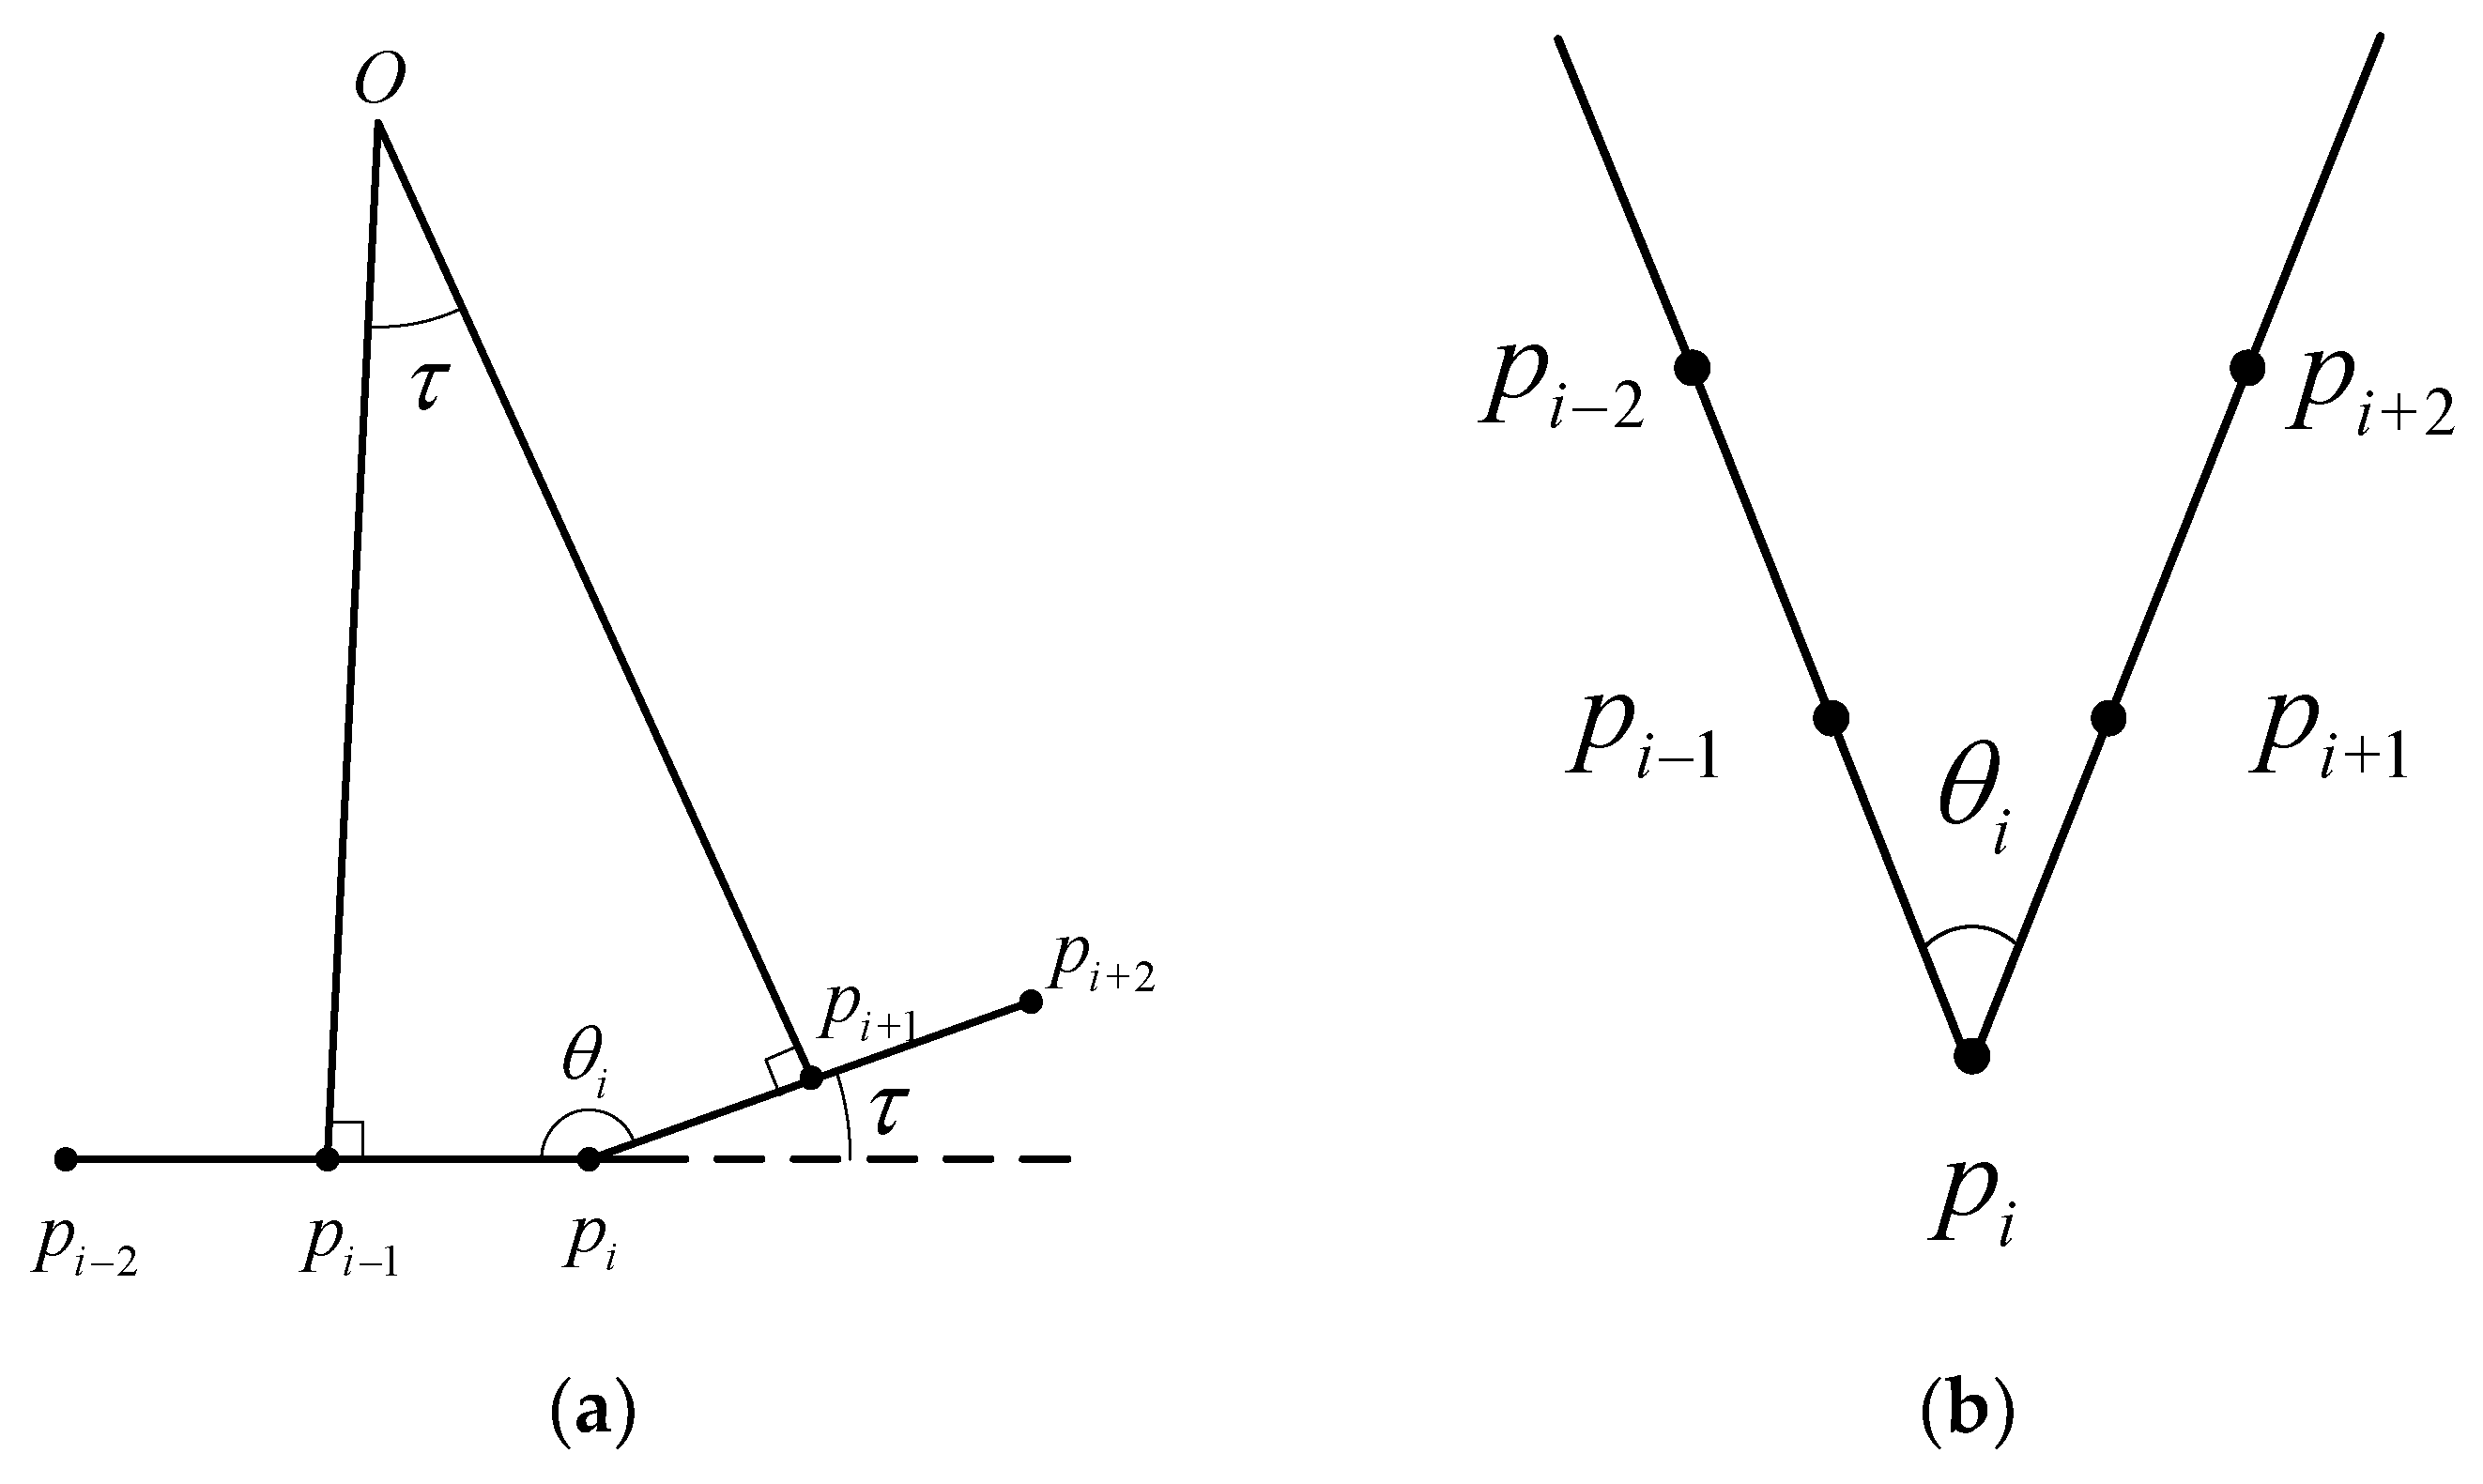
After the calculation of the edge pixel’s curvature, our aim is to extract the sets of line segments and the sets of corner points, respectively. Theoretically, the geometric characteristics of a straight line with zero curvature can be used to identify and extract straight line segments in continuous edges. However, due to the interference of digital image quantization and noise, the actual curvature value of the edge straight line segment after Gaussian smoothing will be greater than zero. And for corner extraction, a point with a local curvature maximum in a continuous edge is regarded as a corner. Thus, the key to this part is how to determine the curvature threshold of straight lines and corner points. Referring to the algorithm proposed by the author [47], we establish the functional relationship between angles and curvature values based on the intuition of first-order geometric angles (as shown in Figure 3).
The coordinate values of points shown in Figure 3 can be expressed as:
p i 2 = 2 , 2 cot θ i / 2 , p i 1 = 1 , cot θ i / 2 p i = 0 , 0 p i + 1 = 1 , cot θ i / 2 , p i + 2 = 2 , 2 cot θ i / 2
By combining Equations (2) and (3), the relationship between the curvature of the edge point and the included angle of tangent lines can be established. Considering that the curvature value of the edge point is associated with the Gaussian parameter σ and the length L e of the continuous edge contours. The relationship between the curvature and the included angle can be simplified as:
k i = G ( θ i , σ , L e ) = K cot ( θ i / 2 )
where θ i is the included angle of the tangent lines, σ is the Gaussian standard deviation, k i is the curvature value of the edge point, K is the coefficient that is negatively correlated with the parameter L e and σ .
2.
Extraction of runway axis
The first step is to extract the set of edge line segments based on the feature extraction model established in the previous stage. Referring to the algorithm [48] which was used for straight line detection based on the consistency of gradient direction, we obtain the angle threshold based on the angle tolerance τ between the gradient directions of adjacent pixels. The included angle threshold θ l of the tangent lines can be expressed as θ l = π τ (as shown in Figure 3a). Combining with Equation (4), the average curvature threshold T l i n e of a line segment can be obtained, and based on the threshold, we can obtain the set of edge line segments as L = l i : ( u i , v i ) , i = 1 , 2 , n .
Secondly, we need to screen pairs of parallel line segments located on both sides of the runways from the set L . Since the damaged runway is often affected by interference factors such as bomb craters, dust coverage, ablation, and taxiways, the detected line segments are usually fragmented short line segments. Specifically, the line segments corresponding to the long straight edge of the runway are few in number, short in length, and far apart from each other. At the same time, the presence of interference objects such as taxiways, roads, and building roofs around the runway will further increase the number of interference line segments and make it more difficult to screen pairs of parallel line segments [19]. The author proposed a line segment connection algorithm based on multi-feature constraints. This method uses the longest line segment as the seed line segment and traverses all the remaining line segments with the purpose of connecting the fragmented line segments together, and then uses the parallel and the fixed width characteristics of the long straight line segments along the edge of runways to position the runway. However, this algorithm is difficult to effectively connect the edge segments with characteristics of short length and long distance from each other. And it is easy to introduce interference of long line segments outside the runway. Thus, we proposed an improved strategy to detect pairs of parallel line segments along runway edges. This strategy first determines the main direction of the candidate runway based on the parallel and distance constraints between line segment pairs, and updates the parameters of straight line. Then we simplify the line segment connection strategy and only use the vertical distance threshold to determine whether to merge the line segments. At the same time, combined with the differences in regional grayscale distribution on both sides of the line segment, pairs of parallel line segments along runway edges are screened. The proposed strategy does not rely on the long line segment characteristics of the runway edge, and the specific steps of the strategy are described below.
Take the set of straight line segments L obtained in the first step as input, traverse the set and calculate, respectively: (1) the direction angle of each line segment, (2) the vertical distance between pairs of parallel line segments, and (3) the direction from the center point of the straight line segment to the area with higher gray value on both sides of the line segment and the vertical distance between the vertices of the high-brightness area. The goal is to find the set of line segments L B L that satisfy all the above constraints, and the set L B can expressed as follows:
L B = L i L   K , K = { K 1 ,   K 2   a n d   K 3 }
where K represents the set of conditions that must be satisfied for line segment selection, and the constraint conditions of each straight line segment in the condition set K are defined as follows:
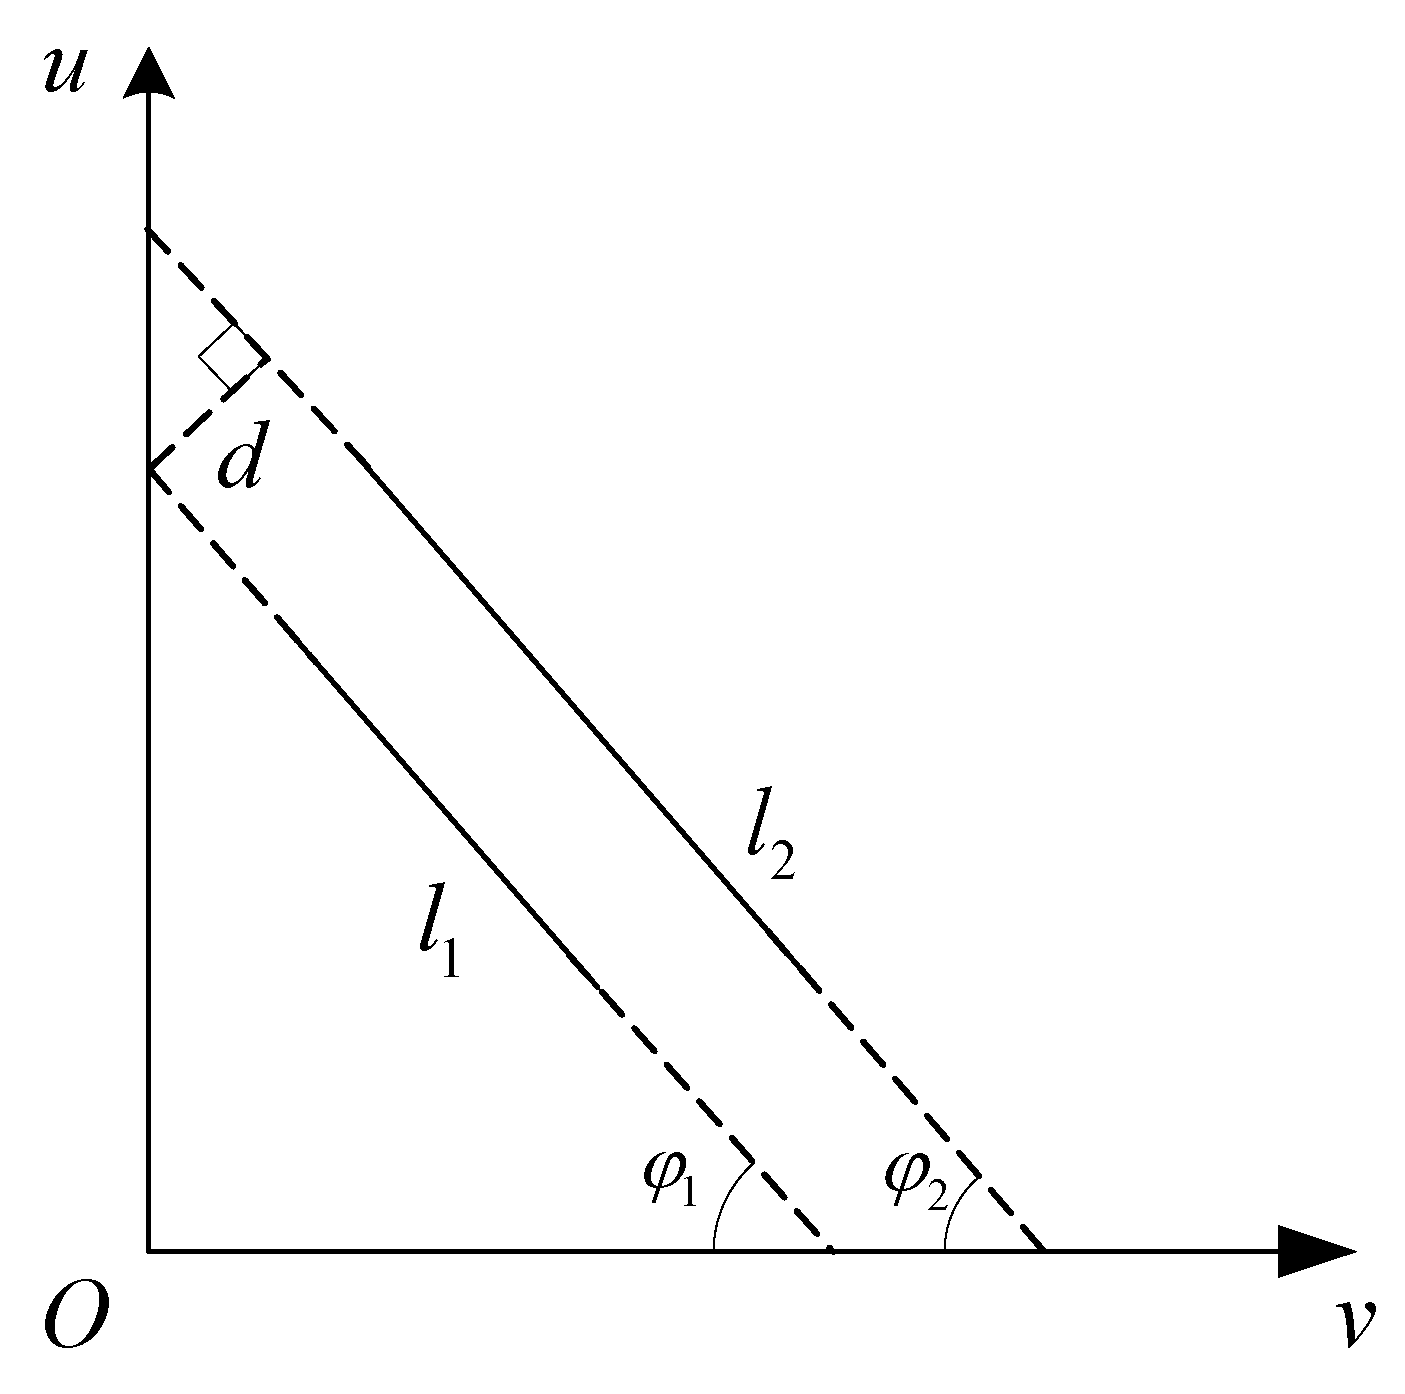
(1) Parallel constraints. First, we fit each line segment in the set L based on the least squares method, and calculate the slope and intercept parameters of each line segment. Then the parallel line segments will be screened by setting the angle difference threshold T φ of line segments (as shown in Figure 4). Referred to the experience of the author [15], we set the threshold parameter to 0.05 radian. If the angle difference between two straight line segments is less than the threshold T φ , the corresponding line segments are regarded as parallel lines, and then we can obtain the set of parallel line segments as:
L 1 = L i , L j L     a b s ( φ i φ j ) T φ
Then, in order to further distinguish multiple runways with different directions in the same image, we group the set L 1 of parallel line segments based on the threshold T φ . Take all the parallel line segments that satisfy the threshold T φ constraint as a group, and calculate the mean angle within each group as the main direction of the airport candidate runway corresponding to the group. Finally, calculate and update the intercept parameters of all straight line segments in each group based on the candidate direction angles.
(2) Distance constraints. Given the vertical distance threshold T c , for line segments whose vertical distance is less than the threshold, we consider them to belong to the same long line segment and merge them. Then calculate and update the intercept parameters of the merged long line segments, eliminate parallel line pairs that do not meet the runway width threshold constraint (the threshold was determined by runway width and image resolution) (as shown in Figure 4), and then we can obtain the set of candidate runway edge parallel line segment pairs as:
L 2 = L i , L j L 1     distance ( L i , L j ) T w
(3) Regional feature constraints. Since the length of line segments was not taken into account when screening parallel line segment pairs in this article, there will be false parallel line segment pairs that do not belong to the runway after the operation of screening based on parallel and distance constraints (as shown in Figure 5). In order to further eliminate the false parallel line segment pairs, we introduce the grayscale difference features of the areas on both sides of the line segment into the screening strategy.
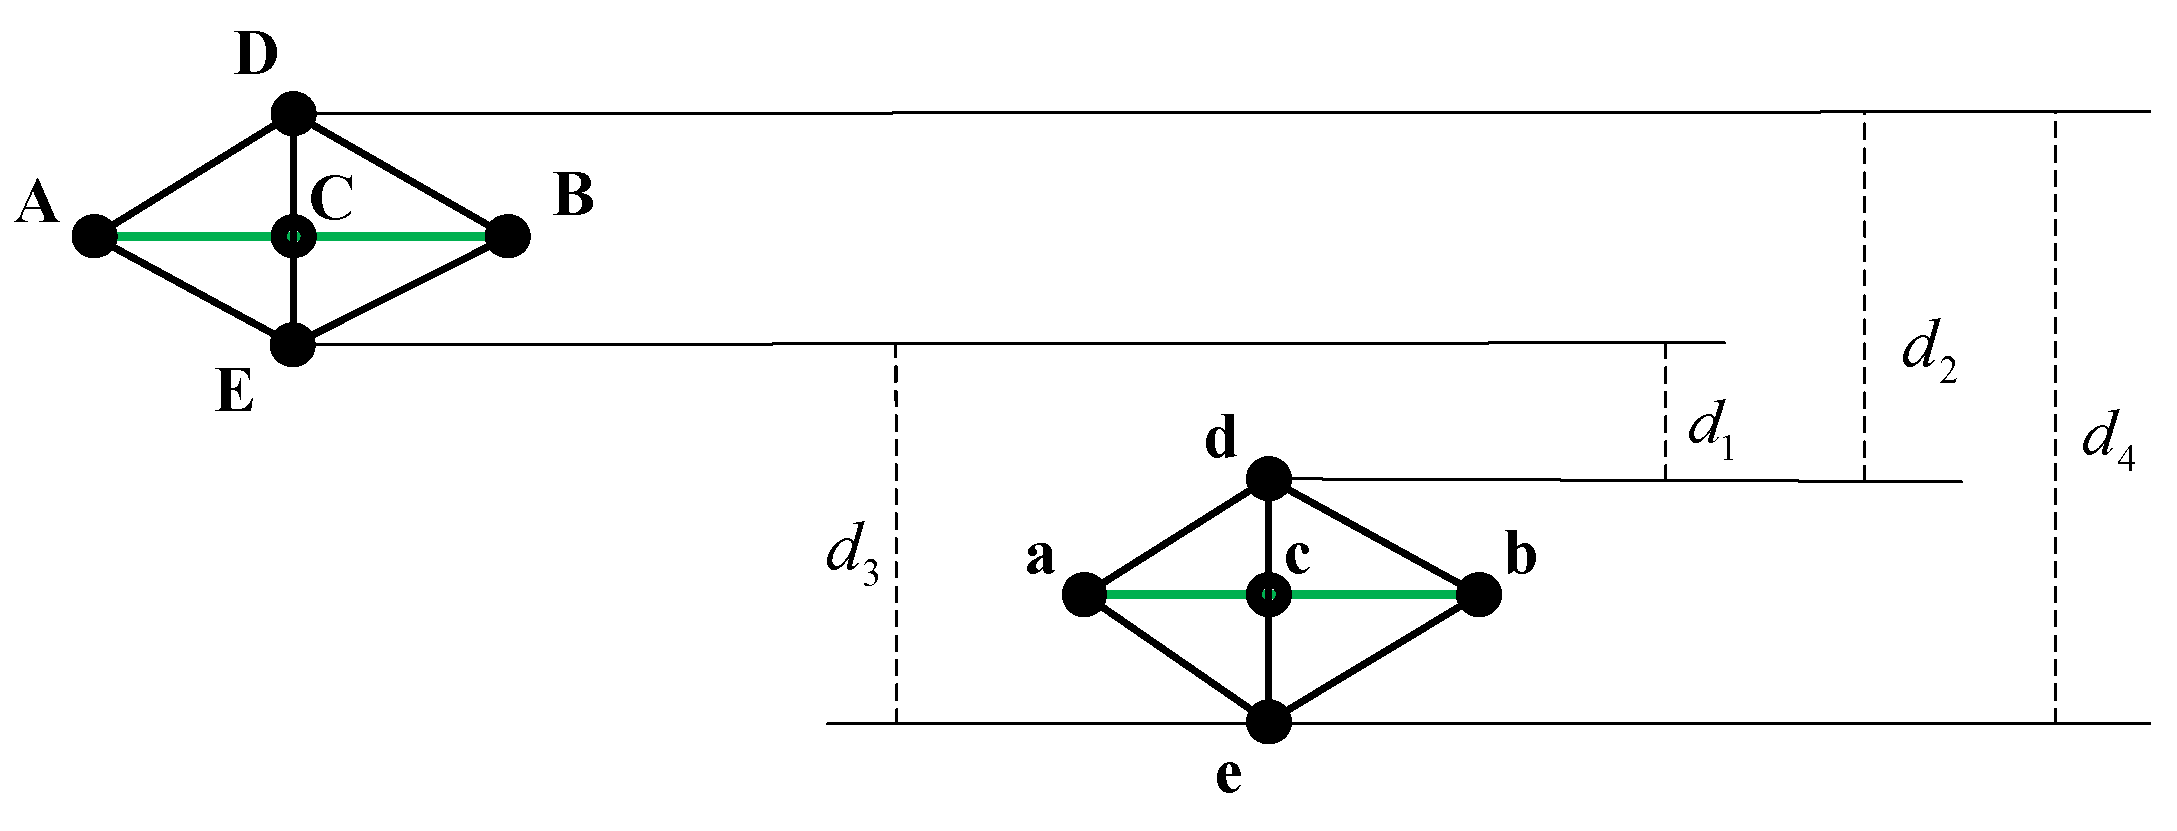
The constraints of regional features take advantage of the high brightness characteristics of the undamaged areas inside the runway, and the significant difference in brightness on both sides of the runway edge. For the parallel line segment pairs obtained after satisfying the parallel and distance constraints (as shown in Figure 6), we construct triangular areas on both sides of each line segment along the normal direction of the line segment and calculate the average gray value of each area on both sides. The side with the larger average gray value is considered to be the internal area of the runway, and the vector from the midpoint of the line segment to the vertex of the triangle is the direction vector A B corresponding to the triangle area. For line segment pairs located on the edge of the runway, the two corresponding direction vectors should have opposite directions, and the vertical distance between the two vertices of the areas on both sides of the line segment should be smaller than the actual width of the runway. The specific description of the constraints is as follows:
(a) Direction vectors. The direction vectors of the parallel line segments on both sides of the runway pointing to the interior of the runway should satisfy that they point in opposite directions(as shown in Figure 6: C E and c d are the direction vectors corresponding to the triangular areas). Then the direction vector C E and c d should satisfy the following formula:
L 31 = L i , L j L 2     C E   ·   c d < 0
(b) Vertex distance. As shown in Figure 6, the direction vectors C D and c e also satisfy the constraint of Equation (8), which cannot effectively eliminate the false pairs of parallel line segments. Thus, we increase the constraint of the vertical distance between the two vertices of the triangular areas inside the runway as follows:
L 32 = L i , L j L 2     d 1 < w i d t h
After the joint constraints of the above steps, the set of parallel line segment pairs located on the continuous edge of the runway can be obtained as L B = L 1 L 2 L 31 L 32 .
Lastly, based on the obtained set of parallel line segment pairs L B , calculate the angle and intercept parameters of the central axes of all candidate runways to achieve the preliminary positioning of the candidate runways. The set of central axes can be expressed as follows:
L c = L i : ( φ i , ρ i ) , i = 1 , 2 , n
where L i is the central axis of a candidate runway, φ i and ρ i is the inclination angle and intercept of the corresponding axis, respectively, n is the total number of candidate runway central axes in the set L c .
3.
Extraction of runway endpoints
The first step is to extract the set of corner points based on the feature extraction model established in the previous stage (as shown in Figure 3b). Generally, the included angle between the neighborhood tangents of the runway vertex is approximately 90 ° . Taking into account the smoothing effect of the Gaussian function and the impact of damaged areas such as craters on continuous edges of the runway, the maximum included angle threshold θ c between the neighborhood tangents of the corner point can be selected in the range of 90 ° 120 ° . Then we can calculate the curvature threshold according to Equation (4) and the set of corner points can be obtained as P = p i : ( u i , v i ) , i = 1 , 2 , n .
Secondly, we need to screen the endpoints of runways from the set of corner points P . However, due to the influence of the complex background, there are a large number of interfering corner points located at non-runway edges in the corner points set, which increases the difficulty of screening the runway endpoints. Regarding corner point screening, the author [49] proposed a roof contour extraction method based on corner point detection and screening. This method first used the Harris corner detection algorithm to detect the global corners, and then the set of corner points located at the edge of the roof was filtered out based on the color space characteristics of the roof. Inspired by the method [49], we first screen the set of corners located at the edge of the runway based on the grayscale distribution characteristics and the geometric structure characteristics of the runway, and then the corner points located at both ends of the runway’s central axis are the endpoints of the runway. The specific steps of the strategy are described below.
Take the set of corner points P obtained in the first step as input, traverse the set and calculate, respectively: (1) the vertical distance from each corner point to the central axis; (2) the grayscale statistical characteristics of the areas on both sides of the edge where each corner point is located; (3) the direction from the edge corner point to the high-brightness area on both sides of the edge. The purpose is to find the set of corner point coordinates that satisfies all the above constraints, which can be defined as follows:
P B = P i P   K , K = { K 1 ,   K 2   a n d   K 3 }
where K represents the set of conditions that must be satisfied for corner point selection, and the constraint conditions of each corner point in the condition set K are defined as follows:
(1) Distance constraints. Traverse the set of corner points P , and calculate the vertical distance d from each corner point to the central axis of the candidate runway. Then use half the width of the runway as the distance threshold T d i s t = w i d t h / 2 , and filter out the set of candidate corner points located on both sides of the candidate runway’s central axis, which can be expressed as follows:
P 1 = P i P     d T d i s t
(2) Regional feature constraints. First, we select the inner and outer areas of the runway along the tangent direction of the corner point, and the areas are represented by circular areas (as shown in Figure 7a) in order to reduce the interference of the damaged area on the regional characteristics. Based on the high brightness characteristics of the undamaged area of the runway, we believe that the area with the maximum gray mean value in the corner neighborhood is the inner area of the runway, and the opposite area is the corresponding outer area. To simplify the calculations, we take the candidate corner point as the center and R as the distance to select 8-neighborhood pixel coordinate points, and then take these 8-neighborhood pixel coordinate points as the center of the circle to construct circular areas, respectively (as shown in Figure 7c). Among these eight circular areas, the area with the largest grayscale average value is considered to be the inner area of the runway (as shown in Figure 7b), and the area in the opposite direction is considered to be the outer area of the runway. After the selection of the inner and outer areas of the runway, we will further screen the corner points based on the regional characteristics.
According to the regional texture similarity of the runway [19], we need to select a circular area T inside the runway as the reference template area. To obtain the template, slide along the central axis of the candidate runway, and select the reference template area based on the maximum gray value of the circular area. Then, traverse the set of corner points P 1 and make a normalized cross-correlation operation between region T and region B (as shown in Figure 7b). The calculation of the normalized cross-correlation coefficient is as follows:
N C C = x y ( T ( x , y ) T ¯ ( x , y ) ) ( R ( x + m , y + n ) R ¯ ( x + m , y + n ) ) / x y ( T ( x , y ) T ¯ ( x , y ) ) 2 x y ( R ( x + m , y + n ) R ¯ ( x + m , y + n ) ) 2
where T ( x , y ) and R ( x , y ) represent the gray level at a pixel in the template region T and the region B around the corner point, respectively, and T ¯ ( x , y ) represent the corresponding mean gray value of the region around the corner point, R ¯ ( x , y ) represent the mean gray value of the template region. Given the correlation coefficient threshold T c o e f , eliminate corner points whose correlation coefficient is less than the threshold, and then the set of corner points that satisfy the threshold constraint can be obtained as follows:
P 21 = P i P 1     N C C T c o e f
Generally, there is an obvious grayscale difference between the inner and outer areas of the runway, and the runway area has significant high-brightness characteristics in the image. Thus, for each corner point, we also set the grayscale difference threshold T d i f f between the inner and outer areas of the runway and the grayscale threshold T g r a y of the inner area of the runway while screening through regional similarity to screen the corner points at the edge of the runway. Then the set of corner points that satisfy the threshold constraints can be obtained as follows:
P 22 = P i P 1     G i n ( x , y ) / G o u t ( x , y ) T d i f f   &   G i n ( x , y ) T g r a y
(3) Orientation constraints. After the screening operation of the above steps, there will still be wrong corner points that satisfy the above constraints. As shown in Figure 7b: O 1 is a correct corner point located at the edge of the runway with the region B 1 inside the runway, O 2 is a wrong corner point with the region B 2 actually located outside the runway, the vector O T represents the direction vector from the corner point to the center of the template area, and the vector O B represents the direction vector from the corner point to the center of the region B . Theoretically, if the corner point is located at the edge of the runway, the angle between vector O T and vector O B should be less than 90°. Based on the constraint of the orientation, the set of corner points can be obtained as follows:
P 3 = P i P 2     O B   ·   O T < 0
After the joint constraints of the above steps, the set of corner points located at the continuous edge of the runway can be obtained as P B = P 1 P 21 P 22 P 3 , and the coordinate points at both ends of the central axis in the set P B are used as the reference points at both ends of the runway. Then, combined with the parameters of the runway central axis, the endpoints of the runway can be calculated and represented as P l and P r .

2.1.3. Generate and Recognition of the Candidate Runway Extraction Results

In the previous section, we can finally obtain the central axis parameters and endpoint coordinates of the candidate runway, respectively (as shown in Figure 2). By combining the central axis parameters { θ , ρ } and the endpoint coordinates, we can calculate and obtain the four vertex coordinates of the candidate runway (the width of the runway is used as prior information). Then, we connect the vertices belonging to the same candidate runway in sequence and fill the closed area to achieve the extraction of the runway area. After screening the pairs of parallel line segments above, there will be incorrect pairs of parallel line segments due to the influence of interference objects such as roofs and roads outside the runway, which will lead to the existence of false results in the final results of runway extraction. Based on the geometric structure characteristics and regional high brightness characteristics of the runway, we are going to eliminate the false results by imposing length constraints and rectangularity constraints on candidate runways: (1) Generally, the runway length is 800–4000 m [15] and the length of the candidate runway can be calculated as L = ( P l ( x ) P r ( x ) ) 2 + ( P l ( y ) P r ( y ) ) 2 based on the coordinates of the runway endpoints P l and P r . Then, we can eliminate the candidate runways whose length L exceeds the interval. (2) On the other hand, we define the index of rectangularity as R = S 1 / S 2 , where S 1 denote the intersection area of the rectangular area of the candidate runway extraction result and ROI and S 2 denote the rectangular area of the candidate runway, and the value range of the rectangularity index is [0, 1]. Here, we set the threshold of the rectangularity index as T R = 0.5 and eliminate the candidate’s runways whose rectangularity index is less than the threshold. Then, we can obtain the final runway extraction results.

2.2. Crater Extraction

The bomb crater area often appears as a small dark area in the image, and has obvious edge transition characteristics. Thus, we design a crater extraction model to extract the crater areas inside the runway based on the runway extraction results.
Firstly, we use the blob detector (providing the center coordinates and the size of the blob) designed by the author [50] to generate the initial set of candidate regions for the crater, which can be expressed as R : r e g i o n s . The blob detector can be applied to bomb craters of any size and images of any scale as long as the parameters of the blob detector are chosen appropriately. Next, to filter out the real crater areas from the set of candidate areas, we establish a crater detection model by utilizing the characteristics of the grayscale distribution consistency and edge high gradient amplitude of the bomb crater area, and set the corresponding threshold T C r a t e r . The model can be expressed as follows:
C = f g 1 n i = 1 n E d g e p i + f h max 0 , H t 1 N o = 1 N p o μ
where E d g e p i represents the magnitude of the gradient amplitude component pointing toward the center direction at the edge pixel of the current candidate crater area, n represents the total number of pixels involved in the calculation of a single crater edge, p o represents the gray value of a certain pixel in the current candidate crater area, μ represents the grayscale mean value of all pixels in the candidate crater area, N represents the total number of pixels in the candidate crater area, f g and f h represents the weighted factor coefficients of the corresponding items in the model, respectively, H t ensures that the second term of the model has a maximum value in the crater area.
After the extraction of the bomb craters through the model, we need to determine whether the craters were correctly extracted. Given the input post-damage image I , x i , y i denote the center coordinates of the crater extracted by the proposed method, where x i represents the column coordinates in the image, and y i represents the row coordinates in the image. Let r i represent the radius of the extracted crater. x ^ i , y ^ i denote the center coordinates of the ground-truth crater, where x i and y i represents the column coordinates and row coordinates in the image, respectively. Let r ^ i represents the radius corresponding to the ground-truth crater. The constraints are defined as follows:
x i x ^ i 2 + y i y ^ i 2 / min r i , r ^ i α x , y a b s r i r ^ / min r i , r ^ i α r
where α x , y denote the error threshold of the position, and α r denote the radius error threshold. If Equation (18) is satisfied, the craters are considered as correct craters.
Finally, taking the envelope rectangle of the crater areas detected above as input, we use the classic active contour algorithm [51] to achieve precise extraction of the crater areas.

3. Results

In this study, all the experiments were performed in MATLAB 2021b under the Windows 10 operating system, and the configuration of the computer was Intel Core I7-8750H CPU @2.20GHz 16GB RAM. In order to verify the effectiveness of the method proposed in this paper, we divide the experiment into two parts: Experiment I and Experiment II. The experiment I mainly focuses on the effectiveness of the runway extraction method proposed in this paper. We conduct experimental analysis on the accuracy of runway extraction and the calculation time of the runway extraction algorithm, and compare the runway extraction method with typical representative methods [15,17]. Experiment II mainly focuses on the effect of our method on extracting craters inside the runway, and we verify the effectiveness of this method on post-damage test images.

3.1. Datasets and Parameters

In this study, we selected four typical satellite images #1~#4 downloaded from Google Earth, and four post-damage satellite images #5~#8 with different degrees of damage from the Internet, respectively (as shown in Figure 8). All eight images formed the test dataset to verify the effectiveness of the airport runway extraction method, and the proposed crater extraction method was then verified on two typical post-damage images. The image size used in each airport image and the parameters used for corner screening are shown in Table 1, and the corresponding spatial resolution of each image is approximately between 2~5 m. For all the test images used in the article, our method only processes the corresponding grayscale image.
In the dataset downloaded from Google Earth, the airports of #2 and #4 are military airports and the rest airports are civil airports. At the same time, an important reason why we select these test data is to comprehensively consider the diversity of geographical backgrounds, such as roads, buildings, and so on; the complexity of the runway structure, such as multiple parallel runways (#1–3), V-shaped runway (#4), X-shaped runway (#3); and the incompleteness of runways in the post-damage images (#5–8), such as the distribution of craters inside the runway, the coverage of large ablation areas, and so on. There will be erroneous extractions, missed extractions or incomplete extraction of airport runways because there are interferences from factors such as background objects that are similar to the runway in shape features, missing features in the damaged runway area, and so on. For crater extraction inside runways, two typical post-damage images were selected for the experiments.
In the module of runway extraction, the similarity threshold Th1 and the grayscale threshold Th2 and Th3 jointly determine the accuracy of edge corner detection, and the accuracy of subsequent endpoint screening. Generally, a larger value of Th1 may result in missed detection of edge corners. Considering that the regional texture similarity of the runway will be reduced due to the factors of damage and in some other airports, the center area of the runway is significantly worn due to the impact of aircraft takeoff and landing, which will also reduce the regional texture similarity of runways. Therefore, in order to more accurately screen the corner points located on the edge of the runway, the value of Th1 is not less than 0.2. For the gray threshold Th2, since the overall brightness of the damaged runway area will be relatively weakened, we set the gray threshold for the undamaged runways to 0.6 and the gray threshold for the damaged runways to 0.5. At the same time, considering that there are obvious differences in grayscale between the inner and outer areas of the runway, the characteristic of which can be used to screen the edge corners of the runway, we set the threshold Th3 to 1.3 in this paper. By combining the above three thresholds, the set of corner points located at the edge of the runway can be effectively detected. In the module of crater extraction, in order to highlight the high gradient amplitude characteristics of the crater edge, we set the parameter n representing the total number of pixels involved in the calculation of a single crater edge to 12. The purpose of the parameter H t is to ensure that the model has a maximum value when a crater is detected and it is set to 20 in this paper. In the same runway, the characteristics of craters after strikes are relatively consistent, so in this paper, we set the threshold T C r a t e r to 50. According to whether the detection value of the model is greater than the given threshold, the craters can be effectively extracted.

3.2. Evaluation Metrics

For the part of runway extraction, we use three quantitative indicators of correctness, completeness, and overall quality to evaluate the performance of the proposed runway extraction method. At the same time, we also compared the results of our method with the state-of-the-art methods. The quantitative indicators are defined as follows [15]:
C o r r e c t n e s s = T P / T P + F P
C o m p l e t n e s s = T P / T P + F N
O v e r a l l   Q u a l i t y = T P / T P + F P + F N
where T P represents the total number of correctly extracted pixels of the runway, F P represents the total number of wrongly extracted pixels, F N represents the total number of pixels of the runway that were not successfully extracted.
For the part of crater extraction, we use the indicators of precision ( P ), recall ( R ) and F-score to evaluate the performance of the proposed crater extraction method, and the indicators can be calculated as follows [41]:
P r e c i s i o n = T p / T p + F p
R e c a l l = T p / T p + F n
F 1 = 2 × P × R / P + R
where T p represents the total number of correctly extracted craters, F p represents the total number of wrongly extracted craters, F n represents the total number of craters that were not successfully extracted. All the ground truth data in this article were obtained by LabelMe.

3.3. Experimental Results and Comparison with State-of-the-Arts

3.3.1. Experiment I

The results of the proposed runway extraction method for test images #1–8 and ground truth data are shown in Figure 8. The quantitative results of the proposed runway extraction method are given in Table 2. From the runway extraction results in Figure 8, the proposed runway extraction method almost achieves complete extraction of all the test images (including images with complex distribution of runway structure and post-damage images). At the same time, it can be seen from Table 2 that the average completeness of the proposed runway extraction method in this paper reaches more than 90%, and the completeness of runway extraction for each test image exceeds 90% except for image #7. The reason for the low runway extraction completeness of image #7 is that one end of the runway was completely covered by the ablation area or dust after damage, which will result in the absence of straight line segments and corner features on the edge of the runway. However, except for the small area at one end of the runway, the runway extraction method still achieved relatively complete extraction of the remaining runway area. And due to the complete damage at the end of the runway, the take-off and landing functions of the runway in this area have been totally lost. Therefore, the runway extraction results of the proposed runway extraction method can effectively support the subsequent research related to crater extraction and functional damage assessment of the runway.
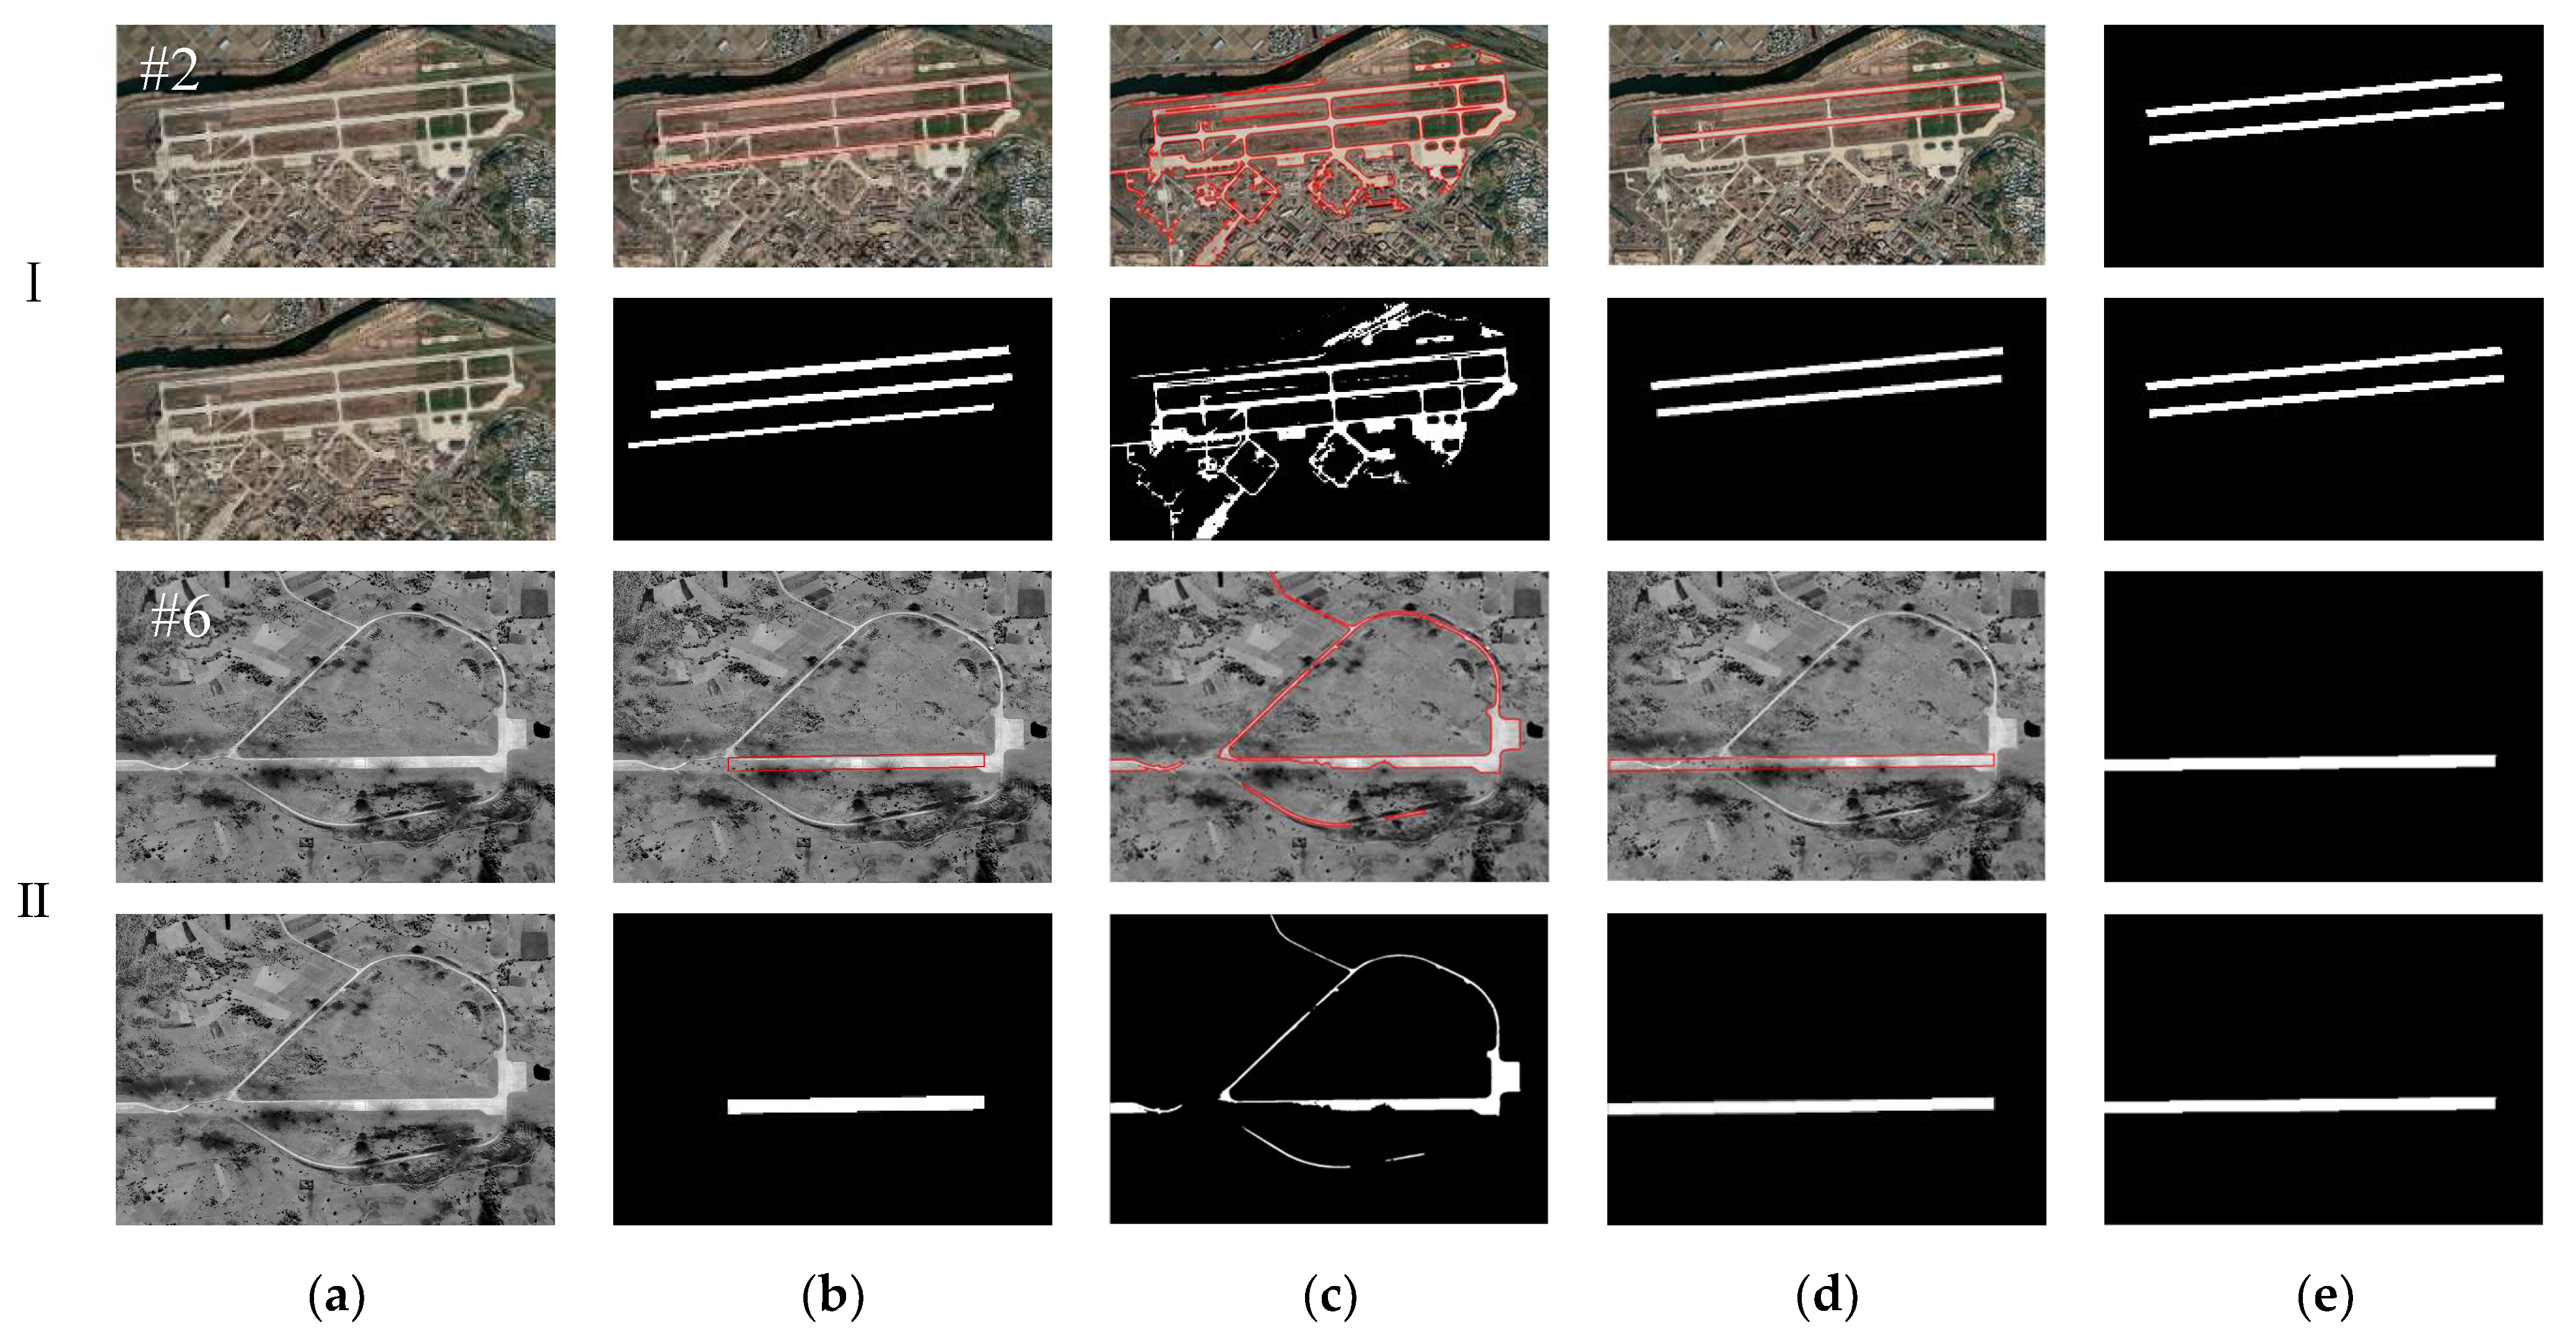
To further illustrate the effectiveness of the proposed runway extraction method, we apply the runway extraction method in this article and the comparison methods [15,17] to the representative images #2 and #6 (as shown in Figure 9) for comparative testing. The reasons why we selected images #2 and #6 for comparative experiment are as follows: (1) the runway structure (two parallel runway) and background in image #2 are relatively simple, which makes it easier for the comparison methods [15,17] to extract the runways in image #2; (2) the airport runway in image #6 has incomplete characteristics due to the influence of craters distribution and explosion dust coverage, which makes it difficult for the comparison methods [15,17] to extract the runways in image #6. In general, image #2 and image #6 can better reflect the fairness of the comparative experiment. The quantitative results and the computing time of the proposed runway extraction method and the methods [15,17] for test images #2 and #6 are given in Table 3.
Compared with the state-of-the-art methods [15,17], our runway extraction method is more accurate and effective. The runway extraction method proposed in [15] performs runway extraction using multiple techniques of line segment detection, runway edge line grouping and grayscale template matching of the chevron markings. The method [15] relies heavily on very high-resolution remote-sensing images, which will increase the calculation amount of the algorithm. Taking into account the fact that when the airport runway is affected by factors such as low image resolution and battle damage, the chevron markings at both ends of the runway may not exist or be unclear, which will cause the chevron marking detection part of the method [15] to fail. Thus, we only use the part of the runway extraction method which was based on morphological filtering and line segment detection in [15] for comparison, and the extraction results of [15] are shown in Figure 9b. Due to the absence of chevron markings at both ends of the runway, the method [15] uses the minimum envelope rectangle of the screened line segments as the runway extraction results, which will lead to incomplete runway extraction results or false extraction results. For example, as shown in Figure 9b(#6), due to the influence of battle damage, the line segments at the runway edge can not be effectively detected at one end of the runway, which results in the minimum envelope rectangle of the line segments not fully encompassing the runway area. As shown in Figure 9b(#2), since the screening of parallel line segments in [15] is based on the Euclidean distance range (between 30~60 m), the extraction results are prone to introduce interference areas such as adjacent taxiways. The method [17] performs runway extraction based on the combination of line segment detection and level set evolution. The extraction results of [17] are shown in Figure 9c, since the algorithm [17] constructs an energy function based on the brightness difference between inner and outer areas of the runway, and obtains the target area through iterative convergence. Therefore, the extraction results of [17] usually include non-runway areas such as terminal buildings, taxiways, and aprons. In addition, the brightness of areas with craters or ablation is low, which results in smaller grayscale differences between the inner and outer areas of the runway. Therefore, the extraction results cannot completely cover the entire runway area, as shown in Figure 9c(#6). As for the quantitative results (as shown in Table 3): for test image #2, although the extraction completeness of [15] is more than 90%, the extraction result also has false alarms, the extraction completeness of [17] is less than 80% and there are non-runway areas in the result; for image #6, the extraction completeness of [15,17] is both around 60%, and neither of them can achieve complete extraction of the runway area.
In the first step of our proposed runway extraction method, we first perform region of interest extraction to greatly reduce the computational complexity of subsequent line segment and corner detection. Then, the screening strategies of parallel line segment pairs and endpoints in the proposed runway extraction method are mainly designed based on geometric constraints. Although there are regional similarity calculations in the process of endpoint screening, the size of the region and the number of corner points that need to be involved in the calculation are both small. And in practical applications, we do not need to process very high-resolution images like [15], which will exponentially increase the calculation amount of the algorithm. In general, our runway extraction method has high operating efficiency (as can be seen in Table 3).
Overall, the proposed runway extraction method in this article performed well on different test images (including post-damage images and images with complex runway structure distribution), the average completeness of runway extraction result is more than 90%, and our method has the advantage of running time (as shown in Table 3).

3.3.2. Experiment II

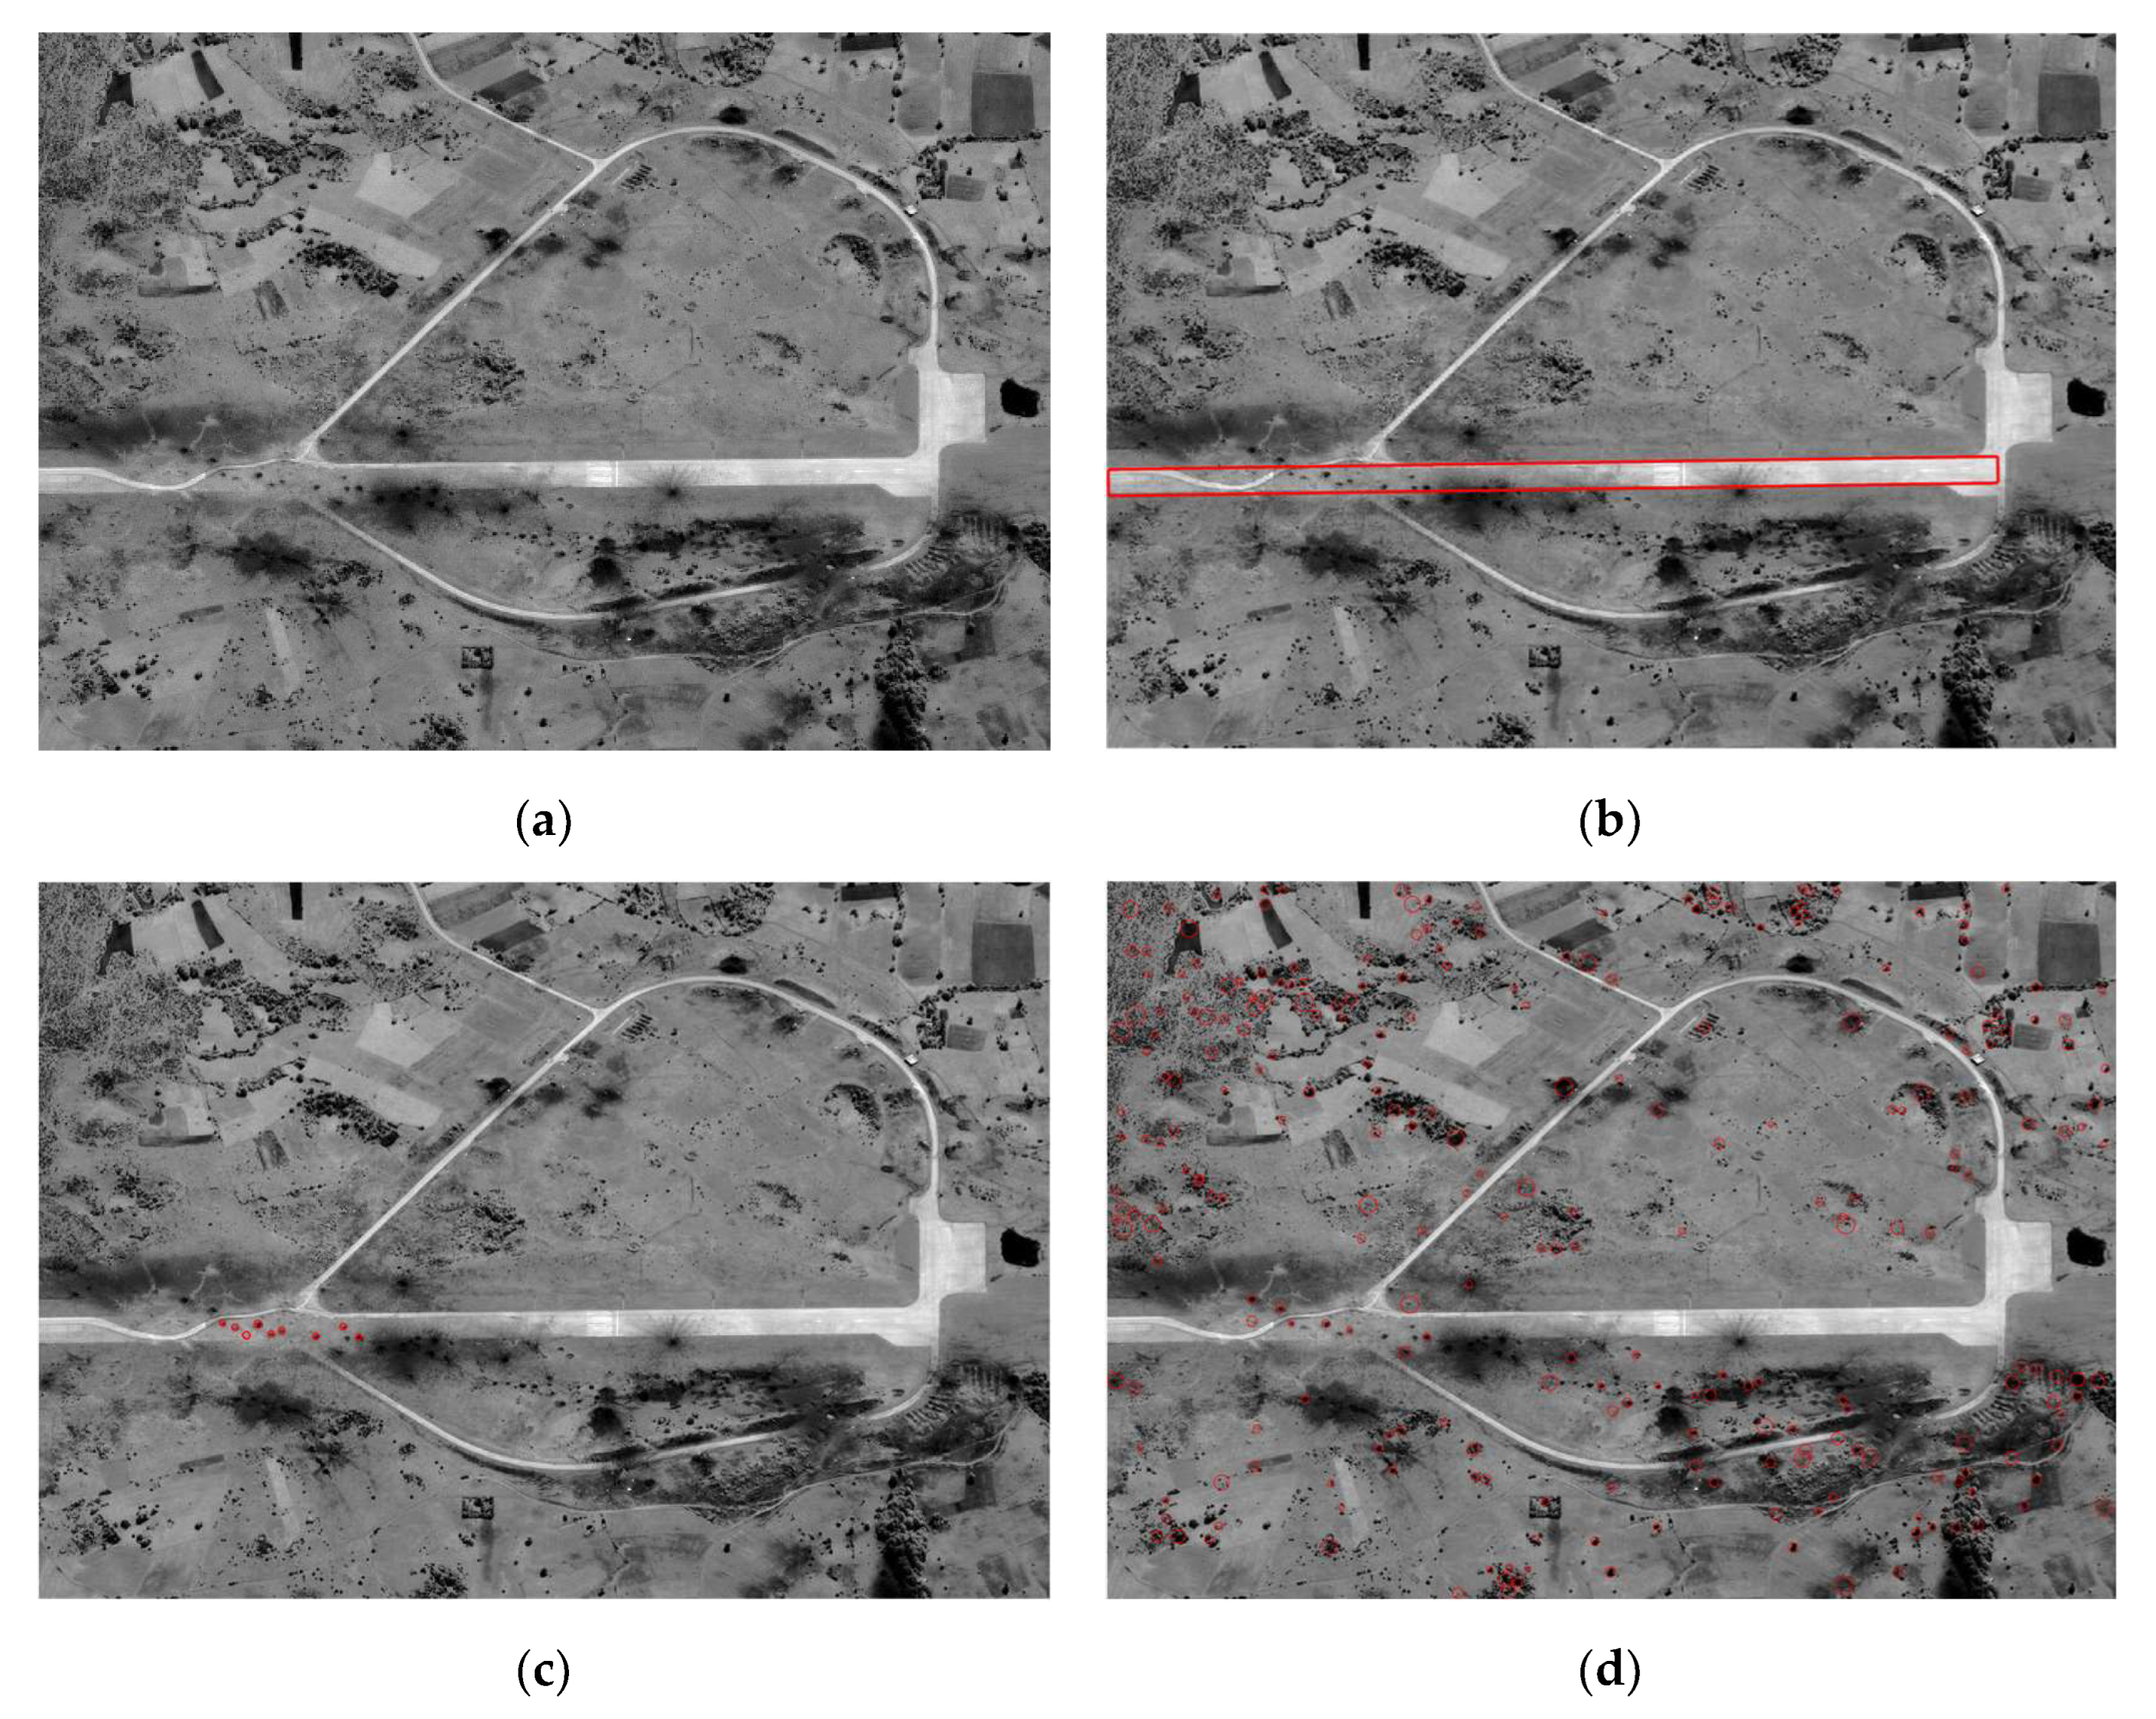
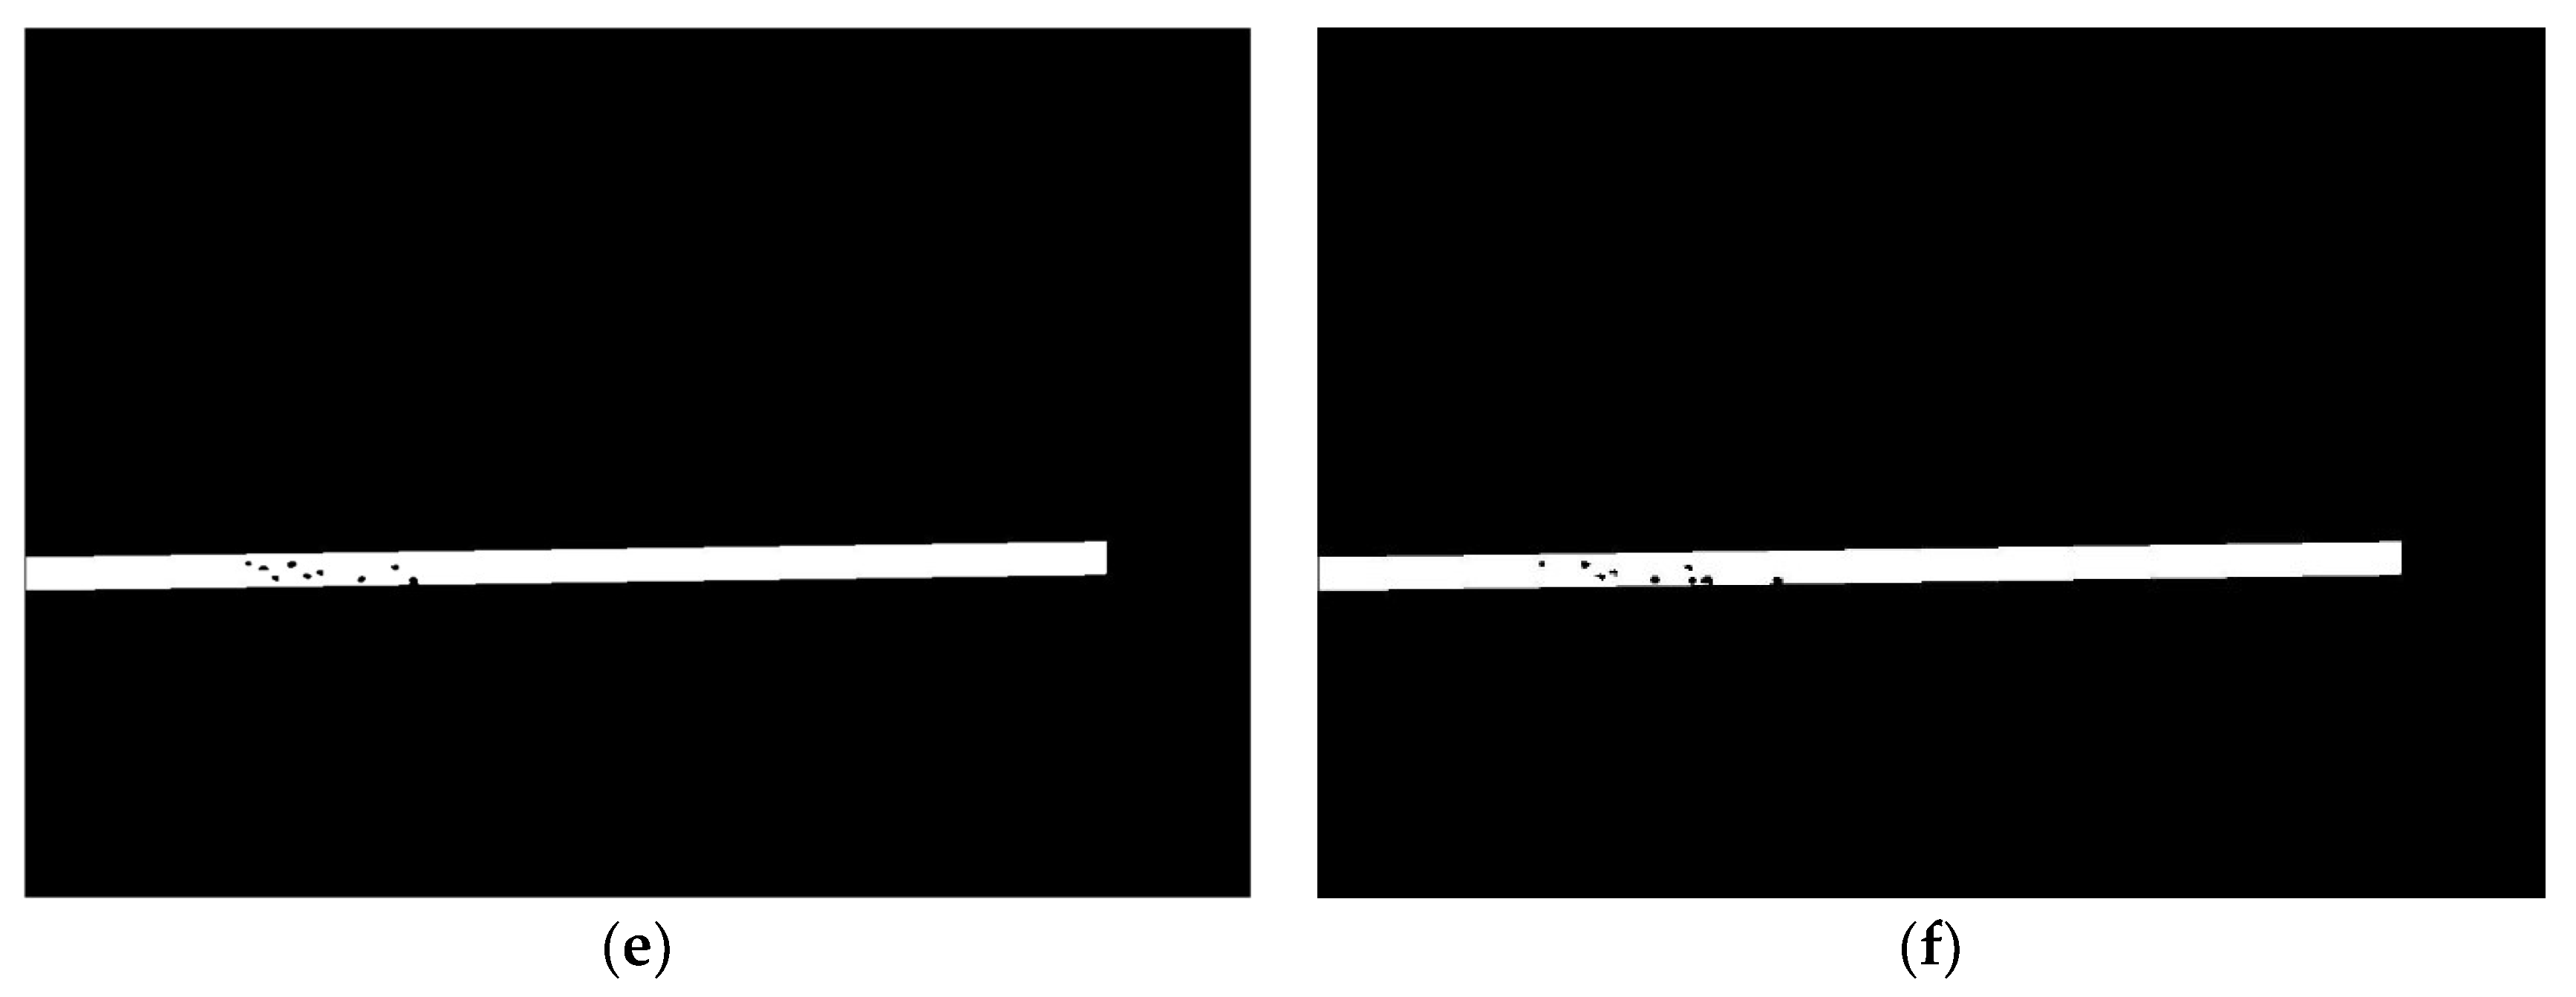
The results of the proposed runway extraction method and crater extraction method in this paper for representative test images #5 and #6 are shown in Figure 10 and Figure 11, respectively. To verify the effectiveness of the proposed crater extraction method, the result obtained by the crater detection algorithm based on marked point processing and the ground truth data of craters inside the runway obtained by manual annotation are also presented in Figure 10 and Figure 11. The quantitative results of the proposed crater extraction method and the method [32] are given in Table 4 and Table 5, respectively.
As can be seen in Figure 10 and Figure 11, the experimental results of the proposed method show that the runway extraction results and crater extraction results are consistent with the real situation. At the same time, the overall quality of the proposed crater extraction method in this paper is relatively high, as shown in Table 4. In contrast, the detection results of the crater detection algorithm based on marker point processing [32] are not ideal. The detection results of the method [32] include a large number of false targets in the background, such as shadows, and also miss a large number of crater targets located in the runway, as shown in Figure 10d and Figure 11d. This may be because the crater target is small and is easily interfered with by small areas in the background that have similar characteristics to the crater, and the application of the algorithm [32] is limited in scenes with complex backgrounds. For the extraction of craters in the runway, it is necessary to further use the characteristics of the runway to constrain the search space, which is difficult to accomplish only by the existing crater detection methods.
In general, the proposed method in this paper has good performance not only in runway extraction but also in crater extraction. The average crater extraction precision of the proposed crater extraction method in this paper is more than 80%, while the existing representative methods perform poorly.

4. Discussion

As far as runway extraction is concerned, the incompleteness of the damaged airport runway area brings challenges to the complete extraction of the runway area. For example, as shown in Figure 8(#5–8), the distribution of a large number of craters inside the runway reduces the consistency of the grayscale distribution inside the runway. The coverage of large black ablation areas will cause the runway areas to be incomplete and break the long line segments at the edge, which will make it easier to be interfered with by short line segments in the background while extracting runway edge line segments. Thus, our method ignores the overall regional characteristics of the runway, and instead designs screening strategies of edge line segment pairs and endpoints based on local regional characteristics and shape characteristics of the runway. Then we perform a complete extraction of the runway by calculating and linking vertex coordinates. This is also the first time that corner detection and screening have been applied to runway extraction. In addition, the proposed runway extraction method also performs well for images with complex distribution of runway structure, such as images #1–4. For the extraction of craters, the crater extraction results of our method are matched with the real situation, and the average crater extraction precision and recall both reach more than 80%. However, it is difficult for the existing crater detection methods to directly locate and extract craters inside the runway.

5. Conclusions

This paper proposes an effective method for extracting craters in airport runways. This method first extracts the region of interest containing the undamaged area of the runway based on the high brightness characteristics of the undamaged area of the runway to reduce the interference of complex backgrounds and damaged areas. Then the multi- features of the runway such as the geometric structure characteristics, the grayscale distribution characteristics of the undamaged runway areas and the grayscale difference between the pixels in the inner and outer areas of the runway are combined to realize the complete extraction of the runway. In addition, within the runway extraction results, we establish the crater model by combining the grayscale distribution characteristics with the shape characteristics of the craters to extract craters inside the runway. The two experimental results show that for both damaged and undamaged airport runway areas, the proposed runway extraction method can achieve complete and effective extraction, the average completeness of runway extraction results is more than 90%, and the running speed is much faster than the state-of-the-art methods. The craters inside the runway are effectively extracted, and the average precision and recall of the crater extraction results is more than 80%.
In our future work, we will focus on improving the crater extraction model to improve the model’s ability to detect craters with different morphological characteristics (such as adjacent craters and overlapping craters). In addition, since our current method mainly focuses on obtaining the distribution of crater areas inside the runway, we will expand crater extraction to the entire airport in future research. This is because, in the actual works of battle damage assessment, the impact point distribution of the missiles and the degree of damage play a key role in the formulation of strike strategy.

Author Contributions

Conceptualization, Y.Z.; methodology, Y.Z.; software, Y.Z.; validation, Y.Z.; investigation, Y.Z.; resources, Y.Z.; writing—review and editing, Y.Z. and J.G.; supervision, D.C. and J.G.; All authors have read and agreed to the published version of the manuscript.

Funding

This research received no external funding.

Data Availability Statement

The raw data supporting the conclusions of this article will be made available by the authors on request.

Acknowledgments

We are grateful to the four anonymous reviewers for providing comments and suggestions that greatly improved the article.

Conflicts of Interest

The authors declare no conflict of interest.

References

  1. Wei, W.; Chen, Y.; Wang, Z.; Li, S.; Chen, L.; Huang, C. Comparative study on damage effects of penetration and explosion modes on airport runway. Constr. Build Mater. 2023, 411, 134169. [Google Scholar] [CrossRef]
  2. Al-Muhammed, M.J.; Zitar, R.A. Probability-directed random search algorithm for unconstrained optimization problem. Appl. Soft Comput. 2018, 71, 165–182. [Google Scholar] [CrossRef]
  3. Zhai, C.; Chen, X. Damage assessment of the target area of the island_reef under theattack of missile warhead. Def. Technol. 2020, 16, 18–28. [Google Scholar] [CrossRef]
  4. Liu, Z.; Xue, J.; Wang, N.; Bai, W.; Mo, Y. Intelligent Damage Assessment for Post-Earthquake Buildings Using Computer Vision and Augmented Reality. Sustainability 2023, 15, 5591. [Google Scholar] [CrossRef]
  5. Shen, Y.; Zhu, S.; Yang, T.; Chen, C.; Pan, D.; Chen, J.; Xiao, L.; Du, Q. BDANet: Multiscale Convolutional Neural Network with Cross-Directional Attention for Building Damage Assessment from Satellite Images. IEEE Trans. Geosci. Remote Sens. 2022, 60, 5402114. [Google Scholar] [CrossRef]
  6. Tu, J.; Gao, F.; Sun, J.; Hussain, A.; Zhou, H. Airport Detection in SAR Images Via Salient Line Segment Detector and Edge-Oriented Region Growing. IEEE J. Sel. Top. Appl. Earth Obs. Remote Sens. 2021, 14, 314–326. [Google Scholar] [CrossRef]
  7. Li, N.; Cheng, L.; Ji, C.; Dongye, S.; Li, M. An Improved Framework for Airport Detection Under the Complex and Wide Background. IEEE J. Sel. Top. Appl. Earth Obs. Remote Sens. 2022, 15, 9545–9555. [Google Scholar] [CrossRef]
  8. Boucek, T.; Stará, L.; Pavelka, K.; Pavelka, K.J. Monitoring of the Rehabilitation of the Historic World War II US Air Force Base in Greenland. Remote Sens. 2023, 15, 4323. [Google Scholar] [CrossRef]
  9. Suau-Sanchez, P.; Burghouwt, G.; Pallares-Barbera, M. An appraisal of the CORINE land cover database in airport catchment area analysis using a GIS approach. J. Air Transp. Manag. 2014, 34, 12–16. [Google Scholar] [CrossRef]
  10. De Luca, M.; Dell’Acqua, G. Runway surface friction characteristics assessment for Lamezia Terme airfield pavement management system. J. Air Transp. Manag. 2014, 34, 1–5. [Google Scholar] [CrossRef]
  11. He, C.; Zhang, Y.; Shi, B.; Su, X.; Xu, X.; Liao, M. Weakly supervised object extraction with iterative contour prior for remote sensing images. EURASIP J. Adv. Sig. Process. 2013, 2013, 19. [Google Scholar] [CrossRef]
  12. Wang, Y.; Song, Q.; Wang, J.; Yu, H. Airport Runway Foreign Object Debris Detection System Based on Arc-Scanning SAR Technology. IEEE Trans. Geosci. Remote Sens. 2022, 60, 5221416. [Google Scholar] [CrossRef]
  13. Jing, Y.; Zheng, H.; Lin, C.; Zheng, W.; Dong, K.; Li, X. Foreign Object Debris Detection for Optical Imaging Sensors Based on Random Forest. Sensors 2022, 22, 2463. [Google Scholar] [CrossRef] [PubMed]
  14. Aytekin, Ö.; Zöngür, U.; Halici, U. Texture-Based Airport Runway Detection. IEEE Geosci. Remote Sens. Lett. 2012, 10, 471–475. [Google Scholar] [CrossRef]
  15. Ding, W.; Wu, J. An Airport Knowledge-Based Method for Accurate Change Analysis of Airport Runways in VHR Remote Sensing Images. Remote Sens. 2020, 12, 3163. [Google Scholar] [CrossRef]
  16. Wang, X.; Lv, Q.; Wang, B.; Zhang, L. Airport Detection in Remote Sensing Images: A Method Based on Saliency Map. Cogn. Neurodynamics. 2013, 7, 143–154. [Google Scholar] [CrossRef] [PubMed]
  17. Li, Z.; Liu, Z.; Shi, W. Semiautomatic Airport Runway Extraction Using a Line-Finder-Aided Level Set Evolution. IEEE J. Sel. Top. Appl. Earth Obs. Remote Sens. 2014, 7, 4738–4749. [Google Scholar] [CrossRef]
  18. Zhang, L.; Wang, J.; An, Z.; Shang, Y. Runway Image Recognition Technology based on Line Feature. In Proceedings of the 2022 IEEE 2nd International Conference on Electronic Technology, Communication and Information (ICETCI), Changchun, China, 27–29 May 2022. [Google Scholar]
  19. Wu, W.; Xia, R.; Xiang, W.; Hui, B.; Chang, Z.; Liu, Y.; Zhang, Y. Recognition of airport runways in FLIR images based on knowledge. IEEE Geosci. Remote Sens. Lett. 2014, 11, 1534–1538. [Google Scholar] [CrossRef]
  20. Liu, C.; Cheng, I.; Basu, A. Real-Time Runway Detection for Infrared Aerial Image Using Synthetic Vision and an ROI Based Level Set Method. Remote Sens. 2018, 10, 1544. [Google Scholar] [CrossRef]
  21. Zhang, Q.; Zhang, L.; Shi, W.; Liu, Y. Airport Extraction via Complementary Saliency Analysis and Saliency-Oriented Active Contour Model. IEEE Geosci. Remote Sens. Lett. 2018, 15, 1085–1089. [Google Scholar] [CrossRef]
  22. Jing, W.; Yuan, Y.; Wang, Q. Dual-Field-of-View Context Aggregation and Boundary Perception for Airport Runway Extraction. IEEE Trans. Geosci. Remote Sens. 2023, 61, 4702412. [Google Scholar] [CrossRef]
  23. Liu, L.; Cheng, L.; Ji, C.; Jing, M.; Li, N.; Chen, H. Framework for Runway’s True Heading Extraction in Remote Sensing Images Based on Deep Learning and Semantic Constraints. IEEE J. Sel. Top. Appl. Earth Obs. Remote Sens. 2022, 15, 6659–6670. [Google Scholar] [CrossRef]
  24. Amit, R.A.; Mohan, C.K. A Robust Airport Runway Detection Network Based on R-CNN Using Remote Sensing Images. IEEE Aerosp. Electron. Syst. Mag. 2021, 36, 4–20. [Google Scholar] [CrossRef]
  25. Men, Z.; Jiang, J.; Guo, X.; Chen, L.; Liu, D. Airport Runway Semantic Segmentation Based on DCNN in High Spatial Resolution Remote Sensing Images. In Proceedings of the International Conference on Geomatics in the Big Data Era (ICGBD), Guilin, China, 15–17 November 2020. [Google Scholar]
  26. Chen, L.; Tan, S.; Pan, Z.; Xing, J.; Yuan, Z.; Xing, X.; Zhang, P. A New Framework for Automatic Airports Extraction from SAR Images Using Multi-Level Dual Attention Mechanism. Remote Sens. 2020, 12, 560. [Google Scholar] [CrossRef]
  27. Lin, E.; Qin, R.; Edgerton, J.; Kong, D. Crater detection from commercial satellite imagery to estimate unexploded ordnance in Cambodian agricultural land. PLoS ONE 2020, 15, e0229826. [Google Scholar] [CrossRef]
  28. Geiger, M.; Martin, D.; Kühl, N. Deep Domain Adaptation for Detecting Bomb Craters in Aerial Images. In Proceedings of the 56th Annual Hawaii International Conference on System Sciences (HICSS), Waikiki Beach, HI, USA, 3–6 January 2022. [Google Scholar]
  29. Dolejš, M.; Pacina, J.; Veselý, M.; Brétt, D. Aerial Bombing Crater Identification: Exploitation of Precise Digital Terrain Models. ISPRS Int. J. Geo-Inf. 2020, 7, 713. [Google Scholar] [CrossRef]
  30. Merler, S.; Furlanello, C.; Jurman, G. Machine Learning on Historic Air Photographs for Mapping Risk of Unexploded Bombs. In Proceedings of the 2005 13th International Conference on Image Analysis and Processing (ICIAP), Cagliari, Italy, 6–8 September 2005. [Google Scholar]
  31. Dolejš, M.; Samek, V.; Veselý, M.; Elznicová, J. Detecting World War II bombing relics in markedly transformed landscapes (city of Most, Czechia). Appl. Geogr. 2020, 119, 102225. [Google Scholar] [CrossRef]
  32. Kruse, C.; Wittich, D.; Rottensteiner, F.; Heipke, C. Generating impact maps from bomb craters automatically detected in aerial wartime images using marked point processes. ISPRS Open J. Photogramm. Remote Sens. 2022, 5, 100017. [Google Scholar] [CrossRef]
  33. Descombes, X.; Zerubia, J. Marked point process in image analysis. IEEE Signal Process. Mag. 2002, 19, 77–84. [Google Scholar] [CrossRef]
  34. Lacroix, V.; Vanhuysse, S. Crater Detection using CGC—A New Circle Detection Method. In Proceedings of the 4th International Conference on Pattern Recognition Applications and Methods (ICPRAM), Lisbon, Portugal, 10–12 January 2015. [Google Scholar]
  35. Ding, M.; Cao, Y.; Wu, Q. Method of passive image based crater autonomous detection. Chin. J. Aeronaut. 2009, 22, 301–306. [Google Scholar]
  36. Bandeira, L.; Saraiva, J.; Pina, P. Impact Crater Recognition on Mars Based on a Probability Volume Created by Template Matching. IEEE Trans. Geosci. Remote Sens. 2007, 45, 4008–4015. [Google Scholar] [CrossRef]
  37. Pedrosa, M.M.; De Azevedo, S.C.; Da Silva, E.A.; Dias, M.A. Improved automatic impact crater detection on Mars based on morphological image processing and template matching. Geomat. Nat. Hazards Risk. 2017, 8, 1306–1319. [Google Scholar] [CrossRef]
  38. Yu, M.; Cui, H.; Tian, Y. A new approach based on crater detection and matching for visual navigation in planetary landing. Adv. Space Res. 2014, 53, 1810–1821. [Google Scholar] [CrossRef]
  39. Sawabe, Y.; Matsunaga, T.; Rokugawa, S. Automated detection and classification of lunar craters using multiple approaches. Adv. Space Res. 2006, 37, 21–27. [Google Scholar] [CrossRef]
  40. Yang, S.; Cai, Z. High-Resolution Feature Pyramid Network for Automatic Crater Detection on Mars. IEEE Trans. Geosci. Remote Sens. 2021, 60, 1–12. [Google Scholar] [CrossRef]
  41. Wang, S.; Fan, Z.; Li, Z.; Zhang, H.; Wei, C. An Effective Lunar Crater Recognition Algorithm Based on Convolutional Neural Network. Remote Sens. 2020, 12, 2694. [Google Scholar] [CrossRef]
  42. Tawari, A.; Verma, V.; Srivastava, P.; Jain, V.; Khanna, N. Automated Crater detection from Co-registered optical images, elevation maps and slope maps using deep learning. Planet. Space Sci. 2022, 218, 105500. [Google Scholar] [CrossRef]
  43. Zhao, Y.; Ye, H. SqUNet: An High-Performance Network for Crater Detection With DEM Data. IEEE J. Sel. Top. Appl. Earth Obs. Remote Sens. 2023, 16, 8577–8585. [Google Scholar] [CrossRef]
  44. Jia, Y.; Liu, L.; Zhang, C. Moon Impact Crater Detection Using Nested Attention Mechanism Based UNet plus. IEEE Access 2021, 9, 44107–44116. [Google Scholar] [CrossRef]
  45. Zhao, Y.; Cong, Y.; Wang, Z.; Gong, J.; Chen, D. Damaged Airport Runway Extraction Based on Line and Corner Constraints. In Proceedings of the 2022 IEEE International Conference on Unmanned Systems (ICUS), Guangzhou, China, 28–30 October 2022. [Google Scholar]
  46. Canny, J. A computational approach to edge detection. IEEE Trans. Pattern Anal. Mach. Intell. 1986, 8, 679–698. [Google Scholar] [CrossRef]
  47. Wang, Z.; Chen, D.; Gong, J.; Wang, C. Fast high-precision ellipse detection method. Pattern Recognit. 2021, 111, 107741. [Google Scholar] [CrossRef]
  48. Von Gioi, R.G.; Jakubowicz, J.; Morel, J.M.; Randall, G. LSD: A fast line segment detector with a false detection control. IEEE Trans. Pattern Anal. Mach. Intell. 2008, 32, 722–732. [Google Scholar] [CrossRef]
  49. Cote, M.; Saeedi, P. Automatic rooftop extraction in nadir aerial imagery of suburban regions using corners and variational level set evolution. IEEE Trans. Geosci. Remote Sens. 2012, 51, 313–328. [Google Scholar] [CrossRef]
  50. Blob Detection Using OpenCV (Python, C++). Available online: https://www.learnopencv.com/blob-detection-using-opencv-python-c/ (accessed on 30 October 2023).
  51. Chan, T.F.; Vese, L.A. Active contours without edges. IEEE Trans. Image Proc. 2001, 10, 266–277. [Google Scholar] [CrossRef] [PubMed]
Figure 1. The flowchart of the proposed runway extraction method.
Remotesensing 16 00573 g001
Figure 2. The process of feature extraction: (a) the extraction of runway edge parallel line segments; and (b) the extraction of runway endpoints.
Remotesensing 16 00573 g002
Figure 3. Geometric model: (a) the neighborhood geometric model for line extraction; and (b) the neighborhood geometric model for corner extraction.
Remotesensing 16 00573 g003
Figure 4. Parallel and distance constraints.
Remotesensing 16 00573 g004
Figure 5. The sample graph of the screening of parallel line segment pairs: (a) the screening results based on parallel and distance constraints (the interference pairs are marked with blue and yellow circles); (b) the screening results combined with regional feature constraints.
Remotesensing 16 00573 g005
Figure 6. Regional feature constraints.
Remotesensing 16 00573 g006
Figure 7. Screening of runway edge corner points: (a) illustration of the inner and outer areas of the runway on both sides of the edge; (b) illustration of the high-brightness area in the corner neighborhood and the template area within the runway; (c) instruction for selecting high-brightness area in corner neighborhood.
Remotesensing 16 00573 g007
Figure 8. Test images of airport runways. (a) Original image #1–8: Image 1 (Hartsfield-Jackson Atlanta International Airport, USA), Image 2 (Osan Air Base, Korea), Image 3 (Charlotte-Douglas International Airport, USA), Image 4 (Rick Husband Amarillo International Airport, USA), Image 5 (Ponikve Airport, Serbia), Image 6 (Ponikve Airport, Serbia), Image 7 (Sjenica Air Base, Serbia), Image 8 (OBRVA Airfield, Serbia); (b) The results of the proposed runway extraction method marked with red boxes; (c) The binary results of the proposed runway extraction method; (d) Ground truth.
Remotesensing 16 00573 g008aRemotesensing 16 00573 g008b
Figure 9. The runway extraction results of methods in this article and [15,17] on test images #2 and #6. (a) Original images; (b) The runway extraction results based on [15]; (c) The runway extraction results based on [17]; (d) The runway extraction results of the proposed method; (e) Ground truth.
Remotesensing 16 00573 g009
Figure 10. Test Image #5: (a) original image; (b) the result of the proposed runway extraction method marked with red box; (c) the result of the proposed crater extraction method marked with red circles; (d) the result of the method [32] marked with red circles; (e) the binary result of the proposed method; (f) ground truth of runway and craters.
Remotesensing 16 00573 g010aRemotesensing 16 00573 g010b
Figure 11. Test Image #6: (a) original image; (b) the result of the proposed runway extraction method marked with red box; (c) the result of the proposed crater extraction method marked with red circles; (d) the result of the method [32] marked with red circles; (e) the binary result of the proposed method; (f) ground truth of runway and craters.
Remotesensing 16 00573 g011aRemotesensing 16 00573 g011b
Table 1. Image size and parameters used for corner detection.
Test
Images
Image Size
(Pixels)
Similarity
Threshold (Th1)
Gray Average
Threshold (Th2)
Gray Difference
Threshold (Th3)
#11024 × 7680.30.61.3
#21317 × 7270.30.61.3
#31920 × 10800.20.61.3
#41920 × 10800.30.61.2
#51101 × 7810.20.51.3
#61051 × 8010.30.51.3
#71122 × 8400.30.51.3
#81130 × 8060.40.51.3
Table 2. The quantitative results of the proposed runway extraction method.
Test ImagesCompletenessCorrectnessQuality
#10.9260.7900.743
#20.9070.9310.850
#30.9220.8170.764
#40.9670.8290.806
#50.9480.9300.885
#60.9050.9200.838
#70.7780.7820.639
#80.9640.7860.764
Average0.9150.8480.786
Table 3. The quantitative results and computing time of our method and methods [15,17].
IndicesImagesMethod [15]Method [17]Our
Completeness#20.9160.7930.907
#60.6380.5940.905
Correctness#20.6450.2800.931
#60.8860.4240.920
Quality#20.6090.2610.850
#60.5900.3290.838
Running time (s)#213.9925.812.11
#65.2822.981.23
Table 4. The quantitative results of the proposed crater extraction method.
Test ImagesRecall (R)Precision (P)F1-Score
#50.8570.9600.906
#60.8750.7780.824
Average0.8660.8690.865
Table 5. The quantitative results of the method [32].
Test ImagesRecall (R)Precision (P)F1-Score
#50.3570.0420.075
#60.4440.0150.029
Disclaimer/Publisher’s Note: The statements, opinions and data contained in all publications are solely those of the individual author(s) and contributor(s) and not of MDPI and/or the editor(s). MDPI and/or the editor(s) disclaim responsibility for any injury to people or property resulting from any ideas, methods, instructions or products referred to in the content.