Review

Review of Satellite Remote Sensing and Unoccupied Aircraft Systems for Counting Wildlife on Land

by
Marie R. G. Attard
1,
Richard A. Phillips
1,
Ellen Bowler
1,
Penny J. Clarke
1,2,
Hannah Cubaynes
1,
David W. Johnston
3 and
Peter T. Fretwell
1,*
1
British Antarctic Survey, Natural Environment Research Council, High Cross, Madingley Road, Cambridge CB3 0ET, UK
2
School of Engineering, The University of Edinburgh, Sanderson Building, Robert Stevenson Road, The King’s Buildings, Edinburgh EH9 3FB, UK
3
Division of Marine Science and Conservation, Nicholas School of the Environment, Duke University Marine Laboratory, 135 Duke Marine Lab Road, Beaufort, NC 28516, USA
*
Author to whom correspondence should be addressed.
Remote Sens. 2024, 16(4), 627; https://doi.org/10.3390/rs16040627
Submission received: 5 January 2024 / Accepted: 26 January 2024 / Published: 8 February 2024

Abstract

:
Although many medium-to-large terrestrial vertebrates are still counted by ground or aerial surveys, remote-sensing technologies and image analysis have developed rapidly in recent decades, offering improved accuracy and repeatability, lower costs, speed, expanded spatial coverage and increased potential for public involvement. This review provides an introduction for wildlife biologists and managers relatively new to the field on how to implement remote-sensing techniques (satellite and unoccupied aircraft systems) for counting large vertebrates on land, including marine predators that return to land to breed, haul out or roost, to encourage wider application of these technological solutions. We outline the entire process, including the selection of the most appropriate technology, indicative costs, procedures for image acquisition and processing, observer training and annotation, automation, and citizen science campaigns. The review considers both the potential and the challenges associated with different approaches to remote surveys of vertebrates and outlines promising avenues for future research and method development.

1. Introduction

Remote sensing refers to the study of objects or physical characteristics at a distance by measuring the energy reflected and emitted from the Earth’s surface by sensors on board high-flying aircraft or satellites [1,2]. The development of efficient unoccupied aircraft systems (UAS) (commonly referred to as remotely piloted aircraft (RPA), an unmanned aerial vehicle (UAV), or a drone [3]) and new methods for satellite remote sensing (SRS) of wildlife has allowed animals to be counted in remote or inaccessible locations and over large geographical areas, greatly increasing our ability to document effects of natural variation and anthropogenic impacts on the environment [4,5]. UAS have existed for more than a century—the first pilotless vehicles were trialled for military purposes in World War I [6]. Improvements in the spatial resolution of Earth Observation (EO) satellites from 80 m in 1972 (Landsat-1) [7] to less than 1 m in 1999 (IKONOS) [8] have provided extensive new opportunities to study wildlife [9,10,11]. Surveys by UAS and SRS are now being used to detect and count individual animals for game or conservation management (Figure 1). The key benefit is that large and remote areas can often be surveyed at a fraction of the time and expense of traditional field-based methods and with less disturbance [12]. UAS and SRS allow the generation of near-real-time data for rapid assessment of population status and threats. Predictive models can explore likely responses to management actions or future changes in the environment and repeated UAS or SRS surveys allow for the monitoring of long-term trends [13].
UAS and SRS offer different advantages and disadvantages for counting wildlife [18,19]. UAS are more suitable for collecting imagery at extremely fine spatial and temporal resolutions; the counts can be more accurate than those conducted in the field by human observers [13] and can be used to estimate animal size or body condition [20,21]. However, studies using UAS often focus on relatively small areas, which can be a limitation for species with large ranges [18,19,22]. Many UAS have limited flight endurance, and tight regulations in some countries restrict operations to within the visual line of sight of the pilot [23] or prohibit their use in certain areas [19]. Satellites overcome several of these logistical limitations, as they collect imagery passively and without disturbance, reducing the need for fieldwork other than initial ground truthing. Although imagery is often available free of charge at 30 m or 60 m resolution, depending on the spectral bands, commercial very high resolution (VHR, <1 m [24]) imagery can be expensive. Image acquisition is affected by cloud cover and revisit time, which can be problematic for certain regions or species or if there is some time sensitivity, for example, associated with the annual breeding cycle. Overall, the advantages of UAS over SRS include the opportunity to work in regions with consistent cloud cover, to collect high-resolution data with greater immediacy, and in some cases, to provide greater detail on study subjects (e.g., age classes or size).
There are numerous reviews of the use of SRS and UAS for animal surveys [4,5,13,18,19,22,25,26,27,28]. However, few offer specific guidance on selecting the appropriate methodology and survey design [5]. Despite the huge potential for expanding such studies and for developing automated or semi-automated methods [26], SRS and UAS remain underused and undervalued [28]. Here, we provide a comprehensive overview of how to select and implement appropriate SRS and UAS techniques to monitor wildlife. We focus on large vertebrates, including birds, mammals and reptiles, that can be counted individually or the number estimated from occupied areas (assuming a consistent density) at predictable times and places (breeding, haul-out or roosting sites). We do not include marine mammals or seabirds at sea, which tend to be less aggregated and are harder to detect because of water turbidity or diving behaviour [29]. Nor have we specifically included photography from occupied aircraft, although many of the same principles apply. We compare remote-sensing methods, including a comparison of current costs of satellite imagery from commercial suppliers, to help readers make an informed decision about possible applications to their target species or area and outline considerations regarding survey design.

2. Materials and Methods

A survey of available literature in which animals were detected and counted using remote-sensing techniques was conducted using Scopus, Google Scholar and Web of Science. The keywords ‘unoccupied aircraft system’, ‘unmanned aerial vehicle’, ‘remotely piloted aircraft’, ‘UAS’, ‘UAV’, ‘RPA’, ‘drone’, ‘satellite’, ‘detection’, ‘count’, ‘wildlife’, ‘monitoring’, ‘automated’, ‘census’ and ‘crowdsourced’ were used to search these databases. The documentation was reviewed between April 2022 and November 2023, and no date limit was set. Conference articles and theses were included, but unpublished reports were not. Information on the costings of commercially available satellite imagery was obtained directly through correspondence with suppliers.
The decision tree in Figure 2 can be used to assess the suitability of alternative remote-sensing methods—SRS or UAS—for counting vertebrate species on land. This involves trade-offs between resolution, coverage area, cost and acquisition time [30]. Several criteria need to be satisfied to be applicable to SRS surveys (see below).

2.1. Detectability

For a target species to be counted in remote-sensing imagery, the animal needs to contrast with the background colour or other characteristics of the local habitat, be large enough to cover several pixels, and occupy open areas (e.g., not under vegetation) (see [27] for further details) (Figure 1a). The higher resolution of UAS enables species as small as a gull to be identified [31], whereas SRS is limited to detecting much larger individuals or groups of animals [30]. Adult emperor penguins Aptenodytes forsteri [32] and wandering albatrosses Diomedea exulans [33,34] can be counted individually in 30 cm resolution satellite imagery, but chicks would be harder to detect, and unlike UAS, it is impossible to distinguish between pair members standing close together (Figure 3a,b). In contrast, southern giant petrel Macronectes giganteus adults and chicks can be distinguished in UAS imagery [33]. Counts of individual polar bears Urus maritimus using 50 cm WorldView-2 and 65 cm QuickBird imagery have produced an estimate similar to aerial surveys conducted a few days earlier [25]. Similarly, counts of zebra Equus quagga burchelliim and wildebeest Connochaetes taurinus in open savannah using 50 cm GeoEye-1 imagery have produced accurate population estimates [34].
Figure 2. Decision tree describing the process involved in selecting an appropriate remote-sensing methodology to detect and count wildlife—information primarily from [5,27,35] and references therein. The decision tree starts at the red box. Key questions and subheadings are in each diamond box. Yellow boxes (1) describe criteria (based on imagery, species life-history and landscape) required for the focal species to be eligible for each remote sensing method (i.e., VHR satellite imagery or UAS), and (2) list requirements for carrying out UAS surveys. The green boxes provide further details for each corresponding yellow box, while the blue boxes state the decision or outcome.
Remotesensing 16 00627 g002
High-resolution imagery (e.g., 30 cm instead of 50 cm) is preferable for larger animals, as more diagnosable species characteristics will be apparent. For instance, the tail of a stranded whale is a conspicuous characteristic that helps it to be distinguished from beached wood of a similar size and colour [13]. Without clear diagnostic features, southern elephant seals Mirounga leonina can be difficult to discern from similarly sized rocks and shading due to sun angle and from animals casting shadows onto adjacent seals in tightly packed harems [36]. Female and male elephant seals can be identified in 30 cm resolution satellite imagery due to the clear size dimorphism, whereas pups are much harder to count because of the large variation in body size and the lack of contrast with the substrate [37].

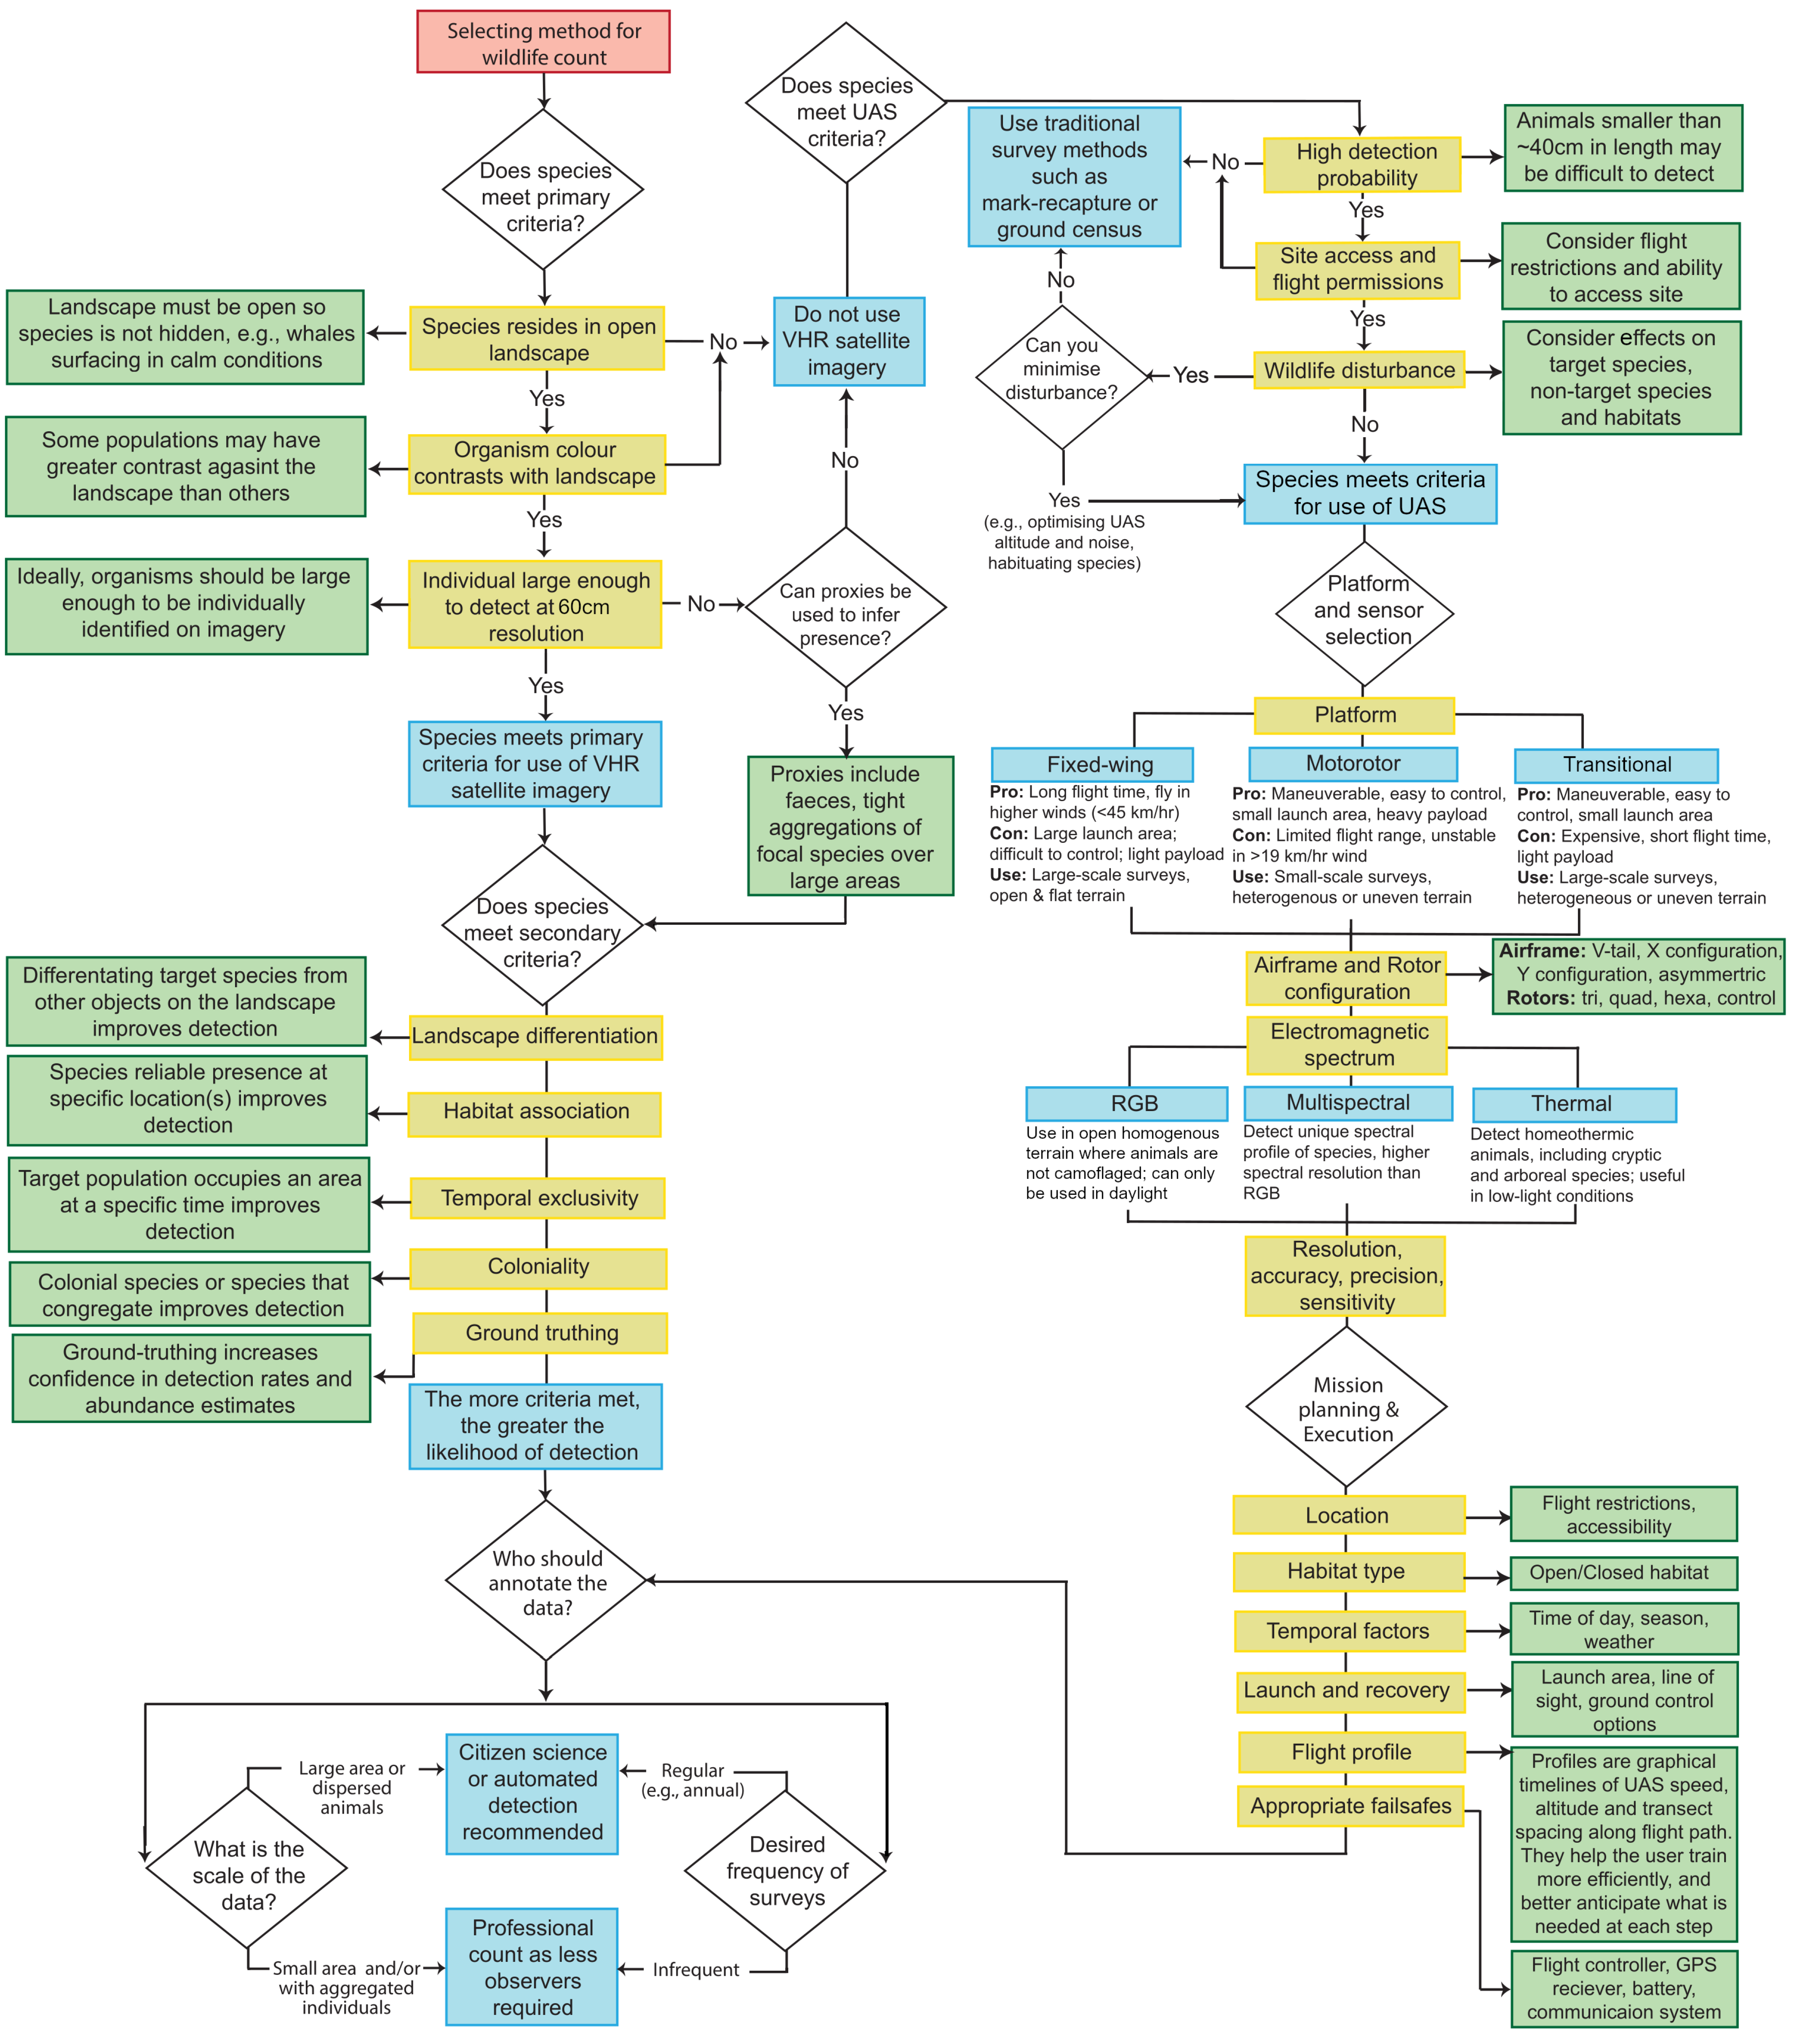
2.2. Species Differentiation

It is often essential to distinguish the target species from other taxa [38]. Colour and size may be diagnostic, e.g., walrus Odobenus rosmarus tend to be grey to cinnamon brown (Figure 3c,d) and are larger than the other pinnipeds in the Arctic [39]. Similar species may segregate spatially or temporally; therefore, prior knowledge about life history, distribution, and ecology can be useful. Crabeater seals Lobodon carcinophaga and Weddell seals Leptonychotes weddellii look similar in VHR satellite imagery but can be distinguished readily because they segregate by habitat (pack ice versus fast ice) and differ in behaviour (crabeater seals congregate in large groups, whereas Weddell seals are usually found alone near the ice edge or breathing hole) [40,41] (Figure 3e,f). VHR imagery is preferable to lower-resolution satellite imagery for species differentiation (see Supplementary Material Table S1 for satellite providers and resolutions).

2.3. Indirect Assessment of Population Size

For species that do not meet detection criteria for distinguishing individuals, it may be possible to estimate numbers indirectly using proxies, particularly if they form large aggregations, such as emperor penguins at breeding colonies (Figure 1b) or walrus at haul-outs (Figure 3c), which are detectable using lower-resolution satellite imagery [15,39,42]. The number of individuals may be inferred from the area of the aggregation using a regression approach if suitable ground-truthing data exist [32]. Some animals have signatures detectable by lower-resolution satellites, such as faecal stains or nests of seabirds [15,43] and warren systems of southern hairy-nosed wombats Lasiorhinus latifrons [44] and Tarbagan marmots Marmota sibirica [45]. Suitability criteria for indirect counts are similar to those used for VHR imagery, i.e., the aggregation or signature is large enough to be detectable, contrasts with the background, and is in open habitat.

2.4. Use of Spectral Imagery

Many studies use multiband satellite and UAS data to map vegetation, habitats or geology, measure marine productivity or detect wildlife aggregations [28,46]. The techniques are usually based on normalised indices or algorithms that detect particular spectral targets using the ratio of values across different bands within single pixels [47,48]. Several criteria must be met: (1) the animal aggregation, or associated features, needs to be sufficiently large to be detectable at the available image resolution, (2) the spectra should be spatially homogenous, and (3) analysis should account for possible changes in spectra over time, e.g., in the colour of guano because of degradation or a change in diet (and associated pigments) or moisture content [49], or of pelage in pinnipeds which dries after they haul out [50]. Discrimination can involve the direct detection of the focal species (e.g., [32]) or associated environmental features, such as guano [23,51,52,53]. The critical requirement is that the spectral profile of the animals differ enough from the surrounding environment to enable automatic discrimination. This may involve contrasting colours in the visible or infrared spectrum. Automatic identification can be confounded by other features with similar spectral profiles [14], such as hydrothermally altered clays mistaken for bird guano [49]. Information on behavioural or geographical context may allow the exclusion of confounding features, but this is often a manual process and species-dependent. Another solution is change-detection, as animals move, whereas the surrounding environment is generally static; this has been used to count polar bears using SRS [4,25].

2.5. Use of Thermal Imagery

Thermal imagery is often used to detect homeothermic animals based on the temperature difference between their bodies and the surrounding environment using wavelengths of 0.75 to 15 μm, although some poikilothermic animals can also be detected during periods of intense activity (e.g., nesting sea turtles [54]). Most successful thermal surveys of animals to date are by UAS or occupied aircraft [34], as the spatial resolution of thermal sensors on satellites lacks the spatial accuracy to identify even large aggregations. Although red-green-blue (RGB) images are the most common type of data acquired by UAS, the development of thermal sensing technology and reduction in sensor prices [55] has allowed researchers to apply this new technology to detect various birds [56] and mammals (e.g., cattle [57], deer [58], hippopotamuses Hippopotamus amphibius [59], seals [60], and koalas Phascolarctos cinereus [17]) (Figure 1d). The infrared radiation feature in thermal sensors is particularly useful in situations where visual-spectrum cameras struggle (e.g., low-light [61] and where animals are camouflaged or partially obscured by vegetation [55]).
Thermal imagery can be used as the primary mode of detection and enumeration or as a tool to augment surveys conducted with RGB and other spectral imagery [34,35]. Using thermal and RGB images simultaneously often results in higher detectability of the target species (e.g., white-tailed deer Odocoileus virginianus [62] and Arctic birds [56]) than using thermal images alone. For canopy-dwelling species, Wich and Piel [24] recommend that a correction is applied to account for individuals hidden under vegetation that are missed on thermal and RGB images [55]. Traditionally, thermal cameras were swapped interchangeably with the existing camera, flown on separate aircraft synoptically (e.g., [63]) or mounted as an additional payload on UAS [64]. However, some newer payloads have multiple sensors that collect RGB imagery at the same time as thermal IR data are acquired [65]. The main disadvantages of combining RGB and thermal images are the larger data storage requirements and the greater time needed to complete additional preprocessing steps to co-register the data before analysis [64].

2.6. Correction Factors: From Counts to Population Sizes and Trends

Survey design should consider whether the goal is to estimate population size or trends and the spatial scale (local, regional or global), and requires consideration of the accuracy and representativeness of the sample data [66,67]. Trends can be established by regular monitoring of representative sites at the same time of year [68], taking account of potential density dependence and environmental variation in growth rates, without the need to survey the entire population. The objective will often be to estimate the total number of individuals or pairs that breed in a given year. As such, surveys of breeding birds should be timed so that all or nearly all nests are occupied and eggs laid, and few nests have failed (usually resulting in reduced attendance) [66]. Animal status needs to be determined in order to estimate breeding population size, and so correction factors derived from intensive study of a much smaller area are often applied that account for previous breeding failures (or later breeding, which is harder to predict) and diurnal and seasonal changes in attendance of partners (which could result in double counting), prebreeders (too young to breed), deferring breeders (animals with breeding experience that skip breeding that season) and failed breeders, just as for counts on the ground (e.g., [68,69]). Turnover rates can be very high, particularly for land-based marine predators, in which case the best index of relative abundance for a pinniped may be the number of animals of all ages in haul-outs during the moulting period or of pups during the breeding season accounting for factors such as topography and vegetation cover that determine detectability.

3. Availability of Imagery and Processing

3.1. Satellite Imagery

3.1.1. Availability and Cost

Free VHR satellite imagery is available (up to 500 km2 per month with a yearly subscription) from Planet as part of their Education and Research Program [70]. Commercial hyperspectral and multispectral data with global coverage at up to 30 cm resolution are available from several suppliers (Table S1), and additional satellites to be launched in the next 1–3 years by Maxar, Airbus and Planet will provide more data and synthetic-aperture radar (SAR) imagery. Currently, several commercial SAR satellite sensors can detect objects with a ground-sampling distance of 25 cm (Table S2) (though see Section 5 for commercial access to <25 cm/pixel SAR imagery). Costings for commercial sub-meter SAR imagery are detailed in Table S3. Online archives are free to search prior to purchase, including Maxar Archive Search and Discovery (https://discover.maxar.com/, accessed on 3 January 2024), Airbus OneAtlas portal (https://www.intelligence-airbusds.com/imagery/oneatlas/, accessed on 3 January 2024), GeoSAT catalogue (http://extcat.deimos-imaging.com/cscda/extcat/, accessed on 3 January 2024), and ESA’s Earth Observation catalogue (https://eocat.esa.int/sec/#data-services-area, accessed on 3 January 2024). The price of VHR satellite imagery is USD 5.14 to USD 24.00 per km2 for archived and USD 7.87 to USD 51.00 per km2 for tasked imagery, depending on spectral resolution and area (Table S4). VHR satellites must be specifically tasked for image collection over target areas and do not easily accommodate regular repeated surveys over large contiguous areas (e.g., the maximum area collected by WorldView satellites in a single pass is 67 km × 112 km [53]). A guarantee of largely cloud-free imagery increases costs by 25–50% [5]. High-definition (HD) uplifted imagery (from raw 30 cm to 15 cm) is available for Maxar products, which involves the application of a mathematical model to increase the number of pixels. As far as we are aware, there have been no direct tests of whether this improves the reliability of wildlife counts. Until recently, researchers with limited budgets were unable to obtain imagery for large areas, but this has changed with the advent of crowdsourcing platforms. Maxar offers imagery at ~USD 2 per km2 for the GeoHIVE platform. VHR data remain largely in the commercial domain, but companies are being encouraged to allow researchers free or cheaper access [5,13].

3.1.2. Preprocessing and Accuracy

Raw VHR imagery is usually collected as two separate components: a high-resolution panchromatic image and a lower-resolution multispectral image. Generally, the first step is to pan-sharpen, where these two components are combined to form a single high-resolution colour image using algorithms that are easily implemented in software such as ArcMap, ArcGIS Pro and ENVI, with trade-offs in terms of preserving spectral or spatial fidelity. The Gram–Schmidt algorithm provided the highest spectral and spatial fidelity for the identification of seals and penguins [71], whereas the Brovey transform algorithm gave the clearest output for the detection of beluga whales Delphinapterus leucas [72]. We recommend testing to determine which algorithm provides the best results for each target species.
Images should be orthorectified if precise geolocation is required, for instance, to validate satellite observations by comparing them to GPS markers on the ground [73]. Orthorectification corrects for topographic and optical distortion introduced by the terrain and sensor. A digital elevation model (DEM) is required for orthorectification and should be of sufficient spatial resolution for VHR imagery. More advanced processing tools may improve the detectability of wildlife. Dehazing algorithms can reduce the effect of haze and cloud, which are common problems shown to limit the detection of albatrosses [74]. The contrast between animals and the environment may be enhanced by adjusting brightness and saturation or altering the weighting or combination of multispectral bands [72,73]. Maxar applies a proprietary method (HD Technology) to artificially sharpen imagery (see above), but this increases costs by ~10–20%.

3.2. UAS Imagery

3.2.1. Operational Frameworks

The diversity of UAS platforms and sensors and their ease of use for different applications requires establishing an operational framework for researchers to help guide decisions throughout all project stages. We have included one possible framework in Table 1. In many cases, the initial steps in a UAS workflow focus on identifying the species-specific traits that ultimately govern likely success. Identifying key natural history states, behavioural complexities and an initial understanding of detection probabilities and availability are examples of these factors. Researchers can then establish the key metrics associated with their project, defining exactly what is to be measured or collected (e.g., abundance, distribution, morphometric details). This sets the stage for subsequent steps, including platform and sensor selection (e.g., multicopter versus fixed wing systems), mission planning and execution (launch and recovery sites etc.), and appropriate data processing and management (quality control, error estimation).

3.2.2. Image Acquisition

In contrast with SRS, there are no online portals that provide commercial access to global-scale UAS imagery, although efforts to develop publicly searchable online archives (and a variety of processing services) are underway (e.g., GeoNadir—https://geonadir.com/, accessed on 3 January 2024). The resolution of UAS imagery and its ease of acquisition can result in legal and ethical issues (e.g., privacy, security, animal disturbance) [75] that rarely apply to commercial SRS imagery [76]. The potential disturbance caused by UAS must be assessed for each target species; some animals show little behavioural response to UAS [33], whereas other species need several weeks to become habituated [77]. To date, few, if any, UAS disturbance studies explicitly declare the stimuli to which animals may be reacting (e.g., the sound, silhouette or shadow on the surrounding substrate). Care should be taken when relying on studies that do not present appropriate operational and statistical approaches to assessing disturbance, as many do not meet the requirements to provide strong inference (e.g., Bevan et al. [78] claim to establish ethical thresholds for approaching some wildlife with drones, but without appropriate experimental design).
There are essentially two modes of UAS imagery collection. (1) A typical UAS mapping exercise, where UAS are programmed to acquire images of a focal area with a relatively high level (70–90%) of along and across-track overlap [19] which are subsequently stitched together, often using Structure from Motion (SfM) photogrammetry to create a georectified map [79]. This is best suited for organisms that move very little during a typical 20–40 min UAS survey (e.g., birds on nests [80], breeding or moulting pinnipeds). If substantial movement occurs, the SfM process will generate artefacts, often referred to as ghosts, which need to be fixed manually to avoid double counting. Flight planning can help alleviate the generation of ghosts, e.g., the elapsed time between image captures that span transect lines (referred to as tracklines) can be reduced by creating short flight lines perpendicular to the long-axis of the focal areas, minimising the likelihood of an animal having changed positions. (2) Tracklines are flown to sample a region of interest, similar to established strip and point transect sampling methods, and used to estimate or model population density [81,82]. Trackline sampling allows cost-effective surveys of large regions as it does not require all objects to be detected. Counts from tracklines are most suitable for species that occur in low densities [83], are detectable for only a proportion of the time (e.g., marine mammals above the water surface) and have the potential to travel long distances quickly [84]. The UAS flies a preprogrammed set of tracklines and collects still imagery at specific times or distance intervals or records video. For still imagery, animals are counted in individual images along the trackline (as opposed to stitching images together), taking care to avoid counting animals detected in more than one image. For video-based sampling, animals are counted during the video replay, often using annotation software that may also extract locations if geocoded tracklines are available [19]. The use of video cameras in trackline surveys remains limited (but see [85,86,87,88]) as they produce lower quality images than still cameras and can suffer from time lags, sporadic dropouts in transmission and positioning, and blurred images when paused [85,86]. Higher-resolution videos are needed to survey larger areas and improve species detectability.

3.2.3. Platforms, Sensors, and Data Management

Three main types of UAS platforms are used, depending on budget, geographic location, habitat type, logistical constraints, and regulatory limitations [89]; these are fixed-wing, multirotor and transitional systems that combine the efficiency of fixed-wing aircraft with the vertical take-off and landing capabilities of multirotors (see Table 2 for summary). For many population assessments, researchers rely on fixed-wing platforms due to their greater endurance, flight performance, and mechanical simplicity [90]. Many have a single motor and simple control surface configuration, resulting in lower power requirements to generate lift and fewer failures. They are usually more stable in higher winds, providing a greater weather envelope for field activities, and are often chosen for large-scale assessments. For example, Pfeifer et al. [90] used a fixed-wing UAS to estimate the number of breeding pairs at 14 chinstrap penguin Pygoscelis antarcticus colonies along a 30 km coastline; it could be released by hand from any open space and land on a variety of surfaces, from gravel beaches to flat patches of ice, snow or dirt. Multirotors are also used, particularly where fixed-wing aircraft are difficult or impossible to launch and recover (e.g., working from constrained locations where typical linear or circular landings by fixed-wing UAS are impossible). Multirotors are generally easier to fly and more affordable than research-grade fixed-wing systems, making them popular for small-scale projects [89]. Transitional platforms bridge the logistical convenience of multirotor systems and the efficiency and flight performance of fixed-wing UAS; these can take off and land vertically in tight spaces but transition to horizontal flight for survey purposes.
Most wildlife surveys using UAS rely on high-resolution EO RGB cameras, although in some cases, thermal infrared sensors can greatly enhance detection. This is especially true when seeking to detect mammals and other homeothermic species, as well as some poikilotherms that generate heat during physical activity or change their thermal context through digging [54]. Many affordable UAS platforms have integrated RGB sensor systems, which are frequently optimised for video collection under a wide range of conditions. However, wildlife surveys may benefit from specific shutter speed, aperture, and ISO settings that can be tailored to specific environmental conditions. If funds are available, greater control of parameter values or collection of RAW imagery—which is more amenable to post-processing—is provided by more expensive UAS with modular camera systems or second-party cameras (e.g., high-resolution mirrorless cameras).

3.3. Spectral Imagery

Many satellites collect multispectral or hyperspectral imagery, which can be invaluable for differentiating animals from the surrounding environment. The MAXAR WorldView-3 satellite samples in eight spectral bands in the visible near-infrared spectrum (coastal blue (400–450 nm) to near-infrared (860–1040 nm)). The characteristic spectral signature of guano allows seabird colonies to be detected (see Figure 1b), and if assumptions are made about bird density, population size can be estimated from the area extent [92]. Some species may be indistinguishable from the landscape when viewed in low spatial and spectral detail, e.g., polar bears and snow in panchromatic satellite imagery [93]; however, high-resolution UAS imagery can resolve these spectral characteristics in more detail, improving detection [94]. Spectral classifiers, principal component analysis or spectral angle mappers are useful tools if the spectral information is the primary discerning feature. If the target has a distinct shape, an Object-Based Image Analysis (OBIA) or a convolutional neural network (CNN) may be more appropriate [95,96]. As mentioned above, colour and spectra may change over time. Rigorous atmospheric correction must be applied in spectral analyses to ensure the comparability of results.

4. Annotating and Analysing Remote-Sensing Data

The steps involved in processing remote-sensing data to count wildlife are summarised in Figure 4. The most common approach for identifying individual animals in VHR satellite imagery involves manual counts [26]. This is also the first step to produce a training dataset in most studies involving automated detection [14]. The number and level of experience of observers and annotation methodology differ markedly among studies, likely dependent on resources (e.g., funding), varying expertise in annotation methods and software, and suitability for the target species [36,73]. We strongly advise the use of a standardised annotation and classification methodology for a given focal species so that datasets can be compared and combined, establishing continuity for wider-scale analyses. Open-access libraries containing annotations of target species in remote-sensing images (e.g., [97]) will assist in training and testing automatic detection systems. An open-access decision-support tool containing all publicly available (published and unpublished) count data has been developed for four penguin species in Antarctica (MAPPPD [98]), allowing abundance estimates to be obtained for any user-defined area of interest. This platform encourages data sharing and model testing of species distribution and abundance, and efforts are currently underway to include population forecasts.

4.1. Selection of Observers

In general, multiple observers should be recruited to achieve consensus or to establish an average and associated error statistics [25]. There is no agreed minimum, and most studies recruit between one and five observers ([4,14,35,36,40,99,100,101,102], but see [12,39]). Where resources and image availability allow, supplementing observer number and expertise with image differencing (where observers use a reference image to detect change or features) could increase confidence in counts [25]. Successive changes in observer identity over time (e.g., annual counts) can reduce the precision of population estimates, which can be overcome by using one observer to count all sites or many observers across different sites. By adopting the latter approach, the poor abilities of one observer are less likely to bias the overall results, reducing uncertainty [103].
Studies often recruit observers who are experienced in reviewing satellite imagery or in carrying out ground or aerial surveys on the target species [34]. Although field experts are generally better at detecting wildlife from SRS imagery than remote-sensing specialists [25,72], lack of experience per se may not be a problem. McMahon et al. [36] used a naive observer to assess the abundance of southern elephant seals from satellites to avoid bias introduced by prior knowledge, and there was a close correspondence between their counts and those collected in the field. Other studies rely solely on experienced wildlife researchers to perform counts [4,34]. It is also apparent that for colonial animals, the larger the colony or subcolony, the greater the variability amongst counts [104]. Performance and perception bias varies between observers and typically coincides with complex or challenging environments or poor image quality [72,73,105]. We recommend recruiting observers with field experience of the target species and, where possible, with additional experience in remote sensing, and that training, calibration, and standardised workflows are implemented to reduce among-observer variation [25].

4.2. Annotation Methodologies

There are three types of annotation tools: points, polygons, or bounding boxes. Point shapefiles are useful for identifying and counting individual animals and providing precise coordinates for animal locations [73,74]. Points are also suitable for reviewing spectral details and for automation techniques that require values for points, such as Spectral Angle Mapping [92]. Polygon shapefiles are valuable for delineating large aggregations, assessing presence-absence, and when individual animals are too close to differentiate [43]. Bounding boxes allow the identification and counting of individual features but are most appropriate for annotating data for integration into CNNs [51,56].
To ensure no features are missed during manual analysis, imagery should be scanned systematically at an appropriate scale dictated by the size of the target species. A grid should be overlaid on the imagery, and each cell should be searched in turn [72]. Certainty of detection refers to confidence in the identification of a feature. Assigning a certainty value (e.g., definite/probable/possible) using set criteria is important for assessing accuracy and quantifying the agreement among multiple observers [39,74]. We encourage the use of multiple observers and the retention of definite and probable features when all observers agree.

4.3. Annotation Software

Many studies use Esri ArcGIS [106] to preprocess and pan-sharpen imagery, customise attribute tables and apply the built-in tools for systematic scanning and image annotation [107]. There are also several open-source software options to complete manual counts, including QGIS [108] and GRASS [109], which can be used to geo-reference satellite imagery, enhance images for better visualisation, and build customisable geographical reference scales [110]. Recent studies have used freely accessible tools within GitHub (LabelImg) [111] and Oxford University (Visual Geometry Group, VGG) [14,112]. Free alternatives to ArcGIS are limited by their ability to preprocess data. A pan-sharpening tool is missing from VGG and is only available in QGIS through a plugin, Orfeo Toolbox. There is, therefore, considerable potential for further development of open-source software to enable researchers with limited financial resources to apply it wider.

4.4. Challenges

The main challenges associated with the manual detection of animals on land in remote-sensing imagery are (1) the time required to scan imagery [4,72], (2) landscape features and environmental characteristics that complicate detection [25], and (3) performance bias, variation in counts and certainty between observers [14]. Variability among observers in manual counts of colonial animals (and automated approaches) may increase with colony size [68]. In addition, the human eye can only see in the visible range of the electromagnetic spectrum, whereas satellites capture considerably more information [113,114]. Some of these limitations can be overcome by automation or the use of a large pool of observers (see Section 4.5 and Section 4.6). However, manual detection may still be the best method for small survey areas, new target species, or the development of training datasets for automation.
Many studies provide insufficient methodological detail, for example, omitting the name of the software [34], the number and experience of observers [32,115], criteria for assigning certainty [114], or the scan and annotation methodology [73,116]. We encourage authors to publish all methods in detail, including freely accessible process flows, and provide image catalogue IDs where applicable (see [97] as an example). Integration of open-source practices and transparency in methodology will promote greater collaboration, inclusivity, replicability, and scalability. This is also true for operational aspects of research. For UAS studies, existing protocol reviews (e.g., [117]) should be consulted, and the use of reporting frameworks (e.g., [118]) can help standardise the transmission of crucial methodological details as supplementary documents without compromising the brevity or readability of scientific studies.
Widespread use of remote-sensing technologies is constrained by costs to purchase, store and process vast quantities of high-resolution imagery, lack of expertise, and limited access to high-speed internet in remote regions [24]. This can be overcome through collaboration with institutions that have appropriate expertise and resources and the release of new satellite constellations (e.g., StarLink https://www.stalink.com, accessed on 3 January 2024) that provide high-speed internet. Misuse of remote-sensing data or derived information about endangered species by poachers or illegal loggers can be minimised by ensuring that individuals in academia and private sectors are aware of the issues and take full responsibility for how they choose to disseminate data and results [119].

4.5. Citizen Science and Crowdsourcing

Satellites collect millions of square kilometres of imagery every day, whilst UAS can provide detailed imagery over thousands of targets. Complex cognitive tasks can be difficult to automate using machine algorithms, and the latter require training data that have been manually labelled for development. An alternative for speeding up the manual analysis of large volumes of satellite and UAS images is to recruit a massive human network working in synchrony. This approach, known as ‘crowdsourcing’, relies on the internet, social media, and purpose-built platforms to have tasks completed by the public. The first global census of Weddell seals was achieved by a crowd review of VHR satellite imagery using the Tomnod platform (now rebranded GeoHIVE) by Maxar [41]. In the future, other satellite providers may develop their own platforms or enable the imagery to be used more broadly by other crowdsourcing applications. Other crowdsourcing platforms are freely accessible, including Zooniverse.org, DotDotGoose [120] and VGG [112], although they are less suited to importing commercial satellite imagery.
Several factors determine the success of remote-sensing crowdsourcing projects for detecting wildlife. The scale of the image chips (also known as tiles, formed by cutting the remote sensing image into smaller square segments using a grid. The larger image can be recreated when the image chips are stitched together) needs careful consideration to limit the number for review while allowing the target species to be detected with confidence without having to zoom in (although a zoom-in option can be helpful). A training session is required to familiarise observers with the target species and possible confounding features before they access the live campaign. A test at the end of the training should be implemented, with a minimum score to pass. Each image chip should be reviewed by various observers to ensure accuracy. The optimal number of observers per image chip will depend on the project. As a minimum, we recommend three observers per image chip based on Bowler et al. [74]. Requirements for a detection campaign—where only image chips with the target species are retained—are a threshold for agreement between observers and expert review of the image chips that the crowd identified as having the target species to prevent misidentification of confounding features. Ultimately, the success of a crowdsourcing campaign relies on sufficient participants; therefore, ways to attract and retain engagement are crucial, such as “fun fact” messages, the award of badges after review of a threshold number of image chips, and regular updates on the progress of the campaign. Links to successful crowdsourcing campaigns involving wildlife remote sensing are given in Table S5. Other components to consider are the minimum age of observers and whether minors require consent from an adult to participate. Crowdsourcing campaigns can be kept private by limiting access to specific users.

4.6. Automated Methods

Automated wildlife detection is evolving rapidly, involving the development of methods that overcome labour-intensive aspects of manual and crowdsourced analysis to generate fast, repeatable and standardised results. Automated methods can be very effective for counting animals in dense aggregations [16] or for locating sparsely distributed species over large ranges [93,121] and will likely become essential as remote-sensing surveys are extended over larger areas and at increased frequency. Most automated image analyses identify patterns in pixel reflectance values and object shapes and can be applied to both SRS and UAS imagery. Hollings et al. [26] review the costs and benefits of semi- and fully-automated methods for wildlife detection in remote-sensing imagery, including spectral thresholding, supervised and unsupervised classification, image differencing, and OBIA. Most are available in software such as ArcMap and ENVI (Exelis Visual Information Solutions, Boulder, Colorado) and are relatively easy to implement for researchers without a background in automated detection. Automated methods using UAS imagery have primarily been used to detect birds and arboreal, marine and terrestrial mammals [35]. The body size of species automatically detected in UAS imagery ranges from 0.34 kg (greater crested tern Thalasseus bergii) [12] to 1500 kg (hippopotamus) [59]. Thus far, most studies are small-scale and proof-of-concept, covering small areas (usually a few square km), and transferability to larger scales remains largely untested [26,73]. In many cases, errors arise because features in the background (e.g., rocks and shadows) have similar reflectance values to the target species, which is more problematic in VHR satellite images because there is often little shape information for the animal, especially if the landscape is heterogeneous [14,26].
Deep learning methods have become the predominant automated approach for the detection of wildlife using UAS [35,116]. These can achieve state-of-the-art performance in tasks such as image classification and object detection [122]. Deep learning architectures (networks) learn feature extraction and classification end-to-end, providing a more general framework than previous computer-vision methods [123]. A supervised training scheme is applied, with labelled examples to teach the network how to recognise target species. As such, image annotations should be collected as an initial step when testing deep learning approaches—either through manual or crowd-sourced analysis. Classification networks can be trained to identify the presence or absence of an animal in an image. For this approach, larger images should be split into small image chips, and presence-absence labels should be used accordingly. Classification networks have been successful in filtering large areas of empty oceans to detect whales [121] and turtles [124]. However, this approach is rarely suitable for dense animal aggregations, as it only provides presence-absence and not a count. On the other hand, object detection methods localise and classify animals simultaneously; a popular example is Faster-RCNN [125], which has been used to detect animals in thermal UAS and SRS imagery [14,17]. The standard form for object detection labels is a bounding box, where an axes-orientated box is drawn around each animal in the dataset. Segmentation methods act in a similar way to object detection, except that every pixel belonging to the target species should be labelled to produce a segmentation mask and have been applied to VHR imagery [74,126]. Finally, regression networks (e.g., [127]) can be trained using the total count of animals in the image. Regression networks indirectly infer the features of interest needed to obtain the full count and are useful if the point or bounding-box annotations are non-existent for each individual animal or are too time-consuming to produce.
Training and testing of automated methods involve a similar process, whether using deep learning or more traditional machine learning approaches. Initially, the dataset should be divided into a training, validation, and test set [128]. Training images are used to guide the algorithm to learn the features (e.g., pixel reflectance values and shape) associated with the target animal. Training and test images should be completely separate to avoid introducing bias. In VHR satellite surveys, only a single large image is often obtained (usually covering several km2), which is then split into smaller image chips to enable computer processing. Although image chips from the same image can be split into non-overlapping training and test sets, we recommend collecting more than one VHR satellite image to assess whether the approach works for different locations, lighting, and weather conditions. The chosen algorithm should then be trained using the annotated training images. Progress for many supervised training schemes (including deep learning methods) can be tracked and assessed using a small validation set to (i) determine when training is complete and (ii) select any hyper-parameters associated with the chosen algorithm. The trained algorithm can then be applied to the test images to assess accuracy using metrics such as recall (the fraction of animals that are correctly detected) and precision (the fraction of detection that is correct) [80]. Since supervised training relies on the use of manual labelling, human error and any uncertainty will feed into the final accuracy assessment. The success of an automated method should always be gauged in terms of how well it compares to human performance on the dataset, the accuracy of which will be much lower than 100%, particularly for satellite surveys [14,74].
In most studies, researchers must address risks associated with both Type I and Type II errors. While traditional statistical analyses often prioritise diminishing Type I errors to bolster confidence in rejecting null hypotheses, studies with a conservation focus must also address the repercussions of committing Type II errors [129] and, in many cases, adopt strategies to minimise their occurrence. When utilising a machine learning approach, researchers have the flexibility to refine their system to minimise either Type I or Type II errors. This refinement requires a balance between recall (the ratio of true positives predicted by the model to the total true positives in the data) and precision (the ratio of true positives predicted by the model to the overall detections made by the model). For instance, Gray et al. [124] tuned their detection model towards minimising the likelihood of Type II errors (i.e., failing to detect an animal in a frame when it was present), accepting the increased financial cost of allocating more time for reviewing detections that may have been false positives.

5. Recommendations and Future Directions

Studies of wildlife using remote sensing will continue to increase as techniques are tested and applied to more species. The preferred platform depends upon particular requirements, locations, species being surveyed, etc. (Figure 2). Satellite technology is especially useful in open landscapes that are remote and difficult to access or for estimates over very large regions. UAS provide more detailed data with higher spatial accuracy, potentially more control, and greater survey frequency. One of the limiting factors at present for SRS is the number of the highest-resolution satellites available. Until 2021, there was only one 30 cm satellite in orbit, the Maxar WorldView-3, but Airbus launched two of four 30 cm Neo Pleaides satellites in late 2021, and MAXAR will follow in 2024 with the launch of up to six further 30 cm satellites. When operational, Pelican will be Planet’s next-generation satellite constellation to replenish and upgrade the ~20 SkySats in orbit today [130]. This escalation of capacity should greatly increase the chance of successfully tasking imagery that is time-dependent (e.g., some arctic areas are almost in continuous darkness through parts of the year [24]) or in areas with high cloud cover (e.g., humid tropics [131]). Tasking SRS imagery depends on several factors: location, access, tasking parameters, time of year, and competition. A feasibility request must be submitted for approval, and delivery of tasked images after the last collection date is not always instantaneous. In the future, useful advances will be more streamlined ordering systems and semi-automated pipelines to facilitate near-real-time image acquisition and delivery to the user.
The United States (US) currently restricts super-high-resolution (<25 cm/pixel) satellite imaging to government use. However, in 2020, the NOAA eased commercial imaging restrictions, allowing some companies to make super-high-resolution SAR imagery commercially available, thereby providing new opportunities for global environmental monitoring. Super-high-resolution SAR imagery is now restricted for 1 year and can be extended annually by the US government for up to 3 years (with further extensions allowed if there is sufficient “burden of proof” preventing its release) before it is eligible for commercial use. On 7 August 2023, Umbra released a 16 cm/pixel SAR image, making it the highest-resolution commercial satellite image so far [132].
For marine work, the use of automated algorithms that consider sea state to ensure that imagery is only taken over relatively calm seas would be extremely useful. Satellite providers already use this type of assessment to avoid taking images if cloud cover is predicted to be high by global weather models. These models also estimate wind speed, which could be used as a proxy for sea state. As surveys expand in scope and area, automation and artificial intelligence (AI) will become key to successful and efficient satellite and UAS imagery analyses. One of the most time-consuming tasks is often the collection of enough test data to facilitate AI models. International collaboration and pooling of test data in open-access databases should help ensure rapid progress.

Supplementary Materials

The following supporting information can be downloaded at: https://www.mdpi.com/article/10.3390/rs16040627/s1, Table S1: Commercial high-resolution satellites that can detect objects less than one metre. Image resolution is measured as ground sampling distance (GSD), the distance between two consecutive pixel centres measured on the ground in metres. The information was collated in November 2023 using the ESA eoPortal [133], CEOS database [134], OSCAR database [135], Satellite Imaging Corporation database [136] or through direct correspondence with the provider. The launch date, mission status in 2023, and expected end of life (EOL) are reported, including EOL to be determined (TBD). Mission status is classified as planned (upcoming launch planned), operational (all systems fully working), and decommissioned (no longer functional); Table S2: Commercial synthetic-aperture radar (SAR) satellites that can detect objects smaller than one metre. The information was collated in November 2023 from multiple sources [133,134,137,138,139,140,141,142,143]. Image resolution is measured as ground sampling distance (GSD), the distance between two consecutive pixel centres measured on the ground in metres. Capella Space is the first US company to launch and operate SAR satellites. ICEYE is currently a constellation of 21 satellites, with plans for expansion to 48 satellites by 2024. The Italian Space Agency (ASI)’s constellation of small satellites for mediterranean basin observation (COSMO-SkyMed) is part of The European Space Agency (ESA) Third Party Missions Programme, in which ESA has an agreement with ASI to distribute data products from the mission. The first-generation COSMO-SkyMED (CSK) satellites consist of four satellites, and the second Generation of COSMO-SkyMed (CSG) satellites consist of two satellites (CSG-1 and CSG-2) with sub-1 m resolution capabilities and are in the same orbit. The KOMPSAT (Korean Multi-Purpose Satellite) program is part of the Korean government’s space development program. Umbra’s constellation currently includes eight satellites with additional constellation growth planned; Table S3: Comparison of costs between commercial synthetic-aperture radar (SAR) satellites that can detect objects smaller than one metre. The order requirements for tasked and archival imagery differ for each company. Costing is dependent on multiple parameters, including minimum area and archival/tasked imagery. Image resolution is measured as ground sampling distance (GSD) for square pixels (i.e., the distance between two consecutive pixel centres measured on the ground in metres) or maximum ground resolution (MGR) for rectangular pixels (measured as azimuth × range). SAR satellites can image in different modes; spotlight and sliding spotlight modes produce higher-resolution images. Spotlight imaging is when a beam is focused on a single point of Earth through the acquisition, whereas in a sliding spotlight, the acquisition angle is slowly varied to slide the illumination point along the ground to cover a larger area. The Italian Space Agency has the Cosmo-Skymed (CSK) and Cosmo Second Generation (CSG) SAR satellites. The UMBRA single-looked product offers shorter dwell times, optimised for very efficient and dense collection, whereas the multi-looked product has longer dwell times to reduce speckle and aid visual interpretation. Umbra SAR satellite constellations are Umbra SAR-2001, Umbra-02, Umbra-03, Umbra-04, Umbra-05 and Umbra-06. Capella Space satellite imagery products are available for purchase from Cloud Earth Observation Services (CLEOS) [144]. ICEYE archive and new tasking products is freely available for scientific research and development activities (see [145] for eligibility requirements and proposal submission); Table S4: Comparison of costs between commercial satellite companies that provide imagery per square km for a minimum order. Planet provides imagery based on annual subscriptions (see main text for details). Each company has different order requirements for tasked and archival imagery, with the costs dependent on multiple parameters, including minimum area. Image resolution is measured as ground sampling distance (GSD), the distance between two consecutive pixel centres measured on the ground in metres; Table S5: Examples of successful crowdsourcing campaigns to estimate population size of wildlife on land using VHR satellite remote sensing (SRS) and unoccupied aircraft systems (UAS). The campaigns are listed in order of release date, with references (see [40,146,147,148,149,150,151,152,153,154]) in a separate column. The platform Tomnod has been replaced by GeoHIVE.

Author Contributions

Conceptualisation: all authors; writing—original draft preparation: all authors; writing—review and editing: all authors; visualisation; all authors; project administration; M.R.G.A. and P.T.F.; funding acquisition, E.B., P.T.F. and R.A.P. All authors have read and agreed to the published version of the manuscript.

Funding

This study represents a contribution to the Ecosystems and Wildlife from Space programmes of the British Antarctic Survey Polar Science for Planet Earth Programme, funded by the Natural Environment Research Programme. Marie Attard was funded by Darwin Plus (DPLUS132).

Data Availability Statement

This manuscript does not use any data.

Acknowledgments

The authors thank MAXAR Technologies for providing satellite imagery and Connor Bamford and Nathan Fenny for providing UAS imagery. We are also grateful to Barry Baker, Igor Debski and anonymous reviewers for providing comments on earlier drafts of the manuscript.

Conflicts of Interest

The authors declare no conflicts of interest.

References

  1. Geller, G.N.; Halpin, P.N.; Helmuth, B.; Hestir, E.L.; Skidmore, A.; Abrams, M.J.; Aguirre, N.; Blair, M.; Botha, E.; Colloff, M. Remote Sensing for Biodiversity. In The GEO Handbook on Biodiversity Observation Networks; Springer: Cham, Switzerland, 2017; pp. 187–210. [Google Scholar]
  2. Herbreteau, V.; Salem, G.; Souris, M.; Hugot, J.-P.; Gonzalez, J.-P. Thirty years of use and improvement of remote sensing, applied to epidemiology: From early promises to lasting frustration. Health Place 2007, 13, 400–403. [Google Scholar] [CrossRef]
  3. Chabot, D.; Hodgson, A.J.; Hodgson, J.C.; Anderson, K. ‘Drone’: Technically correct, popularly accepted, socially acceptable. Drone Syst. Appl. 2022, 10, 399–405. [Google Scholar] [CrossRef]
  4. LaRue, M.A.; Knight, J. Applications of very high-resolution imagery in the study and conservation of large predators in the Southern Ocean. Conserv. Biol. 2014, 28, 1731–1735. [Google Scholar] [CrossRef]
  5. Wang, D.; Shao, Q.; Yue, H. Surveying wild animals from satellites, manned aircraft and Unmanned Aerial Systems (UASs): A review. Remote Sens. 2019, 11, 1308. [Google Scholar] [CrossRef]
  6. Keane, J.F.; Carr, S.S. A brief history of early unmanned aircraft. Johns Hopkins APL Tech. Dig. 2013, 32, 558–571. [Google Scholar]
  7. United States Geological Survey (USGS). Landsat Missions. Available online: https://www.usgs.gov/landsat-missions/landsat-satellite-missions (accessed on 3 January 2024).
  8. Tanaka, S.; Sugimura, T. Cover: A new frontier of remote sensing from IKONOS images. Int. J. Remote Sens. 2001, 22, 1–5. [Google Scholar] [CrossRef]
  9. Laliberte, A.S.; Ripple, W.J. Automated wildlife counts from remotely sensed imagery. Wildl. Soc. Bull. 2003, 31, 362–371. [Google Scholar]
  10. Burn, D.M.; Cody, M.B. Use of Satellite Imagery to Estimate Walrus Abundance at Round Island, Alaska. In Proceedings of the 16th Biennial Conference on the Biology of Marine Mammals, San Diego, CA, USA, 12–16 December 2005; pp. 12–16. [Google Scholar]
  11. Sasamal, S.K.; Chaudhury, S.B.; Samal, R.N.; Pattanaik, A.K. QuickBird spots flamingos off Nalabana Island, Chilika Lake, India. Int. J. Remote Sens. 2008, 29, 4865–4870. [Google Scholar] [CrossRef]
  12. Hodgson, J.C.; Mott, R.; Baylis, S.M.; Pham, T.T.; Wotherspoon, S.; Kilpatrick, A.D.; Raja Segaran, R.; Reid, I.; Terauds, A.; Koh, L.P. Drones count wildlife more accurately and precisely than humans. Methods Ecol. Evol. 2018, 9, 1160–1167. [Google Scholar] [CrossRef]
  13. Clarke, P.J.; Cubaynes, H.C.; Stockin, K.A.; Olavarría, C.; de Vos, A.; Fretwell, P.T.; Jackson, J.A. Cetacean strandings from space: Challenges and opportunities of very high resolution satellites for the remote monitoring of cetacean mass strandings. Front. Mar. Sci. 2021, 8, 650735. [Google Scholar] [CrossRef]
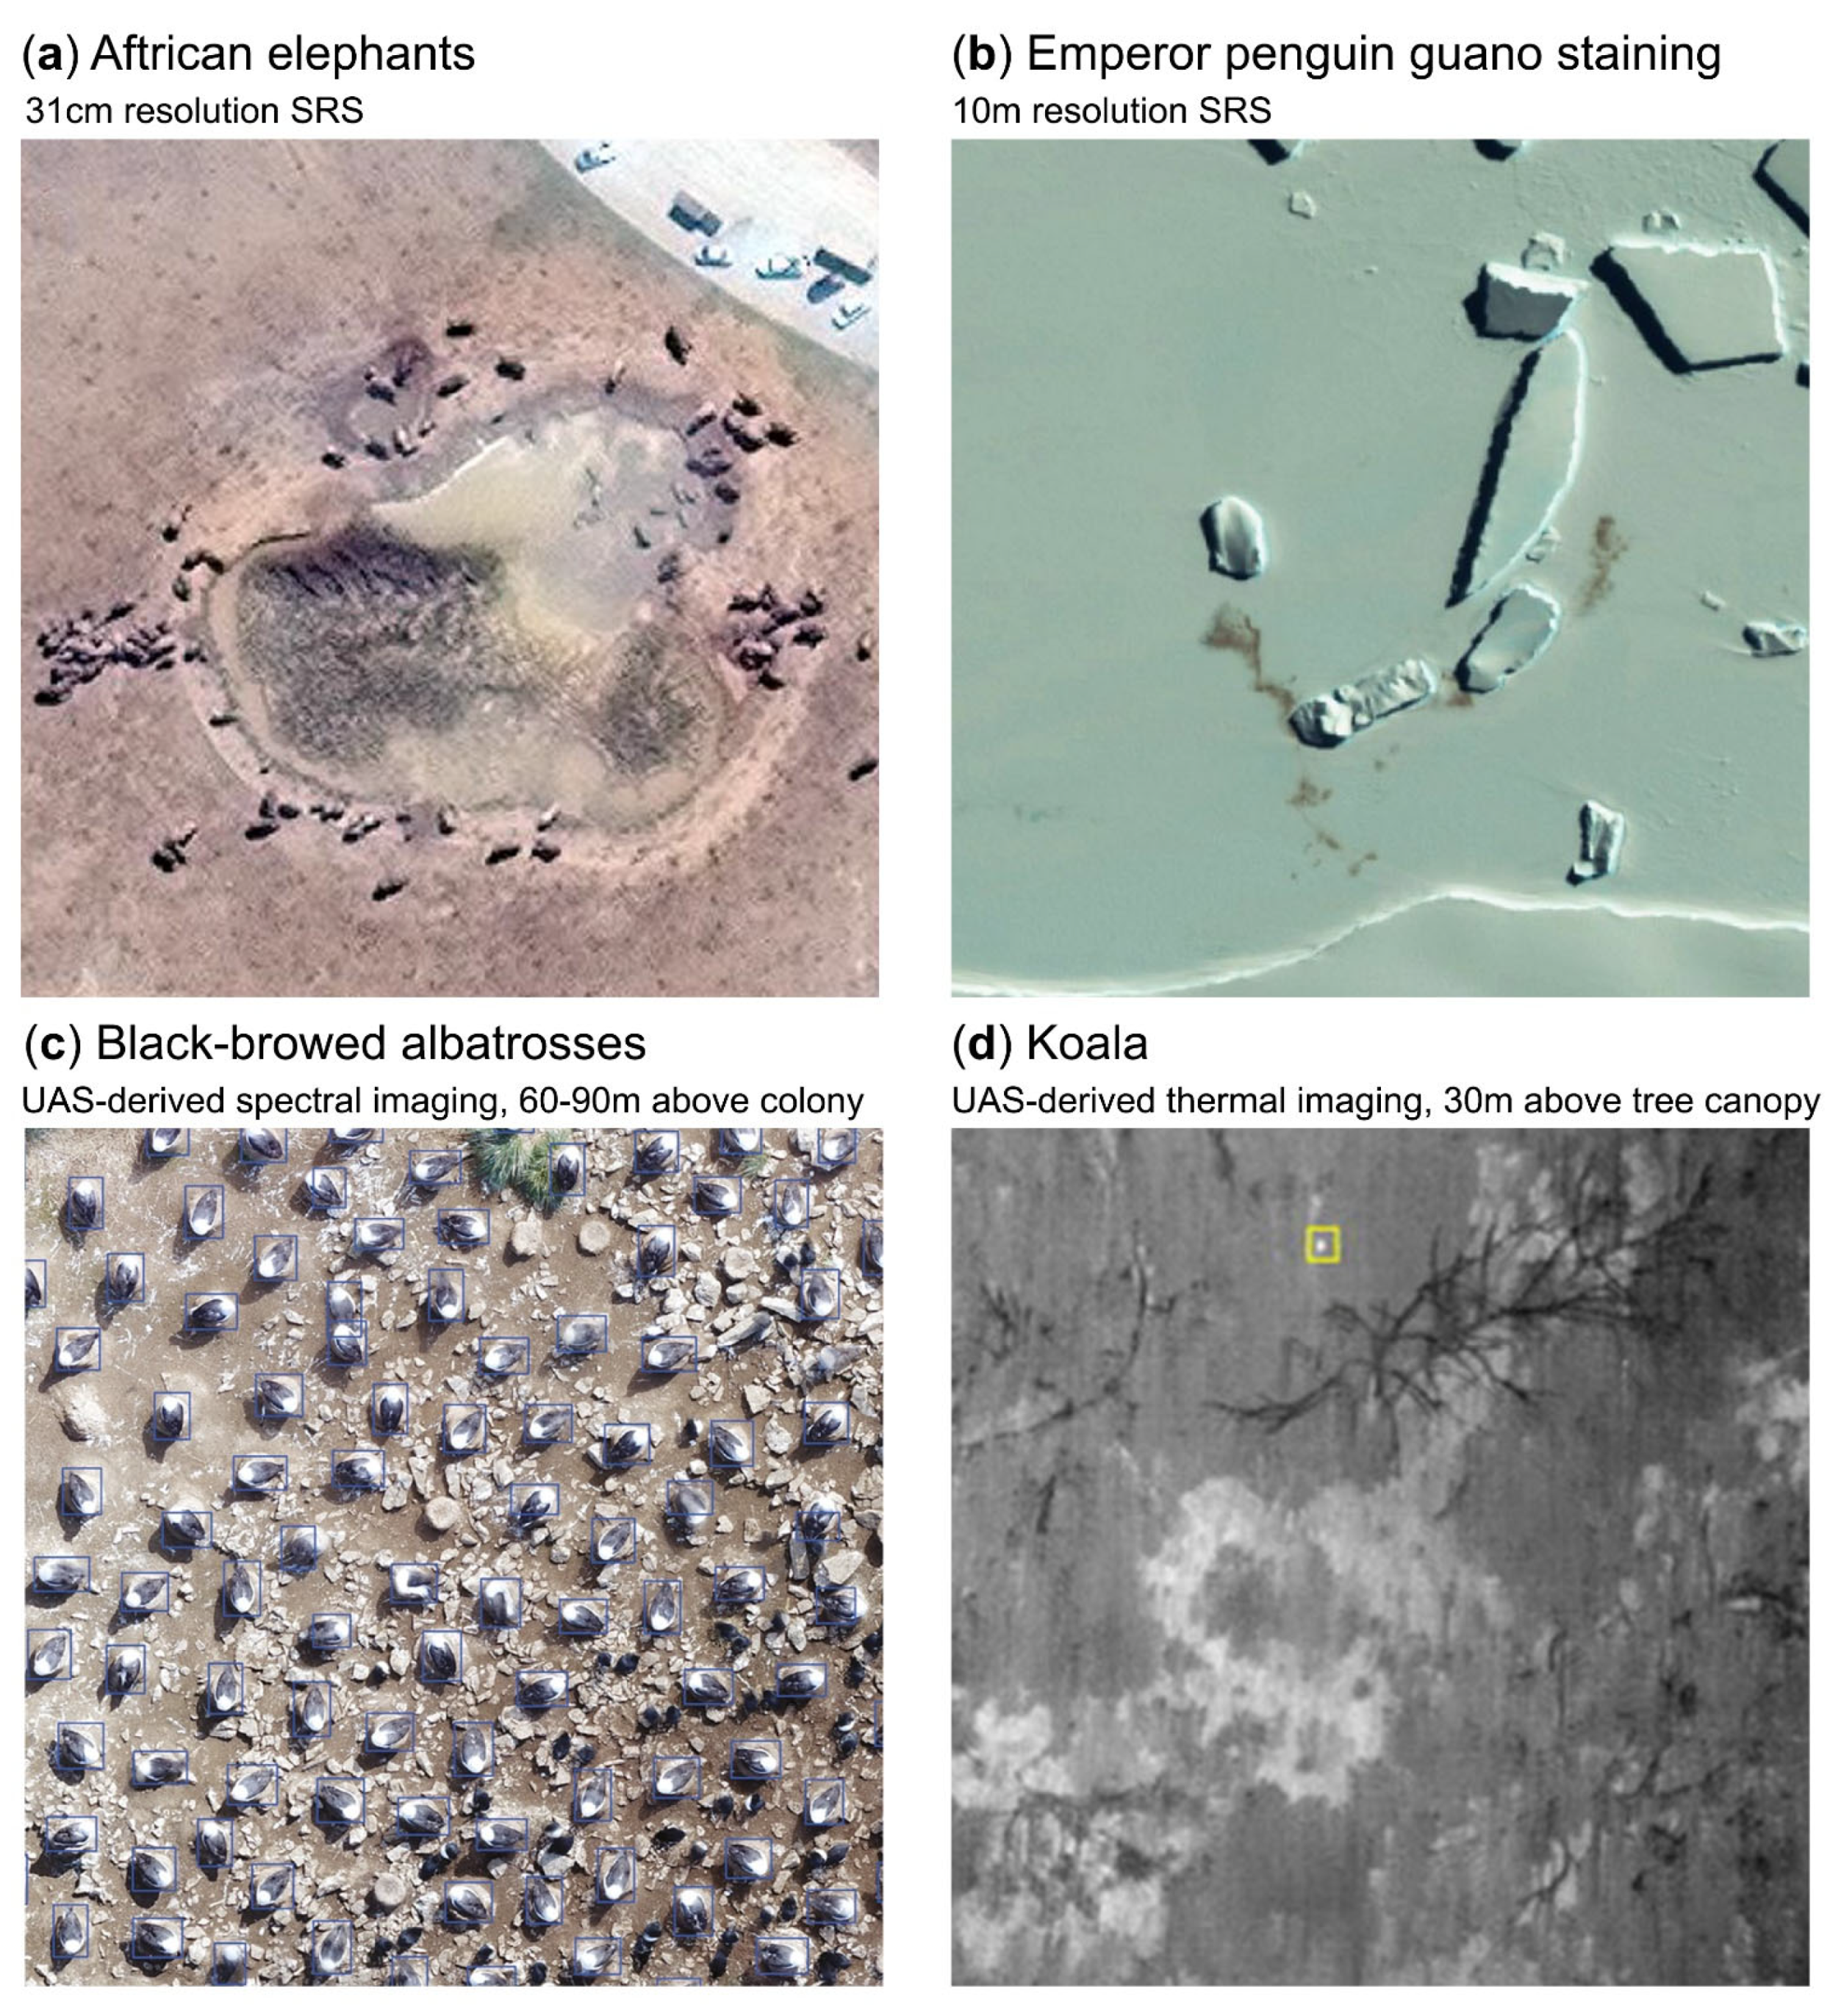
  14. Duporge, I.; Isupova, O.; Reece, S.; Macdonald, D.W.; Wang, T. Using very-high-resolution satellite imagery and deep learning to detect and count African elephants in heterogeneous landscapes. Remote Sens. Ecol. Conserv. 2020, 7, 369–381. [Google Scholar] [CrossRef]
  15. Fretwell, P.T.; Trathan, P.N. Discovery of new colonies by Sentinel2 reveals good and bad news for emperor penguins. Remote Sens. Ecol. Conserv. 2021, 7, 139–153. [Google Scholar] [CrossRef]
  16. Hayes, M.C.; Gray, P.C.; Harris, G.; Sedgwick, W.C.; Crawford, V.D.; Chazal, N.; Crofts, S.; Johnston, D.W. Drones and deep learning produce accurate and efficient monitoring of large-scale seabird colonies. Ornithol. Appl. 2021, 123, duab022. [Google Scholar] [CrossRef]
  17. Corcoran, E.; Denman, S.; Hanger, J.; Wilson, B.; Hamilton, G. Automated detection of koalas using low-level aerial surveillance and machine learning. Sci. Rep. 2019, 9, 3208. [Google Scholar] [CrossRef] [PubMed]
  18. Koski, W.R.; Abgrall, P.; Yazvenko, S.B. An inventory and evaluation of unmanned aerial systems for offshore surveys of marine mammals. J. Cetacean Res. Manag. 2010, 11, 239–247. [Google Scholar] [CrossRef]
  19. Linchant, J.; Lisein, J.; Semeki, J.; Lejeune, P.; Vermeulen, C. Are unmanned aircraft systems (UAVs) the future of wildlife monitoring? A review of accomplishments and challenges. Mammal Rev. 2015, 45, 239–252. [Google Scholar] [CrossRef]
  20. Christiansen, F.; Dujon, A.M.; Sprogis, K.R.; Arnould, J.P.Y.; Bejder, L. Noninvasive unmanned aerial vehicle provides estimates of the energetic cost of reproduction in humpback whales. Ecosphere 2016, 7, e01468. [Google Scholar] [CrossRef]
  21. Krause, D.J.; Hinke, J.T.; Perryman, W.L.; Goebel, M.E.; LeRoi, D.J. An accurate and adaptable photogrammetric approach for estimating the mass and body condition of pinnipeds using an unmanned aerial system. PLoS ONE 2017, 12, e0187465. [Google Scholar] [CrossRef]
  22. Fiori, L.; Doshi, A.; Martinez, E.; Orams, M.B.; Bollard-Breen, B. The use of unmanned aerial systems in marine mammal research. Remote Sens. 2017, 9, 543. [Google Scholar] [CrossRef]
  23. Pasetto, D.; Arenas-Castro, S.; Bustamante, J.; Casagrandi, R.; Chrysoulakis, N.; Cord, A.F.; Dittrich, A.; Domingo-Marimon, C.; El Serafy, G.; Karnieli, A. Integration of satellite remote sensing data in ecosystem modelling at local scales: Practices and trends. Methods Ecol. Evol. 2018, 9, 1810–1821. [Google Scholar] [CrossRef]
  24. Wich, S.A.; Piel, A.K. Conservation Technology; Oxford University Press: Oxford, UK, 2021; ISBN 0192590847. [Google Scholar]
  25. Stapleton, S.; LaRue, M.A.; Lecomte, N.; Atkinson, S.; Garshelis, D.; Porter, C.; Atwood, T. Polar bears from space: Assessing satellite imagery as a tool to track Arctic wildlife. PLoS ONE 2014, 9, e101513. [Google Scholar] [CrossRef]
  26. Hollings, T.; Burgman, M.; van Andel, M.; Gilbert, M.; Robinson, T.; Robinson, A. How do you find the green sheep? A critical review of the use of remotely sensed imagery to detect and count animals. Methods Ecol. Evol. 2018, 9, 881–892. [Google Scholar] [CrossRef]
  27. LaRue, M.A.; Stapleton, S.; Anderson, M. Feasibility of using high-resolution satellite imagery to assess vertebrate wildlife populations. Conserv. Biol. 2017, 31, 213–220. [Google Scholar] [CrossRef] [PubMed]
  28. Pettorelli, N.; Laurance, W.F.; O’Brien, T.G.; Wegmann, M.; Nagendra, H.; Turner, W. Satellite remote sensing for applied ecologists: Opportunities and challenges. J. Appl. Ecol. 2014, 51, 839–848. [Google Scholar] [CrossRef]
  29. Abileah, R. Marine mammal census using space satellite imagery. U.S. Navy J. Underw. Acoust. 2002, 52, 709–723. [Google Scholar]
  30. Brown, J.; Qiao, Y.; Clark, C.; Lomax, S.; Rafique, K.; Sukkarieh, S. Automated aerial animal detection when spatial resolution conditions are varied. Comput. Electron. Agric. 2022, 193, 106689. [Google Scholar] [CrossRef]
  31. Rush, G.P.; Clarke, L.E.; Stone, M.; Wood, M.J. Can drones count gulls? Minimal disturbance and semiautomated image processing with an unmanned aerial vehicle for colony-nesting seabirds. Ecol. Evol. 2018, 8, 12322–12334. [Google Scholar] [CrossRef] [PubMed]
  32. Fretwell, P.T.; LaRue, M.A.; Morin, P.; Kooyman, G.L.; Wienecke, B.; Ratcliffe, N.; Fox, A.J.; Fleming, A.H.; Porter, C.; Trathan, P.N. An emperor penguin population estimate: The first global, synoptic survey of a species from space. PLoS ONE 2012, 7, e33751. [Google Scholar] [CrossRef]
  33. Fudala, K.; Bialik, R.J. The use of drone-based aerial photogrammetry in population monitoring of Southern Giant Petrels in ASMA 1, King George Island, maritime Antarctica. Glob. Ecol. Conserv. 2022, 33, e01990. [Google Scholar] [CrossRef]
  34. Yang, Z.; Wang, T.; Skidmore, A.K.; de Leeuw, J.; Said, M.Y.; Freer, J. Spotting East African mammals in open savannah from space. PLoS ONE 2015, 9, e115989. [Google Scholar] [CrossRef]
  35. Corcoran, E.; Winsen, M.; Sudholz, A.; Hamilton, G. Automated detection of wildlife using drones: Synthesis, opportunities and constraints. Methods Ecol. Evol. 2021, 12, 1103–1114. [Google Scholar] [CrossRef]
  36. McMahon, C.R.; Howe, H.; van den Hoff, J.; Alderman, R.; Brolsma, H.; Hindell, M.A. Satellites, the all-seeing eyes in the sky: Counting elephant seals from space. PLoS ONE 2014, 9, e92613. [Google Scholar] [CrossRef] [PubMed]
  37. Fudala, K.; Bialik, R.J. Seals from outer space—Population census of southern elephant seals using VHR satellite imagery. Remote Sens. Appl. Soc. Environ. 2022, 28, 100836. [Google Scholar] [CrossRef]
  38. Mustafa, O.; Braun, C.; Esefeld, J.; Knetsch, S.; Maercker, J.; Pfeifer, C.; Rümmler, M.-C. Detecting Antarctic seals and flying seabirds usign UAV. ISPRS Ann. Photogramm. Remote Sens. Spat. Inf. Sci. 2019, IV-2/W5, 141–148. [Google Scholar] [CrossRef]
  39. Fischbach, A.S.; Douglas, D.C. Evaluation of satellite imagery for monitoring Pacific walruses at a large coastal haulout. Remote Sens. 2021, 13, 4266. [Google Scholar] [CrossRef]
  40. LaRue, M.A.; Salas, L.; Nur, N.; DG, A.; Stammerjohn, S.; Barrington, L.; Stamatiou, K.; Pennycook, J.; Dozier, M.; Saints, J.; et al. Physical and ecological factors explain the distribution of Ross Sea Weddell seals during the breeding season. Mar. Ecol. Prog. Ser. 2019, 612, 193–208. [Google Scholar] [CrossRef]
  41. Wege, M.; Salas, L.; LaRue, M.A. Ice matters: Life-history strategies of two Antarctic seals dictate climate change eventualities in the Weddell Sea. Glob. Chang. Biol. 2021, 27, 6252–6262. [Google Scholar] [CrossRef]
  42. Barber-Meyer, S.M.; Kooyman, G.L.; Ponganis, P.J. Estimating the relative abundance of Emperor penguins at inaccessible colonies using satellite imagery. Polar Biol. 2007, 30, 1565–1570. [Google Scholar] [CrossRef]
  43. Hughes, B.J.; Martin, G.R.; Reynolds, S.J. The use of Google EarthTM satellite imagery to detect the nests of masked boobies Sula dactylatra. Wildl. Biol. 2011, 17, 210–216. [Google Scholar] [CrossRef]
  44. Swinbourne, M.J.; Taggart, D.A.; Swinbourne, A.M.; Lewis, M.; Ostendorf, B. Using satellite imagery to assess the distribution and abundance of Southern hairy-nosed wombats (Lasiorhinus latifrons). Remote Sens. Environ. 2018, 211, 196–203. [Google Scholar] [CrossRef]
  45. Velasco, M. A Quickbird’s-Eye View on Marmots. MSc Thesis, University of Twente, Enschede, The Netherlands, 2009. [Google Scholar]
  46. Turner, W.; Spector, S.; Gardiner, N.; Fladeland, M.; Sterling, E.; Steininger, M. Remote sensing for biodiversity science and conservation. Trends Ecol. Evol. 2003, 18, 306–314. [Google Scholar] [CrossRef]
  47. Maini, A.K.; Agrawal, V. Satellite Technology: Principles and Applications; John Wiley & Sons Ltd.: Hoboken, NJ, USA, 2011. [Google Scholar]
  48. Pettorelli, N.; Vik, J.O.; Mysterud, A.; Gaillard, J.-M.; Tucker, C.J.; Stenseth, N.C. Using the satellite-derived NDVI to assess ecological responses to environmental change. Trends Ecol. Evol. 2005, 20, 503–510. [Google Scholar] [CrossRef]
  49. Rees, W.G.; Brown, J.A.; Fretwell, P.T.; Trathan, P.N. What colour is penguin guano? Antarct. Sci. 2017, 29, 417–425. [Google Scholar] [CrossRef]
  50. Paterson, W.; Sparling, C.E.; Thompson, D.; Pomeroy, P.P.; Currie, J.I.; McCafferty, D.J. Seals like it hot: Changes in surface temperature of harbour seals (Phoca vitulina) from late pregnancy to moult. J. Therm. Biol. 2012, 37, 454–461. [Google Scholar] [CrossRef]
  51. Schwaller, M.R.; Benninghoff, W.S.; Olson, C.E. Prospects for satellite remote sensing of Adelie penguin rookeries. Int. J. Remote Sens. 1984, 5, 849–853. [Google Scholar] [CrossRef]
  52. Schwaller, M.R.; Lynch, H.J.; Tarroux, A.; Prehn, B. A continent-wide search for Antarctic petrel breeding sites with satellite remote sensing. Remote Sens. Environ. 2018, 210, 444–451. [Google Scholar] [CrossRef]
  53. Lynch, H.J. Satellite remote sensing for wildlife research in the polar regions. Mar. Technol. Soc. J. 2023, 57, 43–50. [Google Scholar] [CrossRef]
  54. Sellés-Ríos, B.; Flatt, E.; Ortiz-García, J.; García-Colomé, J.; Latour, O.; Whitworth, A. Warm beach, warmer turtles: Using drone-mounted thermal infrared sensors to monitor sea turtle nesting activity. Front. Conserv. Sci. 2022, 3, 954791. [Google Scholar] [CrossRef]
  55. Kays, R.; Sheppard, J.; Mclean, K.; Welch, C.; Paunescu, C.; Wang, V.; Kravit, G.; Crofoot, M. Hot monkey, cold reality: Surveying rainforest canopy mammals using drone-mounted thermal infrared sensors. Int. J. Remote Sens. 2019, 40, 407–419. [Google Scholar] [CrossRef]
  56. Lee, W.Y.; Park, M.; Hyun, C.-U. Detection of two Arctic birds in Greenland and an endangered bird in Korea using RGB and thermal cameras with an unmanned aerial vehicle (UAV). PLoS ONE 2019, 14, e0222088. [Google Scholar] [CrossRef]
  57. Rivas, A.; Chamoso, P.; González-Briones, A.; Corchado, J.M. Detection of cattle using drones and convolutional neural networks. Sensors 2018, 18, 2048. [Google Scholar] [CrossRef] [PubMed]
  58. Oishi, Y.; Oguma, H.; Tamura, A.; Nakamura, R.; Matsunaga, T. Animal detection using thermal images and its required observation conditions. Remote Sens. 2018, 10, 1050. [Google Scholar] [CrossRef]
  59. Lhoest, S.; Linchant, J.; Quevauvillers, S.; Vermeulen, C.; Lejeune, P. How many hippos (HOMHIP): Algorithm for automatic counts of animals with infra-red thermal imagery from UAV. Int. Arch. Photogramm. Remote Sens. Spat. Inf. Sci. 2015, XL-3/W3, 355–362. [Google Scholar] [CrossRef]
  60. Gooday, O.J.; Key, N.; Goldstien, S.; Zawar-Reza, P. An assessment of thermal-image acquisition with an unmanned aerial vehicle (UAV) for direct counts of coastal marine mammals ashore. J. Unmanned Veh. Syst. 2018, 6, 100–108. [Google Scholar] [CrossRef]
  61. Kellenberger, B.; Marcos, D.; Tuia, D. Detecting mammals in UAV images: Best practices to address a substantially imbalanced dataset with deep learning. Remote Sens. Environ. 2018, 216, 139–153. [Google Scholar] [CrossRef]
  62. Chrétien, L.-P.; Théau, J.; Ménard, P. Visible and thermal infrared remote sensing for the detection of white-tailed deer using an unmanned aerial system. Wildl. Soc. Bull. 2016, 40, 181–191. [Google Scholar] [CrossRef]
  63. Larsen, G.D.; Seymour, A.C.; Richmond, E.L.; Divine, L.M.; Moreland, E.E.; Newton, E.; London, J.M.; Johnston, D.W. Drones reveal spatial patterning of sympatric Alaskan pinniped species and drivers of their local distributions. Drone Syst. Appl. 2022, 10, 235–255. [Google Scholar] [CrossRef]
  64. Lee, S.; Song, Y.; Kil, S.-H. Feasibility analyses of real-time detection of wildlife using UAV-derived thermal and RGB images. Remote Sens. 2021, 13, 2169. [Google Scholar] [CrossRef]
  65. López, A.; Jurado, J.M.; Ogayar, C.J.; Feito, F.R. A framework for registering UAV-based imagery for crop-tracking in Precision Agriculture. Int. J. Appl. Earth Obs. Geoinf. 2021, 97, 102274. [Google Scholar] [CrossRef]
  66. Wolfaardt, A.; Phillips, R. Guideline Census Methodologies for Albatrosses and Petrels; Agreement on the Conservation of Albatrosses and Petrels: Hobart, TAS, Australia, 2020; pp. 1–12. Available online: https://www.acap.aq/resources/acap-conservation-guidelines (accessed on 15 November 2023).
  67. Hammond, P.S.; Francis, T.B.; Heinemann, D.; Long, K.J.; Moore, J.E.; Punt, A.E.; Reeves, R.R.; Sepúlveda, M.; Sigurðsson, G.M.; Siple, M.C.; et al. Estimating the abundance of marine mammal populations. Front. Mar. Sci. 2021, 8, 735770. [Google Scholar] [CrossRef]
  68. Poncet, S.; Wolfaardt, A.C.; Barbraud, C.; Reyes-Arriagada, R.; Black, A.; Powell, R.B.; Phillips, R.A. The distribution, abundance, status and global importance of giant petrels (Macronectes giganteus and M. halli) breeding at South Georgia. Polar Biol. 2020, 43, 17–34. [Google Scholar] [CrossRef]
  69. Robertson, G.; Moreno, C.A.; Lawton, K.; Kirkwood, R.; Valencia, J. Comparison of census methods for black-browed albatrosses breeding at the Ildefonso Archipelago, Chile. Polar Biol. 2008, 31, 153–162. [Google Scholar] [CrossRef]
  70. Planet Education and Research Program. Available online: https://www.planet.com/markets/education-and-research/ (accessed on 3 January 2024).
  71. Witharana, C.; LaRue, M.A.; Lynch, H.J. Benchmarking of data fusion algorithms in support of earth observation based Antarctic wildlife monitoring. ISPRS J. Photogramm. Remote Sens. 2016, 113, 124–143. [Google Scholar] [CrossRef]
  72. Charry, B.; Tissier, E.; Iacozza, J.; Marcoux, M.; Watt, C.A. Mapping Arctic cetaceans from space: A case study for beluga and narwhal. PLoS ONE 2021, 16, e0254380. [Google Scholar] [CrossRef]
  73. Fretwell, P.T.; Scofield, P.; Phillips, R.A. Using super-high resolution satellite imagery to census threatened albatrosses. Ibis 2017, 159, 481–490. [Google Scholar] [CrossRef]
  74. Bowler, E.; Fretwell, P.T.; French, G.; Mackiewicz, M. Using deep learning to count albatrosses from space: Assessing results in light of ground truth uncertainty. Remote Sens. 2020, 12, 2026. [Google Scholar] [CrossRef]
  75. Millner, N.; Cunliffe, A.M.; Mulero-Pázmány, M.; Newport, B.; Sandbrook, C.; Wich, S. Exploring the opportunities and risks of aerial monitoring for biodiversity conservation. Glob. Soc. Chall. J. 2023, 2, 2–23. [Google Scholar] [CrossRef]
  76. Nowlin, M.B.; Roady, S.E.; Newton, E.; Johnston, D.W. Applying unoccupied aircraft systems to study human behavior in marine science and conservation programs. Front. Mar. Sci. 2019, 6, 567. [Google Scholar] [CrossRef]
  77. Ditmer, M.A.; Werden, L.K.; Tanner, J.C.; Vincent, J.B.; Callahan, P.; Iaizzo, P.A.; Laske, T.G.; Garshelis, D.L. Bears habituate to the repeated exposure of a novel stimulus, unmanned aircraft systems. Conserv. Physiol. 2019, 7, coy067. [Google Scholar] [CrossRef]
  78. Bevan, E.; Whiting, S.; Tucker, T.; Guinea, M.; Raith, A.; Douglas, R. Measuring behavioral responses of sea turtles, saltwater crocodiles, and crested terns to drone disturbance to define ethical operating thresholds. PLoS ONE 2018, 13, e0194460. [Google Scholar] [CrossRef] [PubMed]
  79. Westoby, M.J.; Brasington, J.; Glasser, N.F.; Hambrey, M.J.; Reynolds, J.M. “Structure-from-Motion” photogrammetry: A low-cost, effective tool for geoscience applications. Geomorphology 2012, 179, 300–314. [Google Scholar] [CrossRef]
  80. Lyons, M.B.; Brandis, K.J.; Murray, N.J.; Wilshire, J.H.; McCann, J.A.; Kingsford, R.T.; Callaghan, C.T. Monitoring large and complex wildlife aggregations with drones. Methods Ecol. Evol. 2019, 10, 1024–1035. [Google Scholar] [CrossRef]
  81. Buckland, S.T.; Anderson, D.R.; Burnham, K.P.; Laake, J.L.; Borchers, D.L.; Thomas, L. Introduction to Distance Sampling; Oxford University Press: Oxford, UK, 2001. [Google Scholar]
  82. Buckland, S.T.; Anderson, D.R.; Burnham, K.P.; Laake, J.L.; Borchers, D.L.; Thomas, L. Advanced Distance Sampling; Oxford University Press: Oxford, UK, 2004. [Google Scholar]
  83. Hodgson, A.; Kelly, N.; Peel, D. Unmanned Aerial Vehicles (UAVs) for Surveying Marine Fauna: A Dugong Case Study. PLoS ONE 2013, 8, e79556. [Google Scholar] [CrossRef]
  84. Fewster, R.M.; Southwell, C.; Borchers, D.L.; Buckland, S.T.; Pople, A.R. The influence of animal mobility on the assumption of uniform distances in aerial line-transect surveys. Wildl. Res. 2008, 35, 275–288. [Google Scholar] [CrossRef]
  85. Jones, G.P. The Feasibility of Using Small Unmanned Aerial Vehicles for Wildlife Research. MSc Thesis, University of Florida, Gainesville, FL, USA, 2003. [Google Scholar]
  86. Jones, G.P.; Pearlstine, L.G.; Percival, H.F. An assessment of small unmanned aerial vehicles for wildlife research. Wildl. Soc. Bull. 2006, 34, 750–758. [Google Scholar] [CrossRef]
  87. Koski, W.R.; Allen, T.; Ireland, D.; Buck, G.; Smith, P.R.; Macrander, A.M.; Halick, M.A.; Rushing, C.; Sliwa, D.J.; McDonald, T.L. Evaluation of an unmanned airborne system for monitoring marine mammals. Aquat. Mamm. 2009, 35, 347. [Google Scholar] [CrossRef]
  88. Mulero-Pázmány, M.; Stolper, R.; van Essen, L.D.; Negro, J.J.; Sassen, T. Remotely piloted aircraft systems as a rhinoceros anti-poaching tool in Africa. PLoS ONE 2014, 9, e83873. [Google Scholar] [CrossRef] [PubMed]
  89. Johnston, D.W. Unoccupied aircraft systems in marine science and conservation. Ann. Rev. Mar. Sci. 2019, 11, 439–463. [Google Scholar] [CrossRef] [PubMed]
  90. Pfeifer, C.; Barbosa, A.; Mustafa, O.; Peter, H.-U.; Rümmler, M.-C.; Brenning, A. Using fixed-wing UAV for detecting and mapping the distribution and abundance of penguins on the South Shetlands Islands, Antarctica. Drones 2019, 3, 39. [Google Scholar] [CrossRef]
  91. Wich, S.A.; Koh, L.P. Conservation Drones: Mapping and Monitoring Biodiversity; Oxford University Press: Oxford, UK, 2018. [Google Scholar]
  92. Fretwell, P.T.; Phillips, R.A.; Brooke, M.L.; Fleming, A.H.; McArthur, A. Using the unique spectral signature of guano to identify unknown seabird colonies. Remote Sens. Environ. 2015, 156, 448–456. [Google Scholar] [CrossRef]
  93. LaRue, M.A.; Stapleton, S.; Porter, C.; Atkinson, S.; Atwood, T.; Dyck, M.; Lecomte, N. Testing methods for using high-resolution satellite imagery to monitor polar bear abundance and distribution. Wildl. Soc. Bull. 2015, 39, 772–779. [Google Scholar] [CrossRef]
  94. Chabot, D.; Stapleton, S.; Francis, C.M. Measuring the spectral signature of polar bears from a drone to improve their detection from space. Biol. Conserv. 2019, 237, 125–132. [Google Scholar] [CrossRef]
  95. Brodrick, P.G.; Davies, A.B.; Asner, G.P. Uncovering ecological patterns with convolutional neural networks. Trends Ecol. Evol. 2019, 34, 734–745. [Google Scholar] [CrossRef] [PubMed]
  96. Hossain, M.D.; Chen, D. Segmentation for Object-Based Image Analysis (OBIA): A review of algorithms and challenges from remote sensing perspective. ISPRS J. Photogramm. Remote Sens. 2019, 150, 115–134. [Google Scholar] [CrossRef]
  97. Cubaynes, H.C.; Fretwell, P.T. Whales from space dataset, an annotated satellite image dataset of whales for training machine learning models. Sci. Data 2022, 9, 245. [Google Scholar] [CrossRef] [PubMed]
  98. Humphries, G.R.W.; Naveen, R.; Schwaller, M.; Che-Castaldo, C.; McDowall, P.; Schrimpf, M.; Lynch, H.J. Mapping Application for Penguin Populations and Projected Dynamics (MAPPPD): Data and tools for dynamic management and decision support. Polar Rec. 2017, 53, 160–166. [Google Scholar] [CrossRef]
  99. McCarthy, E.D.; Martin, J.M.; Boer, M.M.; Welbergen, J.A. Ground-based counting methods underestimate true numbers of a threatened colonial mammal: An evaluation using drone-based thermal surveys as a reference. Wildl. Res. 2023, 50, 484–493. [Google Scholar] [CrossRef]
  100. Vermeulen, C.; Lejeune, P.; Lisein, J.; Sawadogo, P.; Bouché, P. Unmanned aerial survey of elephants. PLoS ONE 2013, 8, e54700. [Google Scholar] [CrossRef]
  101. Beaver, J.T.; Baldwin, R.W.; Messinger, M.; Newbolt, C.H.; Ditchkoff, S.S.; Silman, M.R. Evaluating the use of drones equipped with thermal Sensors as an effective method for estimating wildlife. Wildl. Soc. Bull. 2020, 44, 434–443. [Google Scholar] [CrossRef]
  102. Hodgson, A.J.; Kelly, N.; Peel, D. Drone images afford more detections of marine wildlife than real-time observers during simultaneous large-scale surveys. PeerJ 2023, 11, e16186. [Google Scholar] [CrossRef]
  103. Vallecillo, D.; Gauthier-Clerc, M.; Guillemain, M.; Vittecoq, M.; Vandewalle, P.; Roche, B.; Champagnon, J. Reliability of animal counts and implications for the interpretation of trends. Ecol. Evol. 2021, 11, 2249–2260. [Google Scholar] [CrossRef]
  104. Bird, C.N.; Dawn, A.H.; Dale, J.; Johnston, D.W. A semi-automated method for estimating Adélie penguin colony abundance from a fusion of multispectral and thermal imagery collected with unoccupied aircraft systems. Remote Sens. 2020, 12, 3692. [Google Scholar] [CrossRef]
  105. LaRue, M.A.; Rotella, J.J.; Garrott, R.A.; Siniff, D.B.; Ainley, D.G.; Stauffer, G.E.; Porter, C.C.; Morin, P.J. Satellite imagery can be used to detect variation in abundance of Weddell seals (Leptonychotes weddellii) in Erebus Bay, Antarctica. Polar Biol. 2011, 34, 1727. [Google Scholar] [CrossRef]
  106. ESRI. ArcGIS Pro, version 3.2; ESRI: Redlands, CA, USA, 2023. [Google Scholar]
  107. Scott, L.M.; Janikas, M. V Spatial Statistics in ArcGIS. In Handbook of Applied Spatial Analysis; Springer: Berlin/Heidelberg, Germany, 2010; pp. 27–41. [Google Scholar] [CrossRef]
  108. QGIS Geographic Information System. QGIS, version 3.34; Open Source Geospatial Foundation Project: Beaverton, OR, USA, 2023; Available online: http://qgis.org/ (accessed on 3 January 2024).
  109. GRASS Development Team. Geographic Resources Analysis Support System (GRASS) Software, version 8.2; Open Source Geospatial Foundation: Beaverton, OR, USA, 2022; Available online: https://grass.osgeo.org (accessed on 3 January 2024).
  110. Corrêa, A.A.; Quoos, J.H.; Barreto, A.S.; Groch, K.R.; Eichler, P.P.B. Use of satellite imagery to identify Southern right whales (Eubalaena australis) on a Southwest Atlantic Ocean breeding ground. Mar. Mammal Sci. 2022, 38, 87–101. [Google Scholar] [CrossRef]
  111. Wada, K. Image Polygonal Annotation with Python. Available online: https://web.archive.org/web/20240103083537/http://labelme.csail.mit.edu/Release3.0 (accessed on 3 January 2024).
  112. Dutta, A.; Zisserman, A. The VIA Annotation Software for Images, Audio and Video. In Proceedings of the 27th ACM International Conference on Multimedia, Nice, France, 21–25 October 2019; Association for Computing Machinery: New York, NY, USA, 2019; pp. 2276–2279. [Google Scholar]
  113. Nathans, J.; Thomas, D.; Hogness, D.S. Molecular genetics of human color vision: The genes encoding blue, green, and red pigments. Science 1986, 232, 193–202. [Google Scholar] [CrossRef] [PubMed]
  114. Rees, W.G. Physical Principles of Remote Sensing, 2nd ed.; Cambridge University Press: Cambridge, UK, 2012; ISBN 9780511812903. [Google Scholar]
  115. Ramos, E.A.; Santoya, L.; Verde, J.; Walker, Z.; Castelblanco-Martínez, N.; Kiszka, J.J.; Rieucau, G. Lords of the Rings: Mud ring feeding by Bottlenose dolphins in a Caribbean estuary revealed from sea, air, and space. Mar. Mammal Sci. 2022, 38, 364–373. [Google Scholar] [CrossRef]
  116. LaRue, M.A.; Lynch, H.J.; Lyver, P.O.B.; Barton, K.; Ainley, D.G.; Pollard, A.; Fraser, W.R.; Ballard, G. A method for estimating colony sizes of Adélie penguins using remote sensing imagery. Polar Biol. 2014, 37, 507–517. [Google Scholar] [CrossRef]
  117. Raoult, V.; Colefax, A.P.; Allan, B.M.; Cagnazzi, D.; Castelblanco-Martínez, N.; Ierodiaconou, D.; Johnston, D.W.; Landeo-Yauri, S.; Lyons, M.; Pirotta, V.; et al. Operational protocols for the use of drones in marine animal research. Drones 2020, 4, 64. [Google Scholar] [CrossRef]
  118. Barnas, A.F.; Chabot, D.; Hodgson, A.J.; Johnston, D.W.; Bird, D.M.; Ellis-Felege, S.N. A standardized protocol for reporting methods when using drones for wildlife research. J. Unmanned Veh. Syst. 2020, 8, 89–98. [Google Scholar] [CrossRef]
  119. Wasowski, R.J. Some ethical aspects of international satellite remote sensing. Photogramm. Eng. Remote Sens. 1991, 57, 41–48. [Google Scholar]
  120. Ersts, P.J. DotDotGoose, version 1.5.3; Center for Biodiversity and Conservation; American Museum of Natural History: New York, NY, USA, 2022; Available online: https://biodiversityinformatics.amnh.org/open_source/dotdotgoose (accessed on 3 January 2024).
  121. Borowicz, A.; Le, H.; Humphries, G.; Nehls, G.; Höschle, C.; Kosarev, V.; Lynch, H.J. Aerial-trained deep learning networks for surveying cetaceans from satellite imagery. PLoS ONE 2019, 14, e0212532. [Google Scholar] [CrossRef] [PubMed]
  122. LeCun, Y.; Bengio, Y.; Hinton, G. Deep learning. Nature 2015, 521, 436–444. [Google Scholar] [CrossRef]
  123. Weinstein, B.G. A computer vision for animal ecology. J. Anim. Ecol. 2018, 87, 533–545. [Google Scholar] [CrossRef]
  124. Gray, P.C.; Fleishman, A.B.; Klein, D.J.; McKown, M.W.; Bézy, V.S.; Lohmann, K.J.; Johnston, D.W. A convolutional neural network for detecting sea turtles in drone imagery. Methods Ecol. Evol. 2019, 10, 345–355. [Google Scholar] [CrossRef]
  125. Ren, S.; He, K.; Girshick, R.; Sun, J. Faster r-cnn: Towards real-time object detection with region proposal networks. Adv. Neural Inf. Process. Syst. 2015, 28, 91–99. [Google Scholar] [CrossRef] [PubMed]
  126. Gonçalves, B.C.; Spitzbart, B.; Lynch, H.J. SealNet: A fully-automated pack-ice seal detection pipeline for sub-meter satellite imagery. Remote Sens. Environ. 2020, 239, 111617. [Google Scholar] [CrossRef]
  127. Hoekendijk, J.P.A.; Kellenberger, B.; Aarts, G.; Brasseur, S.; Poiesz, S.S.H.; Tuia, D. Counting using deep learning regression gives value to ecological surveys. Sci. Rep. 2021, 11, 23209. [Google Scholar] [CrossRef]
  128. Forsyth, D.; Ponce, J. Computer Vision: A Modern Approach, 2nd ed.; Prentice Hall Professional Technical Reference: Hoboken, NJ, USA, 2011; ISBN 013608592X. [Google Scholar]
  129. Shrader-Frechette, K. Ethics of Scientific Research, 1st ed.; Rowan & Littlefield Publishers: Lanham, MD, USA, 1994. [Google Scholar]
  130. Planet Labs. Introducing the Pelican Constellation: Rapid, Responsive, Resilient. Available online: https://www.planet.com/products/pelican/ (accessed on 3 January 2024).
  131. Hilker, T.; Lyapustin, A.I.; Tucker, C.J.; Sellers, P.J.; Hall, F.G.; Wang, Y. Remote sensing of tropical ecosystems: Atmospheric correction and cloud masking matter. Remote Sens. Environ. 2012, 127, 370–384. [Google Scholar] [CrossRef]
  132. The European Space Agency (ESA). Umbra SAR Commercial Microsatellite Constellation. Available online: https://www.eoportal.org/other-space-activities/umbra#launches-of-umbra-satellites-in-reverse-order (accessed on 3 January 2024).
  133. European Space Agency. EoPortal. Available online: https://www.eoportal.org/satellite-missions (accessed on 15 November 2023).
  134. Commission of Earth Observation Satellites. CEOS Database. Available online: https://database.eohandbook.com/ (accessed on 15 November 2023).
  135. World Meterological Organisation Observing Systems Capability Analysis and Review Tool (OSCAR). Available online: https://database.eohandbook.com/ (accessed on 15 November 2023).
  136. Satellite Imaging Corporation. Satellite Sensors. Available online: https://www.satimagingcorp.com/satellite-sensors/ (accessed on 3 January 2024).
  137. Kelso, T.S. CelesTrak. Available online: https://celestrak.org/satcat/search.php (accessed on 17 November 2023).
  138. Krebs, G.D. Gunter’s Space Page. Available online: https://space.skyrocket.de/ (accessed on 3 January 2024).
  139. World Meterological Organisation. UMBRA-SAR. Available online: https://space.oscar.wmo.int/instruments/view/umbra_sar (accessed on 3 January 2024).
  140. e-geos. Price List 2021. Available online: https://www.e-geos.it/assets/images/test-img/cosmo-document/gd-com-20-001-e-geos-official-pricelist-june-22nd-2020.pdf (accessed on 3 January 2024).
  141. Virelli, M.; Coletta, A.; Tapete, D.; Cigna, F. COSMO-SkyMed: A satellite tool for monitoring cultural heritage. Int. Arch. Photogramm. Remote Sens. Spat. Inf. Sci. 2023, XLVIII-M-2, 1621–1627. [Google Scholar] [CrossRef]
  142. Tapete, D.; Cigna, F. COSMO-SkyMed SAR for Detection and Monitoring of Archaeological and Cultural Heritage Sites. Remote Sens. 2019, 11, 1326. [Google Scholar] [CrossRef]
  143. The European Space Agency (ESA). COSMO-SkyMed SG Overview. Available online: https://earth.esa.int/eogateway/missions/cosmo-skymed-second-generation/overview (accessed on 3 January 2024).
  144. Cloud Earth Observation Services (CLEOS). Radar. Available online: https://www.cleos.earth/SATELLITEIMAGERY/Radar?cclcl=en_US (accessed on 3 January 2024).
  145. ICEYE. ESA Third Party Mission Data. Available online: https://www.iceye.com/free-data/esa-tpm?utm_campaign=032020%20-%20Research%20Program&utm_medium=email&_hsmi=116544214&_hsenc=p2ANqtz-_mqqLikxPGFXjTtNa7s9d-hUDqO8JSW98ghRbtxk92AKIvv3U9y1BfVV4sMZsZFWKZW6svTF5OpcMOQwvBSUqtGVE21Q&utm_content=116544214&utm_source=hs (accessed on 3 January 2024).
  146. Rey, N.; Volpi, M.; Joost, S.; Tuia, D. Detecting animals in African Savanna with UAVs and the crowds. Remote Sens. Environ. 2017, 200, 341–351. [Google Scholar] [CrossRef]
  147. LaRue, M.A.; Ainley, D.G.; Pennycook, J.; Stamatiou, K.; Salas, L.; Nur, N.; Stammerjohn, S.; Barrington, L. Engaging ‘the crowd’ in remote sensing to learn about habitat affinity of the Weddell seal in Antarctica. Remote Sens. Ecol. Conserv. 2020, 6, 70–78. [Google Scholar] [CrossRef]
  148. Salas, L.; LaRue, M.A.; Nur, N.; Ainley, D.; Stammerjohn, S.; Pennycook, J.; Rotella, J.; Paterson, J.T.; Siniff, D.; Stamatiou, K. Reducing error and increasing reliability of wildlife counts from citizen science surveys: Counting Weddell Seals in the Ross Sea from satellite images. bioRxiv 2020. [Google Scholar] [CrossRef]
  149. LaRue, M.; Brooks, C.; Wege, M.; Salas, L.; Gardiner, N. High-resolution satellite imagery meets the challenge of monitoring remote marine protected areas in the Antarctic and beyond. Conserv. Lett. 2022, e12884. [Google Scholar] [CrossRef]
  150. Wege, M.; Salas, L.; LaRue, M.A. Citizen science and habitat modelling facilitates conservation planning for crabeater seals in the Weddell Sea. Divers. Distrib. 2020, 26, 1291–1304. [Google Scholar] [CrossRef]
  151. Wood, S.A.; Robinson, P.W.; Costa, D.P.; Beltran, R.S. Accuracy and precision of citizen scientist animal counts from drone imagery. PLoS One 2021, 16, e0244040. [Google Scholar] [CrossRef]
  152. World Wildlife Fund (WWF). Walrus From Space. Available online: https://www.wwf.org.uk/learn/walrus-from-space (accessed on 3 January 2024).
  153. Wild Southwest. Drones for Ducks. Available online: https://www.zooniverse.org/projects/rowan-aspire/drones-for-ducks (accessed on 15 November 2023).
  154. Wildlife From Space. Albatrosses From Space. Available online: https://www.bas.ac.uk/project/wildlife-from-space/albatrosses-from-space/ (accessed on 3 January 2024).
Figure 1. Examples of wildlife detected in satellite and UAS imagery. (a) VHR satellites can be used to count individual animals provided that they meet key detection criteria: in an open habitat, of suitable size, and of contrasting colour to the background. For instance, African elephants are visible in open savannahs using 31 cm resolution WorldView-3 imagery [14]. (b) Indirect counts can be performed for species which are not directly detectable; for example, colony sizes of emperor penguins can be estimated from the colony area or the extent of guano staining using 10 m resolution Sentinel-2 satellite imagery [15]. (c) Spectral imagery collected by UAS is typically of higher resolution than that of satellite sensors, enabling counts of smaller animals, such as black-browed albatrosses, in open habitats [16]. (d) For species in closed-cover habitats, for instance, koalas in tree canopy (shown in yellow box), thermal cameras mounted on UAS can aid detection [17]. All panels are cropped versions of the originals and are reproduced under CC BY 4.0 licenses.
Remotesensing 16 00627 g001
Figure 3. Comparison of SRS and UAS imagery of wildlife in remote locations. (a,b) Three wandering albatrosses in the same area on Prion Island, South Georgia. (a) Individual albatrosses appear as several white-cream coloured pixels in 31 cm resolution satellite imagery, whereas (b) UAS provide finer details, including body shape and whether the birds are sitting on a nest or displaying. UAS image taken with AgEgle eBee X fixed-wing UAS using the Aeria X RGB sensor © 2023 Nathan Fenney. (c) Hauled-out walruses in a 200 × 200 m image chip from the Walrus From Space crowdsourced campaign. This campaign used 31 cm to 46 cm resolution satellite images. (d) UAS imagery of walruses taken using a Mavic 3 from 55 m elevation © 2023 Hannah Cubaynes. (e) Weddell seals appear as long, dark features in 31 cm resolution satellite imagery (WorldView-3) and can be identified because of their habitat preference (fast ice) and behaviour (they are usually solitary and tend to stay near the ice edge or breathing hole, as shown here). (f) The higher image resolution of UAS allows sympatric phocid species to be identified individually. This example shows a Weddell seal on fast ice taken from 30 m elevation using a DJI Mavic 2 Pro. Credit for satellite images © 2023 Maxar Technologies.
Remotesensing 16 00627 g003
Figure 4. Flowchart describes the steps involved in using remote-sensing technologies to detect and count individuals of a given species. The steps are divided into four categories: image acquisition (blue), image processing (yellow), wildlife classification (green) and experimental design (purple). See Section 2, Section 3 and Section 4 for further details.
Remotesensing 16 00627 g004
Table 1. Workflow elements for consideration of employing unoccupied aircraft systems (UAS) in projects focused on detecting and counting wildlife.
1. Species/Habitat Specific Traits2. Key Metrics3. Platform/Sensor Selection4. Mission Planning/Execution5. Data Management/Processing
  • Availability
  • Detection probability
  • Natural history complexities
  • Behavioural complexities
  • Reaction to drones
  • Potential effects on non-target species of habitats
  • Human dimensions
  • Abundance
  • Distribution
  • Habitat relationships
  • Behavioural sampling, groups and individuals
  • Biological sampling
  • Morphological data
  • Individual identification
  • Fixed-wing, multirotor, or transitional
  • Airframe configuration
  • Flight profiles
  • Electromagnetic spectrum considerations (RGB, multispectral, thermal, etc.)
  • Resolution, accuracy, precision, sensitivity
  • Location
  • Habitat type
  • Time of day, season, and other temporal factors
  • Launch and recovery
  • Flight profile—altitude, speed, transect spacing, camera parameters
  • Appropriate failsafe
  • Short and long-term storage
  • File naming conventions
  • Sensor fusion and flight log data integration
  • QA/QC
  • Processing pipeline
  • Uncertainty
  • Commitment to open science
Table 2. Capabilities of battery-powered fixed-wing, multirotor and transitional UAS platforms, adapted from Wich & Koh [91] (Table 2.1) and Wich & Piel [24] (Table 3.1).
Fixed WingMultirotorTransitional
Launch areaLargeSmallSmall
Flight duration>1 h<1 h30–60 min
PayloadLight (<1 kg)Heavy (several kg)Light (<1 kg)
Piolet experienceSubstantial trainingMinimal, however, larger systems may need more trainingIntermediate
Launch areaLargeSmallSmall
Disclaimer/Publisher’s Note: The statements, opinions and data contained in all publications are solely those of the individual author(s) and contributor(s) and not of MDPI and/or the editor(s). MDPI and/or the editor(s) disclaim responsibility for any injury to people or property resulting from any ideas, methods, instructions or products referred to in the content.

