Article

TDFPI: A Three-Dimensional and Full Parameter Inversion Model and Its Application for Building Damage Assessment in Guotun Coal Mining Areas, Shandong, China

1
Key Laboratory of Meteorological Disaster, Ministry of Education (KLME), Joint International Research Laboratory of Climate and Environment Change (ILCEC), Collaborative Innovation Center on Forecast and Evaluation of Meteorological Disasters (CIC-FEMD), Nanjing University of Information Science & Technology, Nanjing 210044, China
2
School of Remote Sensing & Geomatics Engineering, Nanjing University of Information Science & Technology, Nanjing 210044, China
3
Laboratory of Target Microwave Properties, Deqing Academy of Satellite Applications, Zhejiang 313000, China
4
Institute of Remote Sensing and Geographic Information System, Peking University, Beijing 100871, China
5
Shandong Energy Group, Luxi Mining Co., Ltd., Heze 274700, China
6
Shandong Institute of Advanced Technology, Jinan 250100, China
*
Author to whom correspondence should be addressed.
Remote Sens. 2024, 16(4), 698; https://doi.org/10.3390/rs16040698
Submission received: 3 January 2024 / Revised: 25 January 2024 / Accepted: 1 February 2024 / Published: 16 February 2024

Abstract

:
Subsidence prediction is essential for preventing and controlling geohazards in coal mining areas. However, the Interferometric Synthetic Aperture Radar (InSAR) technique is limited in deriving the goaf displacements with a large gradient and fast deformation rates, hindering its application for potential risk evaluation over the mining areas. In this study, we proposed a three-dimensional and full parameter inversion (TDFPI) model to derive the large-gradient subsidence and then investigate its application for building damage assessment over coal mining areas. By taking the Guotun coal mine as the case study, the TDFPI model was demonstrated to have effectively predicted the large-gradient deformation of the mining areas and successfully evaluated the house damage in Chelou village, which agrees well with our field investigations. Specifically, the predicted subsidence results were validated with high fitting accuracy against field measurements, with RMSE of 0.083 m and 0.102 m, respectively, on observation line A and line F. In addition, the classified damage levels are highly consistent with in situ field surveys for the house cracks in Chelou village, presenting its practicality and effectiveness for building damage evaluation, and thus can provide a useful tool for potential risk assessment and prevention over the mining areas.

1. Introduction

The exploitation of underground coal mining resources usually destroys the geological structure of the overlying rock layer. The rock movement and deformation gradually spread to the ground surface with the expansions of the underground working face scale, which often results in uneven ground subsidence [1]. In particular, in China, mining areas are usually located in mountain areas or beneath the farmlands and villages with houses and other infrastructures around them [2]. Thus, mining-induced ground deformation usually leads to series of geohazards, such as mountain landslides and serious damage to buildings and public facilities in mining areas, which severely threatens the property and life safety of residents and the normal production of coal mines, as well as the ecological safety and sustainable development of the mining area [3]. Therefore, accurate monitoring, predicting, and assessing the mining subsidence is of vital significance for mining disaster prevention and reduction, as well as the protection of the ecological environment and life safety of residents in mining areas.
The commonly employed approaches for observing ground deformation in coal mining areas are the traditional geodetic approaches with high precision, such as leveling, inclinometers, Global Navigation Satellite System (GNSS), and total station [4,5]. However, due to the point-wise measurements with low spatial resolution and high costs, the application of geodetic measurements is greatly limited in providing comprehensive and accurate information support for potential geohazards prevention and control in mining areas with complex terrain conditions [6,7]. Owing to the rapid development of satellite radar and remote sensing technologies, InSAR has become an alternative approach to traditional geodetic methods and plays an important role in monitoring surface deformation induced by coal mining activity, gas extraction activities, groundwater rebound, etc. [8,9,10,11]. And many researchers have investigated the performance of different satellite radar interferometry with different imaging modes in mapping subsidence induced by mining activity. For example, Ng explored the applicability of Radarsat-2, Sentinel-1, and ALOS-2 data for subsidence caused by longwall mining excavation [12]. Declercq investigated the post-mining ground deformations and their transition following the closure of coal mines in Belgium by utilizing three decades of MT-InSAR [13]. These studies demonstrated that InSAR techniques can overcome the limitation of point-wise traditional geodetic measurement and are capable of detecting large-scale deformation fields with theoretical accuracy reaching the millimeter level [14].
Currently, a great number of researchers have investigated and assessed the structural damage of various infrastructures in coal mining areas by adopting the InSAR technique. For instance, Bru has investigated how to control the deformation of buildings affected by subsidence based on Permanent Scatterer (PS) InSAR [15]. Diao assessed the mining-induced structural damage for buildings inside the Jiulong coal mining area based on InSAR techniques and carried out the risk grading for the village constructions [16]. They also investigated the cause of unusual ground deformation and building damage in Xinsan Mine by using InSAR technology [17]. Yang monitored the building displacements by selecting two landmark buildings in Tianjin, China, as the case study based on PS-InSAR, and proved the accuracy of PS-InSAR by comparing with leveling data [18]. Li evaluated the structural damage for infrastructures in the Panji coal mine with the combination of time-series SAR analysis and the empirical building damage modelling method [19]. Mohamadi employed a workflow method and detected the spatiotemporal patterns of abnormal vertical ground displacements in collapsed building areas with the case study in Egypt, by adopting time series PS-InSAR analysis [20]. Liu investigated the mining-induced subsidence and assessed the potential building damage in the Yangquan coal mine by integrating SBAS-InSAR and GIS (Geographic Information System) techniques [21]. Li assessed the building damage in the Huaibei mining area by employing both SBAS and PS-InSAR [22]. Anantrasirichai demonstrated the applicability of sparse satellite InSAR observations in detecting the built environment deformation in the U.K. by employing the convolutional neural network [23]. However, deformation in a mining area is usually characterized by fast subsidence rate and large deformation gradient. Some researchers, for example, Pawłuszek-Filipiak have investigated and monitored the nonlinear and fast deformation induced by the underground mining exploitation by using InSAR technique [24]. Nevertheless, the large deformation gradient usually results in serious incoherence for two SAR images, and consequently lead to interference phase unwrapping errors, especially in the central area of a mining goaf [25,26,27]. In addition, mining areas in China are usually distributed in mountainous areas or beneath the farmlands with low scattering characteristics, which often lead to serious incoherence. These objective factors impede the practical application of InSAR technology for effectively obtaining large-gradient deformation as well as the potential risk assessment in the mining area.
Given this, one of the most widely applied methods for deriving the mining-induced subsidence is still the Probability Integral Method (PIM), which requires the determination of several parameters before predicting the mining displacements [28,29,30,31]. The traditional parameter estimation methods usually adopt linear approximation, modal method, or heuristic intelligent optimization algorithm, and require long-term observed leveling data with laborious surveying and high costs [2,32]. As InSAR techniques provide a convenient data acquisition method, the PIM parameter estimation based on InSAR monitoring and intelligent optimization algorithm has been widely used [31]. For example, Zhu, Yang, and Xu proposed parameter inversion methods based on fruit fly optimization, particle swarm, simulated annealing, quantum annealing, and genetic algorithm, and also combined them with other empirical functions to improve the prediction accuracy for PIM parameters [33,34,35]. It is noted that Yang and Li have been devoted to and continuously strive to improve the methods for subsidence prediction during mining operations. For instance, they have explored and proposed various approaches such as incorporating time series functions into the traditional PIM. The functions utilized include the Prior Model, Weibull Model, and Kalman Filter, as presented in [36,37]. Additionally, they have also considered techniques such as offset tracking and the utilization of single-geometry SAR amplitude data sets by adopting the SPIKE algorithm for retrieving three-dimensional (3D) surface subsidence or 3D and time series subsidence in coal mining areas [38].
However, most of these methods heavily depend on the initial values of parameters with fast convergence rates and inevitable random errors [28,39]. In addition, the single line-of-sight (LOS) displacement obtained by the InSAR technique is difficult to accurately obtain the 3D surface displacement. Although some researchers have established 3D deformation monitoring methods, such as multi-line-of-sight D-InSAR, and the integration of D-InSAR, respectively, fused with Offset Tracking, MAI (Multi-Aperture InSAR), GNSS, and a surface prior model, these methods are mostly used for small-gradient deformation monitoring such as earthquakes, landslides, glacier movements, land subsidence along subway lines, etc. [40,41,42,43]. Research has shown that it is challenging for the single-LOS InSAR technique to directly derive the 3D surface deformation. Nevertheless, the LOS displacement is the projection of real 3D surface deformation in the LOS direction [44]. In addition, maximum detectable deformation gradient by satellite radar interferometry can be determined by a functional model when modeling the 3D relationship between the parameters of PIM and InSAR LOS deformation [45,46]. Therefore, it is theoretically possible to construct a nonlinear inversion model to retrieve the 3D and full parameters, and thus to accurately predict the coal mining subsidence and provide reliable decision support for potential risk assessments [37].
Therefore, the purpose of this study is to provide a comprehensive and refined parameter inversion and deformation prediction solution for the assessment of building damage in mining areas. To achieve this, we proposed a three-dimensional and full parameter inversion (TDFPI) model. Specifically, we first analyzed the 3D relationships between PIM principles and the high-density InSAR LOS observations, and then proposed a 3D data-driven genetic algorithm with random error elimination (GAREE) by spatial clustering to obtain the three-dimensional and full parameters of PIM as well as the goaf subsidence information. Furthermore, the accuracy of the proposed method was verified by result comparisons by taking a coal mine working face in Guotun as the case study. The building damage was also evaluated and assessed, which further validated the reliability and accuracy of the proposed TDFPI model.

2. Study Area and Data Description
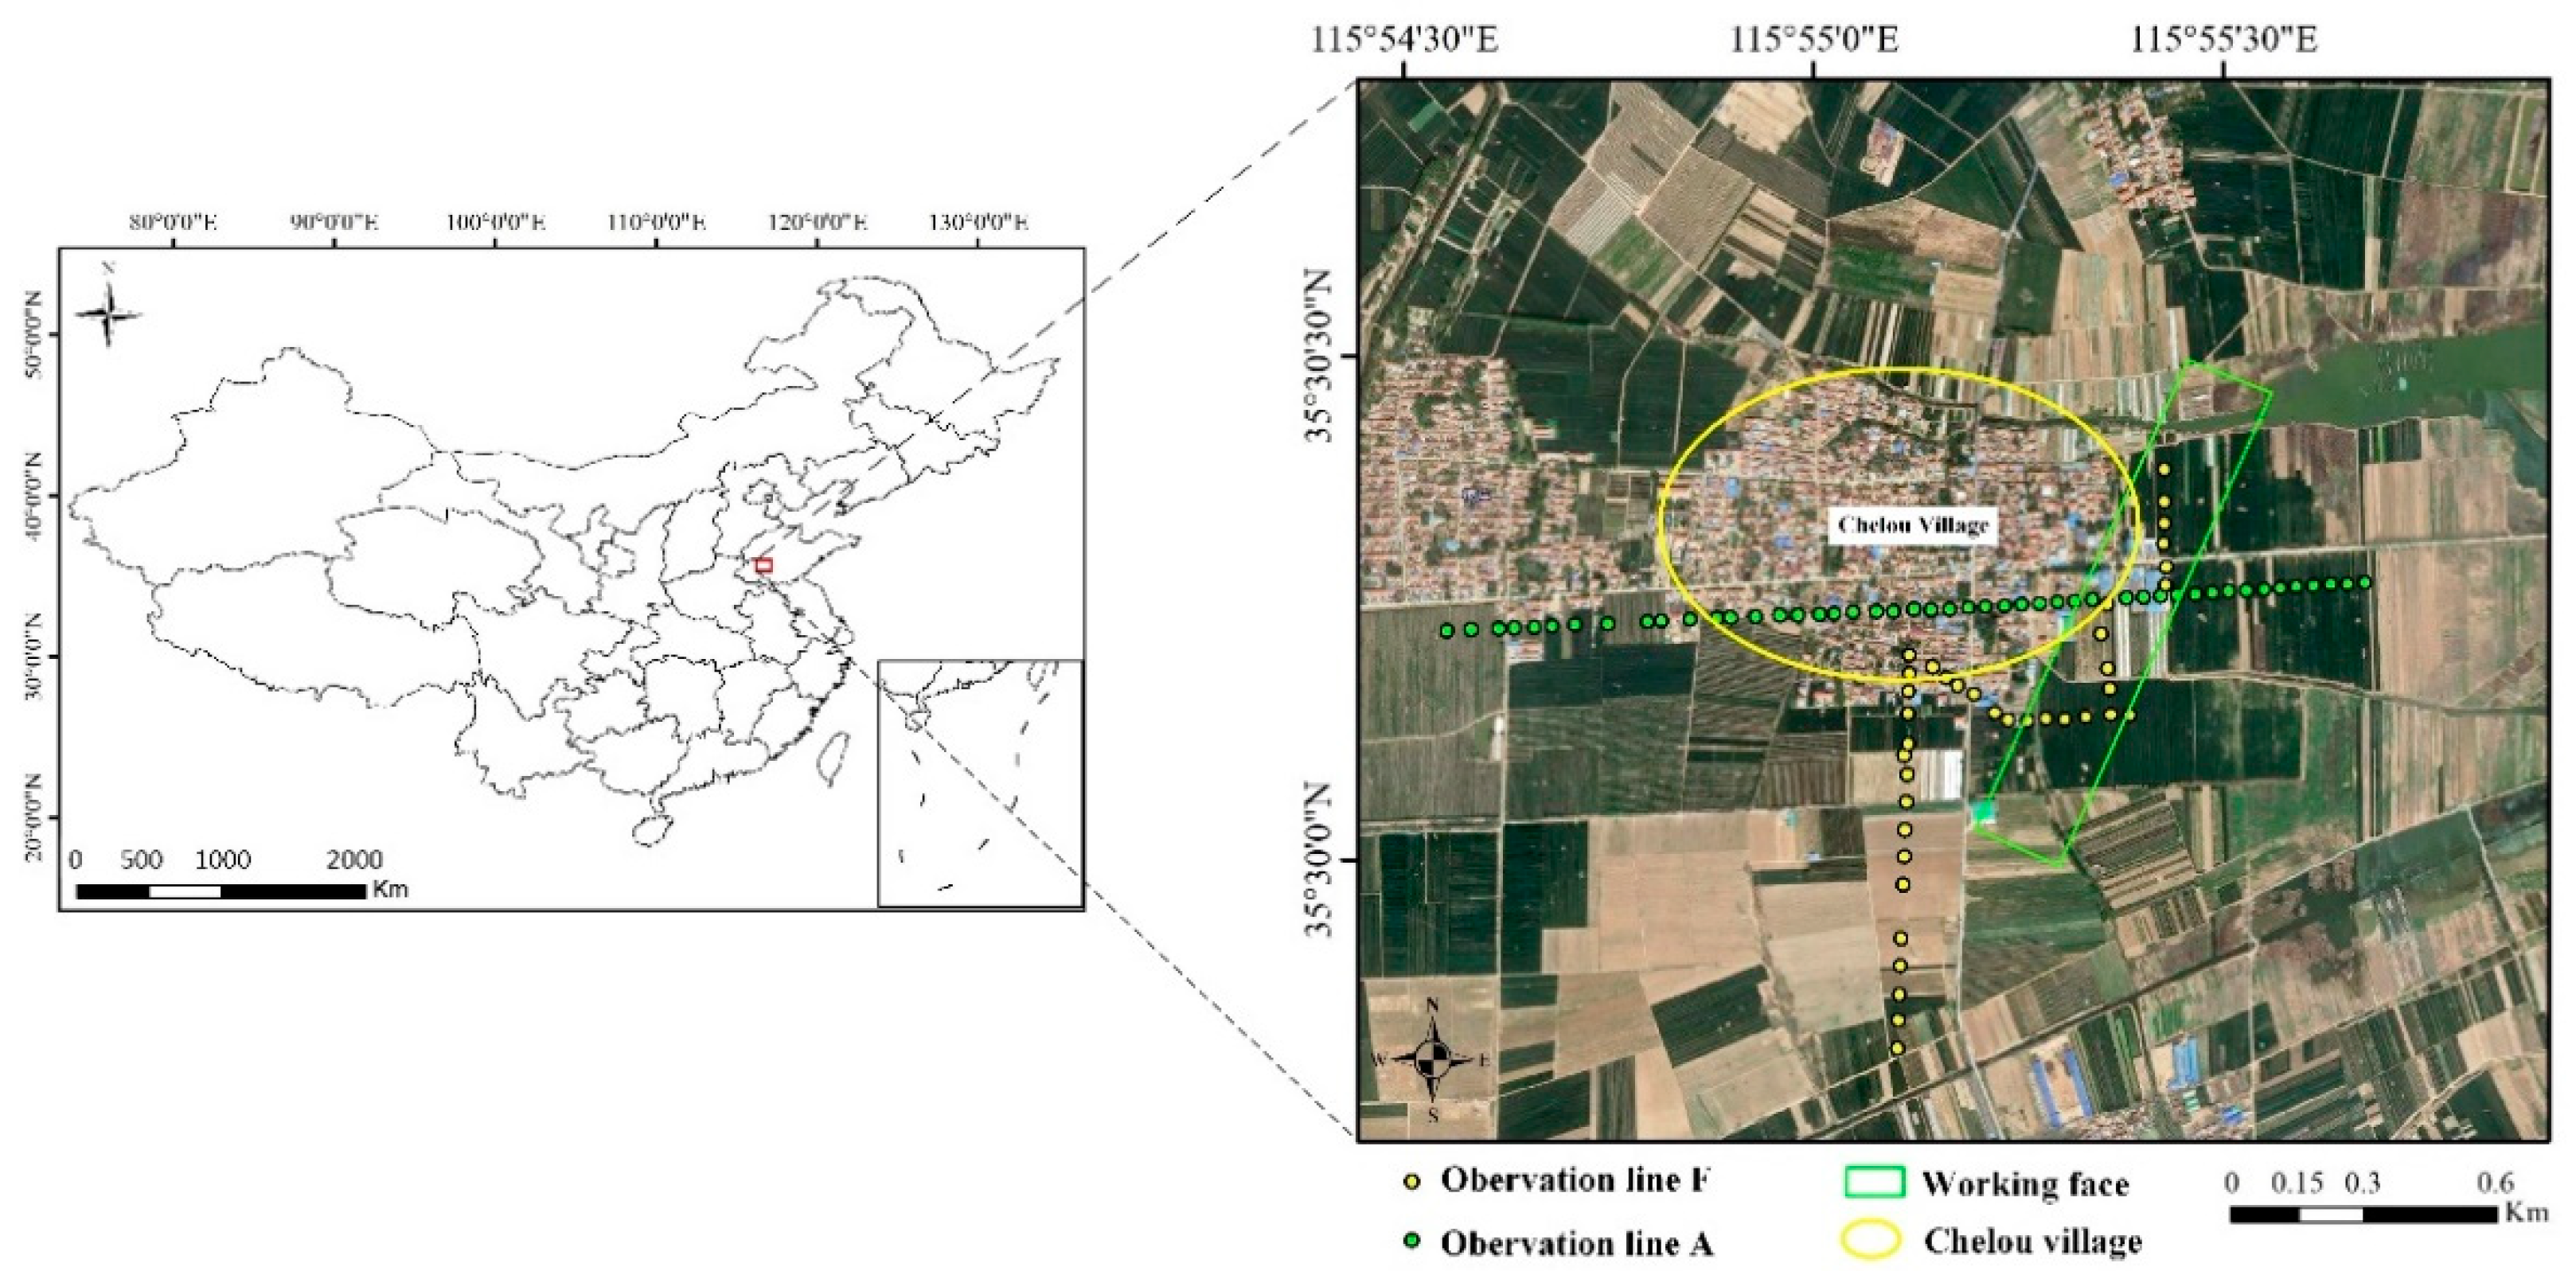
2.1. Study Area

In this study, a coal mine working face in Guotun is selected as the case example, which is situated in Shandong Province, China. The Guotun coal mine is about 13 km wide and 14 km long, with a total area of approximately 180 km2, and with an altitude between +38 and +47 m. It is noted that the study area is adjacent to the Yellow River floodplain with lots of rainfall in summer, and the areas are mainly covered by surface vegetation, farmlands, and houses. The ground subsidence can lead to the serious collapse of farmlands, and roads as well as severe damage to houses and other infrastructures. In addition, mined-out areas may become ponds if the subsidence basin areas are influenced by heavy precipitation, which would seriously affect the residents’ lives and safety.
Figure 1 illustrates the mining progress schedule of the coal mine working face (August 2017 to April 2018) inside the study area. There are two observation lines A and F with observation points number of 47 and 33, respectively. The selected working face belongs to insufficient mining, with the fundamental geometric parameters given by the mining operation regulations, including a strike/dip length of 900/170 m, thickness of the coal bed of 4 m, dip angle of the coal seam of 10°, and average mining depth of 750 m.

2.2. Data Acquisition

Sentinel-1A single-look complex (SLC) images with TOPS mode were acquired within the excavation period of the working face from 31 July 2017 to 3 May 2018. Therefore, we obtained 18 scenes of SAR images (C-band) with a time interval of 12 days, with IW (Interferometric Wideband) imaging mode and VV (Vertical–Vertical) polarization mode. In addition, Precise Orbit Ephemerides (POD) were used to correct the orbital accuracy of the SLC images, and Shuttle Radar Topography Mission data (SRTM DEM) with 30 m resolution from the United States Geological Survey (USGS) were employed to remove the topographic phase effects during the interferometric processing and also to implement the geocoding process.

3. Methodology

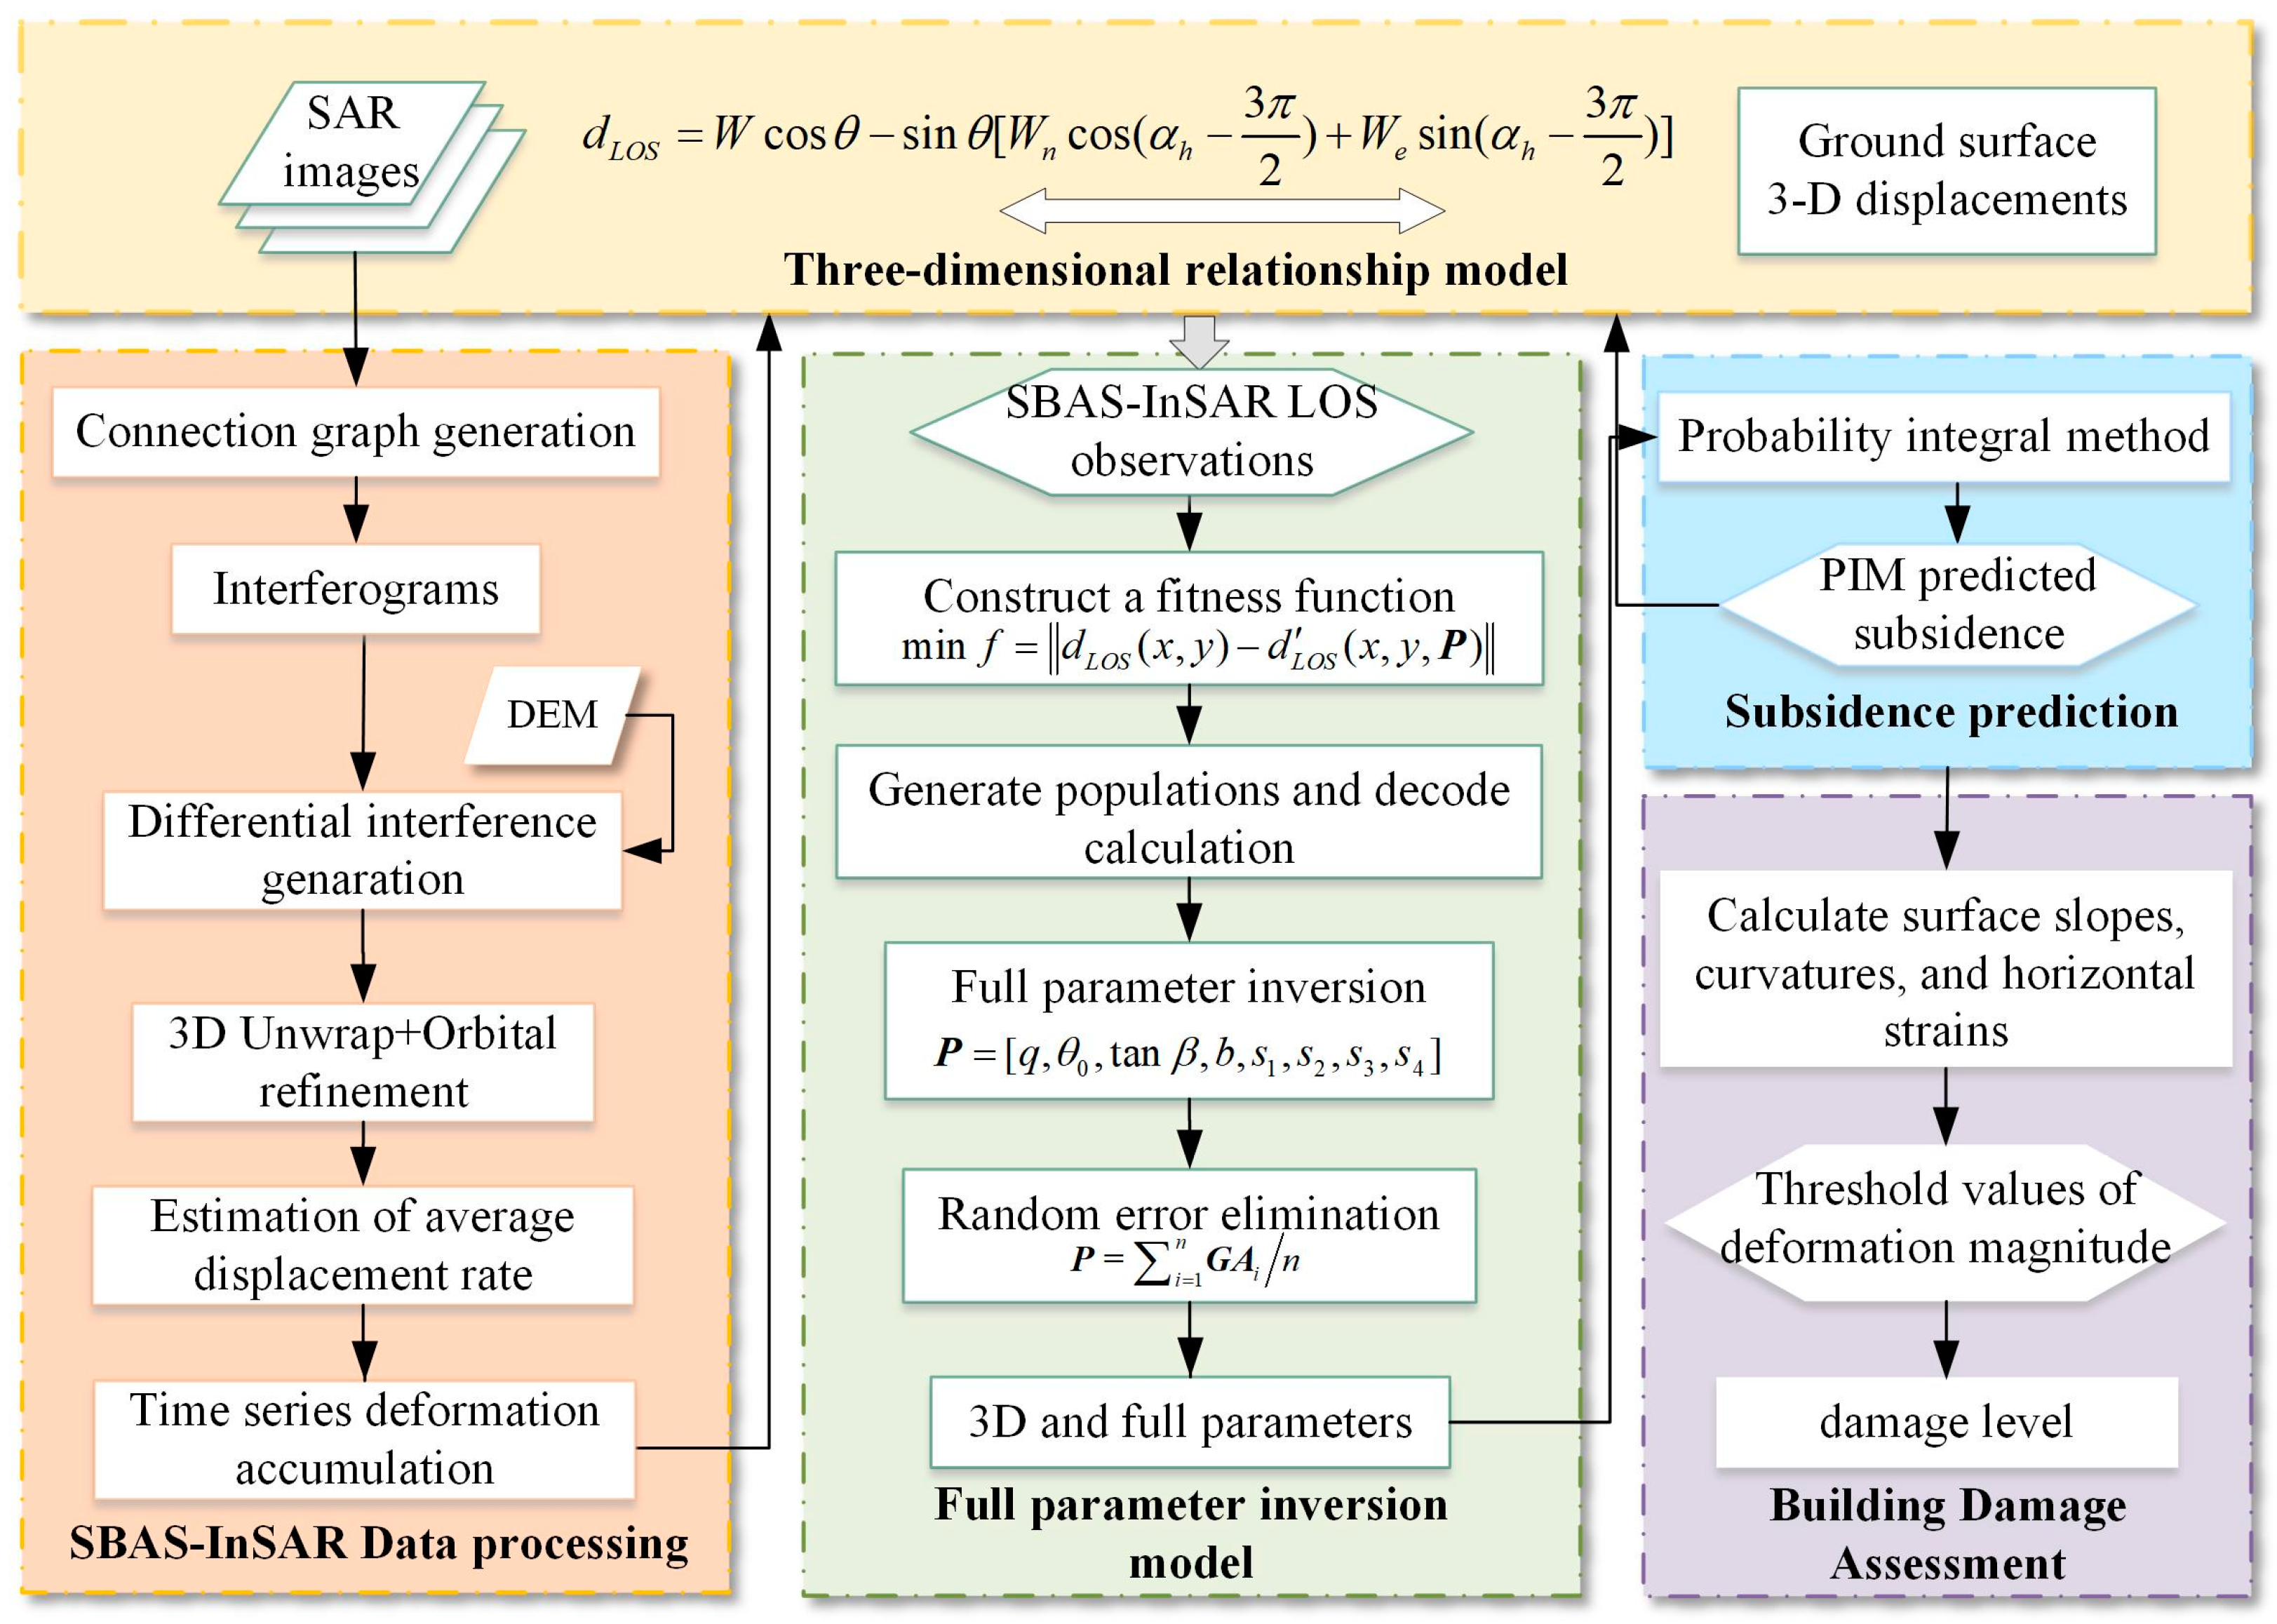
3.1. The Framework of TDFPI and Its Application for Building Damage Assessment

In this study, the time series SBAS-InSAR technique is employed due to its superiority and suitability for monitoring the mining-induced subsidence. Based on this, the specific framework incorporated with the proposed TDFPI model and its application for building damage assessment is illustrated in Figure 2. The model mainly includes five parts, and as is shown, we first construct the 3D relationship model between parameters of PIM and SBAS-InSAR LOS deformation in terms of the real 3D displacements. Then, we acquire the Sentinel-1 SAR image data and process them with procedures of image registration, generating the connected graphs and the differential interferogram, 3D unwrapping, and orbital refinement. Based on the DEM correction, atmospheric phase estimation, and subtraction, we can estimate the averaged displacement rate and achieve the mining-induced subsidence field. The specific methodology and the processing flow are subsequently described in detail.

3.2. Three-Dimensional and Full Parameter Inversion Driven by InSAR Observations

(1)
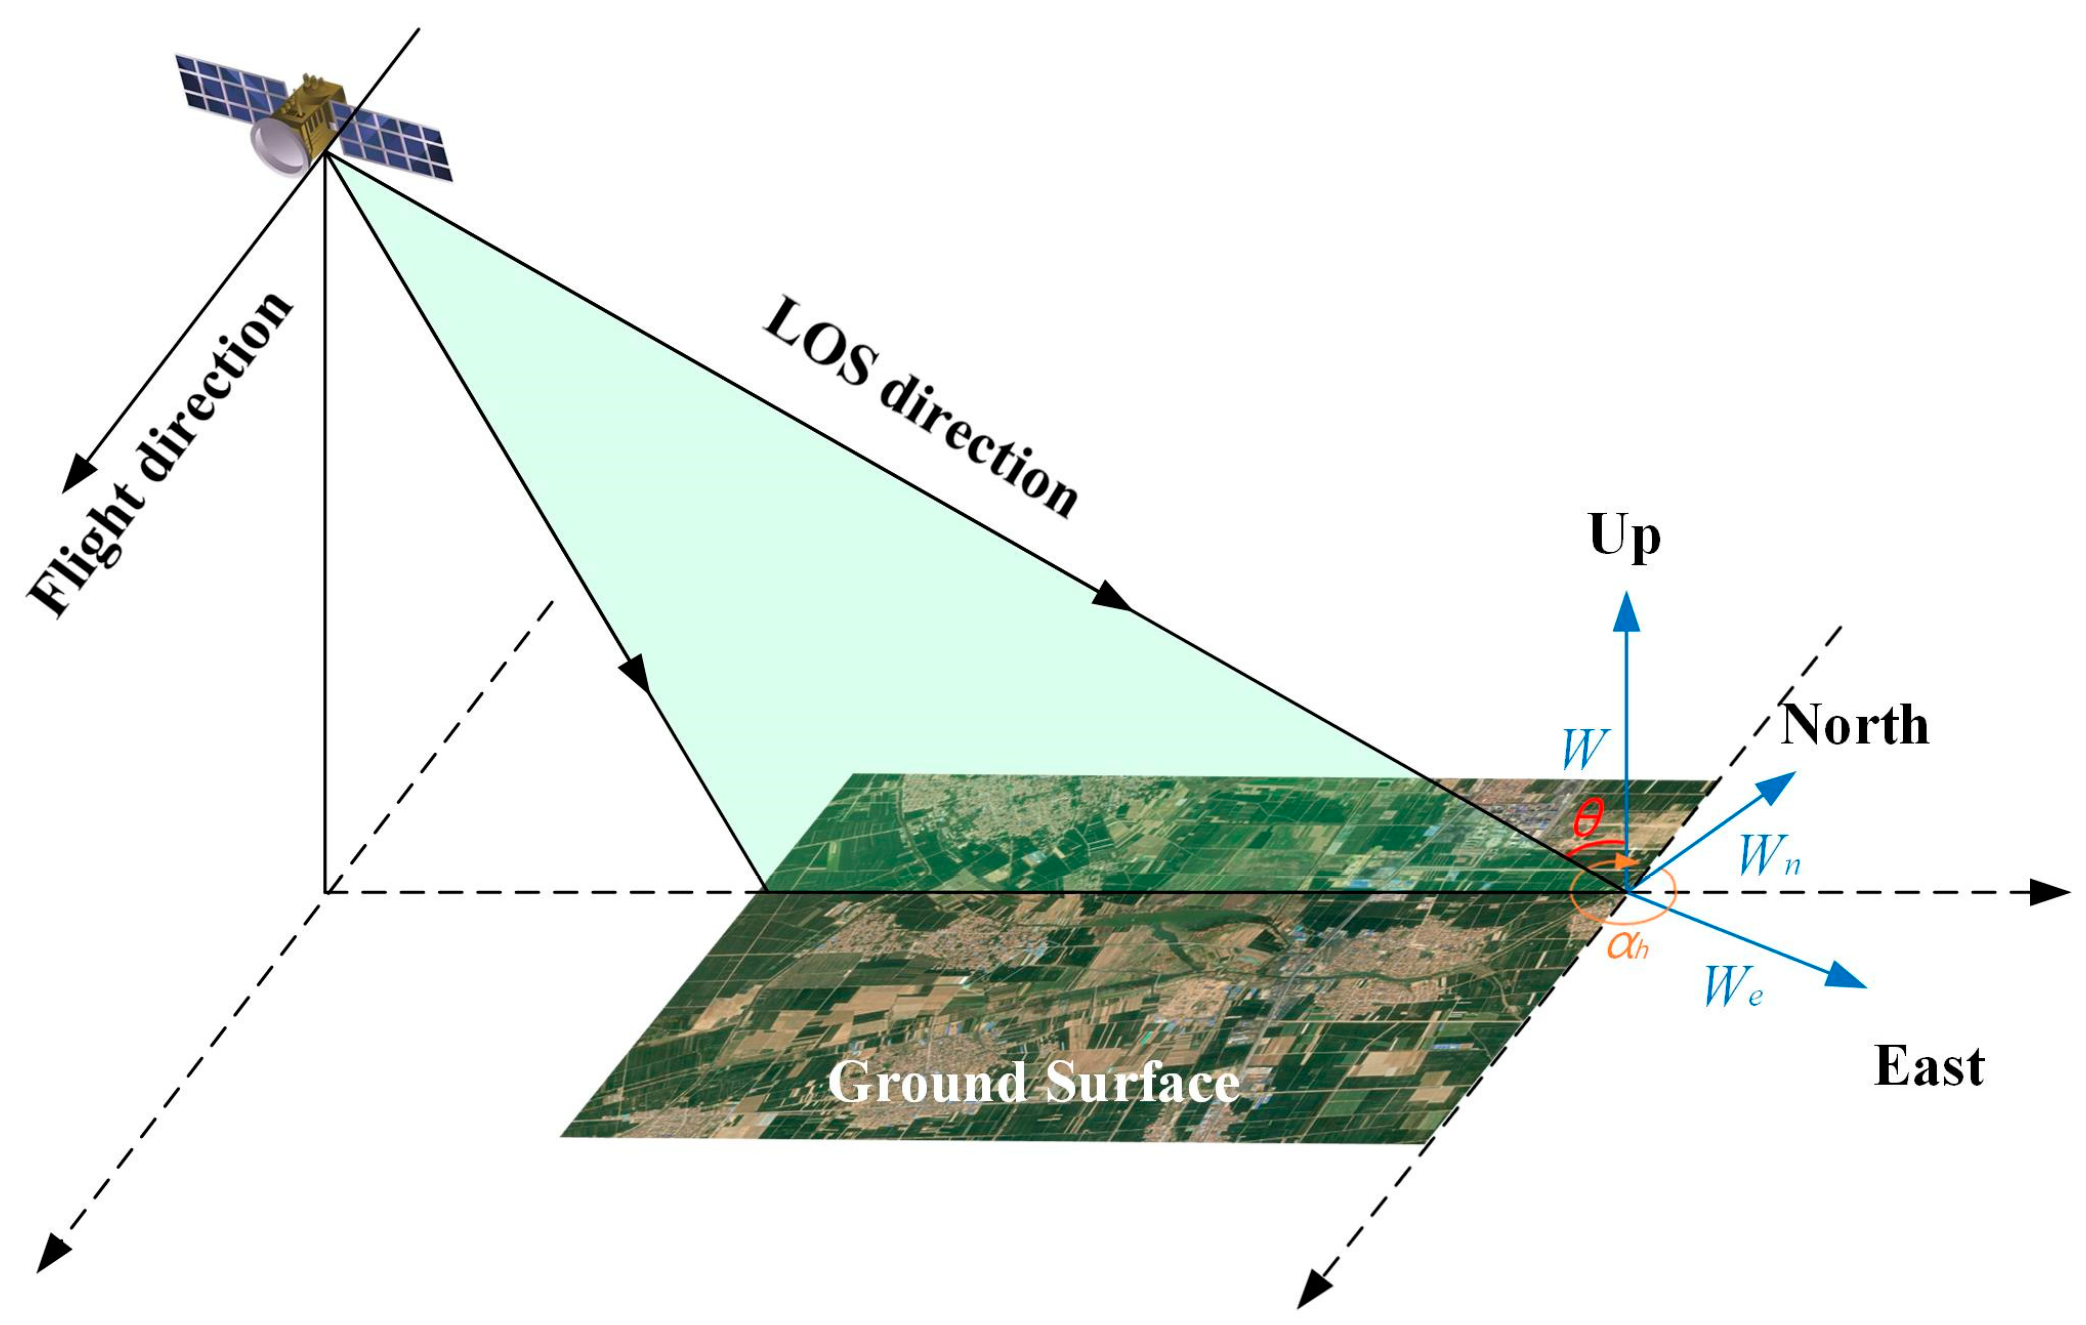
3D Analyst and Relationship Modelling for PIM and SBAS-InSAR
With the given study area, the SBAS-InSAR technique assumes that N + 1 SAR images (with the corresponding time series t0, t1, …, tn) are acquired by radar satellites, and the main image is selected with the other N images registering to the image space of the main image [21,47]. The accumulated surface deformation for each SAR image against the first SAR image can be obtained based on the SAR data process [19]. However, InSAR techniques only acquire the LOS displacement, which is the contribution of the real 3D surface displacement from three directions (west–east of We, north–south of Wn, and vertical directions of W), respectively [28], as is shown in Figure 3. The 3D relationship model can be described as
d L O S = W cos θ sin θ [ W n cos ( α h 3 π 2 ) + W e sin ( α h 3 π 2 ) ]
where θ is the incidence angle of the radar satellites, and α h is the azimuth angle for an ascending satellite orbit. For any point P (x, y) on the surface of the coal mining area, the real 3D displacements of We, Wn, and W can be calculated by using PIM principles.
W ( x , y ) = [ W 0 ( x ) W 0 ( y ) ] / W max W e ( x , y , φ e ) = [ U 0 ( x ) W 0 ( y ) cos φ e + U 0 ( y ) W 0 ( x ) sin φ e ] / W max W n ( x , y , φ n ) = [ U 0 ( x ) W 0 ( y ) cos φ n + U 0 ( y ) W 0 ( x ) sin φ n ] / W max
with:
W 0 ( x ) = W max 2 e r f π tan β H x e r f π tan β H x l W 0 ( y ) = W max 2 e r f π tan β H 1 y e r f π tan β H 2 y L U 0 ( x ) = b W max exp π ( tan β ) 2 H 2 x 2 exp π ( tan β ) 2 H 2 ( x l ) 2 U 0 ( y ) = b W max exp π ( tan β ) 2 H 1 2 y 2 exp π ( tan β ) 2 H 2 2 ( y L ) 2 cot θ W 0 ( y )
where W m a x = m q · c o s α is the maximum subsidence value, with the specific descriptions for the variables being illustrated in Table 1. To further derive the practical meaning of these parameters, we plot a diagram for coal mining excavation of a working face with the 3D view, and the 2D profiles along the strike direction and dip direction for the coal mine working face, as shown in Figure 4.
(2)
GAREE-based Full Parameter Inversion Model
Having established the parameter relationships, the three-dimensional and full parameter inversion model is constructed and the parameters are retrieved driven by high-density InSAR observations. With the consideration of the complexity of the subsidence mechanism in goaf areas and the highly non-linear characteristics of the model, a genetic algorithm with random error elimination, driven by high-density and three-dimensional InSAR observations, namely GAREE, is proposed to retrieve PIM parameters. It is noted that the traditional genetic algorithms with random operation usually result in serious random errors for parameters. Therefore, we designed the algorithm to eliminate the serious errors with the adoption of spatial clustering by conducting multiple experiments, and therefore to rapidly and efficiently achieve accurate PIM parameters. The specific procedures of the algorithm are as follows [44]:
  • Displacement projection: Having derived the SBAS-InSAR LOS observations, then project We, Wn, and W to the LOS direction of the radar based on the 3D relationship model between SBAS-InSAR LOS deformation and parameters of PIM in terms of the real 3D displacements.
  • Construct a fitness function: Minimize the binomials of the SBAS-InSAR observations of dLOS (x, y) and the prediction value of d′LOS (x, y, P), described with the minimization of objective function f at any surface point of P (x, y):
min f = d L O S ( x , y ) d L O S ( x , y , P )
3.
Generate populations: Randomly generate a certain number of target solution libraries for each parameter according to binary coding rules, and determine the range of PIM parameters based on the empirical dataset and in situ geological and mining conditions, and therefore restrict the range of the generated population.
4.
Decoding calculation: Decode the random gene pool for each parameter and calculate the fitness function value with the maximum iteration number of 20 times, the initial population value of 200, the crossover rate of 0.95, and the mutation rate of 0.05.
5.
Full parameter inversion: Retrieve the three-dimensional and full parameters of PIM by calculating the ratio of individual fitness to the sum of all individual fitness.
6.
Random error elimination: To eliminate the systematic error caused by random selection of the gene pool, repeat steps (4) to (6) to obtain m sets of results and calculate the Root Mean Square Error (RMSE) for each group of results. Then, calculate the mean value of RMSE and denote the twice the mean value of RMSE (regarded as abnormal values) as the clustering radius, and eliminate the corresponding results with RMSE greater than the clustering radius. Record the remained results set as [GA1, GA2, …, GAn], and average the result set as P = i = 1 n G A i / n , which represents the ultimately retrieved optimal 3D and full parameters of PIM.
7.
Subsidence field prediction: Predict the 3D subsidence field in accordance with the proposed TDFPI and the principles of PIM by using the retrieved parameters.

3.3. Building Damage Assessment Model in Chelou Village

Having predicted the goaf subsidence based on the proposed TDFPI model, now we can assess the building damage inside the study area. In general, mining-induced subsidence is highly non-linear and belongs to non-uniform displacement, which will seriously affect the building structure. As the selected working face is beneath the farmlands and close to Chelou village, a great number of houses in Chelou village are distributed around the coal mining area and are affected by underground mining excavation. The commonly used indicators for the classification of mining-induced structural damage to buildings mainly consists of surface slopes, curvatures, and horizontal strains [22,39,48]. As illustrated in Figure 5, with the impact of ground subsidence, the surface points A, B, and C moved to the new location, denoted as points A′, B′ and C′. Denote the vertical and horizontal displacement of points A, B, and C as W A , W B , W C and U A , U B , U C , respectively. The surface slope i refers to the ratio of the subsidence value between two adjacent points to their horizontal distance, reflecting the slope of the subsidence basin in a certain direction. Curvature K denotes the ratio between the difference in inclination of two adjacent line segments and the horizontal distance from the midpoint, representing the curvature of the subsidence curve for the surface control points. Horizontal strains ε represent the ratio between the difference in horizontal displacement of two adjacent points and their horizontal distance, reflecting the difference in horizontal movement per unit length. Here, we take points A and B as examples with their horizontal distance denoted as l A B . Therefore, the respective mathematical expressions for surface slopes i A B between points A and B, curvatures K A B C for points A, B, and C, and horizontal strains ε A B for points A and B are described as follows:
i A B = W A B / l A B , ( W A B = W B W A )
K A B C = i A B i A C 1 2 ( l A C l A B ) = 2 i A B C l A C l A B
ε A B = U A B / l A B , ( U A B = U B U A )
Table 2 presents four damage levels for brick buildings in accordance with the empirical data of mine subsidence in China. The structural damage classification is assessed and derived from the buildings’ resistance to the highest values of the three corresponding variables of surface slopes, curvatures, and horizontal strains [19]. Given the fact that the majority of houses in Chelou village are constructed with bricks, we can evaluate the progressive structural damage for the houses impacted by the Guotun coal mining excavation based on Table 2.
Based on the proposed model, except for the prediction of the mining deformation, we can also derive the variables of surface slopes, curvatures, and horizontal strains induced by mining extraction. Then, the structural damage classifications for surface buildings and houses in Chelou village can be assessed by adopting the thresholds of deformation magnitude presented in Table 2.

4. Results and Discussion

4.1. Full Parameter Inversion and Subsidence Prediction Driven by SBAS-InSAR

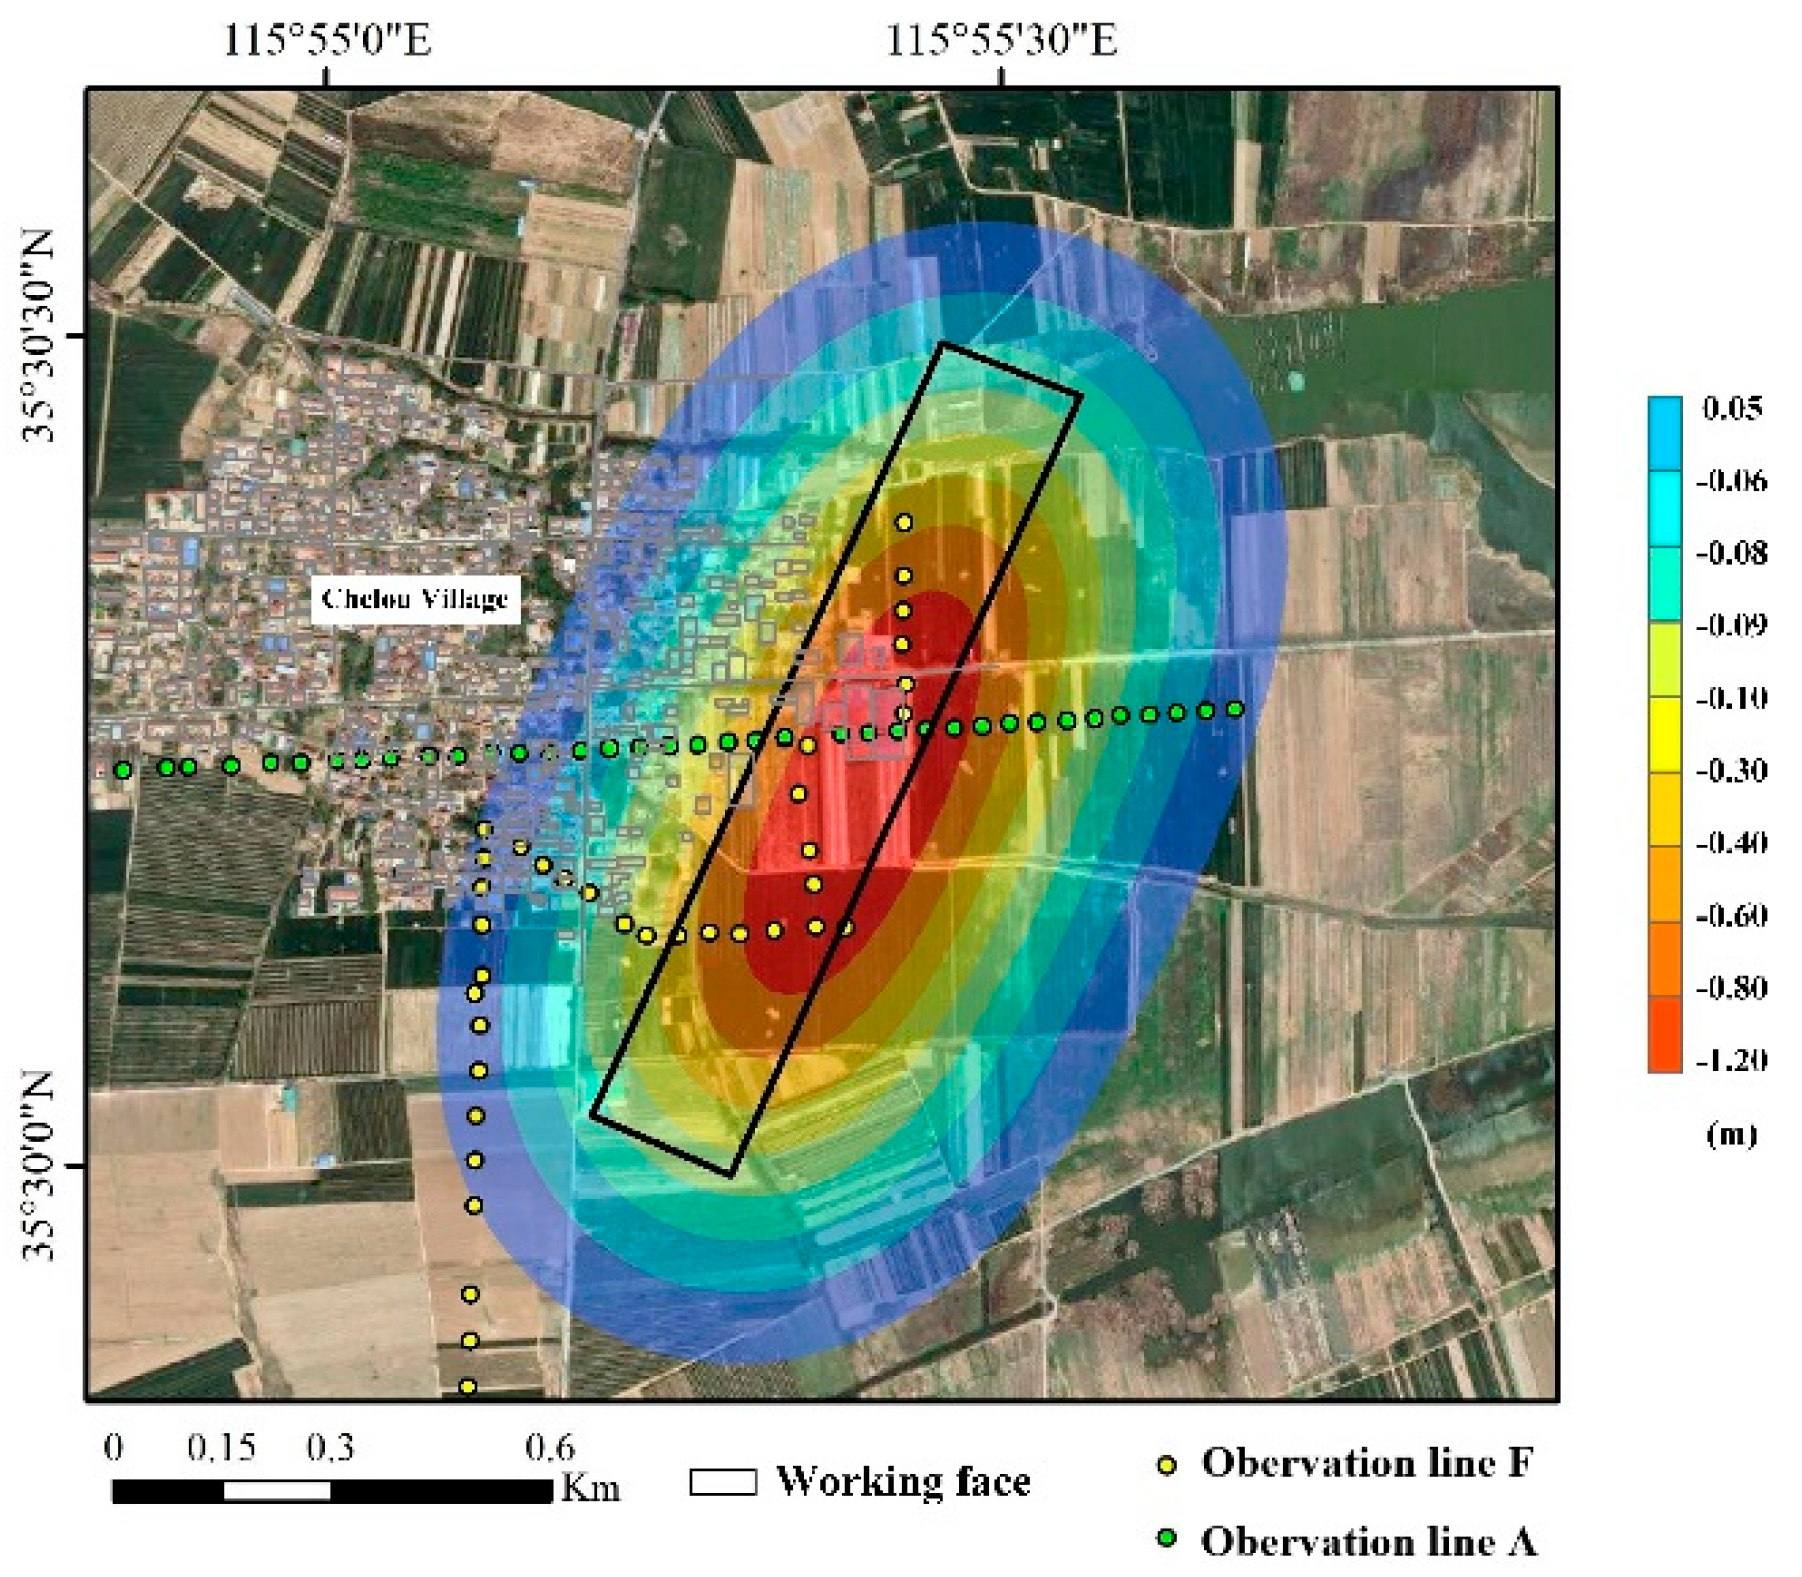
4.1.1. Spatiotemporal Displacements of the Mining Goaf Observed by SBAS-InSAR

The multi-temporal SBAS-InSAR technique was employed to process 18 scenes of SAR image, with the image acquisition date of 31 July 2017 designated as the master image. The thresholds for spatial and temporal baseline were set as 200 m and 280 days according to the small baseline principle, respectively. Therefore, a total of 136 differential interference pairs were obtained. The connection diagrams for spatiotemporal baselines are shown in Figure 6. Subsequently, the Goldstein filtering method was used to suppress the effects of interferogram noise caused by atmospheric delays, etc., and the minimum-cost flow (MCF) method was employed to unwrap the differential interferograms. Finally, the time series deformation rate for the coal mining area was obtained by projecting the interferometric phase onto the LOS direction, which was then converted to the WGS84 coordinate system by the geocoding process. Therefore, the SBAS-InSAR-derived cumulative surface displacements for the mining goaf with high point density were finally achieved, as indicated in Figure 5.
With the fact that the excavation of the working face began in August 2017 and ended in April 2018, and the observed subsidence range of the mining goaf consistently corresponds to the working face location, this indicates that the surface subsidence in this area indeed resulted from the excavation of the coal mine working face. As is demonstrated in Figure 7, the SBAS-InSAR technique effectively captured the subsidence range of the mining goaf within the study area and obtained subtle displacements at the subsidence boundary area. However, there was data loss at the center of the subsidence center, suggesting that this technique has difficulty in detecting large-gradient displacements.
To further analyze the variation trend of the goaf deformation during the mining period, we selected 17 points (P1, P2, …, P17) along the strike direction, 13 points (B1, B2, …, B13) along the dip direction of the working face, and different time series points to analyze the subsidence progress and ranges of the working face, as illustrated in Figure 8a–d. The displacement of the 17 points along the strike direction are displayed in Figure 8a,c. It can be observed that the surface subsidence forms a distinct basin shape along the strike direction. The basin center is located between points P7 and P12, with a maximum subsidence value of −115 mm. Points P1, P2, P3, and P4 are with relatively small subsidence ranging from 0 to −30 mm. Among them, Point P1 consistently exhibits subsidence between 0 and −10 mm throughout the observation period, indicating the minimal impact from the working face excavation. The points P9, P10, P11, and P12, located near the middle area of the working face, have relatively large deformation and are all consistent with the subsidence pattern induced by coal mining. In addition, the subsidence values of the 13 points along the dip direction are demonstrated in Figure 8b,d. It is clear that the surface deformation inside the study area also forms a basin shape along the dip direction. The center of the subsidence basin is between points B7 and B11. Except for the points B7 to B11, the remaining points show subsidence ranging from −30 mm to 30 mm, indicating a relatively minor impact from mining excavation around the goaf boundary area. The maximum subsidence is approximately −127 mm at the central area. The above analysis indicates that the subsidence surrounding the working face gradually expands with the entire subsidence curve forms a basin shape. The boundary area of the goaf experience minimal effects from the mining excavation and defines a distinct subsidence boundary.

4.1.2. Full Parameter Inversion and Subsidence Prediction

Driven by 3D InSAR observations, full parameters of PIM for the working face in the Guotun coal mine were simulated. Here, the parameter inversion experiments based on GAREE were conducted for totally 150 times with the random error eliminated. Finally, the parameters were retrieved with the subsidence coefficient q of 0.933, the tangent for main influence angle tanβ of 1.839, the propagation angle ϑ of 86.877, and the horizontal movement coefficient b of 0.258, and the offset distances of s3, s4, s1, and s2 were obtained as 0.250 mm, 2.469 mm, 2.243 mm, and 1.561 mm. As compared with the empirical parameters provided by the long-term field survey in the Guotun coal mine, the deviations for the first four parameters of q, tanβ, ϑ , and b are 1.686%, 0.916%, 2.385%, and 1.901%, respectively, with the empirical values of 0.949, 1.856, 89, and 0.263. The results suggest that the retrieved parameters have high consistency compared with the empirical parameters with all deviation rates lower than 2.5%, indicating that the proposed TDFPI model based on GAREE is reliable and efficient in the Guotun mine area.
With the retrieved parameters, the ground subsidence induced by coal mine excavation inside the study area was predicted by combining the geometric parameters of the working face by utilizing the PIM principles. As shown in Figure 9, the vertical and horizontal displacement field, and horizontal movement field of the mining goaf were displayed with 3D visualization. It is obvious that the excavated mining goaf formed a symmetrical subsidence basin, with the maximum vertical deformation and horizontal displacement in the goaf center area of about −1.28 m and −0.38 m, respectively. In addition, to better visualize the predicted subsidence results, we overlaid the subsidence results of the coal mining goaf with the satellite image of the study area, as illustrated in Figure 10. This overlay clearly reveals that the mining-induced subsidence area has significantly affected the houses in Chelou village.

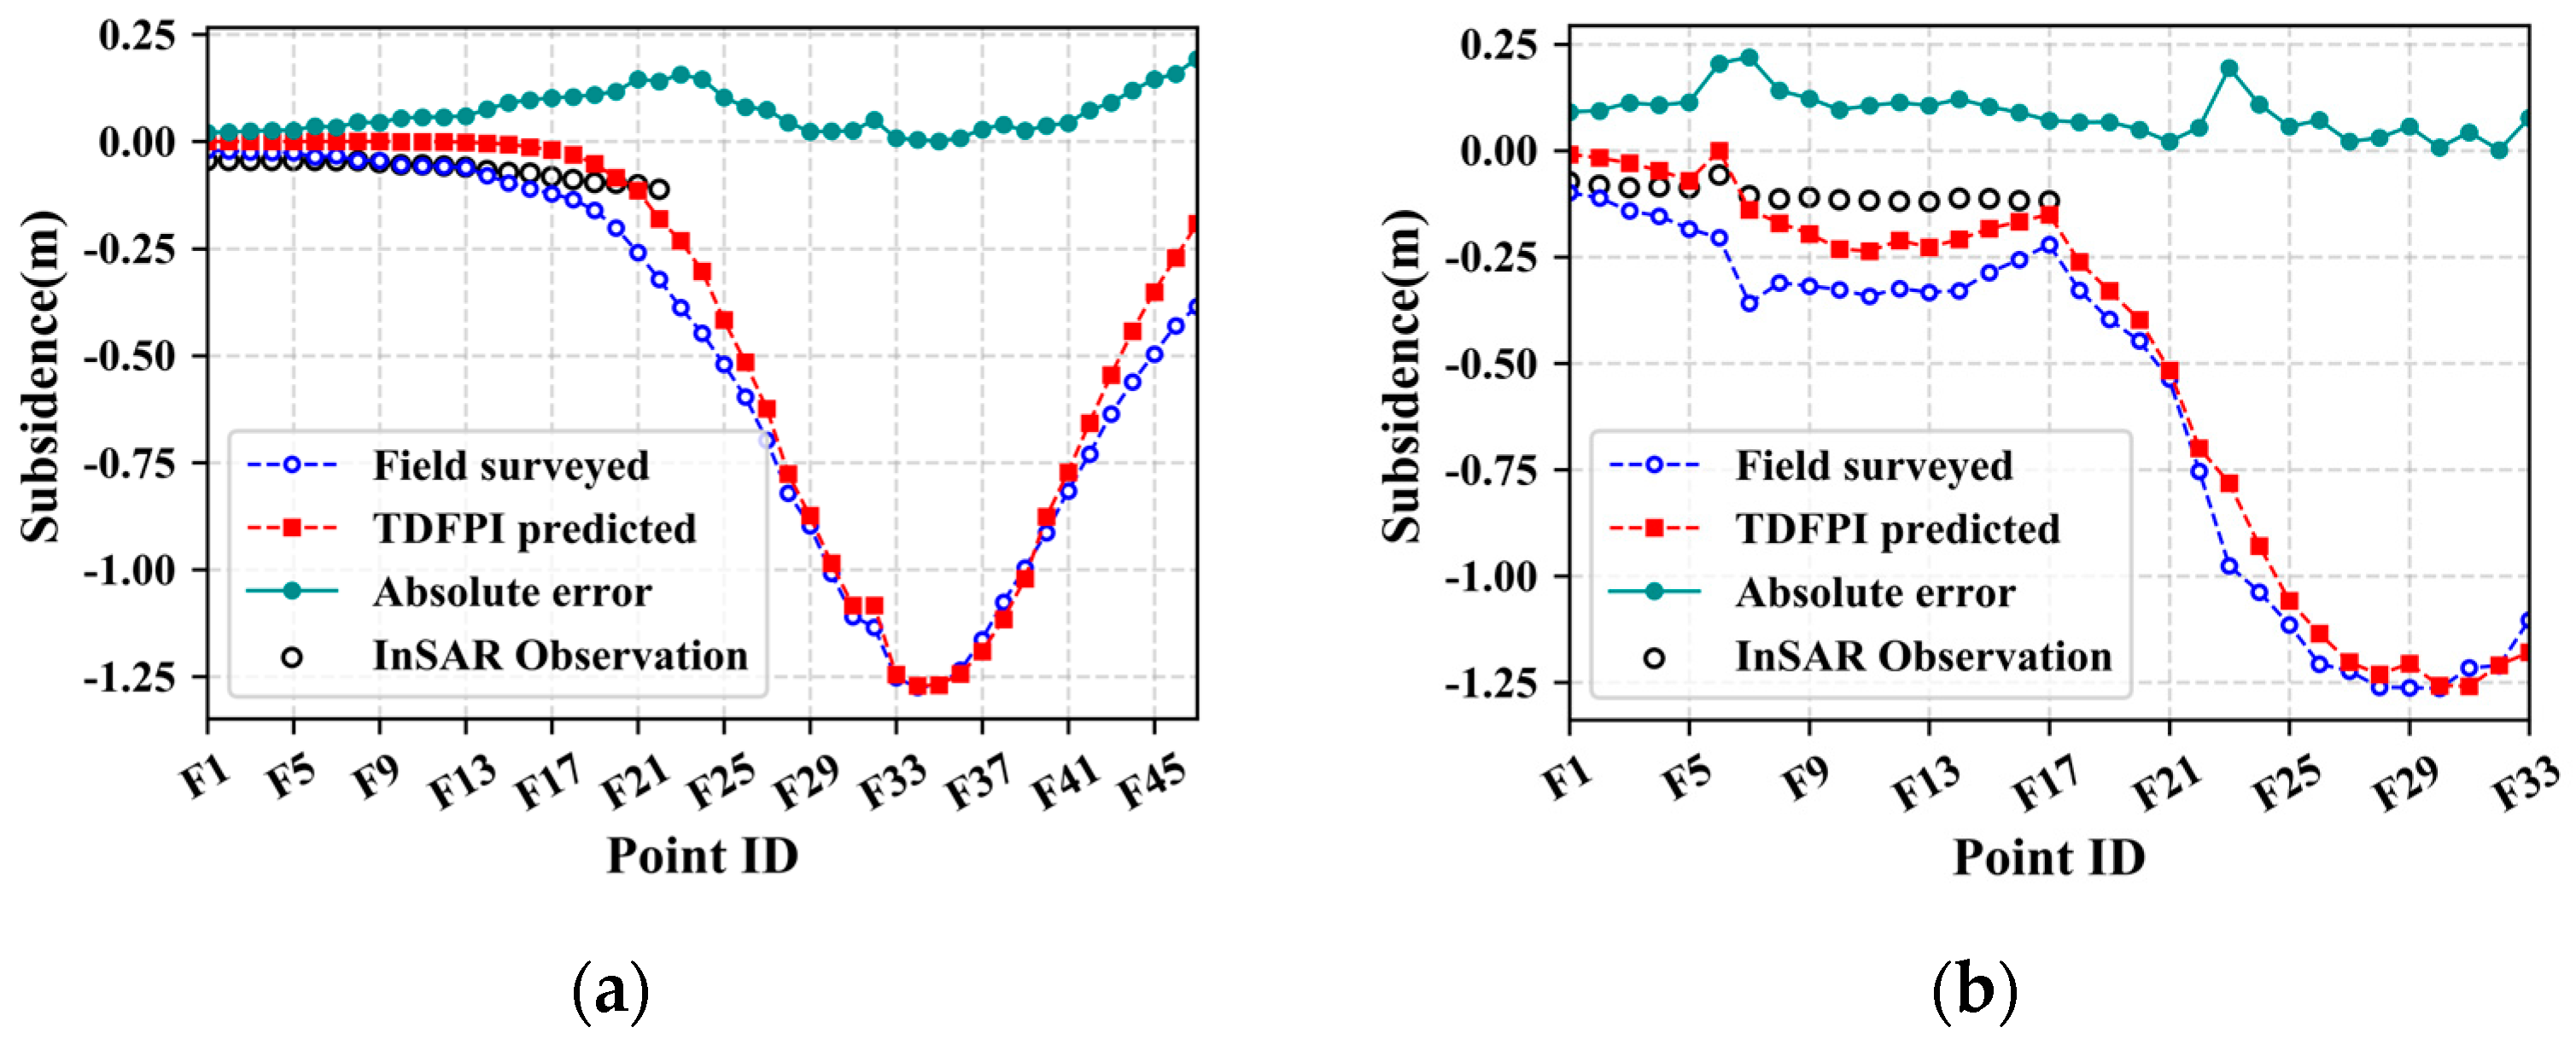
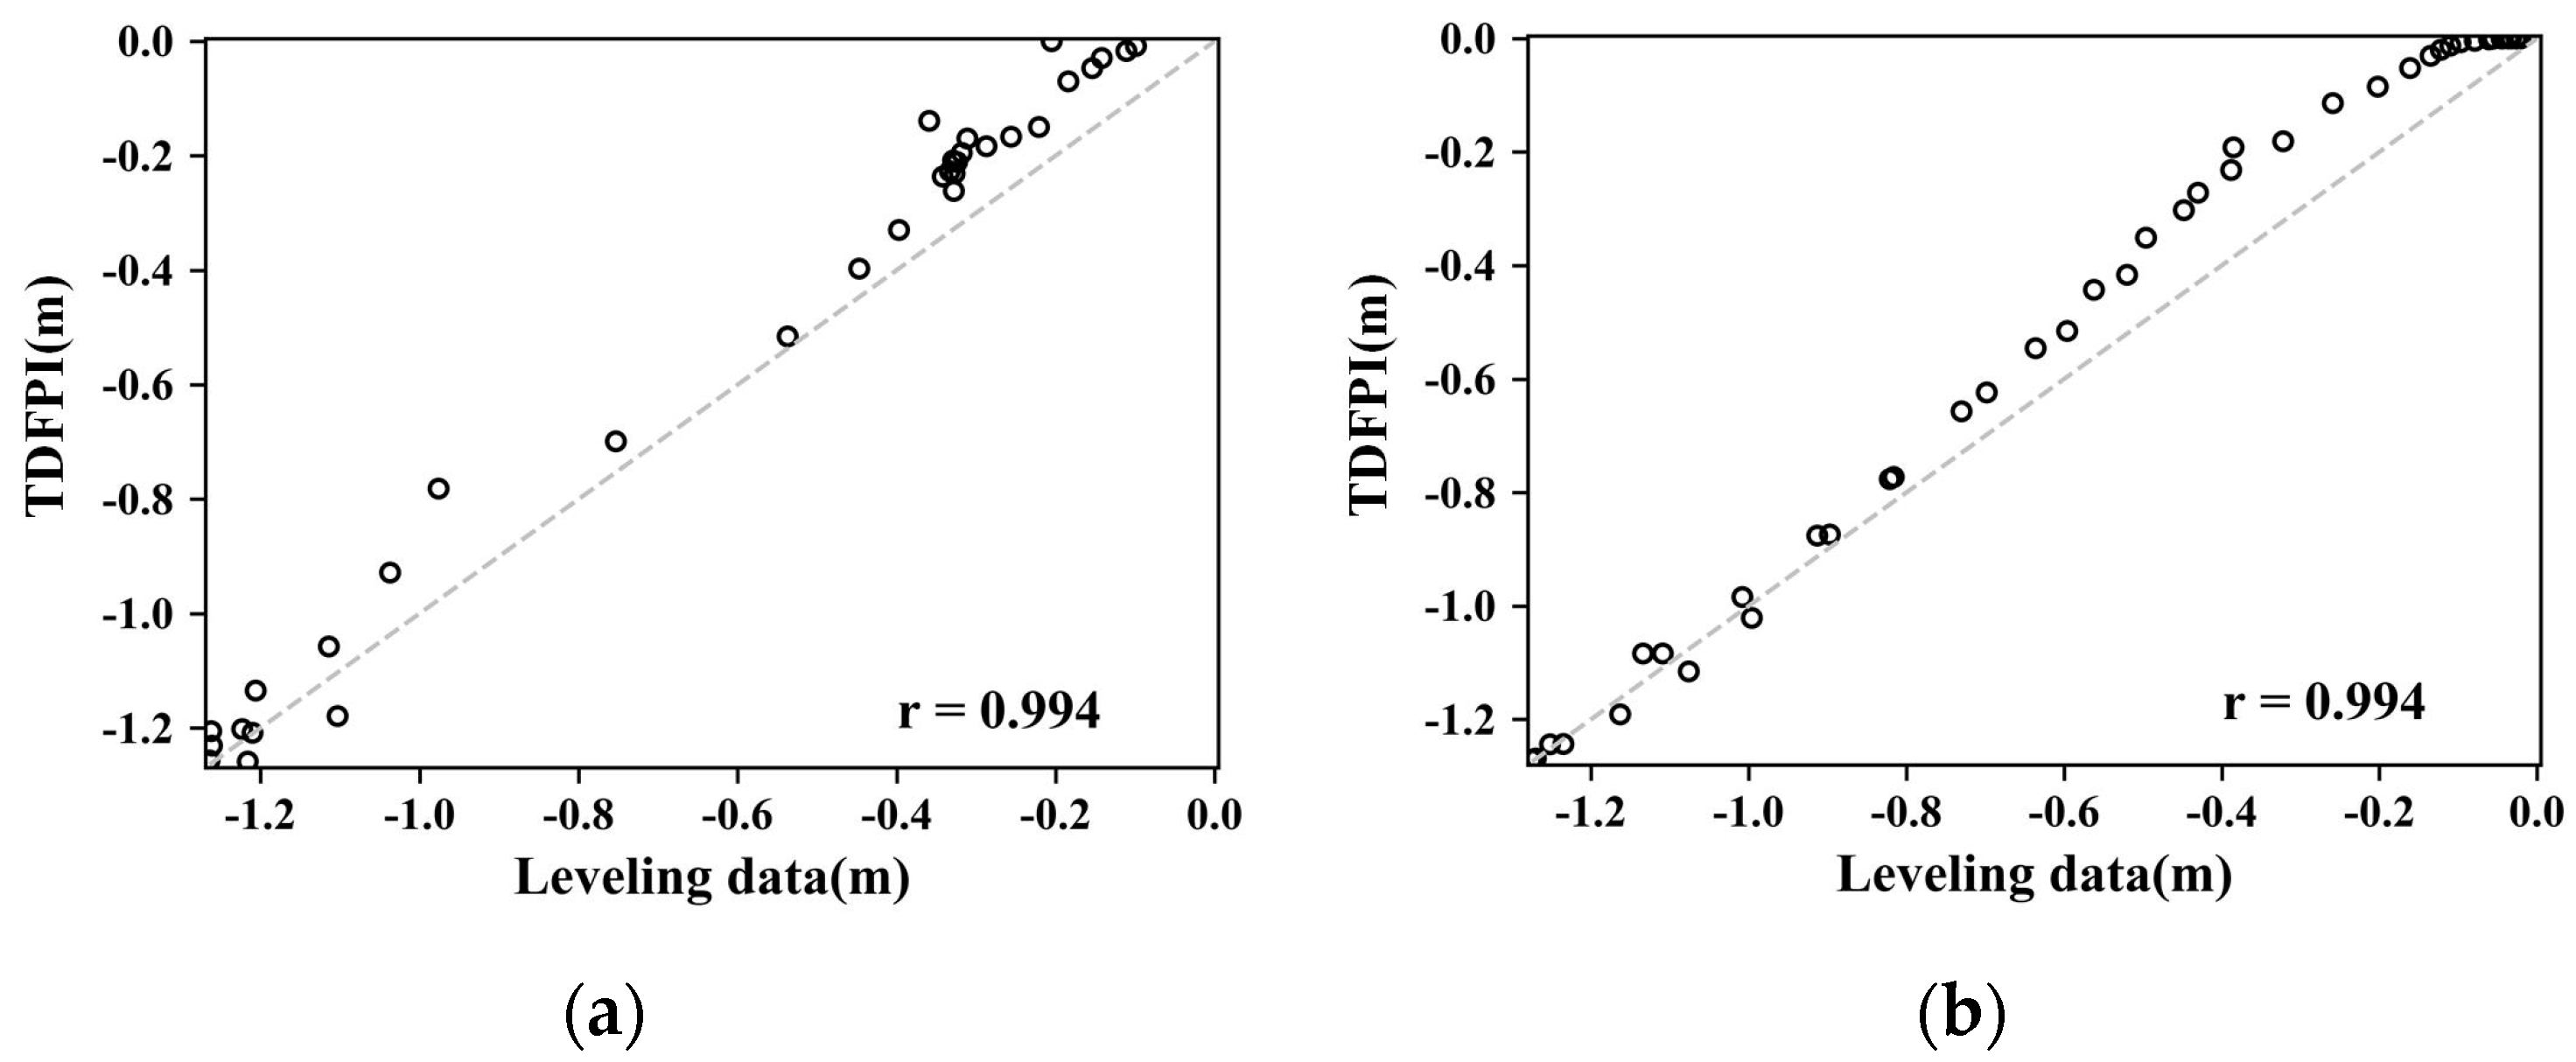
4.1.3. Results Evaluation

To evaluate the fitting accuracy of the proposed TDFPI model, the predicted subsidence was compared with the field-measured leveling data and InSAR measurements along the observation line A and line F, as shown in Figure 11a,b. The low absolute differences (the absolute value of the differences) show that the PIM predictions and field-surveyed measurements are in good agreement and the maximum subsidence value at the goaf center areas are accurately predicted. In addition, it is noted that the small-gradient displacements around the goaf boundary areas were accurately achieved by the SBAS-InSAR in this case study, while it is incapable of monitoring mining subsidence with large gradient.
Figure 12a,b shows the scatter plots of the errors between the TDFPI predicted subsidence and the field measurements on observation line A and line F, which demonstrate the high fitting accuracy between the TDFPI predictions and field-surveyed measurements. To further quantify the prediction accuracy, two statistical indicators, RMSE and MAE (Mean Absolute Error) were calculated, as demonstrated in Table 3. The comparison results with high fitting accuracy indicate that the proposed TDFPI model is highly reliable for deformation prediction with large gradient in coal mining goaf and is also applicable for building damage assessments.

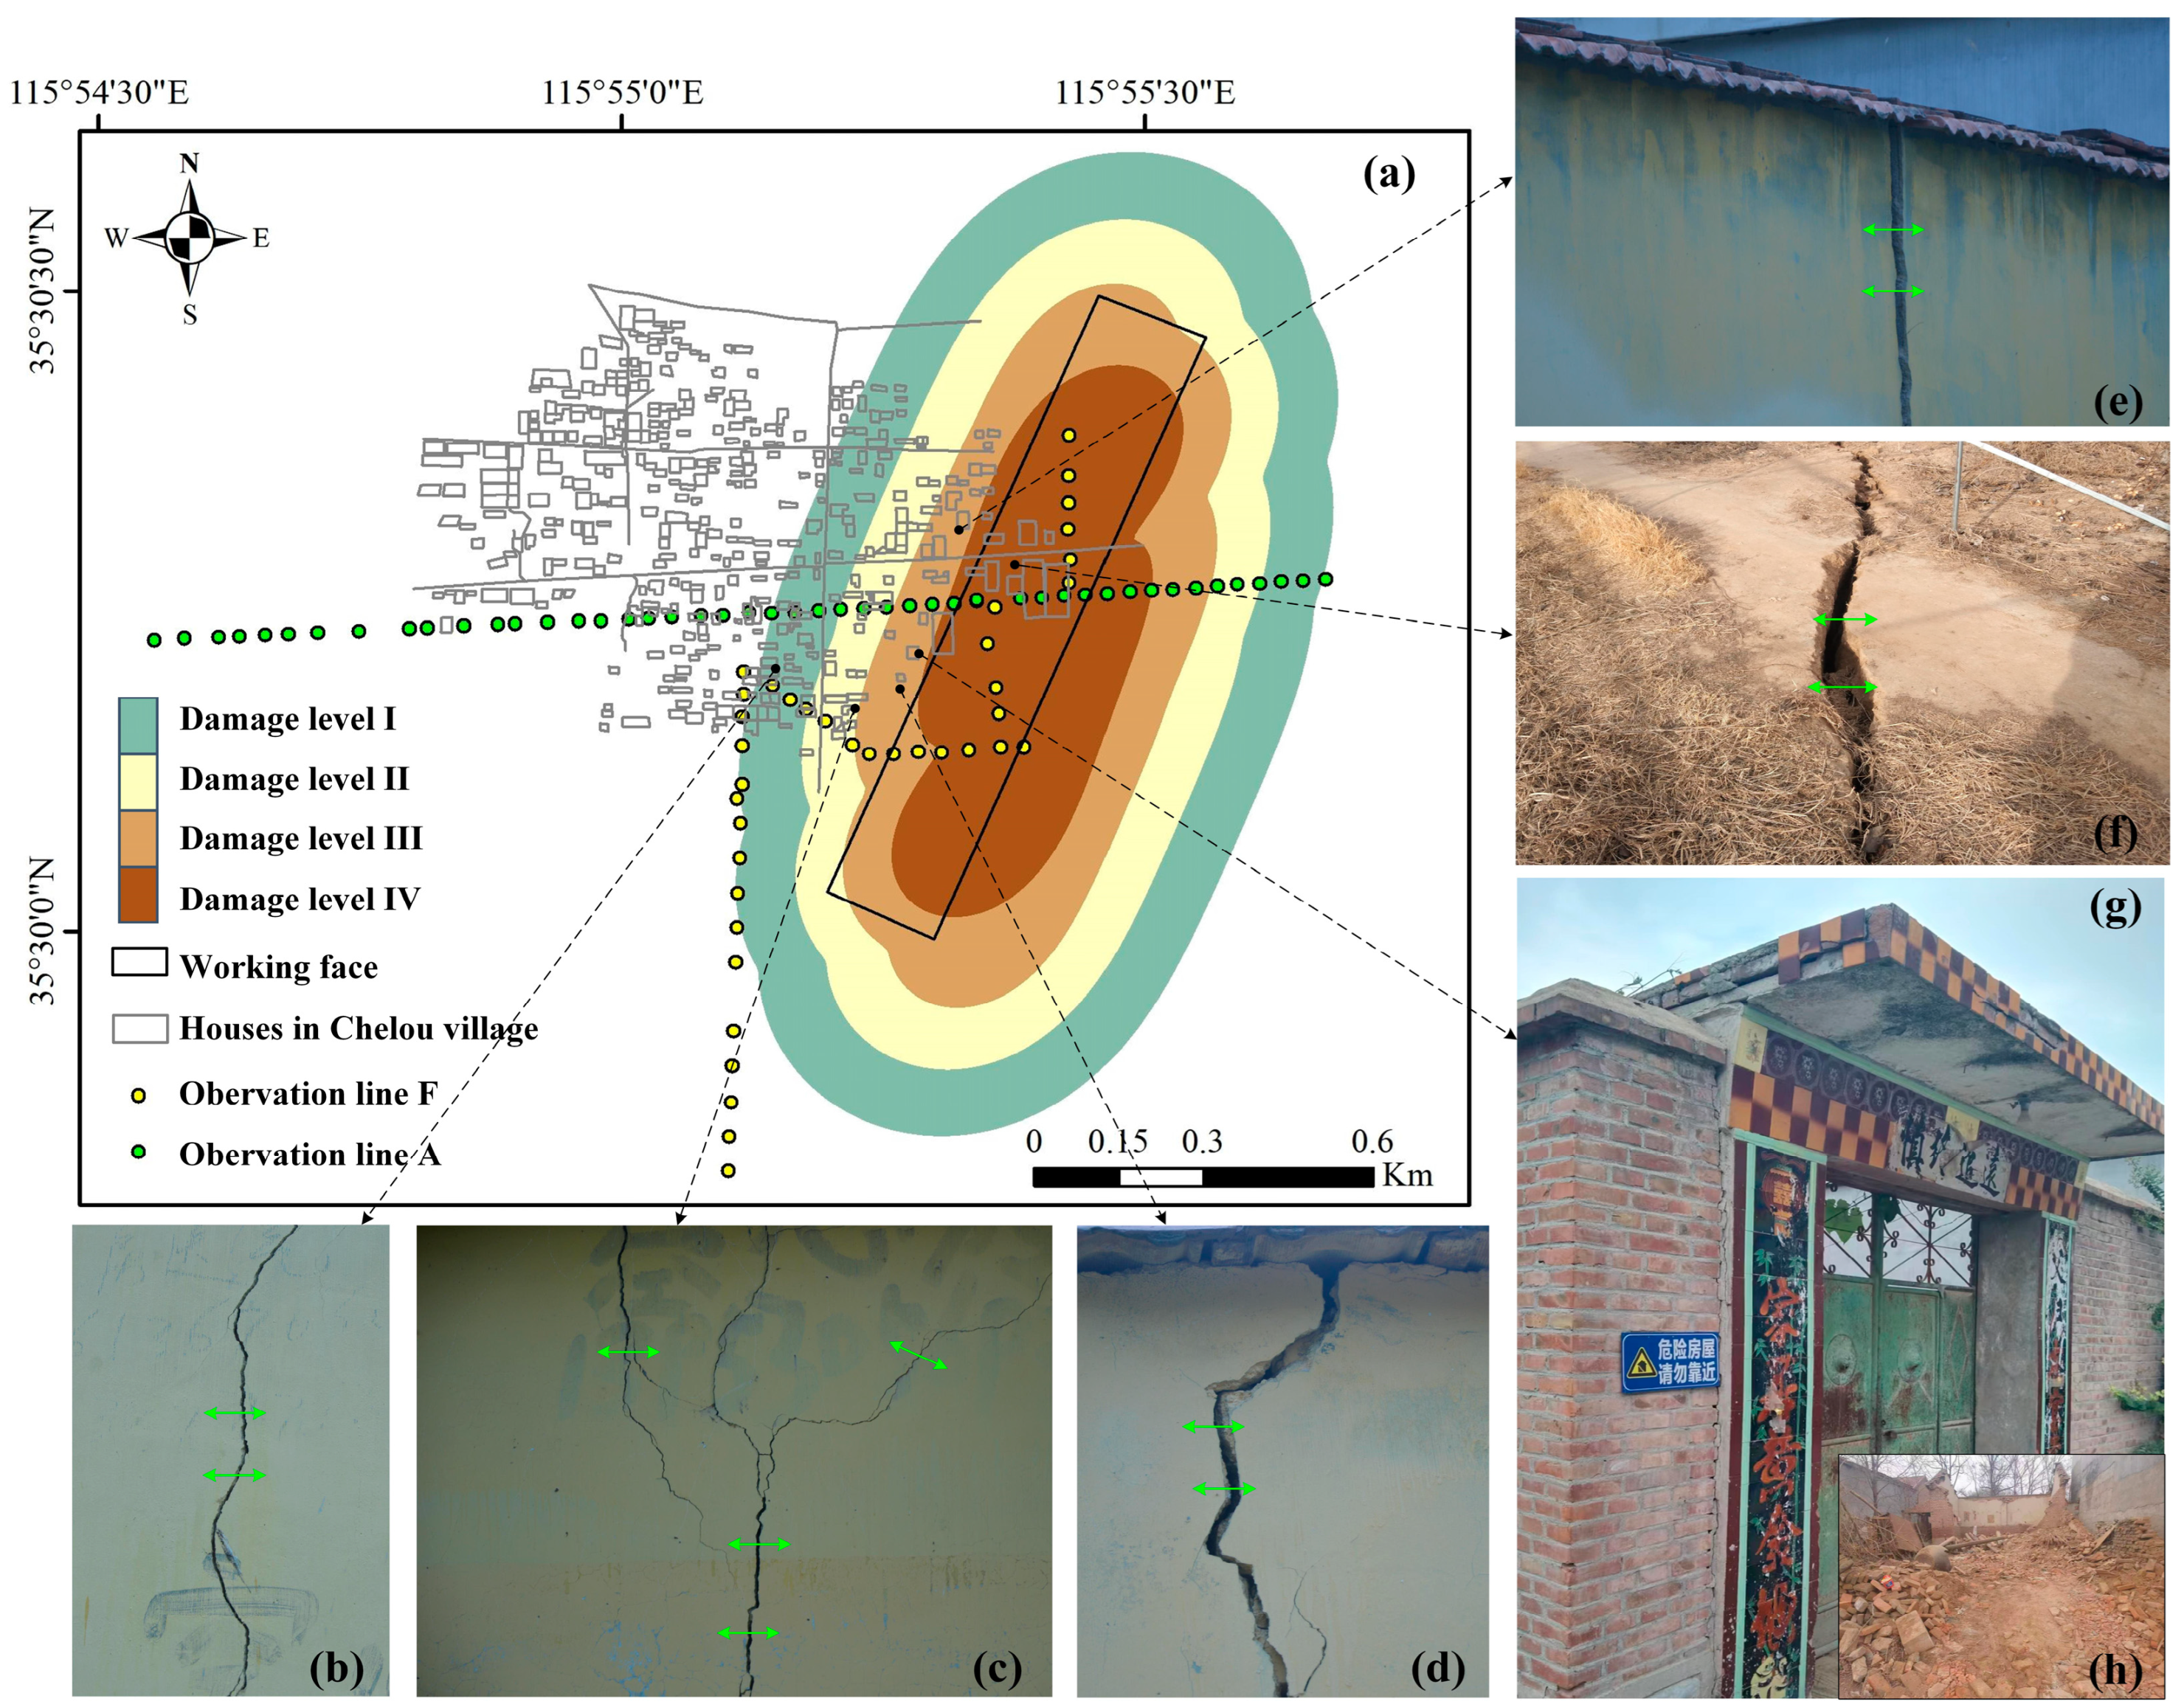
4.2. Building Damage Assessment

4.2.1. The Spatial Distribution of Building Damage Indicators

Analyzing the building damage resulting from surface subsidence helps in assessing the potential risks faced by structures located in proximity to mining areas. It provides valuable insights into the vulnerability of buildings and infrastructures to ground movements, allowing proactive measures to be taken to minimize future damage. In general, indicators for measuring the ground displacement primarily include vertical/horizontal displacement, slope, curvature, and horizontal strain. Among them, the slope, curvature, and horizontal strain reflect the differential changes in horizontal and vertical displacement. The slope and curvature characterize the uneven subsidence of the mining surface. The horizontal strain, as the first derivative of horizontal displacement, reflects the deformation difference in the horizontal direction of the mining surface. Therefore, we utilize these three indicators to establish the relationship between building damage and ground deformation, as well as the damage level classification and assessment of surface buildings.
Having predicted the subsidence results, then we calculated the slope, curvature, and horizontal strain of the mining goaf, as presented in Figure 13. It is clear that the spatial distribution trends of these three indicators are consistent with the dip and strike direction of the working face. In terms of the surface slope, the areas far away from the working face center are with the slope approximately between 0 and 2 mm/m. In accordance with the empirical threshold of building damage magnitude, as presented in Table 1, the mining area with a slope less than 3 is classified as damage level I. Therefore, the damage level of buildings far away from the working face can be regarded as very slight and usually need slight repairs or do not require repairs. However, the surface slope in the goaf center area reaches about 10mm/m, which belongs to damage level IV, with the building structure seriously damaged and needing major repairs or reconstruction. Similarly, by comparing the curvature and horizontal deformation with the empirical thresholds of building damage level, it is obvious that the damage has reached a high level around the goaf center area.

4.2.2. Risk Assessment for Building Damage

Finally, the damage level of houses in Chelou village was evaluated by using the contour map of horizontal strain in the direction of maximum subsidence. The building damage assessment map is derived for the study area, as demonstrated in Figure 14a. The colors dark brown, light brown, yellow, and green represent the damage levels of I, II, III, and IV, respectively. It is clear that the building damage level demonstrates a southwest to northeast direction and gradually increases towards the mining goaf center, which is consistent with the subsidence trend of the working face in the study area. Due to the lack of field records kept by the local government for the damaged houses in Chelou village, we conducted field investigations to qualitatively verify the classified damage level in the study area. As shown in Figure 14b–h, houses within areas of different damage levels exhibit different crack sizes on house walls (see Figure 14b–e), and areas of damage level IV are with serious ground fissures (see Figure 14f). Houses within areas of damage levels III and IV suffered severe damage, with most houses having been demolished and most residents relocated (see Figure 14g,h). The affected houses in this area were signed with “Dangerous houses, Keep away”. It can be concluded that the in situ damaged houses in Chelou village are consistent with the classified damage level presented in this study, indicating the efficiency of the proposed model as well as its practical application in building damage assessment.

4.2.3. Discussions for Key Steps of Building Damage Assessment

Building damage assessment is a critical process in the coal mining areas, which involves evaluating the structural integrity and potential risks faced by buildings due to mining activities. In order to further apply the proposed method and make it more applicable in this coal mining area, the key processes of building damage assessment are proposed in Figure 15 and discussed as follows.
Building Damage Identification: Building damage assessment is of great importance for identifying and documenting the extent and nature of building damage caused by mining-induced deformation. In this step, we adopted visual inspection, surveys, and data collection to assess the building structural conditions, such as building cracks, tilting, settlement, and other signs of damage. The surveyed photos are displayed in Figure 14b–h.
Causal Analysis: Building damage assessment aims to establish a causal relationship between the observed damage and mining activities, which usually involves analyzing the geological, geotechnical, and mining data to understand the mechanisms of subsidence, ground movements, and their impacts on building structures. In this study, three building damage indicators including the slope, curvature, and horizontal strain were investigated and their spatial distributions were analyzed for the mining area (Figure 13).
Risk Evaluation: Assessing the risks associated with building damage is crucial for determining the level of vulnerability and potential hazards, which involves considering factors such as the proximity of buildings to mining areas, the magnitude and frequency of ground movements, and the structural characteristics of the buildings. Therefore, the building damage assessment map (Figure 14a) was derived in this study for risk evaluation inside the mining area.
Structural Integrity Assessment: Building damage assessment usually requires a thorough evaluation for the structural integrity of affected buildings. This involves structural analysis, including load-bearing capacity, stability, and safety factors, to determine whether the damage has compromised the structural integrity and poses risks to the occupants, which is the focus of our further study.
Mitigation and Remediation Measures: To minimize the future damage and ensure the safety of occupants, Guotun coal mine has already employed the appropriate mitigation and remediation measures based on the damage assessment results provided by this study, including structural repairs, reinforcement, retrofitting, and relocation of buildings to safer locations. The affected houses signed with “Dangerous houses, keep away” (Figure 14h) are currently been demolished.
Long-term Evaluation: Building damage assessment is an ongoing process that involves monitoring the condition of structures over time. Regular inspections and monitoring based on various techniques help track the progression of damage, evaluate the effectiveness of mitigation measures, and inform future decision making.
Documentation and Reporting: Building damage assessment requires comprehensive documentation and reporting, including detailed reports, photographs, and records of damage, as well as recommendations for mitigation measures and further actions. The results of this study have contributed to the risk documentation of the Guotun coal mine.
It is concluded that building damage assessment in coal mining areas is essential for safeguarding lives, protecting property, and ensuring sustainable mining practices. The comprehensive building damage assessment methods proposed in this study provide valuable information for risk management, decision making, safety, and well-being of communities in the Guotun coal mining areas.

5. Conclusions

This study aims to derive the large-gradient deformation for mining-induced subsidence and provide technical support for building damage assessment in mining areas. To achieve this, we presented a three-dimensional and full parameter inversion (TDFPI) model, which specifically consists of a three-dimensional relationship model, GAREE, and a building damage assessment mode. Among them, the functional relationship model was first constructed to connect the 3D parameters for parameters of InSAR-derived LOS observations and true ground surface subsidence. Then, driven by InSAR LOS observations, the three-dimensional and full parameters for PIM were retrieved by using the proposed GAREE. Afterward, we predicted the displacement field by employing PIM and retrieved parameters. Finally, we calculated the surface slope, curvature, and horizontal strain by taking a working face in the Guotun coal mine as the case study, and the damage level for the goaf area was classified according to the empirical threshold of damage magnitude.
Validation results indicate that the TDFPI-derived subsidence results are highly consistent with field-surveyed measurements, with RMSEs of about 0.083 m and 0.102 m, respectively, for the observation line A and line F. In addition, the classified damage level for the houses in Chelou village around the mining goaf agrees well with in situ field investigations, presenting good performance and practical value for building damage assessment. This implies that the proposed method is not only capable of identifying significant deformation gradient within the coal mining area, but also applicable and efficient for building damage assessment based on the damage level classification. Therefore, the proposed TDFPI is a promising tool for deriving the mining-induced deformation field, and can also provide technical support for potential risk assessment and prevention.
In conclusion, analyzing and assessing the building damage caused by surface subsidence is crucial for coal mining risk assessment, safety precautions, insurance claims, land-use planning, and environmental impact assessment. The proposed TDFPI method has the potential for informed decision making, proactive measures, and appropriate compensation, and can ultimately contribute to sustainable mining practices and the protection of human life, infrastructure, and the environment of the coal mining area.

Author Contributions

H.L. and M.Y. conceptualized the idea of the manuscript. M.Y. and B.L. performed the Sentinel-1A SAR image processing and contributed to the methodology. H.L. investigated the methodology, analyzed the results, and wrote the manuscript. M.L., N.C., X.L. and X.W. provided suggestions for the final revision of the paper. J.W. provided the leveling data and analyzed the leveling-derived results. All authors have read and agreed to the published version of the manuscript.

Funding

This research was funded by the National Natural Science Foundation of China, grant number 52104158, and the Open Research Fund of Laboratory of Target Microwave Properties, grant number 2022-KFJJ-005.

Data Availability Statement

European Space Agency (ESA) provides SAR images of Sentinel-1A data at https://scihub.copernicus.eu/dhus/#/home (accessed on 20 August 2022).

Acknowledgments

The authors would like to thank the anonymous reviewers who contributed to the quality of this letter by providing helpful suggestions.

Conflicts of Interest

Author Jinzheng Wang was employed by the company Luxi Mining Co., Ltd. The remaining authors declare that the research was conducted in the absence of any commercial or financial relationships that could be construed as a potential conflict of interest.

References

  1. Chen, B.; Li, Z.; Yu, C.; Fairbairn, D.; Kang, J.; Hu, J.; Liang, L. Three-dimensional time-varying large surface displacements in coal exploiting areas revealed through integration of SAR pixel offset measurements and mining subsidence model. Remote Sens. Environ. 2020, 240, 111663. [Google Scholar] [CrossRef]
  2. Wang, G.; Wu, Q.; Li, P.; Cui, X.; Gong, Y.; Zhang, J.; Tang, W. Mining Subsidence Prediction Parameter Inversion by Combining GNSS and DInSAR Deformation Measurements. IEEE Access 2021, 9, 89043–89054. [Google Scholar] [CrossRef]
  3. Wang, Y.; Zhang, Q.; Zhao, C.; Lu, Z.; Ding, X. Monitoring and Inversion on Land Subsidence over Mining Area with InSAR Technique. In Proceedings of the International Symposium on Lidar and Radar Mapping 2011: Technologies and Applications, Nanjing, China, 26–29 May 2011. [Google Scholar]
  4. Liu, H.; Li, M.; Yuan, M.; Li, B.; Jiang, X. A fine subsidence information extraction model based on multi-source inversion by integrating InSAR and leveling data. Nat. Hazards 2022, 114, 2839–2854. [Google Scholar] [CrossRef]
  5. Zhou, D.; Wang, L.; An, S.; Wang, X.; An, Y. Integration of unmanned aerial vehicle (UAV)-based photogrammetry and InSAR for mining subsidence and parameters inversion: A case study of the Wangjiata Mine, China. Bull. Eng. Geol. Environ. 2022, 81, 343. [Google Scholar] [CrossRef]
  6. Wu, Z.; Wang, T.; Wang, Y.; Wang, R.; Ge, D. Deep Learning for the Detection and Phase Unwrapping of Mining-Induced Deformation in Large-Scale Interferograms. IEEE Trans. Geosci. Remote Sens. 2022, 60, 1–18. [Google Scholar] [CrossRef]
  7. Yi, Z.; Liu, M.; Liu, X.; Wang, Y.; Wu, L.; Wang, Z.; Zhu, L. Long-term Landsat monitoring of mining subsidence based on spatiotemporal variations in soil moisture: A case study of Shanxi Province, China. Int. J. Appl. Earth Obs. Geoinf. 2021, 102, 102447. [Google Scholar] [CrossRef]
  8. Modeste, G.; Doubre, C.; Masson, F. Time evolution of mining-related residual subsidence monitored over a 24-year period using InSAR in southern Alsace, France. Int. J. Appl. Earth Obs. Geoinf. 2021, 102, 102392. [Google Scholar] [CrossRef]
  9. Zhang, B.; Chang, L.; Stein, A. A model-backfeed deformation estimation method for revealing 20-year surface dynamics of the Groningen gas field using multi-platform SAR imagery. Int. J. Appl. Earth Obs. Geoinf. 2022, 111, 102847. [Google Scholar] [CrossRef]
  10. Gee, D.; Bateson, L.; Grebby, S.; Novellino, A.; Sowter, A.; Wyatt, L.; Marsh, S.; Morgenstern, R.; Athab, A. Modelling groundwater rebound in recently abandoned coalfields using DInSAR. Remote Sens. Environ. 2020, 249, 112021. [Google Scholar] [CrossRef]
  11. Pawluszek-Filipiak, K.; Borkowski, A. Monitoring mining-induced subsidence by integrating differential radar interferometry and persistent scatterer techniques. Eur. J. Remote Sens. 2020, 54, 18–30. [Google Scholar] [CrossRef]
  12. Ng, A.H.-M.; Ge, L.; Du, Z.; Wang, S.; Ma, C. Satellite radar interferometry for monitoring subsidence induced by longwall mining activity using Radarsat-2, Sentinel-1 and ALOS-2 data. Int. J. Appl. Earth Obs. Geoinf. 2017, 61, 92–103. [Google Scholar] [CrossRef]
  13. Declercq, P.-Y.; Dusar, M.; Pirard, E.; Verbeurgt, J.; Choopani, A.; Devleeschouwer, X. Post Mining Ground Deformations Transition Related to Coal Mines Closure in the Campine Coal Basin, Belgium, Evidenced by Three Decades of MT-InSAR Data. Remote Sens. 2023, 15, 725. [Google Scholar] [CrossRef]
  14. Yuan, M.; Li, M.; Liu, H.; Lv, P.; Li, B.; Zheng, W. Subsidence Monitoring Base on SBAS-InSAR and Slope Stability Analysis Method for Damage Analysis in Mountainous Mining Subsidence Regions. Remote Sens. 2021, 13, 3107. [Google Scholar] [CrossRef]
  15. Bru, G.; Herrera, G.; Tomás, R.; Duro, J.; De la Vega, R.; Mulas, J. Control of deformation of buildings affected by subsidence using persistent scatterer interferometry. Struct. Infrastruct. Eng. 2010, 9, 188–200. [Google Scholar] [CrossRef]
  16. Diao, X.; Bai, Z.; Wu, K.; Zhou, D.; Li, Z. Assessment of mining-induced damage to structures using InSAR time series analysis: A case study of Jiulong Mine, China. Environ. Earth Sci. 2018, 77, 166. [Google Scholar] [CrossRef]
  17. Diao, X.; Wu, K.; Chen, R.; Yang, J. Identifying the Cause of Abnormal Building Damage in Mining Subsidence Areas Using InSAR Technology. IEEE Access 2019, 7, 172296–172304. [Google Scholar] [CrossRef]
  18. Yang, K.; Yan, L.; Huang, G.; Chen, C.; Wu, Z. Monitoring Building Deformation with InSAR: Experiments and Validation. Sensors 2016, 16, 2182. [Google Scholar] [CrossRef]
  19. Li, J.; Gao, F.; Lu, J. An application of InSAR time-series analysis for the assessment of mining-induced structural damage in Panji Mine, China. Nat. Hazards 2019, 97, 243–258. [Google Scholar] [CrossRef]
  20. Mohamadi, B.; Balz, T.; Younes, A. Towards a PS-InSAR Based Prediction Model for Building Collapse: Spatiotemporal Patterns of Vertical Surface Motion in Collapsed Building Areas—Case Study of Alexandria, Egypt. Remote Sens. 2020, 12, 3307. [Google Scholar] [CrossRef]
  21. Liu, Z.; Mei, G.; Sun, Y.; Xu, N. Investigating mining-induced surface subsidence and potential damages based on SBAS-InSAR monitoring and GIS techniques: A case study. Environ. Earth Sci. 2021, 80, 817. [Google Scholar] [CrossRef]
  22. Li, Y.-x.; Yang, K.-m.; Zhang, J.-h.; Hou, Z.-x.; Wang, S.; Ding, X.-m. Research on time series InSAR monitoring method for multiple types of surface deformation in mining area. Nat. Hazards 2022, 114, 2479–2508. [Google Scholar] [CrossRef]
  23. Anantrasirichai, N.; Biggs, J.; Kelevitz, K.; Sadeghi, Z.; Wright, T.; Thompson, J.; Achim, A.M.; Bull, D. Detecting Ground Deformation in the Built Environment Using Sparse Satellite InSAR Data With a Convolutional Neural Network. IEEE Trans. Geosci. Remote Sens. 2021, 59, 2940–2950. [Google Scholar] [CrossRef]
  24. Pawłuszek-Filipiak, K.; Wielgocka, N.; Tondaś, D.; Borkowski, A. Monitoring nonlinear and fast deformation caused by underground mining exploitation using multi-temporal Sentinel-1 radar interferometry and corner reflectors: Application, validation and processing obstacles. Int. J. Digit. Earth 2023, 16, 251–271. [Google Scholar] [CrossRef]
  25. Yang, Z.; Li, Z.; Zhu, J.; Yi, H.; Feng, G.; Hu, J.; Wu, L.; Preusse, A.; Wang, Y.; Papst, M. Locating and defining underground goaf caused by coal mining from space-borne SAR interferometry. ISPRS J. Photogramm. Remote Sens. 2018, 135, 112–126. [Google Scholar] [CrossRef]
  26. Hu, B.; Chen, L.; Zou, Y.; Wu, X.; Washaya, P. Methods for Monitoring Fast and Large Gradient Subsidence in Coal Mining Areas Using SAR Images: A Review. IEEE Access 2021, 9, 159018–159035. [Google Scholar] [CrossRef]
  27. Fan, H.; Lian, X.; Yang, W.; Ge, L.; Hu, H.; Du, Z. Mining large-gradient subsidence monitoring using D-InSAR optimized by GNSS. Imaging Sci. J. 2023, 69, 207–218. [Google Scholar] [CrossRef]
  28. Yang, Z.F.; Li, Z.W.; Zhu, J.J.; Hu, J.; Wang, Y.J.; Chen, G.L. InSAR-Based Model Parameter Estimation of Probability Integral Method and Its Application for Predicting Mining-Induced Horizontal and Vertical Displacements. IEEE Trans. Geosci. Remote Sens. 2016, 54, 4818–4832. [Google Scholar] [CrossRef]
  29. Yang, Z.F.; Li, Z.W.; Zhu, J.J.; Preusse, A.; Yi, H.W.; Wang, Y.J.; Papst, M. An Extension of the InSAR-Based Probability Integral Method and Its Application for Predicting 3-D Mining-Induced Displacements Under Different Extraction Conditions. IEEE Trans. Geosci. Remote Sens. 2017, 55, 3835–3845. [Google Scholar] [CrossRef]
  30. Li, P.; Peng, D.; Tan, Z.; Deng, K. Study of probability integration method parameter inversion by the genetic algorithm. Int. J. Min. Sci. Technol. 2017, 27, 1073–1079. [Google Scholar] [CrossRef]
  31. Wang, L.; Wei, T.; Li, N.; Chi, S.-S.; Jiang, C.; Fang, S.-Y. Research on probability integration parameter inversion of mining-induced surface subsidence based on quantum annealing. Environ. Earth Sci. 2018, 77, 740. [Google Scholar] [CrossRef]
  32. Wang, L.; Li, N.; Zhang, X.-N.; Wei, T.; Chen, Y.-F.; Zha, J.-F. Full parameters inversion model for mining subsidence prediction using simulated annealing based on single line of sight D-InSAR. Environ. Earth Sci. 2018, 77, 161. [Google Scholar] [CrossRef]
  33. Zhu, W.; Zhang, Y.; Liu, Z.; Zhu, Q. Pre- and Postcollapse Ground Deformation Revealed by SAR Interferometry: A Case Study of Foshan (China) Ground Collapse. J. Sens. 2020, 2020, 8899054. [Google Scholar] [CrossRef]
  34. Yang, Z.; Li, Z.; Zhu, J.; Yi, H.; Hu, J.; Feng, G. Deriving Dynamic Subsidence of Coal Mining Areas Using InSAR and Logistic Model. Remote Sens. 2017, 9, 125. [Google Scholar] [CrossRef]
  35. Xu, X.; Ma, C.; Lian, D.; Zhao, D. Inversion and Analysis of Mining Subsidence by Integrating DInSAR, Offset Tracking, and PIM Technology. J. Sens. 2020, 2020, 4136837. [Google Scholar] [CrossRef]
  36. Yang, Z.; Zhu, J.; Xie, J.; Li, Z.; Wu, L.; Ma, Z. Resolving 3-D Mining Displacements From Multi-Track InSAR by Incorporating With a Prior Model: The Dynamic Changes and Adaptive Estimation of the Model Parameters. IEEE Trans. Geosci. Remote Sens. 2021, 60. [Google Scholar] [CrossRef]
  37. Yang, Z.; Xu, B.; Li, Z.; Wu, L.; Zhu, J. Prediction of Mining-Induced Kinematic 3-D Displacements From InSAR Using a Weibull Model and a Kalman Filter. IEEE Trans. Geosci. Remote Sens. 2022, 60, 1–12. [Google Scholar] [CrossRef]
  38. Yang, Z.; Li, Z.; Zhu, J.; Preusse, A.; Hu, J.; Feng, G.; Papst, M. High-Resolution Three-Dimensional Displacement Retrieval of Mining Areas From a Single SAR Amplitude Pair Using the SPIKE Algorithm. IEEE J. Sel. Top. Appl. Earth Obs. Remote Sens. 2018, 11, 3782–3793. [Google Scholar] [CrossRef]
  39. Yang, Z.; Li, Z.; Zhu, J.; Preusse, A.; Hu, J.; Feng, G.; Wang, Y.; Papst, M. An InSAR-Based Temporal Probability Integral Method and its Application for Predicting Mining-Induced Dynamic Deformations and Assessing Progressive Damage to Surface Buildings. IEEE J. Sel. Top. Appl. Earth Obs. Remote Sens. 2018, 11, 472–484. [Google Scholar] [CrossRef]
  40. Zhang, B.; Zhang, L.; Yang, H.; Zhang, Z.; Tao, J. Subsidence prediction and susceptibility zonation for collapse above goaf with thick alluvial cover: A case study of the Yongcheng coalfield, Henan Province, China. Bull. Eng. Geol. Environ. 2015, 75, 1117–1132. [Google Scholar] [CrossRef]
  41. Fadhillah, M.F.; Achmad, A.R.; Lee, C.-W. Integration of InSAR Time-Series Data and GIS to Assess Land Subsidence along Subway Lines in the Seoul Metropolitan Area, South Korea. Remote Sens. 2020, 12, 3505. [Google Scholar] [CrossRef]
  42. Maghsoudi, Y.; van der Meer, F.; Hecker, C.; Perissin, D.; Saepuloh, A. Using PS-InSAR to detect surface deformation in geothermal areas of West Java in Indonesia. Int. J. Appl. Earth Obs. Geoinf. 2018, 64, 386–396. [Google Scholar] [CrossRef]
  43. Li, Q.; Wang, W.; Wang, J.; Zhang, J.; Geng, D. Exploring the relationship between InSAR coseismic deformation and earthquake-damaged buildings. Remote Sens. Environ. 2021, 262, 112508. [Google Scholar] [CrossRef]
  44. Jiang, C.; Wang, L.; Yu, X.; Wei, T.; Chi, S.; Guo, Q. Prediction of 3D deformation due to large gradient mining subsidence based on InSAR and constraints of IDPIM model. Int. J. Remote Sens. 2020, 42, 208–239. [Google Scholar] [CrossRef]
  45. Baran, I.; Stewart, M.; Claessens, S. A new functional model for determining minimum and maximum detectable deformation gradient resolved by satellite radar interferometry. IEEE Trans. Geosci. Remote Sens. 2005, 43, 675–682. [Google Scholar] [CrossRef]
  46. Berardino, P.; Fornaro, G.; Lanari, R.; Sansosti, E. A new algorithm for surface deformation monitoring based on small baseline differential SAR interferograms. IEEE Trans. Geosci. Remote Sens. 2002, 40, 2375–2383. [Google Scholar] [CrossRef]
  47. Tao, Q.; Wang, F.; Guo, Z.; Hu, L.; Yang, C.; Liu, T. Accuracy verification and evaluation of small baseline subset (SBAS) interferometric synthetic aperture radar (InSAR) for monitoring mining subsidence. Eur. J. Remote Sens. 2021, 54, 642–663. [Google Scholar] [CrossRef]
  48. Wang, L.; Teng, C.; Jiang, K.; Jiang, C.; Zhu, S. D-InSAR Monitoring Method of Mining Subsidence Based on Boltzmann and Its Application in Building Mining Damage Assessment. KSCE J. Civ. Eng. 2021, 26, 353–370. [Google Scholar] [CrossRef]
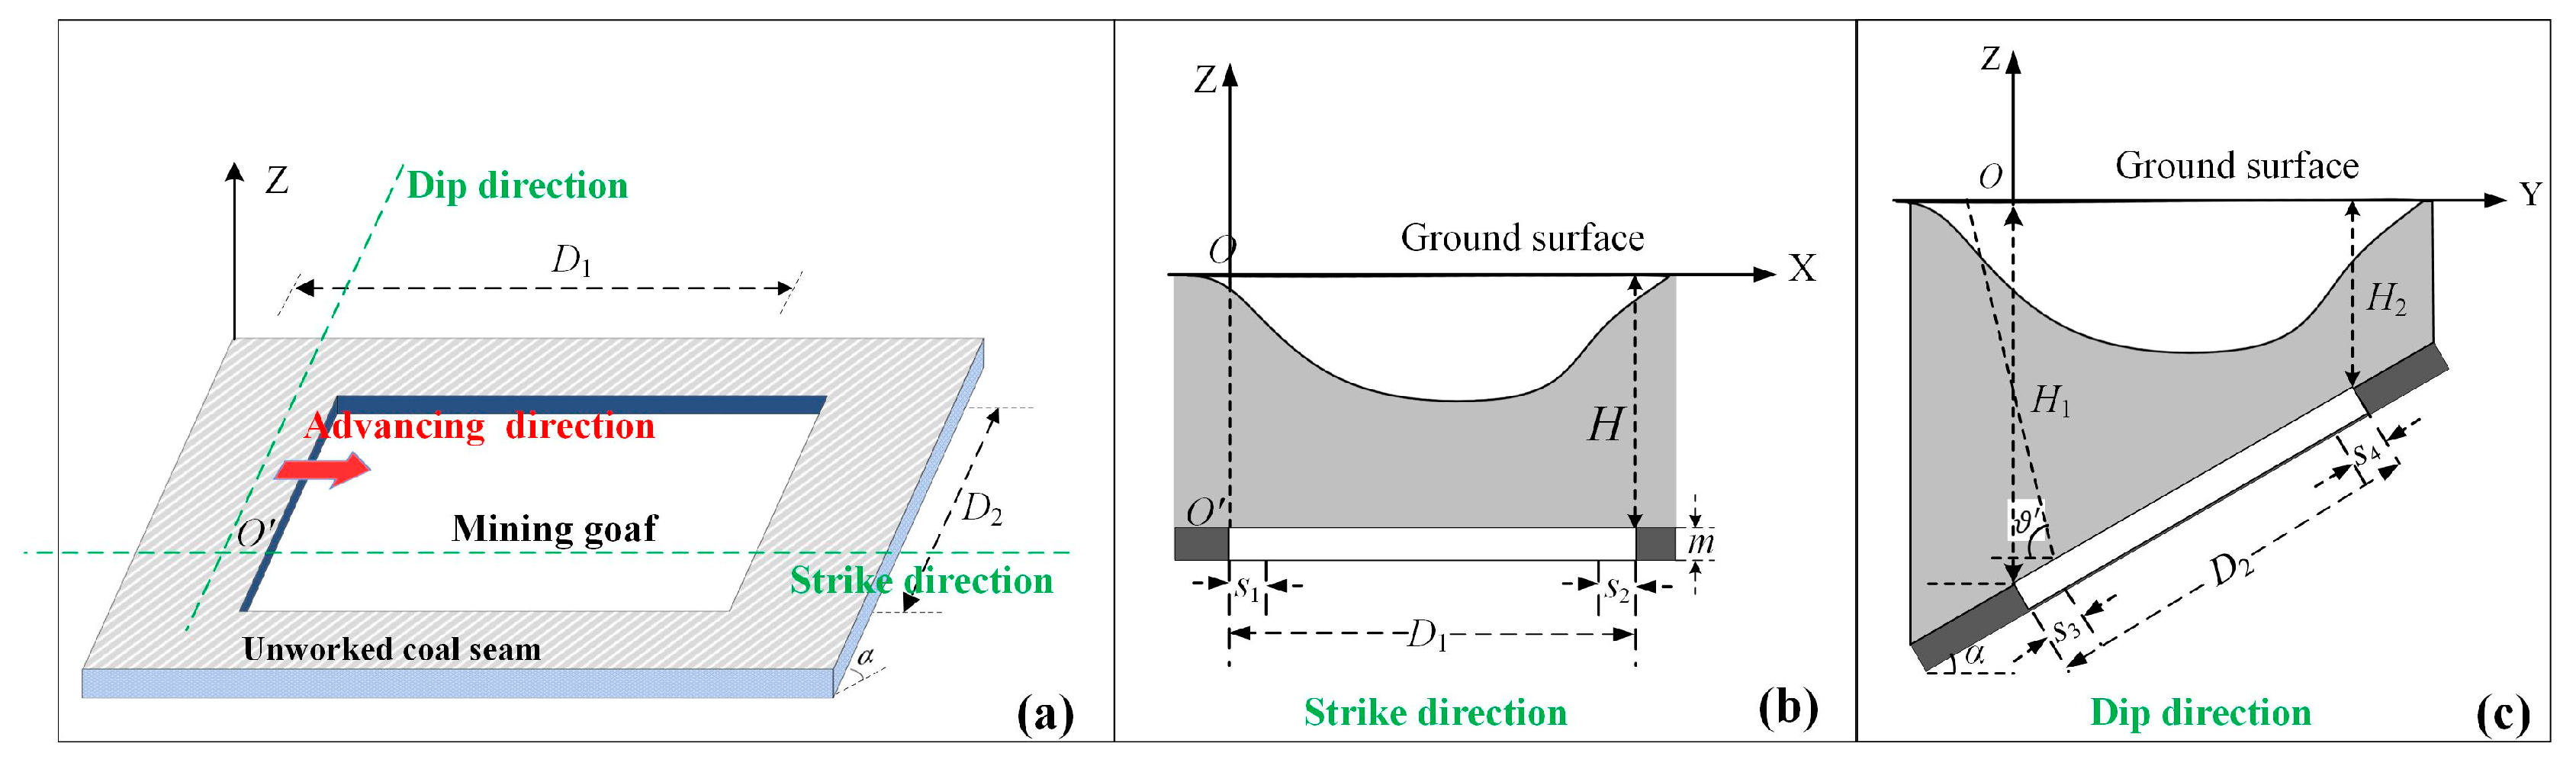
Figure 1. The case study area: Guotun coal mine in Shandong province.
Remotesensing 16 00698 g001
Figure 2. The framework of the proposed TDFPI model and its application for building damage assessment.
Remotesensing 16 00698 g002
Figure 3. Schematic view of projection relationship between the InSAR LOS displacement and the 3D surface subsidence.
Remotesensing 16 00698 g003
Figure 4. The diagram for (a) coal mining excavation of a working face with the 3D view; (b) 2D profiles along the strike direction; and (c) 2D profiles along the dip direction for the working face.
Remotesensing 16 00698 g004
Figure 5. Schematic views of the impact of ground subsidence on surface buildings.
Remotesensing 16 00698 g005
Figure 6. Connection diagram for (a) spatial baseline and (b) temporal baseline, with the yellow dot stands for the imaging time of the master image, and the green dot represents the other images.
Remotesensing 16 00698 g006
Figure 7. The SBAS-InSAR-derived cumulative surface displacements for the working face in the Guotun coal mine.
Remotesensing 16 00698 g007
Figure 8. The spatially point-wise cumulative displacements derived by SBAS-InSAR in the strike direction and the dip direction of the working face, with time series displacements for (a,c) points P1~P17 and for (b,d) points B1~B13 near the Guotun coal mine working face.
Remotesensing 16 00698 g008
Figure 9. (a) Vertical displacement field (m), (b) horizontal displacement field (m), and (c) horizontal movement field (mm/m) derived by retrieved parameters and PIM principle for the mining area; the black rectangle denotes the working face.
Remotesensing 16 00698 g009
Figure 10. Subsidence field of the coal mining goaf overlaid with the satellite image inside the study area.
Remotesensing 16 00698 g010
Figure 11. A comprehensive comparison for TDFPI-predicted subsidence, field-surveyed measurements, and InSAR observations along the observation (a) line A and (b) line F, respectively, where the absolute error represents the error between TDFPI-predicted subsidence and field-surveyed subsidence.
Remotesensing 16 00698 g011
Figure 12. The scatter plots of the errors between TDFPI-predicted subsidence and field-surveyed measurements along the observation (a) line A and (b) line F, respectively.
Remotesensing 16 00698 g012
Figure 13. The spatial distribution of (a) surface slope (mm/m), (b) curvature (10−3/m), and (c) horizontal strain (mm/m), where the black rectangle denotes the working face.
Remotesensing 16 00698 g013
Figure 14. Building damage assessment map with (a) classified damage level, (be) cracks on house walls with different damage levels, (f) cracks on roads with damage level IV, (g,h) houses to be demolished and the demolished houses.
Remotesensing 16 00698 g014
Figure 15. The comprehensive and key processes for building damage assessment in Guotun coal mine.
Remotesensing 16 00698 g015
Table 1. Descriptions for the variables.
VariablesDescriptionsVariablesDescriptions
mcoal bed thickness r i main influence radius *
qsubsidence coefficientbhorizontal displacement coefficient
α coal bed dip angle ϑ propagation angle
W 0 ( x ) , W 0 ( y ) vertical displacements along the strike direction φ e , φ n angles between the coal mine working face (strike direction) with the east and north directions
U 0 ( x ) , U 0 ( y ) horizontal displacements along the dip direction H i mining   depth ,   with   H i = r i tan β *
l 0 , l 1 computational   lengths   of   the   coal   mine   working   face   along   the   strike   and   dip   direction ,   with   l 0 = D 0 s 3 s 4 , l 1 = ( D 1 s 1 s 2 ) sin ( ϑ + α ) ,   where   D 0 , D 1 are the corresponding ground truth. s 1 , s 2 , s 3 , s 4 offsets in directions of the down-dip, up-dip, strike left, and strike right for the inflection points of the coal mine working face.
* Here, the index i = 0, 1, 2 represents the variables along the strike, down-dip, and up-dip directions of the coal mine working face.
Table 2. Damage level descriptions based on threshold values of deformation magnitude.
Damage LevelPossible Damage CharacteristicsDeformation MagnitudeDamage Level
Description
Surface Slope i (mm/m)Curvature
K (10−3/m)
Horizontal Strain ε (mm/m)
ISmall cracks less than 4 mm appear in the brick walls and ceilings.≤3≤0.2≤2Very slight damage with slight repairs.
IIThe width of cracks on brick walls and ceilings grows to about 15 mm with slight damage to doors and windows.≤6≤0.4≤4Slight damage with minor repairs.
IIICracks grow to about 30 mm with severe deformation on doors and windows.≤10≤0.6≤6Moderate damage with moderate repairs.
IVCracks grow larger than 30 mm and lead to serious collapse for houses.>10>0.6>6Serious damage with major repairs or need to be demolished.
Table 3. Statistical indicators of RMSE and MAE for the predicted subsidence against the field-surveyed measurements.
Observation Line RMSE (m)MAE (m)
Line A0.0830.068
Line F0.1020.089
Disclaimer/Publisher’s Note: The statements, opinions and data contained in all publications are solely those of the individual author(s) and contributor(s) and not of MDPI and/or the editor(s). MDPI and/or the editor(s) disclaim responsibility for any injury to people or property resulting from any ideas, methods, instructions or products referred to in the content.

