Article

Rainfall Area Identification Algorithm Based on Himawari-8 Satellite Data and Analysis of its Spatiotemporal Characteristics

1
State Key Laboratory of Remote Sensing Science, The Aerospace Information Research, Chinese Academy of Sciences, Beijing 100101, China
2
University of Chinese Academy of Sciences, Beijing 100049, China
3
Meteorological Observation Centre, China Meteorological Administration, Beijing 100089, China
*
Author to whom correspondence should be addressed.
Remote Sens. 2024, 16(5), 747; https://doi.org/10.3390/rs16050747
Submission received: 9 January 2024 / Revised: 11 February 2024 / Accepted: 19 February 2024 / Published: 21 February 2024
(This article belongs to the Section Atmospheric Remote Sensing)

Abstract

:
Real-time monitoring of rainfall areas based on satellite remote sensing is of vital importance for extreme rainfall research and disaster prediction. In this study, a new rainfall area identification algorithm was developed for the new generation of geostationary satellites with high spatial and temporal resolution and rich bands. As the main drivers of the rainfall process, the macro and micro physical properties of clouds play an important role in the formation and development of rainfall. We considered differences in the absorption capacity of the water vapor absorption channels in the infrared band and introduced a sensitivity difference of rainfall area in water vapor channels to construct a sensitive detection of the water vapor region. The results of this algorithm were evaluated using Global Precipitation Measurement (GPM) satellite products and CloudSat measurements in various scenarios, with hit rates of 70.03% and 81.39% and false alarm rates of 2.05% and 21.34%, respectively. Spatiotemporal analysis revealed that the types of upper clouds in the rainfall areas mainly consisted of deep convection, cirrostratus, and nimbostratus clouds. Our study provides supporting data for weather research and disaster prediction, as well as an efficient and reliable method for capturing temporal and spatial features.

1. Introduction

Rainfall is an important factor affecting weather change and a main cause of meteorological disasters. The identification of rainfall areas provides effective data support for the study of extreme rainfall disasters and provides important information for further understanding weather change. A comprehensive understanding of the spatiotemporal characteristics of rainfall areas is also essential for guiding artificial rainfall and numerical weather forecasting [1,2]. However, due to the limitations of observation levels and analytical methods, obtaining accurate rainfall data over a large scale remains a major challenge.
Remote sensing is an important method of rainfall observation coupled with the analysis of its temporal and spatial characteristics [3,4,5]. Information on rainfall can be obtained using both ground-based and satellite measurements. Ground-based observation methods typically include the implementation of ground radar (Doppler radar) or rain gauges [6], which measure the collected rainfall using a ruler or metering tube [7]. Ground-based instruments can obtain fairly accurate information on rainfall but are constrained by a limited spatial observation horizon. Satellite observation mainly relies on the use of active radar observation and passive microwave radiometers. Marzano et al. [8] conducted rainfall detection based on the complementarity between low-orbit microwaves and stationary satellites. However, the limited coverage of microwave rainfall detection cannot meet the needs of large-scale rainfall monitoring [9,10]. Ma et al. [11] improved the accuracy of TRMM satellite rainfall detection based on spatial downscaling. Ji et al. [12] estimated global total precipitable water based on AMSR-E passive microwave radiometers. Although these studies used stationary satellite or microwave detection to retrieve rainfall intensity, they actually needed to introduce accurate observation truth values, such as GPM or ground-based observations, as input data for data fusion. Therefore, the detection of rainfall areas from satellite measurements remains a challenging problem [13,14]. The algorithm presented here makes full use of the advantages of geostationary satellite multi-spectrum and high-resolution data to detect rainfall areas, does not rely on the input of other satellite data, and is not limited to the problem of time matching.
Using optical stationary satellites to detect rainfall areas is a major challenge in itself. The first low-inclination orbit precipitation measurement satellite from China, FY-3G, launched in April 2023, and can provide three-dimensional structural information on precipitation in middle and low latitudes around the world. However, existing rainfall detection based on geostationary satellites has not fully capitalized on the advantages of multi-band coordination of geostationary satellites. In this study, the high spatial and temporal resolution and multi-band advantages of the Himawari-8 geostationary satellite were used to develop a relatively precise rainfall area identification algorithm, which showed higher consistency as compared with the GPM passive microwave rainfall observation-generated data. Additionally, rainfall data obtained by ground radar on different time scales were also compared, and it was found that the algorithm presented here could capture very similar patterns to those generated by ground-based observation. Therefore, this algorithm is capable of producing high-precision rainfall area products at large scales and with a high spatial and temporal resolution and thus has high application value.
Many geostationary satellite-based studies of rainfall areas have previously focused on the rainfall characteristics of extreme precipitation areas or the generation and distribution of convective systems. Allan et al. [15] found that the frequency of extreme precipitation events increases with warming. Roca and Fiolleau [16] suggested that 40% of the days in which extreme precipitation (i.e., precipitation greater than 250 mm) occurs on land are associated with convective systems. Maddox [17] proposed the concept of convective cloud life history based on satellite observations and achieved the identification of convective clouds with a bright temperature of less than 241 K in the infrared band. Williams and Houze [18] used a threshold algorithm to implement the identification and characterization of mesoscale convective systems (MCS). Although there have been many attempts to study rainfall-related cloud types, most algorithms only concentrate on a single raincloud type and generally use a single threshold value, which makes it difficult to provide clearer criteria for rainfall area identification. Furthermore, existing rainfall detection based on geostationary satellites has not fully made use of the advantages of coordinating multi-band geostationary satellites, and we use this feature to establish a new rainfall area identification algorithm.
There are two main types of rainfall: stratiform rainfall and convective rainfall [19,20]. Of these, nimbostratus clouds mainly produce stratiform rainfall and convective clouds mainly produce convective rainfall [20,21]. Clouds are the main carriers of rain and important components of the rainfall process; the species scale, structural characteristics, and phase change latent heat processes of clouds affect the formation of rainfall [22,23,24]. Different cloud types have different rainfall characteristics. Therefore, we begin with the microphysical characteristics and types of clouds that may produce rainfall to identify the rainfall area and analyze the characteristics of clouds in the rainfall area.
Rainfall has the characteristics of rapid spatiotemporal change, so it is always difficult to accurately capture and forecast the spatiotemporal change of clouds and rainfall. Existing satellite observation means have provided the basis for solving the problems mentioned above [25]. In this study, the criteria for the identification of rainfall areas were proposed, and Himawari-8 was able to effectively capture the dynamic change characteristics of rainfall by taking advantage of its high spatiotemporal resolution, which provided data support for improving the accuracy of rainfall forecast. Moreover, the algorithm has a high recognition accuracy for the rainfall area and can find the extreme rainfall events that may cause disasters in time and guard them. Our sensitivity analysis found that rainfall areas exhibited different absorption capacities at 6.21 μm, 6.93 μm, and 7.34 μm water vapor channels; furthermore, a combination of these channels provides effective information on rainfall areas [26,27,28]. Therefore, we used not only the cloud characteristic products of cloud top temperature (CTT), cloud optical thickness (COT), and cloud effective particle radius (CER) of H-8/AHI but also the 6.21 μm channel brightness temperature ( B T 6.21 μ m ), the brightness temperature difference between the 6.93 and 6.21 μm channels ( B T D 6.93,6.21 μ m ), and the brightness temperature difference between the 7.34 and 6.93 μm channels ( B T D 7.34,6.93 μ m ). To ensure the reliability and effectiveness of the algorithm in this study, the algorithm results were validated and evaluated in various aspects using the Global Precipitation Measurement mission (GPM) global rainfall product and CloudSat radar rainfall measurement results, all of which proved the effectiveness of the proposed algorithm.
This article is organized as follows. Detailed information about the data is presented in Section 2. Section 3 describes the sensitivity analysis of the effectiveness of B T 6.21 μ m , B T D 6.93,6.21 μ m , and B T D 7.34,6.93 μ m in rainfall area identification and summarizes the rainfall area identification algorithm and its validation method. Section 4 presents the algorithm results and the validation results using GPM and CloudSat rainfall products in the rainfall area, and Section 4 briefly summarizes the results of this study and offers conclusions.

2. Materials and Methods

2.1. Materials

2.1.1. Himawari-8/AHI Data

Himawari-8 is a next-generation geostationary meteorological satellite launched by the Japan Meteorological Agency (JAM) in 2014. Himawari-8 products were used in this study because they have high-frequency observations and fine spatial resolutions of 0.5–2 km with a spatial coverage of 60°S–60°N, 80°E–160°W [29]. H-8 has clear advantages in the study of rapidly changing weather systems, as it can capture the dynamic characteristics of rainfall areas that change rapidly over time. The 16 spectral channels of Advanced Himawari Imager (AHI) measure span from 0.47 to 13.3 μm, where channels 1–3 are visible channels, channels 4–6 are near-infrared channels, and channels 7–16 are all infrared channels. Channels 8–10, centered at 6.21, 6.93, and 7.34 μm, are water-vapor-sensitive channels that are used to observe water vapor [30,31]. Thus, these three channels also have high sensitivity to rainfall areas. H-8 level 2 (L2) cloud products contain cloud microphysical parameters, such as cloud types, CER, COT, and CTT, which are all influencing factors on cloud characteristics in rainfall areas [32,33,34]. Therefore, in this study, H-8 L1 product infrared band information and L2 cloud microphysical parameter information were used as input parameters to identify rainfall areas. Additionally, the H-8 L2 cloud-type products were first validated using GPM precipitation products to analyze the rainfall characteristics of different cloud types.

2.1.2. GPM Data

In order to validate rainfall areas using multiple characteristics, we used GPM multi-satellite observation rainfall products as the first layer of verification data. The dual-frequency precipitation radar (DPR) onboard the Global Precipitation Measurement (GPM) satellite has been widely applied to investigate the vertical structure of typhoon precipitation and has also been used to indirectly obtain related microphysical information [35,36]. The Integrated Multi-satellite Retrievals for GPM (IMERG) product, developed by NASA, is a satellite-based precipitation measurement program based on TRMM, which provides a new generation of global satellite data products with higher accuracy and resolution than the previous generation of TRMM. IMERG includes input from multiple satellite sensors, including geostationary/infrared, as well as information from rain gauges and CloudSat. In addition to this, there is the sensitivity of some areas to light rainfall. Compared with the previous generation of TRMM products, GPM products have a larger coverage area (expanded to between 60° north and south latitude) and higher spatial and temporal resolution. GPM uses a dual-frequency radar observation system and combines active radar observation technology to provide physical information on cloud precipitation particles from different perspectives and thereby improve the description of light precipitation and snowfall [37], effectively improving detection accuracy [38]. The IMERG product is the third level of GPM, with a temporal resolution of half an hour and a spatial resolution of 0.1° × 0.1°. Depending on the calibration accuracy, IMERG products are divided into three products, known as IMERG-Early, IMERG-Late, and IMERG-Final. IMERG-Final is a non-real-time post-processing product and is calibrated based on the deviation of the monthly observation data from ground rainfall stations [39,40,41]. Here, the IMERG-Final V6 product was used for the comparative analysis of rainfall area identification results.

2.1.3. CloudSat Data

In order to further verify the rainfall area detection results, active, high-precision observation measurements were considered in the validation process. For this purpose, CloudSat’s rainfall product was adopted. Launched by the United States in 2006, CloudSat is one of the key members of the A-Train series of satellites and is primarily used to detect the vertical distribution of microphysical cloud quantities. CloudSat has approximately 36,383 subsatellite pixel points per orbit, with an along-orbit resolution of 1.7 km. The cloud profiling radar (CPR) on board the CloudSat satellite actively emits radiation signals to Earth, thereby obtaining the vertical distribution of global clouds and providing a new perspective through which to understand the role of clouds in the Earth system and describe their characteristics. The CloudSat 2C-RAIN-PROFILE precipitation product was used in this study [42]; this is an algorithm that deduces profiles of precipitation liquid and ice water content and surface rainfall rates based on CloudSat profiling radar (CPR) reflectivity profiles and path-integrated attenuation (PIA) constraints on radar beams. The key input to the algorithm flow, the 2C–PRECIP–COLUMN product, is used to label precipitation profiles, determine freezing levels, and identify precipitation type (convective/stratified/shallow). This algorithm can effectively identify both rainfall areas and cloud types on a global scale [42,43,44,45,46]. Thus, this study used CloudSat rainfall data as the true values against which AHI data were matched and verified. Based on CloudSat geolocation data, AHI data for the corresponding locations were extracted for comparison and validation.

2.1.4. China New Generation Weather Radar (CINRAD)

In order to assess the effectiveness of this algorithm in various contexts, we also introduced the China New Generation Weather Radar (CINRAD) for comparative analysis on different time scales. CINRAD is an active microwave atmospheric remote sensing device composed of data based on Doppler radar. It can detect the reflectivity factor, Doppler radial velocity, spectral width, and other basic meteorological elements [47], and is especially apt for collecting radar reflectivity data because it is directly related to strong convective weather systems; thus, it is the main means of detecting precipitation systems and is one of the main tools for monitoring and warning about strong convective weather [48]. In this study, the radar data of a single station in the study area were pieced together, and the maximum radar reflectivity factor was selected as the value of the overlapping area between adjacent stations.

2.2. Methods

2.2.1. Selection of Algorithm Indicators

We determined the water vapor channels for identifying rainfall areas, their brightness temperature, and the brightness temperature difference according to the channel design characteristics of AHI. We also performed sensitivity analysis and established indicators and thresholds for rainfall area identification. The thresholds of six indicators were established as the conditions necessary for identifying rainfall areas. As long as a region met the six conditions, the region was considered to be a rainfall area. The flow chart of the algorithm is shown in Figure 1.
Clouds are closely associated with rainfall, so selecting the most optimal spectral channels and cloud physical properties is the basis for the accurate identification of rainfall areas. The formation of rainfall results from a process in which, through the cooling of moist air, water vapor reaches saturation to form cloud droplets or ice crystals on atmospheric condensation nuclei or atmospheric ice nuclei; after a series of physical processes, these droplets then evolve into precipitation objects and fall to earth [32]. The formation of rainfall requires sufficient water vapor and an updraft to lift the water vapor enough to form a sufficient number of water droplets [49,50,51,52]. Based on the physical process of rainfall formation, it can be expected that the formation of rainfall is closely related to the water vapor content in clouds, cloud temperature, and cloud droplet size.
Rainfall areas usually occur under high cloud thickness. Rain clouds must have a sufficient vertical range and large enough droplets in order for rainfall to occur [21]. The detection of rainfall area pixels in clouds is relevant to the physical thickness of the cloud; clouds that are optically thick and fill the field of view in the visible band are considered to be candidates for rain clouds [53,54]. Generally speaking, greater cloud optical thickness is associated with a higher probability of rainfall [55].
CER is also an indicator of rainfall areas. In general, higher water vapor content is associated with larger cloud droplet size. At the top of relatively warm clouds, droplets with a radius of at least 12 μm need to be present to effectively form rainfall [54]. Some studies have suggested using a CER value of about 14 μm as a fixed threshold for rainfall areas [54,56]. A CER of 14 μm can effectively identify convective systems [21]. The CER also plays a crucial part in the formation of rainfall from cumulus clouds [56,57]. Therefore, in addition to the COT, the rainfall area identification algorithm in this study also used the CER obtained from AHI data.
During the formation of rain clouds, the CTT presents various characteristics. At the peak of precipitation, the cold convective core at the top of convective clouds reaches a minimum temperature and the cloud coverage area reaches a maximum [58]. Longer-lived and larger mesoscale convective systems, as well as mesoscale convective systems with lower convective core temperatures, are more likely to induce more intense precipitation [59]. Lower cloud top temperatures are the main feature of strong convective clouds in the process of producing heavy precipitation; colder cloud tops are associated with stronger precipitation that appears on the cloud surface. When strong precipitation occurs on the cloud surface, the cloud top temperature is not only lower, but this lower cloud top temperature also persists for some time [60].
Additional information about microphysical and rainfall processes near cloud tops can be obtained using information on solar radiation reflected in the infrared band. Rainfall is usually associated with deep convective clouds and can be identified in the infrared and/or water vapor channels [21,58,61,62].
Infrared channels with a wavelength of 6–7 µm were the most significant water vapor absorption spectrum and are usually chosen by geostationary satellites to obtain water vapor radiation information. AHI has a high detection sensitivity to water vapor, and has three water vapor channels centered at 6.21 μm, 6.93 μm, and 7.34 μm, respectively [63]. In this study, the brightness temperature of the infrared window channel and the brightness temperature difference threshold between the infrared channels were implemented to detect rainfall areas. In the early stages of rain cloud formation, the cloud top first appears to cool more strongly at the infrared window channel. With the decrease in the brightness temperature difference between the infrared and the water vapor channel, cloud top height develops significantly, the minimum brightness temperature continues to decrease, and the number of cool cloud pixels gradually increases, thus indicating that the clouds are continuously developing [59,64].
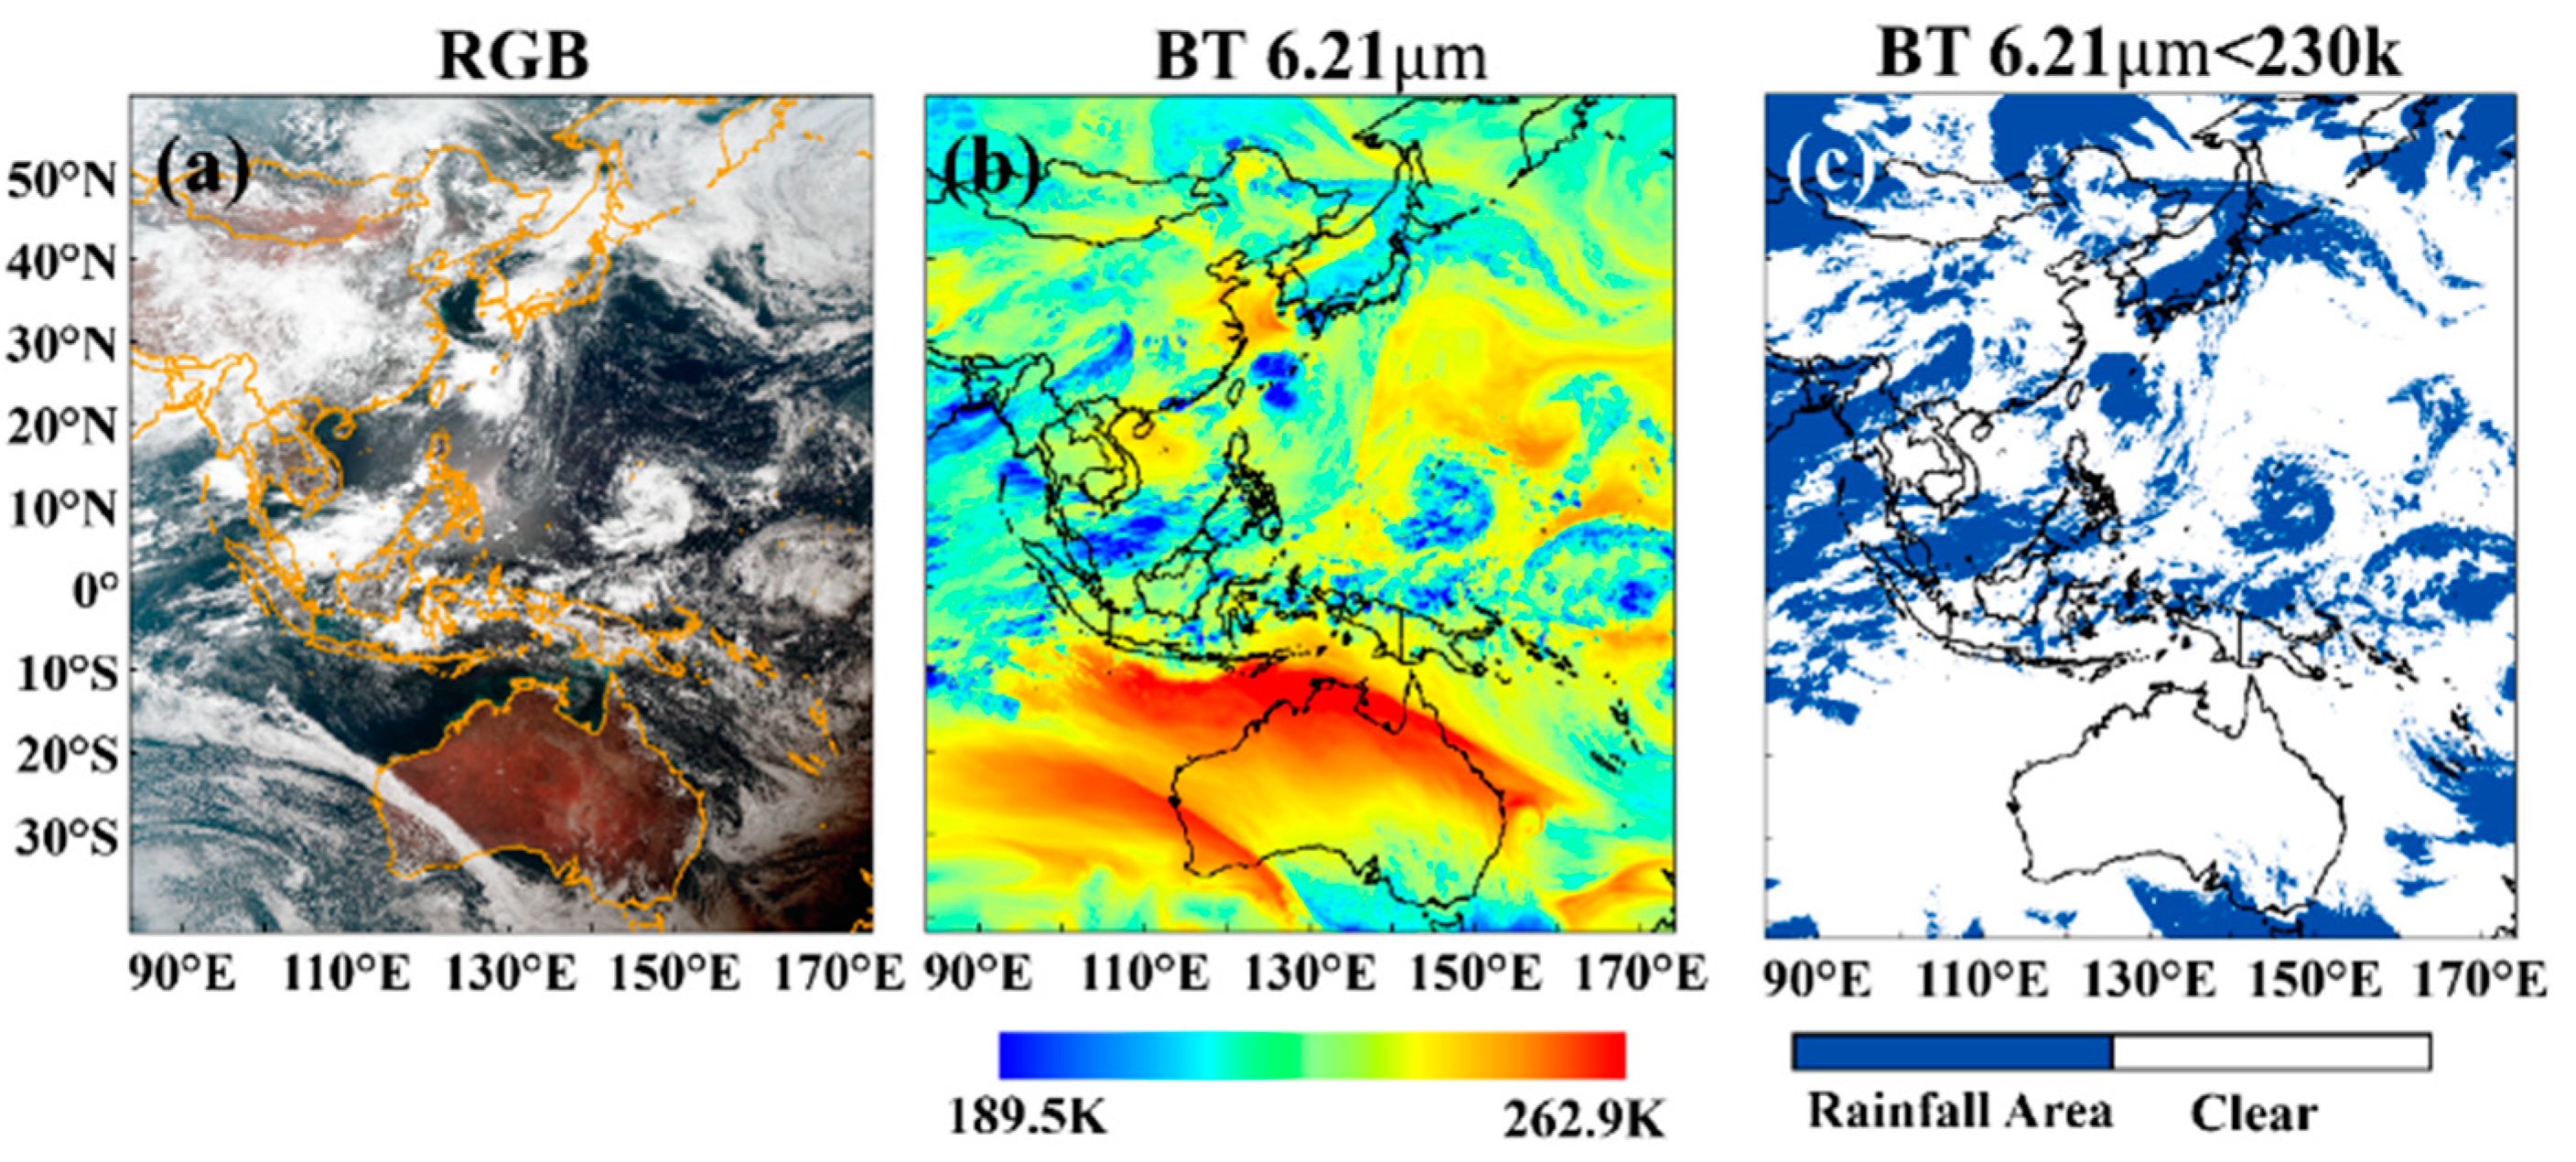
Figure 2 shows the B T 6.21 μ m of the IR channel (Figure 2b) compared to the true color map (Figure 2a) on 3 July 2018, at 05:00 UTC. The rainfall areas corresponding to IMERG data occur in areas where the brightness temperature of the 6.21 μm channel is lower than or approximately below 230 K. Figure 2c shows the rainfall areas obtained with testing using a 6.21 μm channel brightness temperature below 230 K. It can be seen that there is better identification in the area where rainfall areas occur, especially over the ocean, where identification is more accurate. However, the overall identification result based on a single channel at 6.21 μm appeared to be overestimated. Therefore, we added the parameters of brightness temperature difference of the water vapor absorption bands and features of cloud physical properties to improve the accuracy of rainfall area identification.
Thus, we employed a multi-threshold method to identify rainfall areas. The threshold criteria considered both the characteristics of rainfall areas in terms of the three water vapor absorption channels (i.e., B T 6.21 μ m , B T D 6.93,6.21 μ m , and B T D 7.34 , 6.93 μ m ) and three cloud physical properties (i.e., COT, CER, and CTT).

2.2.2. Determination of Threshold Criteria

To determine the thresholds for the six indicators mentioned above, we extracted the coordinates of rainfall areas and clear sky from rainfall events that occurred from January to October 2018 in East Asia based on rainfall area in the corresponding IMERG and CloudSat data. After matching the coordinates with H-8 L1 and L2 cloud products, the values of each indicator were extracted and quantified, and the occurrence frequency of pixels in rainfall and non-rainfall areas was calculated, which was then used to determine thresholds for rainfall area identification. The thresholds of previous similar studies are shown in Table 1.
Figure 3a–d show the one-dimensional histograms of the 6.21 μm channel, CER, CTT, and COT for rainfall area and non-rainfall area image elements, respectively. The rainfall areas are mainly distributed between 6.21 μm, bright temperature 200–235 K, CER between 10 and 50 μm, CTT between 200 and 265 K, and COT greater than 10. Thus, the thresholds for identifying rainfall areas were determined based on these distributions.
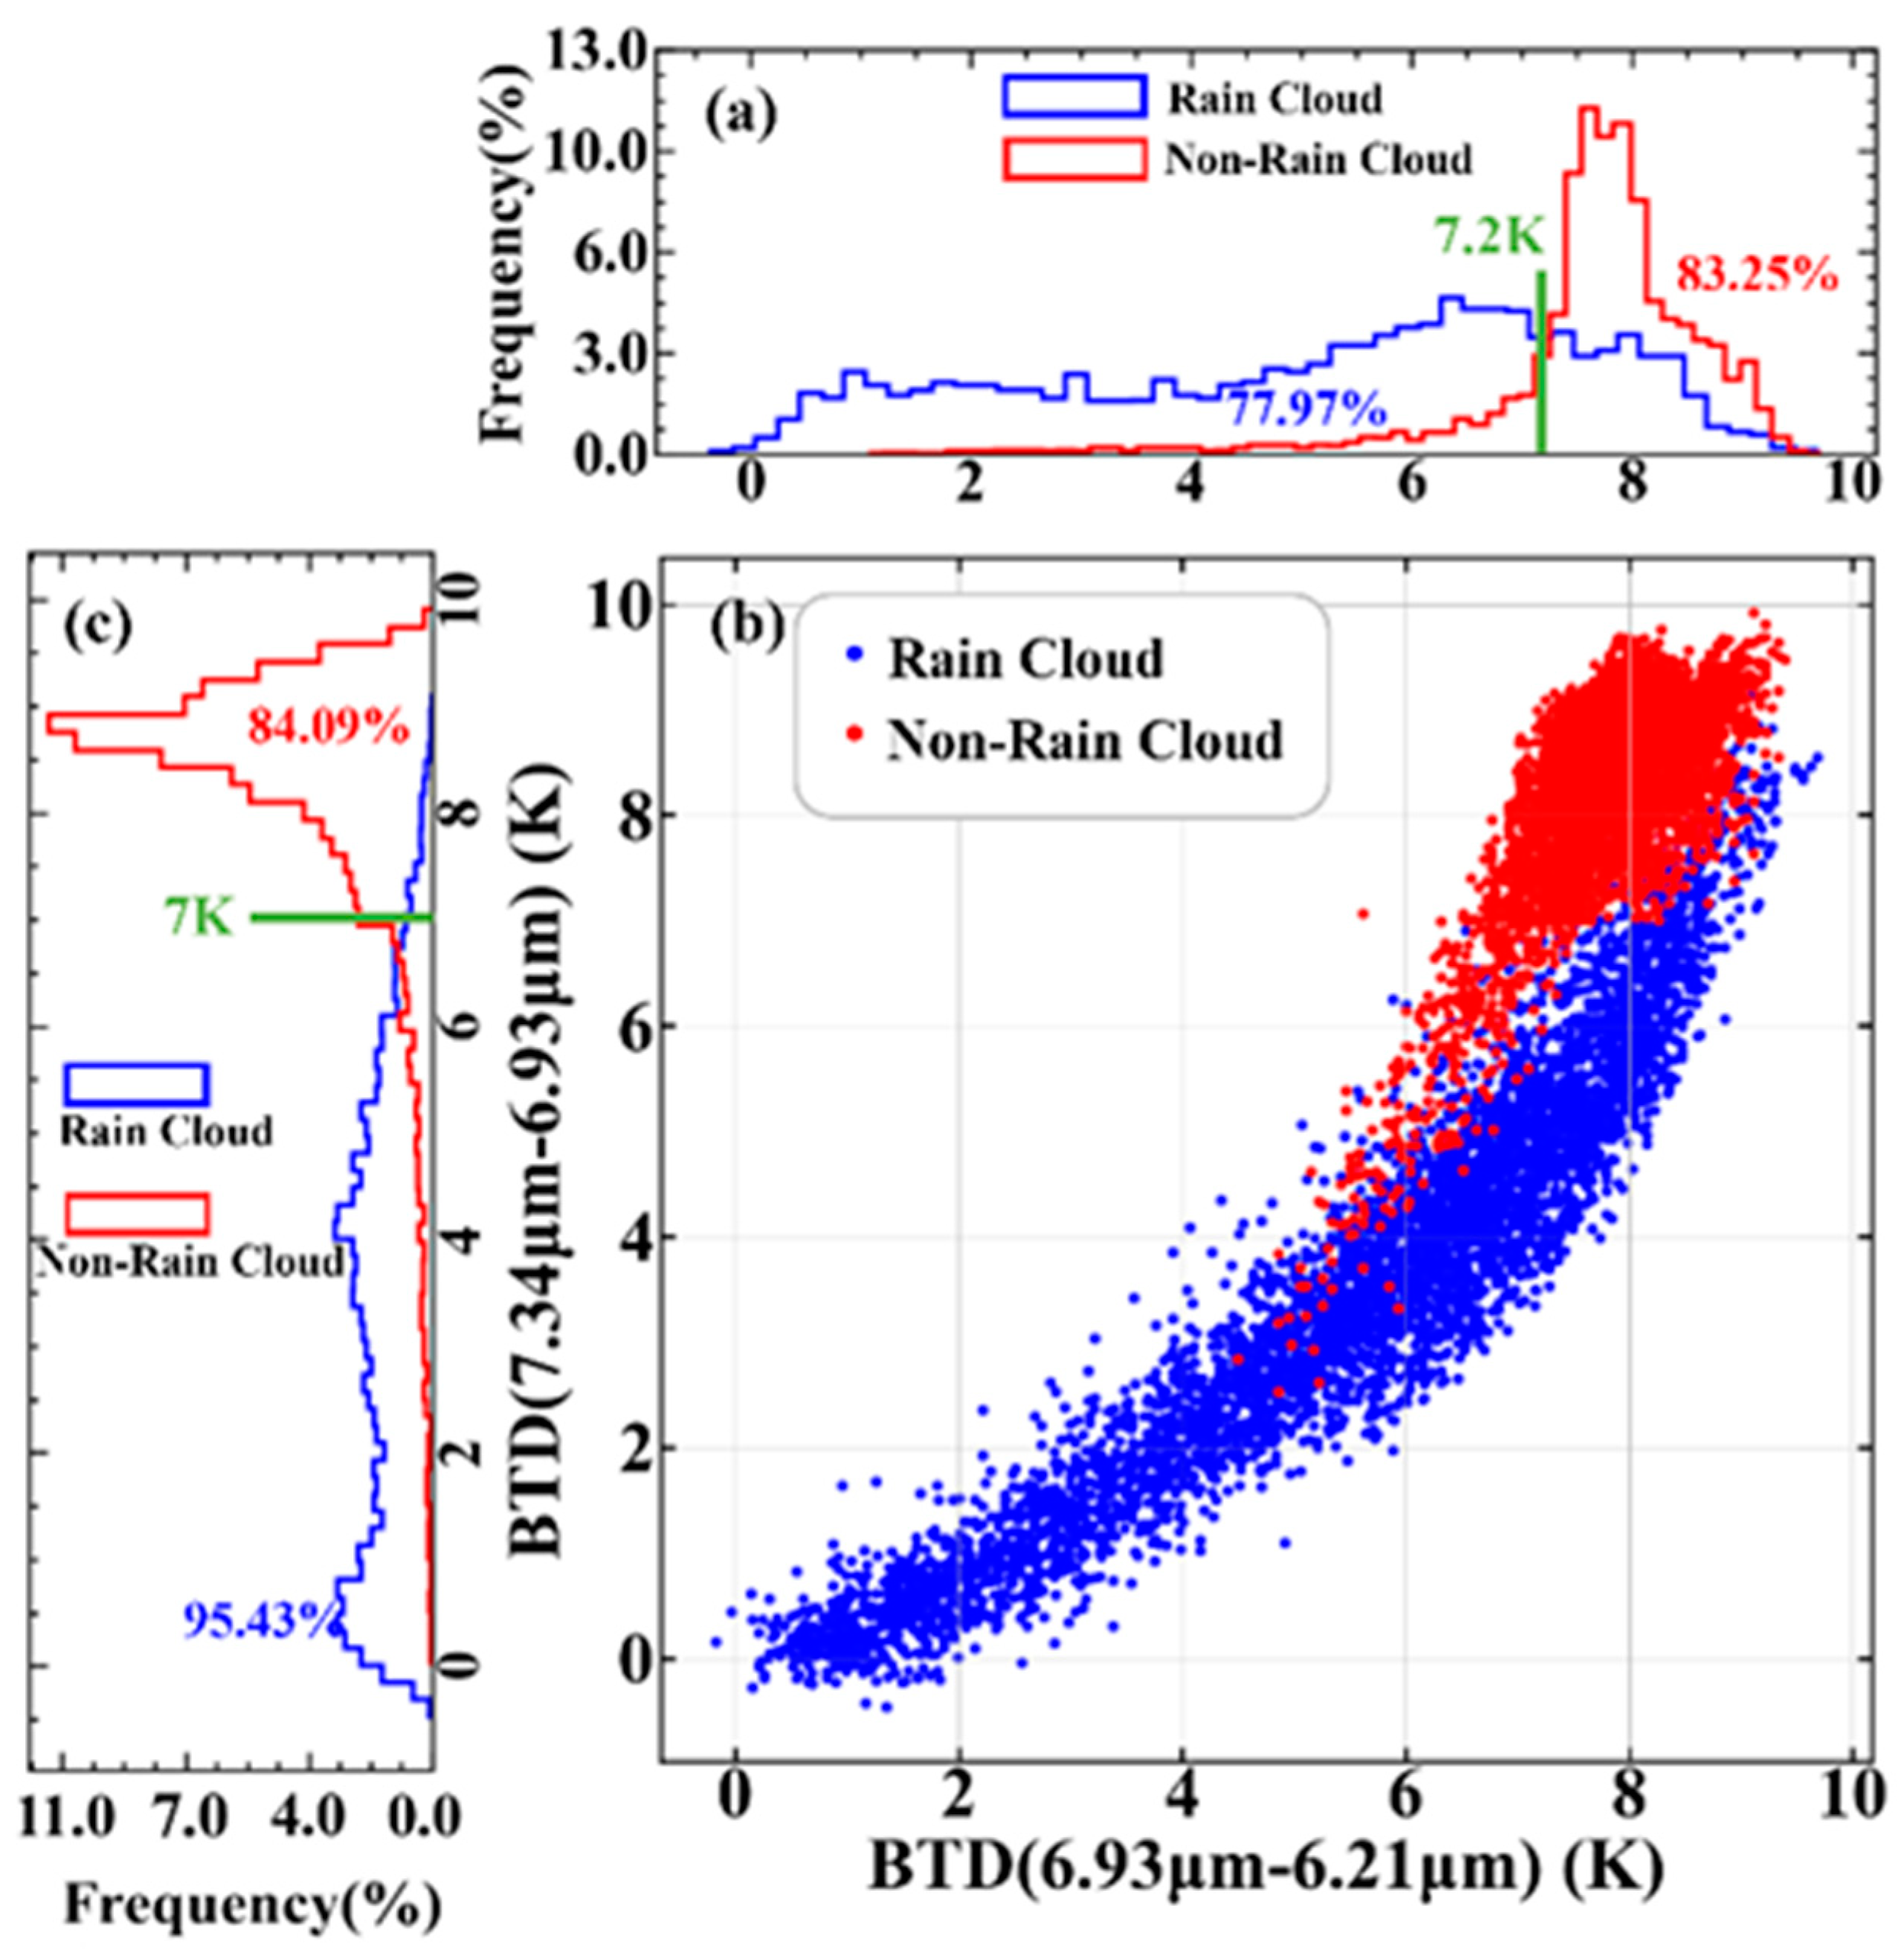
Rain clouds with high water vapor content had similar absorption characteristics in the three water vapor absorption channels at 6.21 μm, 6.93 μm, and 7.34 μm. The rainfall area had a slightly higher absorption capacity in the 6.21 μm channel than in the 6.93 μm channel, and the absorption capacity in the 6.93 μm channel was higher than that in the 7.34 μm channel. Thus, the bright temperature of rainfall areas in the 6.93 μm channel was higher than the bright temperature of the 6.21 μm channel, and the bright temperature of the 7.34 μm channel was higher than the bright temperature of the 6.93 μm channel. Here, the B T D 6.93,6.21 μ m and B T D 7.34 , 6.93 μ m between these three channels were used to identify rainfall areas. Figure 4a shows the one-dimensional histogram of B T D 6.93,6.21 μ m , Figure 4b shows the scatter plot of the rainfall area and non-rainfall pixels in B T D 6.93,6.21 μ m B T D 7.34 , 6.93 μ m coordinates, and Figure 4c shows the one-dimensional histogram of B T D 7.34,6.93 μ m . It is worth noting that, in this two-dimensional physical space, rainfall areas are clearly separated from non-rain clouds. The main clusters of rainfall areas were distributed between 0 and 7.2 K for B T D 6.93,6.21 μ m and between −1 and 7 K for B T D 7.34 , 6.93 μ m . Consequently, the threshold of the two bright temperature differences was adjusted on this basis.

2.2.3. Validation Method

GPM incorporates dual-frequency precipitation radar and has a wide global coverage. CloudSat radar data has limitations in observation range, and both are the most reliable sources of rainfall information available. In order to ensure the reliability of the verification results, we combined the two data for a quantitative comparison of the algorithm results. Due to the limited observation range of ground radar, we provide cases of long time series comparisons with ground-based radar in large rainfall areas, which achieves a high consistency.
The rainfall data in the CloudSat rainfall product 2C-RAIN-PROFILE had confidence levels of −1, 0, 1, 2, and 3, where −1 is the null value, 0 is a clear sky, and 1, 2, and 3 are the different types of rainfall, respectively; here, we chose cases with confidence levels greater than 0 as indicating the true value of rainfall. The CloudSat orbit passed over the study area from approximately 3:00 to 7:00 UTC each day. The CloudSat orbit passed over land areas, such as China and Australia, and ocean areas, such as the South China Sea and the Pacific Ocean, around 05:00 UTC each day. For the Pacific Ocean, so as to be consistent with the CloudSat results, we obtained the AHI measurements at 5:00 UTC each day. The GPM data IMERG-F product provided half-hourly global precipitation information. Thus, to match the CloudSat time and AHI measurements with the CloudSat results, we obtained the AHI measurements at 5:00 UTC. In order to be consistent with the CloudSat time and AHI measurement time, we also obtained the GPM rainfall measurement at 05:00 UTC time.
The accuracy of rainfall area recognition was evaluated based on the rainfall amount product from GPM and the CloudSat rainfall product, using a hit rate [65,66,67], false alarm rate [66,67], and accuracy rate [68] to evaluate the accuracy of rainfall area recognition results. The hit rate indicates the probability of correctly identifying rainfall areas, the false alarm rate indicates the probability of misclassification as rainfall area pixels, and the accuracy rate indicates the overall accuracy of the recognition algorithm. This was expressed in the following formula:
H R r a i n = A H I r a i n & A r a i n A r a i n
F A R r a i n = A H I r a i n & A c l r N c o l l o c a t e d
H R c l r = A H I c l r & A c l r A c l r
F A R c l r = A H I c l r & A r a i n N c o l l o c a t e d
A c c u r a c y = A H I r a i n & A r a i n + A H I c l r & A c l r A r a i n + A c l r
where A H I r a i n indicates the number of rainfall pixel samples of this algorithm, and A H I c l r indicates the number of non-rainfall pixels. A r a i n includes G P M r a i n   a n d   C l o u d s a t r a i n , the number of pixels of rainfall in GPM rainfall products and the number of pixels of rainfall in CloudSat rainfall products at the time of algorithm result validation, respectively. A c l r denotes the number of pixels of non-rainfall areas in GPM and CloudSat at the time of validation. & indicates pixels with consistent results. N c o l l o c a t e d represents the total number of collocated pixels.
To assess the impact of multiple indicators on identification accuracy, we conducted four tests for each level of validation. Indicators for identification were gradually included in tests 1, 2, 3, and 4, as indicated in greater detail in Table 2.

2.2.4. Analysis of Rainfall Characteristics of Cloud Types

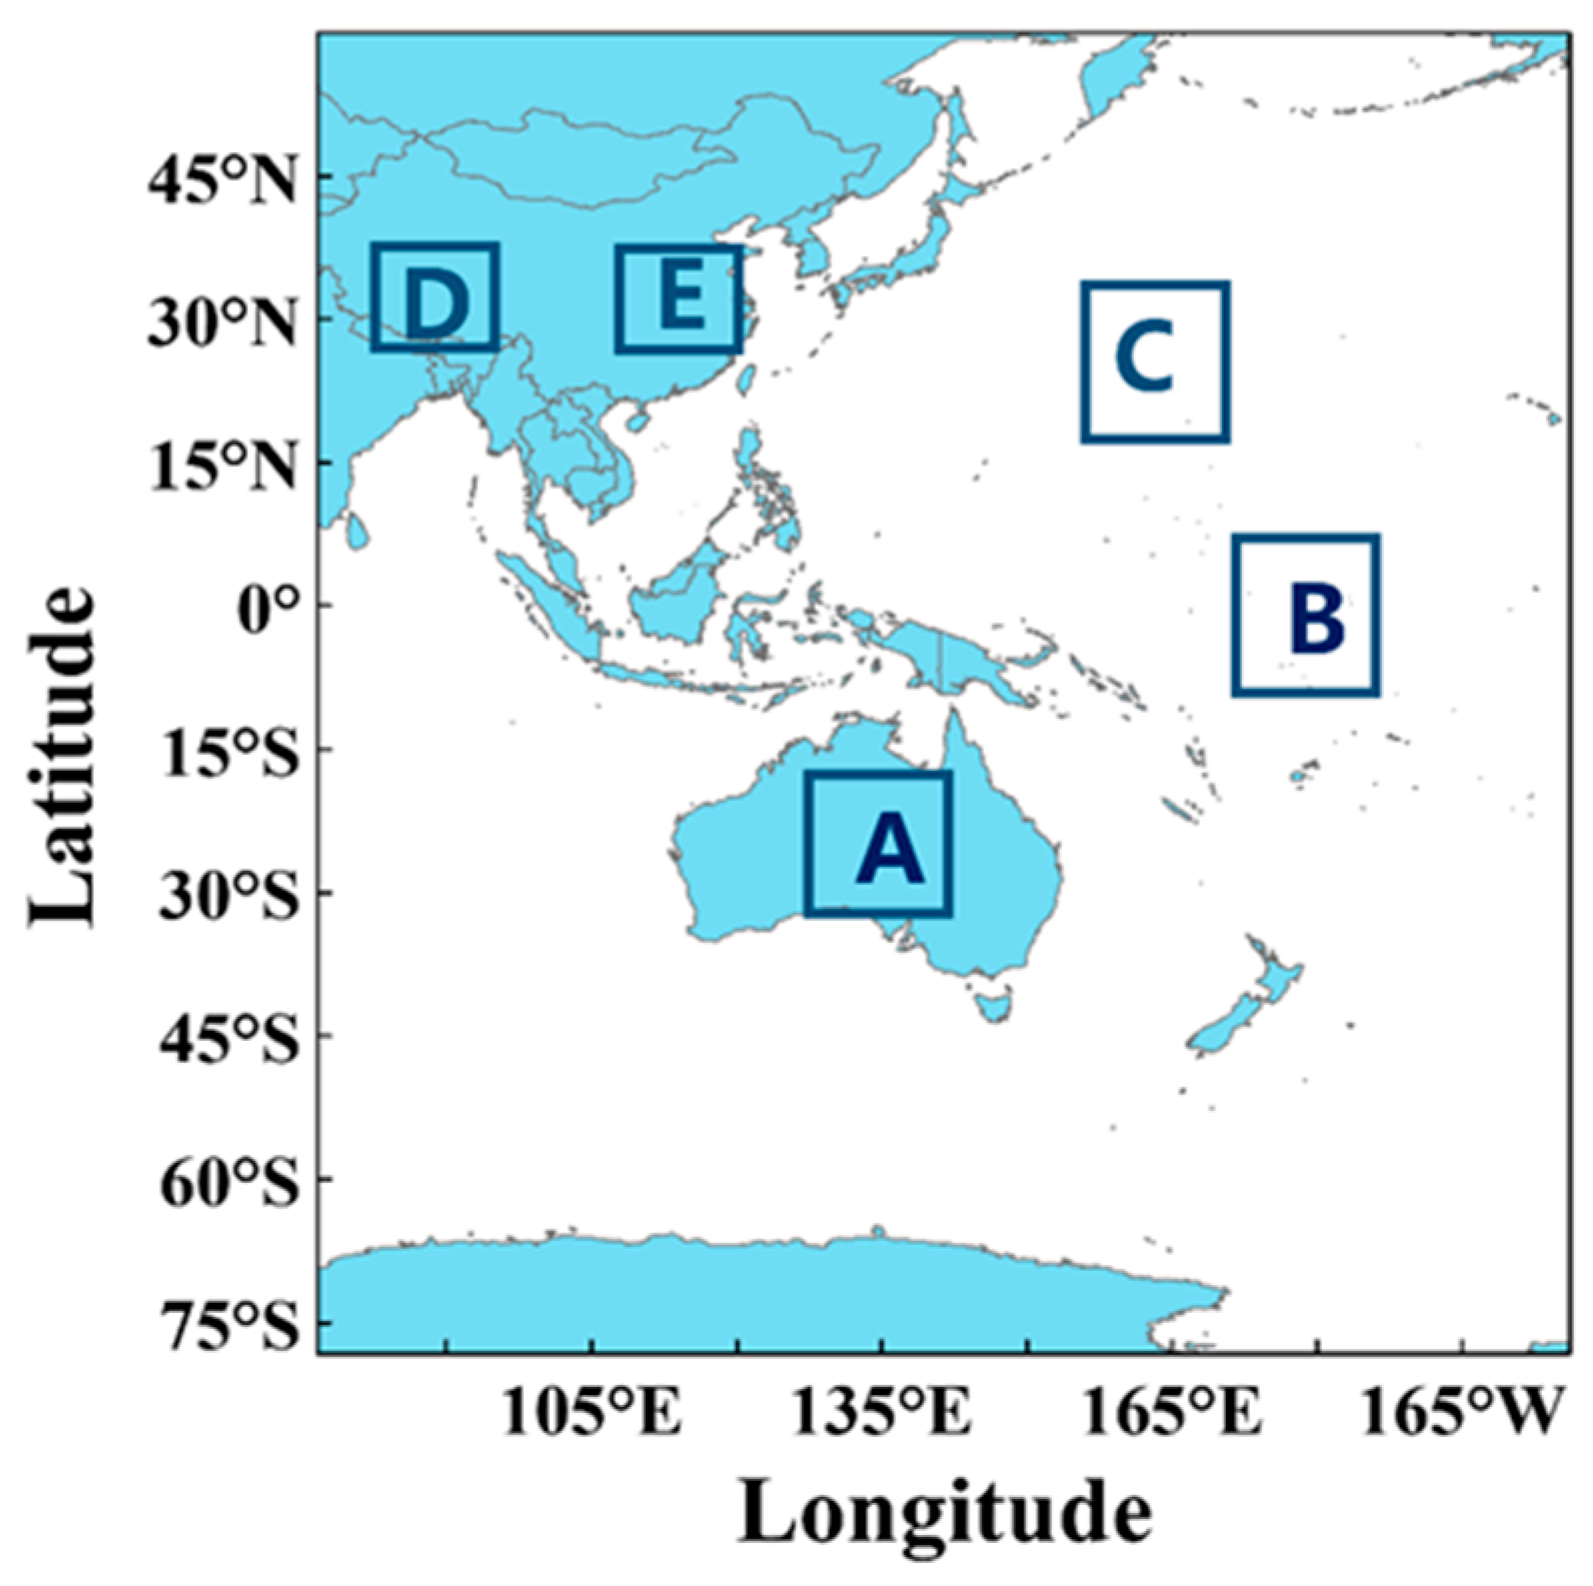
According to different climatic and topographic conditions, five typical regions were selected: Australia (A), the equatorial region (B), the Pacific Ocean (C), the Tibetan Plateau (D), and the North China Plain (Figure 5). To analyze the characteristics of rain cloud types in five different regions, we first needed to match the data in time and space. GPM IMERG data covers the whole world, while H-8 only covers East Asia. Therefore, GPM data were tailored to be consistent with the spatial scope of H-8. Additionally, the GPM data were obtained every half hour, while the H-8 data were obtained every ten minutes, allowing two scenes in one hour to be matched in time. Here, we used the GPM rainfall data and the H-8 cloud type data for January, April, July, and October 2017. Precipitation property in GPM represents rainfall data, in which invalid values of −9999.9 represent clear sky, and values greater than 0 represent rainfall. Values 1–9 in the cloud type data of H-8 represent nine different cloud types, respectively.

3. Results

3.1. Evaluation of Rainfall Area Algorithm Results

The above-shown analysis showed that the 6.21 μm channel brightness temperature had a strong sensitivity to rainfall areas. The introduction of CER also improved the determination of rainfall areas. Rainfall areas also showed significant differences between the 6.93 μm, 6.21 μm, and 7.34 μm channels of AHI. To determine the effectiveness of CER and AHI water vapor channels in rainfall area identification, four different tests were designed to verify the effectiveness of the above cloud properties in identifying rainfall areas (Table 2). Test 1 defined two tests, COT and CTT:COT was defined as between 10 and 70 and CTT between 210 and 265 K according to the detection method of Platnick and Twoiiiey [53]. Test 2 included CER tests of 10–50 μm. Test 3 included a 6.21 μm channel brightness temperature of less than 235 K. According to the H-8 channel design characteristics, the 6–7 μm channel is a water vapor absorption channel. Test 4 included a 6.93–6.21 μm channel brightness temperature difference and a 7.34–6.93 μm channel brightness temperature difference.
Therefore, this study introduced the validation of rainfall area identification results with GPM/CloudSat precipitation information. Four tests were applied to the cloud attribute data from Himawarii-8/AHI at 05:00 UTC on 3 July 2018; at 05:00 UTC on 13 July 2018; and at 05:00 UTC on 23 July 2018. Table 2 documents the quantitative analysis of the accuracy of the rainfall area identification results relative to GPM precipitation products. For the full H-8 range, the rainfall area image elements specified in Test 2 agreed significantly better with H-8/AHI data than the rainfall area identification results from Test 1, with HR values of 61.07% and 45.48%, and FAR values of 4.45% and 3.18% for the two tests, respectively. These results indicate that the addition of CER significantly improved the accuracy of the rainfall area identification results. The HR values of rainfall area identification for Test 3 and Test 4 were 72.2% and 76.46%, while the FAR values were 12.04% and 16.55%, respectively; this confirms the effectiveness of water vapor channel brightness and volume temperature differences as methods of rainfall area identification. Overall, test 4 appeared to reduce the probability of misclassifying clear sky as a rainfall area and identified rainfall areas in clouds more accurately.
Test 3, which used 6.21 μm bright temperature, showed a significant improvement in recognition accuracy over Test 2 for different areas of the ocean, land, and H-8 full-disk, with 14.09%, 7.49%, and 11.13% improvement in the ocean, land, and H-8 full disk HR, respectively, with the greatest improvement on the ocean. Test 4, which used 6.93–6.21 μm channel bright temperature differences and 7.34–6.93 μm channel bright temperature differences also showed improvement in recognition accuracy over test 3 on different areas of the ocean, land, and H-8 full disk by 6.73%, 2.59%, and 4.26%, respectively, with the most significant improvement in the ocean and the weakest improvement on land. All four tests showed higher recognition accuracy for rainfall areas on the ocean than on the land. This result may be due to the higher frequency of rainfall areas on the ocean than on land, as well as the lower reflectivity and bright temperature of the ocean, which have less impact on cloud recognition than over land.
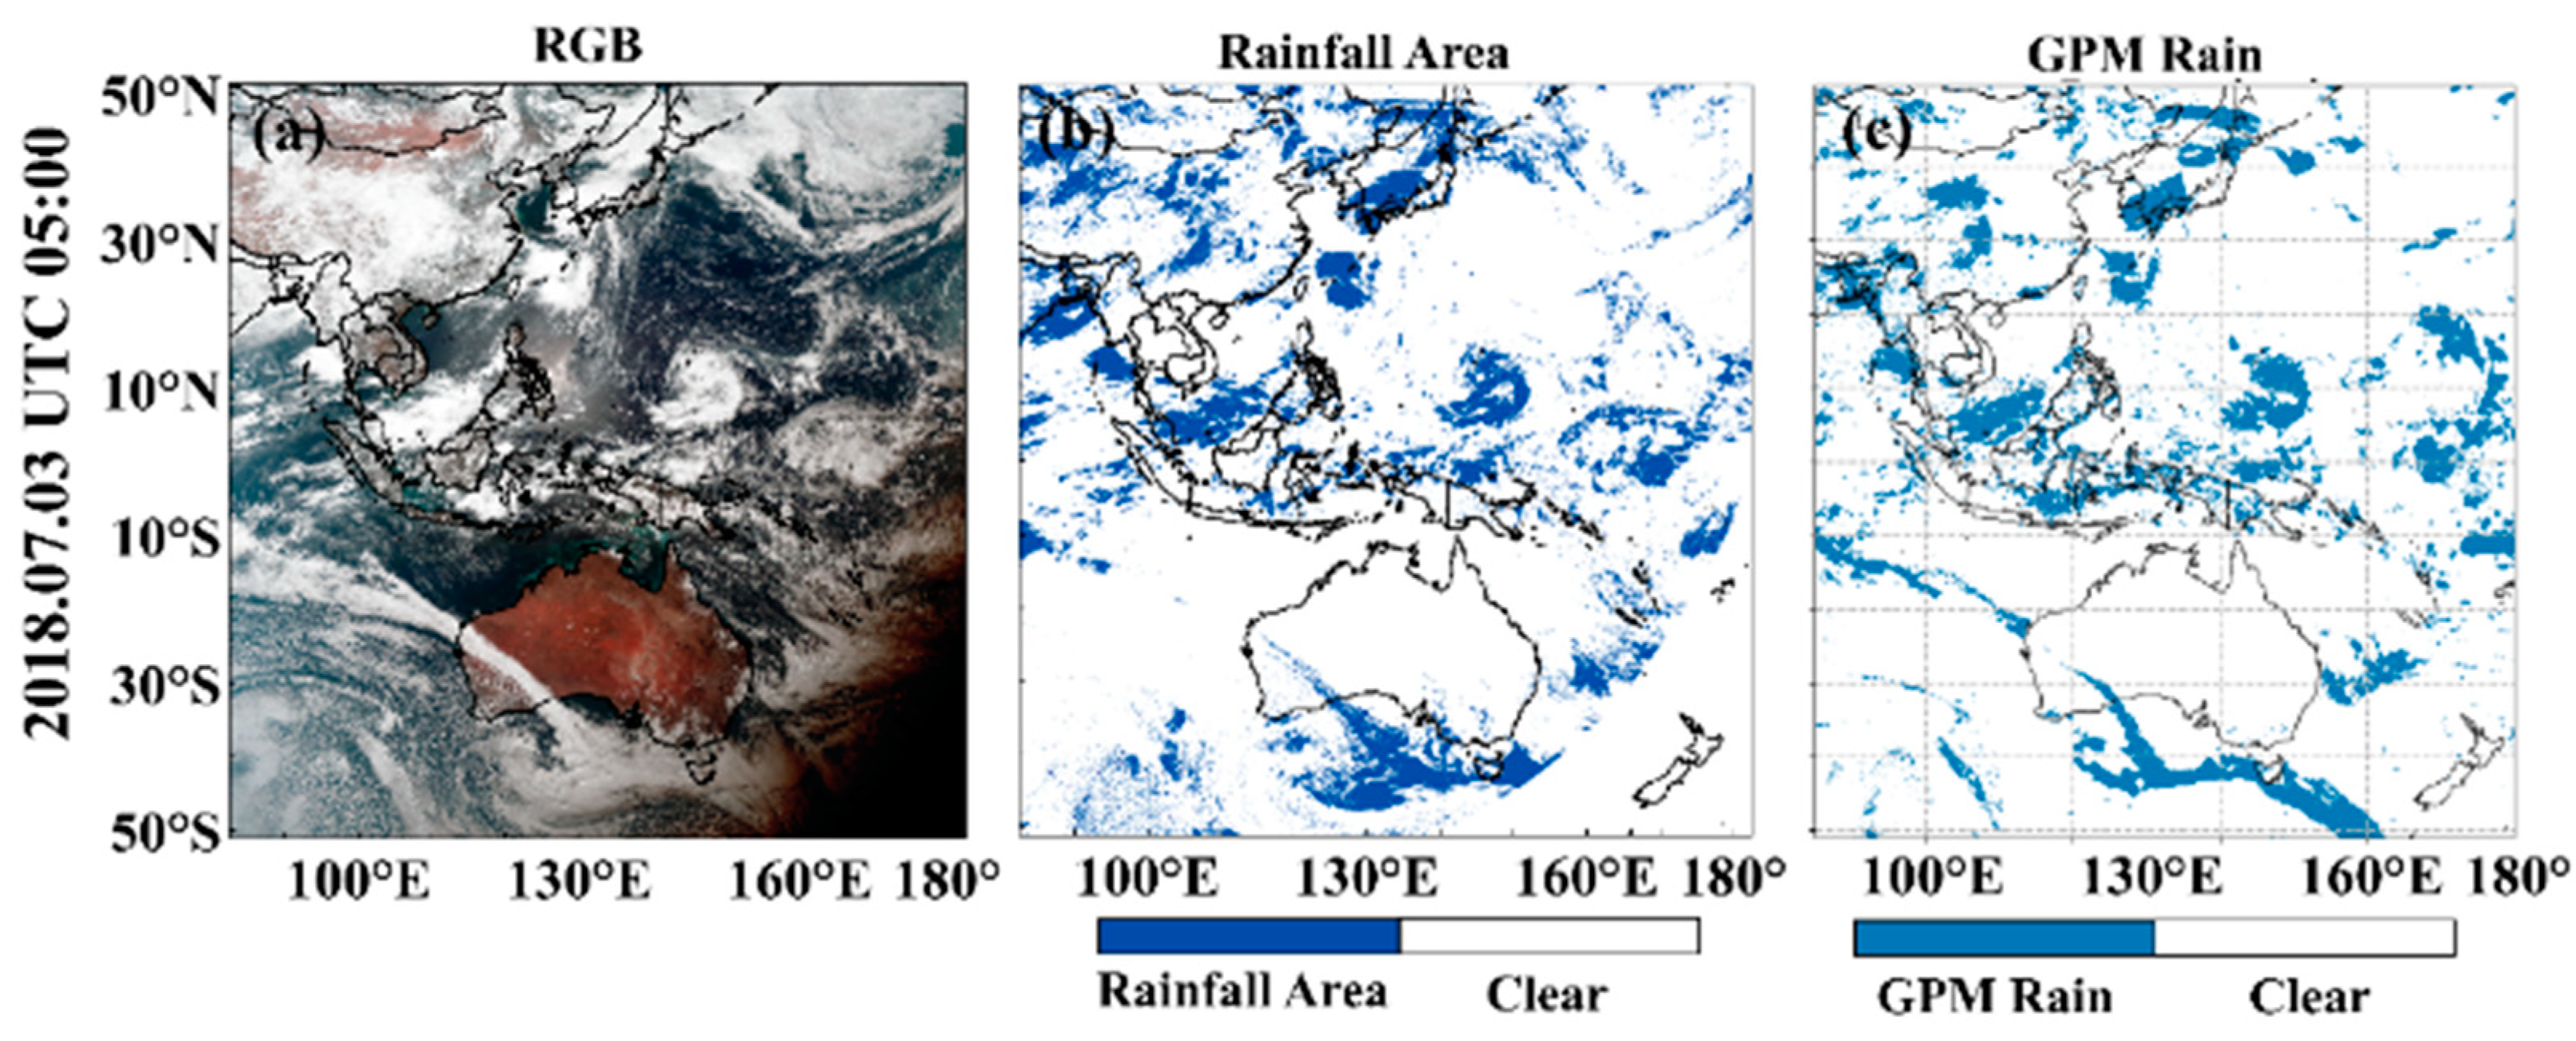
Figure 6a–c show the spatial distribution of the H-8/AHI true-color image, the rainfall area identification results of this study, and the GPM rainfall data, respectively. Over the ocean, the H-8/AHI rainfall areas were able to correspond well with the GPM rainfall products. However, over the land, the accuracy of this algorithm’s identification was slightly lower than over the ocean. This may be due to the properties of the different underlying surfaces.
Table 3 shows the quantitative validation results of rainfall areas using GPM rainfall products in four seasons: January 2019, April 2019, July 2018, and November 2018. Consistent with previous results, the highest hit rates of 80.78% and 82.67% accuracy were achieved by matching the rainfall area identification results with GPM in the summer month of July 2018, while the lowest accuracy of 67.19% was achieved in the winter month of November 2018. This may be due to the greater cloudiness and additional rainfall in summer and less cloudiness in winter.
In order to further verify the accuracy of rainfall area identification, our study incorporated the validation of rainfall area identification results with the highly accurate active detection observation of CloudSat satellite rainfall product. Table 4 shows the quantitative validation results of the rainfall area identification results using the CloudSat rainfall product. Consistent with the above results, the highest hit rates of 84.45% and 83.51% accuracy were achieved by matching rainfall areas with the CloudSat rain product in July 2018 in summer, while the lowest hit rate of 77.93% was from January 2019, in winter.

3.2. Analysis of Cloud Types in Rainfall Area

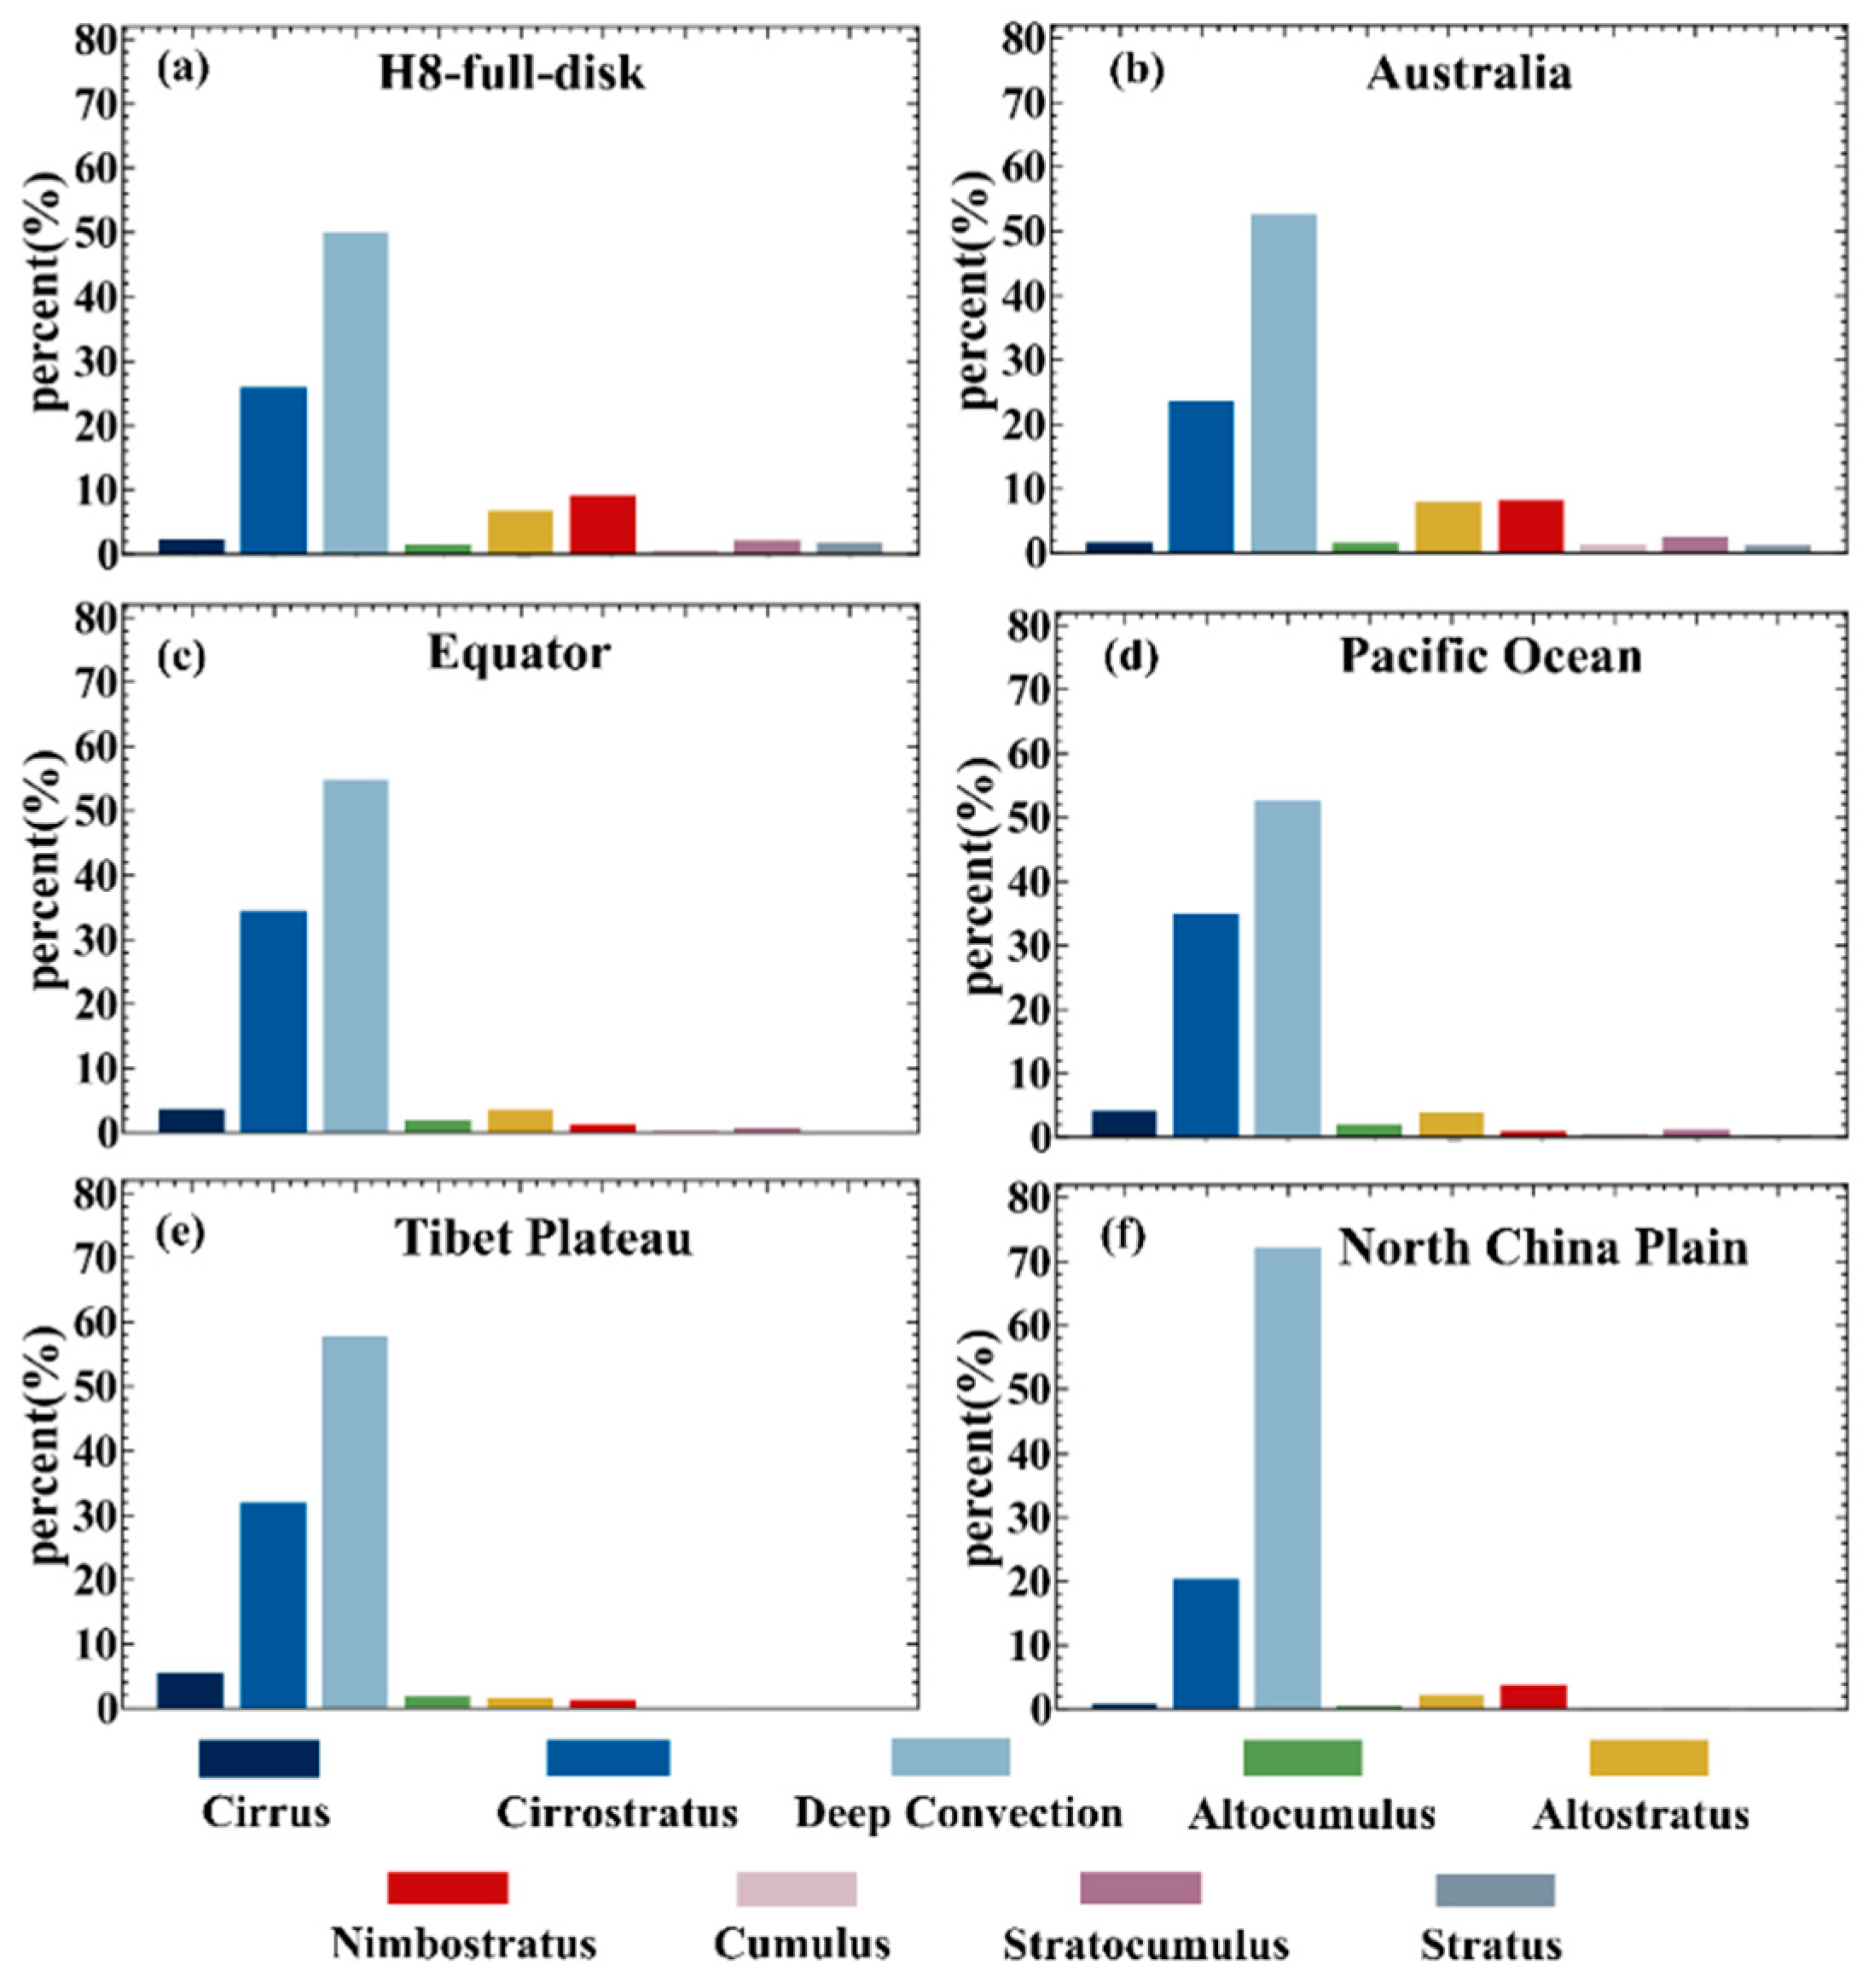
Deep convective clouds are generated by strong convection in the air and usually cause more intense rainfall, which is the main source of rainfall in different regions, such as the ocean, land, and H-8 full disk. The second main source is cirrostratus clouds, which are mainly ice clouds and usually cover deep convective clouds, especially over the ocean. In all rainfall events over the ocean, 87.6% of the rainfall areas are associated with deep convective clouds and cirrostratus clouds. Additionally, nimbostratus clouds also contribute significantly to rainfall over land (e.g., Australia and the North China Plain) and over the overall H-8 full region (8.14%, 3.75%, and 8.99%, respectively) (Figure 7).
Single-layer rain clouds are dominated by nimbostratus clouds. Nimbostratus clouds are thick and uniform rain clouds with a wide spatial distribution. Large droplets and high albedo are typically identified in nimbostratus. The tops of nimbostratus clouds are composed of ice crystals, the middle is composed of supercooled water droplets together with ice crystals, and the bottom is composed of water droplets [69,70]. Nimbostratus clouds tend to be associated with longer periods of continuous rainfall. Convective clouds are cumulus clouds generated by convection in an unstable atmosphere due to thermal or dynamic conditions. Convective clouds are characterized by a small spatial scale, rapid development and variation, short duration, and high suddenness, which make them difficult to forecast accurately at present [59,64,71]. Convective clouds and single convective clouds are often accompanied by strong convective weather, such as hail, tornadoes, and heavy precipitation. Thus, they are also types of clouds that may respond strongly to climate change [17,72]. Given the above, rainfall area areas were presumed to mainly contain convective clouds and nimbostratus in this study.

3.3. Spatiotemporal Characteristics Analysis of Rainfall Area

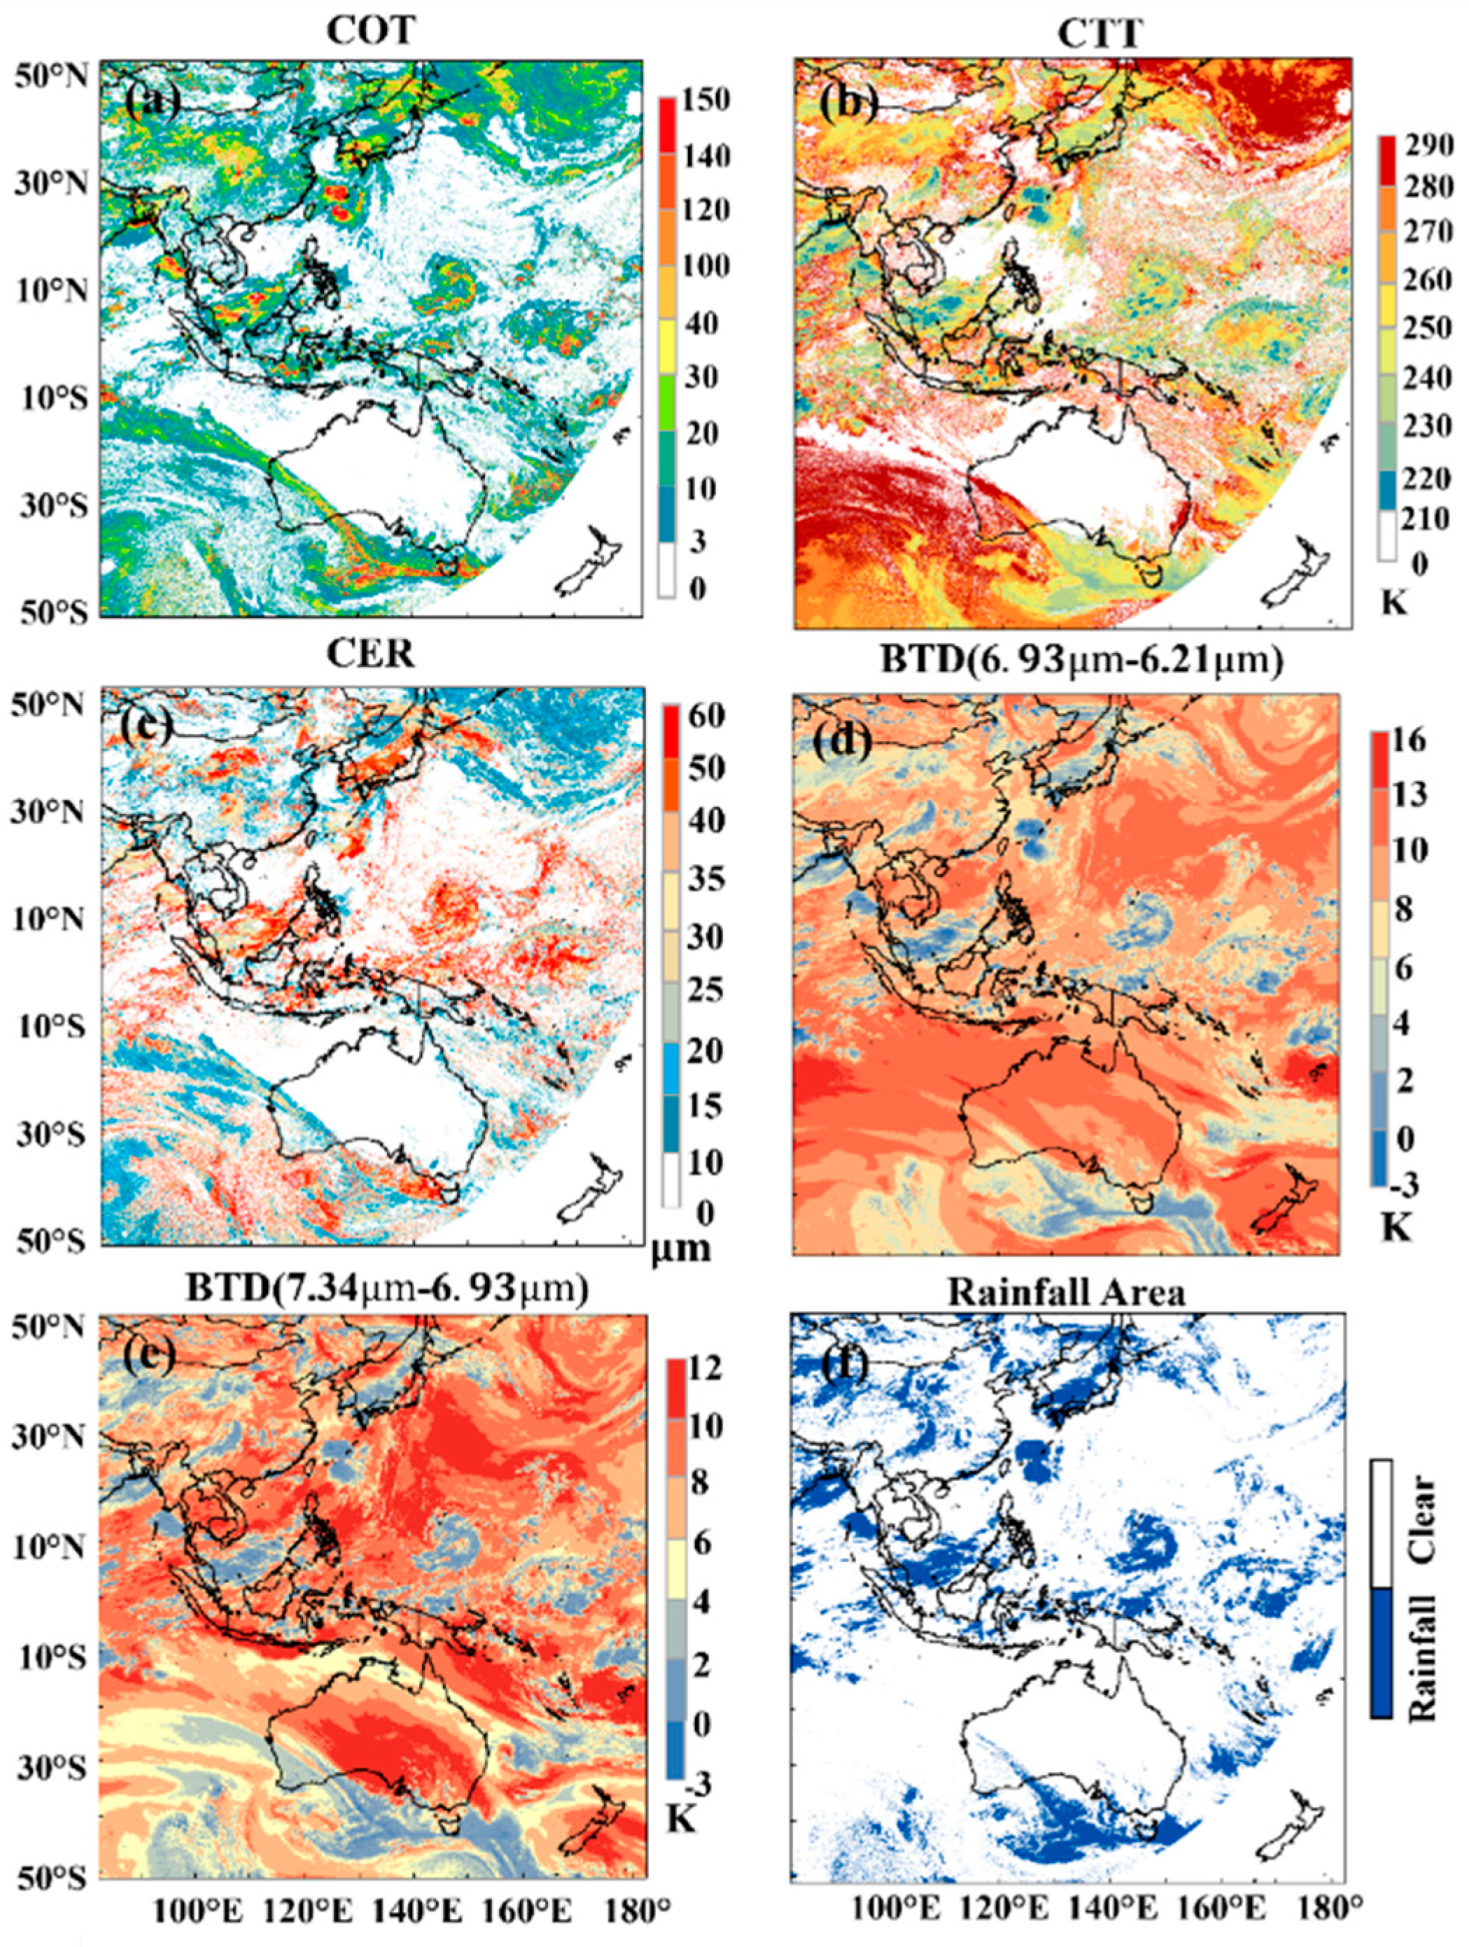
As shown in Figure 8, the COT of rainfall areas is generally larger than that of clear areas. For the rainfall areas in Figure 8f, the optical thickness of rainfall areas over the ocean in the corresponding region of Figure 8a is greater than 120 μm, and the optical thickness of rainfall areas over land is greater than 30 μm. The CTT range of rainfall areas shown in Figure 8b is about 230–260 K. The effective range of CER in Figure 8c is about 30–60 μm, the brightness temperature difference between the 6.93 μm and 6.21 μm channels is about −3–7 K (Figure 8d), and the brightness temperature difference between the 7.34 μm and 6.93 μm channels is about −3–6 K (Figure 8e). The rainfall area identification results in Figure 8f are consistent with the spatial distribution results for COT, CTT, CER, brightness temperature of the 6.21 μm channel, and the brightness temperature difference; thus, the rainfall area recognition algorithm could effectively identify rainfall areas.
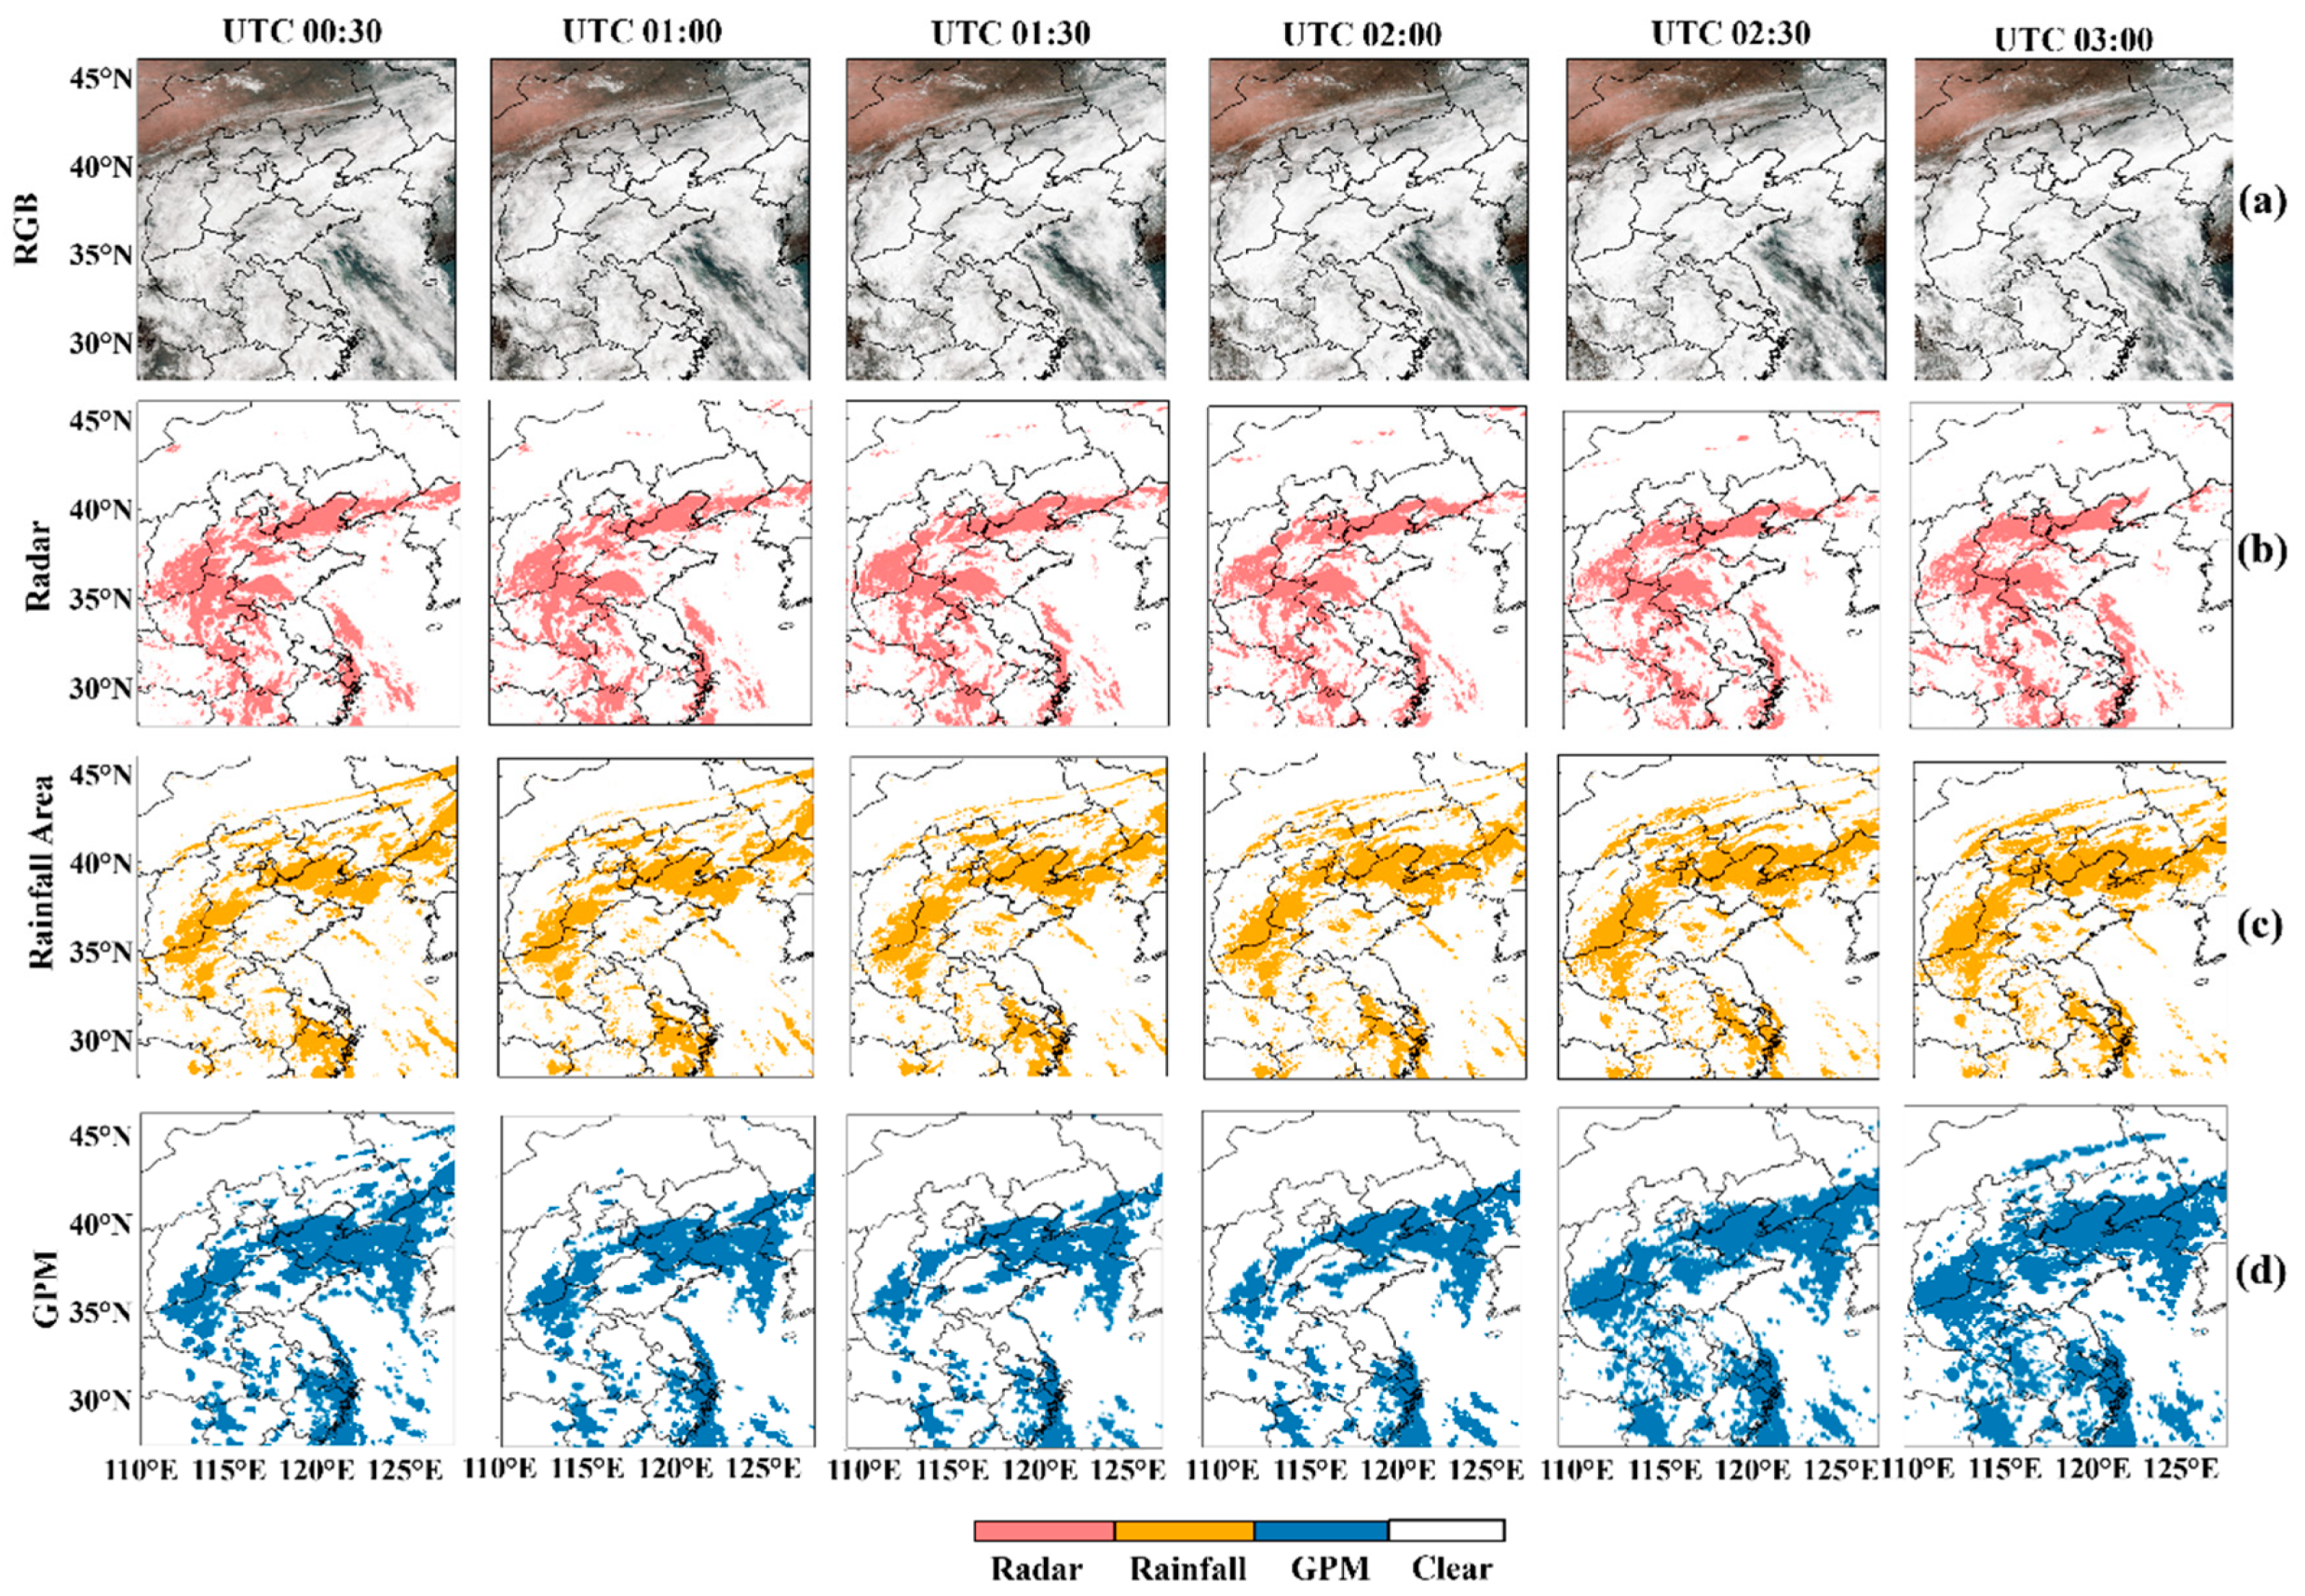
In order to further prove the effectiveness of this algorithm, we also performed a comparative analysis with the ground radar rainfall observation data on different time scales and found that the algorithm could capture very similar patterns to ground-based observations. Figure 9a indicates the true-color maps of UTC 00:30, UTC 01:00, UTC 01:30, UTC 02:00, UTC 02:30, and UTC 03:00 on July 29, respectively; Figure 9b shows the rainfall areas of the ground-based radar, respectively; Figure 9c shows the identification results of the rainfall area of this algorithm, respectively; Figure 9d shows the rainfall areas of GPM, respectively. As can be seen here, the results indicate that this algorithm was more sensitive to capturing the spatiotemporal variation of rainfall areas.
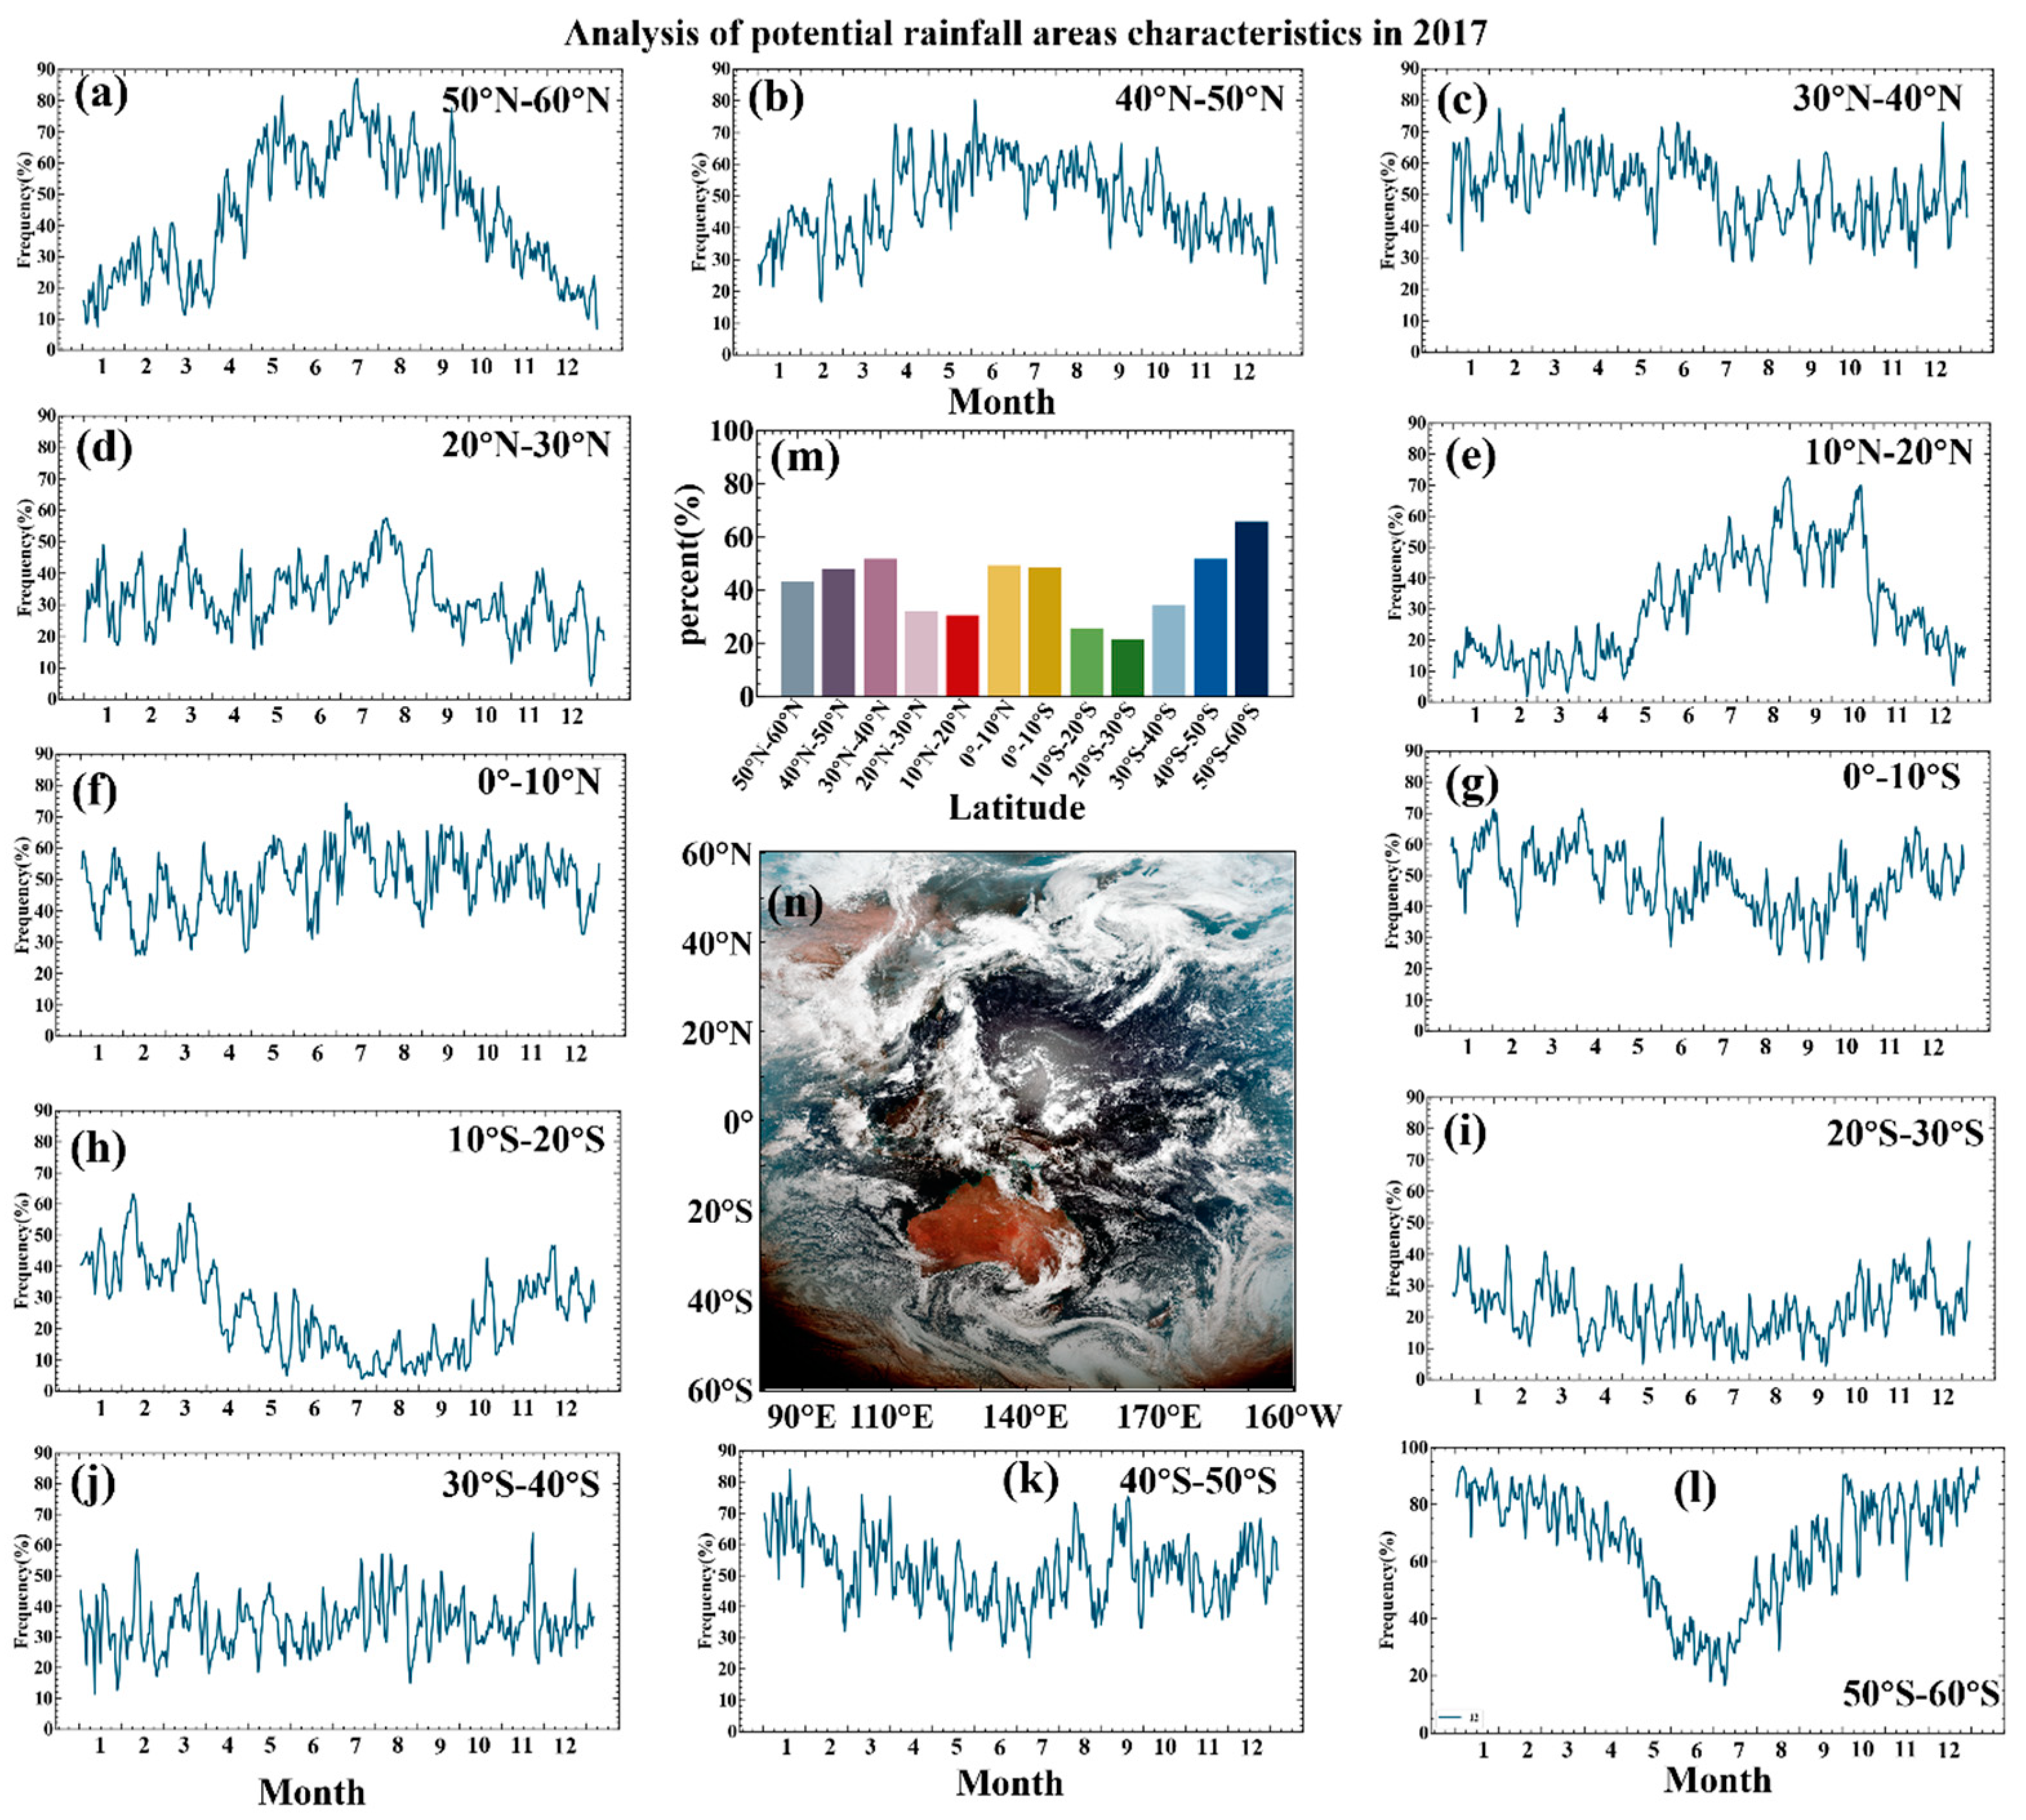
Figure 10 shows the temporal and spatial variation of rainfall area in the H-8 full disk. Figure 10a–l indicate the rainfall frequency in rainfall areas from mid-latitudes in the Northern Hemisphere to mid-latitudes in the Southern Hemisphere during 2017. On a time scale, the peak of precipitation is mainly concentrated in summer (June, July, and August in the Northern Hemisphere, December, January, and February in the Southern Hemisphere). The peak of precipitation from the mid-latitude to the equator also gradually moves, and the seasonal change tends to be stable at the equator. Moreover, on a spatial scale, the closer the region was to mid-latitude, the more obvious the seasonal variation of rainfall. As shown in Figure 10m, rainfall decreases from mid-latitudes to the equator and then increased; the mid-latitude and the equatorial region had more rainfall, and the North-South tropic had less rainfall.

4. Discussion and Conclusions

In this study, multiple infrared bands were found to improve the accuracy of rainfall area detection and the development of reliable rainfall area products with high spatial and temporal resolution. Such products have obvious advantages in extreme precipitation systems and could provide data support for studies on guiding artificial rainfall and improving numerical weather forecasting, as well as ensuring aircraft flight safety.
The rainfall area algorithm constructed in this study had high recognition accuracy. Validated with the rainfall area of GPM IMERG products, the CHR and FAR of rainfall areas were 70.03% and 2.05%, respectively. When validated with CloudSat satellite rainfall products, the CHR and FAR of rainfall areas were 81.39% and 21.34%, respectively, and the accuracy of rainfall area identification was improved by introducing parameters such as COT and water vapor channels. Compared with the cloud type products of AHI, the proportion of deep convection, cirrostratus, and nimbostratus clouds in rainfall areas were 50.09%, 25.95%, and 8.99%, respectively, with their sum totaling 85.03%. This algorithm provided an effective basis for the scientific realization of artificial rainfall and extreme weather research.
Over the time scale employed here, rainfall area identification was most accurate in the summer; the validation results with GPM and CloudSat in the summer reached an HR of 80.78% and 84.45% in HR, and 3.52% and 19.43% false alarm rates, respectively. Peak rainfall was mainly concentrated in summer, and seasonal variation was more obvious in the mid-latitude region than in the equatorial region, while the peak rainfall from the mid-latitude region to the north–south tropic region of Capricorn shifted gradually.
On the spatial scale, rainfall areas were more distributed over the ocean than over land, and the accuracy of rainfall area identification was higher over the ocean than on land as well. The accuracy of the rainfall area results with the quantitative validation results on ocean is higher than that on land and the rainfall area identification algorithm can reduce the probability of misclassifying non-rainfall areas as rainfall areas. Additionally, there was the most precipitation in the mid-latitude and the equatorial region, and less in the north–south tropic region.
It is different from the measurement of rainfall in previous studies. In this study, the use of geostationary satellites for rainfall detection is a challenge in itself. The rainfall identification results obtained by the use of geostationary satellites in this study reached a high consistency with the most reliable satellite radar observation, and can also have a high consistency with ground radar in heavy rainfall areas. In addition, this study focuses on using the advantages of a multi-band combination of geostationary satellites to establish a high-precision rainfall area recognition algorithm and emphasizes the advantage of high spatiotemporal resolution of geostationary satellites to capture the dynamic changes of rainfall regions, which is of great significance for rainfall prediction and the study of extreme rainfall disasters.
It should be noted that this rainfall area identification algorithm also had certain limitations. (1) In winter, the accuracy of rainfall area identification was lower due to less distribution of clouds, less rainfall, and underlying surface properties. (2) On land, the accuracy of rainfall area identification was lower than that over the ocean due to the influence of subsurface characteristics. In the future, we will consider the influence of underlying surface on rainfall recognition, and add the exclusion of snow pixels to optimize the algorithm. (3) The data for rainfall area validation were limited, and the available data lacked more accurate rainfall area products with wide coverage based on active observation radar; thus, there was some uncertainty in assessing the accuracy of the algorithm.

Author Contributions

Conceptualization, X.C., H.L. and H.S.; methodology, X.C., H.L. and H.S.; validation, X.C.; formal analysis, H.L. and H.S.; resources, H.L.; data curation, D.J., C.T. and Y.T.; writing—original draft preparation, X.C.; writing—review and editing, X.C.; supervision, X.R.; project administration, H.L. and C.S. All authors have read and agreed to the published version of the manuscript.

Funding

This research was funded by the National Natural Science Foundation of China (Grant 42025504), the National Key Research and Development Program of China (Grant No. 2023YFB3905900), the National Natural Science Foundation of China (Grant 42175152), and the Second Tibetan Plateau Scientific Expedition and Research Program (2019QZKK0206).

Data Availability Statement

The data are available from the authors upon reasonable request as the data need further use.

Acknowledgments

The authors would like to thank the JAXA and NASA for providing the Himawari-8 satellite data, and the GPM precipitation and CloudSat data, respectively. They would also like to thank the Meteorological Observation Centre, China Meteorological Administration for providing ground-based precipitation data and China New Generation Weather Radar (CINRAD).

Conflicts of Interest

The authors declare no conflicts of interest.

References

  1. Bruintjes, R.T. A Review of Cloud Seeding Experiments to Enhance Precipitation and Some New Prospects. Bull. Am. Meteor. Soc. 1999, 80, 805–820. [Google Scholar] [CrossRef]
  2. Kulkarni, J.R.; Maheskumar, R.S.; Morwal, S.B. The Cloud Aerosol Interaction and Precipitation Enhancement Experiment (CAIPEEX): Overview and Preliminary Results. Curr. Sci. 2012, 102, 413–425. [Google Scholar]
  3. Kollias, P.; Clothiaux, E.E.; Miller, M.A.; Albrecht, B.A.; Stephens, G.L.; Ackerman, T.P. Millimeter-Wavelength Radars: New Frontier in Atmospheric Cloud and Precipitation Research. Bull. Am. Meteor. Soc. 2007, 88, 1608–1624. [Google Scholar] [CrossRef]
  4. Li, J.; Wang, W.-C.; Dong, X.; Mao, J. Cloud-Radiation-Precipitation Associations over the Asian Monsoon Region: An Observational Analysis. Clim. Dyn. 2017, 49, 3237–3255. [Google Scholar] [CrossRef]
  5. Liu, L.; Zheng, J.; Ruan, Z.; Cui, Z.; Hu, Z.; Wu, S.; Dai, G.; Wu, Y. Comprehensive Radar Observations of Clouds and Precipitation over the Tibetan Plateau and Preliminary Analysis of Cloud Properties. J. Meteorol. Res. 2015, 29, 546–561. [Google Scholar] [CrossRef]
  6. Zhang, J.; Chen, Y. Typhoon Nida’s Rainfall Characteristics in Guangzhou City Based on Doppler Radar Estimation. IOP Conf. Ser. Earth Environ. Sci. 2018, 169, 012002. [Google Scholar] [CrossRef]
  7. Lo, S.-W.; Wu, J.-H.; Lin, F.-P.; Hsu, C.-H. Cyber Surveillance for Flood Disasters. Sensors 2015, 15, 2369–2387. [Google Scholar] [CrossRef]
  8. Marzano, F.S.; Palmacci, M.; Cimini, D.; Giuliani, G.; Turk, F.J. Multivariate Statistical Integration of Satellite Infrared and Microwave Radiometric Measurements for Rainfall Retrieval at the Geostationary Scale. IEEE Trans. Geosci. Remote Sens. 2004, 42, 1018–1032. [Google Scholar] [CrossRef]
  9. Hossain, F.; Anagnostou, E.N. Assessment of Current Passive-microwave- and Infrared-based Satellite Rainfall Remote Sensing for Flood Prediction. J. Geophys. Res. 2004, 109, JD003986. [Google Scholar] [CrossRef]
  10. Kim, M.-S.; Kwon, B. Rainfall Detection and Rainfall Rate Estimation Using Microwave Attenuation. Atmosphere 2018, 9, 287. [Google Scholar] [CrossRef]
  11. Ma, Z.; Zhou, Y.; Hu, B.; Liang, Z.; Shi, Z. Downscaling Annual Precipitation with TMPA and Land Surface Characteristics in China. Int. J. Climatol. 2017, 37, 5107–5119. [Google Scholar] [CrossRef]
  12. Ji, D.; Shi, J.; Letu, H.; Li, W.; Zhang, H.; Shang, H. A Total Precipitable Water Product and Its Trend Analysis in Recent Years Based on Passive Microwave Radiometers. IEEE J. Sel. Top. Appl. Earth Obs. Remote Sens. 2021, 14, 7324–7335. [Google Scholar] [CrossRef]
  13. Min, M.; Bai, C.; Guo, J.; Sun, F.; Liu, C.; Wang, F.; Xu, H.; Tang, S.; Li, B.; Di, D.; et al. Estimating Summertime Precipitation from Himawari-8 and Global Forecast System Based on Machine Learning. IEEE Trans. Geosci. Remote Sens. 2019, 57, 2557–2570. [Google Scholar] [CrossRef]
  14. Yang, X.; Fei, J.; Huang, X.; Cheng, X.; Carvalho, L.M.V.; He, H. Characteristics of Mesoscale Convective Systems over China and Its Vicinity Using Geostationary Satellite FY2. J. Clim. 2015, 28, 4890–4907. [Google Scholar] [CrossRef]
  15. Allan, R.P.; Soden, B.J. Atmospheric Warming and the Amplification of Precipitation Extremes. Science 2008, 321, 1481–1484. [Google Scholar] [CrossRef]
  16. Roca, R.; Fiolleau, T. Extreme Precipitation in the Tropics Is Closely Associated with Long-Lived Convective Systems. Commun. Earth Environ. 2020, 1, 18. [Google Scholar] [CrossRef]
  17. Maddox, R.A. Mesoscale Convective Complexes. In Bulletin of the American Meteorological Society; American Meteorological Society: Boston, MA, USA, 2021; Volume 61. [Google Scholar]
  18. Williams, M.; Houze, R.A. Satellite-Observed Characteristics of Winter Monsoon Cloud Clusters. Mon. Weather Rev. 1987, 115, 505–519. [Google Scholar] [CrossRef]
  19. Falkovich, G.; Fouxon, A.; Stepanov, M.G. Acceleration of Rain Initiation by Cloud Turbulence. Nature 2002, 419, 151–154. [Google Scholar] [CrossRef] [PubMed]
  20. Lazri, M.; Ameur, S.; Brucker, J.M.; Testud, J.; Hamadache, B.; Hameg, S.; Ouallouche, F.; Mohia, Y. Identification of Raining Clouds Using a Method Based on Optical and Microphysical Cloud Properties from Meteosat Second Generation Daytime and Nighttime Data. Appl. Water Sci. 2013, 3, 1–11. [Google Scholar] [CrossRef]
  21. Nauss, T.; Kokhanovsky, A.A. Discriminating Raining from Non-Raining Clouds at Mid-Latitudes Using Multispectral Satellite Data. Atmos. Chem. Phys. 2006, 6, 5031–5036. [Google Scholar] [CrossRef]
  22. Martins, J.V.; Marshak, A.; Remer, L.A.; Rosenfeld, D.; Kaufman, Y.J.; Fernandez-Borda, R.; Koren, I.; Correia, A.L.; Zubko, V.; Artaxo, P. Remote Sensing the Vertical Profile of Cloud Droplet Effective Radius, Thermodynamic Phase, and Temperature. Atmos. Chem. Phys. 2011, 11, 9485–9501. [Google Scholar] [CrossRef]
  23. Tana, G. Retrieval of Cloud Microphysical Properties from Himawari-8/AHI Infrared Channels and Its Application in Surface Shortwave Downward Radiation Estimation in the Sun Glint Region. Remote Sens. Environ. 2023, 290, 113548. [Google Scholar] [CrossRef]
  24. Letu, H.; Ma, R.; Nakajima, T.Y.; Shi, C.; Hashimoto, M.; Nagao, T.M.; Baran, A.J.; Nakajima, T.; Xu, J.; Wang, T.; et al. Surface Solar Radiation Compositions Observed from Himawari-8/9 and Fengyun-4 Series. Bull. Am. Meteorol. Soc. 2023, 104, E1772–E1789. [Google Scholar] [CrossRef]
  25. Ri, X.; Tana, G.; Shi, C.; Nakajima, T.Y.; Shi, J.; Zhao, J.; Xu, J.; Letu, H. Cloud, Atmospheric Radiation and Renewal Energy Application (CARE) Version 1.0 Cloud Top Property Product from Himawari-8/AHI: Algorithm Development and Preliminary Validation. IEEE Trans. Geosci. Remote Sens. 2022, 60, 1–11. [Google Scholar] [CrossRef]
  26. Di, D.; Ai, Y.; Li, J.; Shi, W.; Lu, N. Geostationary Satellite-based 6.7 Μm Band Best Water Vapor Information Layer Analysis over the Tibetan Plateau. JGR Atmos. 2016, 121, 4600–4613. [Google Scholar] [CrossRef]
  27. Wang, Y.; Liu, Z.; Yang, S.; Min, J.; Chen, L.; Chen, Y.; Zhang, T. Added Value of Assimilating Himawari-8 AHI Water Vapor Radiances on Analyses and Forecasts for “7.19” Severe Storm Over North China. J. Geophys. Res. Atmos. 2018, 123, 3374–3394. [Google Scholar] [CrossRef]
  28. Wu, Y.; Zhang, F.; Wu, K.; Min, M.; Li, W.; Liu, R. Best Water Vapor Information Layer of Himawari-8-Based Water Vapor Bands over East Asia. Sensors 2020, 20, 2394. [Google Scholar] [CrossRef] [PubMed]
  29. Letu, H.; Nakajima, T.Y.; Wang, T.; Shang, H.; Ma, R.; Yang, K.; Baran, A.J.; Riedi, J.; Ishimoto, H.; Yoshida, M.; et al. A New Benchmark for Surface Radiation Products over the East Asia–Pacific Region Retrieved from the Himawari-8/AHI Next-Generation Geostationary Satellite. Bull. Am. Meteorol. Soc. 2022, 103, E873–E888. [Google Scholar] [CrossRef]
  30. Da, C. Preliminary Assessment of the Advanced Himawari Imager (AHI) Measurement Onboard Himawari-8 Geostationary Satellite. Remote Sens. Lett. 2015, 6, 637–646. [Google Scholar] [CrossRef]
  31. Zhuge, X.; Zou, X. Summertime Convective Initiation Nowcasting over Southeastern China Based on Advanced Himawari Imager Observations. J. Meteorol. Soc. Jpn. 2018, 96, 337–353. [Google Scholar] [CrossRef]
  32. Andreae, M.O.; Rosenfeld, D. Aerosol–Cloud–Precipitation Interactions. Part 1. The Nature and Sources of Cloud-Active Aerosols. Earth Sci. Rev. 2008, 89, 13–41. [Google Scholar] [CrossRef]
  33. Pruppacher, H.R.; Klett, J.D.; Wang, P.K. Microphysics of Clouds and Precipitation. Aerosol Sci. Technol. 1998, 28, 381–382. [Google Scholar] [CrossRef]
  34. Rosenfeld, D.; Andreae, M.O.; Asmi, A.; Chin, M.; De Leeuw, G.; Donovan, D.P.; Kahn, R.; Kinne, S.; Kivekäs, N.; Kulmala, M.; et al. Global Observations of Aerosol-Cloud-Precipitation-Climate Interactions: Aerosol-Cloud-Climate Interactions. Rev. Geophys. 2014, 52, 750–808. [Google Scholar] [CrossRef]
  35. Chen, F.; Fu, Y.; Yang, Y. Regional Variability of Precipitation in Tropical Cyclones Over the Western North Pacific Revealed by the GPM Dual-Frequency Precipitation Radar and Microwave Imager. J. Geophys. Res. Atmos. 2019, 124, 11281–11296. [Google Scholar] [CrossRef]
  36. Huang, H.; Chen, F. Precipitation Microphysics of Tropical Cyclones Over the Western North Pacific Based on GPM DPR Observations: A Preliminary Analysis. J. Geophys. Res. Atmos. 2019, 124, 3124–3142. [Google Scholar] [CrossRef]
  37. Pradhan, R.K.; Markonis, Y.; Vargas Godoy, M.R.; Villalba-Pradas, A.; Andreadis, K.M.; Nikolopoulos, E.I.; Papalexiou, S.M.; Rahim, A.; Tapiador, F.J.; Hanel, M. Review of GPM IMERG Performance: A Global Perspective. Remote Sens. Environ. 2022, 268, 112754. [Google Scholar] [CrossRef]
  38. Hou, A.Y.; Kakar, R.K.; Neeck, S.; Azarbarzin, A.A.; Kummerow, C.D.; Kojima, M.; Oki, R.; Nakamura, K.; Iguchi, T. The Global Precipitation Measurement Mission. Bull. Am. Meteor. Soc. 2014, 95, 701–722. [Google Scholar] [CrossRef]
  39. Guo, H.; Chen, S.; Bao, A.; Behrangi, A.; Hong, Y.; Ndayisaba, F.; Hu, J.; Stepanian, P.M. Early Assessment of Integrated Multi-Satellite Retrievals for Global Precipitation Measurement over China. Atmos. Res. 2016, 176–177, 121–133. [Google Scholar] [CrossRef]
  40. Li, N.; Tang, G.; Zhao, P.; Hong, Y.; Gou, Y.; Yang, K. Statistical Assessment and Hydrological Utility of the Latest Multi-Satellite Precipitation Analysis IMERG in Ganjiang River Basin. Atmos. Res. 2017, 183, 212–223. [Google Scholar] [CrossRef]
  41. Tang, G.; Ma, Y.; Long, D.; Zhong, L.; Hong, Y. Evaluation of GPM Day-1 IMERG and TMPA Version-7 Legacy Products over Mainland China at Multiple Spatiotemporal Scales. J. Hydrol. 2016, 533, 152–167. [Google Scholar] [CrossRef]
  42. Stephens, G.L.; Vane, D.G.; Tanelli, S.; Im, E.; Durden, S.; Rokey, M.; Reinke, D.; Partain, P.; Mace, G.G.; Austin, R.; et al. CloudSat Mission: Performance and Early Science after the First Year of Operation. J. Geophys. Res. 2008, 113, D00A18. [Google Scholar] [CrossRef]
  43. Eastwood, I.M.; Chialin, W.; Durden, S.L. Cloud Profiling Radar for the Cloudsat Mission. In Proceedings of the IEEE International Radar Conference, Arlington, VA, USA, 9–12 May 2005; IEEE: Arlington, VA, USA, 2005; pp. 483–486. [Google Scholar]
  44. Hudak, D.; Rodriguez, P.; Donaldson, N. Validation of the CloudSat Precipitation Occurrence Algorithm Using the Canadian C Band Radar Network. J. Geophys. Res. 2008, 113, D00A07. [Google Scholar] [CrossRef]
  45. L’Ecuyer, T.S.; Stephens, G.L. An Estimation-Based Precipitation Retrieval Algorithm for Attenuating Radars. J. Appl. Meteor. 2002, 41, 272–285. [Google Scholar] [CrossRef]
  46. Sassen, K.; Wang, Z. Classifying Clouds around the Globe with the CloudSat Radar: 1-Year of Results. Geophys. Res. Lett. 2008, 35, L04805. [Google Scholar] [CrossRef]
  47. Zou, H.; Zhang, S.; Liang, X.; Yi, X. Improved Algorithms for Removing Isolated Non-Meteorological Echoes and Ground Clutters in CINRAD. J. Meteorol. Res. 2018, 32, 584–597. [Google Scholar] [CrossRef]
  48. Chen, Y.; Zou, Q.; Han, J.; Cluckie, I. Cinrad Data Quality Control and Precipitation Estimation. Proc. Inst. Civ. Eng. Water Manag. 2009, 162, 95–105. [Google Scholar] [CrossRef]
  49. Mason, B.J.; Ludlam, F.H. The Microphysics of Clouds. Rep. Prog. Phys. 1951, 14, 147–195. [Google Scholar] [CrossRef]
  50. Peters, O.; Neelin, J.D. Critical Phenomena in Atmospheric Precipitation. Nat. Phys. 2006, 2, 393–396. [Google Scholar] [CrossRef]
  51. Stephens, G.L.; Kummerow, C.D. The Remote Sensing of Clouds and Precipitation from Space: A Review. J. Atmos. Sci. 2007, 64, 3742–3765. [Google Scholar] [CrossRef]
  52. Trenberth, K. Changes in Precipitation with Climate Change. Clim. Res. 2011, 47, 123–138. [Google Scholar] [CrossRef]
  53. Platnick, S.; Twomey, S. Remote Sensing the Susceptibility of Cloud Albedo to Changes in Drop Concentration. Atmos. Res. 1994, 34, 85–98. [Google Scholar] [CrossRef]
  54. Rosenfeld, D.; Gutman, G. Retrieving Microphysical Properties near the Tops of Potential Rain Clouds by Multispectral Analysis of AVHRR Data. Atmos. Res. 1994, 34, 259–283. [Google Scholar] [CrossRef]
  55. Kobayashi, T.; Masuda, K. Changes in Cloud Optical Thickness and Cloud Drop Size Associated with Precipitation Measured with TRMM Satellite. J. Meteorol. Soc. Jpn. 2009, 87, 593–600. [Google Scholar] [CrossRef]
  56. Rosenfeld, D.; Lensky, I.M. Satellite–Based Insights into Precipitation Formation Processes in Continental and Maritime Convective Clouds. Bull. Am. Meteor. Soc. 1998, 79, 2457–2476. [Google Scholar] [CrossRef]
  57. Rosenfeld, D.; Ulbrich, C.W. Cloud Microphysical Properties, Processes, and Rainfall Estimation Opportunities. Meteorol. Monogr. 2003, 30, 237. [Google Scholar] [CrossRef]
  58. Adler, R.F.; Negri, A.J. A Satellite Infrared Technique to Estimate Tropical Convective and Stratiform Rainfall. J. Appl. Meteorol. Climatol. 1988, 27, 30–51. [Google Scholar] [CrossRef]
  59. Goyens, C.; Lauwaet, D.; Schröder, M.; Demuzere, M.; Van Lipzig, N.P.M. Tracking Mesoscale Convective Systems in the Sahel: Relation between Cloud Parameters and Precipitation: Tracking mesoscale convective systems in the Sahel. Int. J. Climatol. 2012, 32, 1921–1934. [Google Scholar] [CrossRef]
  60. Westra, S.; Fowler, H.J.; Evans, J.P.; Alexander, L.V.; Berg, P.; Johnson, F.; Kendon, E.J.; Lenderink, G.; Roberts, N.M. Future Changes to the Intensity and Frequency of Short-Duration Extreme Rainfall: Future intensity of sub-daily rainfall. Rev. Geophys. 2014, 52, 522–555. [Google Scholar] [CrossRef]
  61. Levizzani, V.; Schmetz, J.; Lutz, H.J.; Kerkmann, J.; Alberoni, P.P.; Cervino, M. Precipitation Estimations from Geostationary Orbit and Prospects for METEOSAT Second Generation. Meteorol. Appl. 2001, 8, 23–41. [Google Scholar] [CrossRef]
  62. Levizzani, V. Satellite Rainfall Estimates: New Perspectives for Meteorology and Climate from the EURAINSAT Project. Ann. Geophys. 2009, 46, 3409. [Google Scholar] [CrossRef]
  63. Bessho, K.; Date, K.; Hayashi, M.; Ikeda, A.; Imai, T.; Inoue, H.; Kumagai, Y.; Miyakawa, T.; Murata, H.; Ohno, T.; et al. An Introduction to Himawari-8/9— Japan’s New-Generation Geostationary Meteorological Satellites. J. Meteorol. Soc. Jpn. 2016, 94, 151–183. [Google Scholar] [CrossRef]
  64. Berg, P.; Moseley, C.; Haerter, J.O. Strong Increase in Convective Precipitation in Response to Higher Temperatures. Nat. Geosci. 2013, 6, 181–185. [Google Scholar] [CrossRef]
  65. Liu, Y.; Ackerman, S.A.; Maddux, B.C.; Key, J.R.; Frey, R.A. Errors in Cloud Detection over the Arctic Using a Satellite Imager and Implications for Observing Feedback Mechanisms. J. Clim. 2010, 23, 1894–1907. [Google Scholar] [CrossRef]
  66. Mace, G.G.; Jakob, C.; Moran, K.P. Validation of Hydrometeor Occurrence Predicted by the ECMWF Model Using Millimeter Wave Radar Data. Geophys. Res. Lett. 1998, 25, 1645–1648. [Google Scholar] [CrossRef]
  67. Shang, H.; Chen, L.; Letu, H.; Zhao, M.; Li, S.; Bao, S. Development of a Daytime Cloud and Haze Detection Algorithm for Himawari-8 Satellite Measurements over Central and Eastern China: Detection of Haze and Clouds From AHI. J. Geophys. Res. Atmos. 2017, 122, 3528–3543. [Google Scholar] [CrossRef]
  68. Yang, Y.; Sun, W.; Chi, Y.; Yan, X.; Fan, H.; Yang, X.; Ma, Z.; Wang, Q.; Zhao, C. Machine Learning-Based Retrieval of Day and Night Cloud Macrophysical Parameters over East Asia Using Himawari-8 Data. Remote Sens. Environ. 2022, 273, 112971. [Google Scholar] [CrossRef]
  69. Houze, R.A. Nimbostratus and the Separation of Convective and Stratiform Precipitation. In International Geophysics; Elsevier: Amsterdam, The Netherlands, 2014; Volume 104, pp. 141–163. ISBN 978-0-12-374266-7. [Google Scholar]
  70. Wolde, M.; Vali, G. Cloud Structure and Crystal Growth in Nimbostratus. Atmos. Res. 2002, 61, 49–74. [Google Scholar] [CrossRef]
  71. Zhi-Qiang, C.; Qing-Ni, H.; Su-Rong, Z. Using Satellite Data to Analyze the Initiation and Evolution of Deep Convective Clouds. Atmos. Ocean. Sci. Lett. 2013, 6, 445–450. [Google Scholar] [CrossRef]
  72. Bluestein, H.B. Severe Convective Storms and Tornadoes: Observations and Dynamics; Springer: Berlin/Heidelberg, Germany, 2013; ISBN 978-3-642-05380-1. [Google Scholar]
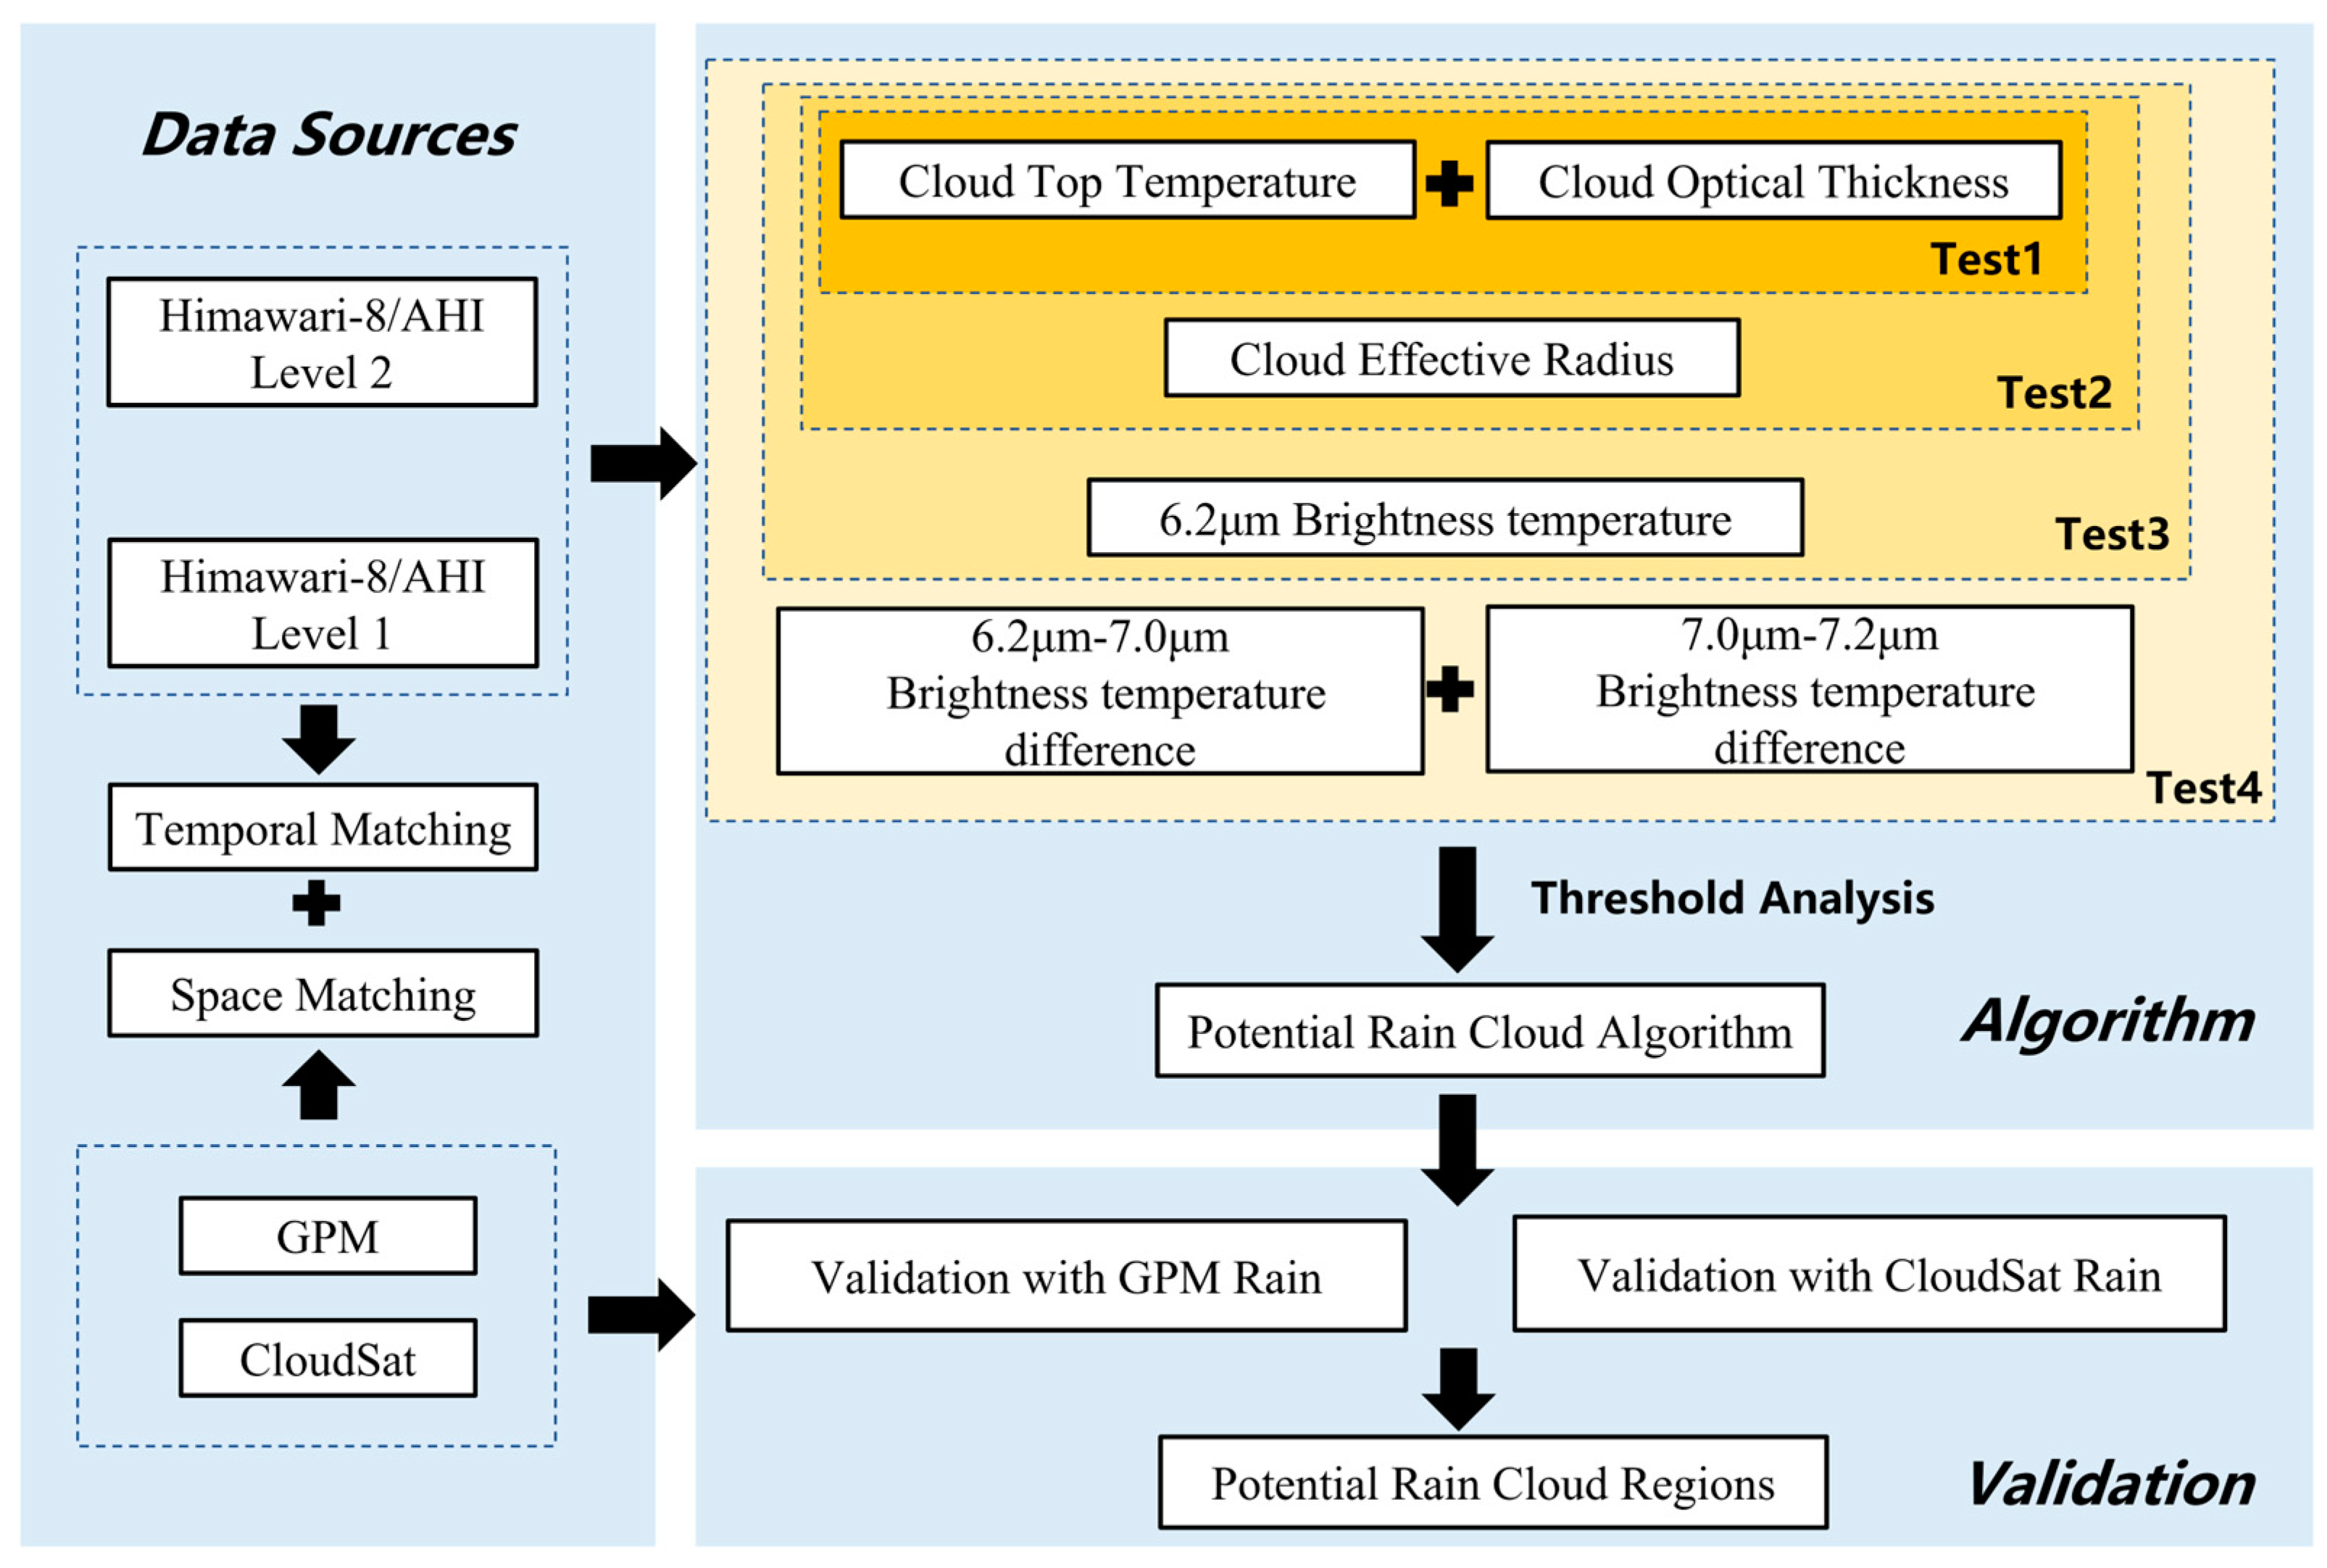
Figure 1. The H–8 rainfall areas algorithm flow chart using H–8/AHI cloud products.
Remotesensing 16 00747 g001
Figure 2. (a) True-color cloud map, where the solid orange lines represent the borders of countries, (b) 6.21 μm channel brightness temperature, and (c) 6.21 μm brightness temperature of less than 230 K according to a test at 05:00 UTC on 3 July 2018.
Remotesensing 16 00747 g002
Figure 3. Comparison of frequency distributions of rainfall areas and clear skies. (a) The 6.21 μm channel brightness temperature, (b) cloud-effective particle radius (CER), (c) cloud top temperature (CTT), and (d) cloud optical thickness (COT). The solid black line represents the threshold for each parameter to identify the rainfall area.
Remotesensing 16 00747 g003
Figure 4. (a) One-dimensional histogram of B T D 6.93,6.21 μ m ; (b) scatterplot of rainfall area/clear pixels in B T D 6.93,6.21 μ m B T D 7.34 , 6.93 μ m coordinate system; and (c) one-dimensional histogram of B T D 7.34 , 6.93 μ m .
Remotesensing 16 00747 g004
Figure 5. Study area. The blue box A represents the region of Australia, B represents the equatorial region, C represents the Pacific Ocean, D represents the Tibetan Plateau, and E represents the North China Plain.
Remotesensing 16 00747 g005
Figure 6. Spatial distribution of rainfall area identification results. (a) True-color image at UTC 05:00 on 3 July 2018. (b) Rainfall area identification results of this algorithm. (c) Spatial distribution of GPM rainfall comparison.
Remotesensing 16 00747 g006
Figure 7. Rainfall characteristics associated with different cloud types. (a) The H-8 full disk; (b) Australia land; (c) the equator regions; (d) the Pacific Ocean; (e) the Tibet plateau; (f) the north China plain.
Remotesensing 16 00747 g007
Figure 8. Spatial distribution results of the rainfall area identification algorithm. (a) COT, (b) CTT, (c) CER, (d) B T D 6.93 , 6.21 μ m , (e) B T D 7.34 , 6.93 μ m , and (f) results of rainfall areas based on H−8/AHI rainfall area identification algorithm. The spatial distribution of identification results was measured at 05:00 UTC on 3 July 2018.
Remotesensing 16 00747 g008
Figure 9. (a) True-color images at UTC 00:30 on 29 July 2023, UTC 01:00 on July 29, UTC 01:30 on 29 July UTC 02:00 on July 29, UTC 02:30 on 29 July, and UTC 03:00 on 29 July, respectively. (b) The rainfall areas of ground-based radar at the corresponding times. (c) The rainfall areas at the corresponding times. (d) The rainfall regions of GPM at the corresponding times, respectively.
Remotesensing 16 00747 g009
Figure 10. H-8 full-disk analysis of rainfall area characteristics in different latitudes in 2017. Images (af) indicate the temporal changes of rainfall areas at latitudes 50°N–60°N, 40°N–50°N, 30°N–40°N, 20°N–30°N, 10°N–20°N, and 0°–10°N in 2017, respectively. Images (gl) show the temporal changes of rainfall areas at latitudes 0°–10°S, 10°S–20°S, 20°S–30°S, 30°S–40°S, 40°S–50°S, and 50°S–60°S in 2017, respectively. (m) Variation of rainfall frequency at different latitudes in 2017, where the color of each rectangle represents the latitude region marked on its corresponding horizontal axis. (n) True-color image of the H-8 full disk.
Remotesensing 16 00747 g010
Table 1. Cloud properties which were input into the rainfall area algorithm and their threshold.
PropertiesValue ChangeReferences
COT10–70[21]
CTT210–265 K[59]
CER10–50 μm[54,56]
B T 6.21 μ m <235 K[63]
B T D 6.93,6.21 μ m <7.2 K
B T D 7.34 , 6.93 μ m <7 K
Table 2. Four tests to validate the effectiveness of cloud properties in identifying rainfall areas.
TestProperties
Test1COT, CTT
COT, CTT, CER
COT, CTT, CER, B T 6.2
COT, CTT, CER, B T 6.21 B T D 6.93 6.21   B T D 7.34 6.93
Test2
Test3
Test4
OceanNo. of observationsHR (%)No. of observationsFAR (%)Accuracy (%)
Test117,01168.8353032.2184.41
Test217,01170.8649572.0785.43
Test317,01184.95256011.8086.67
Test417,01191.68141611.5189.65
LandNo. of observationsHR (%)No. of observationsFAR (%)Accuracy (%)
Test124,83226.3218,29715.2563.16
Test224,83253.8611,4579.5576.93
Test324,83261.35959811.0173.73
Test424,83263.9489547.4672.31
H8 full-diskNo. of observationsHR (%)No. of observationsFAR (%)Accuracy (%)
Test1471,31045.48256,9804.4572.70
Test2471,31061.07183,4673.1880.34
Test3471,31072.20131,02112.0479.54
Test4471,31076.46110,93116.5579.23
Table 3. The HR and FAR of the rainfall areas algorithm for January and April in 2018, July and November in 2019 with respect to GPM IMERG products.
Rainfall AreaNon-Rainfall
PeriodNo. ObservationHR (%)FAR (%)HR (%)FAR (%)Accuracy (%)
2019.0176,94679.070.4180.9517.1780.01
2019.0471,58176.443.1686.439.7681.44
2018.0771,14380.783.5284.5610.8382.67
2018.1171,26743.111.2791.278.1967.19
total290,93770.032.0585.6111.5977.87
Table 4. The HR and FAR of the rainfall areas algorithm for January and April in 2018 and July and November in 2019 with respect to CloudSat products.
Rainfall AreaNon-Rainfall
PeriodNo. of ObservationsHR (%)FAR (%)HR (%)FAR (%)Accuracy (%)
2019.0139,56177.9317.9885.593.8281.13
2019.0437,67079.8722.1073.463.5075.09
2018.0736,55284.4519.4383.344.2183.51
2018.1136,97283.6028.5167.332.1974.30
total150,75581.3921.3477.543.4379.83
Disclaimer/Publisher’s Note: The statements, opinions and data contained in all publications are solely those of the individual author(s) and contributor(s) and not of MDPI and/or the editor(s). MDPI and/or the editor(s) disclaim responsibility for any injury to people or property resulting from any ideas, methods, instructions or products referred to in the content.