Article

Technology Demonstration of Space Situational Awareness (SSA) Mission on Stratospheric Balloon Platform

Department of Earth and Space Science, York University, Toronto, ON M3J 1P3, Canada
*
Author to whom correspondence should be addressed.
Remote Sens. 2024, 16(5), 749; https://doi.org/10.3390/rs16050749
Submission received: 23 November 2023 / Revised: 31 January 2024 / Accepted: 19 February 2024 / Published: 21 February 2024
(This article belongs to the Section Satellite Missions for Earth and Planetary Exploration)

Abstract

:
As the number of resident space objects (RSOs) orbiting Earth increases, the risk of collision increases, and mitigating this risk requires the detection, identification, characterization, and tracking of as many RSOs as possible in view at any given time, an area of research referred to as Space Situational Awareness (SSA). In order to develop algorithms for RSO detection and characterization, starfield images containing RSOs are needed. Such images can be obtained from star trackers, which have traditionally been used for attitude determination. Despite their low resolution, star tracker images have the potential to be useful for SSA. Using star trackers in this dual-purpose manner offers the benefit of leveraging existing star tracker technology already in orbit, eliminating the need for new and costly equipment to be launched into space. In August 2022, we launched a CubeSat-class payload, Resident Space Object Near-space Astrometric Research (RSONAR), on a stratospheric balloon. The primary objective of the payload was to demonstrate a dual-purpose star tracker for imaging and analyzing RSOs from a space-like environment, aiding in the field of SSA. Building on the experience and lessons learned from the 2022 campaign, we developed a next-generation dual-purpose camera in a 4U-inspired CubeSat platform, named RSONAR II. This payload was successfully launched in August 2023. With the RSONAR II payload, we developed a real-time, multi-purpose imaging system with two main cameras of varying cost that can adjust imaging parameters in real-time to evaluate the effectiveness of each configuration for RSO imaging. We also performed onboard RSO detection and attitude determination to verify the performance of our algorithms. Additionally, we implemented a downlink capability to verify payload performance during flight. To add a wider variety of images for testing our algorithms, we altered the resolution of one of the cameras throughout the mission. In this paper, we demonstrate a dual-purpose star tracker system for future SSA missions and compare two different sensor options for RSO imaging.

1. Introduction

Space Situational Awareness (SSA) has been identified in the Canadian research community as a top priority for space activity, as it serves to detect, track, identify, and characterize resident space objects (RSOs). The convention on the registration of objects launched into outer space obligates launching nations to supply the United Nations with information regarding the orbit of each space object [1]. However, there are objects in space that have not been identified yet. The uncatalogued elements are primarily composed of space debris resulting from numerous recorded collisions. For instance, the collision between Iridium 33 and Kosmos 2251 in 2009 caused significant telecommunication disruptions and produced thousands of fragments that linger in Earth’s orbit [2]. According to NASA, there are over 25,000 objects larger than 10 cm in diameter orbiting today, and an estimated 500,000 objects under 10 cm [3]. To avoid disastrous collisions, it is imperative to enhance technologies and further develop capabilities to identify both foreground (satellites) and background objects (debris).
Ground-based observations of RSOs are constrained by weather conditions, atmospheric interference, limited access time, and visibility to RSOs. In contrast, space-based RSO observations, where imaging is conducted by satellites, enable multi-site simultaneous observations and improved imaging conditions. Hence, recognizing the need for space-based observation, the United States Space Force is already planning a satellite constellation, named “Space-Based Space Surveillance” (SBSS), to assist ground infrastructure [4].

1.1. Application of Wide Field-of-View (WFOV) Imagers for SSA

Considering the latest technologies available for space optical sensors, we have focused our efforts on the use of space-based WFOV cameras, including star trackers and similar low-resolution imagers, for SSA applications. These commercial-grade cameras, such as the AURICAM™ star tracker by Sodern (Limeil-Brévannes, France) [5] and the PCO Complementary Metal Oxide Semiconductor (sCMOS) camera [6], are far less costly than dedicated imaging systems with custom telescopes. They are also readily available onboard satellites to provide attitude information. Additionally, WFOV cameras are capable of continuously monitoring large parts of the sky. These cameras can monitor multiple objects without actively tracking them, which allows for quick detection capabilities used in rapid capture, detection, timely identification, and tracking. Early warning of close approaches can also be implemented using full-sky coverage to respond to potential collisions and plan collision avoidance maneuvers if necessary. While the images obtained with WFOV cameras tend to have reduced resolution that lacks features for identification, simple detection in photometric analysis—with light curve extraction—provides sufficient information for astrometric analysis and object classification. In [7], light curve extraction has been performed on images captured from WFOV cameras, and in [8], object classification has been proven with light curves collected from ground-based telescopes.

1.2. Research Objective

With the long-term objective to develop low-cost WFOV optical systems for RSO detection suitable for operating on RSOs as small as nanosatellites, we have been developing a dual-purpose camera system that can serve as both an attitude sensor and SSA payload. With the support from the Canadian Space Agency (CSA) through the FAST Project # 19FAYORA12, we developed a dual-purpose star tracker and demonstrated the concept on the STRATO-SCIENCE 2022 mission (payload depicted in Figure 1). Leveraging the experience gained from the balloon campaign, we are continuing to develop image-processing algorithms, such as [9], and Field Programmable Gate Array (FPGA)-based camera electronics. Additionally, we are conducting a mission concept study for future Canadian SSA Missions, in partnership with Defence Research and Development Canada (DRDC), Magellan, C-Core, and the University of Manitoba. As outlined in [10,11], the results from the 2022 flight were promising. A total of 95,046 images were obtained under varying light conditions and altitudes during the mission. The images are being annotated and used for the development of RSO algorithms using AI and traditional object detection methods. This novel dataset is available upon request for algorithm development and validation.
In this paper, we describe the second-generation mission, Resident Space Object Near-space Astrometric Research II (RSONAR II). This mission aimed to collect RSO images for varying resolutions to enhance our SSA dataset and demonstrate improved software on the 2023 flight with the dual objectives of attitude determination and real-time RSO detection from the stratospheric balloon platform at over 35 km in altitude. We also conducted a comparison study between two imaging systems and assessed the capability of each for stellar observation.

2. Mission Overview

The primary objective of the RSONAR II mission was to collect an improved SSA dataset compared to RSONAR. The stratospheric balloon platform, part of the STRATO-SCIENCE 2023 campaign, was utilized as a quicker and simpler approach compared to a space-based mission [12]. The project spanned 10 months from concept design to flight. This timeline facilitated the acquisition of a large RSO image dataset from ground observation, which was utilized for hardware testing and algorithm design, and to improve our SSA algorithms prior to a CubeSat launch to Low Earth Orbit (LEO). The camera acquired images in varying resolutions. The secondary objective of the mission was to demonstrate real-time RSO detection and attitude determination. A second camera system has been developed specifically for this functionality. The payload features two additional cameras that were developed for non-SSA purposes, which will be discussed in future publications. RSONAR II has multiple improvements over RSONAR. RSONAR only had one main image capturing system but RSONAR II contained two for SSA purposes. The first system in RSONAR II retained the same sensor and board used in RSONAR, but improvements to the image capturing algorithm were implemented to allow for more efficient image capturing. These improvements include altering detector resolution in-flight to collect images of different quality in addition to addressing an issue with image delays that caused RSO sequences captured from RSONAR cut-off mid-streak. Additionally, downlink communications were added to allow for health data and some images from the data collection camera to be viewed from the ground during the mission. Another major improvement to RSONAR II was adding a dual-purpose system for real-time onboard attitude determination and RSO detection extending our capabilities in the field of SSA.

3. Payload Design

The design of the payload was centered on the first generation of RSONAR [10]. There were two distinct imaging systems, referred to as subpayloads, that were connected to a singular Power Distribution Unit (PDU). Subpayload 1 was dedicated to gathering a dataset through continuous acquisition of RSO images at varying resolutions for the purpose of testing and improving existing SSA algorithms. Subpayload 2 consisted of real-time attitude determination and RSO detection systems.

3.1. Structure

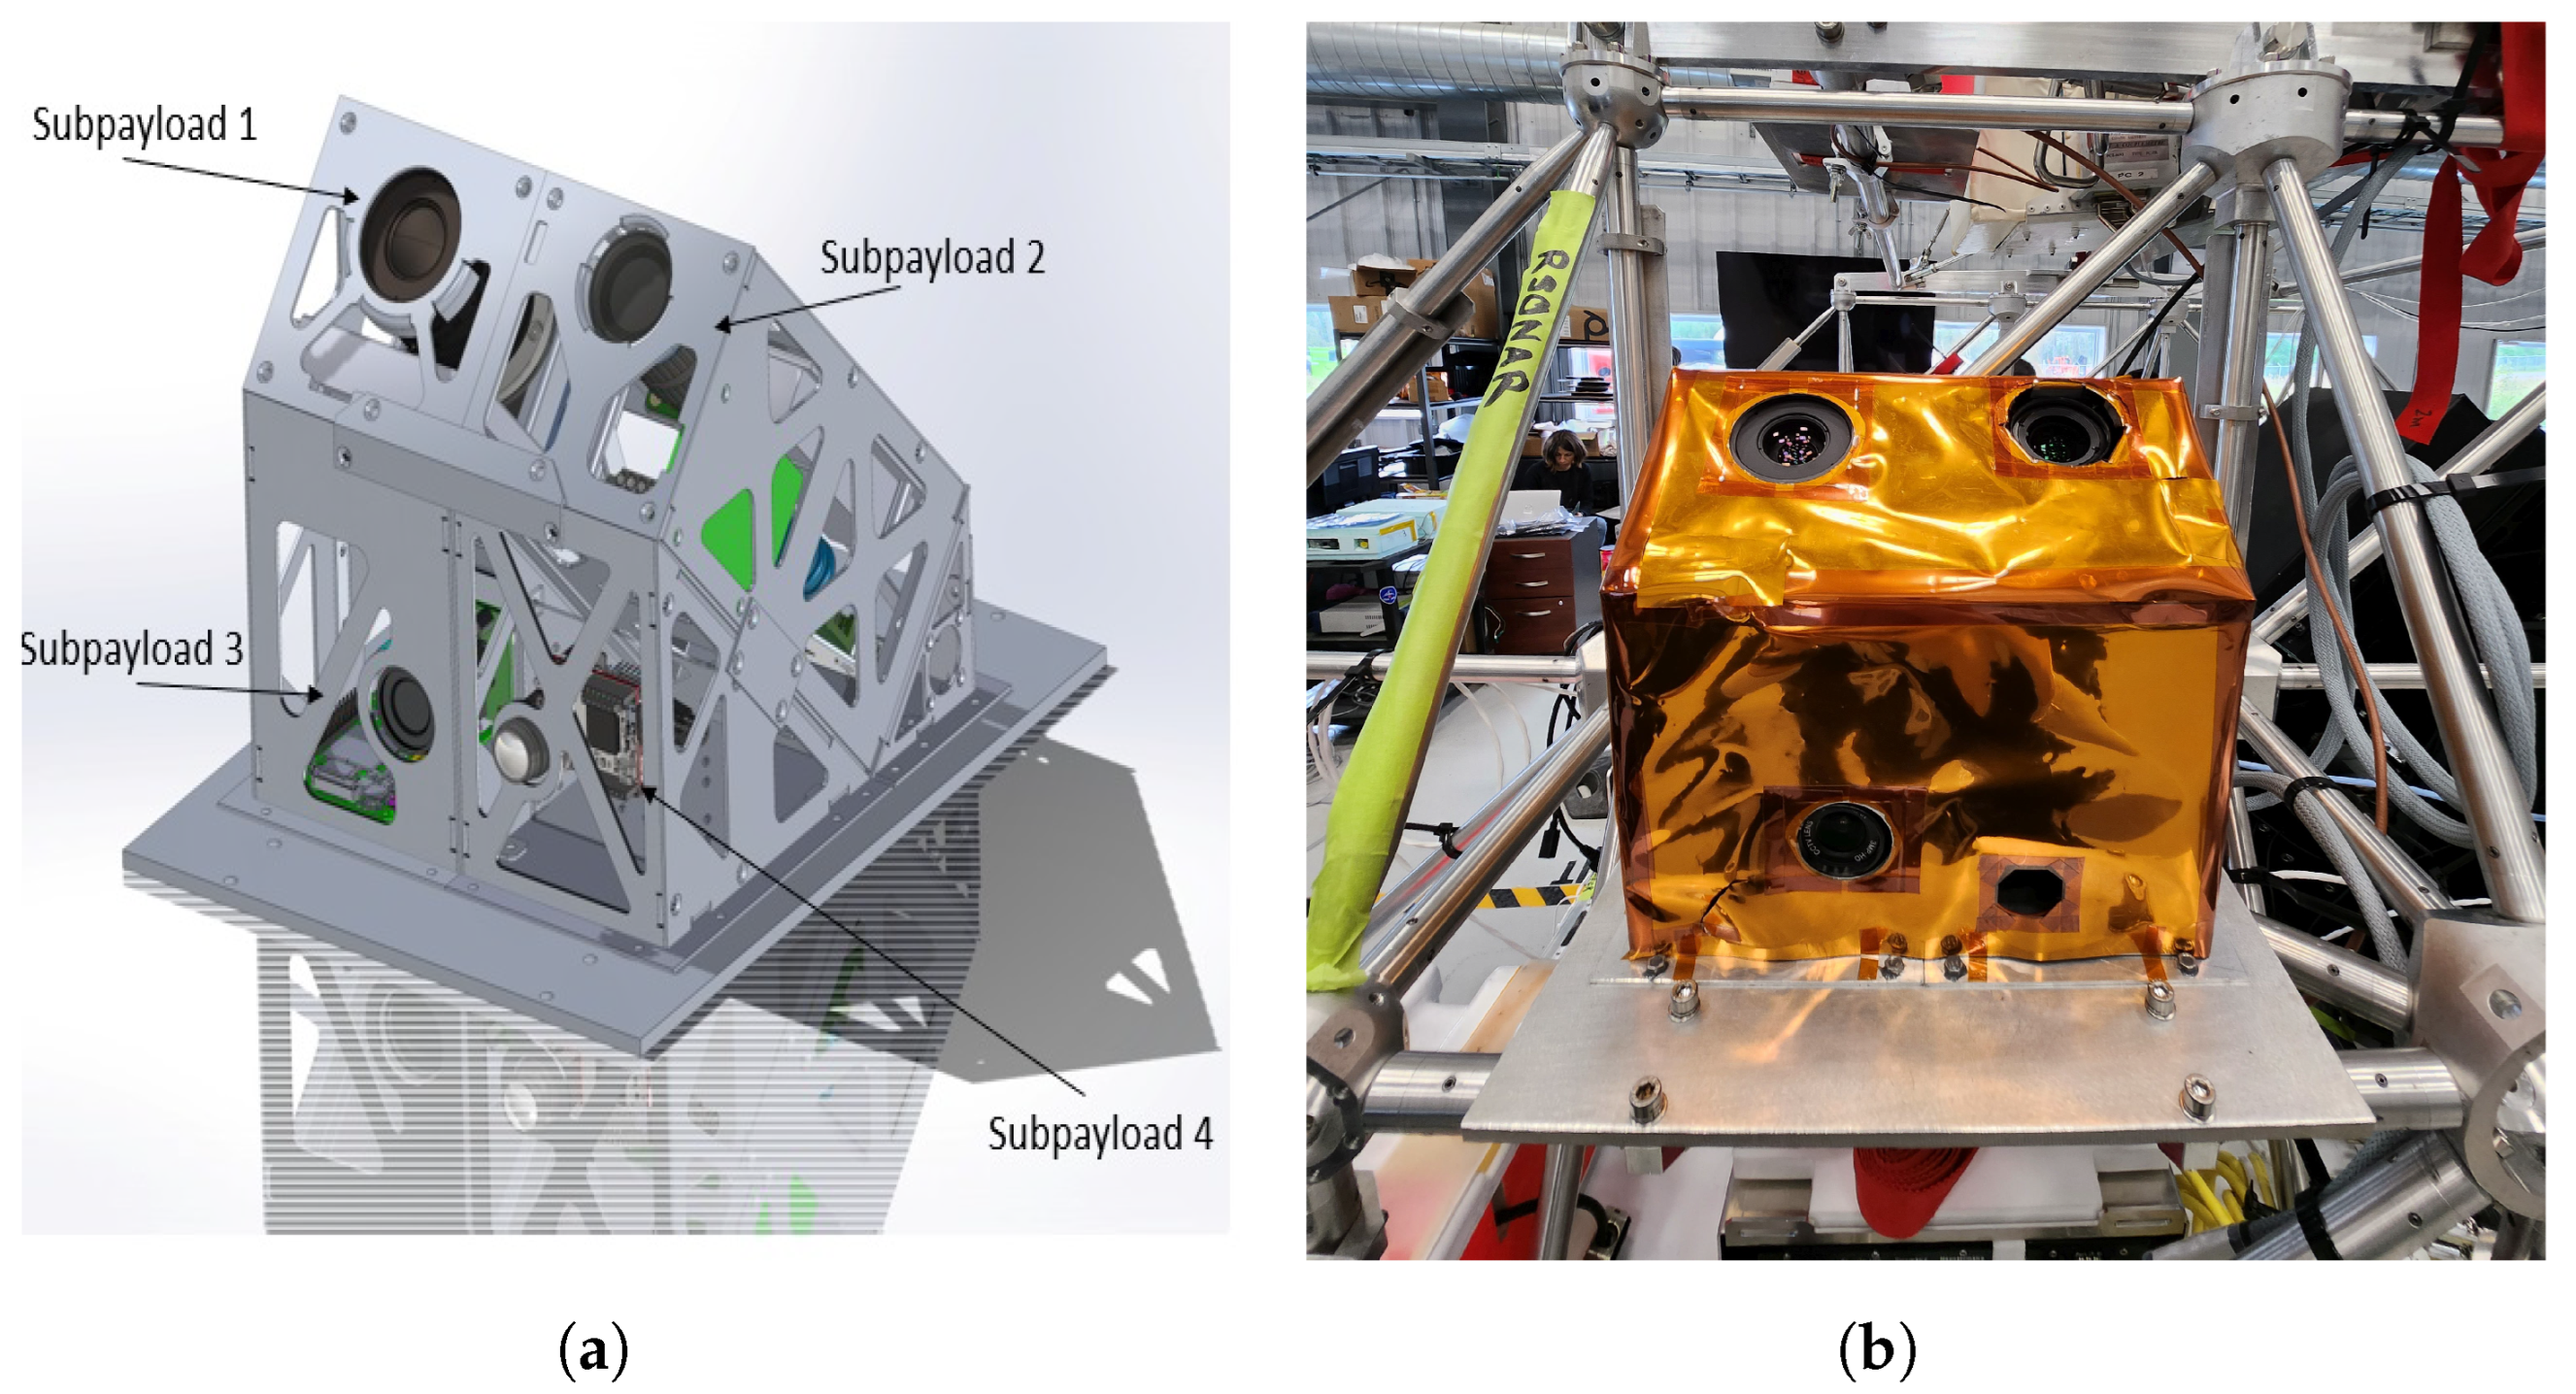
RSONAR II features a CubeSat form factor with a 4U-inspired structure. Triangular prisms were utilized at the base of each main structure as in the first iteration of the payload, which raised the subpayloads to a 45° viewing angle. This results in an improved RSO viewing geometry. The Computer-Aided Design (CAD) model of the payload is illustrated in Figure 2a, where subpayload 1 and subpayload 2 are located at the top-left and top-right, respectively. A 250 × 320 × 6 mm interface plate was utilized to mount the payload onto the CSA’s gondola. Figure 2b displays the integrated payload and interface plate on the gondola of the CSA prior to launch. Both the primary structure and interface plate were crafted from aluminum 6061-T6 (Ekos Precision Machining Inc, Concord, ON, Canada [13], with fasteners composed of AISI 30 (McMaster Carr, Princeton, NJ, USA) [14]. The total mass of the payload was approximately 5.3 kg, as indicated in the mass budget (Table 1).

3.2. Electrical

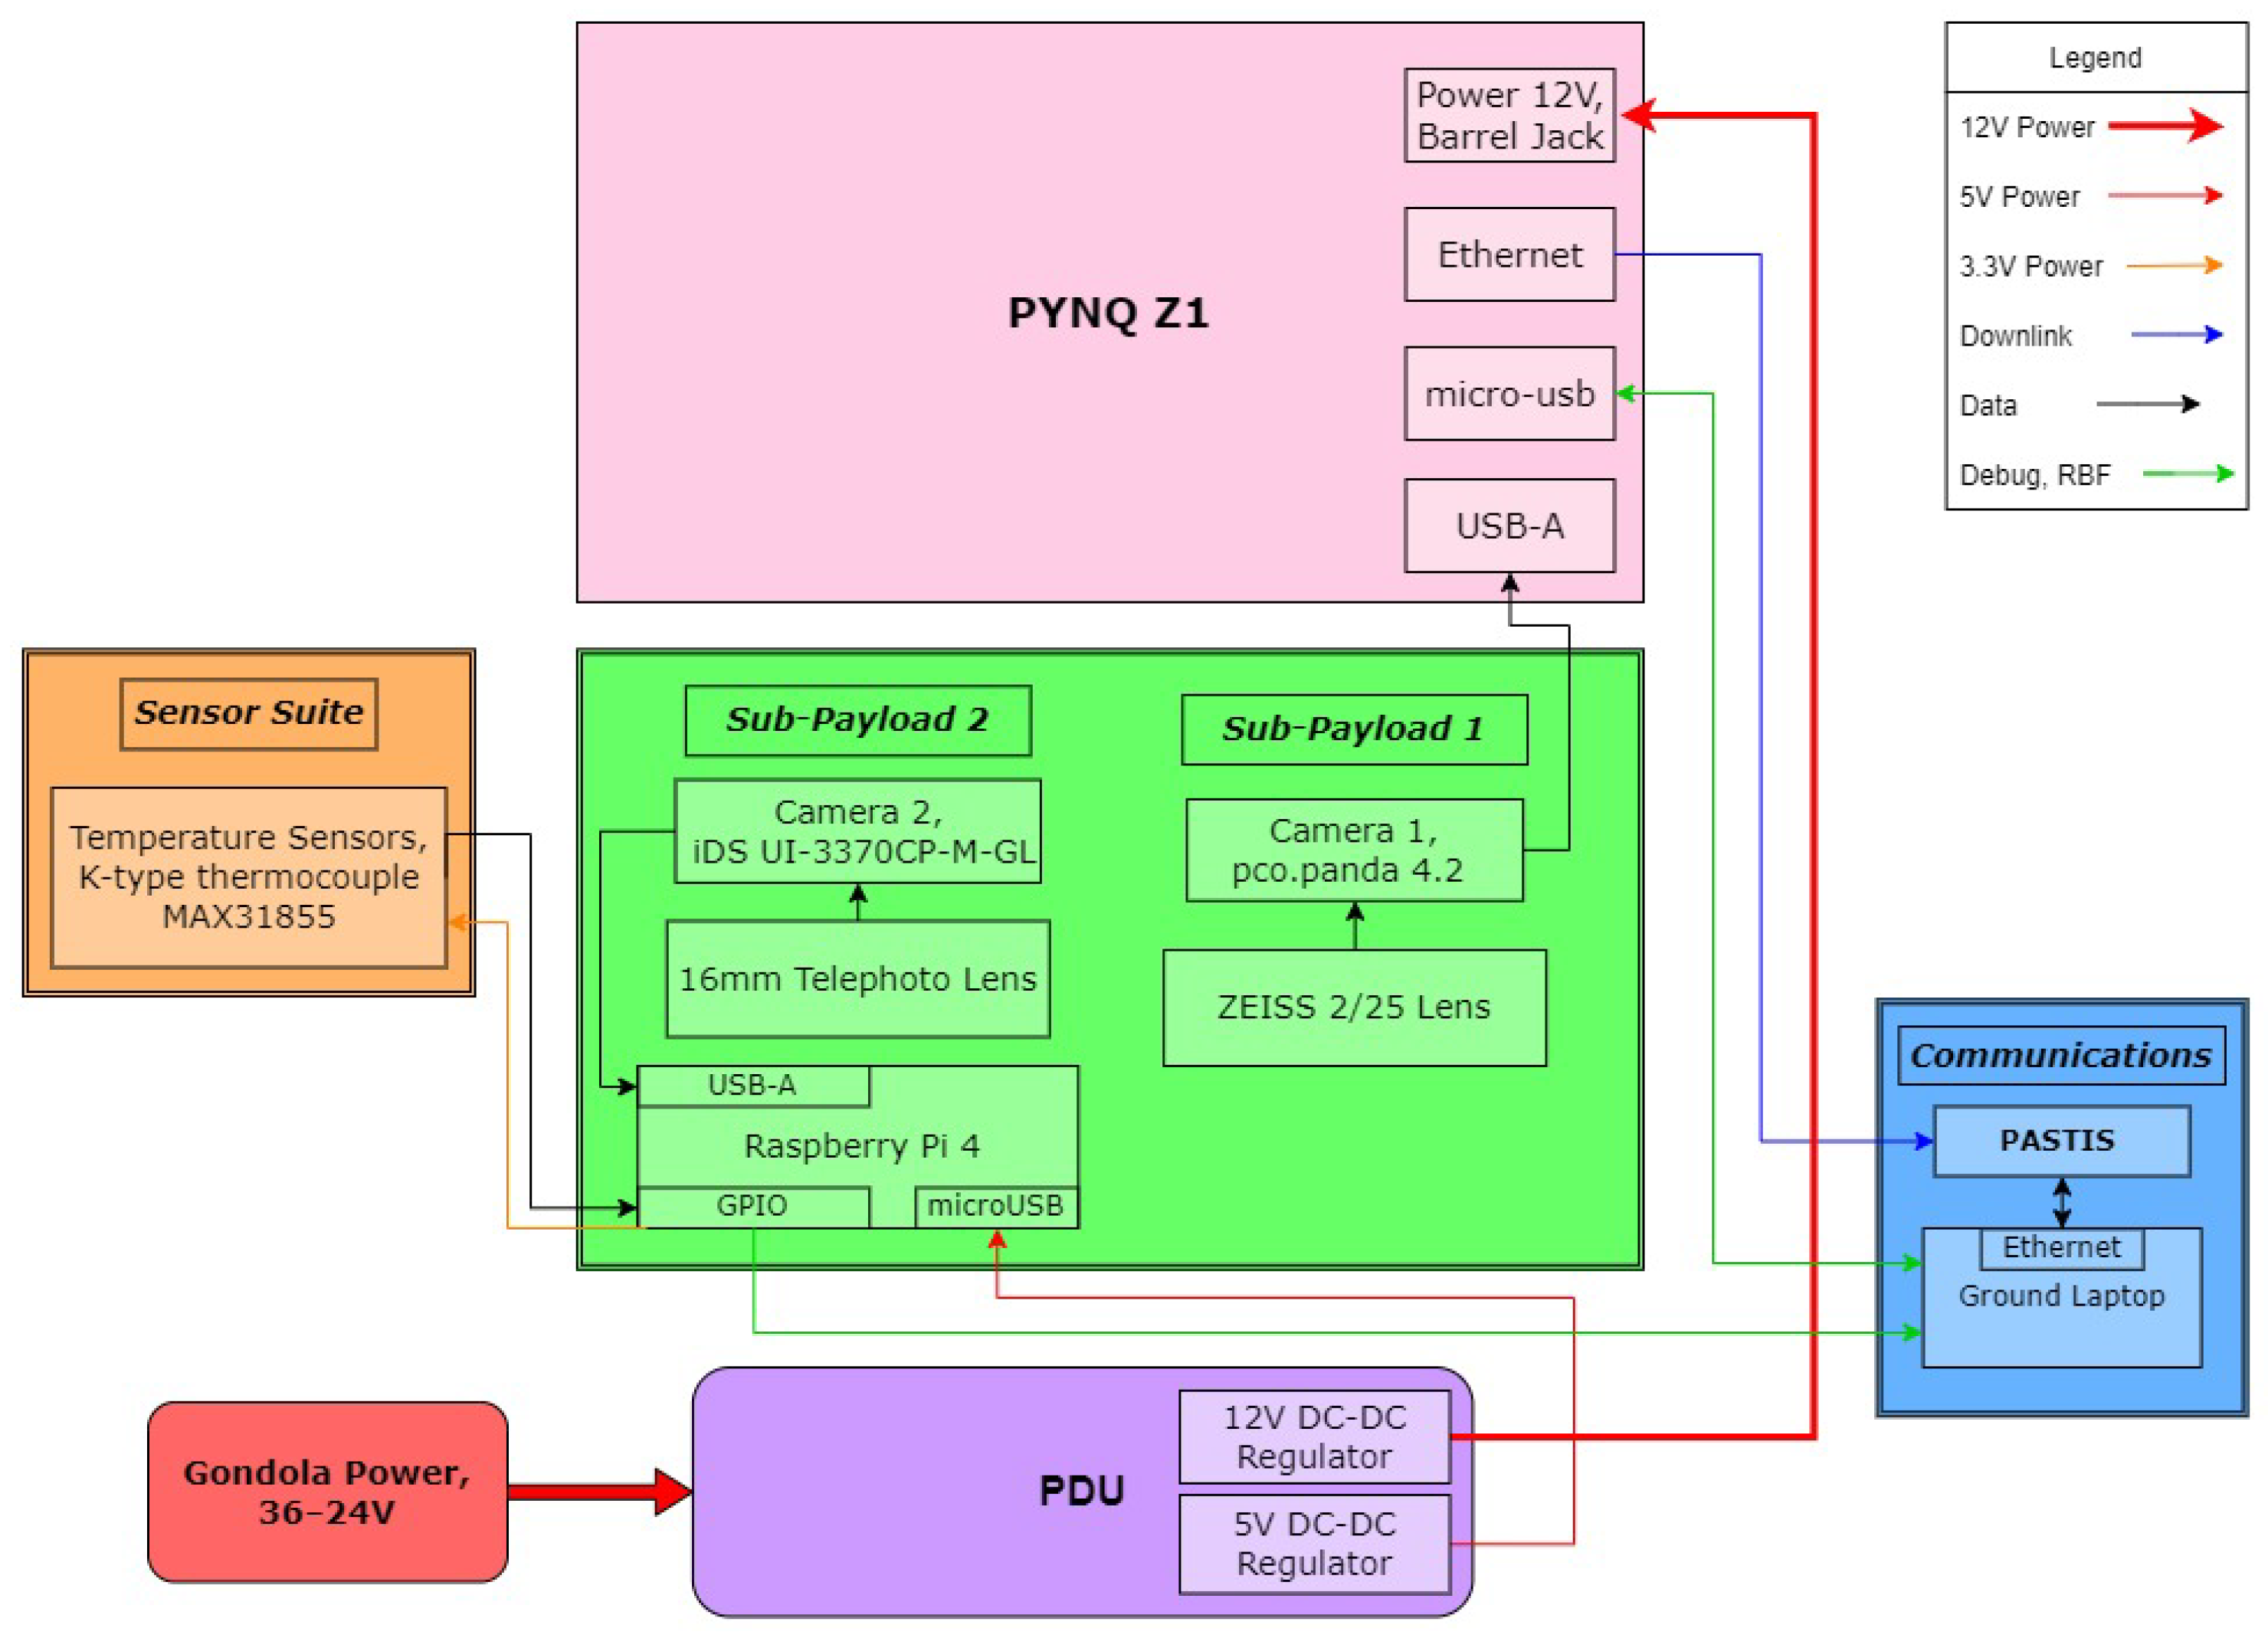
Figure 3 portrays the harness diagram for the RSONAR II payload. The power budget measurements for the payload and subpayloads are outlined in Table 2. Each subpayload has its own onboard computer (OBC), so OBC power consumption is calculated for each subpayload. RSONAR II uses a single PDU for all subpayloads but the PDU is physically located within subpayload 2, so the PDU power consumption is calculated with subpayload 2 in Table 2. The PDU of RSONAR II comprised an input power harness, two custom Printed Circuit Boards (PCB), and six output lines. The DC voltage was supplied by the CSA batteries (Saint-Hubert, QC, Canada), which started at around 36 V and dropped to 24 V throughout the planned mission duration. The power harness was connected to the CSA batteries and PCBs via a PT06E-12-3P(SR) connector, a 16 AWG dual conductor wire, PT06E-12-3S(SR) connector, and a PT02E-12-3P connector in series. The selected connectors conform to the MIL-DTL-26482 standard [15] and feature a higher wire ampacity to accommodate the expected power draw. The primary function of the PDU was to regulate the input voltage, producing a single 12 V output line for subpayload 1 and a 5 V output line for subpayload 2 with four redundant lines. These output lines were achieved through the use of a PYBE30-Q24-S12-T DC-to-DC converter and two PYBE30-Q24-S5-T converters. All three regulators were placed in the application and electromagnetic compatibility (EMC) circuits recommended by the manufacturer [16]. The input of the regulators utilized a 5 A fuse, while the 12 V and 5 V regulator lines had additional fuses rated at 2.5 A and 2 A, respectively. The output rails each had a barrel jack connector, and an 18 AWG power cable connected them to the subpayload’s primary boards.

3.3. Subpayload 1: Data Acquisition System

Subpayload 1 included components that were utilized in the payload’s previous iteration. Subpayload 1 consisted of an independent sensor and OBC and is the only subpayload that provided downlink communications. Data from other subpayloads was not downlinked.

3.3.1. Optics

The optical system comprised a scientific sCMOS sensor, the pco.panda 4.2 from PCO Imaging, based in Kelheim, Germany [6]. The ZEISS Dimension 2/25 lens from Carl Zeiss Industrielle Messtechnik GmbH, located in Oberkochen, Germany [17], was the lens of choice for subpayload 1. In comparison to the PCO imager onboard RSONAR II, two other imagers AURICAM™ and the Fast Auroral Imager (FAI) are also listed. AURICAM™ is a commercial star tracker [5], manufactured by Sodern. Various models of star trackers from different vendors have been flown on various satellites including DirecTV-15, One Web, Pléiades Neo, and Cygnus missions among others. The FAI is part of the e-POP Mission onboard the Cascade, Smallsat, and Ionospheric Polar Explorer (CASSIOPE) satellite, whose primary focus is on ionospheric and space weather studies. The FAI [18] features a WFOV of 26° and images aurora around the Earth in nadir pointing orientation under nominal conditions. FAI has an f/4 lens system that is combined with a fiber-optic taper, which results in an effective f-number of f/0.8. While FAI is not a star tracker typically used for attitude determination like AURICAM™, we have used FAI images to examine spaceborne RSO images for feasibility [19], simulation analysis [20], and RSO observation prediction analysis. A feasibility study was conducted on the use of the IDS UI-3370CP-M-GL Rev.2 compact monochrome camera, coupled with a telephoto lens, for RSO imaging. This low-cost optical system was found to be an economical alternative, costing approximately one-tenth of the PCO imaging system while offering comparable sensor specifications in a compact form factor. The key specifications of these four imaging systems are detailed in Table 3. The sensor specifications in Table 3 are related to each other. FOV is directly proportional to the number of pixels in the sensor and the pixel size but is inversely proportional to the focal length.

3.3.2. Electronics

The Xilinx PYNQ-Z1 System on Chip (SoC) development board, acquired from Digilent, in Pullman, WA, USA [21] was chosen as the OBC for subpayload 1. The board is built around the Xilinx Zynq®-7000 SoC, which incorporates an FPGA and a dual-core ARM Cortex™-A9 processor. The communication subsystem for telemetry via the Ethernet IP network protocol is accomplished by implementing the FPGA fabric using Python (version 3.11.3). The development of the image acquisition application and the management of its drivers were handled by the processor, which operates on a Linux-based system. The board is powered by the 12 V output line connected to its onboard power jack from the PDU. The OBC utilizes a USB-A to USB-C cable to connect to the optical system, powering the camera and facilitating the exchange of image data. Debugging was performed using the Secure Shell (SSH) and USB serial protocols.
To host the operating system and store images, hardware drivers, and sensor data, we reused an Innodisk industrial-grade 512 GB microSD card, which was sourced from Innodisk Corporation in New Taipei City 221, Taiwan [22]. Since it stores crucial data, the microSD is a vital component of the system. However, the microSD card is categorized under the Ultra-High Speed (UHS) class 1, featuring a minimum speed of 10 MB/s [23]. The team did not find any other microSD card capable of matching or exceeding this level of performance under similar operating temperatures of stratospheric flight. Additionally, the card’s ability to withstand thermal requirements and its performance during the previous year’s flight validated the decision to reuse it for the current mission. It should be noted that the other, lower-priority systems of RSONAR II were tested with microSD cards with inferior ratings to prove the viability of using cheaper non-weather-rated microSD cards for future missions.

3.3.3. Communications

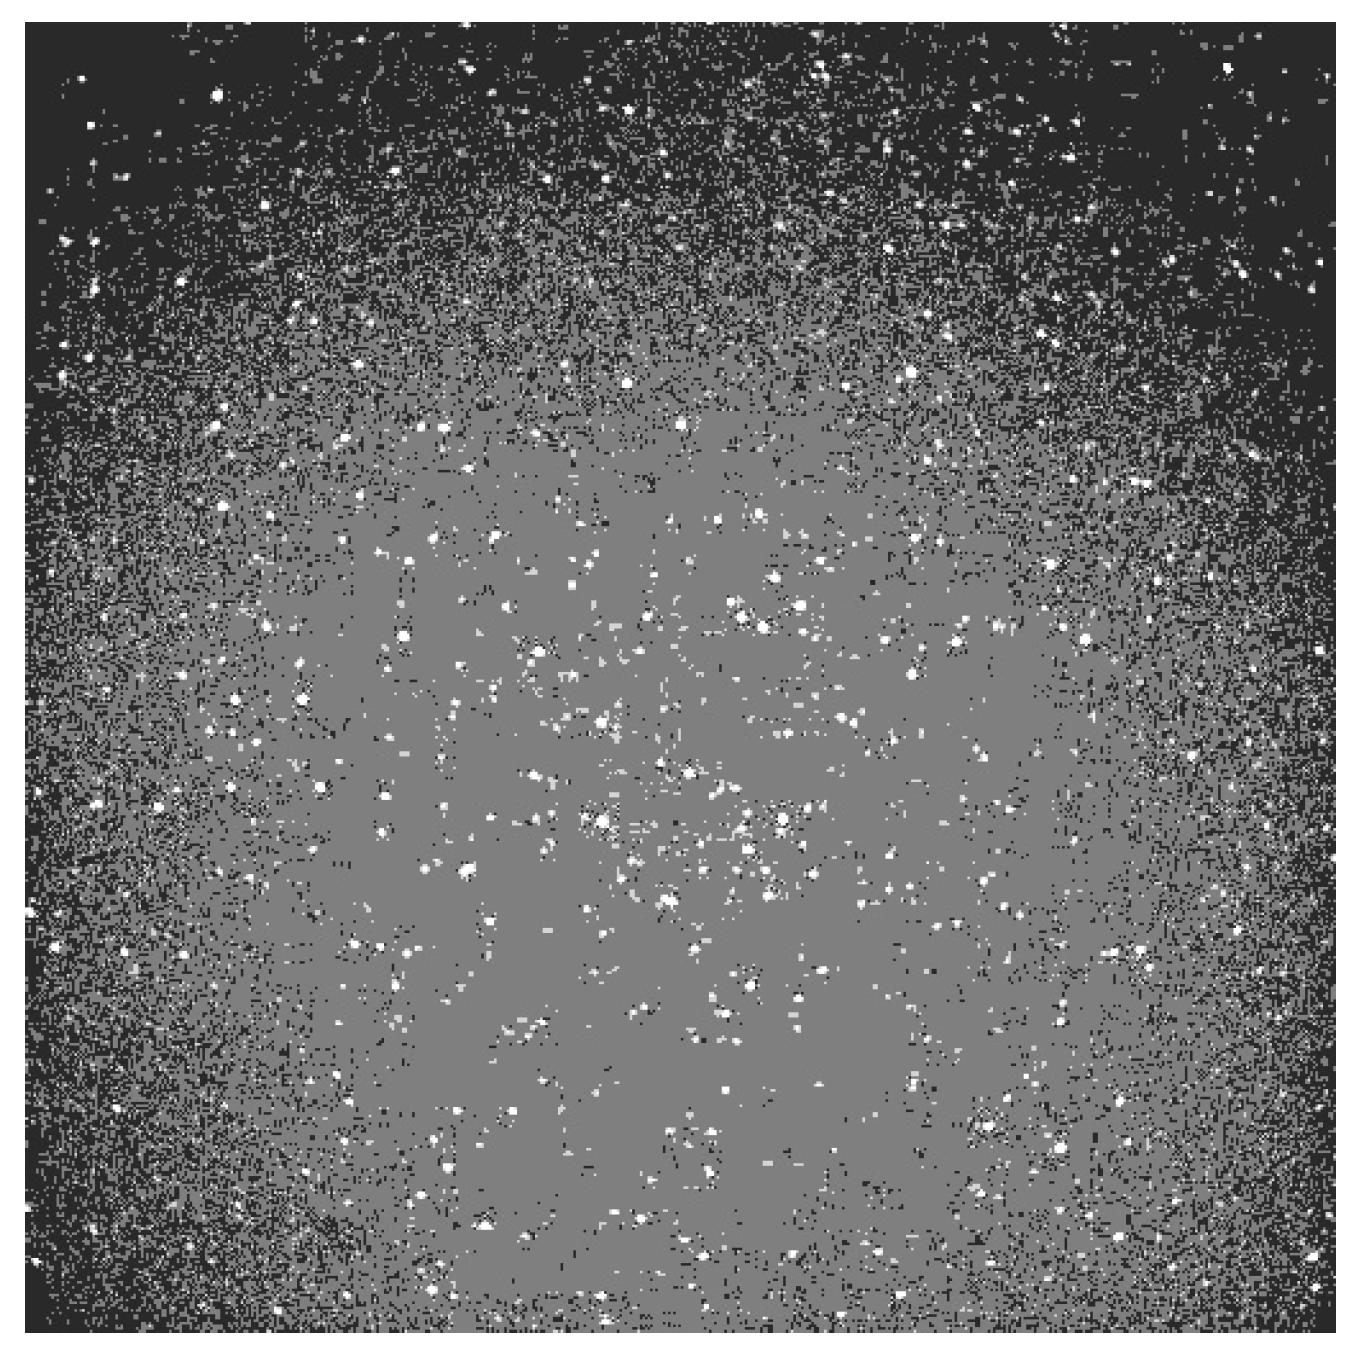
In the first iteration of the mission, the payload’s performance during the mission was assessed solely through current consumption during flight. Consequently, one of the significant upgrades to RSONAR II involved the inclusion of downlink functionality for subpayload 1. This new capability allowed for continuous real-time monitoring of subpayload 1’s status throughout the mission. In order to adhere to the allocated rate of 350 kilobits per second, we downlinked four 512 × 512 pixel images captured from the PCO camera at 500-millisecond exposure intervals along with a CSV file that included subpayload 1’s overall system health status. The CSV file comprised onboard time, mode of acquisition, imaging parameters, latest image count, and the PCO camera temperature. Due to the relatively high exposure rate used for these images, any RSO present in the downlinked images would appear as a streak, providing visual confirmation of RSO imaging during flight. To ensure the allocated capacity was never exceeded, images were transferred in small, manageable packets, with multiple validations of downlink performance conducted prior to launch. RF communications were handled from the CSA balloon. An Ethernet cable was used to connect the PYNQ Z1 board on subpayload 1 to the CSA’s communications module.

3.4. Subpayload 2: Star Tracker Attitude and RSO Detection for Unified Space Technologies (STARDUST)

The STARDUST payload serves as a dual-purpose real-time payload to demonstrate attitude determination and RSO detection on the same compact, WFOV platform. Additionally, the selected components were chosen to demonstrate the viability of using Commercial-Off-The-Shelf (COTS) components in a stratospheric environment. A Raspberry Pi 48 GB was used as the payload’s OBC, running the flight software used for image acquisition, attitude determination, RSO detection, and temperature sensor readings [24]. The optical system consisted of an IDS UI-3370CP-M-GL Rev.2 compact monochrome camera, paired with a Raspberry Pi 16 mm telephoto lens [25,26]. This configuration was chosen for its small form factor and its wide 40 ° × 40 ° FOV, capturing images at an exposure time of 100 ms and a resolution of 2048 × 2048 pixels. A 512 GB SanDisk Extreme microSD was chosen as the board’s memory card to ensure adequate storage for any flight duration [27]. Unlike subpayload 1, this system did not use a weather-rated microSD card. By having both weather-rated and non-weather-rated microSD cards on RSONAR II, we were able to assess the viability of using a faster non-weather-rated microSD card for future missions. The final component used was a temperature sensor, consisting of an Adafruit MAX31855 (Adafruit, New York, NY, USA) thermocouple amplifier breakout board with an Adafruit type-k glass braid thermocouple [28,29].

4. Payload Development

To ensure compliance with CSA safety requirements and evaluate the performance of our payload under various flight conditions, multiple simulations and tests were conducted. This section offers a summary of the key simulations and tests we carried out to evaluate the payload’s safety compliance and performance.

4.1. Mechanical Simulations

Payload survivability had to be demonstrated under the various loads it would be subjected to during the landing and transportation to meet the CSA’s safety requirements. With the gondola weighing 500 kg, the payload was expected to experience a maximum vertical acceleration of 70.56 m/s2 and an estimated shock acceleration of 147 m/s2. Therefore, the potential detachment of any components during landing was a significant concern. A series of Finite Element Modeling (FEM) analyses were conducted to confirm that the stresses detected were lower than the materials’ yield strength. The simulations indicated a significant safety margin for both shear and axial stresses. Although the highest stress was observed at the bolt corner of the interface plate, it posed no significant risk.

4.2. Thermal Testing

Similar to RSONAR, RSONAR II used passive thermal control by covering the payload with aluminum polyamide. Based on measured temperatures recorded during previous flights, it was determined that internal payload components were likely to experience temperatures of approximately −20 °C. As a result, a temperature profile was created for RSONAR II, with a minimum temperature of −20 °C. The payload underwent a 16-h operational assessment in a thermal chamber to evaluate any alterations in its performance. Following the thermal test, it was ascertained that all components were functioning properly with no performance degradation in the systems.

4.3. Vacuum Testing

During flight, the payload was expected to withstand pressures ranging from 3 to 1000 hPa. The payload was tested in a vacuum chamber to assess its performance in a vacuum environment. Following the vacuum test, all components were tested to confirm proper functionality.

4.4. Long-Form Communication Testing

To test the payload’s downlink capability over the duration of the mission and ensure robustness to connectivity issues, a 12-h long-form functional test was conducted. Simultaneously, the payload acquired images. Subsequently, image acquisition delays were analyzed to determine the optimal manual delay values that could be implemented between images to mitigate any unanticipated system delays.

4.5. Field Campaigns

Multiple field campaigns were conducted to acquire starfield images with the optical systems. On some occasions, short component-level tests focusing on a particular imaging system took place, while on others, full end-to-end tests, including downlink capability, were carried out. These campaigns aimed to calibrate the optical system based on the brightest stars in view. Innisfil, Ontario, was the site of one of the system-level tests. The sky brightness in Innisfil was measured at 20.18 mag./arc s², ranking it as five on the Bortle Dark Sky Scale [30], in contrast to a sky brightness of 17.80 mag./arc sec² that is in typical urban cities, ranking nine on the same scale. Figure 4 illustrates a series of images captured by the PCO camera during the Innisfil field campaign, featuring an RSO sequence. These images have been enhanced using the Zscale algorithm, which highlights images near the median [31]. This algorithm is beneficial in situations where data has extreme outliers, such as astronomical images that include stars. Additionally, multiple system-level tests were conducted in Timmins, Ontario, with a sky brightness ranked as class 4 on the Bortle Dark Sky Scale prior to the launch window. These campaigns were essential in acquiring datasets from various locations, in addition to those from the proposed flight.

5. Modes of Operation

5.1. Data Acquisition System (Subpayload 1) RSO Imaging

The image acquisition application was developed in C++ using the header files and functions provided with the PCO camera. In the event of a power outage, the system was designed to reboot, in order to prevent any open drivers from causing interference with image acquisition. The application was specifically designed for continuous imaging at resolutions of 512 × 512 pixels, 1024 × 1024 pixels, and 2048 × 2048 pixels upon startup. After boot-up, the system initialized into the low-resolution mode (low-res) with a resolution of 512 × 512 pixels in order to capture four images for downlink, each with an exposure time of 500 ms. The next step involved imaging in medium resolution mode (med-res) at a resolution of 1024 × 1024 pixels with an exposure time of 100 ms capturing 5100 images. Then the application was programmed to capture at a high resolution (high-res) of 2048 × 2048 pixels with an exposure time of 100 ms acquiring 600 images. Afterwards, the application transitioned to low-resolution mode, then medium-resolution and back to high-resolution, operating as a closed-loop system until it was powered off.
A system delay of 200 ms was added between each image when imaging at med-res and high-res modes to account for the microSD write speed of 10 MB/s. The system health status comprises the exposure rate, resolution, and system delay at the current mode of acquisition, along with three temperature recordings of the PCO camera at various locations (sCMOS sensor, camera, and power supply). Low-resolution mode images were then downlinked to the ground station along with the sensor’s health status. These modes are designed to enable continuous data acquisition for the planned flight duration of 12 h, with an added 2-h margin requiring the payload to be powered on prior to launch. Refer to Figure 5 for an overview of the image acquisition process from boot-up.

5.2. STARDUST (Subpayload 2) Camera Real-Time Operation

This section provides an overview of Subpayload 2’s software (version 1.0). Further details on the operation of this subpayload are in [32].

5.2.1. Real-Time Attitude Determination

The star tracker algorithm was split between a Lost In Space (LIS) algorithm, which used no a priori attitude knowledge, followed by a tracking mode algorithm which only used the star measurements and time between images. Both outputs provide the attitude in the Earth Centered Inertial (ECI) reference frame for every image captured. All design choices were targeted to maximize image capture by decreasing the computation time at the cost of lower pointing accuracy. Examples of this included the implementation of a tracking mode, which reduced the need for the computationally expensive LIS algorithm, as well as the requirement to use a minimum of three stars rather than four or more to determine the attitude. LIS would be performed every 5 min, based on inertial ground observations in which the accuracy for tracking mode was decreased to above 5 degrees error.
The LIS algorithm started with detecting and centroiding the stars in the image, using a simple threshold and Center Of Mass (COM) calculation. Next, the planar area and moment method was used for pattern matching. The onboard star catalog containing the same pattern of stars with their inertial measurements used a magnitude threshold of three and roughly a third of the full Bright Star 5 catalog [33] based on the expected pointing direction for the camera. Finally, using the three brightest star’s body frame and ECI vectors, the Quaternion Estimator (QUEST) algorithm was applied to output the final attitude measurement. The algorithms are described in detail in [34]. Tracking mode first applied a Gaussian blur and gamma correction to the image to help with noise reduction and star detection respectively. Next, the centroid of the stars was found and compared with the stars in the previous image using a nearest neighbor search. The unit vector representation in the body frame of the stars was used to estimate the angular rate between the images [35]. This angular rate was then converted to an updated attitude based on only the measurements of the stars.

5.2.2. Real-Time RSO Detection

RSO detection was performed on three images at a time, in a rolling window fashion. This meant that RSO detection was performed starting on the third iteration (once the third image was read in). After this iteration, image reading and preprocessing was only performed on one image at a time. The algorithm was based on the idea that RSOs will travel roughly linearly in the camera’s FOV, and so a simple two-step algorithm was created. The first step involved extracting the x and y pixel locations of the centroids for every detected object in the image. This step made use of image processing techniques such as thresholding and performing Connected Components Analysis (CCA) to uniquely segment objects. The next step involved associating three unique, equally spaced points together, that all lie on a straight line, within a tolerance. These conditions classified these points as RSOs, while additional constraints such as distance thresholds removed points that were too far apart (and likely noise), or too close together (and likely stars, moving slightly due to the gondola sway).
Figure 6 shows the entire STARDUST software block diagram. All functions were run in series with error handling to ensure that faults in some functions do not impact the execution of other functions.

6. Data Collection and Analysis

This section highlights the preliminary findings from the mission. A more detailed analysis of all our results will be published at a later date.

6.1. Flight Summary

RSONAR II was launched at 4:52 a.m. UTC on 22 August 2023, from Victor M. Power Airport located in Timmins, ON, Canada. The flight was shortened to approximately 5 h due to adverse weather conditions, significantly shorter than the expected 9 to 12 h. After the mission ended, the payload was recovered from Chapleau, ON, Canada.

6.2. Subpayload 1

A total of 65,951 images were captured and stored over 6.5 h, resulting in 170 gigabytes of data. These images comprised of 6600 at a resolution of 2048 × 2048 pixels, 60 at a resolution of 512 × 512 pixels, and 59,291 at a resolution of 1024 × 1024 pixels. The hourly image capture rate remained consistent with the previous year, but there were significant delays expected and observed during the imaging period (refer to Section 7.1 for further delay analysis).

Data Telemetry

The payload effectively transmitted images and telemetry health files throughout the entire mission duration. A total of 160 files were downlinked over the course of the mission. Figure 7 shows a sample image that was downlinked.

6.3. Subpayload 2

Preliminary processing of mission data shows that there were far fewer objects (both stars and RSOs) in each frame than was expected. Initial hardware investigation indicated that a degradation in hardware may have occurred, specifically the camera. Despite this reduced performance, at least five unique RSOs were observed visually in the images. The algorithm detected all these RSOs as they passed through the imager’s FOV, with few dropped detections. Furthermore, these detections were found to have been made in less than 500 ms, which included the attitude determination algorithm processing time, 100 ms image exposure time, and sensor data saving time, among other processing steps. This indicates that for these detections, the linear motion model assumed by the algorithm for RSOs performed well. Figure 8 shows an illustration of the RSO detection algorithm’s outputs.
Further processing needs to be performed to calculate metrics such as True Positives (TP), False Positives (FP), and False Negatives (FN), along with precision and recall. The extended analysis will also verify the presence of dimmer RSOs that were not visually observed during the initial analysis of the data. A better calculation of the processing time and a thorough investigation of the camera’s performance will be conducted as well.
Preliminary results for the attitude determination LIS algorithm had shown an average cross-boresight accuracy of 32 arc minutes and around boresight of 75 arc minutes. The tracking mode had shown an average cross-boresight accuracy of 2.5 degrees and around boresight of 3 degrees. Further analysis is required to examine calculations with incorrect star identification, primarily caused by the sensitivity of the barrel distortion correction. Investigation is also required for calculations with bright RSOs in the image incorrectly identified as stars, leading to incorrect attitude estimation. Removal of these RSOs during star detection and the stars for RSO detection can lead to improved results but is left for future work.

7. Results

This section highlights the analysis conducted on the data gathered from the mission.

7.1. Delay Analysis

Due to the slow microSD card speed, a 200 ms delay was implemented after each image capture to prevent system delays. Time intervals between captures were measured using the board time in the image name, accounting for exposure and self-induced delays, with the name generated before imaging begins. Significant delays during mode transitions were observed, likely caused by changes in imaging parameters. To address this, outliers in the delay dataset were removed using the Interquartile Range method (IQR), defining outliers as delay values outside Q 1 1.5 × I Q R or Q 3 + 1.5 × I Q R . Figure 9 shows the distribution of delays for high-resolution 2048 × 2048 imaging. With the exception of a few anomalies, negligible or no delay was observed in both the low and medium-resolution modes.

7.2. Thermal Analysis

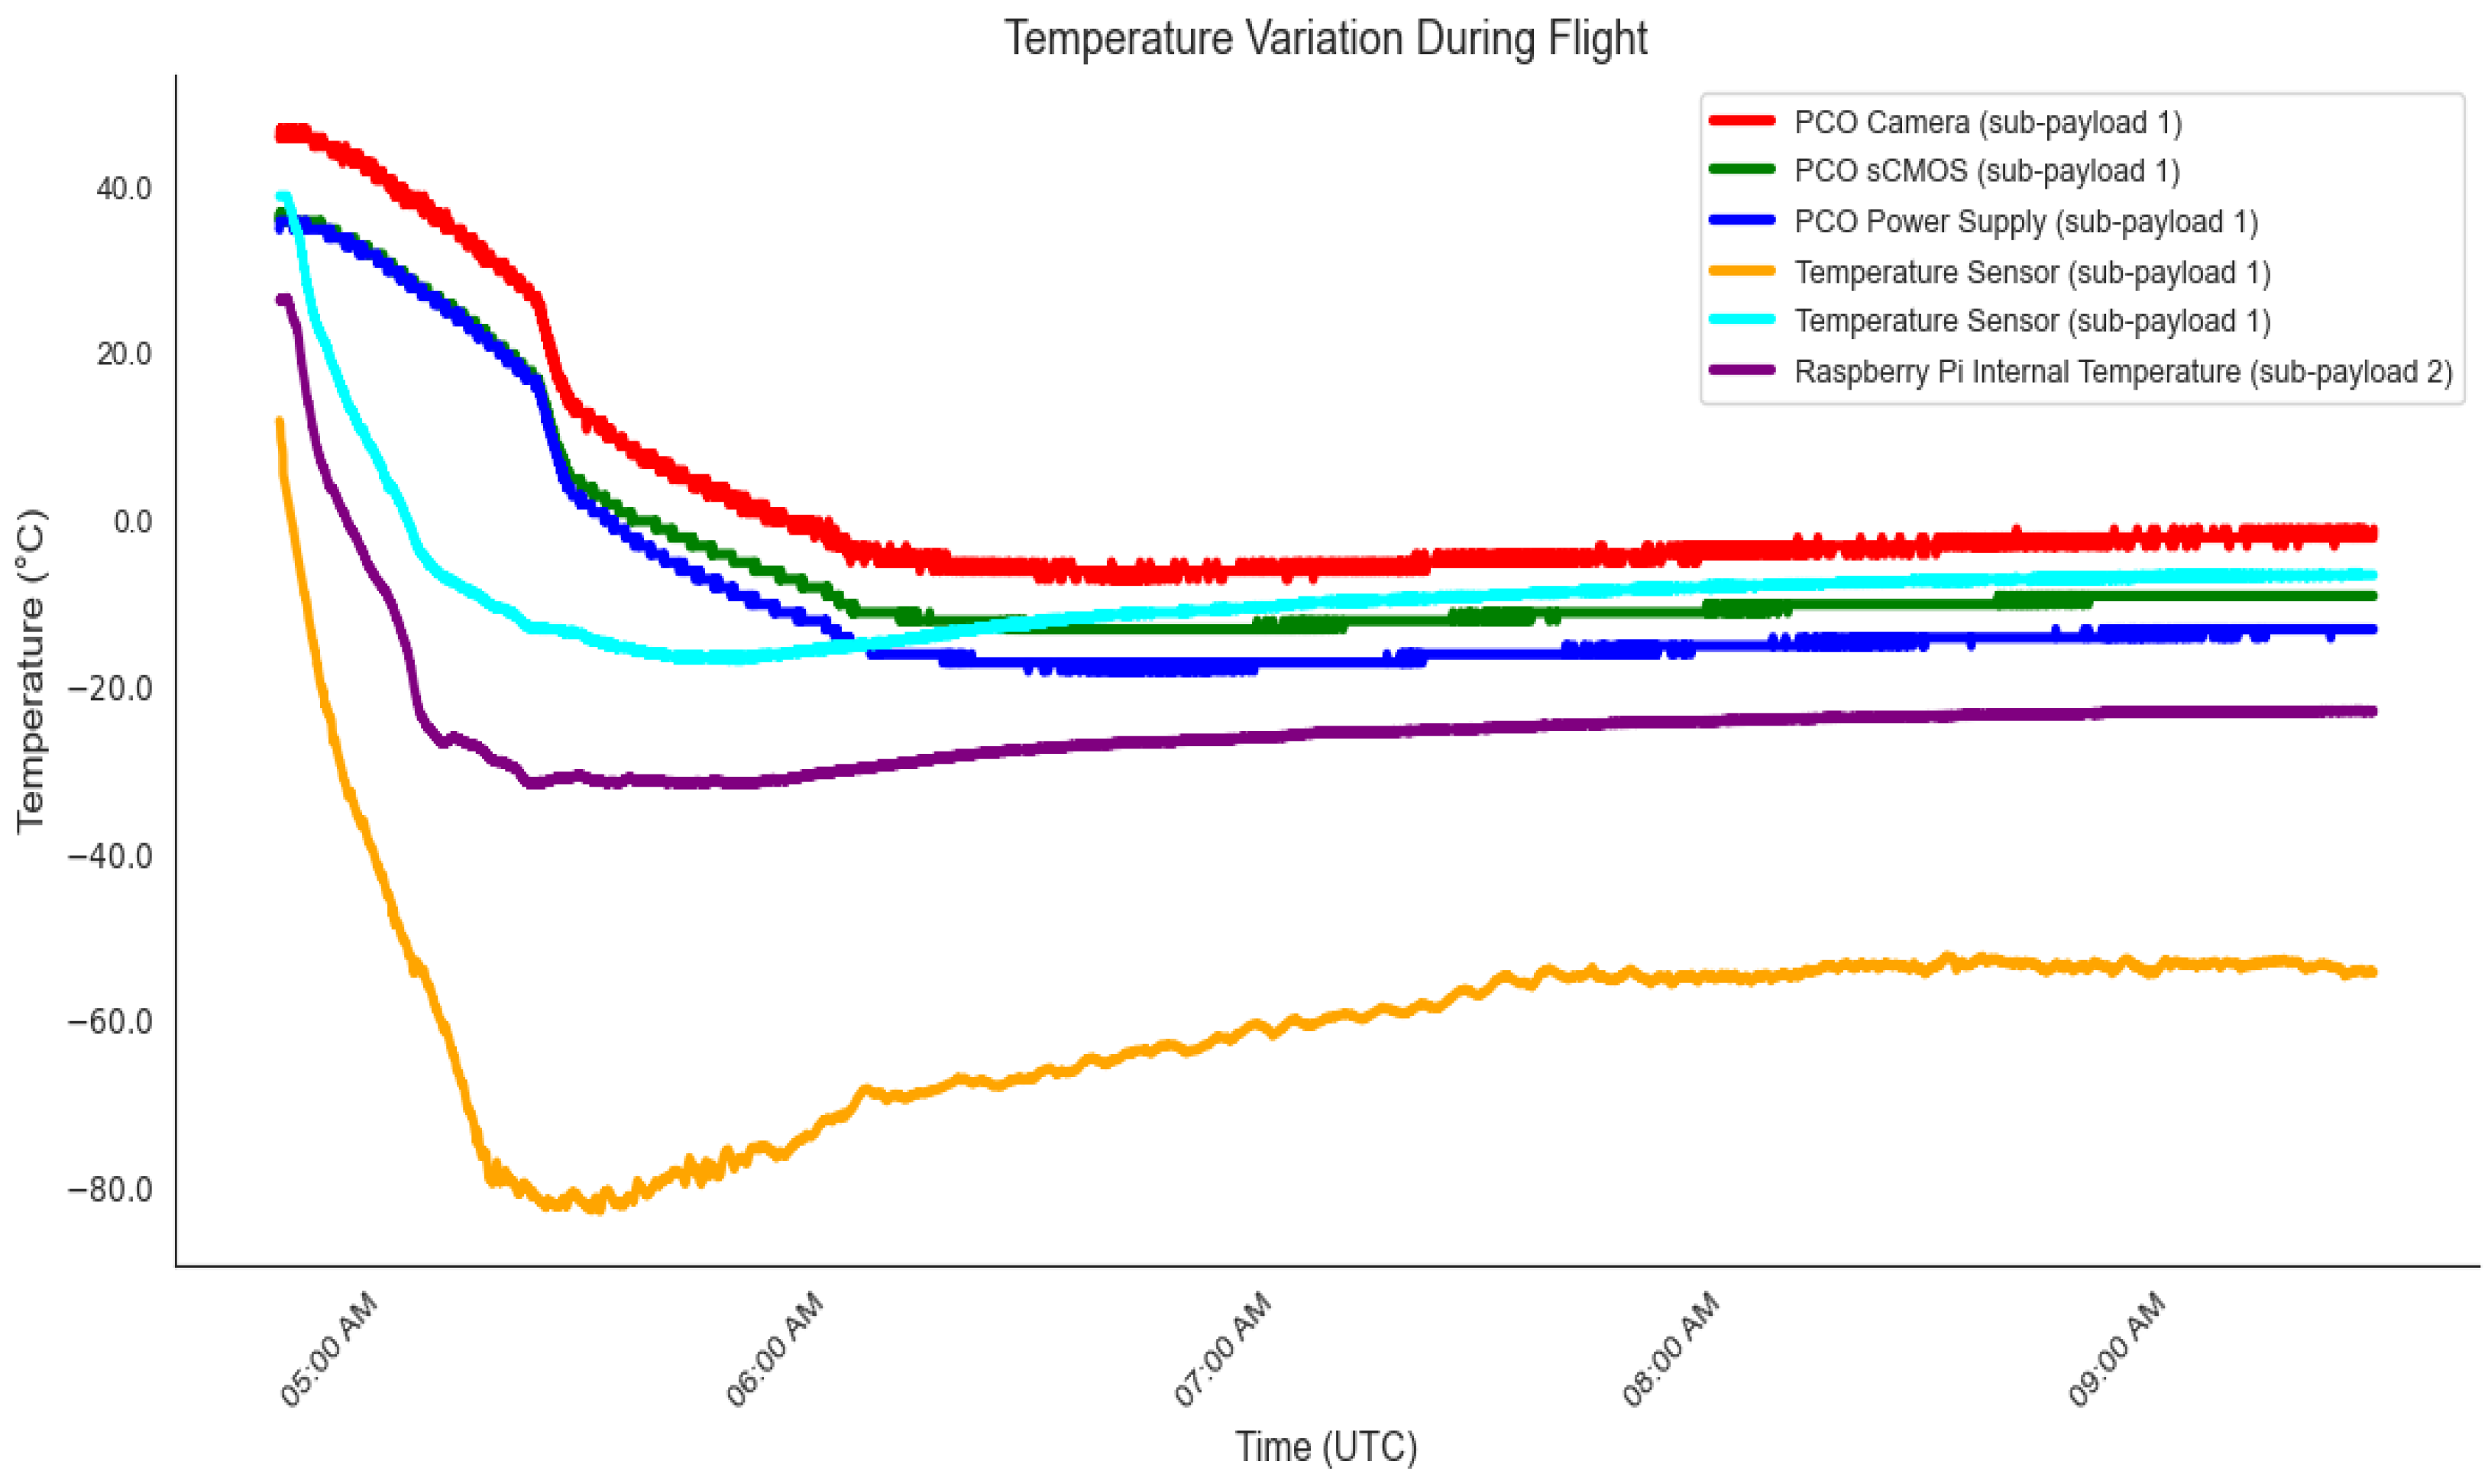
In subpayload 1, PCO gathered temperature data for the sCMOS, power supply, and camera during every image capture. A temperature sensor was fixed to the PCO body, and the readings were registered by subpayload 2’s Raspberry Pi in addition to its own internal temperature. The operational temperature of the payload components was a fundamental aspect of the payload design due to the expected ambient temperature of −80 °C. Figure 10 displays temperature readings for different components of the payload and the external environment during the payload’s operational phase of the flight. This work is based on observations with the CNES temperature sensor under a balloon operated by CNES, within STRATO-SCIENCE 2023 and in the framework of the CNES/CSA Agreement.

7.3. Sensor Comparison

7.3.1. Limiting Magnitude

Cameras with different capabilities and price ranges were employed for RSO and star observations during this mission. Before the mission commenced, the limiting magnitude of the stars for each sensor was estimated. This magnitude denotes the faintest star imaged by the sensor. The sensor’s limiting magnitude can be computed by finding the magnitude of an object where the Signal-to-Noise Ratio (SNR) is the minimum for detectability. The magnitude of an RSO can be calculated using the irradiance equation from [36]. Equations (1) and (2) show the steps for calculating the photon-based irradiance.
E R S O P o w e r = 1.78 × 10 8 · 10 0.4 m o b j [ W / m 2 ]
E R S O = E R S O P o w e r h c = 1.78 × 10 8 · 10 0.4 m o b j λ h c [ ph / s / m 2 ]
In Equations (1) and (2), E R S O P o w e r refers to the irradiance in units of power per unit area, E R S O refers to the photon-based irradiance, m o b j is the object magnitude, λ is the wavelength, h is Planck’s constant, and c is the speed of light. The photon-based irradiance can be used in the signal photoelectron equation from [36] as shown in Equations (3) and (4).
e s = Q e τ A τ a t m E R S O t
e s = Q e τ A τ a t m t 1.78 × 10 8 · 10 0.4 m o b j λ h c
In Equations (3) and (4), e s is the number of signal photoelectrons, Q e is the sensor’s quantum efficiency, τ is the optical transmittance, τ a t m is the atmospheric transmittance, A is the aperture area, and t is integration time. We reorganize Equation (4) and assume the optical and atmospheric transmittance values equal to one result in the equation for the object magnitude as shown in Equation (5).
m o b j = 2.5 · lg e s h c 1.78 × 10 8 Q e A λ t
As shown in [37], the SNR can be estimated as in Equation (6) and an updated expression for the signal photoelectrons is obtained in (7).
S N R = e s
e s = S N R 2
By substituting the expression for e s as per Equation (7), the limiting magnitude expression can be updated as shown in Equation (8).
m l i m = 2.5 · lg S N R 2 h c 1.78 × 10 8 Q e A λ t
Assuming a minimum SNR of 5 for ensuring reliable detection of faint objects in CCD imaging [38], Equation (9) shows the limiting magnitude equation used in this study.
m l i m = 2.5 · lg 25 h c 1.78 × 10 8 Q e A λ t
Equation (9) is simplistic and does not account for complexities such as readout noise. Thus, it can be easily applied when there is limited sensor information as is with many commercially available cameras. Factors such as the motion of the RSO are not considered in Equation (9). This is acceptable because the equation is used to provide an estimate of the sensor performance prior to capturing images were the motion of RSOs would need to be taken into account. Figure 11 displays a plot of limiting magnitudes for a range of integration times determined using Equation (9). The vertical line indicates an integration time of 100 ms, which was the value used during the mission.
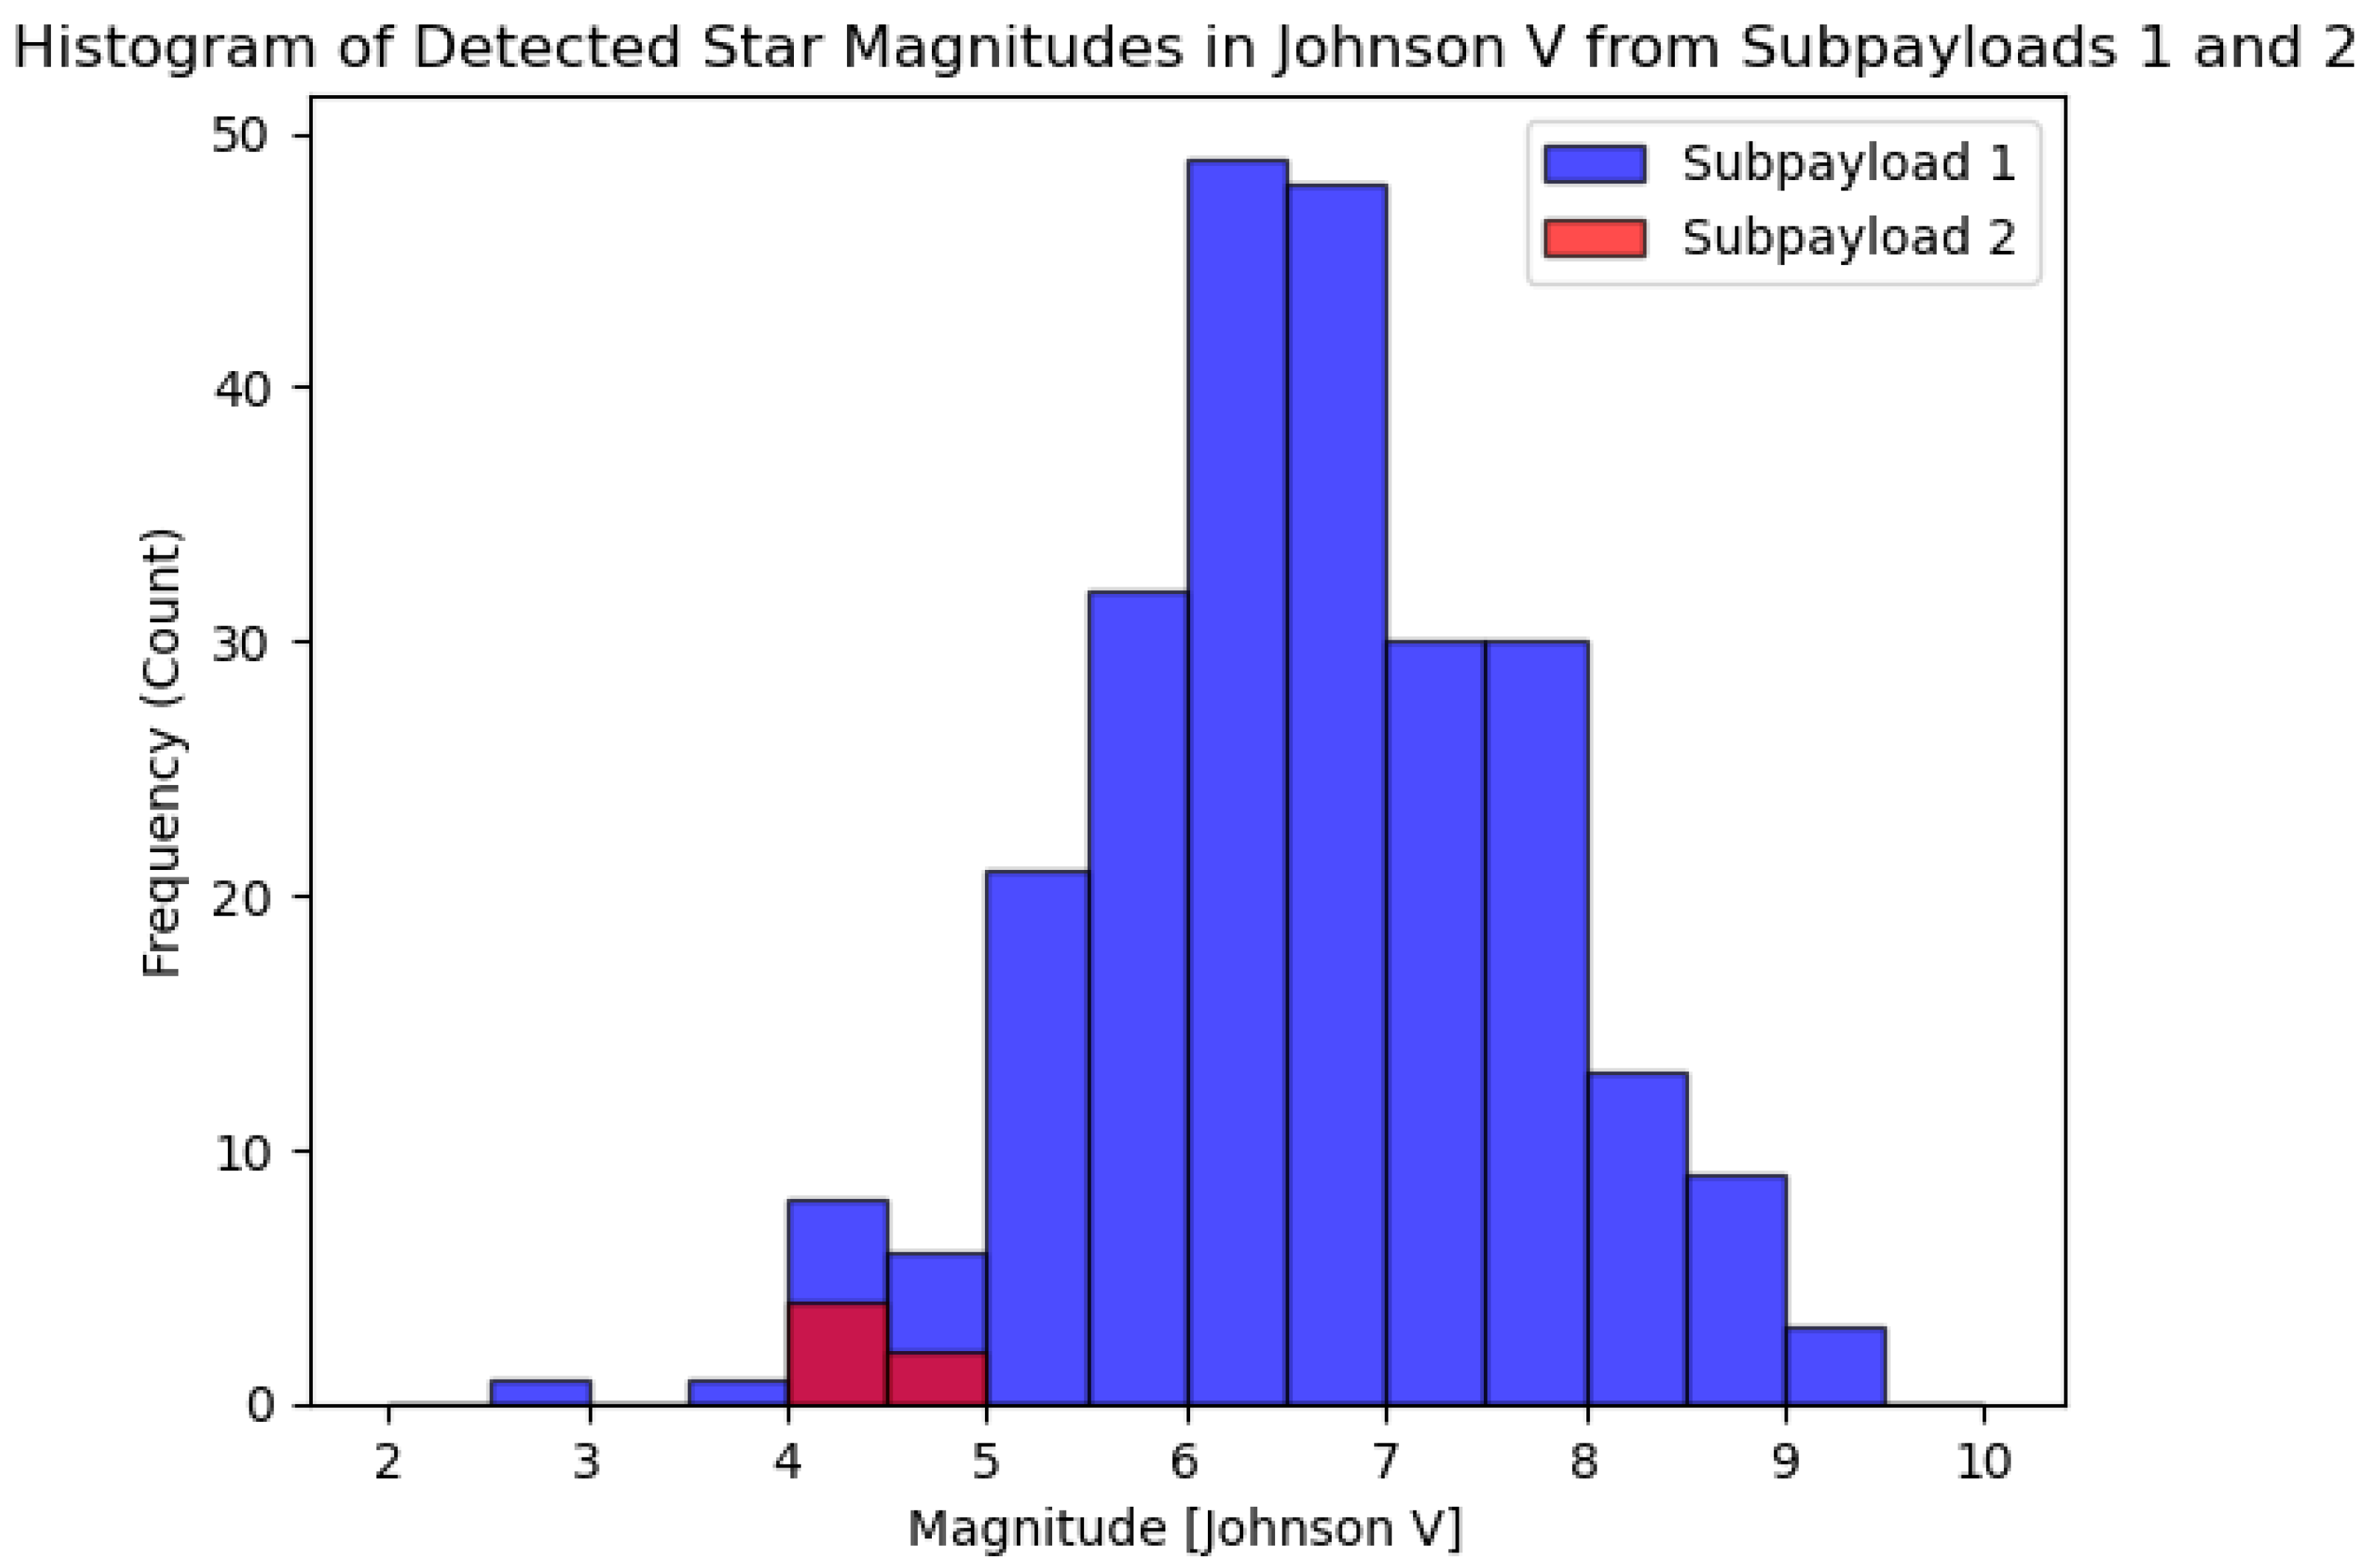
The images obtained at the end of the mission from subpayloads 1 and 2 were processed with Astrometry.net [39] to compute the World Coordinate System (WCS) and the field distortions present in them. The celestial sources within the images were detected using DAOStarFinder function from the photutils package in Astropy [40]. A Full Width at Half Maximum (FWHM) value of 3 and the threshold was set at 2.5 times the standard deviation of pixel intensities in the images for the source detection. After extracting the sources, their pixel coordinates were converted to Right Ascension (RA) and Declination (Dec) values using WCS. The sources detected were queried using the Hipparcos catalogue [41] from the VizieR database [42], with a search radius equivalent to the pixel scale of the respective images. Figure 12 depicts the frequency of detected star magnitudes in the Johnson V band from the subpayloads.

7.3.2. Field of View (FOV)

Figure 13 shows segments of the Pisces constellation as captured by subpayloads 1 and 2 near the end of their operational phase in flight. The 2048 × 2048 resolution images were processed for celestial coordinates using astrometry.net [39] and labeled using the Tycho-2 catalog. Due to the optical sensors’ similar FOV and placement within the payload, there was an expected overlap in starfield observations within regions of starfield imaging. Furthermore, Table 4 presents the calibration metrics alongside the right ascension and declination values from images presented in Figure 13.

7.3.3. Star Detectability

To assess the camera sensors’ capacity to distinguish stars from the background sky, contrast maps are used in starfield imaging. A sliding window approach was employed to perform local contrast measurement within these images. This method calculates contrast over small, localized areas of the image and then moves this window across the entire image. Figure 14 displays the contrast maps of images from subpayload 1 and subpayload 2.
In starfield imaging, a histogram can visualize intensity distribution, with a characteristic peak at the lower intensities and some spikes at the high intensity end, as shown in Figure 15 using the minimum and maximum pixel values within the images.

7.3.4. RSO Detection

This subsection provides an initial comparison between the RSO detection capabilities of the PCO camera and the IDS camera. For the PCO camera, this was performed by visually distinguishing the RSOs within the images from the background stars. The RSO detection capability of the IDS camera was investigated in [32] and was achieved by comparing the onboard algorithm’s detections to the actual images to verify the detections. Given the unstable flight conditions, only the last 92 min of data were used for this analysis. Additionally, the images captured by the PCO camera for downlink were ignored in this analysis, given their differences from the main mission data and small quantity. Table 5 shows the comparison between the imagers on a variety of metrics.

8. Discussion

8.1. Delay Analysis

From Figure 9, the histogram displays a unimodal distribution with a prominent peak. The data are skewed towards the right, as evidenced by the tail extending towards longer time delays. The mode value of 460 ms is in proximity to the median value of 470 ms, suggesting that the most common time delay is close to the middle of the distribution.The mean value of 593.28 ms is higher than both the median and mode. This disparity is possibly due to a natural asymmetry in the delays, rather than extreme values. The continued presence of higher delays after exclusion of outliers indicates issues with the imaging system that must be addressed to decrease the frequency of such high delays, which can be directly linked to the SD speed rate.

8.2. Thermal Analysis

The payload was powered on two hours before the balloon’s launch, leading to an initial temperature higher than the surrounding environment which can be seen in Figure 10. The most significant temperature changes occurred between 5:00 a.m. and 6:00 a.m. UTC, possibly during the balloon’s passage through different atmospheric layers, followed by stabilization post-ascent. The external high-altitude temperatures were substantially colder than the payload components. The Raspberry Pi’s internal temperature remained stable, indicating effective thermal regulation. Temperature readings recorded lows of −13 °C, −18 °C, −16.7 °C, and −7 °C for the PCO components, −82.78 °C for the environment, and −31.6 °C for the Raspberry Pi. The subpayloads’ components were both warmer than their environment, most likely due to the passive heating and thermal blanket insulation. The PCO camera generated more heat compared to the Raspberry Pi in subpayload 2. The internal temperature of the Raspberry Pi is noticeably lower than what would be expected during standard operating conditions. Therefore, it appears feasible to consider overclocking the Raspberry Pi in these circumstances, as it could potentially produce added heat and enhance its performance. However, overclocking could still lead to system instability if implemented improperly. As such, overclocking should be approached cautiously, with thorough testing prior to deployment in future missions. The standard microSD card, rated at UHD speed class 3 and utilized in the Raspberry Pi of subpayload 2, which was not designed for stratospheric temperature ranges, functioned below its expected temperatures, indicating the potential for using faster microSD cards within these temperature ranges in future missions.

8.3. Sensor Comparison

Based on Figure 11, it can be estimated that the PCO camera has a limiting magnitude of approximately 14 at 100 ms, while the IDS camera has a limiting magnitude of around 10 at the same exposure time. As a result, numerous stars and, by extension, RSOs should be detectable using both sensors. Despite the fact that the PCO camera is ten times more expensive than the IDS camera, both systems are capable of capturing enough stars and RSOs to support the attitude determination and RSO detection algorithms. This estimation was validated during the mission as both systems were able to capture stars and RSOs.
Figure 12 demonstrates that subpayload 1 detects stars at a frequency ten times higher than subpayload 2. The plot employs the Johnson V magnitude system, also known as visual magnitude, operating at an effective wavelength midpoint of 551 nm, a part of the UBV photometric system used for classifying stars. The histogram reveals that most stars detected by subpayload 1 (represented in blue) have magnitudes ranging approximately from 5.5 to 7.5, with the peak frequency observed between magnitudes 6 and 7. In contrast, subpayload 2 (depicted in red) shows fewer detections and a more limited magnitude range. Subpayload 1 demonstrates a higher sensitivity in star detection with a quantum efficiency of 82% and a spectral responsivity range of 350–800 nm. In contrast, subpayload 2 exhibits a peak quantum efficiency of 64% within a wavelength range of 400–800 nm. The magnitudes of sources extracted from images were found to be significantly lower than those evaluated from Equation (9). This discrepancy can be attributed to the parameters used in source extraction and the correlation of celestial objects within the catalogue. However, the most significant factor reducing the detection of dimmer magnitudes is the noise present in the sensors. Furthermore, the images used for extraction were captured at the end of the mission, a time when the sun was 9 degrees below the horizon, further contributing to this reduction.
Figure 14 clearly illustrates subpayload 1’s sensor’s ability to capture stars as bright, well-defined points against the dark sky, demonstrating high contrast. In comparison, subpayload 2’s sensor produces a contrast map with a more homogeneous appearance, with stars appearing less distinct against the background. This comparison is essential as it uncovers the relative constraints of subpayload 2’s sensor, potentially caused by increased noise levels, decreased dynamic range, or differences in ISO and overall imaging system quality. The contrast map for subpayload 1, with its distinct and high contrast dots, is not only a confirmation that the sensor can detect stars but also a testament to its enhanced capabilities for photometric and astrometric analysis. High contrast is crucial for precise photometry, which depends on accurate measurements of object intensities, and for detecting faint resident space objects (RSOs), which require clear distinction from background noise. The contrast map of subpayload 1 provides evidence of functional sensors and indicates an imaging system that has the potential to significantly improve the quality and reliability of astronomical data.
In Figure 15, the pixel intensity distributions from the images captured by the subpayloads yields distinct insights. Subpayload 1 exhibits a higher dynamic range, as evidenced by the broader spread of pixel intensities, ranging from the minimum to the maximum values within the images. This wide range is indicative of subpayload 1’s capacity to capture a full spectrum of brightness, from deep blacks to bright highlights. In addition, subpayload 1 demonstrates a greater variation in the brightness of features within the images. This is characterized by distinct peaks at multiple intensity levels in the histogram. Such variation is indicative of the payload’s ability to resolve differences in brightness with high fidelity. The pronounced peaks at the lower end of the intensity spectrum are characteristic of the dark background typical in starfield images. Moreover, the increased count of lower intensity values in subpayload 1’s histogram compared to that of subpayload 2 conclusively shows subpayload 1’s superior sensitivity to subtle light features. Subpayload 1 is equipped with a more refined detection capability for capturing faint astronomical phenomena, as expected.
In terms of RSO detection, the PCO camera appeared to be far superior to the IDS camera. As per the results in Table 5, the PCO camera was able to capture over 20 times as many unique RSOs, while yielding more than 40 times as many RSO detections. This was despite the fact that the PCO camera had a narrower FOV and almost half as many images. However, this is expected, given that the PCO camera was selected for its low-light sensitivity and low-noise, and is an order of magnitude costlier than the IDS camera. It is important to note, however, that the RSOs detected by the IDS camera were determined by the onboard algorithm, rather than a comprehensive visual review of the original images, which is to be accomplished. Therefore, it can be expected that the IDS camera may have captured more RSOs but was limited by the algorithm’s performance.

9. Outreach

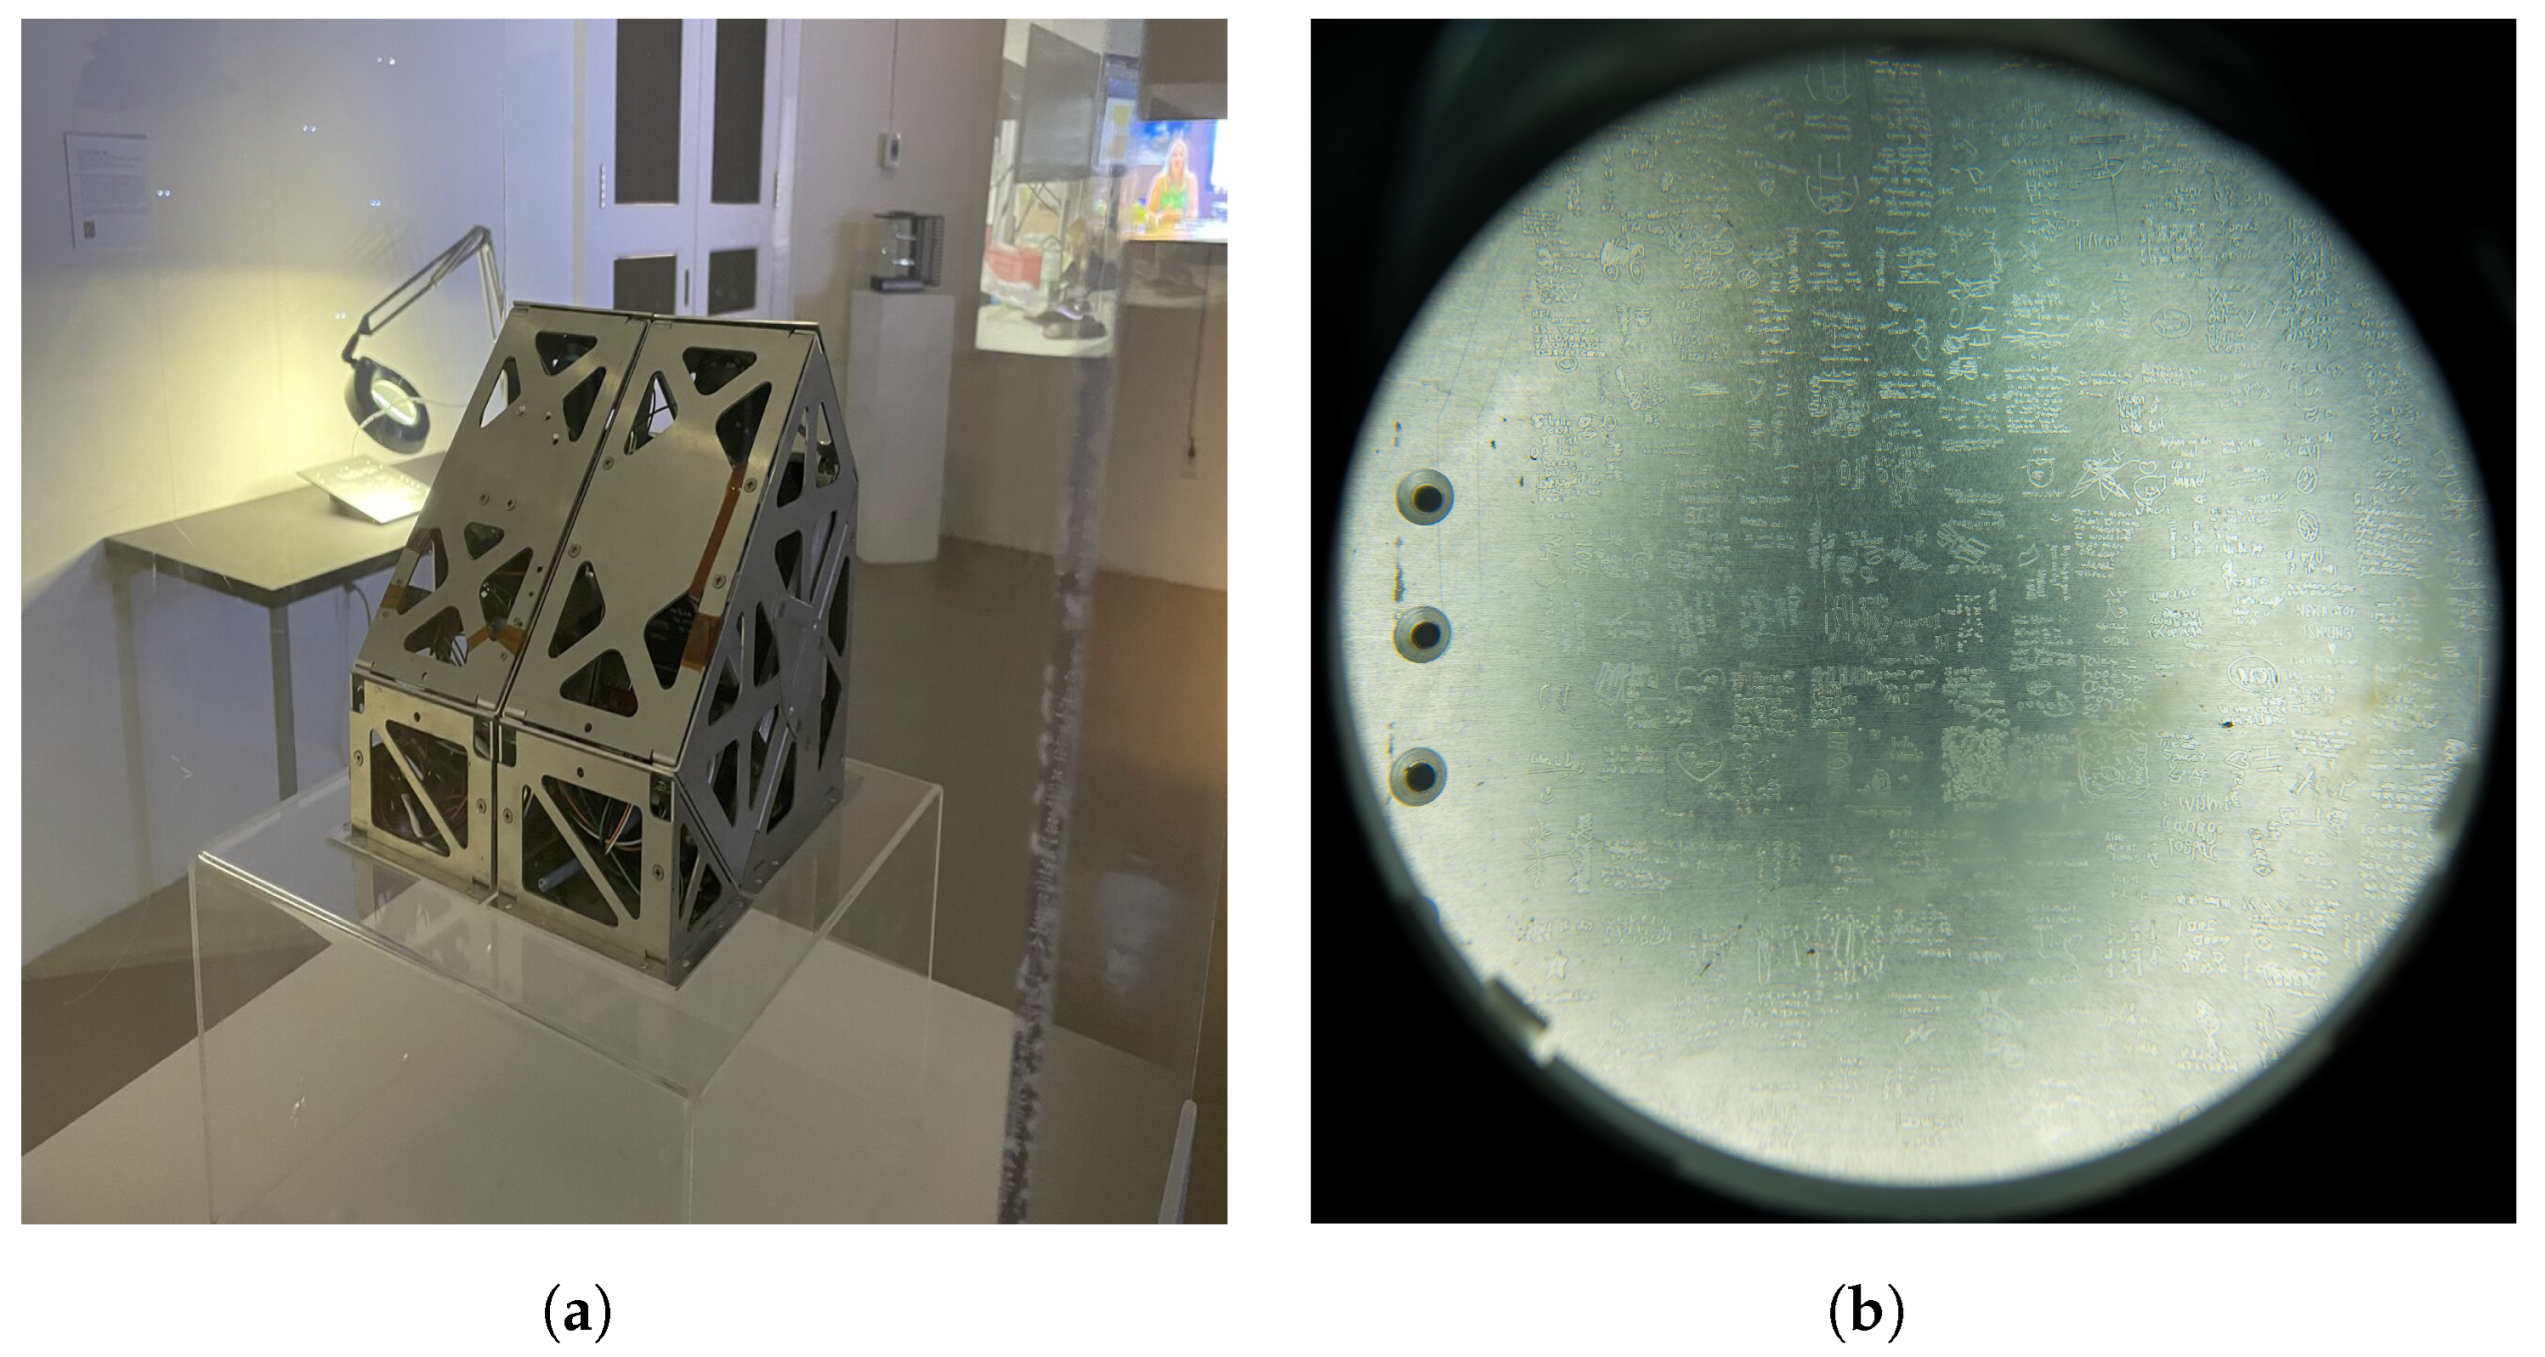
In addition to the primary objectives stated earlier, the secondary objective of the mission is to provide a platform for public outreach on SSA. Given that this is not a technical goal, it was not included in the main payload discussion earlier. In March 2023, we performed a series of presentations to children and their parents at the Ontario Science Centre. The program, called “SSA and Us”, was intended to inform the general public about SSA and its importance. An interactive aspect of this endeavor involved asking the audience to write a message that will be sent on our payload to near-space. The payload’s interface plate and custom-made PCB board for the PDU were engraved with over 2000 messages gathered during the presentation. Following the mission, the messages were on display at Western University’s McIntosh Gallery as part of “The Life Cycle of Celestial Objects Pts. 1 & 2” exhibit between September and December of 2023, where visitors could view these messages. Additionally, the exhibit featured the payload staged with a video showcasing the development journey of RSONAR II shown in Figure 16 [43].
The initiative to develop and deliver a series of activities around SSA is in recognition of the need for public outreach for space programs. In this unprecedented time of access and democratization of tools, there is an urgent need for a reframing of space. It should not be viewed as a ‘new frontier’ for appropriation and extraction but as a critical site for considering how we, as a whole, can participate in pioneering explorations in the skies above us. Space-art has been recognized as a tool for public outreach for many years in its myriad representations of data, creative fiction, and myth-making. These networks offer significant potential today, especially with the growing need for amateur space observations. Such efforts support the recording and identification of an increasing number of space objects, including satellites and debris.
Therefore, the objectives of the SSA outreach project are to (1) develop hybrid and synergistic strategies across space engineering, community practice, and visual arts to catalyze a collective imagination and envisioning of future worlds and (2) create access and accountability in the use of high-level data for public workshops around SSA data visualization and physical/virtual modes of creative data visualization. Throughout the RSONAR II mission, we have collected qualitative and quantitative data around SSA, space exploration, and the commercialization of space through interviews with workshop participants, field specialists, and social media analyses. We adopted research-creation strategies around data visualization and public exhibition formats, constantly evaluating our methods for effective communication.

10. Conclusions

In this paper, we demonstrated the second iteration of a dual-purpose star tracker system launched on a stratospheric balloon. By adding an extra camera for real-time attitude determination and RSO detection, we have been able to successfully test our algorithms without the risk of altering the performance of our image capture payload. We also successfully demonstrated image downlink, enabling us to monitor the payload’s performance throughout the mission. This is an extremely important feature of our payload, which will be especially critical for any long stratospheric missions that run for multiple days. We performed a limiting magnitude comparison between the two main sensors, the PCO and IDS cameras, and proved through calculations that both are able to see stars. Additionally, we analyzed resulting data from the image and performed a delay analysis, thermal analysis, and sensor comparison. An important lesson from the analysis of this stratospheric balloon mission is that non-weather-rated microSD cards are more advantageous than weather-rated ones because the internal payload temperatures support the operation of standard microSD cards. These cards offer a faster writing speed at a relatively low cost.
Future work includes further post-processing of the data we captured. Additionally, in future stratospheric missions, we aim to incorporate uplink commands alongside downlink capabilities. This will enable us to make necessary code adjustments based on the data collected via downlink. With regards to RSO detection, we plan to use the RSO detection algorithm flown on subpayload to perform RSO detection on both datasets to assess if there is a difference between it and the truth data. We will also study subpayload 2’s IDS truth data’ and compare it to the onboard algorithm’s detection. Additionally, we intend to expand our analysis to determine which RSOs were uniquely detected by PCO, which RSOs were uniquely detected by IDS, and which RSOs were detected by both cameras.

Author Contributions

Conceptualization, R.Q.; methodology, R.Q., G.C., P.K. and V.S.; software, R.Q., G.C., P.K. and V.S.; validation, R.Q., G.C., P.K. and V.S.; formal analysis, R.Q., G.C., P.K. and V.S.; writing—original draft preparation, R.Q., G.C., P.K. and V.S.; writing—review and editing, R.S.K.L.; supervision, R.S.K.L.; project administration, R.S.K.L.; funding acquisition, R.S.K.L. All authors have read and agreed to the published version of the manuscript.

Funding

This work was supported by the Natural Sciences and Engineering Research Council of Canada Discovery Grant (grant number: RGPIN-2019-06322) and the Canadian Space Agency Flights and Fieldwork for the Advancement of Science and Technology (FAST) program (grant number: 19FAYORA12) in collaboration with Magellan Aerospace and Defence Research and Development Canada.

Data Availability Statement

The data presented in this study are available on request from the corresponding author. The data are not publicly available due to continuing research and containing sensitive data.

Acknowledgments

We would like to thank Akash Chauhan for his invaluable feedback and support during the RSONAR II mission.

Conflicts of Interest

The authors declare no conflict of interest.

References

  1. United Nations Office for Outer Space Affairs. Convention on Registration of Objects Launched into Outer Space. 1974. Available online: https://www.unoosa.org/oosa/en/ourwork/spacelaw/treaties/registration-convention.html (accessed on 18 January 2024).
  2. Johnson, N. The Collision of Iridium 33 and Cosmos 2251: The Shape of Things to Come. In Proceedings of the 60th International Astronautical Congress, Daejeon, Republic of Korea, 12–16 October 2009; Available online: https://ntrs.nasa.gov/citations/20100002023 (accessed on 18 January 2024).
  3. Astromaterials Research & Exploration Science. NASA Orbital Debris Program Office. Available online: https://orbitaldebris.jsc.nasa.gov/faq/ (accessed on 18 January 2024).
  4. Space Based Space Surveillance. Space Operations Command (SpOC). Available online: https://www.spoc.spaceforce.mil/About-Us/Fact-Sheets/Display/Article/2381700/space-based-space-surveillance (accessed on 18 January 2024).
  5. AURICAM Monitoring Camera. Sodern. Available online: https://sodern.com/wp-content/uploads/2021/12/Auricam.pdf (accessed on 18 January 2024).
  6. pco.panda 4.2 Ultra Compact SCMOS Camera; Excelitas PCO GmbH. pp. 1–7. Available online: https://www.excelitas.com/product-category/pco?referer=pco (accessed on 18 January 2024).
  7. Oelkers, R.J.; Stassun, K.G. Precision Light Curves from TESS Full-frame Images: A Different Imaging Approach. Astron. J. 2018, 156, 132. [Google Scholar] [CrossRef]
  8. Qashoa, R.; Lee, R. Classification of Low Earth Orbit (LEO) Resident Space Objects’ (RSO) Light Curves Using a Support Vector Machine (SVM) and Long Short-Term Memory (LSTM). Sensors 2023, 23, 6539. [Google Scholar] [CrossRef] [PubMed]
  9. Dave, S.; Clark, R.; Lee, R.S. RSOnet: An Image-Processing Framework for a Dual-Purpose Star Tracker as an Opportunistic Space Surveillance Sensor. Sensors 2022, 22, 5688. [Google Scholar] [CrossRef]
  10. Kunalakantha, P.; Baires, A.V.; Dave, S.; Clark, R.; Chianelli, G.; Lee, R.S. Stratospheric Night Sky Imaging Payload for Space Situational Awareness (SSA). Sensors 2023, 23, 6595. [Google Scholar] [CrossRef] [PubMed]
  11. Suthakar, V.; Sanvido, A.A.; Qashoa, R.; Lee, R.S.K. Comparative Analysis of Resident Space Object (RSO) Detection Methods. Sensors 2023, 23, 9668. [Google Scholar] [CrossRef]
  12. Strato-Science 2023 Campaign. Canadian Space Agency. Available online: https://www.asc-csa.gc.ca/eng/sciences/balloons/campaign-2023.asp (accessed on 18 January 2024).
  13. Ekos Precision Machining Inc. Available online: http://www.ekosprecisionmachining.com/ (accessed on 20 February 2024).
  14. McMaster Carr. Available online: https://www.mcmaster.com/ (accessed on 20 February 2024).
  15. MIL-DTL-26482 H. Available online: http://everyspec.com/MIL-SPECS/MIL-SPECS-MIL-DTL/MIL-DTL-26482H_6891/ (accessed on 20 February 2024).
  16. DC-DC Converter, PYBE30 Series. CUI Inc. Tualatin, USA. Available online: https://www.cui.com/product/resource/pybe30-t.pdf (accessed on 18 January 2024).
  17. ZEISS Dimension 2/25; Carl Zeiss AG. 2018, pp. 1–5. Available online: https://www.zeiss.com/content/dam/consumer-products/downloads/industrial-lenses/datasheets/en/dimension-lenses/datasheet-zeiss-dimension-225.pdf (accessed on 18 January 2024).
  18. Cogger, L.; Howarth, A.; Yau, A.; White, A.; Enno, G.; Trondsen, T.; Asquin, D.; Gordon, B.; Marchand, P.; Ng, D.; et al. Fast Auroral Imager (FAI) for the e-POP Mission. Space Sci. Rev. 2015, 189, 15–25. [Google Scholar] [CrossRef]
  19. Clemens, S.; Lee, R.; Harrison, P.; Soh, W. Feasibility of Using Commercial Star Trackers for On-Orbit Resident Space Object Detection. In Proceedings of the Advanced Maui Optical and Space Surveillance (AMOS) Technologies Conference, Maui, HI, USA, 11–14 September 2018; Available online: https://amostech.com/TechnicalPapers/2018/Space-Based_Assets/Clemens.pdf (accessed on 18 January 2024).
  20. Clark, R.; Fu, Y.; Dave, S.; Lee, R. Simulation of RSO images for space situation awareness (SSA) using parallel processing. Sensors 2021, 21, 7868. [Google Scholar] [CrossRef] [PubMed]
  21. PYNQ-Z1 Reference Manual. Digilent. Available online: https://digilent.com/reference/programmable-logic/pynq-z1/reference-manual?redirect=1 (accessed on 18 January 2024).
  22. Datasheet MicroSD Card 3TE4 Series; Innodisk: New Taipei City, Taiwan, 2021; pp. 1–2. Available online: https://www.innodisk.com/en/products/flash-storage/sd-card-and-microsd-card/microsd-card-3te4 (accessed on 18 January 2024).
  23. A Guide to Speed Classes for SD and microSD Cards. Kingston Technology. Available online: https://www.kingston.com/en/blog/personal-storage/memory-card-speed-classes (accessed on 18 January 2024).
  24. Raspberry Pi 4 Model B Datasheet. Raspberry Pi Foundation. Pencoed, Wales. Available online: https://www.raspberrypi.com/products/raspberry-pi-4-model-b/ (accessed on 18 January 2024).
  25. IDS UI-3370CP Rev. 2 Camera. IDS Imaging Inc. Obersulm, Gernmany. Available online: https://en.ids-imaging.com/store/ui-3370cp-rev-2.html (accessed on 18 January 2024).
  26. Telephoto Lens for Raspberry Pi HQ Camera. Adafruit Industries. Available online: https://www.adafruit.com/product/4562 (accessed on 18 January 2024).
  27. Datasheet SanDisk Extreme MicroSD. SanDisk. Available online: https://documents.westerndigital.com/content/dam/doc-library/en_us/assets/public/sandisk/product/memory-cards/extreme-uhs-i-microsd/data-sheet-extreme-uhs-i-microsd.pdf (accessed on 18 January 2024).
  28. Thermocouple Amplifier MAX31855 Breakout Board (MAX6675 Upgrade). Adafruit Industries. Available online: https://www.adafruit.com/product/269 (accessed on 18 January 2024).
  29. Thermocouple Type-K Glass Braid Insulated Stainless Steel Tip. Adafruit Industries. Available online: https://www.adafruit.com/product/3245 (accessed on 18 January 2024).
  30. Batin, F.F.; Bautista, R.A.; Dela Cruz, R.A.; Kalaw, J.; Martinez, F.K.; Tucio, P. Bortle Scale: A Way to Assess and Monitor the Urban Nightsky. 2021. Available online: https://www.researchgate.net/publication/360538981_Bortle_scale_A_way_to_assess_and_monitor_the_urban_nightsky (accessed on 18 January 2024).
  31. IRAF Zscale Scaling Algorithm. Center for Astrophysics. Available online: https://js9.si.edu/js9/plugins/help/scalecontrols.html (accessed on 18 January 2024).
  32. Chianelli, G.; Kunalakantha, P.; Myhre, M.; Lee, R.S.K. A Dual-Purpose Camera for Attitude Determination and Resident Space Object Detection on a Stratospheric Balloon. Sensors 2024, 24, 71. [Google Scholar] [CrossRef] [PubMed]
  33. Yale Bright Star Catalog. Harvard University. Available online: http://tdc-www.harvard.edu/catalogs/bsc5.html (accessed on 18 January 2024).
  34. Lohmann, A. Star Imager For Nanosatellite Applications. 2017. Available online: https://yorkspace.library.yorku.ca/server/api/core/bitstreams/50ecf197-cbc3-4503-8f34-c21f5456725d/content (accessed on 18 January 2024).
  35. Crassidis, J.L. Angular Velocity Determination Directly from Star Tracker Measurements. J. Guid. Control. Dyn. 2002, 25, 1165–1168. [Google Scholar] [CrossRef]
  36. Shell, J.R. Optimizing orbital debris monitoring with optical telescopes. In Proceedings of the Advanced Maui Optical and Space Surveillance (AMOS) Technologies Conference, Maui, HI, USA, 14–17 September 2010; Available online: https://amostech.com/TechnicalPapers/2010/Systems/Shell.pdf (accessed on 18 January 2024).
  37. About Dynamic. Excelitas PCO Knowledge Base. Available online: https://www.excelitas.com/sites/default/files/2023-01/PCO_WhitePaper_About%20Dynamic.pdf (accessed on 18 January 2024).
  38. Harris, W.E. A Comment on Image Detection and the Definition of Limiting Magnitude. Publ. Astron. Soc. Pac. 1990, 102, 949–953. [Google Scholar] [CrossRef]
  39. Astrometry.net. Available online: https://nova.astrometry.net/ (accessed on 18 January 2024).
  40. Stetson, P.B. Daophot: A Computer Program for Crowded-Field Stellar Photometry. Publ. Astron. Soc. Pac. 1987, 99, 191. [Google Scholar] [CrossRef]
  41. Perryman, M.A.C.; Lindegren, L.; Kovalevsky, J.; Hoeg, E.; Bastian, U.; Bernacca, P.L.; Crézé, M.; Donati, F.; Grenon, M.; Grewing, M.; et al. The HIPPARCOS Catalogue. Astron. Astrophys. 1997, 323, L49–L52. [Google Scholar]
  42. Ochsenbein, F.; Bauer, P.; Marcout, J. The VizieR database of astronomical catalogues. Astron. Astrophys. Suppl. Ser. 2000, 143, 23–32. [Google Scholar] [CrossRef]
  43. The Life Cycle of Celestial Objects Exhibit. McIntosh Gallery, Western University. Available online: https://www.events.westernu.ca/events/mcintosh-gallery/2023-09/opening-reception-the-life.html (accessed on 18 January 2024).
Figure 1. Star tracker prototype launched on a stratospheric balloon in 2022.
Remotesensing 16 00749 g001
Figure 2. RSONAR II Model; (a) RSONAR II CAD Model, (b) RSONAR II payload integrated on the gondola.
Remotesensing 16 00749 g002
Figure 3. RSONAR II harness diagram.
Remotesensing 16 00749 g003
Figure 4. Example of a sequence of PCO camera images captured from a field campaign. The red circle shows the location of the RSO as it transits. These images have been enhanced with the use of the Zscale algorithm.
Remotesensing 16 00749 g004
Figure 5. Block diagram outlining the closed-loop image acquisition application once the payload is powered on.
Remotesensing 16 00749 g005
Figure 6. Software block diagram of the STARDUST payload.
Remotesensing 16 00749 g006
Figure 7. Sample downlinked image enhanced with the Zscale algorithm.
Remotesensing 16 00749 g007
Figure 8. An illustration of the RSO detection algorithm’s processing steps, taking the lit pixels corresponding to RSOs in 3 different images and associating them together into a detection. The red, green, and blue pixels represent the centroids of the RSO from the first, second, and third image, respectively.
Remotesensing 16 00749 g008
Figure 9. The distribution of time delays between images during high-resolution 2048 × 2048 imaging, with the frequency of occurrences on the Y-axis and the time difference in milliseconds on the X-axis. The mode (460 ms), median (470 ms), and mean (593.28 ms) are indicated by the red dashed, green solid, and orange dash-dotted lines, respectively.
Remotesensing 16 00749 g009
Figure 10. The graph illustrates temperature fluctuations of various components during the mission flight on 22 August 2023, from 4:52 a.m. to 9:34 a.m. (UTC). Notably, both the payload and the environment experienced significant temperature changes in the initial two hours. Subsequently, the temperature of all components stabilized as the flight coasted at the targeted altitudes, with only minor temperature fluctuations observed.
Remotesensing 16 00749 g010
Figure 11. Plot of limiting magnitude over integration time for RSONAR II sensors.
Remotesensing 16 00749 g011
Figure 12. The histogram displays the frequency of stars detected at different magnitudes (brightness levels) in the Johnson V (visual) band, with two datasets represented: subpayload 1 in blue and subpayload 2 in red. The x-axis represents the magnitude (Johnson V), a logarithmic scale used to measure the brightness of stars, while the y-axis indicates the frequency of stars at the detection’s magnitude ranges.
Remotesensing 16 00749 g012
Figure 13. (a) Subpayload 1 and (b) subpayload 2 display parts of the Pisces constellation captured by subpayloads 1 and 2, respectively, towards the end of their operational period during flight.
Remotesensing 16 00749 g013
Figure 14. Contrast maps for (a) subpayload 1 and (b) subpayload 2 capturing the same starfield, which reveal the variations in local contrast across each sensor’s image. Brighter squares indicate areas of higher contrast, likely corresponding to celestial bodies, against the darker background of space.
Remotesensing 16 00749 g014
Figure 15. Two histograms are presented, each in log scale, representing the distribution of pixel intensities from the minimum to maximum pixel values in the images: (a) a 16-bit image from subpayload 1, and (b) an 8-bit image from subpayload 2, respectively.
Remotesensing 16 00749 g015
Figure 16. The Life Cycle of Celestial Objects Pts. 1 & 2: (a) RSONAR II payload display; (b) some of the etched messages seen through magnifying glass.
Remotesensing 16 00749 g016
Table 1. RSONAR II Mass Budget.
ItemMass (Grams)
Payload components2236.3
Fasteners (screws, nuts, and washers)150.0
Aluminum Parts and Frames (main body)1428.9
Interface Plate1488.0
Total Mass5303.2
Table 2. RSONAR II Power Budget.
NominalPeakInputNominalPeak
Current (A)Current (A)Voltage (V)Power (W)Power (W)
Subpayload 10.370.392810.3610.92
Subpayload 20.290.34288.129.52
Total Power (W)18.4820.44
Table 3. Key specifications of four imagers (AURICAM™, PCO, FAI, and IDS) are compared to illustrate the similarities in FOV and pixel size.
CharacteristicAURICAM™PCOFAIIDS
Number Of Pixels 2048 2 2048 2 256 2 2048 2
Pixel size (µm)5.56.5265.5
Field-of-View (degrees)3529.62641
Focal Length (mm)25256.8916
Table 4. A detailed comparison of two cameras, PCO and IDS, based on various characteristics relevant to stellar observations from 2048 × 2048 images.
CharacteristicPCOIDS
Pixel Scale (arcsec/pixel)52.372.1
Central Right Ascension (degrees)1.0121.170
Central Declination (degrees)9.81610.757
Orientation (East of North in degrees)−153.6153.4
Radius (degrees)21.05629.004
Table 5. Comparison between the PCO camera and IDS camera on a variety of metrics.
PCO Panda 4.2IDS UI-3370CP-M-GL
Analysis Period (min)9292
Total Images13,47721,817
Exposure Time (ms)100100
Resolution (pixels × pixels)2048 × 2048, 1024 × 10242048 × 2048
FOV (deg × deg)29.6 × 29.641 × 41
Unique RSOs Detected24511
Total RSO Detections30,855669
Disclaimer/Publisher’s Note: The statements, opinions and data contained in all publications are solely those of the individual author(s) and contributor(s) and not of MDPI and/or the editor(s). MDPI and/or the editor(s) disclaim responsibility for any injury to people or property resulting from any ideas, methods, instructions or products referred to in the content.