Article

Scattering Field Intensity and Orbital Angular Momentum Spectral Distribution of Vortex Electromagnetic Beams Scattered by Electrically Large Targets Comprising Different Materials

School of Physics, Xidian University, Xi’an 710071, China
*
Author to whom correspondence should be addressed.
Remote Sens. 2024, 16(5), 754; https://doi.org/10.3390/rs16050754
Submission received: 14 December 2023 / Revised: 11 February 2024 / Accepted: 17 February 2024 / Published: 21 February 2024
(This article belongs to the Section Engineering Remote Sensing)

Abstract

:
In this study, we obtained the intensity and orbital angular momentum (OAM) spectral distribution of the scattering fields of vortex electromagnetic beams illuminating electrically large targets composed of different materials. We used the angular spectral decomposition method to decompose a vortex beam into plane waves in the spectral domain at different elevations and azimuths. We combined this method with the physical optics algorithm to calculate the scattering field distribution. The OAM spectra of the scattering field along different observation radii were analyzed using the spiral spectrum expansion method. The numerical results indicate that for beams with different parameters (such as polarization, topological charge, half-cone angle, and frequency) and targets with different characteristics (such as composition), the scattering field intensity distribution and OAM spectral characteristics varied considerably. When the beam parameters change, the results of scattering from different materials show similar changing trends. Compared with beams scattered by uncoated metal and dielectric targets, the scattering field of the coating target can better maintain the shape and OAM mode of beams from the incident field. The scattering characteristics of metal targets were the most sensitive to beam-parameter changes. The relationship between the beam parameters, target parameters, the scattering field intensity, and the OAM spectra of the scattering field was constructed, confirming that the spiral spectrum of the scattering field carries the target information. These findings can be used in remote sensing engineering to supplement existing radar imaging, laying the foundation for further identification of beam or target parameters.

1. Introduction

In the 1990s, Allen demonstrated that vortex beams, i.e., light beams with a helical phase structure, carry significant orbital angular momentum (OAM) and thus have an additional degree of freedom when compared with conventional plane waves [1]. Vortex light beams have found applications in fields such as high-capacity optical communication [2,3,4,5], rotating object detection [6,7,8], optical tweezers [9,10], and laser processing [11]. In 2007, Thidé et al., applied OAM to a radiofrequency (RF) field [12]. Subsequently, research has been conducted on the role of OAM in RF vortex beam generation [13,14,15,16,17], wireless communication [18,19,20,21], radar imaging [22,23,24,25], and detection and recognition [26].
Vortex electromagnetic (EM) beams have been investigated because of their unique helical phase structure, which may be superior to plane waves for information transmission and radar imaging. The acquisition of target scattering information is an indispensable part of the latter. It is possible to detect the feature parameters of a target by analyzing its scattering echo. OAM-based radars obtain scattering-echo information more easily than conventional radars.
The study of vortex beams scattered by electrically large targets is still in its infancy. In 2011, Mitri investigated the scattering field of a homogeneous dielectric sphere, illuminated by a high-order Bessel vortex beam using the surface integral equation method [27]. Subsequently, Liu et al., defined the OAM radar cross-section, compared it with the conventional radar cross-section (RCS), and calculated the backward scattering from several typical metallic targets [28]. Using the series expansion method, Wu et al., investigated the scattering of OAM waves using a metallic sphere [29]. Later in 2022, the scattering characteristics of a vortex beam incident on a metallic sphere [30] and an electrically large aircraft [31] were investigated using the physical optics (PO) method in conjunction with the angular spectrum expansion method. Zhang et al. [32] analyzed in detail the theoretical scattering of OAM waves incident on typical targets; in particular, they simulated and analyzed the scattering characteristics of a perfect electric conductor and dielectric targets. It was found that the target RCS was greater for vortex-beam incidence than for plane-wave incidence. Chen et al. discussed the near-field scattering characteristics of a vortex beam incident on metal targets [33].
The OAM spectrum encapsulates the spiral phase information in a field and is often used to detect turbulent transport in oceans and the atmosphere [34,35,36]. It can also be used to detect the spiral phase distribution of scattering fields for vortex beam scattering; however, insufficient research has been conducted on this topic and on the estimation of target information from spiral spectral distributions. In 2012, Petrov et al. [37] investigated the spiral spectra of scattering from transparent dielectric spheres illuminated by Laguerre–Gaussian light beams. They found that scattering data could be used to determine the positions and other geometrical properties of the spheres. The scattering effects of vortex beams scattered by multilayer chiral spheres were investigated in [38], and the phase distortion and OAM spectra of the beams after particle scattering were analyzed. In 2020, Liu et al. [39] used the PO algorithm to investigate the backscattering characteristics of conductive spheres and cones under vortex-beam illumination. After sampling the phase of the scattering field along a circle with a fixed radius, they concluded that the scattering field of a symmetric object was still a vortex field with the same topological charge as the incident field. Recently, Shi and her co-workers discussed a difference-sampling method that covered the entire region and line path along a specific radius. They found that, unlike sampling along a certain radius, whole-region sampling could accurately represent the particle scattering results [40]. In a previous study, we investigated the scattering characteristics of on- and off-axis vortex beams scattered by differently shaped targets. We found that when the off-axis degree of the beam or the topological charge carried by the beam increased, the scattering field was distorted and the OAM spectrum was aliased. For asymmetric targets, spectral aliasing occurred even when the beam was on the incidence axis [41].
The scattering characteristics of arbitrarily shaped targets on electrically large scales are investigated in the present study. Different intensities and phases are produced when the vortex beam is incident on triangular patches of the target surface. The coherent superposition of the scattering fields causes the phase of the scattering electric field to become more complex and variable. Unlike the simply shaped particles in [40], the targets in this study require that the OAM spectrum corresponding to different radii be described in detail. Use of the OAM spectrum description method in [40] may result in significant information loss. Therefore, we adopted a method to calculate the scattering OAM spectral distribution for different radii. This method can provide more data, which are beneficial for subsequent identification and inversion.
In this study, the angular spectral decomposition method was used in conjunction with the PO algorithm to establish a reliable theoretical model for simulating and analyzing the EM scattering characteristics of vortex beams that illuminate targets made of different dielectric materials. The vortex beams were first expanded into a series of plane waves in different directions. The scattering of these plane waves by targets comprising different materials was then calculated, and the results were superimposed to obtain effective feature information, such as the scattering field intensity and OAM spectra of the target under incident vortex beams. Further, the target and beam information can be inferred and inverted from the differences in the scattering field intensity and the OAM spectrum of the vortex beam in the receiving plane. The eventual goal is to construct a reference database that will allow accurate comparisons and references for the remote sensing, detection, and recognition of different dielectric material targets. The main contributions of this study are as follows:
  • A calculation method for analyzing the scattering of a polarized transmitting and receiving vortex beam by electrically large targets of varying materials is presented, utilizing the angular spectrum expansion technique. The impact of diverse polarization transmission and reception methods, as well as sampling directions, on the scattering field intensity and OAM spectrum, is thoroughly examined. It is suggested that target scattering data can be multi-dimensionally sampled to supplement the information required for target recognition. Based on this, the scattering field intensity and OAM spectra of different material targets under different incidence conditions are calculated and analyzed.
  • The correlation between the beam parameters, target parameters, the scattering field intensity, and the OAM spectra of the scattering field was constructed, confirming that the spiral spectrum of the scattering field carries the target information. It is proposed that the beam and target parameters can be inferred and inverted based on the differences in the scattering field intensity and OAM spectrum. A complete classification and recognition database based on the different scattering results can be established to lay the foundation for identifying different target geometries and dielectric properties.
The structure of the paper is as follows: Section 2 presents the PO algorithm based on the angular spectral expansion method and the theory of OAM spectrum calculations. In Section 3, the incident field distribution of the Bessel vortex is presented, and the effects of the state of polarization, reception method, and characteristic parameters of the targets and beam on the scattering field intensity and OAM spectrum are investigated. Finally, the conclusions are presented in Section 4.

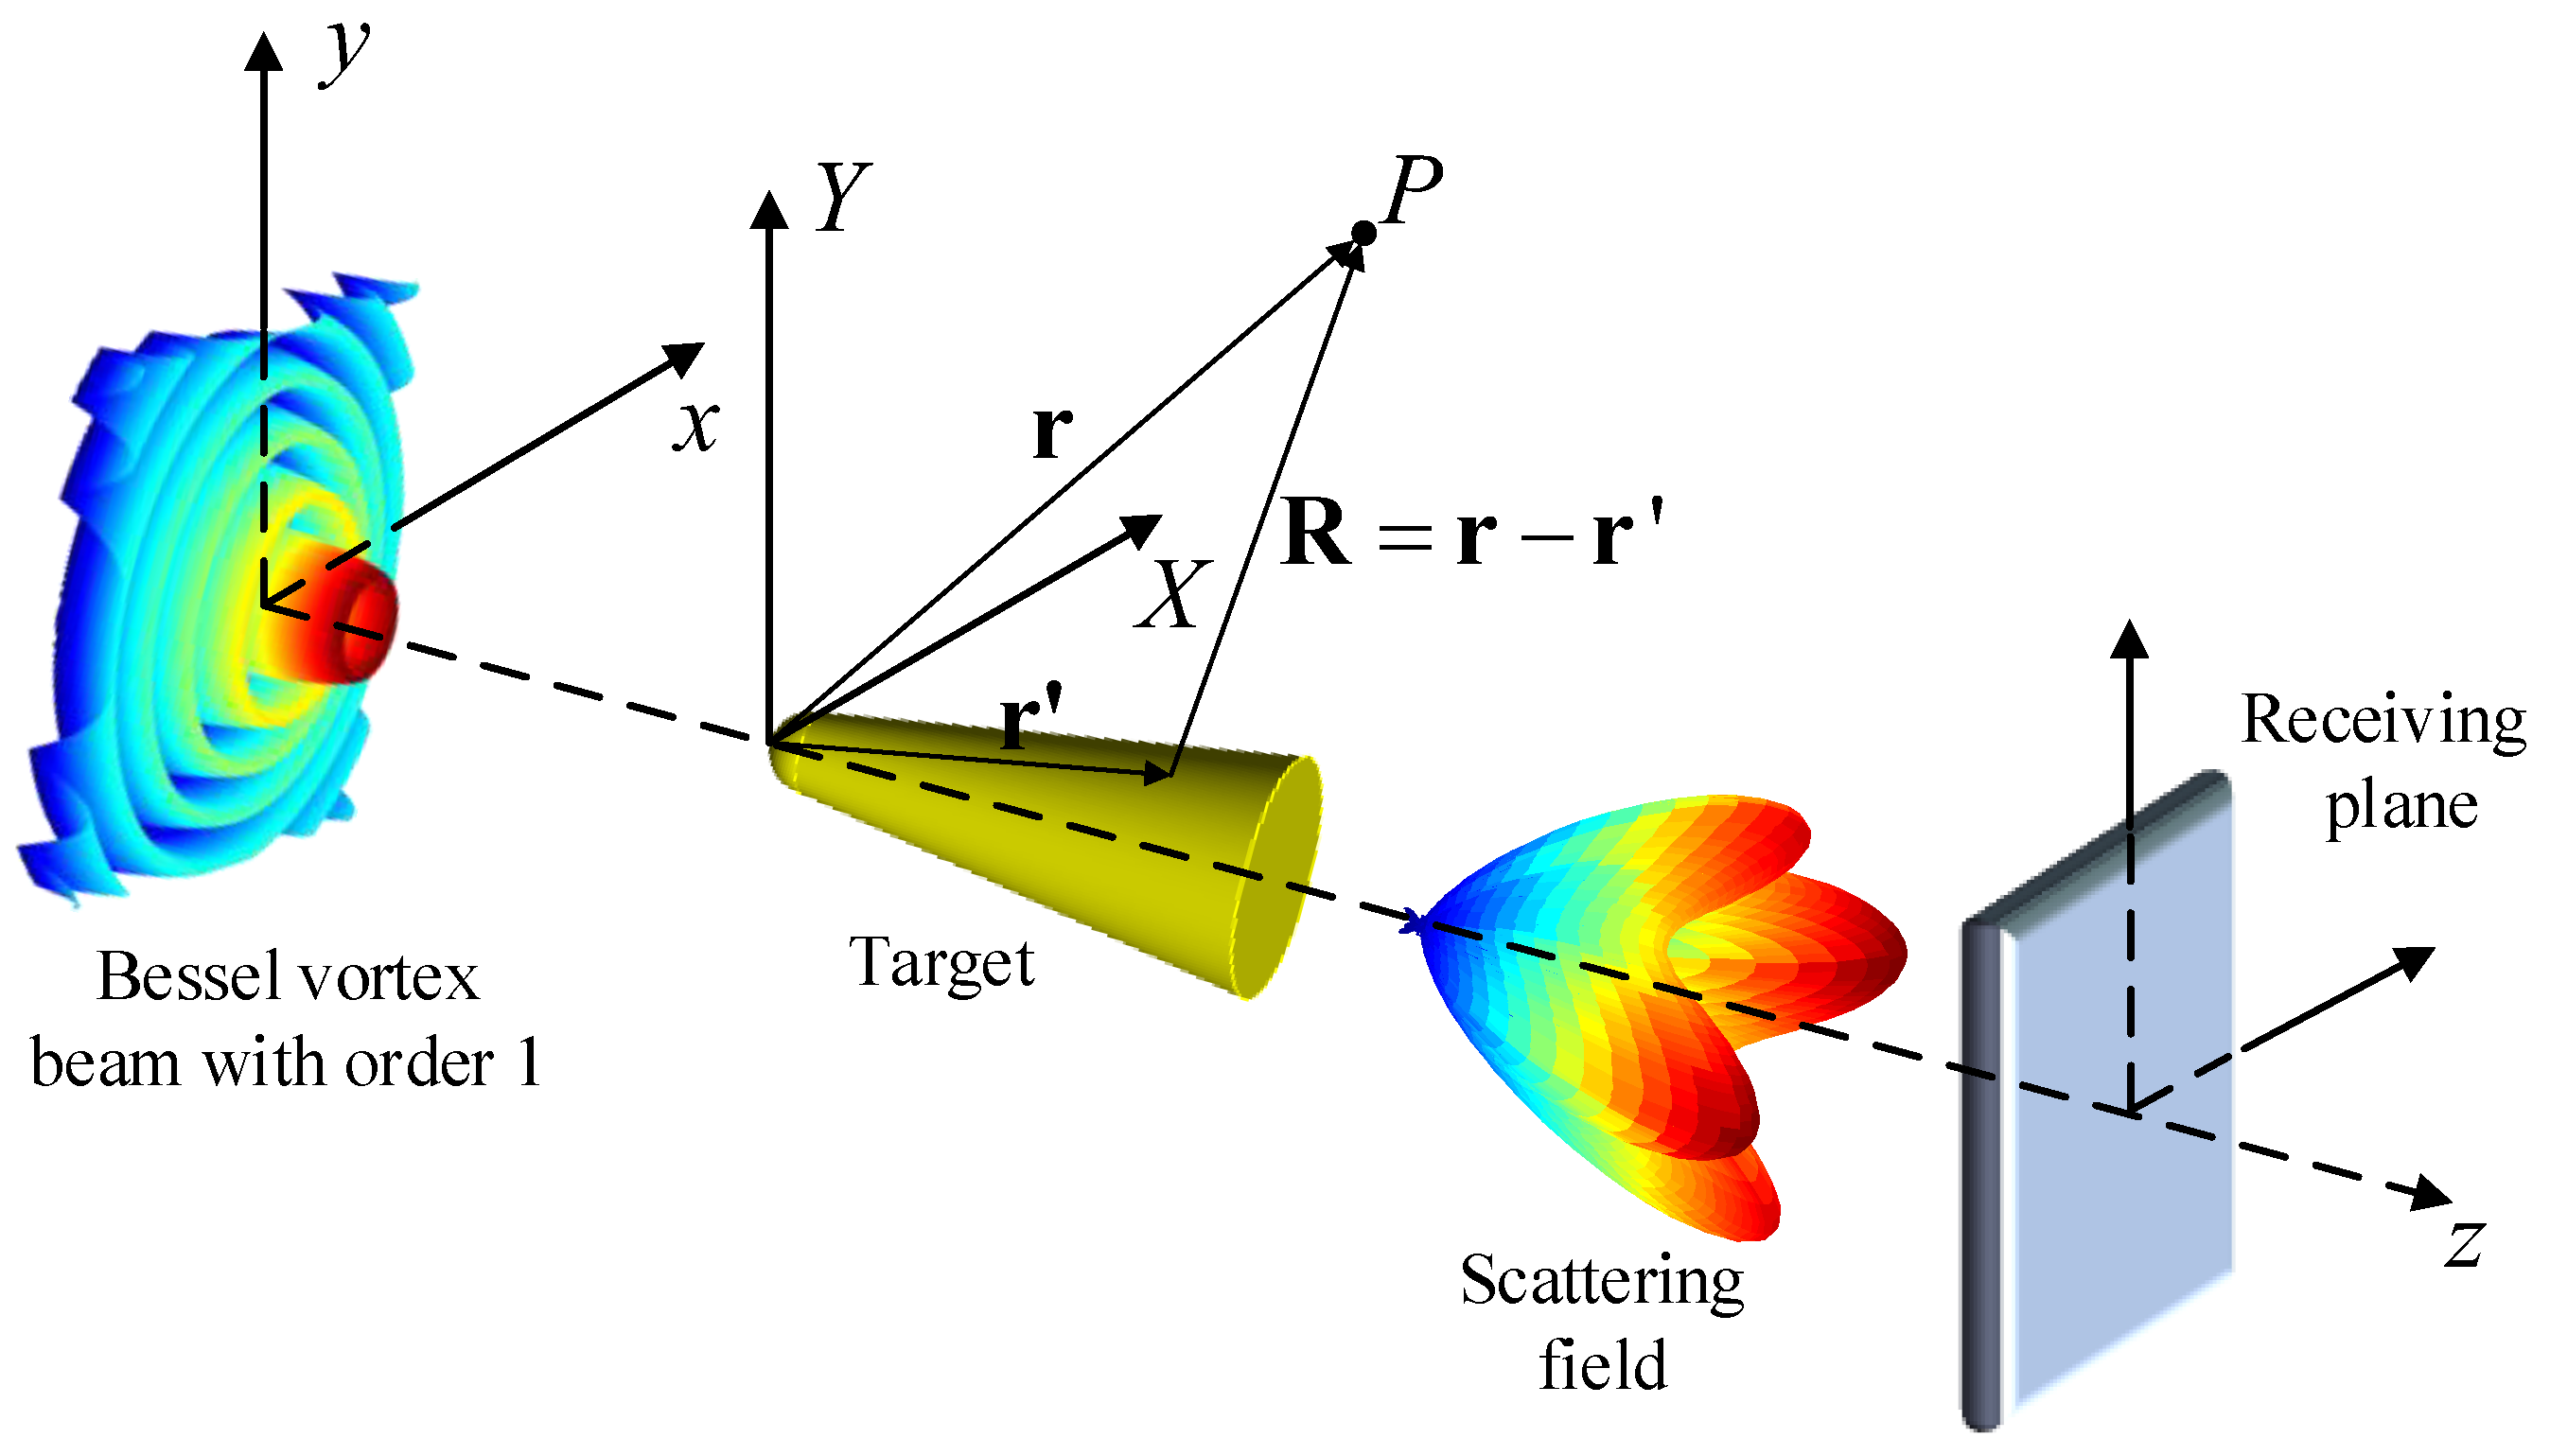
2. Theoretical Background

2.1. Angular Spectral Decomposition Method for Bessel Vortex Beam

Ideal Bessel vortex beams are considered in this study. They are the most commonly used vortex EM beams because of their good non-diffraction and self-healing properties and their directionality. The Bessel vortex beam constitutes an exact solution to the scalar Helmholtz wave equation. Its radial energy distribution is infinite, thus making it suitable for long-distance transmission. Moreover, a vortex electromagnetic beam with quasi-Bessel distribution can be generated using a uniform circular array antenna.
With the time-harmonic factor e i ω t , the scalar electric field of a Bessel vortex beam propagating along the +z direction in the cylindrical coordinate system ρ , φ , z is [42]
E B ρ , φ , z = J l k ρ ρ exp i l φ exp i k z z ,
where J l is the lth order cylindrical Bessel function of the first kind, ρ = x 2 + y 2 , and φ = arctan y / x . Additionally, k ρ = k sin θ 0 and k z = k cos θ 0 are the transverse and longitudinal components of the wavenumber k, respectively, where θ 0 is the half-cone angle of the Bessel beam. When z = 0, the scalar field of the Bessel beam in the initial plane becomes
E B ρ , φ , 0 = J l k ρ ρ exp i l φ .
With initial plane z = 0, the scalar field in a cylinder is E ρ , φ , z = 0 . The expression of the Bessel vortex beam in the spectral domain can be obtained using a two-dimensional Fourier transform as follows:
E ˜ θ , ϕ = 1 4 π 2 0 2 π 0 E ρ , φ , z = 0 exp i k ρ sin θ cos ϕ φ ρ d ρ d φ ,
where θ and ϕ are spherical coordinates in k-space. After additional calculations, the angular spectral amplitude of the Bessel vortex beam can be obtained:
E ˜ θ , ϕ = 1 4 π 2 0 J l k ρ ρ 0 2 π exp i l φ exp i k ρ sin θ cos ϕ φ d φ ρ d ρ = 1 2 π i l δ θ θ 0 k 2 sin θ 0 cos θ 0 exp i l ϕ .
The vector angular spectrum of the vortex-beam electric field can be represented by a scalar angular spectrum as follows:
E ˜ θ , ϕ = α x ^ + β y ^ 1 cos θ α sin θ cos ϕ + β sin θ sin ϕ z ^ E ˜ θ , ϕ ,
E ˜ x = α E ˜ ,
E ˜ y = β E ˜ ,
E ˜ z = 1 cos θ α sin θ cos ϕ + β sin θ sin ϕ E ˜ .
Using the relationship between the electric and magnetic fields H ˜ θ , ϕ = 1 η k × E ˜ θ , ϕ k , the angular spectrum of the magnetic field can be expressed as
H ˜ x = α 1 η sin 2 θ sin ϕ cos ϕ cos θ E ˜ β 1 η sin 2 θ sin 2 ϕ cos θ E ˜ β 1 η cos θ E ˜ ,
H ˜ y = α 1 η cos θ E ˜ + α 1 η sin 2 θ cos 2 ϕ cos θ E ˜ + β 1 η sin 2 θ sin ϕ cos ϕ cos θ E ˜ ,   and
H ˜ z = β 1 η sin θ cos ϕ E ˜ α 1 η sin θ sin ϕ E ˜ ,
where α and β are the polarization coefficients that determine the polarization state of the vortex beam. Specifically, when the time-harmonic factor is e i ω t , the ( α , β ) pairs (1, 0), (0, 1), 1 , i / 2 , and 1 , i / 2 correspond to x-linear polarization (x-LP), y-linear polarization (y-LP), left-circular polarization (L-CP), and right-circular polarization (R-CP), respectively.
The electric and magnetic fields of the vortex beam can then be calculated using the inverse Fourier transform of the angular spectrum:
E ( ρ , φ , z ) = 0 π 0 2 π E ˜ ( θ , ϕ ) exp i k ρ sin θ cos ϕ φ exp ( i k cos θ z ) k 2 cos θ sin θ d θ d ϕ ,
H ( ρ , φ , z ) = 0 π 0 2 π H ˜ ( θ , ϕ ) exp i k ρ sin θ cos ϕ φ exp ( i k cos θ z ) k 2 cos θ sin θ d θ d ϕ .

2.2. Physical Optics Algorithm of an Electrically-Large Target Illuminated by Vortex Beam

The vector of the angular spectrum of the vortex beam represents the EM field components of a single plane wave propagating along a certain path θ , ϕ . By incorporating this into the PO algorithm, the scattering of plane waves at a certain angle θ , ϕ can be calculated, and the inverse Fourier transform can be performed to obtain the scattering result. Figure 1 schematically shows the problem under investigation. According to the Stratton–Chu formula, the scattering electric field at the observation point is given by [43]
E s = i k e i k r 4 π r S l R ^ × n ^ × E T η R ^ × n ^ × H T e i k R ^ r d S l ,
where k = 2 π / λ and η = μ 0 / ε 0 are the propagation constant and intrinsic impedance of free space, respectively; R ^ denotes a unit vector of the scattering direction; r is the facet-element position vector; and n ^ is the unit normal vector of the target surface. E T and H T are the total fields on the boundary:
E T = E i + E s ,
H T = H i + H s ,
where the superscripts i and s specify incident and scattering fields, respectively.
To obtain E T and H T , a local coordinate system is first defined (Figure 2). The incidence angle of the single plane wave is θ i , the corresponding wave vector is k ^ i = k X X ^ + k Y Y ^ + k Z Z ^ , and θ and ϕ are the elevation and azimuth angles of a single incident wave. Furthermore, e ^ = k ^ i × n ^ / k ^ i × n ^ is the direction of the incident electric field perpendicular to the plane of incidence, and e ^ i = e ^ × k ^ i and e ^ r = e ^ × k ^ r are the directions of the incident and reflected electric fields parallel to the plane of incidence, respectively.
After mathematical manipulations, the scattering fields become
E s = i k e i k r 4 π r 0 π 0 2 π S l R ^ × 1 + R E n ^ × e ^ + R 1 E cos θ i e ^ R ^ × 1 + R E n ^ × e ^ + 1 R E cos θ i e ^ e i k R ^ r d S l d θ d ϕ ,
where E = e ^ E ˜ ( θ , ϕ ) exp i k ρ sin θ cos ϕ φ exp ( i k cos θ z ) k 2 cos θ sin θ and E = e ^ i E ˜ ( θ , ϕ ) exp i k ρ sin θ cos ϕ φ exp ( i k cos θ z ) k 2 cos θ sin θ .
R and R are respectively the reflection coefficients of the transverse electric (TE) and transverse magnetic (TM) waves at the target surfaces of different materials and can be calculated using the following recurrence formulas [44]:
R n = A 1 + B 1 R n 1 M B 1 + A 1 R n 1 M ,
R n = A 2 + B 2 R n 1 M B 2 + A 2 R n 1 M ,
with
M = exp i 2 k β n 1 D n 1 R Y n 1 ,
A 1 = Z n 1 R Y n Z n R Y n 1 ,
B 1 = Z n 1 R Y n + Z n R Y n 1 ,
A 2 = Z n R Y n Z n 1 R Y n 1 ,
B 2 = Z n R Y n + Z n 1 R Y n 1 .
Here, β n = ε r n μ r n , Z n = μ r n / ε r n , and R Y n = 1 sin 2 θ i / ε r n μ r n , where ε r n and μ r n are the permittivity and permeability of the nth layer, respectively; R(n) is the reflection coefficient of the interface between the nth and (n − 1)th layers. When there is no dielectric coating on the outer surface of the target (i.e., only a metal layer and vacuum layer exist), R = 1 and R = 1 .

2.3. Spiral Spectral Expansion Method

Vortex beams carry OAM, which is related to the spiral phase. After interacting with the target, the phase distribution of the scattering field changes. To display the distribution and variation of the spiral phase visually, the OAM spectral distribution of the scattering field is calculated using the spiral spectral expansion [38,40]. Any field distribution can be expanded into the superposition of multiple spiral harmonics:
E φ = l = l = C l exp i l φ .
Here, C l is the weight coefficient
C l = 1 2 π 0 2 π E φ exp i l φ d φ .
The normalized weight of each OAM state of the vortex field distribution is
C l n = C l max ( C l ) , l , .

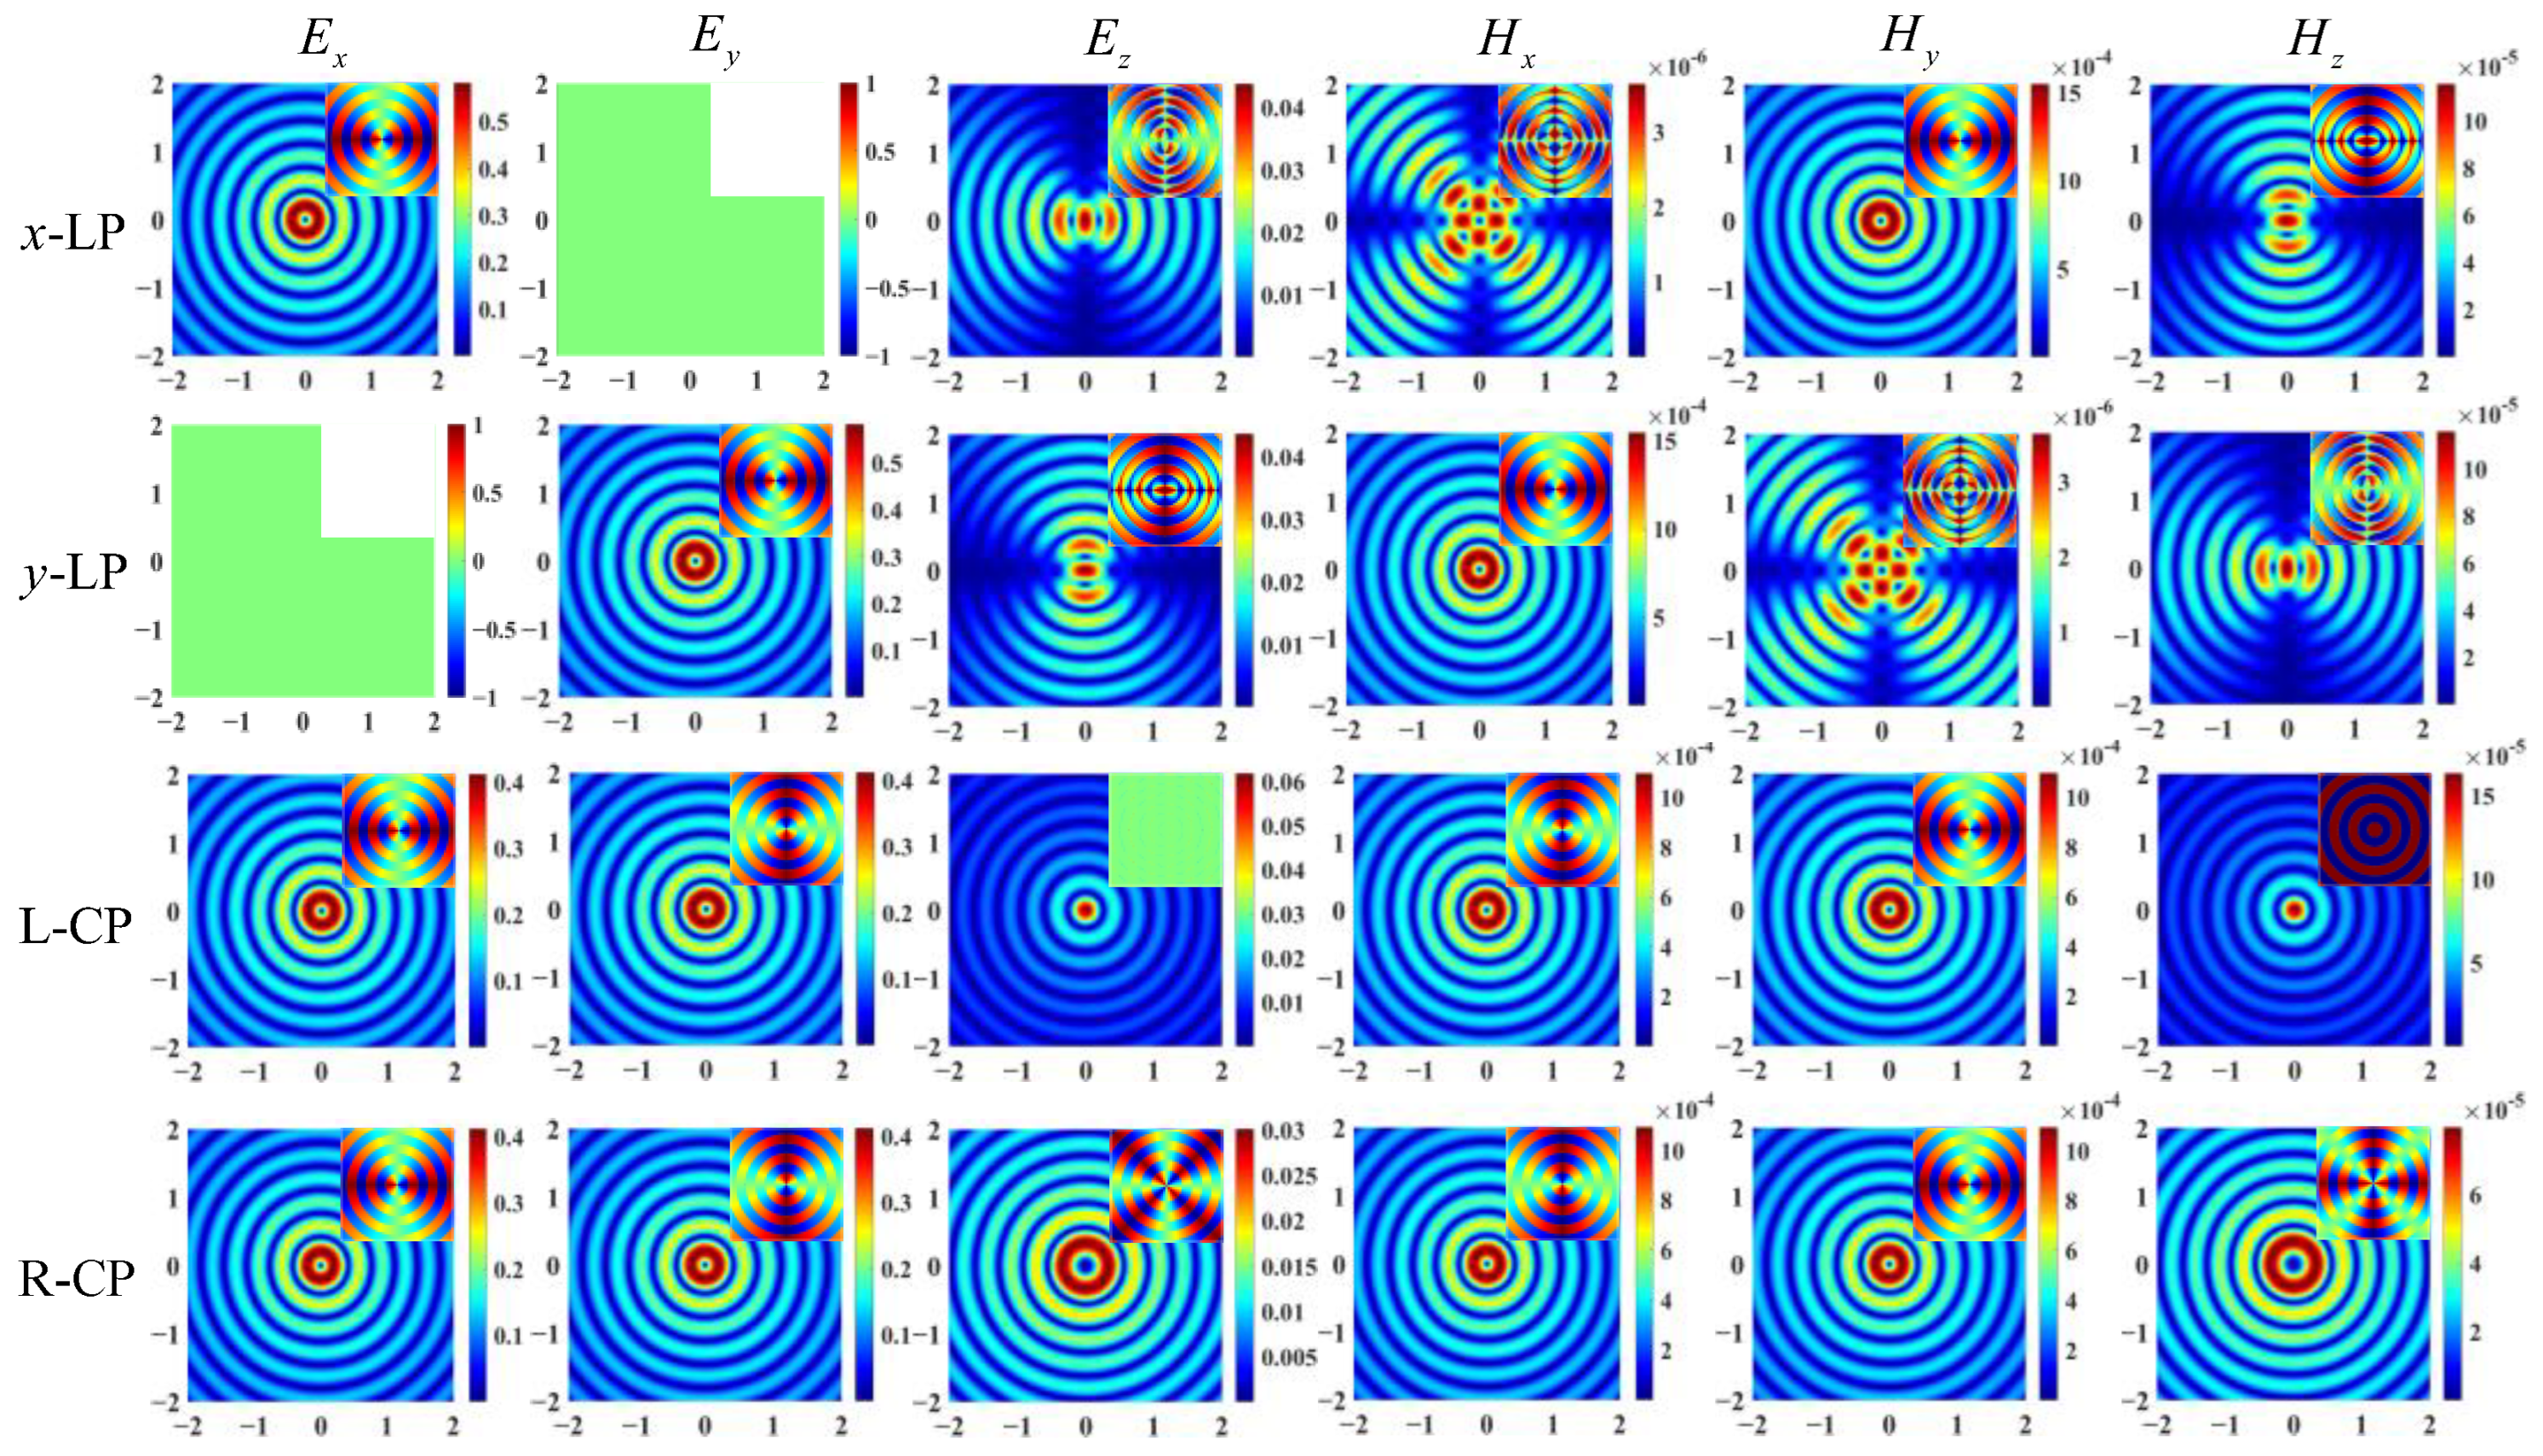
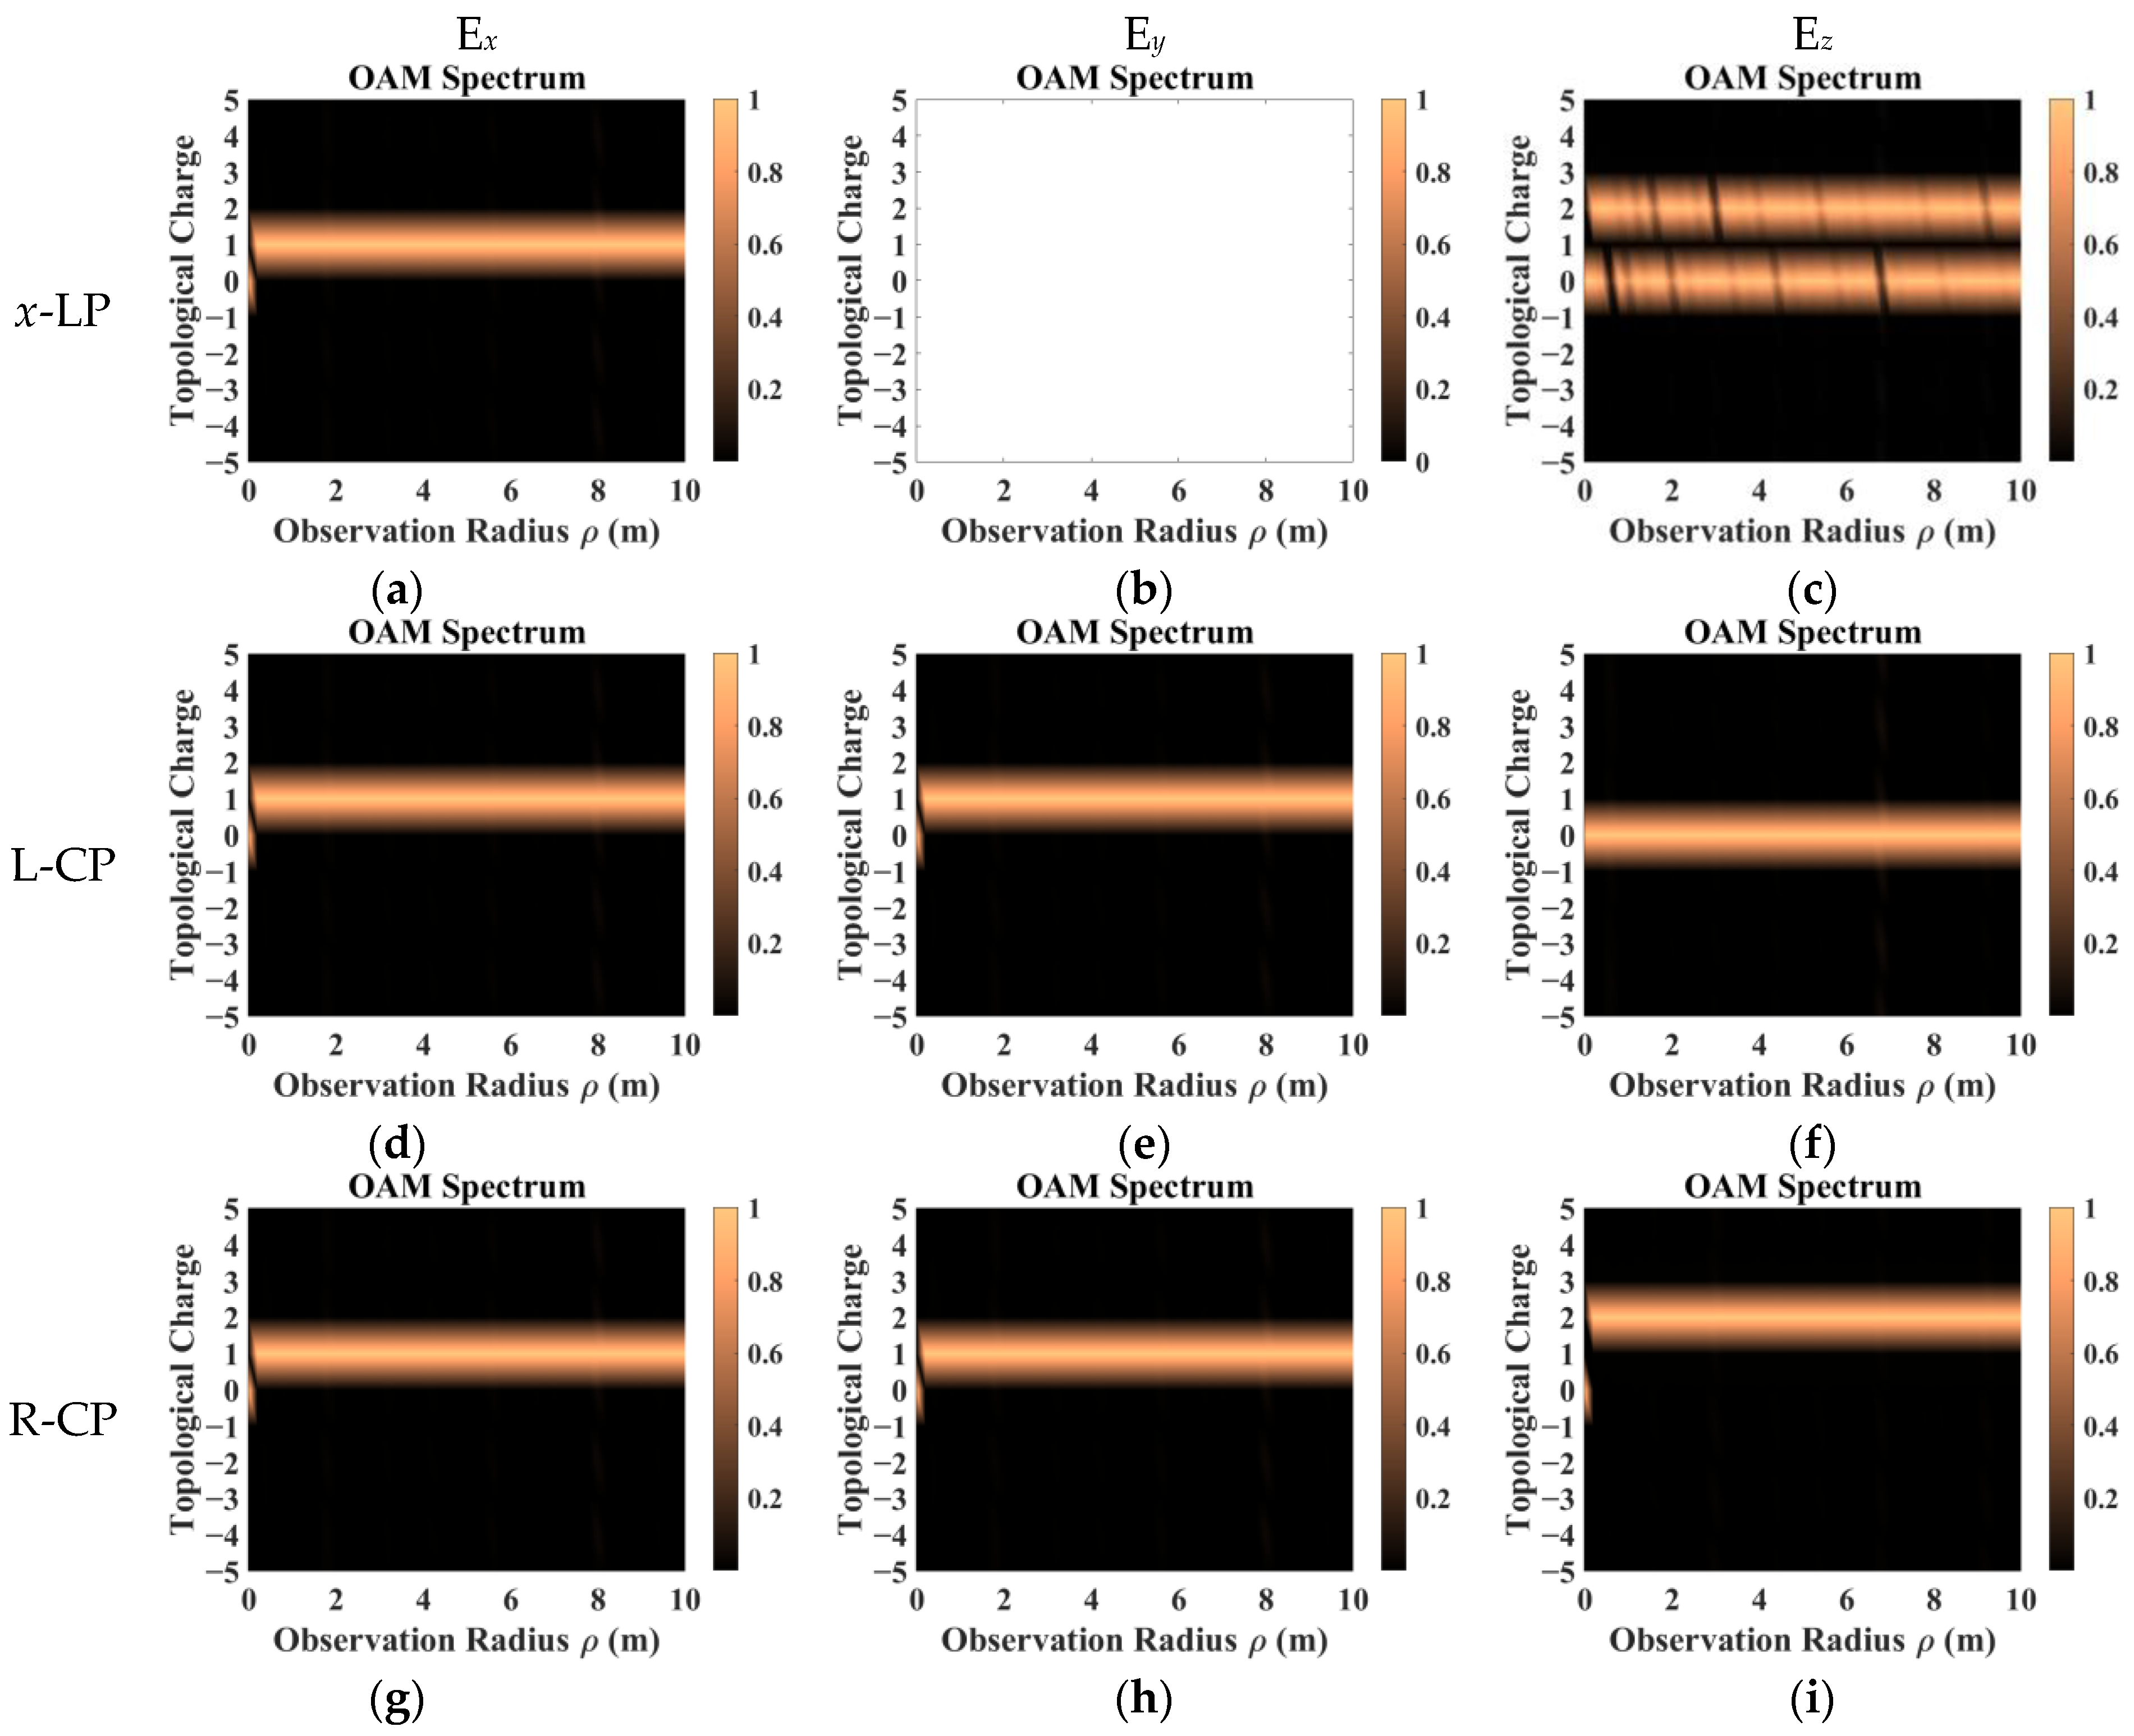
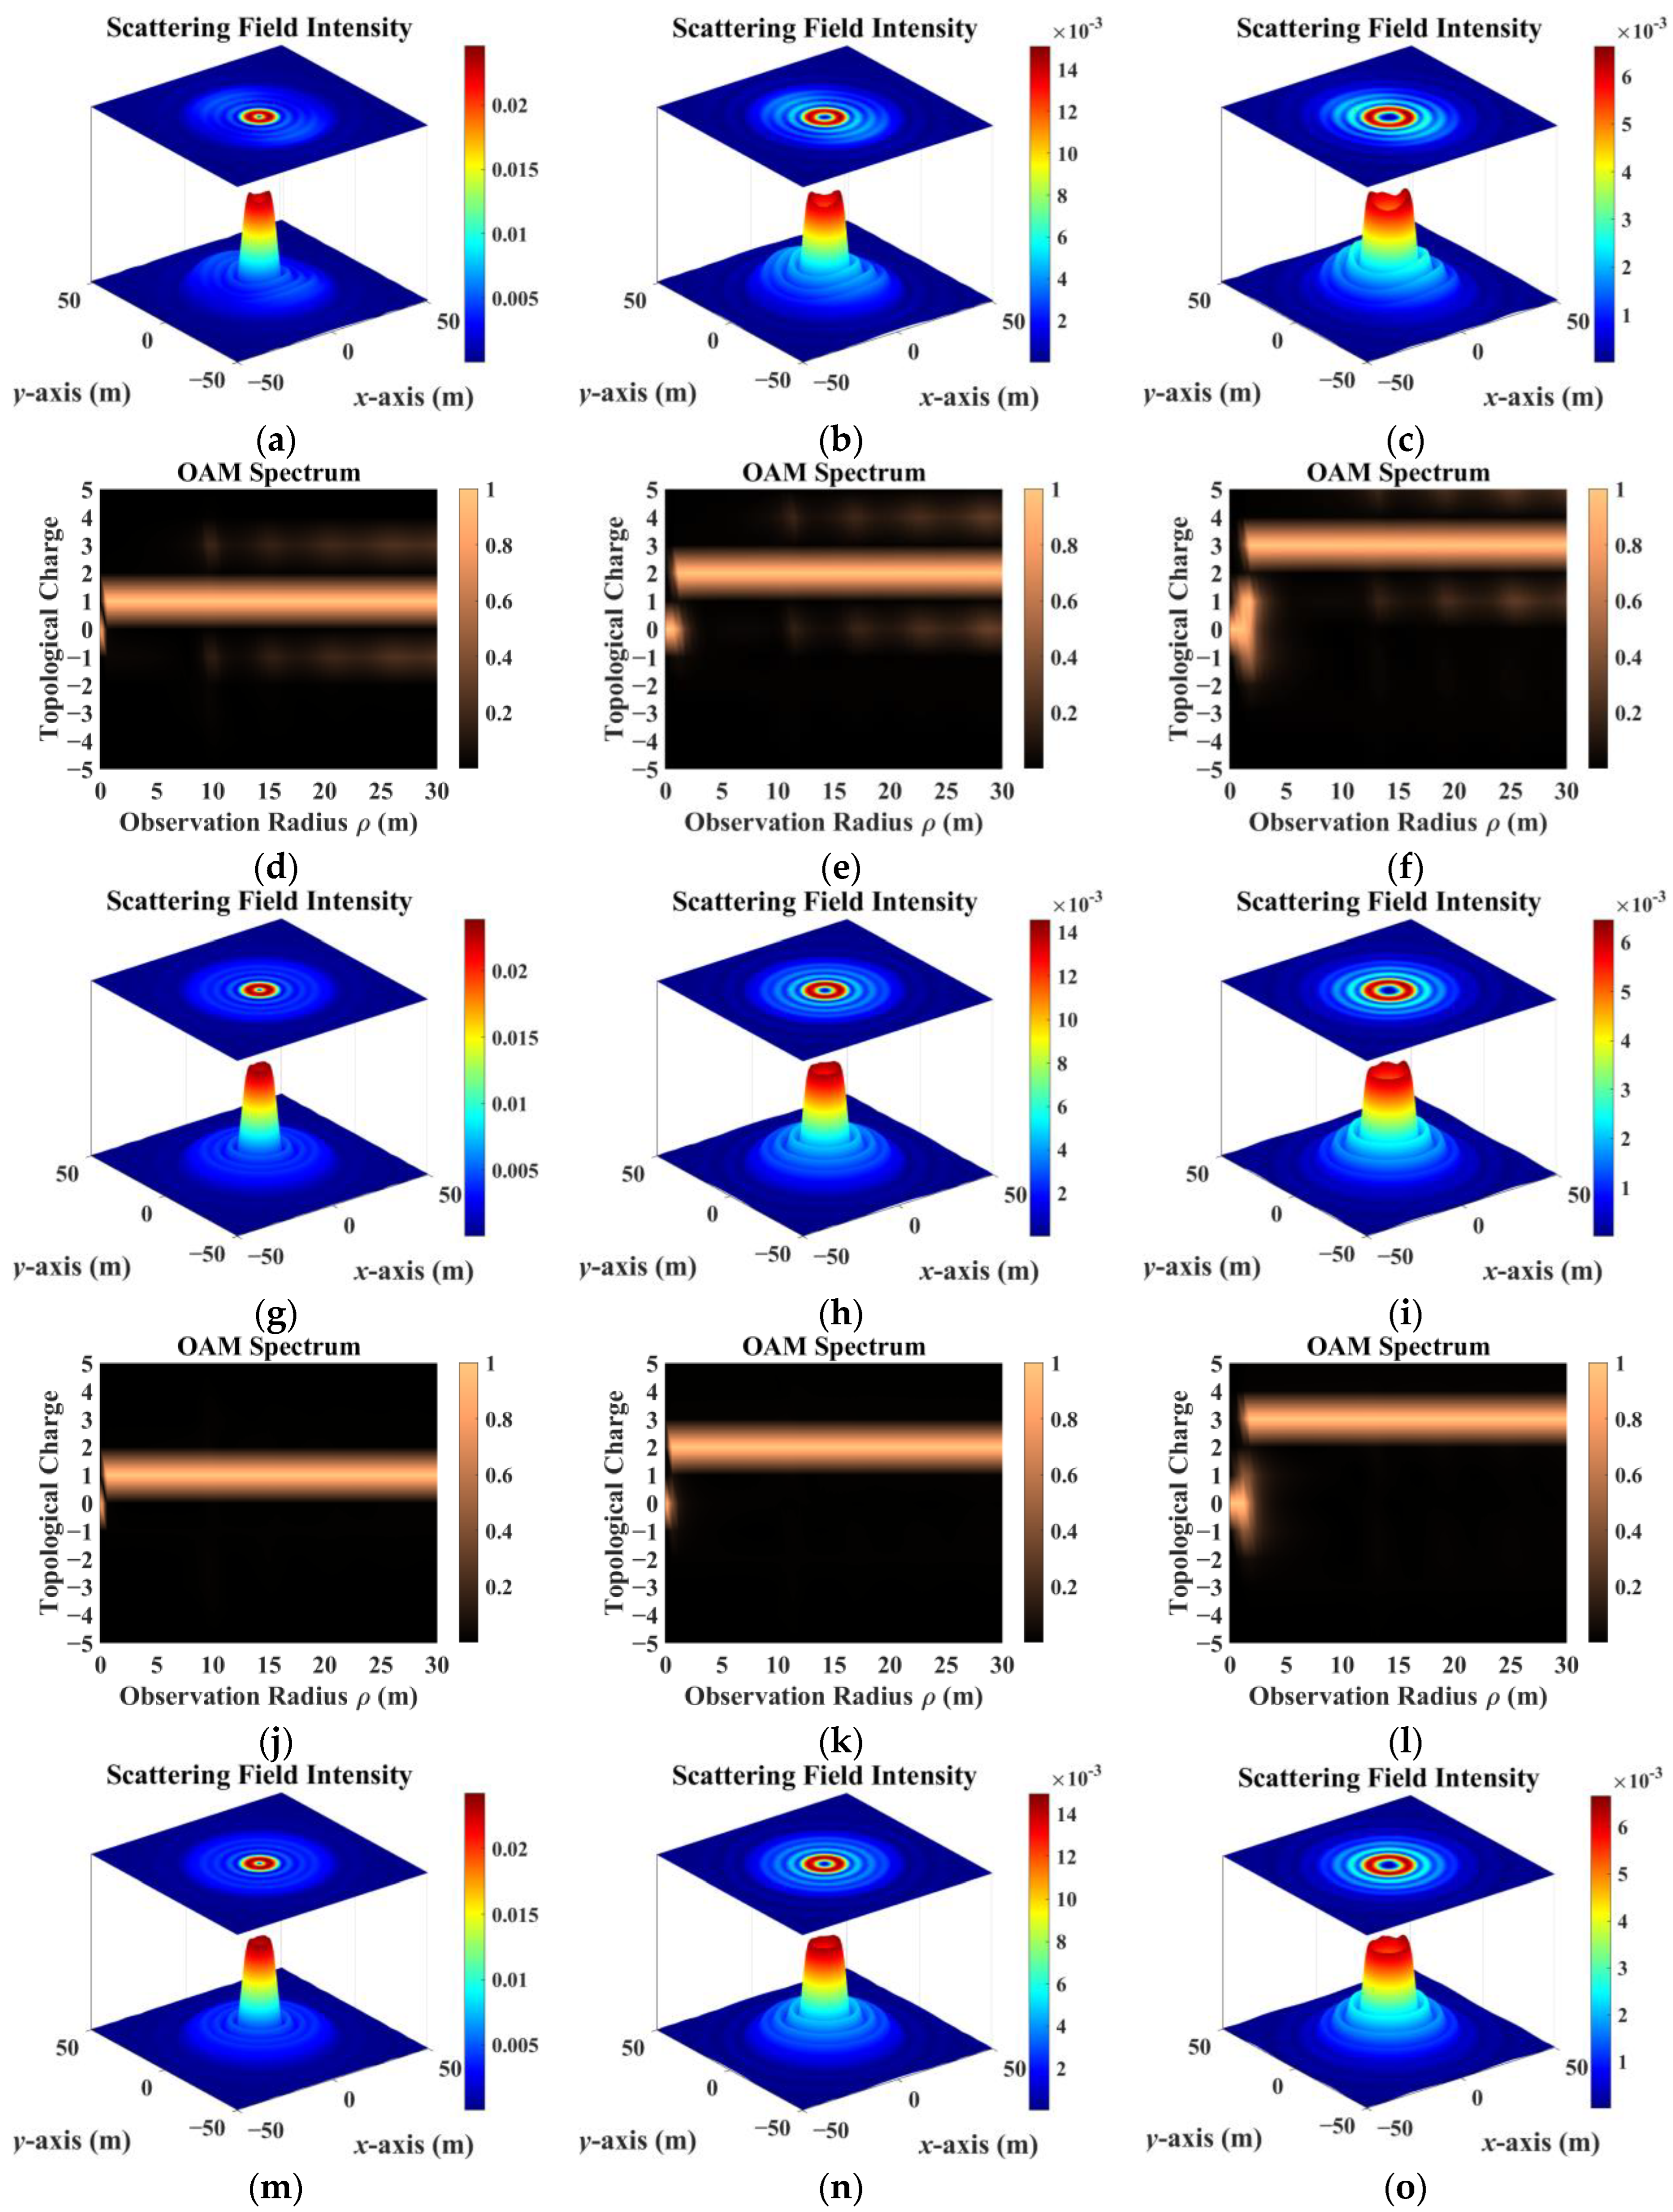
3. Simulation and Discussion

The inverse Fourier transform was performed to the vector angular spectrum, and the spatial distributions of the incident electric and magnetic fields in the initial xoy plane for the Bessel vortex beams with x-LP, y-LP, L-CP, and R-CP were calculated by Equations (12) and (13) and are shown in Figure 3. Their corresponding phases are shown as insets in the top-right corner. The beam parameters were set as f = 5 GHz, l = 1, and θ 0 = 5 ° . From the Figure, we can observe that all the intensity distributions of the electric and magnetic field components have axial symmetry, except for the y- and x-components of the electric field cases of the x-LP and y-LP beams, respectively. For the L-CP and R-CP beams, the electric and magnetic field distributions of the x- and y-components are similar, but the phase is shifted by π / 2 . The z-component distributions of the electric and magnetic fields of the L-CP beam are not hollow, and its maximum field intensity is larger than that of R-CP.
Additionally, the OAM spectra of all components of the incident vortex beam under different polarization conditions were calculated, and the results are presented in Figure 4. The electric field components were sampled along different receiving radii, and the Fourier transform was performed to obtain the proportion of each mode of the incident field. This method can digitally represent the OAM carried by a vortex field. The vortex beam used in this study is an ideal Bessel vortex beam. Therefore, the phase distribution shown in the top-right corner of Figure 3 is significantly perfect, and the number of changes in phase along different radius circles is completely consistent with the topological charge calculated in Figure 4. It can be concluded that the incident beam is a high-purity vortex beam.
Based on a radio attenuation measurement flight experiment reported by the National Aeronautics and Space Administration, an aircraft with a length of 1.3 m was selected as the target model for the research [45]. To illustrate the validity of the proposed algorithm, a validation example was used to compare the calculation results of the PO method with those of FEKO 2021 EM simulation software. The RCS (far field) and scattering field distributions of a perfect electric conductor (PEC) blunt cone and a PEC blunt cone coated with a single-layer dielectric were calculated using the PO method and FEKO; the results are presented in Figure 5. The receiving plane of the scattering field was located at z = 60 m, and the coating dielectric parameter was set to εr = 0.3 + 0.7i (coating thickness: 0.1 m). The dielectric parameters and coating thickness of the target were obtained according to NASA flight tests. The thickness of the plasma sheath during aircraft flight is about 0.1 m. Based on the plasma parameter measured during flight, the dielectric parameter of the coating was further calculated using the Drude model [45,46]. There is no ideal vortex beam excitation in FEKO 2021 simulation software. We imported the vortex beam EM field data into simulation software, and the near-field aperture field was used to equivalent the incident vortex beam. However, it is worth noting that this equivalent method will bring some errors. Therefore, in comparing the results calculated by the PO algorithm and FEKO, there is a slight difference in the scattering field intensity distribution in the peripheral region.
In radar systems, employing a multifrequency and multipolarization operating mode significantly enhances imaging quality and target-resolution capability. Therefore, after verifying the reliability of the results, we discuss the scattering field intensity and OAM spectral distribution of Bessel vortex beams with different polarizations to determine whether they can exhibit differences in target-characteristic parameters. The research target was a PEC blunt cone coated by a single-layer dielectric (coating thickness: 0.03 m, coating dielectric parameter: ε r = 1 . 3 + 3 . 2 i ); the blunt-cone size was consistent with the validation example. The beam parameters were set to f = 5 GHz, and the half-cone angle was θ 0 = 5 ° . First, we used co-polarization transmitting and receiving methods to obtain the scattering field. Figure 6 shows that the OAM mode of the scattering field remained consistent with that of the incident field when the receiving and transmitting polarization states were the same. The receiving field intensity distributions corresponding to the different polarizations were similar. This conclusion is consistent with the results of previous research [39,41]; that is, for symmetric targets, when the polarization of the receiving field is the same as that of the transmitting field, the topological charge of the scattering field is the same as that of the incident field. When x-linear polarization incidence occurs, other modal components also occupy a portion of the proportion. This is mainly manifested in modal components that are one bit apart from the incident mode; however, this phenomenon does not occur if the incident beam is circularly polarized.
Subsequently, the scattering electric field intensity and OAM spectral distribution in the x, y, and z directions of the receiving plane illuminated by vortex EM beams with different polarizations were investigated. The incident frequency was set to 5 GHz, the topological charge was l = 1, and θ 0 = 5 ° .The target parameters were consistent with Figure 6. Figure 7 shows that for x-LP incidence, the distribution of the scattering electric field in the x direction remained basically consistent with that of the incident field. The scattering electric field appeared in the y direction; the mode was different from that carried by the incident field, which was separated from the main incident mode (by single bits on both sides). In the cases of L-CP and R-CP incidence, the distributions of the scattering electric field in the x direction were similar to those in the y direction, but the phase was shifted by π / 2 . The main mode of the scattering OAM spectrum was consistent with the incident mode, and the submaximal modes appeared at single-bit distances from the main mode. A comparison of Figure 4 and Figure 7 shows that scattering did not have a significant impact on the OAM spectrum of the z component of a scattering electric field with arbitrary polarization. Hence, it can be concluded that as long as the spectral distribution in a certain direction is known, we may attempt to use it to infer the target and beam parameters.
Based on the above discussion, we selected the vortex beam with x-polarization incidence and the scattering field in the x direction for further research and analyzed the influences of the beam parameters on targets with different dielectric parameters. Three typical targets with different dielectric parameters, namely a PEC target, a dielectric target (dielectric parameter: ε r = 4 + 1.5 i ), and a coating target (coating thickness: 0.1 m, dielectric parameter ε r = 0 . 6 + 0 . 2 i ) [47], were selected. Figure 8 shows the scattering field intensities and the OAM spectral distributions (x-components) of vortex beams carrying different topological charges incident on PEC, dielectric, and coating targets. The incident frequency was set to 5 GHz, the topological charges were l = 1–3, and the half-cone angle was θ 0 = 5 ° . The receiving plane was located 60 m away from the target. For a more intuitive illustration, Figure 9 and Table 1 present the one-dimensional intensity distribution of the scattering field in the polarization direction and the total proportion of each mode on the sampling surface, respectively. The bold display in the table shows a special mode proportion of the scattering field, which is the same as the incident field mode. The scattering field intensity distributions differed for targets made of different materials. For all three targets, other modal values occurred as the observation radius increased. In particular, for the metal targets there were other obvious modes, whereas for the dielectric and coating targets there were not. Of the three targets, the coating target had the largest peak value of the scattering electric field, and the original incident mode was best maintained. With an increase in the topological charge, the scattering-field intensity distribution showed a clear outward diffusion trend. The total proportion of the modes in the scattering field, which was consistent with that of the incident mode, also decreased in all three cases. We found that the scattering field intensity and OAM spectra may reflect the characteristic parameters of the target, such as the type of target material and the coating method. Based on this, it may be possible to identify and invert the target parameters.
Like Figure 8, Figure 10 compares the effects of the half-cone angle on targets with different parameters. The topological charge was set to two, the half-cone angles were 2.8°, 10°, and 20°, respectively, and the other target parameters remained unchanged. It can be observed that as the half-cone angle increased, the scattering electric field intensity distribution exhibited a diffusion trend, and the peak intensity decreased. In addition, for the same half-cone angle, the peak scattering field of the coating target was the highest. This is because—despite the absorption of EM wave energy—the coating’s thickness increased the volume of the target, thus resulting in a larger scattering field. In addition, owing to the combined influence of the target size and the coating dielectric parameters, the purity of the scattering OAM spectrum along the radius distribution of the coating target was higher. An increase in the half-cone angle resulted in other larger modes at certain radii.
We also investigated whether the distance between the receiving plane and the target affected the intensity and spiral spectrum of the scattering field. The intensity distribution of the scattering field at different receiving distances is shown in Figure 11, in which the incident topological charge was l = 2, and the other beam and target parameters were the same as in Figure 8. As the receiving distance increased, the size of the scattering field increased and the energy decreased. It was found that although the incident beam was an ideal non-diffracted beam, the scattering field (after target scattering) underwent diffraction. The intensities of the scattering fields received by different receiving planes were different, and the field intensity gradually decreased at increasing receiving distances. The center position of the scattering field maintained the mode of the original incident field, and the scattering field at the center position gradually spread as a function of the receiving distance. Therefore, the different positions of the receiving plane obviously affect the observation results. If the computer’s computing power allows, a large enough observation surface size and sufficient scattering field calculation points should be selected. In this way, the scattering field energy can be received as much as possible to obtain more scattering information and improve recognition accuracy.
Figure 12 shows the influence of different offset distances on the scattering characteristics of the targets for different dielectric parameters. The incident frequency was set to 5 GHz, the topological charges were l = 2, and the half-cone angle was θ 0 = 5 ° . It can be observed that the scattering field and OAM spectral distributions of all the dielectric targets are also affected by changes in offset distance. The metal targets were the most sensitive to beam offset, thus causing more severe deformation of the scattering field and more significant crosstalk among OAM modes than did the dielectric and coating targets. At the same offset, the scattering field of the coating target could maintain the original vortex shape. Furthermore, the offset had a relatively small impact on scattering. The scattering field distribution was no longer symmetrical when the beam axis deviated from the target center. Moreover, because of the off-axis incidence of the beam, the intensity of the illumination at the center of the target was no longer zero, the position of the hollow region in the scattering field deviated, and the intensity at the central position was no longer the minimum value. This asymmetry also made the scattering OAM spectral distribution chaotic; as the degree of deviation increased, the OAM spectral confusion became more obvious.
As is commonly known, the impact of frequency on a beam is multifaceted, leading to variations in intensity distribution, hollow-region size, and other parameters. Based on this understanding, our study included an in-depth examination of the effects of incident frequency on target scattering and changes in the OAM spectrum. The results of this investigation are presented in Figure 13. Among them, the simulation parameters are the same as in Figure 12, except that the frequency f changes to 3 GHz, 5 GHz, and 10 GHz. The incident frequency not only affected the size of the scattering electric field but also changed the oscillation distribution of the scattering electric field. Figure 13 shows that as the frequency increased, the scattering electric field tended to contract, whereas the peak intensity also increased. Thus, when the frequency increased, the scattering energy distribution was more concentrated, which was consistent with the effect of the frequency increase on the incident field. Other modes may appear at smaller observation radii. The main mode had an absolute advantage in that it indicated the mode of the incident beam. The other modal values contributed less. The OAM spectrum of the coating targets was the least affected by frequency changes. In future research, we will use target scattering data to identify and invert beam and target parameters based on machine learning.

4. Conclusions

We investigated the influences of targets with different dielectric parameters on the scattering field intensity and OAM spectrum of vortex electromagnetic beams with various beam parameters. We used the PO algorithm and angular spectral decomposition method to calculate the scattering fields of a Bessel vortex EM beam. Subsequently, the spiral spectral expansion method was used to calculate the OAM spectral distributions of the scattering fields at different radii. We also examined the influences of different polarizations (transmitting and receiving) and different directional sampling methods on the sampling results. Subsequently, we investigated the effects of different topological charges, half-cone angles, receiving plane positions, offset positions, and frequencies on the scattering fields and OAM spectra of targets with different dielectric parameters. The following conclusions can be drawn:
(1)
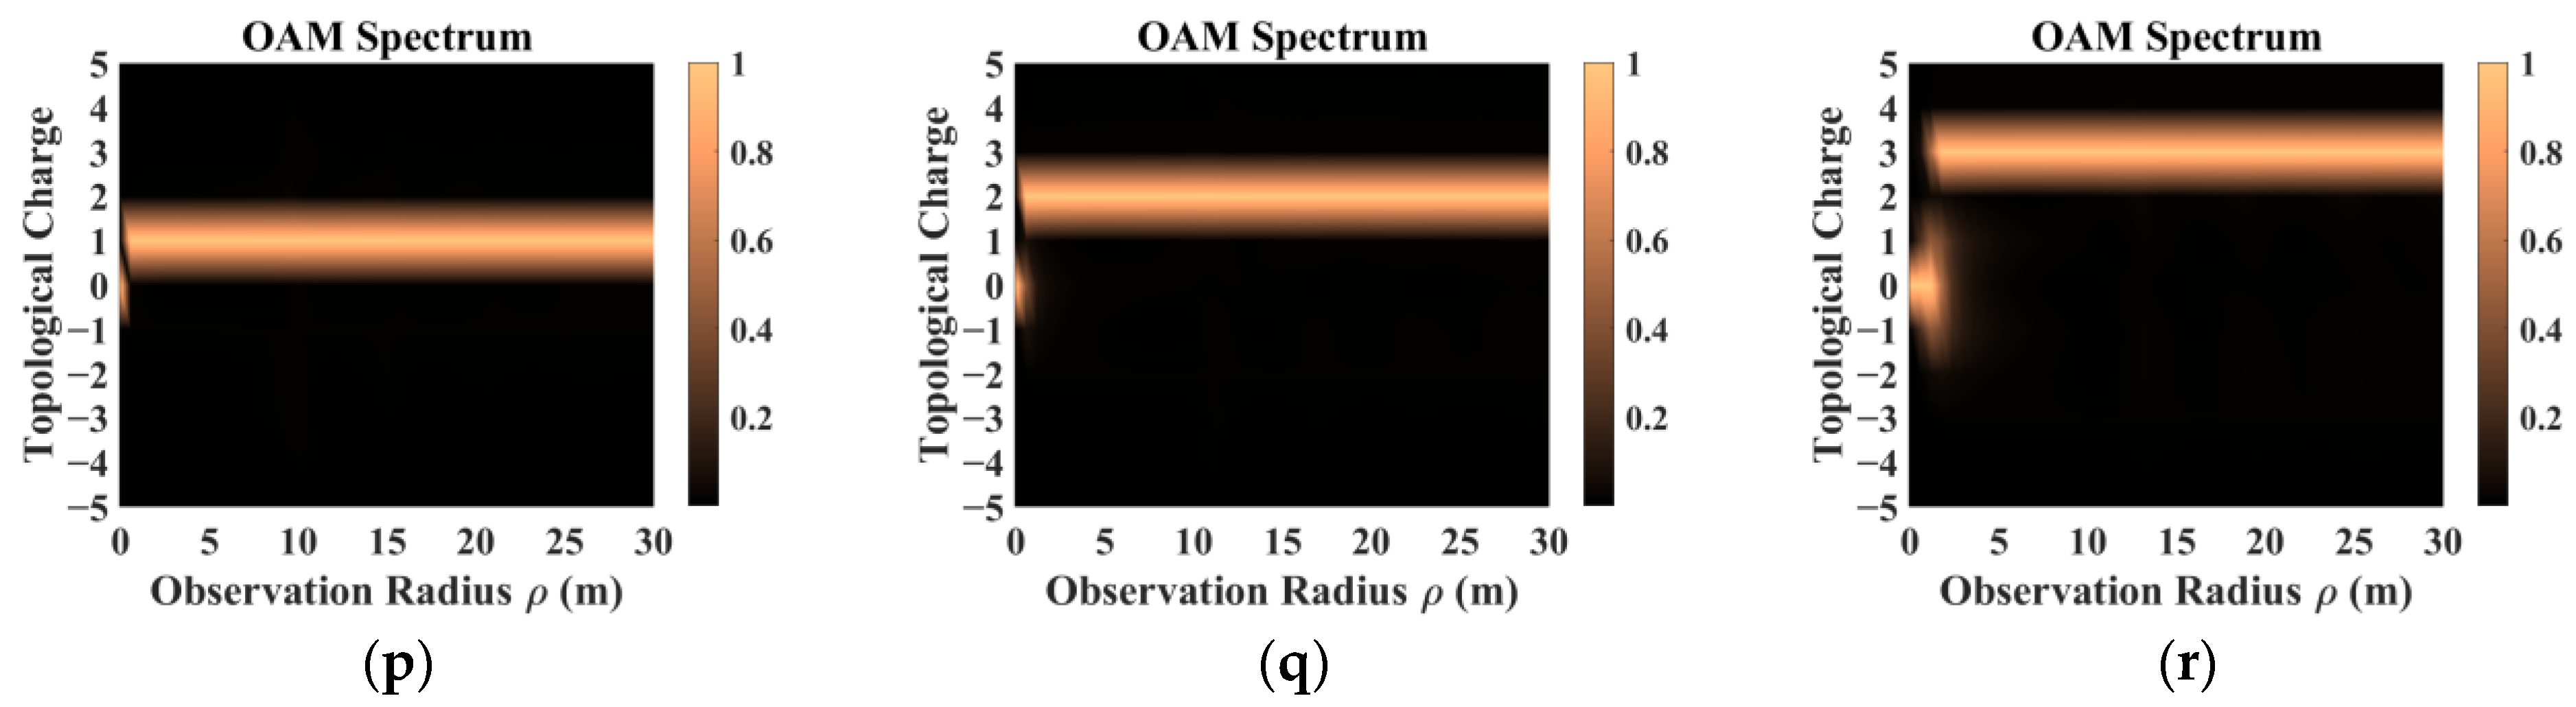
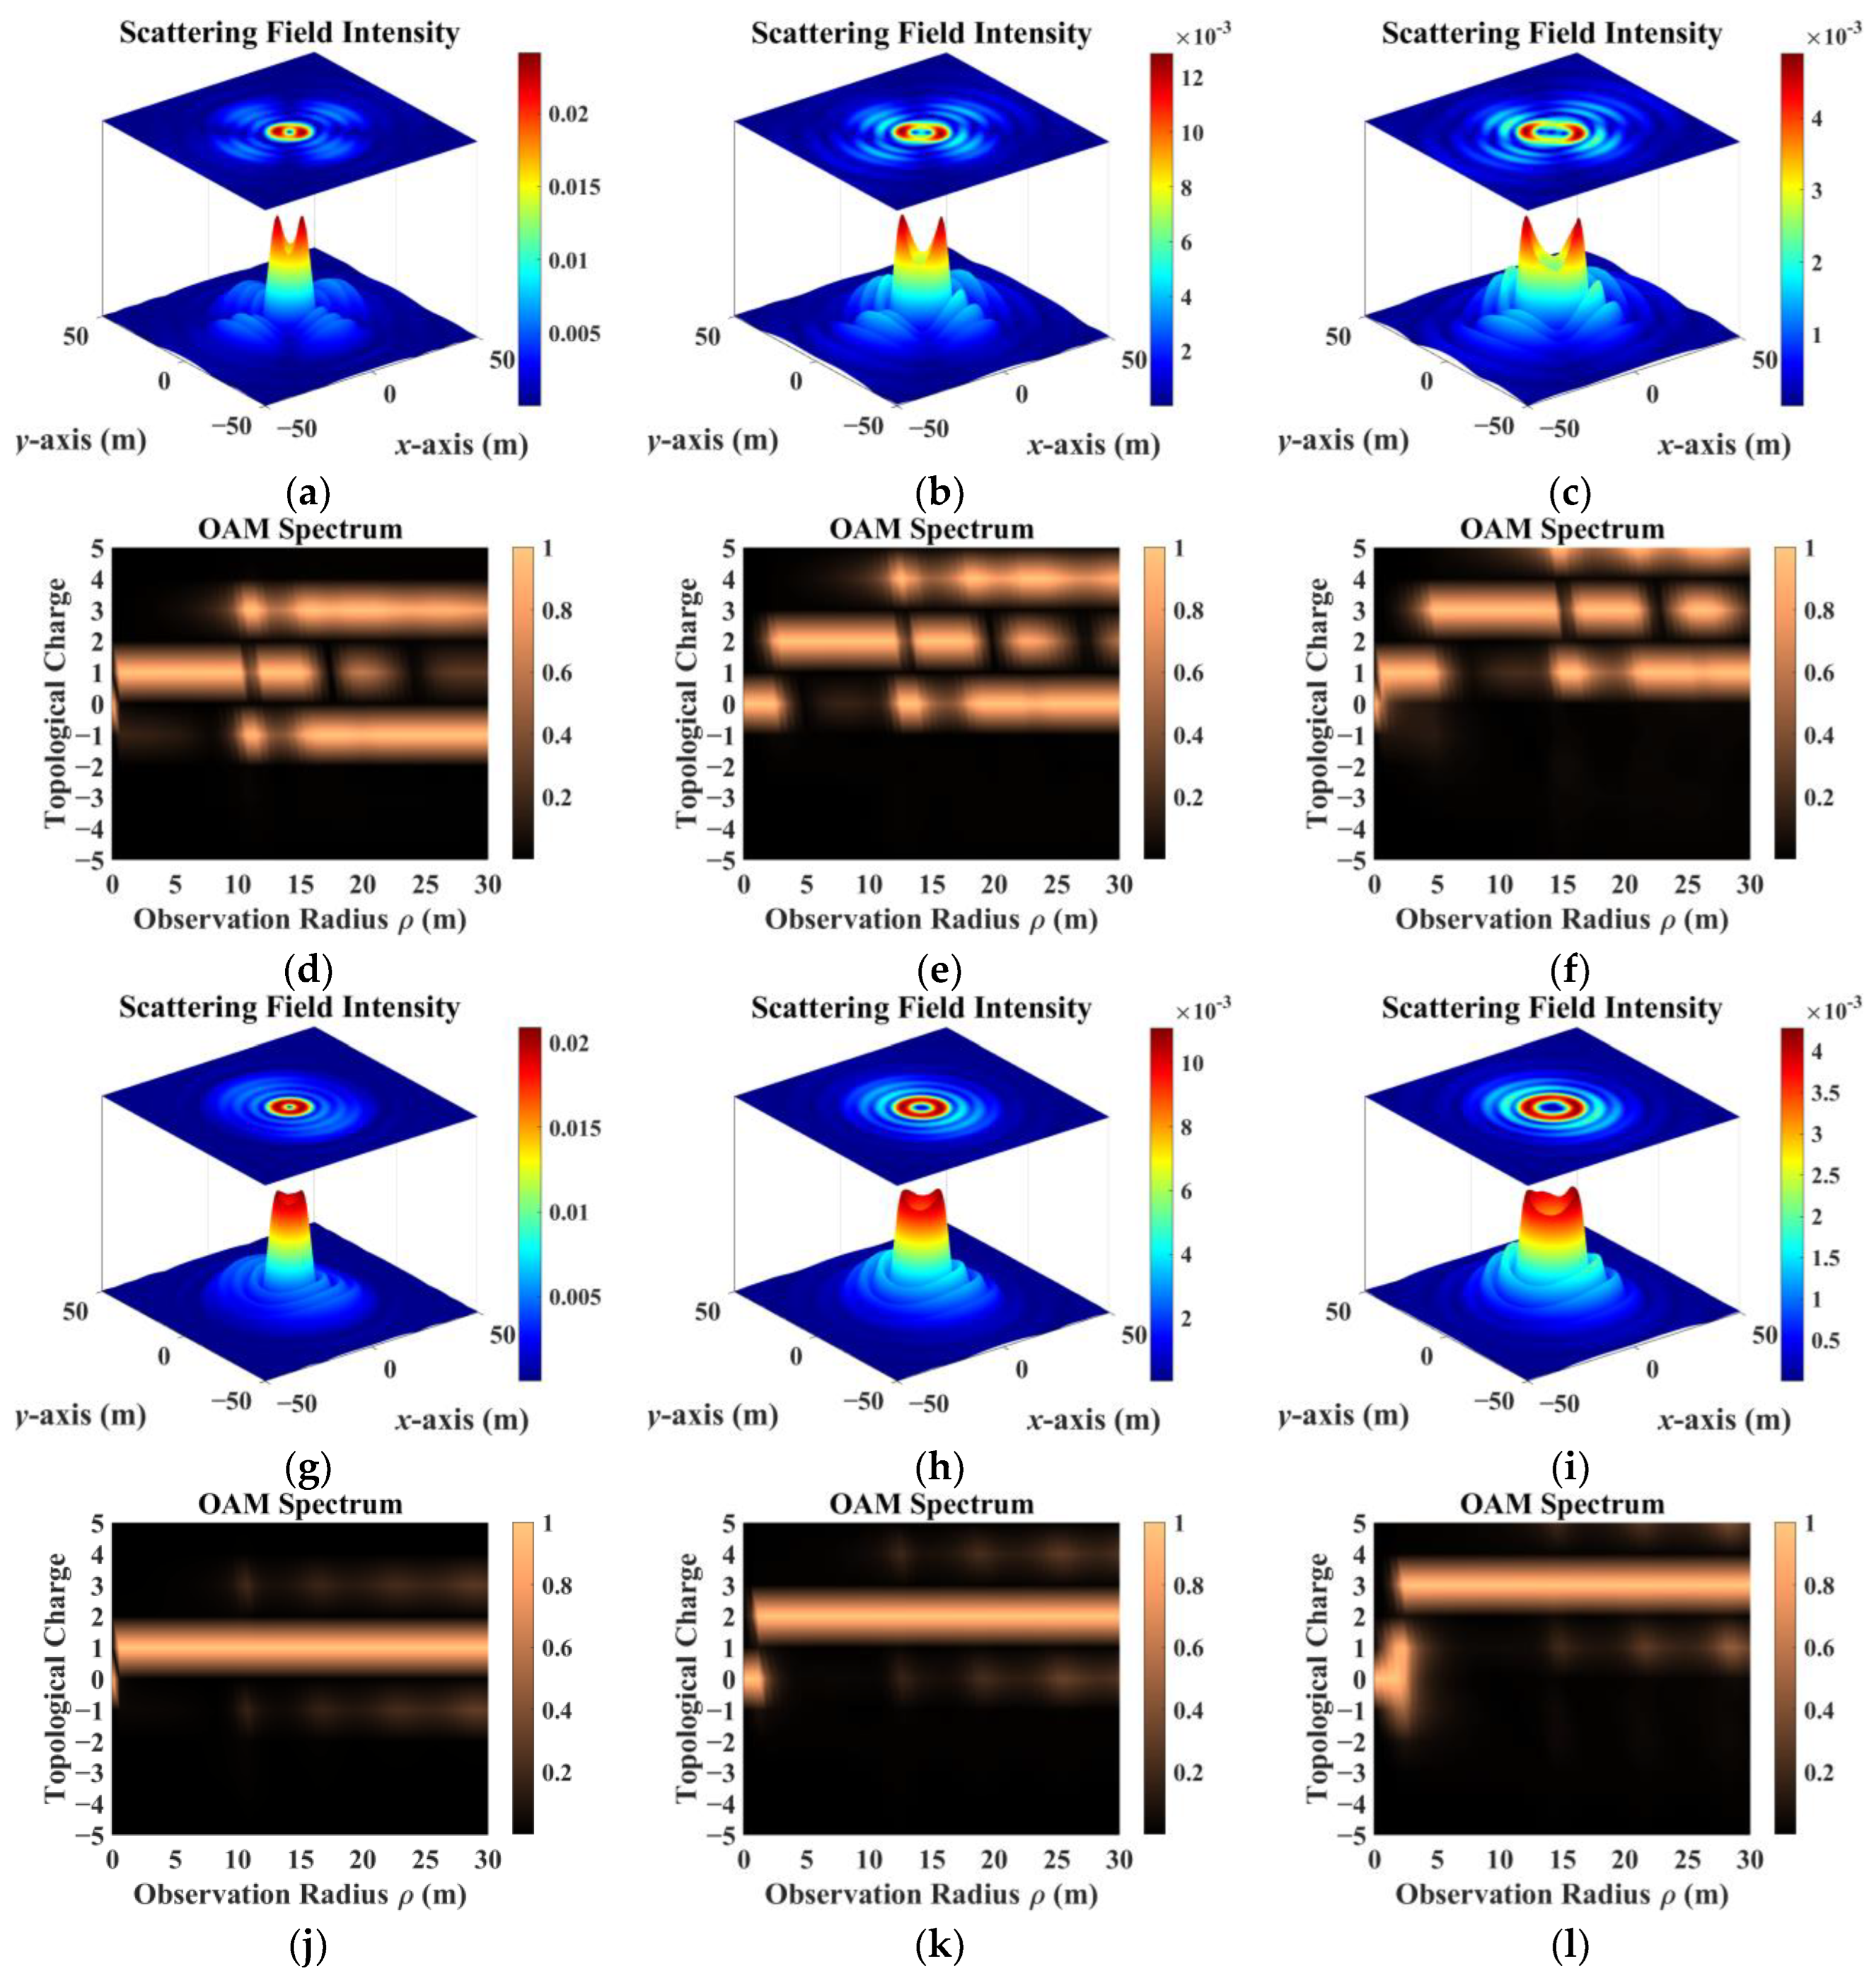
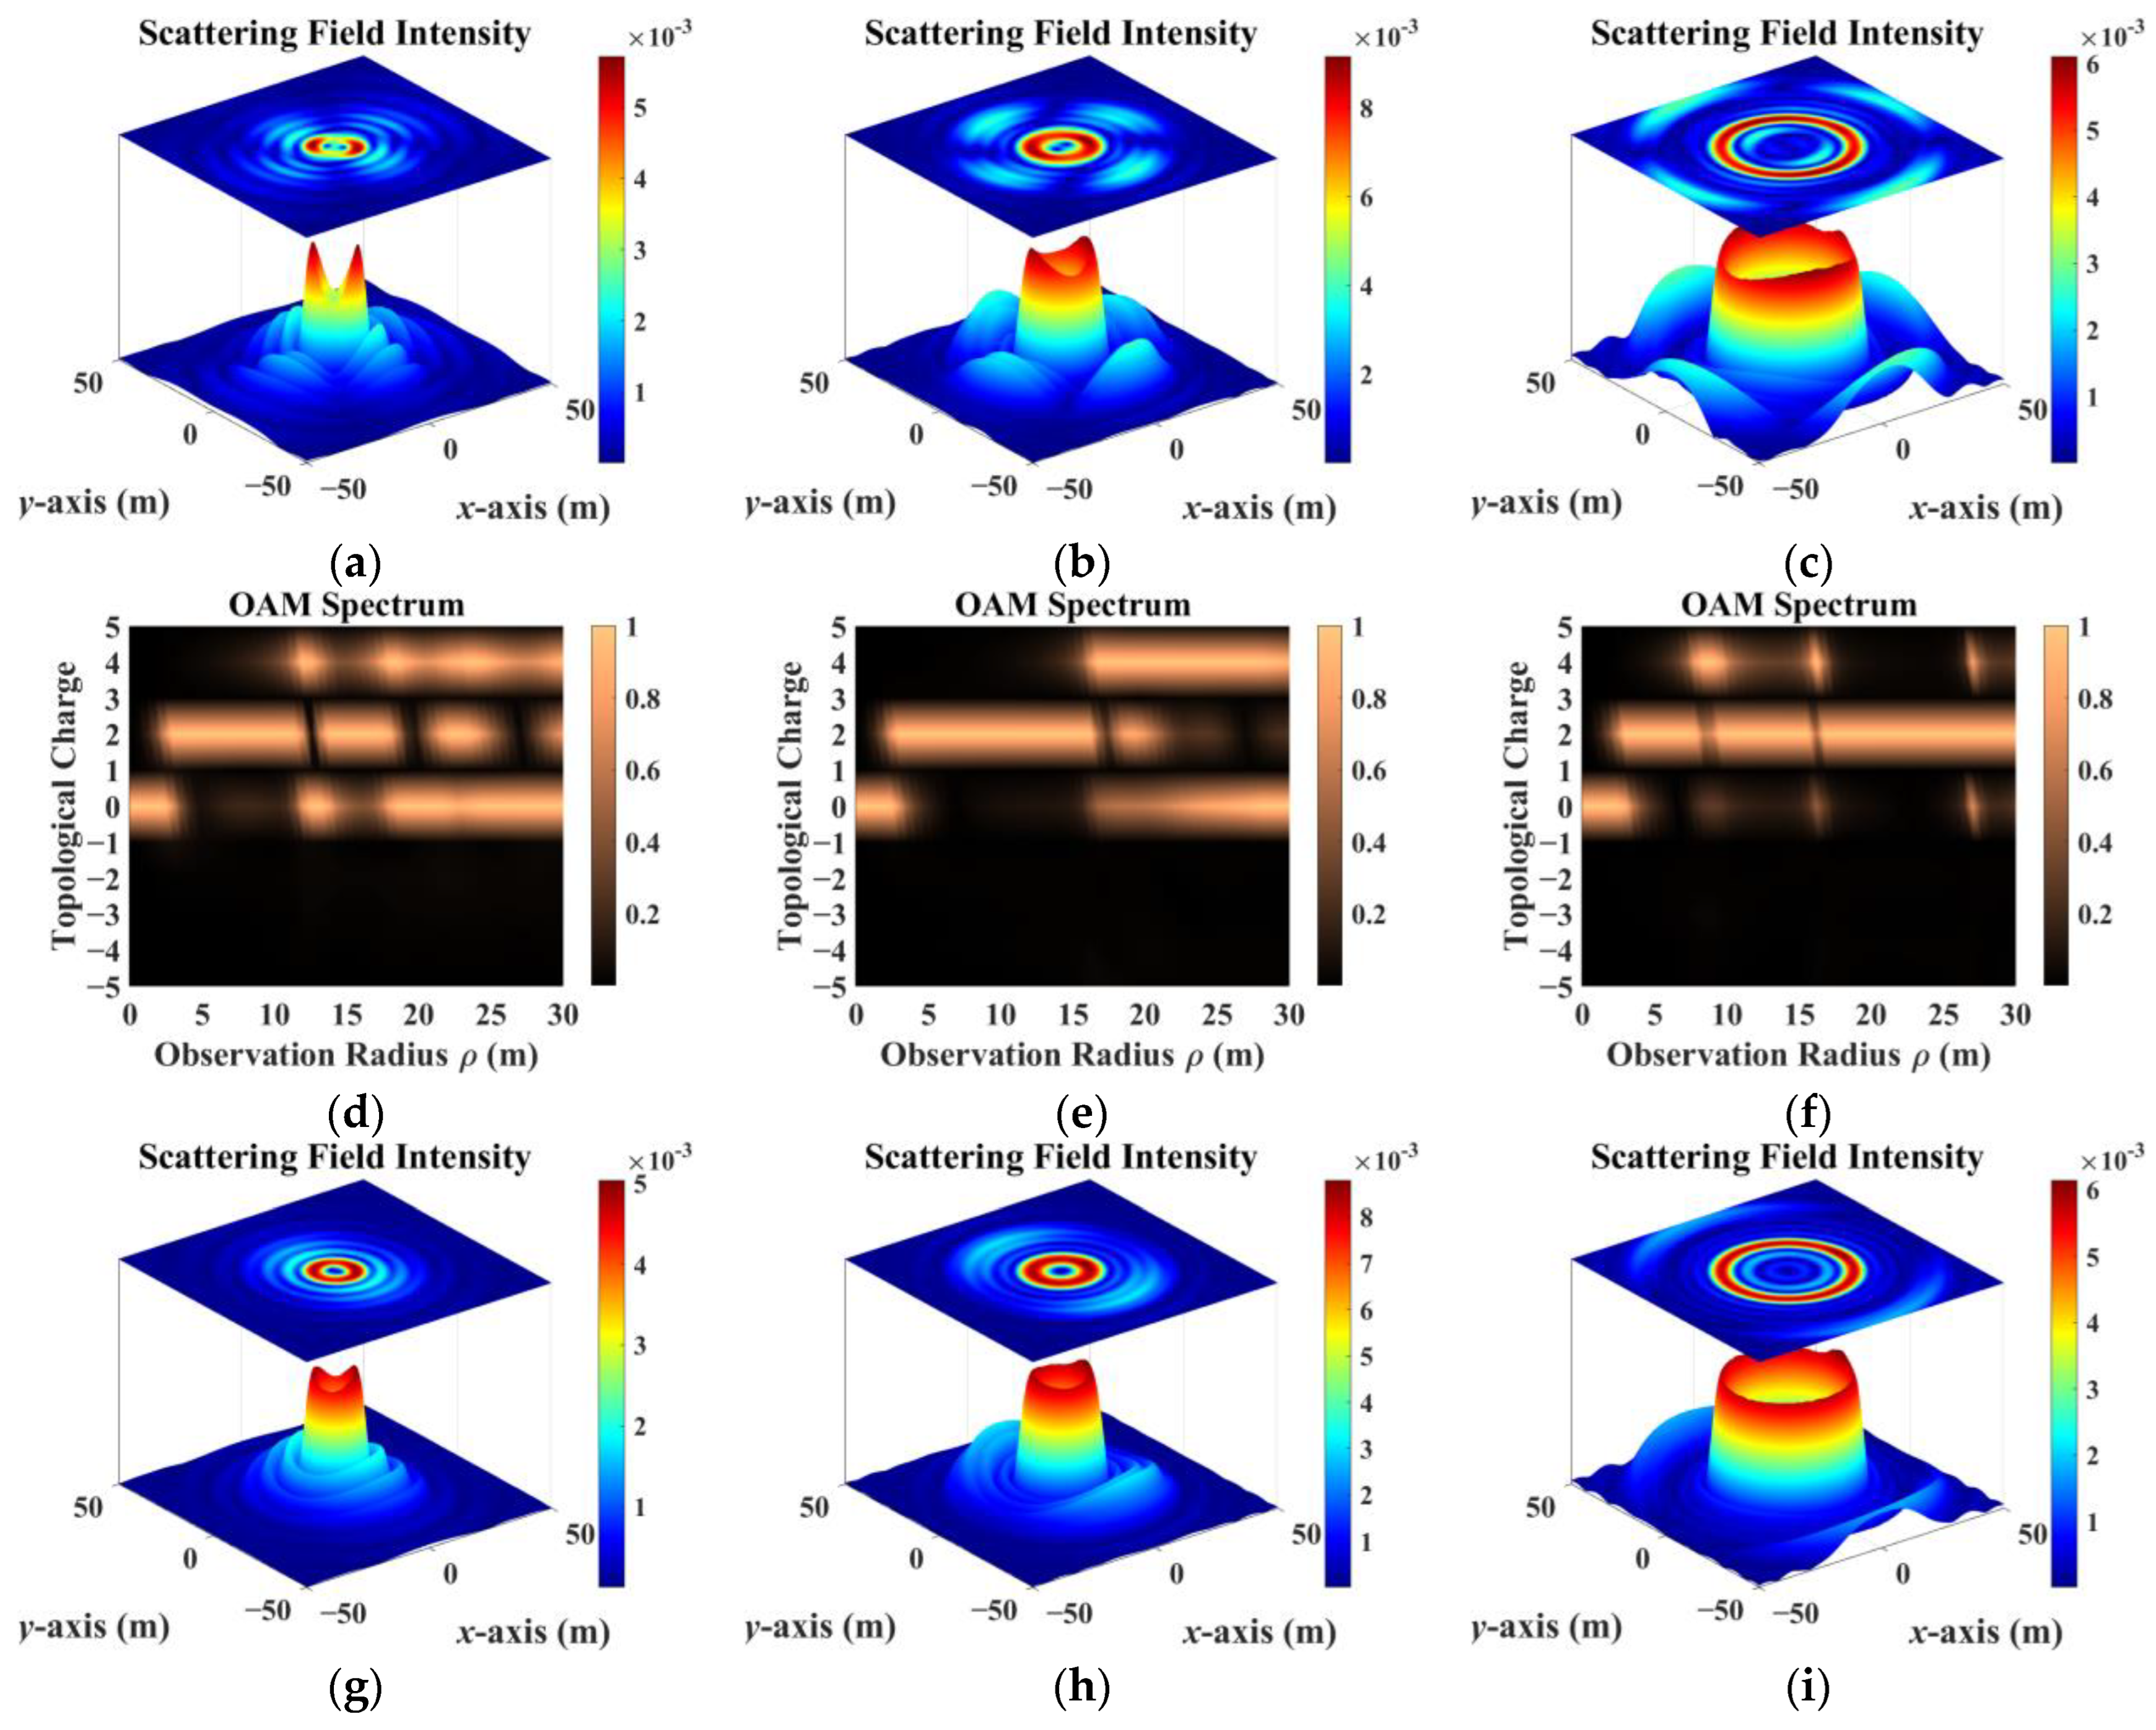
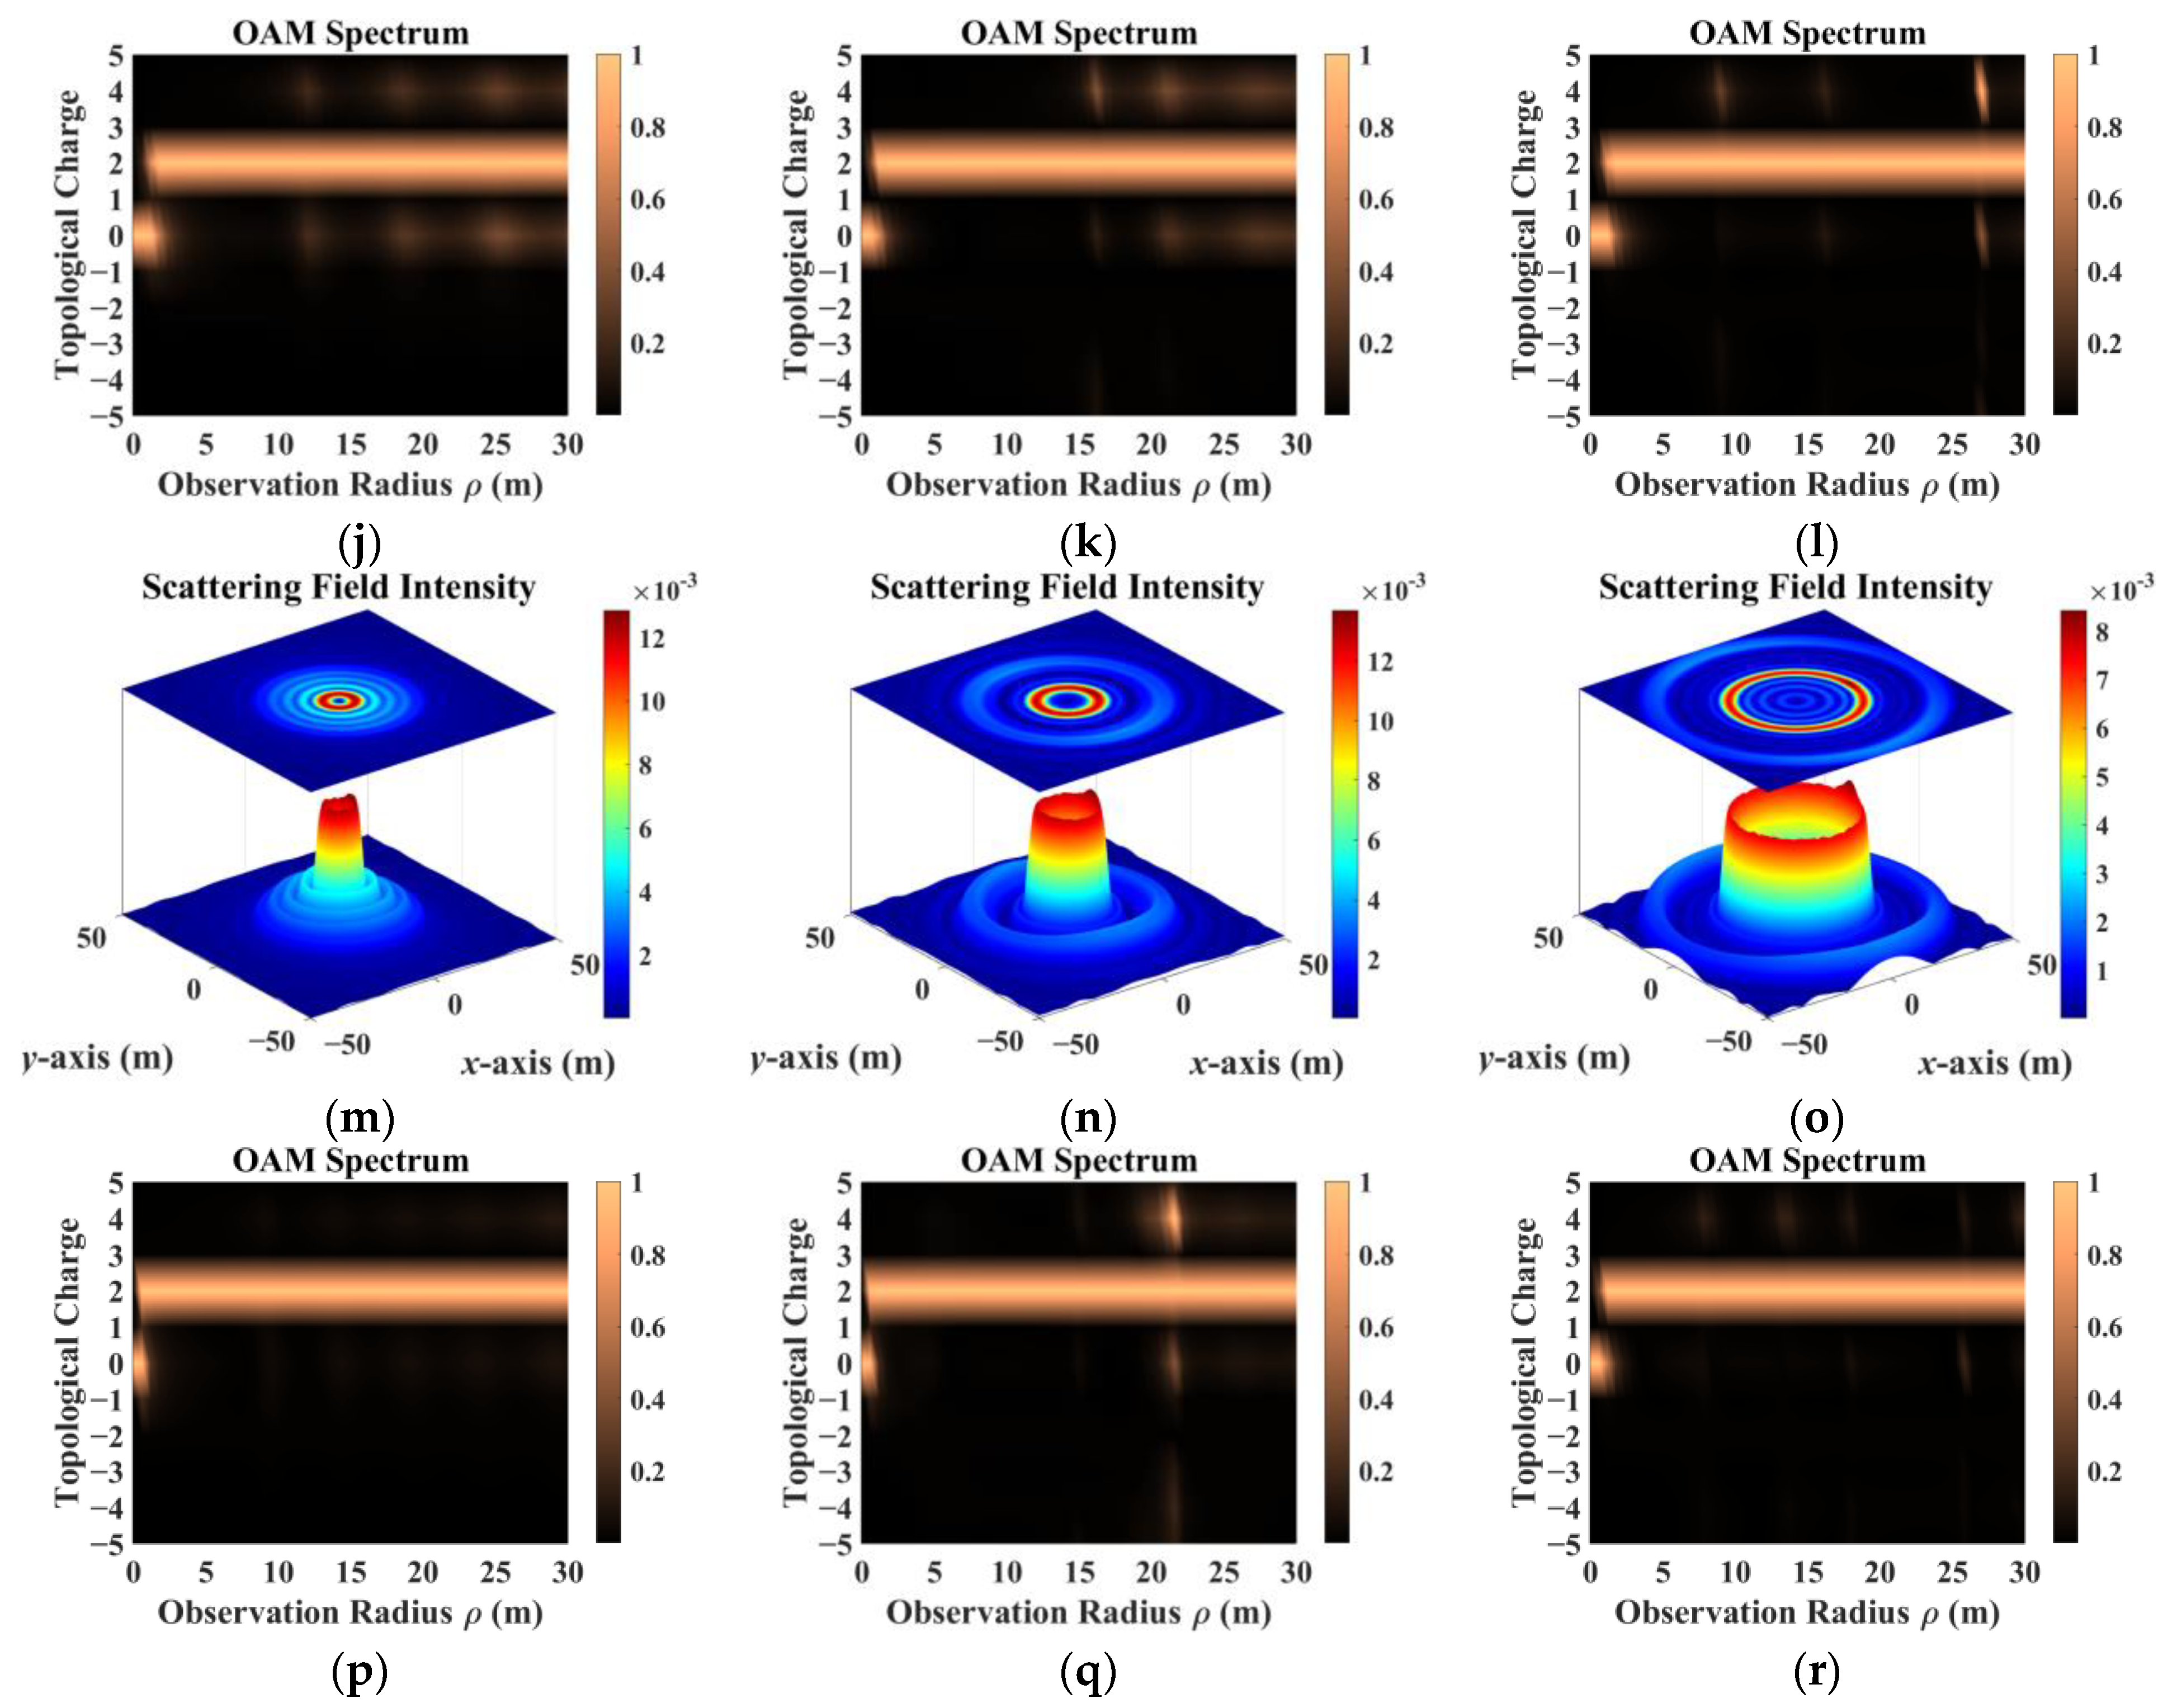
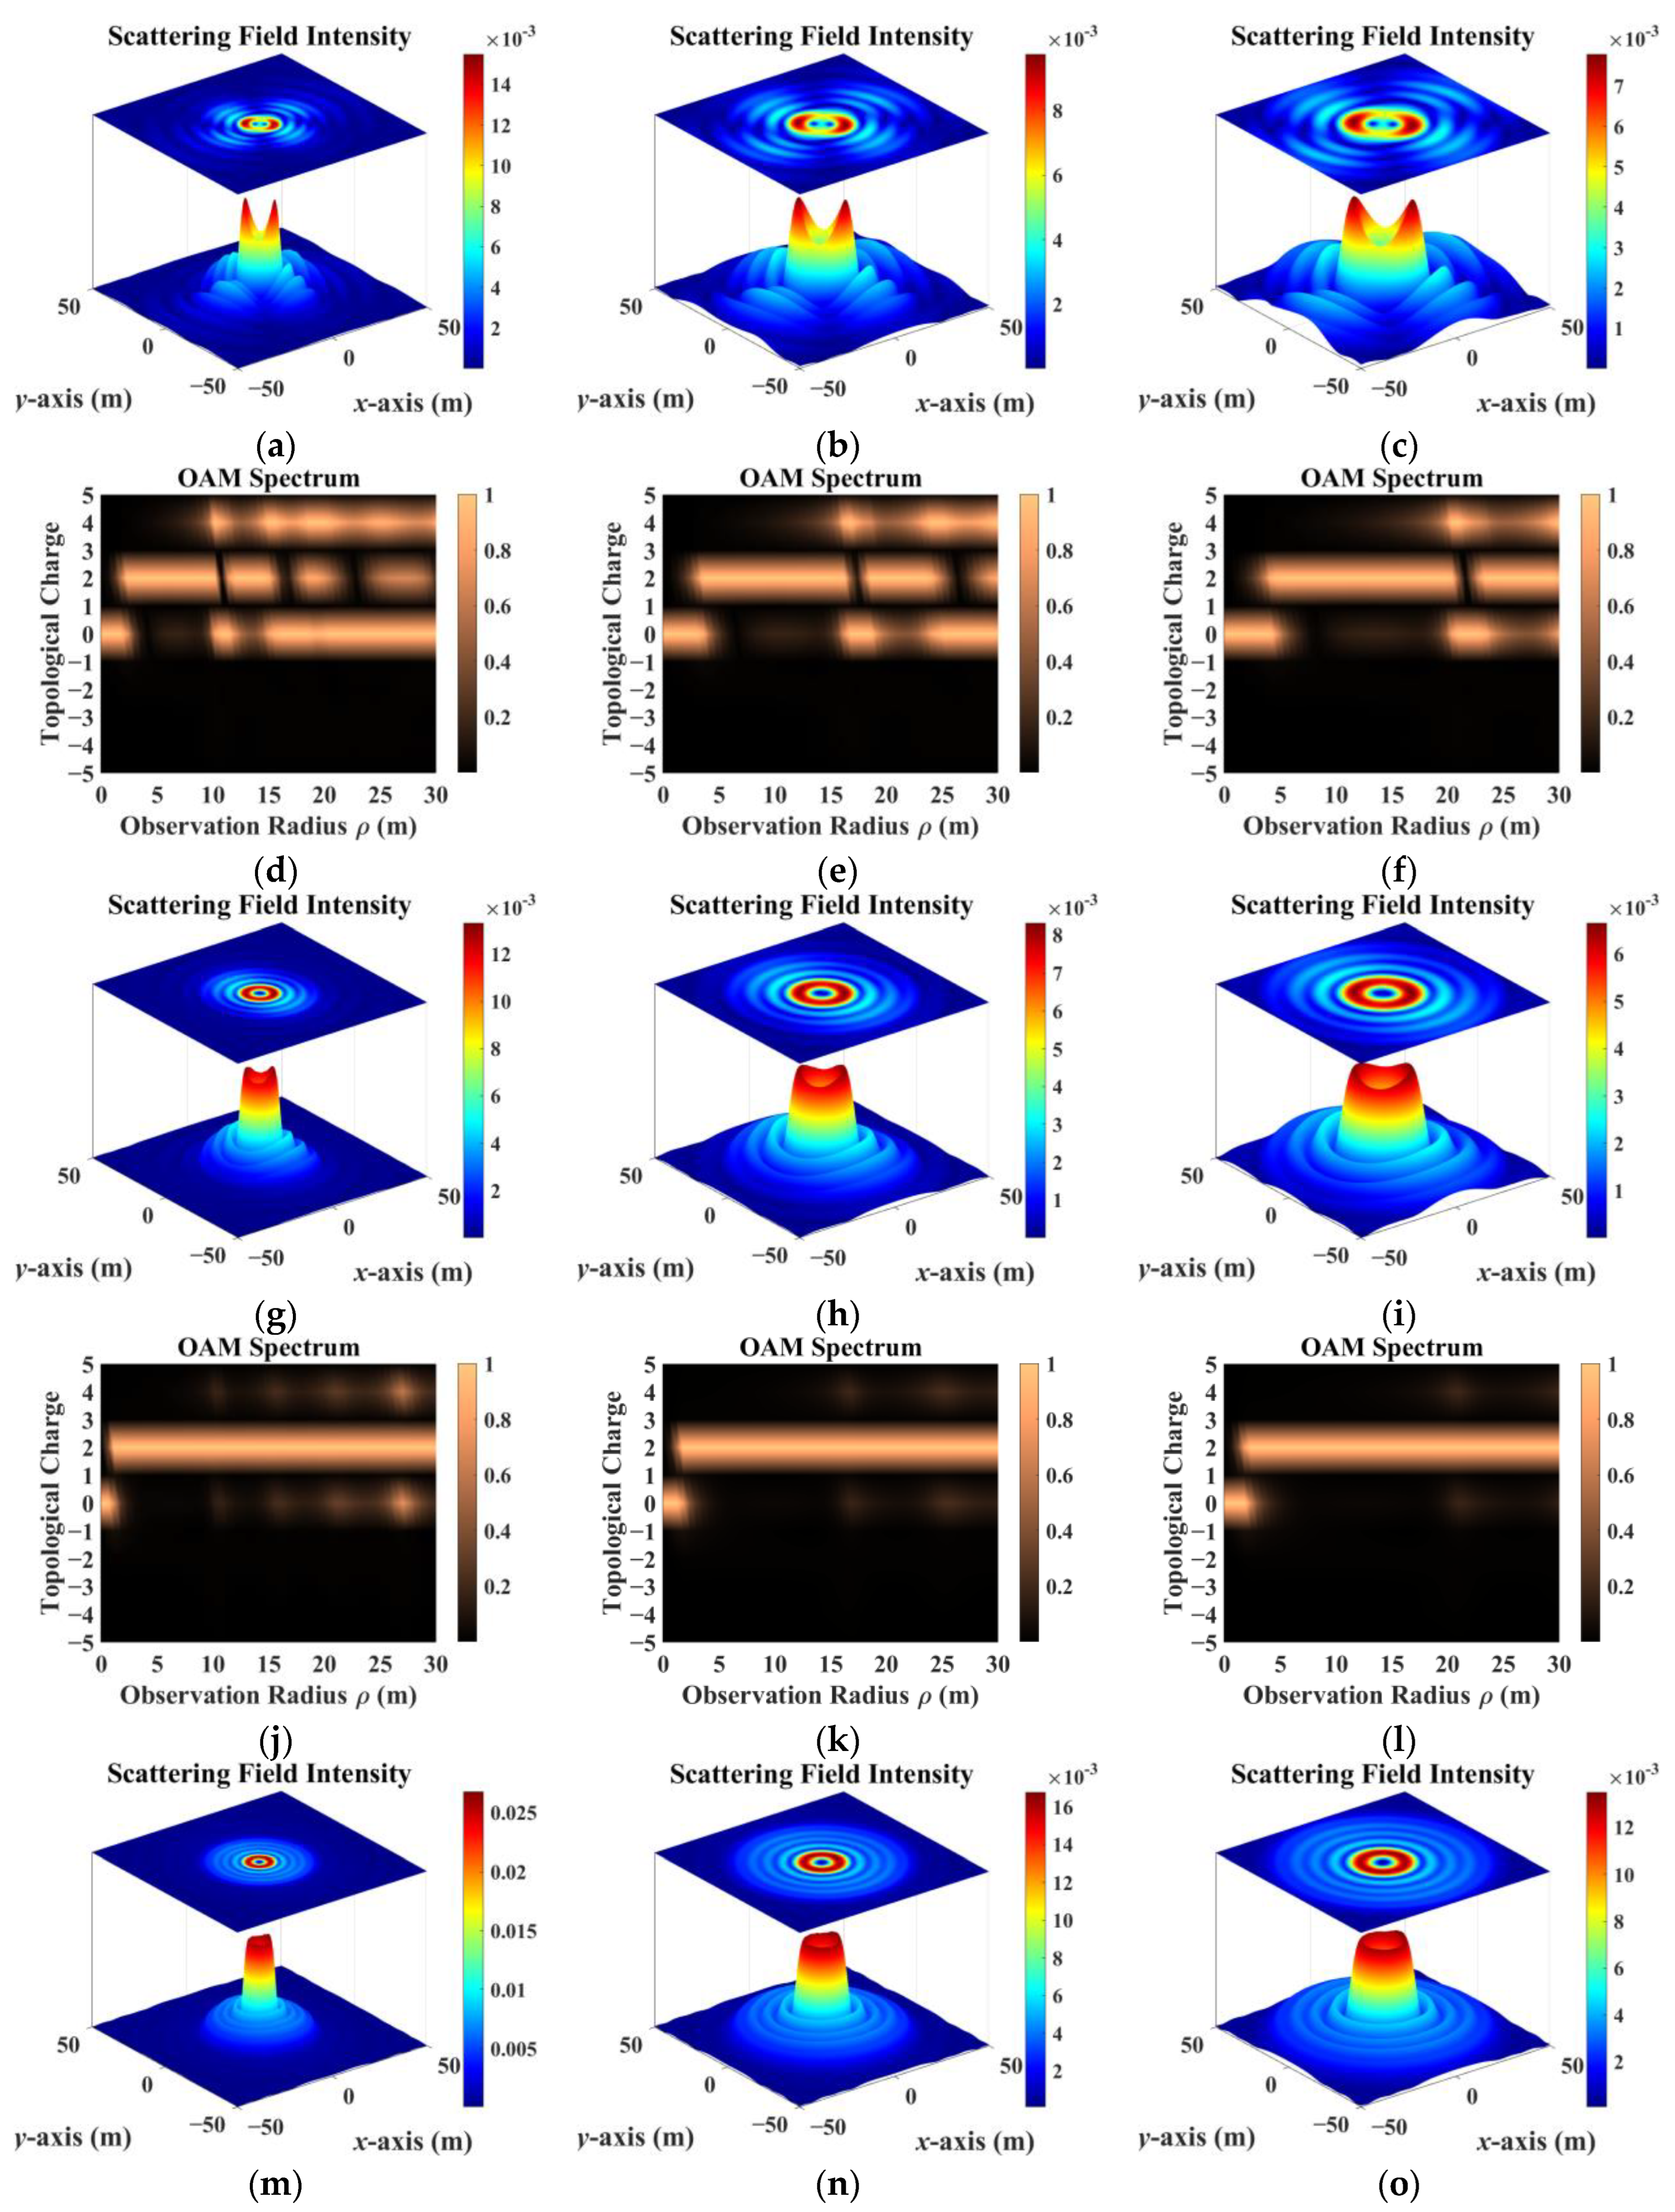
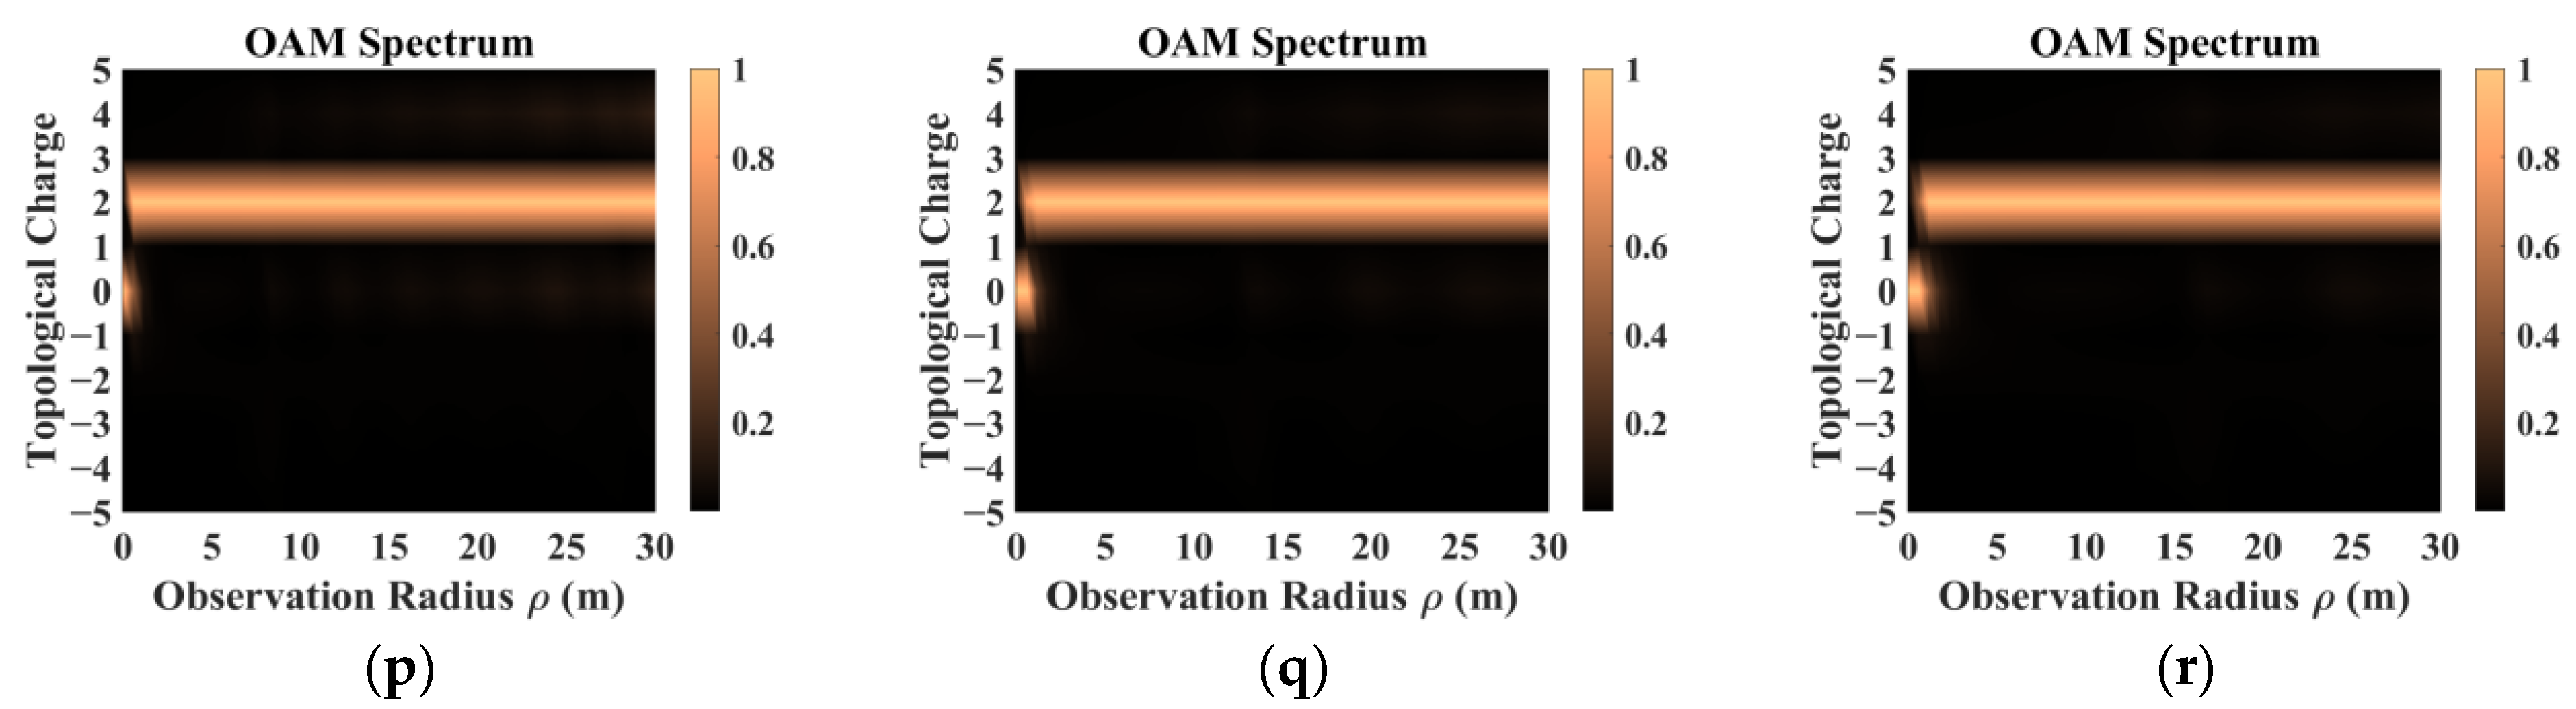
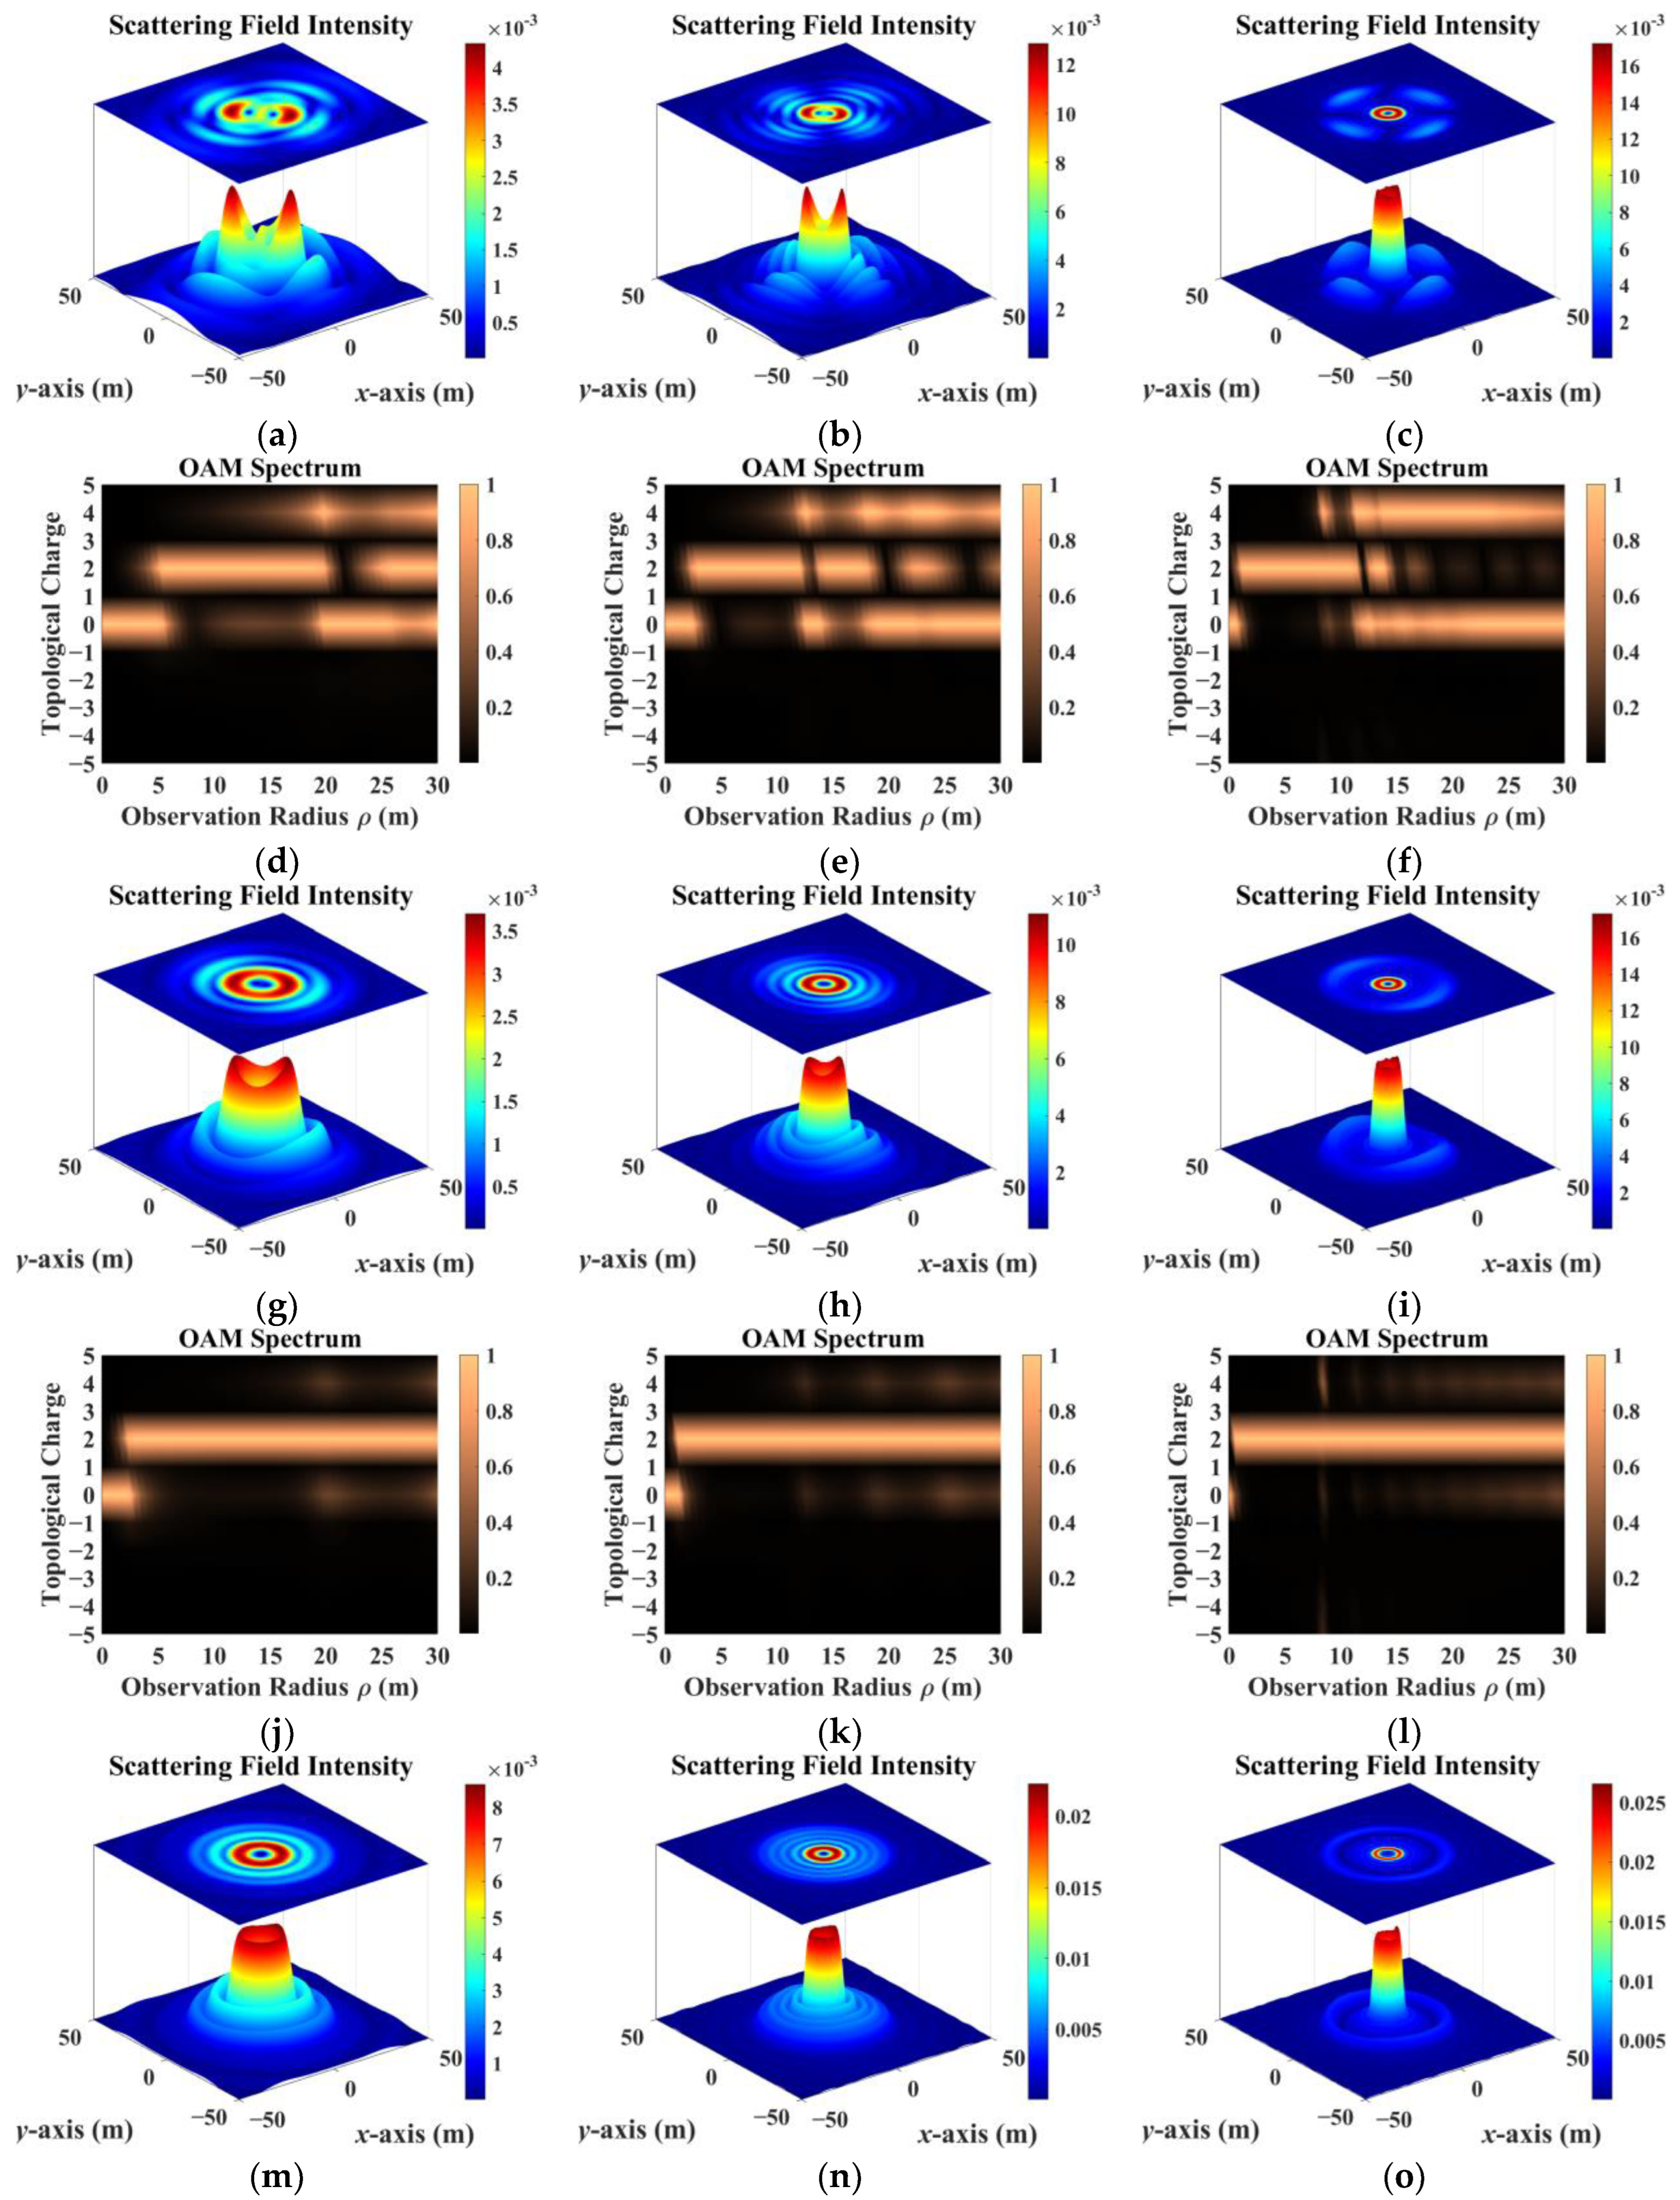
The sampling results obtained by co-polarization transmission and receiving methods were relatively similar, but the results for different directions of the scattering field were inconsistent. Therefore, the sampling direction can be used as the calculation dimension to construct a target-scattering database.
(2)
The scattering field of the target was extremely sensitive to different incidence parameters. As topological charge increased, the scattering field intensity distribution showed a clear outward diffusion trend, and the proportion of modes consistent with the incident field decreased. The scattering field of the non-diffracting vortex beam underwent diffraction, and the intensity gradually decreased with increasing receiving distance. The position of the receiving plane directly affected the scattering-field sampling results. Choosing the appropriate sampling distance and receiving-plane size facilitated receiving more information. The scattering field intensity distribution maintained a profile similar to that of an on-axis incident beam, but when incidence was off-axis, the scattering field was significantly distorted and the topological charge could not be preserved.
(3)
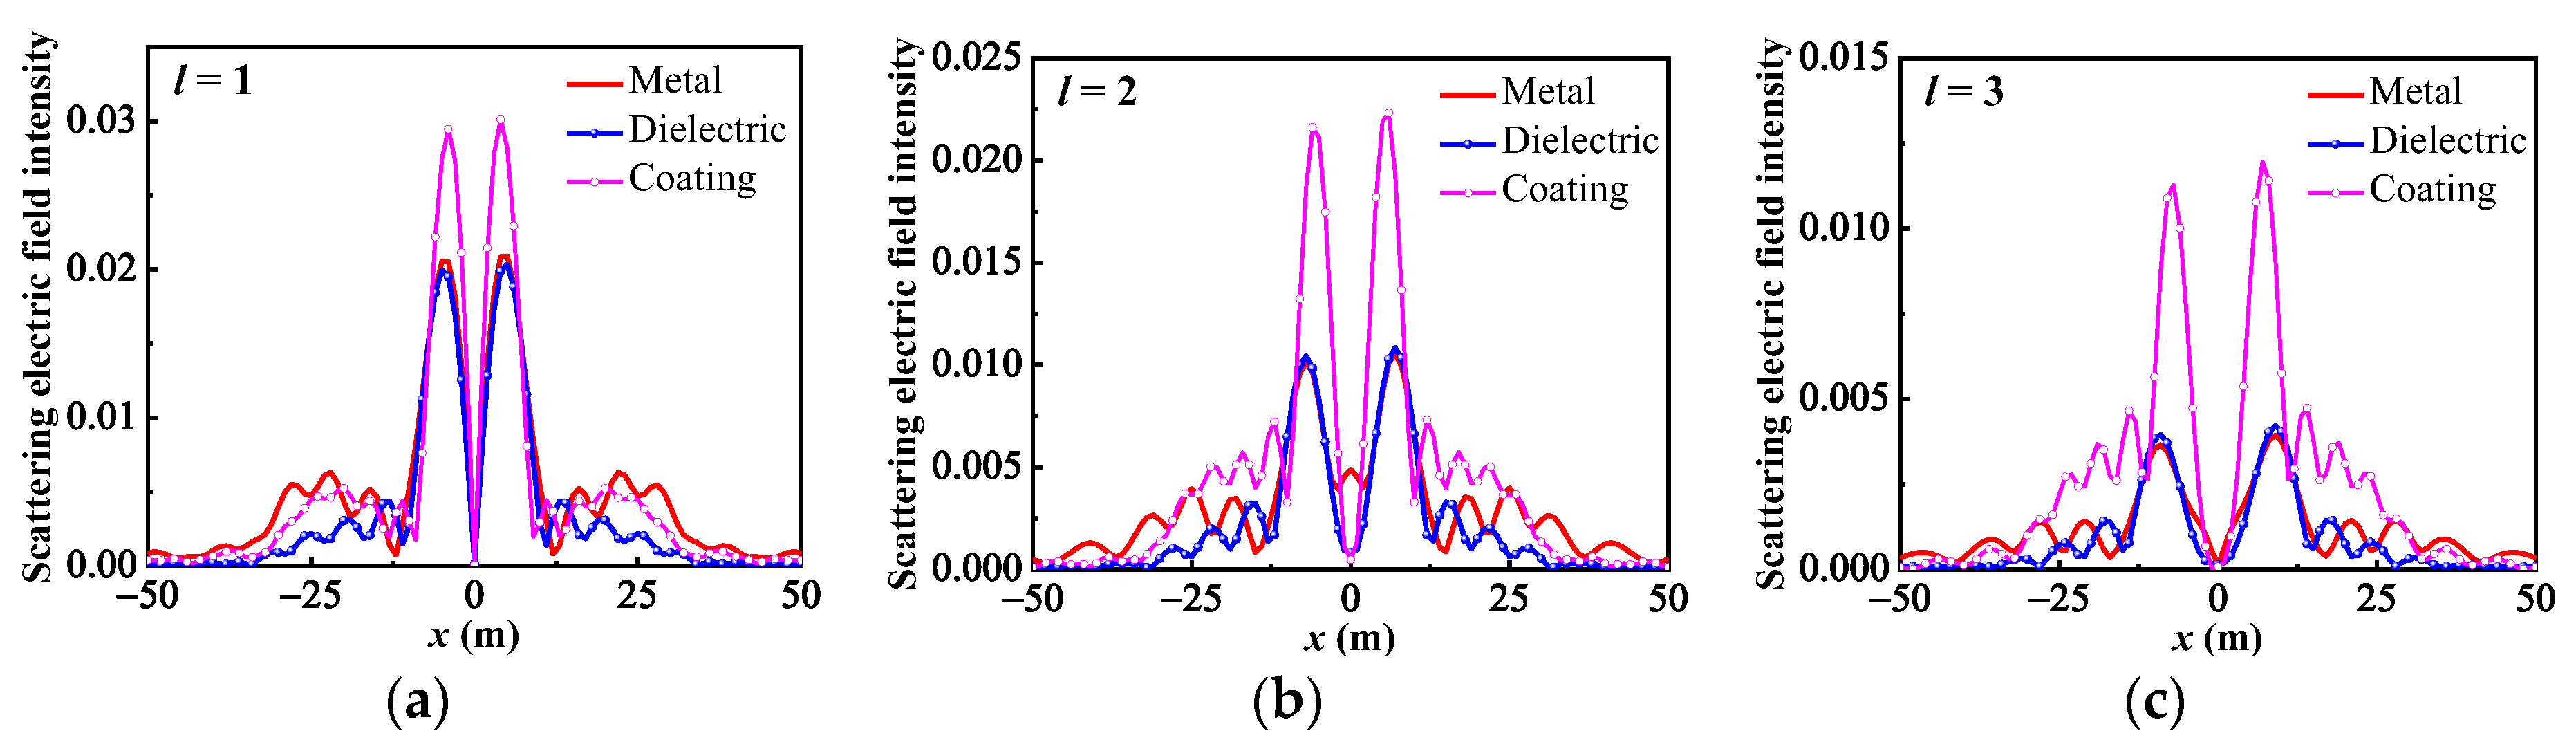
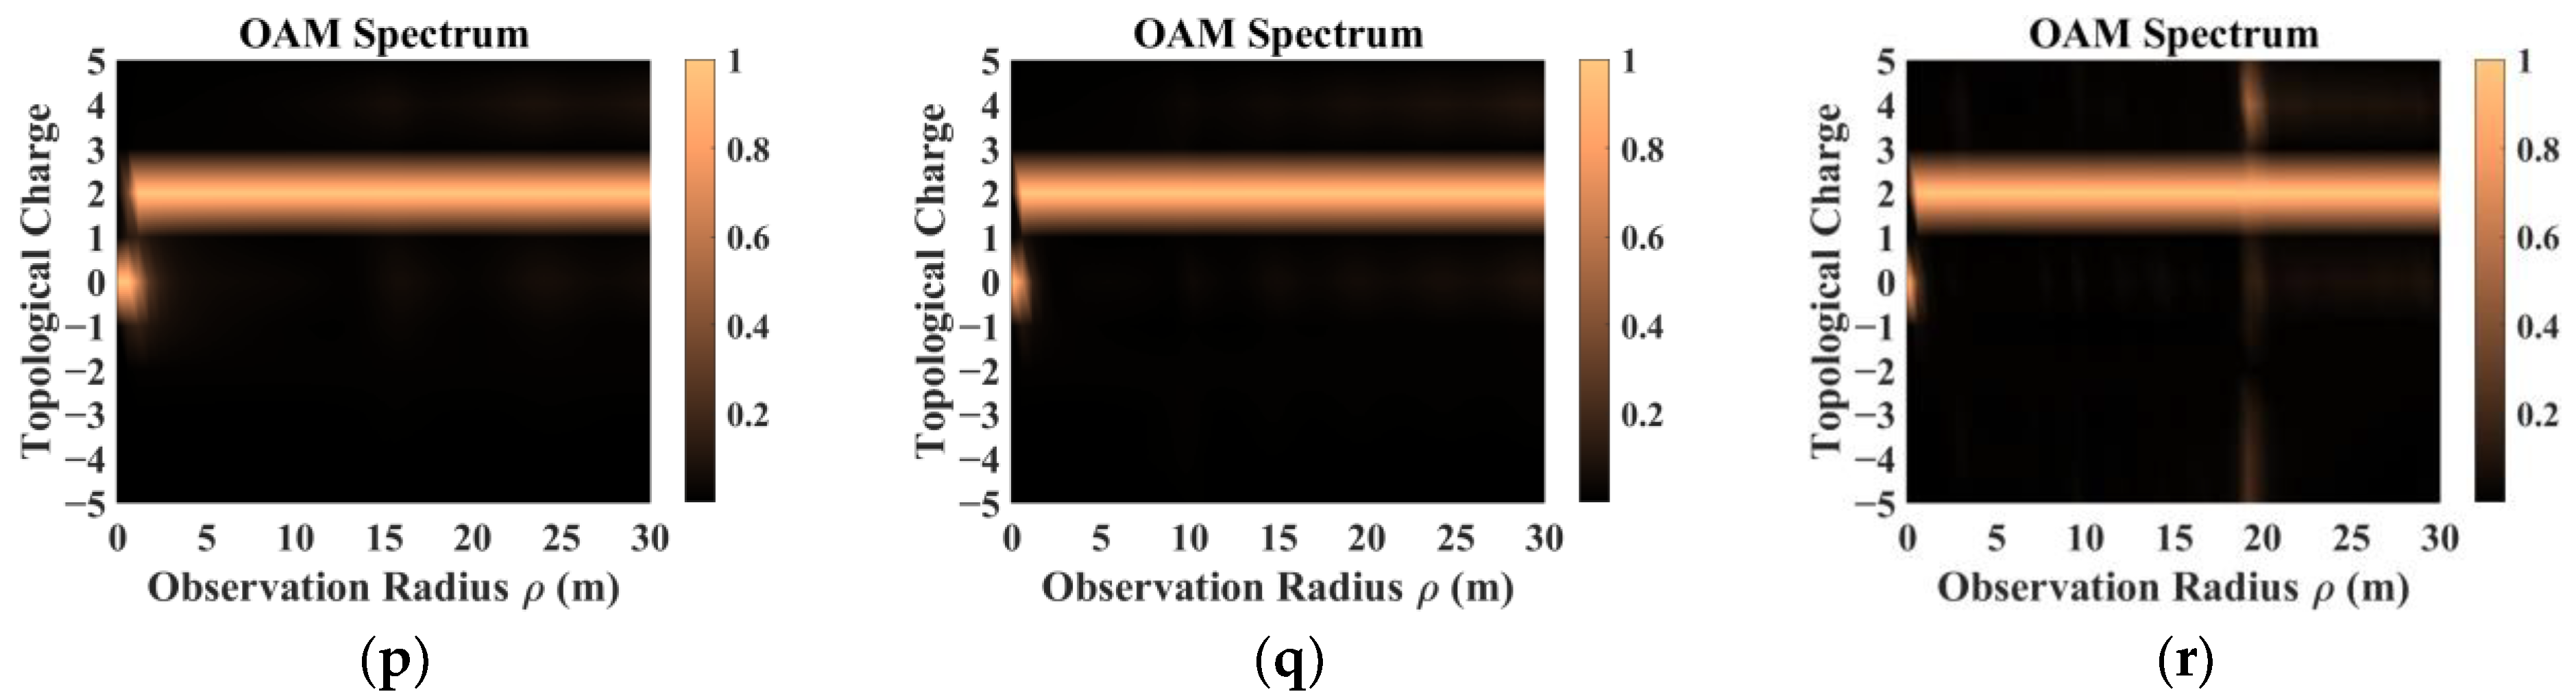
In addition, beams with the same parameters incident on targets with different dielectric parameters produced significantly different scattering results. The intensity distribution and patterns most similar to those of the incident beam came from scattering by a dielectric coating.
Therefore, when the target parameters are known, the parameters of the incident beam can be retrieved using scattering field intensity and OAM spectra; similarly, the target parameters can be inferred by knowing the beam parameters. This research is more general and universal. The investigation of the scattering field intensity and spiral spectral distribution of a vortex EM beam scattered by electrically large targets comprising different materials provides a theoretical basis for the potential application of vortex beams in remote sensing, such as the inversion of targets and beam parameters to supplement radar imaging and other fields.

Author Contributions

Conceptualization, S.L. and L.G.; methodology, M.S., S.L. and L.G.; software, M.S.; validation, M.S. and S.L.; investigation, M.S. and S.L.; resources, S.L. and L.G.; writing—original draft preparation, M.S. and S.L.; writing—review and editing, M.S., S.L. and L.G. All authors have read and agreed to the published version of the manuscript.

Funding

This research was funded by the National Natural Science Foundation of China (Grant No. 61901336, 62231021), the 111 Project (Grant No. B17035), and the Fundamental Research Funds for the Central Universities (Grant No. YJSJ23017).

Data Availability Statement

Data are contained within the article.

Acknowledgments

The authors would like to thank the editor and anonymous reviewers who handled our paper.

Conflicts of Interest

The authors declare no conflicts of interest.

References

  1. Allen, L.; Beijersbergen, M.W.; Spreeuw, R.J.; Woerdman, J.P. Orbital angular momentum of light and the transformation of Laguerre-Gaussian laser modes. Phys. Rev. A 1992, 45, 8185–8189. [Google Scholar] [CrossRef]
  2. Wang, J.; Yang, J.; Fazal, I.; Ahmed, N.; Yan, Y.; Huang, H.; Ren, Y.; Yue, Y.; Dolinar, S.; Tur, M. Terabit free-space data transmission employing orbital angular momentum multiplexing. Nat. Photonics 2012, 6, 488–496. [Google Scholar] [CrossRef]
  3. Huang, H.; Xie, G.; Yan, Y.; Ahmed, N.; Ren, Y.; Yue, Y.; Rogawski, D.; Willner, M.J.; Erkmen, B.I.; Birnbaum, K.M.; et al. 100 Tbit/s free-space data link enabled by three-dimensional multiplexing of orbital angular momentum, polarization, and wavelength. Opt. Lett. 2014, 39, 197–200. [Google Scholar] [CrossRef] [PubMed]
  4. Lei, T.; Zhang, M.; Li, Y.; Jia, P.; Liu, G.N.; Xu, X.; Li, Z.; Min, C.; Lin, J.; Yu, C.; et al. Massive individual orbital angular momentum channels for multiplexing enabled by Dammann gratings. Light Sci. Appl. 2015, 4, e257. [Google Scholar] [CrossRef]
  5. Ahmed, N.; Zhao, Z.; Li, L.; Huang, H.; Lavery, M.P.J.; Liao, P.; Yan, Y.; Wang, Z.; Xie, G.; Ren, Y.; et al. Mode-division-multiplexing of multiple Bessel-Gaussian beams carrying orbital-angular-momentum for obstruction-tolerant free-space optical and millimetre-wave communication links. Sci. Rep. 2017, 7, 15412. [Google Scholar] [CrossRef] [PubMed]
  6. Lavery, M.P.J.; Speirits, F.C.; Barnett, S.M.; Padgett, M.J. Detection of a spinning object using light’s orbital angular momentum. Science 2013, 341, 537–540. [Google Scholar] [CrossRef]
  7. Lavery, M.P.J.; Barnett, S.M.; Speirits, F.C.; Padgett, M.J. Observation of the rotational Doppler shift of a white-light, orbital-angular-momentum-carrying beam backscattered from a rotating body. Optica 2014, 1, 1–4. [Google Scholar] [CrossRef]
  8. Fu, S.; Wang, T.; Zhang, Z.; Zhai, Y.; Gao, C. Non-diffractive Bessel-Gauss beams for the detection of rotating object free of obstructions. Opt. Express 2017, 25, 20098–20108. [Google Scholar] [CrossRef]
  9. Simpson, N.B.; Dholakia, K.; Allen, L.; Padgett, M.J. Mechanical equivalence of spin and orbital angular momentum of light: An optical spanner. Opt. Lett. 1997, 22, 52–54. [Google Scholar] [CrossRef]
  10. Garcés-Chávez, V.; McGloin, D.; Melville, H.; Sibbett, W.; Dholakia, K. Simultaneous micromanipulation in multiple planes using a self-reconstructing light beam. Nature 2002, 419, 145–147. [Google Scholar] [CrossRef]
  11. Meier, M.; Romano, V.; Feurer, T. Material processing with pulsed radially and azimuthally polarized laser radiation. Appl. Phys. A 2007, 86, 329–334. [Google Scholar] [CrossRef]
  12. Thidé, B.; Then, H.; Sjöholm, J.; Palmer, K.; Bergman, J.; Carozzi, T.D.; Istomin, Y.N.; Ibragimov, N.H.; Khamitova, R. Utilization of photon orbital angular momentum in the low-frequency radio domain. Phys. Rev. Lett. 2007, 99, 087701. [Google Scholar] [CrossRef] [PubMed]
  13. Shen, F.; Mu, J.; Guo, K.; Guo, Z. Generating circularly polarized vortex electromagnetic waves by the conical conformal patch antenna. IEEE Trans. Antennas Propag. 2019, 67, 5763–5771. [Google Scholar] [CrossRef]
  14. Dang, W.; Zhu, Y.; Yu, Y.; Zuo, K. A miniaturized dual-orbital-angular-momentum (OAM)–mode helix antenna. IEEE Access 2018, 6, 57056–57060. [Google Scholar]
  15. Wang, L.; Chen, H.; Guo, K.; Shen, F.; Guo, Z. An inner- and outer-fed dual-arm archimedean spiral antenna for generating multiple orbital angular momentum modes. Electronics 2019, 8, 251. [Google Scholar] [CrossRef]
  16. Mohammadi, S.M.; Daldorff, L.K.S.; Bergman, J.E.S.; Karlsson, R.L.; Thidé, B.; Forozesh, K.; Carozzi, T.D.; Isham, B. Orbital angular momentum in radio—A system study. IEEE Trans. Antennas Propag. 2010, 58, 565–572. [Google Scholar] [CrossRef]
  17. Yang, L.; Sun, S.; Sha, W.E.I. Ultrawideband reflection-type metasurface for generating integer and fractional orbital angular momentum. IEEE Trans. Antennas Propag. 2020, 68, 2166–2175. [Google Scholar] [CrossRef]
  18. Tamburini, F.; Mari, E.; Sponselli, A.; Thidé, B.; Bianchini, A.; Romanato, F. Encoding many channels on the same frequency through radio vorticity: First experimental test. New J. Phys. 2012, 14, 033001. [Google Scholar] [CrossRef]
  19. Tamburini, F.; Thidé, B.; Boaga, V.; Carraro, F.; del Pup, M.; Bianchini, A.; Someda, C.G.; Romanato, F. Experimental demonstration of free-space information transfer using phase modulated orbital angular momentum radio. arXiv 2013, arXiv:1302.2990. [Google Scholar]
  20. Edfors, O.; Johansson, A.J. Is Orbital Angular Momentum (OAM) Based Radio Communication an Unexploited Area? IEEE Trans. Antennas Propag. 2011, 60, 1126–1131. [Google Scholar] [CrossRef]
  21. Gaffoglio, R.; Cagliero, A.; Vecchi, G.; Andriulli, F.P. Vortex waves and channel capacity: Hopes and reality. IEEE Access 2017, 6, 19814–19822. [Google Scholar] [CrossRef]
  22. Liu, K.; Cheng, Y.; Yang, Z.; Wang, H.; Qin, Y.; Li, X. Orbital-angular-momentum-based electromagnetic vortex imaging. IEEE Antennas Wirel. Propag. Lett. 2015, 14, 711–714. [Google Scholar] [CrossRef]
  23. Liu, K.; Cheng, Y.; Li, X.; Wang, H.; Qin, Y.; Jiang, Y. Study on the theory and method of vortex-electromagnetic-wave-based radar imaging. IET Microw. Antennas Propag. 2016, 10, 961–968. [Google Scholar] [CrossRef]
  24. Wang, J.; Liu, K.; Liu, H.; Cao, K.; Cheng, Y.; Wang, H. 3-D object imaging method with electromagnetic vortex. IEEE Trans. Geosci. Remote Sens. 2022, 60, 2000512. [Google Scholar] [CrossRef]
  25. Jiang, Y.; Liu, K.; Wang, H.; Deng, B.; Zhuang, Z. Orbital-angular-momentum-based ISAR imaging at terahertz frequencies. IEEE Sensors J. 2018, 18, 9230–9235. [Google Scholar] [CrossRef]
  26. Wang, Y.; Wang, Y.; Guo, K.; Guo, Z. Detecting targets’ longitudinal and angular accelerations based on vortex electromagnetic waves. Measurement 2022, 187, 110278. [Google Scholar] [CrossRef]
  27. Mitri, F.G. Electromagnetic wave scattering of a high-order Bessel vortex beam by a dielectric sphere. IEEE Trans. Antennas Propag. 2011, 59, 4375–4379. [Google Scholar] [CrossRef]
  28. Liu, K.; Gao, Y.; Li, X.; Cheng, Y. Target scattering characteristics for OAM-based radar. AIP Adv. 2018, 8, 0250022. [Google Scholar] [CrossRef]
  29. Wu, Z.; Qu, T.; Wu, J.; Wu, Z.; Yang, L.; Li, X. Scattering of electromagnetic waves with orbital angular momentum on metallic sphere. IEEE Antennas Wirel. Propag. Lett. 2020, 19, 136–1369. [Google Scholar] [CrossRef]
  30. Wu, Z.; Wu, J.; Li, H.; Qu, T.; Meng, X.; Xu, Q.; Wu, Z.; Bai, J.; Yang, L.; Gong, L.; et al. Integrated physical optics for calculating electric-large metallic sphere scattering irradiated by vortex wave in microwave frequency band. IEEE Antennas Wirel. Propag. Lett. 2022, 21, 1288–1292. [Google Scholar] [CrossRef]
  31. Wu, Z.; Wu, J.; Qu, T.; Wu, Z.; Xu, Q.; Li, H.; Yang, L.; Meng, X.; Bai, J. Scattering characteristics of an electrically-large aircraft objects illuminated by Bessel vortex beams. IEEE Access 2022, 10, 126023–126029. [Google Scholar] [CrossRef]
  32. Zhang, X.; Su, X.; Wu, Z.; Ma, L.; Li, X.; Bai, J. Analysis of electromagnetic scattering from typical targets for orbital-angular-momentum waves: Theoretical model. IET Microw. Antennas Propag. 2022, 16, 699–708. [Google Scholar] [CrossRef]
  33. Chen, X.; Li, H.; Wu, T.; Meng, X.; Li, F. Near-field electromagnetic scattering of Bessel vortex beam by metal target. Acta Phys. Sin. 2023, 72, 100302. [Google Scholar] [CrossRef]
  34. Zhu, Y.; Chen, M.; Zhang, Y. Propagation of the OAM mode carried by partially coherent modified Bessel-Gaussian beams in an anisotropic non-Kolmogorov marine atmosphere. J. Opt. Soc. Am. A 2016, 33, 2277–2283. [Google Scholar] [CrossRef]
  35. Cui, X.; Yin, X.; Chang, H.; Zhang, Z.; Wang, Y.; Wu, G. A new method of calculating the orbital angular momentum spectra of Laguerre–Gaussian beams in channels with atmospheric turbulence. Chin. Phys. B 2017, 26, 232–238. [Google Scholar] [CrossRef]
  36. Watkins, R.J.; Dai, K.; White, G.; Li, W.; Miller, J.K.; Morgan, K.S.; Johnson, E.G. Experimental probing of turbulence using a continuous spectrum of asymmetric OAM beams. Opt. Express 2020, 28, 924–935. [Google Scholar] [CrossRef]
  37. Petrov, D.; Rahuel, N.; Molina-Terriza, G.; Torner, L. Characterization of dielectric spheres by spiral imaging. Opt. Lett. 2012, 37, 869–871. [Google Scholar] [CrossRef] [PubMed]
  38. Qu, T.; Wu, Z.; Shang, Q.; Wu, J.; Bai, L. Interactions of high-order Bessel vortex beam with a multilayered chiral sphere: Scattering and orbital angular momentum spectrum analysis. J. Quant. Spectrosc. Radiat. Transf. 2018, 217, 363–372. [Google Scholar] [CrossRef]
  39. Liu, K.; Liu, H.; Sha, W.; Cheng, Y.; Wang, H. Backward scattering of electrically large standard objects illuminated by OAM Beams. IEEE Antennas Wirel. Propag. Lett. 2020, 19, 1167–1171. [Google Scholar] [CrossRef]
  40. Shi, C.; Cheng, M.; Guo, L.; Lavery, M.P.J.; Wang, P.; Liu, S.; Li, R.; Li, J. Particle Scattering Induced Orbital Angular Momentum Spectrum Change of Vector Bessel–Gaussian Vortex Beam. Remote Sens. 2022, 14, 4550. [Google Scholar] [CrossRef]
  41. Sun, M.; Liu, S.; Guo, L.; Huang, K.; Cheng, M. Scattering characteristics of electrically large arbitrarily shaped targets illuminated by an off-axis vortex electromagnetic beam. J. Appl. Phys. 2023, 133, 124905. [Google Scholar] [CrossRef]
  42. Song, P.; Cui, Z.; Hui, Y.; Zhao, W.; Wang, J.; Han, Y. Explicit analytical expressions for the electromagnetic field components of typical structured light beams. J. Quant. Spectrosc. Radiat. Transf. 2020, 241, 106715. [Google Scholar] [CrossRef]
  43. Knott, E.F.; Shaeffer, J.F.; Tuley, M.T. Radar Cross Section, 2nd ed.; SciTech Publishing: Boston, MA, USA, 2004; pp. 189–193. [Google Scholar]
  44. Zhao, W. Study on Prediction Techniques of Radar Cross Section of Complex Targets. Ph.D. thesis, Xidian University, Xi’an, China, 1999. [Google Scholar]
  45. Swift, C.T.; Beck, F.B.; Thomson, J.; Castellow, S.L., Jr. RAM C-III S-band diagnostic experiment. In Proceedings of the Entry Plasma Sheath and its Effects on Space Vehicle Electromagnetic Systems, Hampton, VA, USA, 1 January 1971. [Google Scholar]
  46. Liu, S.; Guo, L. Analyzing the Electromagnetic Scattering Characteristics for 3-D Inhomogeneous Plasma Sheath Based on PO Method. IEEE Trans. Plasma Sci. 2016, 44, 2838–2843. [Google Scholar] [CrossRef]
  47. Michielssen, E.; Sajer, J.; Ranjithan, S.; Mittra, R. Design of lightweight, broad-band microwave absorbers using genetic algorithms. IEEE Trans. Microw. Theory 1993, 41, 1024–1031. [Google Scholar] [CrossRef]
Figure 1. Schematic of an electrically large target illuminated by a Bessel vortex beam.
Remotesensing 16 00754 g001
Figure 2. Scattering of a single plane wave incident on coating materials.
Remotesensing 16 00754 g002
Figure 3. Intensity distribution of the x, y, and z components of the electric and magnetic fields in the xoy plane (z = 0) for Bessel beams with x-linear polarization (x-LP), y-linear polarization (y-LP), left-circular polarization (L-CP), and right-circular polarization (R-CP). The receiving plane has an area of 4 × 4 m2.
Remotesensing 16 00754 g003
Figure 4. Orbital angular momentum (OAM) spectral distributions corresponding to the three components Ex, Ey, and Ez of incident electric fields with different polarizations x-LP, L-CP, and R-CP incidence. Panels (ac,df,gi) correspond to the OAM spectral distributions under x-LP, L-CP, and R-CP incident conditions. The first to third columns represent the spectral distribution corresponding to the Ex, Ey, and Ez components of incident electric fields.
Remotesensing 16 00754 g004
Figure 5. Comparison of the results calculated by the physical optics (PO) algorithm and FEKO simulation software. Panel (a) shows the radar cross section (RCS), and panels (b,c) are the scattering field intensity distributions for a perfect electric conductor (PEC) blunt cone obtained by the PO algorithm and FEKO software, respectively. Panel (d) is the RCS, and panels (e,f) are the scattering field intensity distributions for a blunt cone coated by dielectric, obtained by the PO algorithm and the FEKO software, respectively.
Remotesensing 16 00754 g005
Figure 6. Scattering field intensity and OAM spectral distributions for the same transmission and reception polarizations, but different incident topological charges. Panels (ac,gi,mo) correspond to the scattering electric field intensity distributions, and panels (df,jl,pr) correspond to the scattering OAM spectral distributions. The three columns correspond to different incident topological charges (l = 1, 2, and 3). The calculation results for the first and second, third and fourth, and fifth and sixth rows correspond to x-LP incidence and x-LP reception, L-CP incidence and L-CP reception, and R-CP incidence and R-CP reception, respectively.
Remotesensing 16 00754 g006aRemotesensing 16 00754 g006b
Figure 7. Scattering field intensity and scattering OAM spectral distribution of the components Ex, Ey, and Ez with different incident-beam polarization. Panels (ac,gi,mo) correspond to the scattering electric field intensity distributions, and panels (df,jl,pr) correspond to the scattering OAM spectral distributions. The three columns respectively correspond to the cases of the Ex, Ey, and Ez components. The calculated results for the first and second, third and fourth, and fifth and sixth rows correspond to the x-LP, L-CP, and R-CP incidences, respectively.
Remotesensing 16 00754 g007aRemotesensing 16 00754 g007b
Figure 8. Scattering field intensity and scattering OAM spectral distribution of metal, dielectric, and coating targets under different topological-charge incidence conditions. Panels (ac,gi,mo) correspond to the scattering electric field intensity distributions, and panels (df,jl,pr) correspond to the scattering OAM spectra. The three columns respectively correspond to the cases of topological charges l = 1, 2, and 3. The calculated results for the first and second, third and fourth, and fifth and sixth rows correspond to metal, dielectric, and coating targets, respectively.
Remotesensing 16 00754 g008aRemotesensing 16 00754 g008b
Figure 9. One-dimensional intensities of the scattering field in the polarization direction, where the beam is incident with topological charges in the range of 1–3. The receiving plane is located at z = 60 m. Subfigures (ac) correspond to topological charges l with 1, 2, and 3, respectively.
Remotesensing 16 00754 g009
Figure 10. Scattering field intensity and scattering OAM spectral distributions of metal, dielectric, and coating targets under different half-cone angle incidence conditions. Panels (ac,gi,mo) correspond to the scattering electric field intensity distributions, and panels (df,jl,pr) correspond to the scattering OAM spectra. The outcomes are the same as those in Figure 8, but the first three columns correspond to half-cone angles of 2.8°, 10°, and 20°, respectively.
Remotesensing 16 00754 g010aRemotesensing 16 00754 g010b
Figure 11. Scattering field intensity and scattering OAM spectral distributions of metal, dielectric, and coating targets at different receiving-plane distances. Panels (ac,gi,mo) correspond to the scattering electric field intensity distributions, and panels (df,jl,pr) correspond to the scattering OAM spectra. The outcomes are the same as those in Figure 8, but the first three columns correspond to receiving-plane and target distances of 50 m, 80 m, and 100 m, respectively.
Remotesensing 16 00754 g011aRemotesensing 16 00754 g011b
Figure 12. Scattering field intensity and scattering OAM spectral distributions of metal, dielectric, and coating targets at different beam offset distances. Panels (ac,gi,mo) correspond to the scattering electric field intensity distributions, and panels (df,jl,pr) correspond to the scattering OAM spectra. The outcomes are the same as those in Figure 8, but the first three columns correspond to the beam offset distances 0.05 m, 0.1 m, and 0.15 m.
Remotesensing 16 00754 g012aRemotesensing 16 00754 g012b
Figure 13. Scattering field intensity and scattering distributions of the OAM spectra of metal, dielectric, and coating targets at different incident frequencies. Panels (ac,gi,mo) correspond to the scattering electric field intensity distributions, and panels (df,jl,pr) correspond to the scattering OAM spectra. The outcomes are the same as those in Figure 8, but the first three columns correspond to incident frequencies 3 GHz, 5 GHz, and 10 GHz.
Remotesensing 16 00754 g013aRemotesensing 16 00754 g013b
Table 1. Total proportions of different orbital angular momentum (OAM) modes of the scattering field on the receiving plane when the incident vortex beams carry different topological charges l. The data in the table (left to right) correspond to metal, dielectric, and coating targets.
Total Mode Proportions of the Scattering Field of Targets Made from Different Materials
OAM Modesl = 1l = 2l = 3
MetalDielectricCoatingMetalDielectricCoatingMetalDielectricCoating
−50.00070.00090.00120.00120.00140.00160.00280.00160.0016
−40.00170.00140.00190.00290.00190.00220.00390.00220.0025
−30.00310.00240.00420.00270.00240.00350.00930.00950.0097
−20.00220.00330.00550.00590.00920.00990.01100.01520.0116
−10.22230.05880.02600.00630.00990.00720.01900.02630.0150
00.00550.00490.00440.27950.08130.03070.02210.02900.0101
10.55390.86110.91680.00520.00920.00820.26760.08850.0300
20.00740.00870.01060.49220.81020.89160.01010.01330.0122
30.19660.05570.02540.00880.01210.01310.46560.73960.8581
40.00440.00170.00270.18950.06000.02910.01080.01500.0168
50.00230.00110.00120.00560.00240.00290.17780.05980.0324
Disclaimer/Publisher’s Note: The statements, opinions and data contained in all publications are solely those of the individual author(s) and contributor(s) and not of MDPI and/or the editor(s). MDPI and/or the editor(s) disclaim responsibility for any injury to people or property resulting from any ideas, methods, instructions or products referred to in the content.

