Article

Integrating Dendrochronological and LiDAR Data to Improve Management of Pinus canariensis Forests under Different Thinning and Climatic Scenarios

by
Rafael M. Navarro-Cerrillo
1,*,†,
Eva Padrón Cedrés
2,
Antonio M. Cachinero-Vivar
1,†,
Cristina Valeriano
3 and
Jesús Julio Camarero
3
1
Laboratory of Dendrochronology, Silviculture and Climate Change, Department of Forestry, School of Agriculture and Forestry, University of Córdoba, DendrodatLab-ERSAF, Edif. Leonardo da Vinci, Campus de Rabanales s/n, 14071 Córdoba, Spain
2
Área de Gestión del Medio Natural y Seguridad, Cabildo Insular de Tenerife, Plaza de España s/n, 38003 Santa Cruz de Tenerife, Spain
3
Instituto Pirenaico de Ecología (IPE-CSIC), Avda. de Montañana 1005, 50056 Zaragoza, Spain
*
Author to whom correspondence should be addressed.
These authors contributed equally to this work.
Remote Sens. 2024, 16(5), 850; https://doi.org/10.3390/rs16050850
Submission received: 5 January 2024 / Revised: 16 February 2024 / Accepted: 26 February 2024 / Published: 29 February 2024
(This article belongs to the Special Issue Vegetation Structure Monitoring with Multi-Source Remote Sensing Data)

Abstract

:
Thinning focused on achieving growth and diameter management objectives has typically led to stands with reduced climate sensitivity compared to unthinned stands. We integrated dendrochronological with Airborne Laser Scanner (LiDAR) data and growth models to assess the long-term impact of thinning intensity on Canary pine (Pinus canariensis) radial growth. In 1988, 18 permanent treatment units were established in 73-year-old Canary pine plantations and three thinning treatments were applied (C–control-unthinned; 0% basal area removal; MT–moderate thinning: 10% and 15% basal area removal, and HT–heavy thinning: 46% and 45% basal area removal on the windward and leeward slopes, respectively). Dendrochronological data were measured in 2022 and expressed as basal area increment (BAI). The impact of climate on growth was examined by fitting linear regression models considering two different Representative Concentration Pathway (RCP) climate scenarios, RCP 2.6 and RCP 4.5. Finally, LiDAR data were used for standing segmentation to evaluate changes in overall growth under different climatic scenarios. The LiDAR–stand attributes differed between aspects. The BAI of the most recent 20 years (BAI20) after thinning was significantly higher for the moderate and heavy treatments on the leeward plots (F = 47.31, p < 0.001). On the windward plots, BAI decreased after moderate thinning. Considerable thinning treatments resulted in stronger changes in growth when compared to RCP climatic scenarios. From a silviculture perspective, the mapping of canopy structure and growth response to thinning under different climatic scenarios provides managers with opportunities to conduct thinning strategies for forest adaptation. Combining dendrochronological and LiDAR data at a landscape scale substantially improves the value of the separate datasets as forecasted growth response maps allow improving thinning management plans.

1. Introduction

Forest ecosystems have an irreplaceable value as regards mitigating climate change because forest growth is a major carbon sink [1]. The recent environmental shift has nudged numerous forest ecosystems toward the edges of their historical climatic limits, thus increasing the potential for sudden alterations in characteristics and functions due to changes in disturbance regimes [2]. Given the likelihood of forthcoming climate changes including rising temperatures [3], present-day forest management research is significantly focused on comprehending whether forests will undergo gradual or abrupt shifts in response to escalating climate pressures [4]. However, the presence of tipping points remains uncertain for several systems, and if they do exist, it is unclear whether constraining climate warming to below +2 °C would be adequate to avert critical transformations, i.e., sudden switches from one forest ecosystem state to another [5]. One pivotal inquiry into current forest management revolves around discovering how these ecosystems will react to climatic-derived disturbance and precisely quantifying the influential relationships between silvicultural actions and forest adaptability [6,7].
Thinning regulates the density of trees within a stand, subsequently influencing natural growth patterns, stand structure, and development [8]. Thinning practices focused on achieving growth and diameter management objectives have typically demonstrated reduced climate sensitivity compared to unthinned control stands [9]. By decreasing the basal area of a forest, thinning can help to reduce tree mortality caused by drought [10]. This suggests its potential as an adaptive tool in forest management. Over time, thinning has the potential to shape the structure and functional diversity of forests, offering a sustainable strategy for climate-adaptive management. Improving both the structural and functional diversity of forests not only contributes to stabilizing ecosystem processes, adapting them to disturbances and changing climatic conditions, but also improves the delivery of ecosystem goods and services [11]. In pine-planted mountain forests, where there are generally high-density stocks with a limited supply of water, radial growth responses to climate vary significantly depending on tree density [12,13,14]. Furthermore, according to one study [15], in order to predict the response of forest ecosystems to climate change, the modeling of radial increments serves as a well-established quantitative measure with which to explore variations in forest adaptation to thinning, thus shedding light on how future climatic scenarios will impact on tree growth and adaptation to stress [16].
The Canary pine (Pinus canariensis Sweet ex Spreng.) is a conifer species that is endemic to the western Canary Islands, where it forms pure stands under quite different ecological conditions with respect to elevation and geographical position [17]. In Tenerife, Canary pine forests form the alpine timberline, where the climate is characterized by summer drought and winter coldness including frost days [18]. The availability of water is a crucial limiting resource in many Canary pine forests, and it has been demonstrated that these forests are susceptible to the effects of global warming, despite their morphological and physiological adaptations (e.g., sprouting ability) to tolerate drought and heat stress [19]. High-density Canary pine forests planted on Tenerife during the 20th century exacerbate the risks of wildfires, pests, and forest dieback. Forest managers have recently been re-evaluating the value of these pine plantations, with the goal of adapting the original pine plantations through the use of silvicultural methods [20,21]. Furthermore, the different environmental conditions across limited geographic areas within the Canary Islands have been influenced by trade winds, resulting in a notable contrast between the windward (northern) slopes, where moisture is primarily received, and the drier leeward (southern) slopes. Existing studies have addressed thinning effects on Canary pine plantations to assess the effects of various management approaches on species regeneration [22], microclimate conditions [23], tree radial growth [24,25,26], or the naturalizing of pinewoods [20,27].
Dendrochronology has commonly been used to precisely determine the impact of thinning on radial growth [14]. However, dendrochronological data operate on a tree to plot scale, collecting data over several years by means of a systematic design. These limitations have led some studies to explore the possibility of integrating tree-ring and remote-sensing data for stand-level estimation of forest parameters including changes in growth [28,29]. The use of remotely sensed data from technologies such as Airborne Laser Scanning (LiDAR) enables the precise estimation of various forest stand parameters such as changes in tree volume, supporting informed decision making in forest management [30]. The typical steps involved in a LiDAR-based forest inventory include stand delineation and tree-species stratification. Even though dendrochronological data result in a large temporal dataset, their field sampling fraction is significantly smaller when compared to that of LiDAR and they only provide data on radial growth (e.g., basal area increments, BAI). Low-density ALS systems (1–5 points m−2) have proven their effectiveness in describing the three-dimensional structure of aboveground vegetation, offering highly detailed and precise spatially explicit information on the structure of forest vegetation [31]. However, characterizing forest stands using ALS technology over larger areas requires careful consideration of various sampling, statistical, and methodological constraints. Approaches combining dendrochronology and LiDAR data may allow the creation of wall-to-wall forest management map parameters on stand-to-landscape scales. In some countries, a proliferation of large-scale LiDAR campaigns focused primarily on creating accurate digital terrain models have been conducted during recent years and have been used to predict stand-level attributes [32] and develop spatially explicit mapping of vertical structure. The use of dendrochronological plots has been suggested to enhance the accuracy of the LiDAR-based mapping of forest attributes in a spatially explicit and economically viable manner.
Given the diverse potential applications of dendrochronology and the increasing availability of LiDAR data, there is a compelling need to explore whether it is possible to integrate those two types of data to characterize the impacts of thinning intensity and different climate scenarios on tree growth over large areas. In this study, we integrated dendrochronological and LiDAR data and used growth models to assess the long-term impact of thinning intensity on Canary pine radial growth, using previous experimental stands on Tenerife as a basis [22,24]. This research endeavors to address the following questions: (i) How do growth patterns, based on BAI data, change according to the windward and leeward slopes and thinning intensity? (ii) Can BAI models estimate future growth patterns under different climatic scenarios with diverse warming rates? (iii) To what extent can a model with which to predict dendrochronological growth be integrated with LiDAR data in order to predict forest attributes such as changes in volume? Overall, we aim to develop models capable of mapping tree and stand attributes to inform forest management strategies. Understanding forest structure at the landscape level is crucial for the assessment of forest attribute interactions with growth regimes and climate-adapted forest management. Given the recent and anticipated future rise in the number, extent, and severity of the impacts of drought in southern Europe [33], identifying areas with a greater vulnerability to drought is imperative, and mapping high-density areas could help to identify locations in which thinning should be a priority and implemented at a landscape level.

2. Materials and Methods

2.1. Study Area

This study was conducted in the Cordillera Dorsal, which is located in the central region of Tenerife, Canary Islands, Spain (28°22′54″N; 16°26′05″W). Sampled sites are situated near the northeastern boundary of the “Corona Forestal” Natural Park (Figure 1, Table S1, Supplementary Materials). The study area covered 41,467 ha, about 25% of which corresponds to pine plantations and 30% of the “Corona Forestal” Natural Park. Mean forest attributes of the dominant vegetation types were derived from the permanent field plots of the Spanish Fourth NFI remeasured every ten years ([34] Table S1, Supplementary Materials). High-density P. canariensis plantations were established during the 1940–1960s for both hydrological and timber production purposes at about 1000–2000 m.a.s.l [20]. The terrain has slopes with gradients of 33–35°, primarily facing northwest. The principal environmental factors to influence the distribution of vegetation across the altitudinal gradients in Tenerife are elevation and wind exposure [18]. Trade winds occasionally bring moisture in the form of fog drip, resulting in dense undergrowth within the wet windward pine forests, while the leeward forests are drier and tend to have sparse shrub cover. Understory shrubs on the windward site primarily include Morella faya (Aiton) Wilbur, Erica arborea L., and Adenocarpus viscosus (Willd.) Webb & Berthel, while the leeward site features A. viscosus and Chamacytisus proliferus (L.f.) Link (Table S1, Supplementary Materials). The soils in this area have developed over deep volcanic scoria horizons and are classified as Entisols, specifically belonging to the Orthens suborder [35]. Soils texture is approximately 29.0% sand, 29.2% silt, and 41.8% clay.
The mean annual temperature and precipitation levels are approximately 16.9 °C and 1000–1250 mm, respectively. Notably, 70% of this precipitation falls between October and April, with high year-to-year variability, while there is a prolonged dry summer season (Figure 1). There was a noticeable upward trend in the mean annual temperature during the period spanning 1901 to 2006, although annual precipitation has not undergone any significant changes.

2.2. Experimental Design and Measures

In 1988, 18 permanent treatment units were established in a ~73-year-old pine plantation (1949 and 1953) that is representative of a larger area of over 1500 ha of Canary pine plantations [22,24] (Table S1, Supplementary Materials). On the windward side (N), two light thinning treatments were carried out (the removal of doubled trees and moderate thinning from below 40% of the previous density in 1978, and the removal of 33–40% by means of light pruning in 1985 [22]. On the leeward side, a light thinning from below took place in 1979 (a removal of 20–28% and doubled trees) and a second was conducted in 1985 (a removal of between 16 and 20% with a low pruning) [22].
Three blocks composed of three 625 m2 stands were randomly assigned to three thinning treatments (C–control or unthinned: 0% of basal area removal; MT–moderate thinning: 10% and 15% of basal area removal, and HT–heavy thinning: 46% and 45% of basal area removal on the windward and leeward slopes, respectively, [22]). Thinning activities were carried out manually, and the trees preferentially selected for thinning were those that were overtopped, small-sized, or dying looking for the balance of basal area between the same treatments and orientations [22] (Table 1 and Table S2). Significant differences in tree growth were found between the two locations and treatments at the time of the study. These differences resulted from the effect of prethinning (1978) and thinning (1988) [24].

2.3. Dendrochronological Data

Plots were remeasured in 2022 (diameter at breast height, 1.3 m above ground level –dbh-cm, determined using a Haglöf Mantax tree caliper, Långsele, Sweden; total height (H, m) determined using a Vertex IV hypsometer Haglöf, Sweden; stand density (N, tree ha−1); and basal area (G, m2 ha−1), all trees with a dbh > 10 cm) (Table 1). On each treatment site, 15 healthy and non-suppressed trees were selected, and two cores per tree were extracted at breast height (1.3 m), separated by 180° on the cross-slope sides of the stem, using a Pressler increment borer, thus comprising a total of 125 cores.
The cores were air-dried at room temperature and were subsequently glued to wooden mounts and progressively sanded to improve ring boundary visibility, after which ring series were visually cross-dated [36]. Tree-ring width was measured to the nearest 0.01 mm using binocular microscopes and a Lintab-TSAP measuring device (RinnTech, Heidelberg, Germany). The COFECHA program [37], which calculates moving correlations between each individual tree-ring series and the mean site series, was used to check dating errors. Tree-ring width data were transformed into basal area increment (BAI), which better reflects growth responses to thinning treatments because it is related to sapwood and transpiring canopy areas.
We then detrended each tree-ring width series by first fitting negative exponential or spline curves and then obtaining the residuals by dividing the observed values by the fitted values [36]. This was done to eliminate the influence of tree aging and stem enlargement and to remove long-term biological trends. The resulting individual series of ring-width indices were subsequently averaged into site-level chronologies using biweight robust means. These procedures were conducted using the dplR package [38] in the R statistical package [39]. Finally, several variables were calculated to characterize the tree-ring series: first-order autocorrelation of ring-width data (AC), which measures growth persistence between years t − 1 and t; mean sensitivity (MS) of standard ring-width indices, which quantifies relative changes in ring-width between consecutive years, and mean correlation between individual series of ring-width indices (Rbar), which assesses growth synchrony among coexisting trees [36].

2.4. Climate-Driven Growth Models

The impact of climate on radial growth was examined by carrying out a three-step analysis. We initially identified the climatic variables that were significantly correlated with radial growth and subsequently used a Linear Regression Model (MLRM) to correlate them with climatic variables. During the first two stages, climate data were obtained from a meteorological station located 20 km north of the study site (Izaña, 16°30′38″W, 28°18′04″N, 2390 m a.s.l.). The climate variables selected were daily minimal and maximal temperatures and total daily precipitation. This data made it possible to derive the following variables: monthly mean temperature (Temp), monthly precipitation (Prec), monthly potential evapotranspiration (PET) calculated using the Thornthwaite method [40], and monthly climatic water balance (WB, i.e., Prec–PET; [41]). Potential limitations between growth and climate were addressed by additionally averaging or summing these variables into bimonthly and semi-annual categories, spanning from January of the previous year to December of the current year. Finally, we calculated bootstrapped correlations between the detrended series of ring-width indices and detrended climatic variables. We considered the IPSL-CM5 Earth System Model (ESM) and two different Representative Concentration Pathway (RCP) scenarios (Figure S1, Supplementary Materials), RCP 2.6 and RCP 4.5, characterized by 1.5–2.0 °C and 2–3 °C warming rates, respectively [42]. Correlations between climate and ring-width data were computed for the period 1988–2100.

2.5. LiDAR Stand Segmentation

Low-density Airborne Laser Scanner (LiDAR) data were provided by GRAFCAN (https://www.grafcan.es/productos/lidar, accessed on 12 July 2023). The objective of the GRAFCAN project is to cover the entire Canary Island territory by employing airborne LiDAR sensors with a density of 1 point m−2 and an elevational accuracy better than 20 cm [43]. In our study area, the ALS flight was performed in 2016 and provided in 2 km × 2 km tiles of raw data points in a LAZ binary file (compressed LAS files), containing x and y coordinates (EPSG: 25,830 ETRS 1989/UTM Zone 30) and ellipsoidal elevation Z. In 2014, the Tenerife Forest Service developed ALS-derived models to estimate the main forest attributes of Pinus canariensis forests (Table S2, Supplementary Materials) based on ALS metrics and submetrics referenced field plots (Trimble Geo 7X, Westminster, CO, USA, N = 77). Using this plot set, prediction models of Quadratic Mean Diameter (Dg, cm), basal area (m2 ha−1), and tree height (H, m) were obtained at a 25 × 25 m grid through stepwise selection (Table S2, Supplementary Materials). Finally, 50 out of the 99 original parameters were used as regressors, including the mean, maximum and minimum values, mode, standard deviation, variance, interquartile distance, coefficients of skewness and kurtosis, average absolute deviation, and percentiles (Table S3, Supplementary Materials). The predefined set of ALS metrics was similar to previous models for Mediterranean pine species [44]. For modeling tree density (tree ha−1), a Weibull density function was used based on previous experience with Spanish pine species [45]. The models were fitted using the lme package [46] in R [39]. For complete information about the statistical parameters, see McGaughey [47]. Model accuracy was assessed through internal validation, including a Q-value overfitting test, and external validation and cross-validation. The mean absolute error (MAE) and mean squared error (MSE, %) were calculated for each model (tree density Weibull’s parameters were a = 29.72, MAE = 9.90%, MSE = 12.31%; b = 4.17, MAE = 21.61%, MSE = 28.60%) ([43], Table S3, Supplementary Materials).
Using forest attributes as a basis, stand segmentation was implemented using Orpheo ToolBox software for QGIS 3.28 [48] in the study area, as is commonly done when modeling forest attributes using ALS data in forest management inventories [49]. The models were ultimately used to produce predictions for tree density (N, tress ha−1) at stand scale covering the entire P. canariensis plantations in the study area, which included the current tree density in a particular stand that could potentially be thinned at a particular time. The locations of stands were delineated using ArcGisPro 2.0 (https://www.esri.com/en-us/arcgis/products/arcgis-pro/) from local orthophotographs [43] and these were used to plan silvicultural interventions.

2.6. Silvicultural Schemes

Using silvicultural plots as a basis, three forest management scenarios were generated that could be projected into a specific forest management plan. There were stands with very low (<250 tree ha−1), middle (<500 tree ha−1), and high tree density (>500 tree ha−1).
Changes in overall growth (m3 ha−1 year−1) in the different climatic scenarios (see Section 2.4) for the 2040- and 2060-year periods were calculated using the predicted growth for a thinning program on a stand scale. The silvicultural model used in this study was developed based on a previous study [50].

2.7. Cartography of Silviculture Planning

A current map of stand density was developed for P. canariensis forests on Tenerife (see Section 2.5). The original raster was reclassified into three different classes on the basis of tree density per hectare (<250 tree ha−1, <500 tree ha−1, and >500 tree ha−1) using the SAGA Reclassify Grid Values Module (ver. 2.2.5). The adaptive silviculture map for Canary pine plantations was estimated by calculating the mean value of tree density and growth for each stand. Each stand was assigned to a density class, and the growth models were applied in the four different climatic scenarios based on tree density.

2.8. Statistical Analysis

All variables were normalized (i.e., transformed into variables with zero mean and unit variance) prior to analyses. The effect of thinning was tested by analyzing post-thinning growth according to the thinning treatment and aspect using a two-way ANOVA model. The variables employed for the analyses were BAI20, BAIpreTH, BAIpost10, and BAIpostTH. All statistical analyses were conducted in R version 4.1.1 [39] and models were fitted using the lmer4 package [51].

3. Results

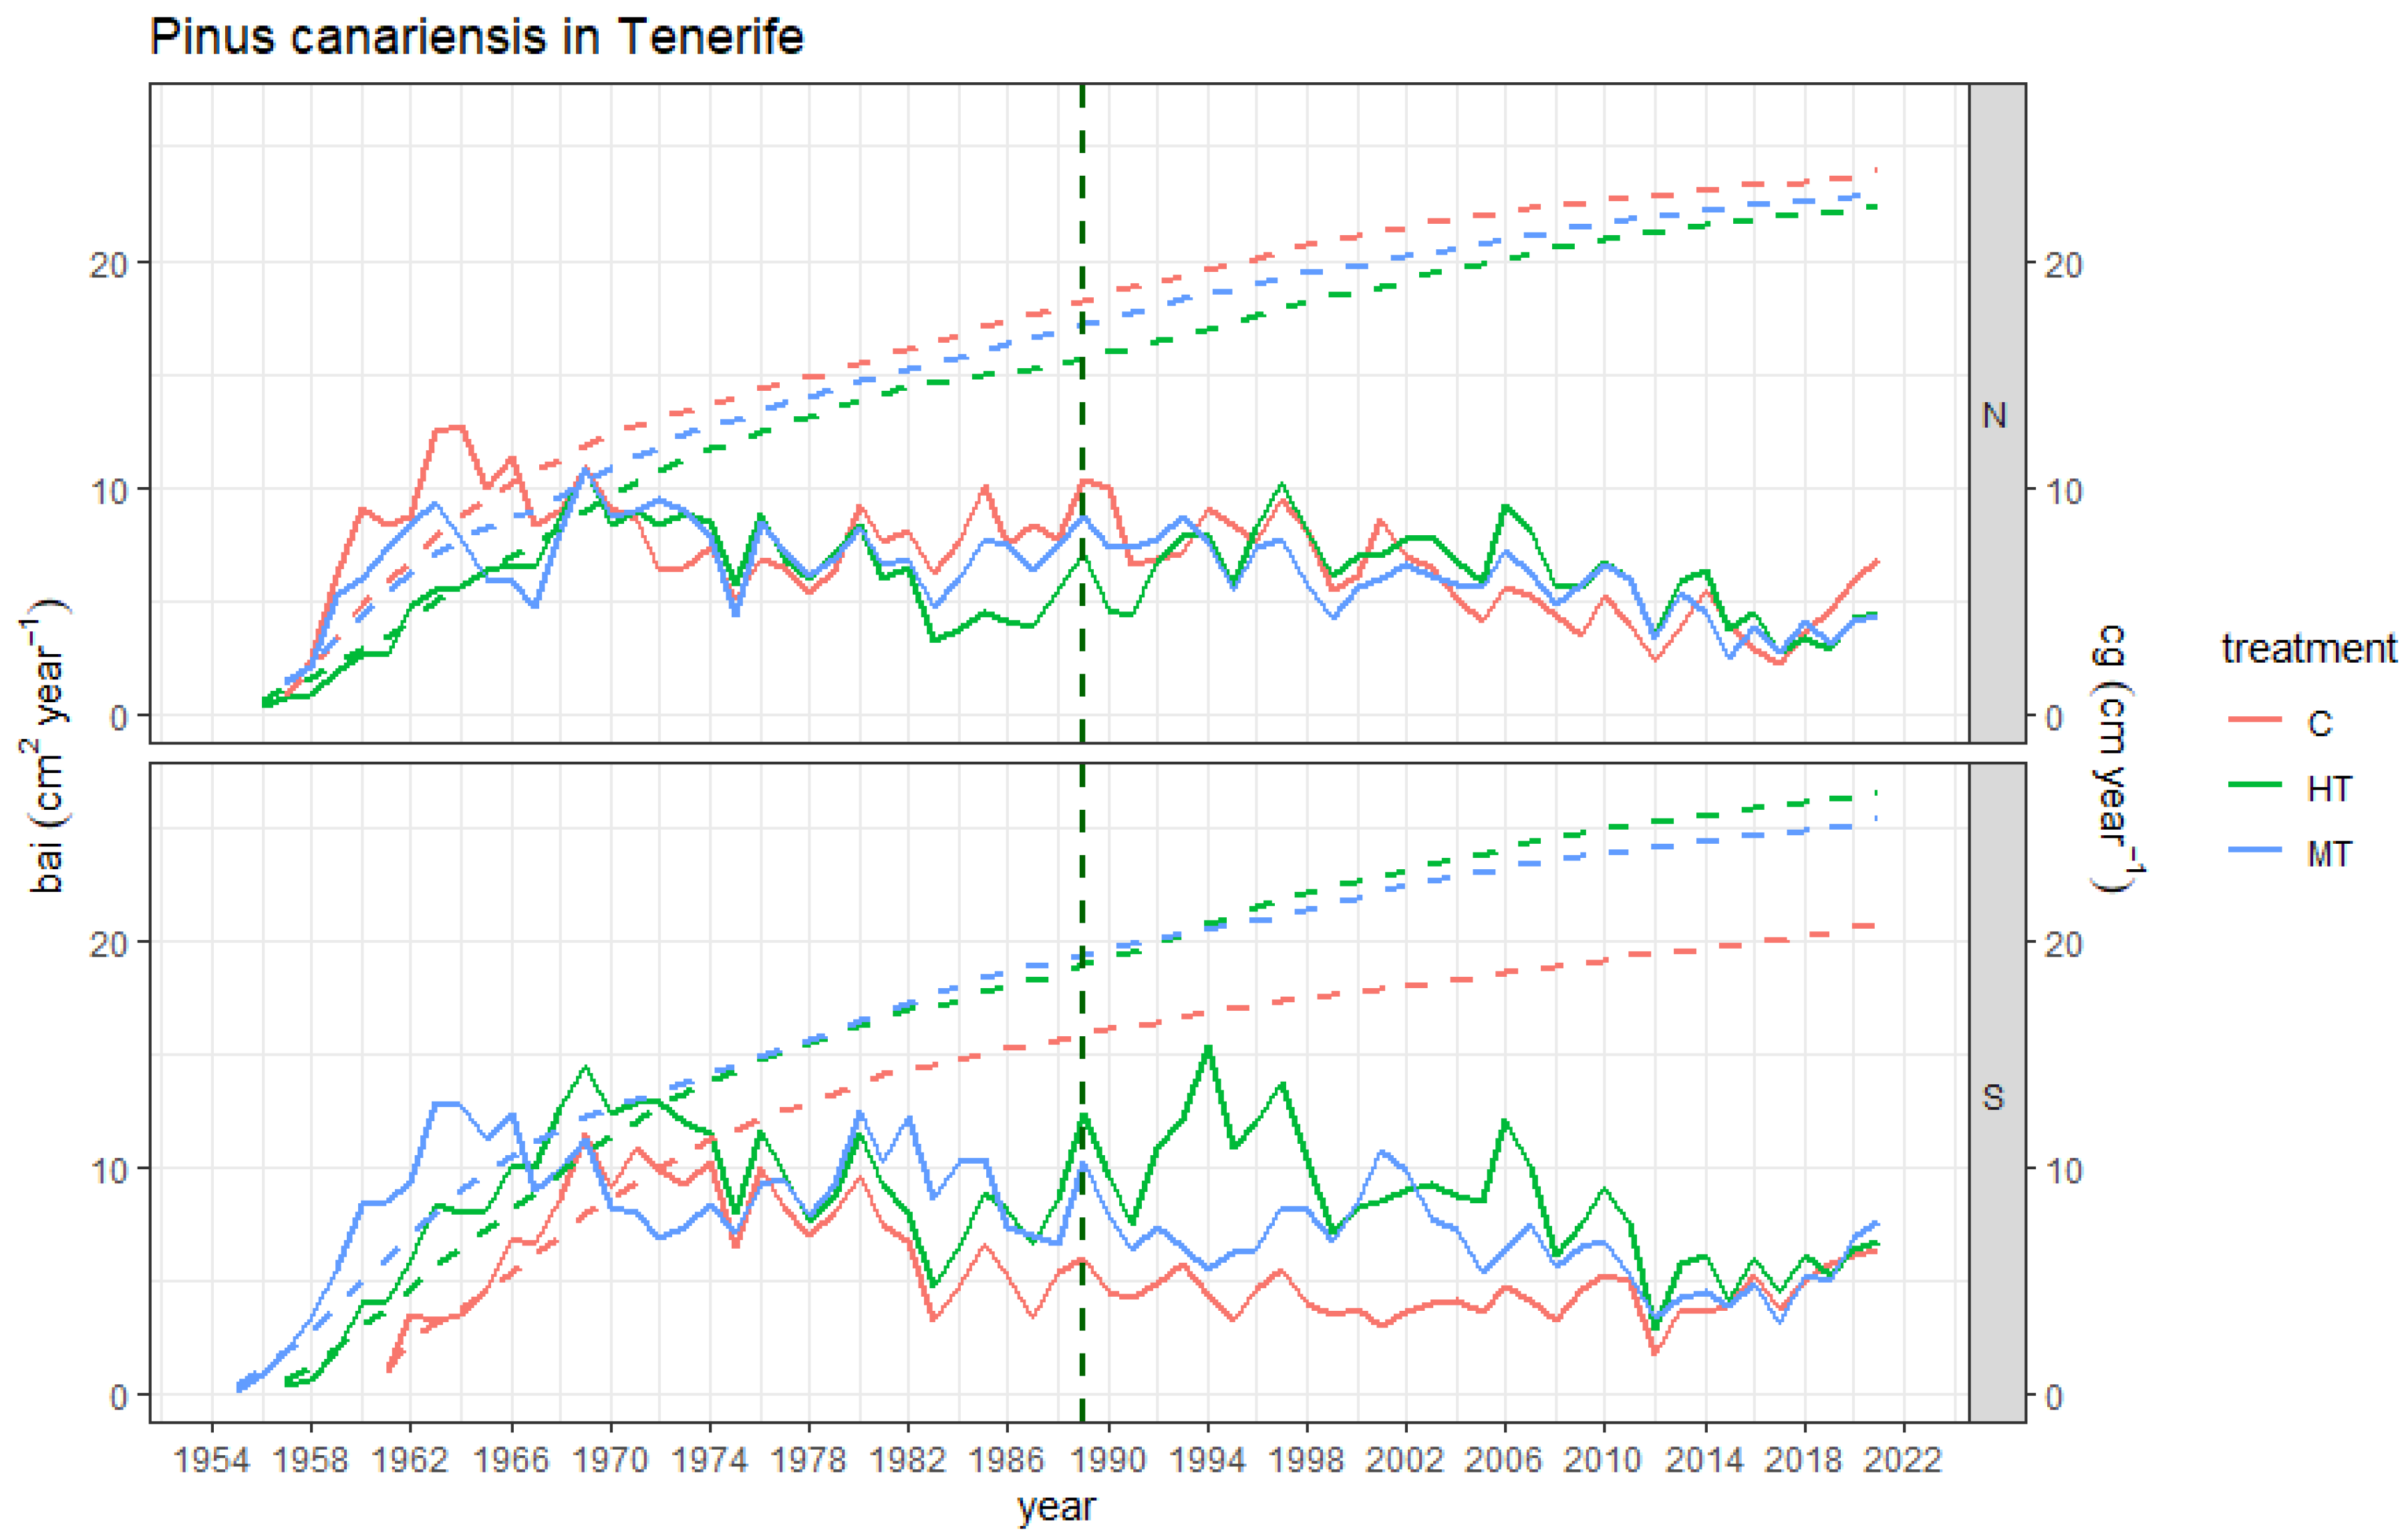
3.1. Stand-Level Growth Responses

The longest tree-ring series dated back to 1955, with small variations between the different blocks (1955–1961) (Figure 2, Table 2). The quality of standardized BAI chronologies was better on the windward side (Table 1), with the higher MS (0.34 vs. 0.30) and Rbar (0.33 vs. 0.29) on the drier leeward side suggesting an increasing importance of climatic constraints (water availability) for growth (Table 1). Synchronous reductions in growth were found on all sites before 1978, prior to carrying out the first thinning (Figure 2).
The 20-year BAI (BAI20) did not significantly differ among treatments, but there were significant differences following thinning (Table 1 and Table S2). Short-term variations in the BAI after thinning followed different patterns of variation for both aspects. On the windward plots, BAI20 was similar for all treatments (F = 1.35, p = 0.27), maintaining the same trend 10 years after thinning (BAIpost10, F = 0.19, p = 0.83) (Table 1, Figure 2). Conversely, BAI20 on the drier leeward plots was significantly higher for the moderate and heavy thinning (F = 12.17, p < 0.001, Table 1). BAIpost10 after thinning in this aspect was also significantly higher for the moderate and heavy treatments (F = 47.31, p < 0.001). Long-term variations in post-thinning BAI (BAIpostTH) followed similar patterns to those of BAIpost10 for both aspects. On the windward plots, BAIpost10 showed higher growth for controlled thinning, and a decrease after middle thinning (F = 1.17, p = 0.31).
However, BAIpostTH was higher after the heavy thinning treatment in the leeward aspect, with a sharp decrease in the control plots (F = 32.34, p < 0.001). Treatment and aspect and treatment were also significant predictors of BAIpost10 and BAIpostTH (Table 2).

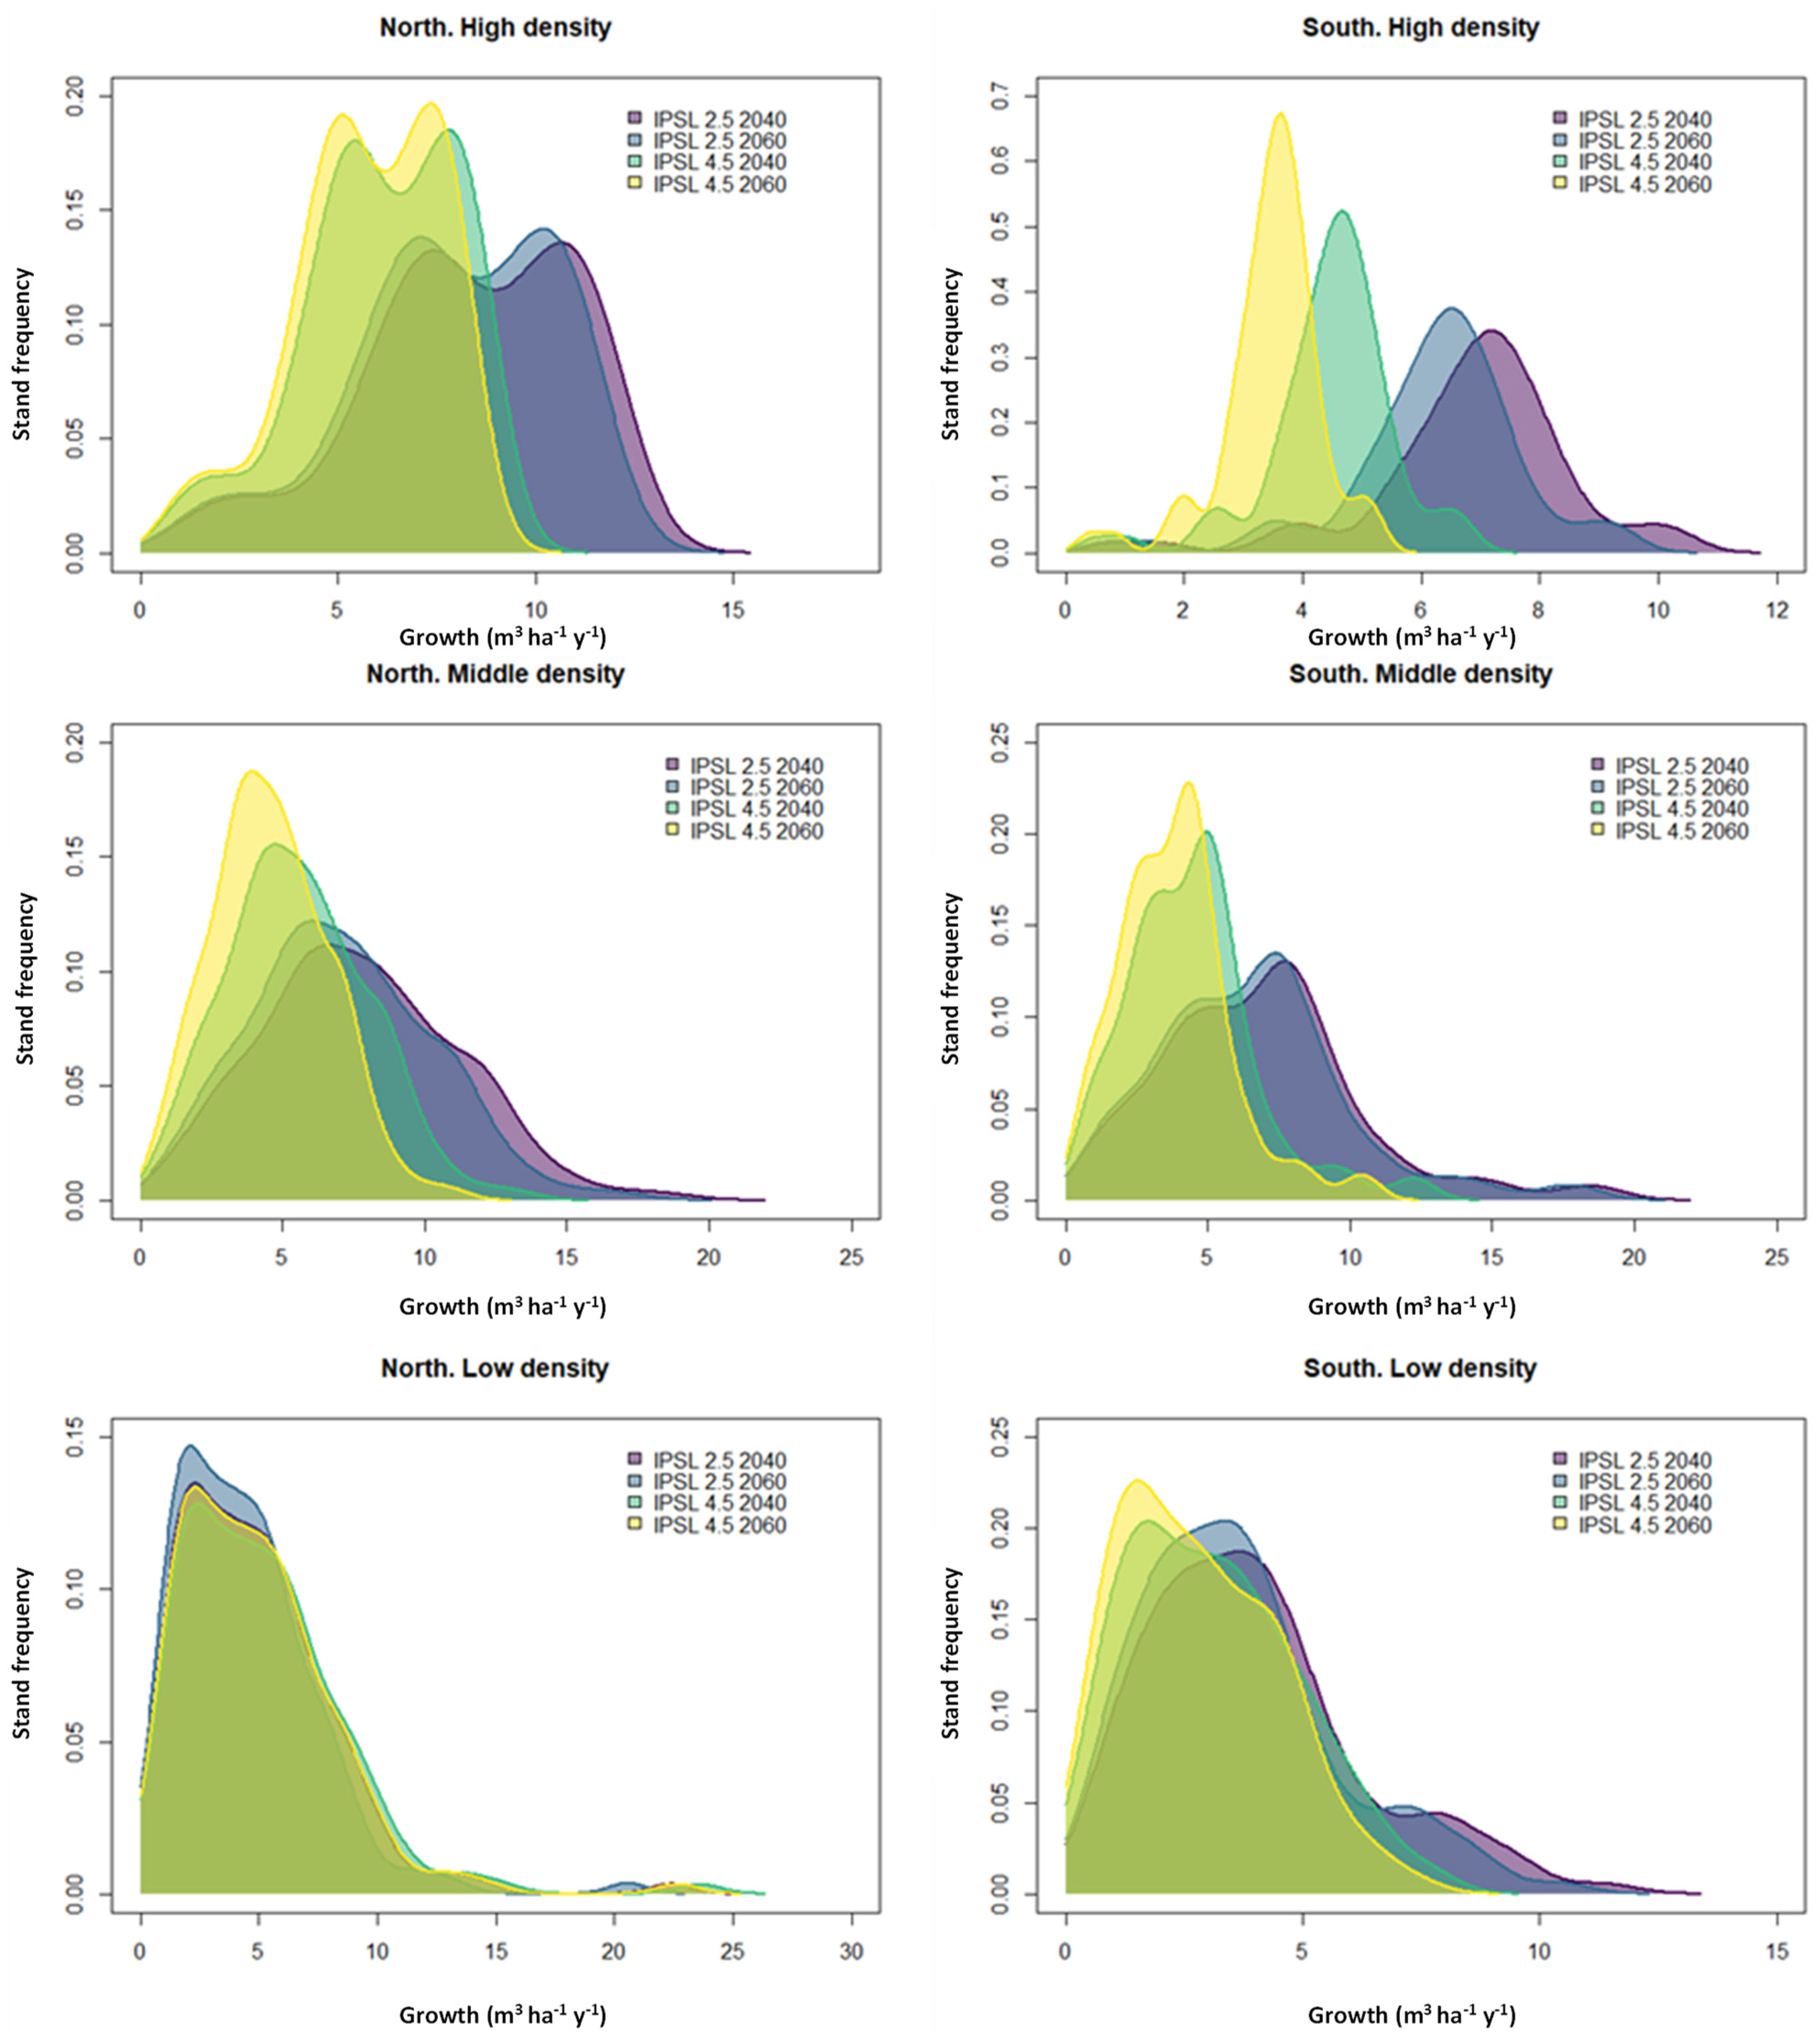
3.2. Growth Projections

The climate-driven growth models showed that temperature and precipitation both significantly influenced the variation in radial growth (Figure S2, Tables S3 and S4, Supplementary Materials). In the RCP2.6 scenario, temperature and precipitation were positively related to tree growth (R2 = 0.24, p < 0.001). In the RCP4.5 scenario, growth was positively correlated with temperature for the C and MT treatments in the leeward aspect (R2 = 0.48, p < 0.001).
With regard to the windward aspect, the RCP2.6 scenario showed an increasing growth trend for the C and MT treatments over the projected period (2020–2100) and predicted a slight decrease in growth for the HT treatment. However, in the leeward aspect, the decrease in growth inferred by the model was observed for the control treatment. In the case of the RCP4.5 scenario, models showed a rapid growth decrease for both aspects, with this being more prominent in the leeward aspect. Heavy thinning slightly increased growth in the windward aspect but showed negative growth trends; although this was less accentuated than for the other thinning treatments in the leeward aspect.

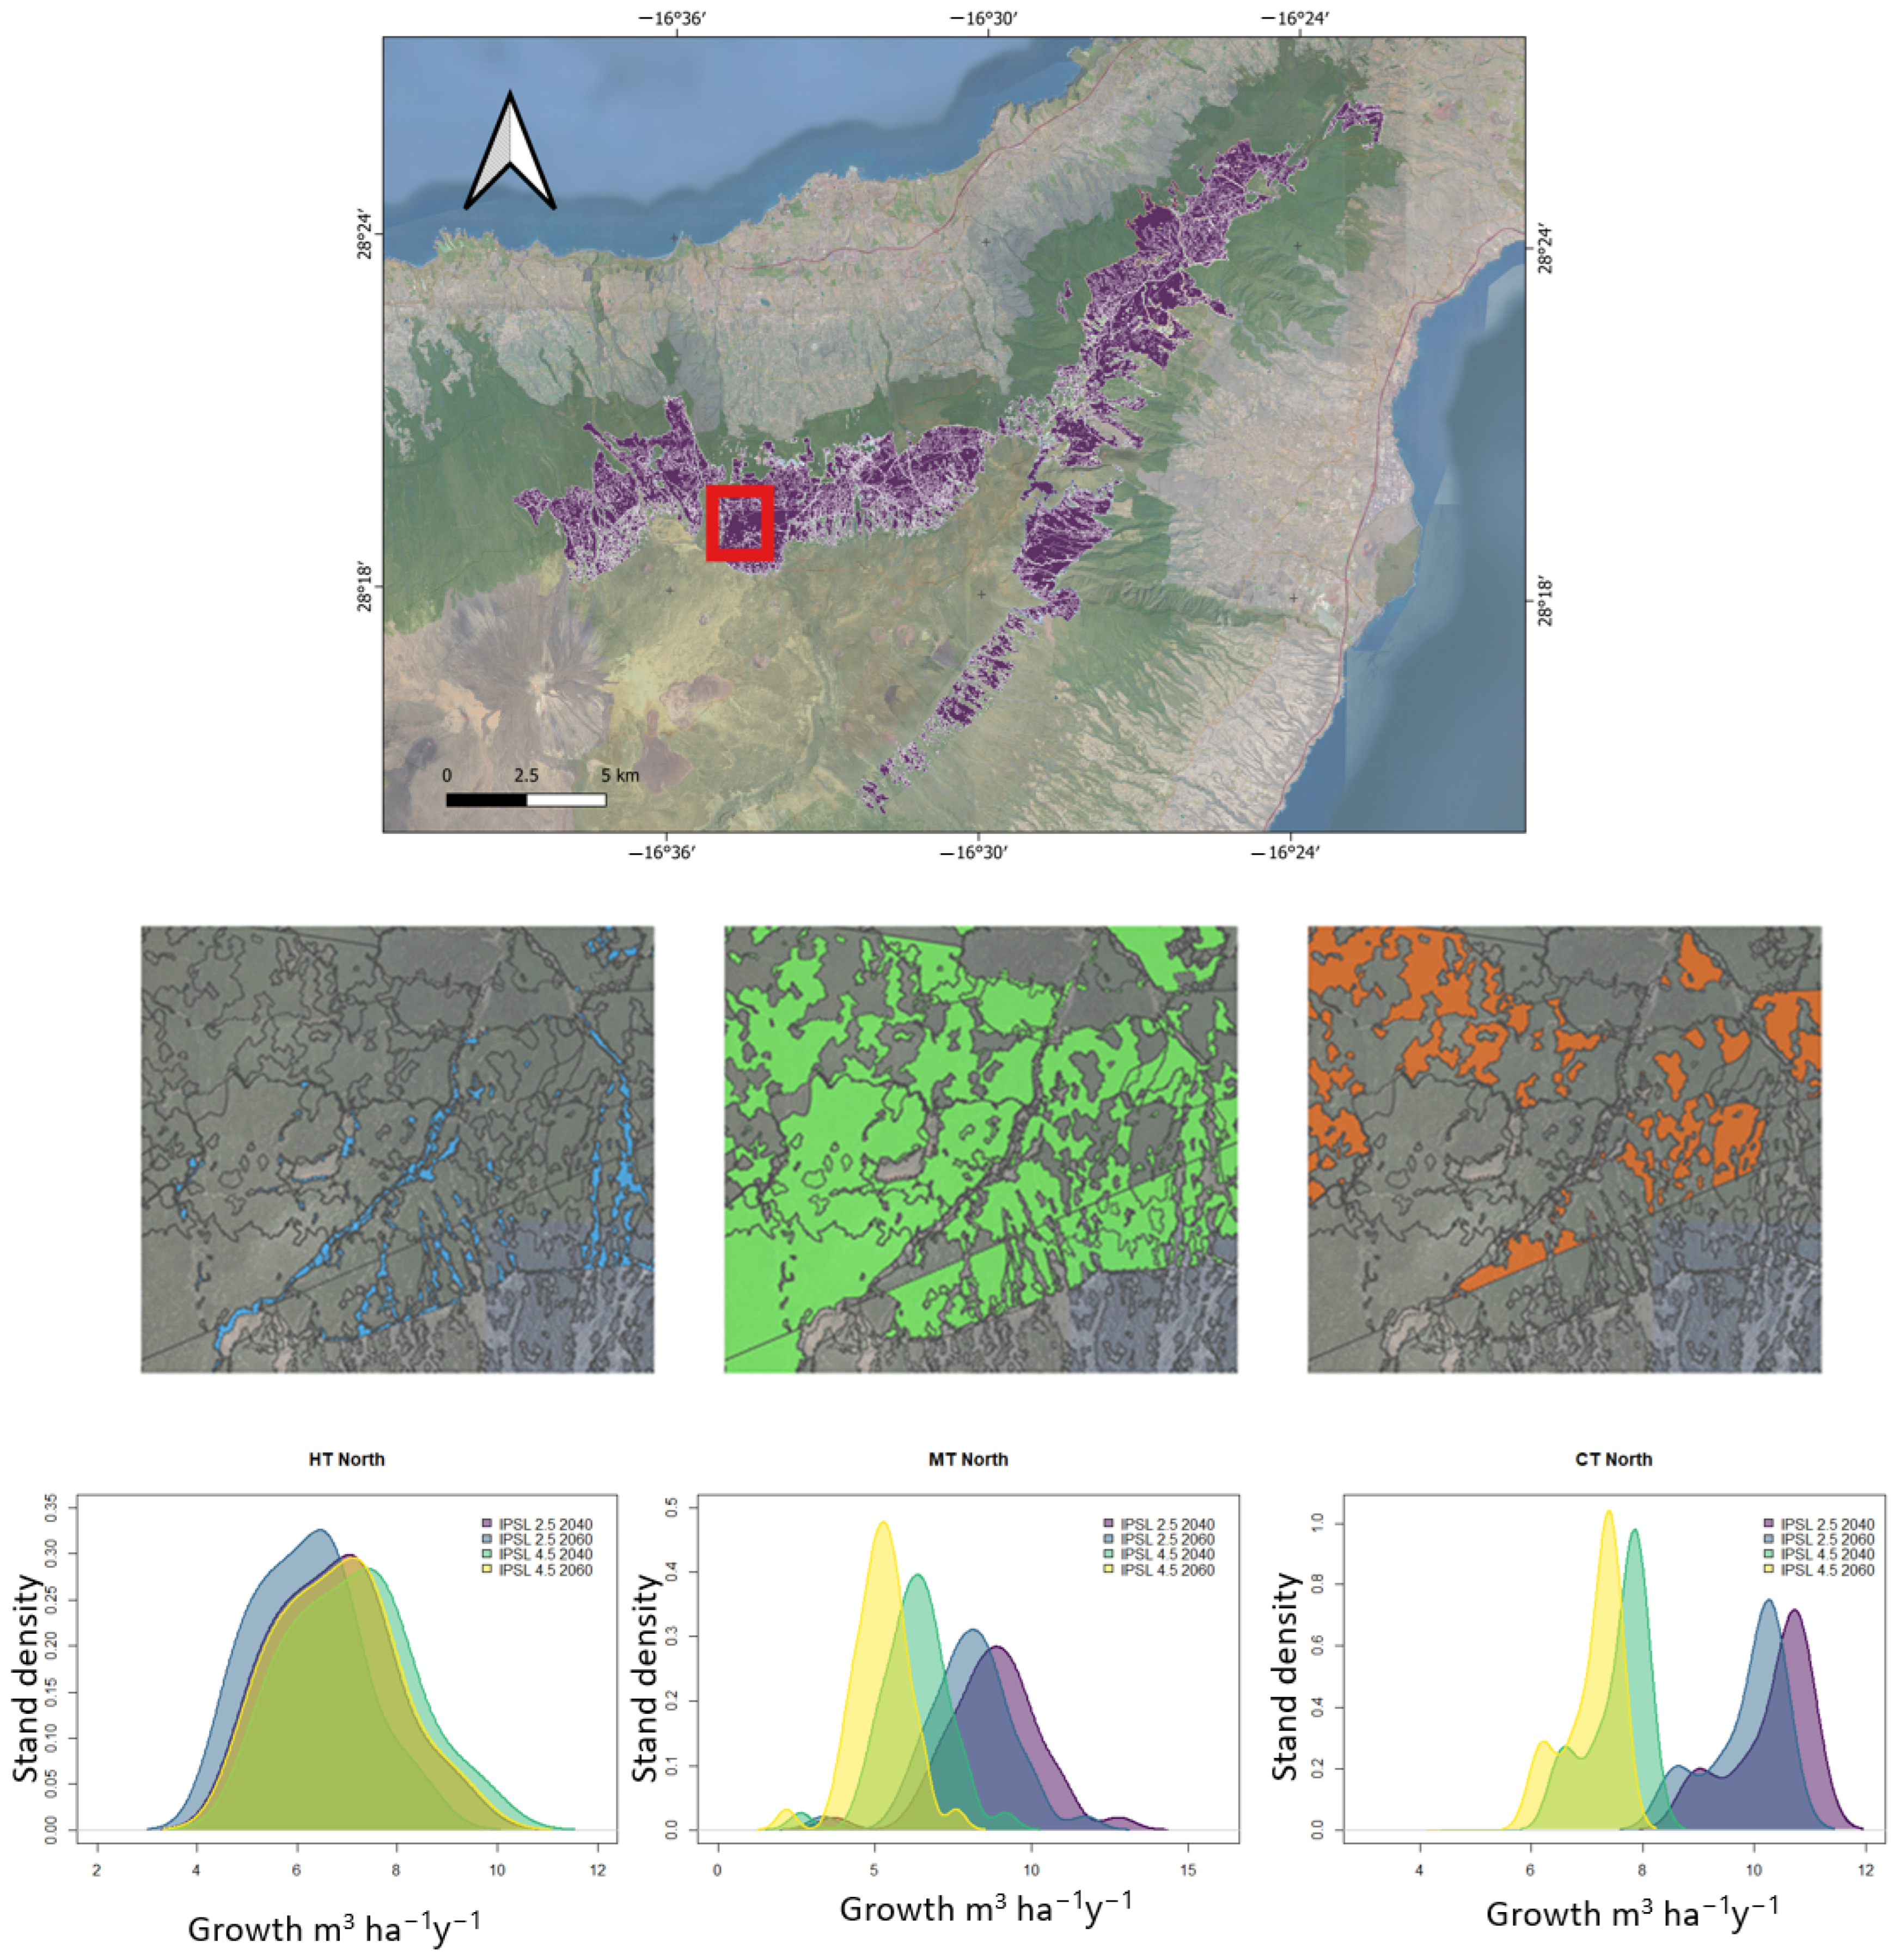
3.3. LiDAR Stand Attributes Used to Forecast Growth Trajectories

The tree density at stand scale derived from LiDAR-derived attributes was used to project growth according to aspects and tree density categories (Table S5, Supplementary Materials). Tree density, considering thinning treatments, resulted in stronger changes in growth compared to aspect and climatic scenarios (Figure 3), as already observed in the growth models (Figure 3). In the windward orientation and the most optimistic scenario (RCP 2.6), stands with a middle density (N = 250–500 trees ha−1) had a higher growth reduction (−8.52%), and stands with higher densities (N > 500 trees ha−1) had the lowest growth reduction (−4.31%) expressed in total volume per ha. Conversely, the growth response on the leeward plots was inverse: stands with the middle density were those with the lowest growth reduction (−3.95%), followed by stands with low densities (N < 250 trees ha−1), and the stands with the highest growth reduction were those with the highest density (−9.17%). In the warmest climate scenario (RCP 4.5), the growth response changed. In the windward aspect, the lower density stands were those that had a more stable growth (−3.92%), with the middle density stands obtaining the highest decreasing growth values (−17.11%). This effect was much more evident in the leeward stands, with a sharp drop in the growth (−22.19%) that was higher for the higher-density stands and lower for the lower-density stands (−9.64%).
Table 1. Dendrochronological statistics of the sampled pine species on Tenerife (Canary Islands, Spain) according to thinning treatments (C, control; MT, moderate thinning; HT, heavy thinning). Abbreviations: BAI, mean basal area increment; BAI20, mean basal area increment in the last 20 years; BAIpre, mean basal area increment before thinning; BAIpost10, mean basal area increment 10 years after thinning; BAIpostTH, mean basal area increment at sampling time (22 years after thinning); AC, first-order autocorrelation coefficient; MS, mean sensitivity; Rbar, mean correlation between trees. Values are means ± SD (in brackets) and superscripts (a, b, c) indicate pairwise comparisons when these are significantly different (p < 0.05).
Species—SiteTreatmentTimespanBAI (cm2)BAI20 (cm2)BAIpreTH (cm2)BAIpos10 (cm2)BAIpostTH (cm2)AC1MSRbar
P. canariensis—leewardC1957–20216.94 (0.003)4.65 (0.003)7.86 (0.005) a8.37 (0.003) a5.97 (0.003) a0.9320.2950.355
MT1957–20216.33 (0.002)4.97 (0.003) a6.95 (0.003)7.42 (0.003) a5.74 (0.002) a0.8870.3440.286
HT1956–20215.93 (0.002) a5.59 (0.004)5.71 (0.004) b7.13 (0.005) a6.16 (0.003) a0.9010.3770.331
P. canariensis—windwardC1961–20215.54 (0.002) a4.42 (0.002) a6.84 (0.005)4.76 (0.002) b4.44 (0.001) b0.9060.3670.321
MT1955–20217.48 (0.003)5.87 (0.003)8.38 (0.005) a7.29 (0.004) a6.56 (0.003) a0.9380.2660.392
HT1957–20218.46 (0.003) b7.11 (0.004) b8.40 (0.006) a11.49 (0.006) c8.51 (0.004) c0.8840.3530.255
Table 2. Two-way ANOVA plus interaction statistics for basal area increment (BAI) and related variables: BAI20; basal area increment in the last 20 years (cm2 year−1), BAIpreTH; basal area increment before thinning (cm2 year−1), BAIpost10; basal area increments 10-year after thinning (cm2 year−1), BAIpost; basal area increment at sampling time (22-year after thinning) (cm2 year−1) and CG; cumulative growth (cm year−1). Significance levels: * p ≤ 0.05; ** p ≤ 0.01; *** p ≤ 0.001.
BAIBAI20BAIpreTHBAIPost10BAIPostTHCG
FpFpFpFpFpFp
Aspect1.5860.2091.3110.2546.3490.012 *1.7310.1942.2550.1351.4200.234
Treatment0.8130.4635.9530.003 **0.8260.43923.416<0.001 ***17.089<0.001 ***0.4630.630
Exposition x Aspect11.100<0.001 ***8.096<0.001 ***7.1450.001 **29.190<0.001 ***21.632<0.001 ***5.6570.003 **

3.4. Cartographying Silvicultural Management Plans

Finally, the growth pattern for each stand was projected based on current tree density (Figure 4 and Figure 5). An adaptive silviculture map for Canary pine plantations was estimated by calculating the mean value of tree density and growth for each stand.

4. Discussion

Climate-change-induced shifts in tree growth and forest vigor on a global scale are leading to extensive effects on forest ecosystems worldwide [52]. In southern Europe, the increase in temperature and changes in precipitation are resulting in the decreased replenishment of soil water, ultimately leading to drier growing conditions. These climate changes have adverse effects on tree growth, intensifying drought stress in forests and leading to dieback and high-mortality episodes [53]. This heightened drought stress additionally makes forests more susceptible to increasingly frequent and intense wildfires, pests, and other disturbances [54]. One of the strategies being considered as a means to alleviate water competition and mitigate drought stress in semi-arid regions is thinning [55]. Our study of the effect of thinning on the growth patterns of P. canariensis forests provides new insights into the contrasted effects of thinning in the face of a changing climate. We integrated dendrochronological with LiDAR data to examine the effect of thinning in two different climatic scenarios.

4.1. Thinning Intensity and Growth Responses

The range of P. canariensis expanded during the second part of the 20th century owing to forest plantations and the colonization of other formations such as the fayal-brezal. However, high-density forests (between 1500 to 800 trees ha−1) were established, depending on the aspect and soil conditions, leading to the need for urgent thinning interventions [20,27]. Previous studies on the sampled area revealed that P. canariensis has immediate growth responses in the first few years after thinning and that this is modulated by aspect, with the most pronounced effects observed in heavy thinning treatments [24]. Our findings partially align with previous studies, revealing lower tree growth responses 10 years after heavy thinning compared to controls carried out on windward stands, but that this response changes in the long-term, thus suggesting a higher responsiveness to the climate in dry leeward slopes [24]. Thinning-induced temperature increases within stands, resulting from greater exposure to radiation [56]. This counteracts the positive effect of winter temperatures and accentuates their negative impact during the dry summer, particularly after heavy thinning on the windward side. This may be linked to reduced fog entrapment in Canary pine woods after heavy thinning compared to light thinning [23]. On the windward slopes, the mean annual throughfall can account for up to twice the incident rainfall [23], increasing the growth dependence of horizontal foggy precipitation.
However, on leeward plots, a higher impact of thinning was observed in the two time periods (10 and 20 years after thinning) for heavy thinning treatments. Our results suggest that aspect modulation was influenced by the higher tree density on the leeward slopes and drier conditions with an increase in the effect of thinning in competition for water. High-density stands cannot be adequately supported under more limiting climatic conditions, therefore, increasing the advantages of thinning on leeward slopes. The reduction in tree density on leeward slopes contributed to increased BAI, possibly owing to the enhanced drought tolerance of Canary pines on this slope, since they recover from drought-induced depressions, and a more pronounced climatic control of BAI on the leeward side [24], as evidenced by the higher common signal and year-to-year growth variability. However, in the long term, there is a clear effect of density reduction as shown in this work.
Similar findings have been reported for trees with different competition intensities or thinning in Mediterranean climates [14,56,57]. The increased growth rates resulting from heavy thinning are typically associated with improved tree water status and illumination within the stand as a result of reduced inter-tree competition [58]. A greater water supply enables better stomatal conductance and carbon assimilation, promoting tree growth and extending the growing season [59]. The Canary pine is a light-demanding species, and shaded environments are, therefore, prone to more severe detrimental effects of drought [60]. Heavy thinning is more favorable in these cases, creating larger canopy gaps and greater irradiance, thus leading to the release of dominant trees. As shown in Scots pine [61], thinning can also alter nutrient return via needle litterfall, although this is not necessarily proportional to its intensity, thus suggesting the existence of thresholds in the ecological response to thinning from below. Contrary to the windward aspect, the growth increase after thinning on the leeward side showed responsiveness to temperature. In areas with very low summer precipitation, growth regulation by water shortage can be controlled more by high temperatures (elevated evapotranspiration rate) than by rainfall [58].

4.2. Projecting Tree Growth Based on Climate Scenarios

The growth of P. canariensis in the most optimistic scenario (RCP 2.6) was shown to be more responsive to temperature than in the most pessimistic scenario (RCP 4.5). This is in line with the tree ring formation dynamics in pines, where earlywood formation depends on photosynthates produced the prior year and used during spring as a function of thermal conditions [62]. Thermal variables related to water balance therefore underscore the significance of spring and summer weather conditions for P. canariensis, together with fog precipitation. Differences in water supply may also contribute to the variation in the models for the two aspects [63], showing the greater vulnerability of the leeward stands, which makes these forests more vulnerable in the warmest RCP4.5 climate scenario.
Projections for future growth showed that aspect played a crucial role. The suitability of the windward stands for positive growth was projected in the RCP2.6 scenario and it was higher in the high-density stands. In contrast, in the leeward scenario, higher growth was observed in the low-density stands. With regard to the windward stands, their lower vulnerability to changes in precipitation and an inter-annual variation in climate may explain the higher growth increases in high-density stands, suggesting that other factors are contributing to growth, such as fog precipitation and deep soil [64]. The windward stands may have deeper root systems that explore soil layers extensively to uptake groundwater. However, the leeward stands have greater growth in low-density stands in the RCP2.6 scenario, showing their higher vulnerability to changes in precipitation and temperature. These stands probably have shallow and concentrated rooting systems in the upper soil layers owing to the stony and superficial nature of the soils, which do not permit root stratification and lead the leeward stands to undergo slower growth.
The models based on the RCP4.5 scenario forecast a substantial loss of growth. Concerning the windward stands, this scenario underwent a minimal increase in low-density stands, but with a rapid loss of growth for mid- and high-density stands. A comparable study [65] to model tree growth with climatic variables predicted a future decrease in the growth of several tree species in Germany until 2100. In the leeward stands, the growth index was projected to decrease in all stands, and it would appear that these P. canariensis stands would be unable to buffer the adverse effects of long-term climate changes on growth. Warmer climates are expected to extend the water stress periods, thus affecting wood formation and potentially leading to lower radial growth [66] in locations in which competition dynamics within the stand strongly condition growth levels [15,67]. A previous study on P. canariensis revealed that when they grow in mixed stands with Fayal (Erica spp.) species, there are smaller decreases in growth during droughts compared to pure pine forests [27]; although, these mixed stands are not formed in dry leeward sites [68].

4.3. LiDAR Metrics Used to Describe Thinning Growth Trajectories

Finally, we propose a methodology with which to integrate dendrochronological data and growth climatic models with LiDAR-derived forest attributes. Enhancing our understanding of forest structure patterns holds significant value for various tasks, ranging from harvest management planning to fire-risk assessments and climate-adapted regeneration. In recent years, there has been increased emphasis on integrating ALS data into enhanced forest inventory systems. The LiDAR metrics made it possible to map mean tree density with high accuracy as a baseline for a thinning-based canopy threshold and enabled the effect of thinning in volume growth at the stand level to be differentiated. The LiDAR-derived forest attributes, therefore, indicate the capability to predict growth variables with reasonable accuracy.
Previous studies have shown that LiDAR metrics provide accurate information about stand density [69], and the expansive coverage and efficiency of ALS data compensated for the potential loss in accuracy. Here, the number of trees present in each stand was used to predict growth patterns on the landscape scale. Stands with different tree densities and volumes appear to be fragmented within a different stand density matrix. LiDAR data were then applied for stand segmentation from an adaptative silviculture perspective. Expected changes in total volume per ha showed different growth responses. The average increments in annual volume observed from the LiDAR segmentation ranged between 6.97 m3 ha−1 year−1 (windward) and 5.88 m3 ha−1 year−1 (leeward). These values are lower than those found by a previous study [22] (7.7 and 6.88 m3 ha−1 year−1 on the windward and leeward slopes, respectively). In general, P. canariensis growth in diameter may be as high as up to 2 cm per year, and growth in height up to 1 m per year, although these growth rates slow down after approximately 25–30 years of age when the species begins to invest the resources used in growth in the formation of heartwood [60].
Operationally, the use of permanent plots to estimate forest growth allows the generation of predictive equations for forest management. From an adaptative silviculture perspective, estimating changes in volume growth under different climatic scenarios allows thinning plans as a strategy to reduce disturbance impacts (e.g., tree dieback and mortality due to drought, wildfire, pests, etc.). The mapping of canopy structure and growth response to thinning under different climatic scenarios provides managers with opportunities to carry out thinning strategies at a time at which forests are under climatic risk and timber harvest on public land may be an alternative for forest adaptation [70]. The result of this study shows that low-density ALS-specific models contribute to the prediction of growth at stand scale, improving traditional inventories. While our approach shares many aspects of the methodology used in local forest management inventories, integration of ALS and dendrochronological data is useful for mapping forest attributes and the improvement of estimates on various scales. Because of their fine spatial resolution and relatively high accuracy, ALS maps of forest attributes offer forest managers opportunities for retention harvest strategies, carbon stock modeling, wildfire, and habitat potential.
Expanding dendrochronological data beyond plot attributes with a landscape scale can substantially increase the value of these data. Growth can be used as an input for models that predict the climatic vulnerability of plantations, and these models may then be used to improve forest attribute maps derived from LiDAR by replacing traditional inventory layers [71]. Our predicted canopy growth response maps illustrate the opportunities to improve thinning management plans by efficiently combining tree-ring and LiDAR data. Limitations of this study include those derivate of tree density ALS models, and application to different stand densities and configurations, impacting stand-level estimates, particularly in low-density forests. Ongoing research should explore synergies between growth models through the fusion of ALS and very-high-spatial-resolution optical imagery.

5. Conclusions

We showed the impact of thinning treatments on growth patterns in Canary pine plantations integrating dendrochronological data, growth models, and LiDAR data. Heavy thinning enhances growth rates and modifies growth sensitivity to climates. Growth predictions for the 2020–2100 period showed different trends for the windward and leeward stands, with a significant trend towards decreasing growth in the warmest RCP4.5 climate scenario. Integrating dendrochronological data and growth models at the landscape scale can be improved by using LiDAR data to characterize forest structure. This procedure resulted in models with an improved predictive growth response to thinning. We were also able to create a predictive map across the study site that highlights the effects that locations and patterns of thinning have on growth across environmental gradients. Management guidelines could consider those thinning maps to improve growing conditions and self-maintenance in Canary pine plantations. This is particularly relevant on the dry leeward sites because harsh climate conditions may overshadow thinning impacts there if thinning is not intense enough. This information is requested by foresters, ecologists, and wildfire managers who require stand-level details with a representation of canopy structure resulting from thinning and based on long-term growth trends.

Supplementary Materials

The following supporting information can be downloaded at: https://www.mdpi.com/article/10.3390/rs16050850/s1, Figure S1. Global climate models (CMIP5) projections derived from model IPSL.CM5-MR across two RCP scenarios (2.6 and 4.5) of Pinus canariensis stands on Tenerife (Canarian Islands, Spain). Abbreviations: Prcp (precipitation, mm)-descendant trend, Temp (mean temperature, °C)-ascendant trend. Figure S2. Growth index models and future projections of standardized master chronologies of Pinus canariensis, climatic growth models calibrated on the past, used to forecast growth according to climatic scenarios (RCP 2.6 and 4.5) and IPSL-CM5-MR model within CMIP5 on Tenerife (Canarian Islands, Spain). Asterisks indicate significant slopes of the regression lines (* p < 0.5, ** p < 0.01, *** p < 0.001). Table S1. Forest attribute of the forest types on Tenerife (Canarian Islands, Spain). Abbreviations: W = above-ground biomass, H = average height, N = tree density, G = basal area, dbh = diameter at breast height, and Fcc = tree cover. Values are means ± standard error (in brackets). Source: Spanish National Forest Inventory [34]. Table S2. Selected LiDAR metrics parameters to run statistical analyses [46]. Table S3. LiDAR models to estimate Basal area (G, m2 ha−1), Quadratic mean diameter (Dg, cm), and Weibull’s diameter distribution used for forest attribute inventory [43]. See Table S2 for LiDAR metrics. Table S4. General characteristics of the Pinus canariensis stands on Tenerife (Canarian Islands, Spain) after thinning interventions. H = average height, N = tree density, G = basal area, dbh = diameter at breast height, and Fcc = tree cover. Values are means ± standard error (in brackets). Table S5. Multiple Linear Regression Model (MLRM) outputs of Pinus canariensis throughout the thinning treatments (CN, control, north side; MTN, moderate thinning, north side; HTN, heavy thinning, north side, CS, control, south side; MTS, moderate thinning, south side; HTS, heavy thinning, south side) on Tenerife (Canarian Islands, Spain). As fixed effects, we included the estimated variables, time (year), precipitation (prcp), and mean temperature (temp), and standardized BAIs (Growth index) was fitted as the response variable projections derived from model IPSL.CM5A-MR across two RCP scenarios (2.6 and 4.5). Table S6. Multiple Linear Regression Model (MLRM) outputs. Asterisks indicate significant slopes of the regression lines (* p < 0.5, ** p < 0.01, *** p < 0.001). Table S7. Forest attributes of the Pinus canariensis stands on Tenerife (Canarian Islands, Spain) and growth (m3 ha−1 year−1) under climatic scenarios (IPSL-CM5 Earth System Model-ESM, RCP 2.6 and 4.5, [42]). Abbreviations: H = average height, N = tree density, G = basal area, dbh = diameter at breast height. Values are means ± SD (in brackets).

Author Contributions

Conceptualization, R.M.N.-C. and E.P.C.; methodology, R.M.N.-C., A.M.C.-V., C.V. and E.P.C.; validation, E.P.C. and R.M.N.-C.; formal analysis, R.M.N.-C. and A.M.C.-V.; investigation, R.M.N.-C., A.M.C.-V. and J.J.C.; resources, E.P.C. and R.M.N.-C.; data curation, A.M.C.-V., E.P.C., C.V. and R.M.N.-C.; writing—original draft preparation, R.M.N.-C.; writing—review and editing, R.M.N.-C., E.P.C., A.M.C.-V., C.V. and J.J.C.; supervision, R.M.N.-C.; project administration, E.P.C.; funding acquisition, R.M.N.-C. All authors have read and agreed to the published version of the manuscript.

Funding

This research was funded by the following projects: SILVADAPT.NET (RED2018-102719-T), EVIDENCE (Ref: 2822/2021) and REMEDIO (PID2021-128463OB-I00).

Data Availability Statement

Data are available on request from authors.

Acknowledgments

We acknowledge the financial and institutional support of the University of Cordoba-Campus de Excelencia CEIA3. We thank the “Área de Gestión del Medio Natural y Seguridad” (Cabildo Insular de Tenerife) for providing fieldwork and data support. We also thank M Ángeles Varo for her invaluable help with cartographic analysis and Irene Muñoz Monton and all the staff of Forestal Vicor for their assistance during this research. We thank Sally Newton for revisions of the written English in different versions of this manuscript, and the anonymous referees for their valuable comments and corrections.

Conflicts of Interest

The authors declare no conflicts of interest.

References

  1. Canadell, J.G.; Raupach, M.R. Managing forests for climate change mitigation. Science 2008, 320, 1456–1457. [Google Scholar] [CrossRef]
  2. Seidl, R.; Albrich, K.; Erb, K.; Formayer, H.; Leidinger, D.; Leitinger, G.; Rammer, W. What drives the future supply of regulating ecosystem services in a mountain forest landscape? For. Ecol. Manag. 2019, 445, 37–47. [Google Scholar] [CrossRef]
  3. Legg, S. Climate change 2021-the physical science basis. Interaction 2021, 49, 44–45. [Google Scholar]
  4. Turner, M.G.; Calder, W.J.; Cumming, G.S.; Hughes, T.P.; Jentsch, A.; LaDeau, S.L.; Carpenter, S.R. Climate change, ecosystems and abrupt change: Science priorities. Philos. Trans. R. Soc. B 2020, 375, 20190105. [Google Scholar] [CrossRef]
  5. Scheffer, M.; Carpenter, S.R.; Lenton, T.M.; Bascompte, J.; Brock, W.; Dakos, V.; Vandermeer, J. Anticipating critical transitions. Science 2012, 338, 344–348. [Google Scholar] [CrossRef]
  6. Seidl, R.; Vigl, F.; Rössler, G.; Neumann, M.; Rammer, W. Assessing the resilience of Norway spruce forests through a model-based reanalysis of thinning trials. Forest Ecol. Manag. 2017, 388, 3–12. [Google Scholar] [CrossRef] [PubMed]
  7. D’Amato, A.W.; Palik, B.J. Building on the last “new” thing: Exploring the compatibility of ecological and adaptation silviculture. Can. J. For. Res. 2021, 51, 172–180. [Google Scholar] [CrossRef]
  8. Nyland, R.D. Silviculture: Concepts and Applications; Waveland Press: Long Grove, IL, USA, 2016. [Google Scholar]
  9. Gleason, K.E.; Bradford, J.B.; Bottero, A.; D’Amato, A.W.; Fraver, S.; Palik, B.J.; Kern, C.C. Competition amplifies drought stress in forests across broad climatic and compositional gradients. Ecosphere 2017, 8, e01849. [Google Scholar] [CrossRef]
  10. Bradford, J.B.; Shriver, R.K.; Robles, M.D.; McCauley, L.A.; Woolley, T.J.; Andrews, C.A.; Bell, D.M. Tree mortality response to drought-density interactions suggests opportunities to enhance drought resistance. J. Appl. Ecol. 2022, 59, 549–559. [Google Scholar] [CrossRef]
  11. Bottero, A.; D’Amato, A.W.; Palik, B.J.; Bradford, J.B.; Fraver, S.; Battaglia, M.A.; Asherin, L.A. Density-dependent vulnerability of forest ecosystems to drought. J. Appl. Ecol. 2017, 54, 1605–1614. [Google Scholar] [CrossRef]
  12. Brodribb, T.J.; Powers, J.; Cochard, H.; Choat, B. Hanging by a thread? Forests and drought. Science 2020, 368, 261–266. [Google Scholar] [CrossRef] [PubMed]
  13. D’Amato, A.W.; Bradford, J.B.; Fraver, S.; Palik, B.J. Effects of thinning on drought vulnerability and climate response in north temperate forest ecosystems. Ecol Appl. 2013, 23, 1735–1742. [Google Scholar] [CrossRef] [PubMed]
  14. Navarro-Cerrillo, R.M.; Cachinero-Vivar, A.M.; Pérez-Priego, Ó.; Cantón, R.A.; Begueria, S.; Camarero, J.J. Developing alternatives to adaptive silviculture: Thinning and tree growth resistance to drought in a Pinus species on an elevated gradient in Southern Spain. Forest Ecol. Manag. 2023, 537, 120936. [Google Scholar] [CrossRef]
  15. Manrique-Alba, À.; Beguería, S.; Molina, A.J.; González-Sanchis, M.; Tomàs-Burguera, M.; Del Campo, A.D.; Camarero, J.J. Long-term thinning effects on tree growth, drought response and water use efficiency at two Aleppo pine plantations in Spain. Sci. Total Environ. 2020, 728, 138536. [Google Scholar] [CrossRef]
  16. Tague, C.L.; Moritz, M.; Hanan, E. The changing water cycle: The eco-hydrologic impacts of forest density reduction in Mediterranean (seasonally dry) regions. Water 2019, 6, e1350. [Google Scholar] [CrossRef]
  17. Arévalo, J.R.; Naranjo-Cigala, A.; Fernández-Palacios, J.M.; Fernández Lugo, S. Ecology and management of natural and reforested Canary Island pine stands. In Ecology and Management of Natural and Reforested Canary Island Pine Stands; Wallace, E.B., Ed.; Woodlands; Ecology, Management and Conservation Nova Science Publishers, Inc.: Hauppauge, NY, USA, 2010. [Google Scholar]
  18. Fernández-Palacios, J.M.; de Nicolás, J.P. Altitudinal pattern of vegetation variation on Tenerife. J. Veg. Sci. 1995, 6, 183–190. [Google Scholar] [CrossRef]
  19. Gieger, T.; Leuschner, C. Altitudinal change in needle water relations of Pinus canariensis and possible evidence of a drought-induced alpine timberline on Mt. Teide, Tenerife. Flora 2004, 199, 100–109. [Google Scholar] [CrossRef]
  20. Arévalo, J.R.; Fernández-Palacios, J.M. From pine plantations to natural stands. Ecological restoration of a Pinus canariensis Sweet, ex Spreng forest. Plant Ecol. 2005, 181, 217–226. [Google Scholar] [CrossRef]
  21. Molina, A.J.; Navarro-Cerrillo, R.M.; Pérez-Romero, J.; Alejano, R.; Bellot, J.F.; Blanco, J.A.; del Campo, A.D. SilvAdapt. Net: A Site-Based Network of Adaptive Forest Management Related to Climate Change in Spain. Forests 2021, 12, 1807. [Google Scholar] [CrossRef]
  22. Madrigal, A.; Domínguez, M.L.; Peraza, M.; Barber, J.R.; Herrero, J.; Rodríguez-Solano, R. Estudio de la Selvicultura de las Masas Artificiales de Pinus Canariensis Sweet ex Spreng; Gobierno de Canarias, Dirección General del Medio Ambiente; Fundación General de la Universidad Politécnica de Madrid, Departamento de Silvopascicultura: Santa Cruz de Tenerife, Madrid, Spain, 1989. [Google Scholar]
  23. Aboal, J.R.; Jiménez, M.S.; Morales, D. Gil P Effects of thinning on throughfall in Canary Islands pine forest—The role of fog. J Hydrol. 2000, 238, 218–230. [Google Scholar] [CrossRef]
  24. Pérez-de-Lis, G.; García-González, I.; Rozas, V.; Arévalo, J.R. Effects of thinning intensity on radial growth patterns and temperature sensitivity in Pinus canariensis afforestations on Tenerife Island, Spain. Ann. For. Sci. 2011, 68, 1093–1104. [Google Scholar] [CrossRef]
  25. Rozas, V.; García-González, I.; Pérez-de-Lis, G.; Arévalo, J.R. Local and large-scale climatic factors controlling tree-ring growth of Pinus canariensis on an oceanic island. Clim. Res. 2013, 56, 197–207. [Google Scholar] [CrossRef]
  26. Rozas, V.; Pérez-de-Lis, G.; García-González, I.; Arévalo, J.R. Contrasting effects of wildfire and climate on radial growth of Pinus canariensis on windward and leeward slopes on Tenerife, Canary Islands. Trees 2011, 25, 895–905. [Google Scholar] [CrossRef]
  27. Otto, R.; García-del-Rey, E.; Méndez, J.; Fernández-Palacios, J.M. Effects of thinning on seed rain, regeneration and understory vegetation in a Pinus canariensis plantation (Tenerife, Canary Islands). For. Ecol. Manag. 2012, 280, 71–81. [Google Scholar] [CrossRef]
  28. Correa-Díaz, A.; Silva, L.C.R.; Horwath, W.R.; Gómez-Guerrero, A.; Vargas-Hernández, J.; Villanueva-Díaz, J.; Velázquez-Martínez, A. From trees to ecosystems: Spatiotemporal scaling of climatic impacts on montane landscapes using dendrochronological, isotopic, and remotely sensed data. Glob. Biogeochem. Cycles 2020, 34, e2019GB006325. [Google Scholar] [CrossRef]
  29. Zhou, Y.; Yi, Y.; Jia, W.; Cai, Y.; Yang, W.; Li, Z. Applying dendrochronology and remote sensing to explore climate-drive in montane forests over space and time. Quat. Sci. Rev. 2020, 237, 106292. [Google Scholar] [CrossRef]
  30. Kangas, A.; Gobakken, T.; Puliti, S.; Hauglin, M.; Naesset, E. Value of airborne laser scanning and digital aerial photogrammetry data in forest decision making. Silva Fenn. 2018, 52, 9923. [Google Scholar] [CrossRef]
  31. Coops, N.C.; Tompalski, P.; Goodbody, T.R.; Queinnec, M.; Luther, J.E.; Bolton, D.K.; Hermosilla, T. Modelling lidar-derived estimates of forest attributes over space and time: A review of approaches and future trends. Remote Sens. Environ. 2021, 260, 112477. [Google Scholar] [CrossRef]
  32. Wulder, M.A.; White, J.C.; Nelson, R.F.; Næsset, E.; Ørka, H.O.; Coops, N.C.; Hilker, T.; Bater, C.W.; Gobakken, T. Lidar sampling for large-area forest characterization: A review. Remote Sens. Environ. 2012, 121, 196–209. [Google Scholar] [CrossRef]
  33. Pretzsch, H.; del Río, M.; Grote, R.; Klemmt, H.J.; Ordóñez, C.; Bravo Oviedo, F. Tracing drought effects from the tree to the stand growth in temperate and Mediterranean forests: Insights and consequences for forest ecology and management. Eur. J. For. Res. 2022, 141, 727–751. [Google Scholar] [CrossRef]
  34. MITECO Cuarto Inventario Forestal Español Canarias. Ministerio para la Transición Ecológica y el Reto Demográfico (MITECO) Madrid 2020. Available online: www.miteco.gob.es (accessed on 12 January 2023).
  35. Fernández-Caldas, E.; Tejedor, M.; Quantin, P. Los Suelos Volcánicos de Canarias; Servicio de Publicaciones de la Universidad de La Laguna: La Laguna, Spain, 1985. [Google Scholar]
  36. Fritts, H. Tree Rings and Climate; Academic Press: London, UK, 1976. [Google Scholar]
  37. Holmes, R.L. Computer-assisted quality control in tree-ring dating and measurement. Tree Ring Res. 1983, 43, 51–67. [Google Scholar]
  38. Bunn, A.; Korpela, M.; Biondi, F.; Campelo, F.; Mérian, P.; Qeadan, F.; Klesse, S. Package ‘dplR’. Dendrochronology Program Library in R, Version, 1, 2015. [Google Scholar]
  39. R Core Team. R: A Language and Environment for Statistical Computing. R Foundation for Statistical Computing, Vienna, Austria. 2022. Available online: https://www.R-project.org/ (accessed on 9 January 2023).
  40. Thornthwaite, C.W. An approach toward a rational classification of climate. Geogr. Rev. 1948, 38, 55–94. [Google Scholar] [CrossRef]
  41. Lebourgeois, F.; Pierrat, J.C.; Perez, V.; Piedallu, C.; Cecchini, S.; Ulrich, E. Simulating phenological shifts in French temperate forests under two climatic change scenarios and four driving global circulation models. Int. J. Biometeorol. 2010, 54, 563–581. [Google Scholar] [CrossRef] [PubMed]
  42. Bert, D.; Lebourgeois, F.; Ouayjan, A.; Ducousso, A.; Ogée, J.; Hampe, A. Past and future radial growth and water-use efficiency of Fagus sylvatica and Quercus robur in a long-term climate refugium. Dendrochronologia 2022, 72, 125939. [Google Scholar] [CrossRef]
  43. Cabildo de Tenerife. Proyecto Para la Ejecución de Tratamientos Selvícolas de Mejora en Pino Canario Procedente de Repoblación; Agresta: Cabildo de Tenerife: Santa Cruz de Tenerife, Spain, 2014. [Google Scholar]
  44. Arias-Rodil, M.; Diéguez-Aranda, U.; Álvarez-González, J.G.; Pérez-Cruzado, C.; Castedo-Dorado, F.; González-Ferreiro, E. Modeling diameter distributions in radiata pine plantations in Spain with existing countrywide LiDAR data. Ann. For. Sci. 2018, 75, 36. [Google Scholar] [CrossRef]
  45. Gorgoso-Varela, J.J.; Rojo-Alboreca, A. Use of Gumbel and Weibull functions to model extreme values of diameter distributions in forest stands. Ann. For. Sci. 2014, 71, 741–750. [Google Scholar] [CrossRef]
  46. Pinheiro, J.; Bates, D.; DebRoy, S.; Sakar, D. nlme: Linear and Nonlinear Mixed Effects Models. R Package Version 3.1 2020, 1–149. [Google Scholar]
  47. McGaughey, B. FUSION Version 3.30; USDA Forest Service: Seattle, WA, USA, 2018. [Google Scholar]
  48. Varo-Martínez, M.Á.; Navarro-Cerrillo, R.M. Stand delineation of Pinus sylvestris L. plantations suffering decline processes based on biophysical tree crown variables: A necessary tool for adaptive silviculture. Rem. Sens. 2021, 13, 436. [Google Scholar] [CrossRef]
  49. Næsset, E. Predicting forest stand characteristics with airborne scanning laser using a practical two-stage procedure and field data. Remote Sens. Environ. 2002, 80, 88–99. [Google Scholar] [CrossRef]
  50. López-Senespleda, E.; Climent, J.M.; Montero, G. Selvicultura de Pinus canariensis Sweet. In Compendio de Selvicultura Aplicada en España; INIA: Madrid, Spain, 2008. [Google Scholar]
  51. Bates, D.; Maechler, M.; Bolker, B.; Walker, S.; Christensen, R.H.B.; Singmann, H.; Green, P. Package ‘lme4’. 2009. Available online: http://lme4.r-forge.r-project (accessed on 21 January 2023).
  52. Anderegg, W.R.; Kane, J.M.; Anderegg, L.D. Consequences of widespread tree mortality triggered by drought and temperature stress. Nat. Clim. Chang. 2013, 3, 30–36. [Google Scholar] [CrossRef]
  53. Williams, A.P.; Allen, C.D.; Macalady, A.K.; Griffin, D.; Woodhouse, C.; Meko, D.M.; Swetnam, T.W.; Rauscher, S.A.; Seager, R.; Grissino-Mayer, H.D. Temperature as a potent driver of regional forest drought stress and tree mortality. Nat. Clim. Chang. 2012, 3, 292–297. [Google Scholar] [CrossRef]
  54. Yi, C.; Hendrey, G.; Niu, S.; McDowell, N.; Allen, C.D. Tree mortality in a warming world: Causes, patterns, and implications. Environ. Res. Lett. 2022, 17, 030201. [Google Scholar] [CrossRef]
  55. Sankey, T.; Tatum, J. Thinning increases forest resiliency during unprecedented drought. Sci. Rep. 2022, 12, 9041. [Google Scholar] [CrossRef] [PubMed]
  56. Moreno, G.; Cubera, E. Impact of stand density on water status and leaf gas exchange in Quercus ilex. For. Ecol. Manag. 2008, 254, 74–84. [Google Scholar] [CrossRef]
  57. Linares, J.C.; Camarero, J.J.; Carreira, J.A. Plastic responses of Abies pinsapo xylogenesis to drought and competition. Tree Physiol. 2009, 29, 1525–1536. [Google Scholar] [CrossRef] [PubMed]
  58. Martín-Benito, D.; Del Río, M.; Heinrich, I.; Helle, G.; Cañellas, I. Response of climate-growth relationships and water use efficiency to thinning in a Pinus nigra afforestation. For. Ecol. Manag. 2010, 259, 967–975. [Google Scholar] [CrossRef]
  59. Lechuga, V.; Carraro, V.; Viñegla, B.; Carreira, J.A.; Linares, J.C. Managing drought-sensitive forests under global change. Low competition enhances long-term growth and water uptake in Abies pinsapo. For. Ecol. Manag. 2017, 406, 72–82. [Google Scholar] [CrossRef]
  60. Climent, J.; Chambel, M.R.; Pérez, E.; Gil, L.; Pardos, J. Relationship between heartwood radius and early radial growth, tree age, and climate in Pinus canariensis. Can. J. For. Res. 2002, 32, 103–111. [Google Scholar] [CrossRef]
  61. Blanco, J.A.; Imbert, J.B.; Castillo, F.J. Nutrient return via litterfall in two contrasting Pinus sylvestris forests in the Pyrenees under different thinning intensities. For. Ecol. Manag. 2008, 256, 1840–1852. [Google Scholar] [CrossRef]
  62. Kagawa, A.; Battipaglia, G. Post-photosynthetic carbon, oxygen and hydrogen isotope signal transfer to tree rings—How timing of cell formations and turnover of stored carbohydrates affect intra-annual isotope variations. In Stable Isotopes in Tree Rings: Inferring Physiological, Climatic and Environmental Responses; Springer: Cham, Switzerland, 2022; pp. 429–462. [Google Scholar]
  63. Zhirnova, D.F.; Belokopytova, L.V.; Barabantsova, A.E.; Babushkina, E.A.; Vaganov, E.A. What prevails in climatic response of Pinus sylvestris in-between its range limits in mountains: Slope aspect or elevation? Int. J. Biometeorol. 2020, 64, 333–344. [Google Scholar] [CrossRef]
  64. Brito, P.; Wieser, G.; Oberhuber, W.; Gruber, A.; Lorenzo, J.R.; González-Rodríguez, Á.M.; Jiménez, M.S. Water availability drives stem growth and stem water deficit of Pinus canariensis in a drought-induced treeline in Tenerife. Plant Ecol. 2017, 218, 277–290. [Google Scholar] [CrossRef]
  65. Bauwe, A.; Jurasinski, G.; Scharnweber, T.; Schroeder, C.; Lennartz, B. Impact of climate change on tree-ring growth of Scots pine, common beech and pedunculate oak in northeastern Germany. iForest 2015, 9, 1. [Google Scholar] [CrossRef]
  66. Vieira, J.; Carvalho, A.; Campelo, F. Tree growth under climate change: Evidence from xylogenesis timings and kinetics. Front. Plant Sci. 2020, 11, 90. [Google Scholar] [CrossRef] [PubMed]
  67. Navarro-Cerrillo, R.M.; Sánchez-Salguero, R.; Rodriguez, C.; Lazo, J.D.; Moreno-Rojas, J.M.; Palacios-Rodriguez, G.; Camarero, J.J. Is thinning an alternative when trees could die in response to drought? The case of planted Pinus nigra and P. sylvestris stands in southern Spain. Forest Ecol. Manag. 2019, 433, 313–324. [Google Scholar] [CrossRef]
  68. Blanco, A.; Castroviejo, M.; Fraile, J.L.; Gandullo, J.M.; Muñoz, L.A.; Sánchez Palomares, O. Estudio Ecológico del Pino Canario; ICONA-MAPA: Madrid, Spain, 1989. [Google Scholar]
  69. Hill, A.; Buddenbaum, H.; Mandallaz, D. Combining canopy height and tree species map information for large-scale timber volume estimations under strong heterogeneity of auxiliary data and variable sample plot sizes. Eur. J. For. Res. 2018, 137, 489–505. [Google Scholar] [CrossRef]
  70. Hashida, Y.; Lewis, D.J. The intersection between climate adaptation, mitigation, and natural resources: An empirical analysis of forest management. J. Assoc. Environ. Resour. Econ. 2019, 6, 893–926. [Google Scholar] [CrossRef]
  71. Velasco Pereira, E.A.; Varo Martínez, M.A.; Ruiz Gómez, F.J.; Navarro-Cerrillo, R.M. Temporal Changes in Mediterranean Pine Forest Biomass Using Synergy Models of ALOS PALSAR-Sentinel 1-Landsat 8 Sensors. Remote Sens. 2023, 15, 3430. [Google Scholar] [CrossRef]
Figure 1. (a) Location of the study area on Tenerife Island, Canary Islands, Spain. (b) Location of the thinning plots on the windward (red) and leeward slopes (green). (c) Climate diagram of the study area for the period 1901–2006, showing the dry (black area) and wet (grey area) seasons. (d) Trends for mean annual temperature and precipitation in the study area in the period 1901–2006. Climate information is based on the CRU TS 3.0 dataset.
Remotesensing 16 00850 g001
Figure 2. Mean curves of basal area increment (BAI, cm2 year−1) and cumulative growth–dotted line (CG, cm year−1)–of Pinus canariensis in windward (N) and leeward (S) stands on Tenerife (Canary Islands, Spain). C, control; MT, moderate thinning; and HT, heavy thinning. The dashed vertical lines indicate the dates of the first (1975) and second thinning (1988).
Remotesensing 16 00850 g002
Figure 3. Variation in volume growth in the windward (N) and leeward (S) stands of Pinus canariensis under different climatic scenarios (RCP 2.6 and 4.5 at 2040 and 2060) and tree density. HT: low-density stands (N < 250 trees ha−1), MT: middle-density stands (N = 250–500 trees ha−1), CT: high-density stands (N > 500 trees ha−1).
Remotesensing 16 00850 g003
Figure 4. Variation in volume growth in a selected area in the windward sector of Pinus canariensis under different climatic scenarios (RCP 2.6 and 4.5 at 2040 and 2060) and tree density (low-density stands N < 250 tree ha−1, middle-density stands N = 250–500 tree ha−1, and high-density stands N > 500 tree ha−1).
Remotesensing 16 00850 g004
Figure 5. Variation in volume growth in a selected area in the leeward sector of Pinus canariensis under different climatic scenarios (RCP 2.6 and 4.5 at 2040 and 2060) and tree density (low-density stands N < 250 trees ha−1, middle-density stands N = 250–500 trees ha−1, and high-density stands N > 500 trees ha−1).
Remotesensing 16 00850 g005
Disclaimer/Publisher’s Note: The statements, opinions and data contained in all publications are solely those of the individual author(s) and contributor(s) and not of MDPI and/or the editor(s). MDPI and/or the editor(s) disclaim responsibility for any injury to people or property resulting from any ideas, methods, instructions or products referred to in the content.

