Technical Note

Windshear Detection in Rain Using a 30 km Radius Coherent Doppler Wind Lidar at Mega Airport in Plateau

1
School of Atmospheric Physics, Nanjing University of Information Science and Technology, Nanjing 210044, China
2
School of Earth and Space Science, University of Science and Technology of China, Hefei 230026, China
3
National Laboratory for Physical Sciences at the Microscale, University of Science and Technology of China, Hefei 230026, China
4
Institute of Software, Chinese Academy of Sciences, Beijing 100190, China
5
Yunnan Sub-Bureau of Southwest Regional Air Traffic Management Bureau CAAC, Kunming 650211, China
*
Author to whom correspondence should be addressed.
Remote Sens. 2024, 16(5), 924; https://doi.org/10.3390/rs16050924
Submission received: 22 January 2024 / Revised: 1 March 2024 / Accepted: 2 March 2024 / Published: 6 March 2024
(This article belongs to the Special Issue Synergetic Remote Sensing of Clouds and Precipitation II)

Abstract

:
Convective weather is often accompanied by precipitation and windshear, seriously endangering the safety of aircraft during takeoff and landing. However, under rainfall conditions, conventional wind lidars have a limited detection range due to significant signal attenuation. To solve this problem, a 200 mm temperature-controlled telescope coated with a hydrophobic film is applied in the coherent Doppler wind lidar system to improve the detection capability in rain. The maximum detection range of the lidar is extended to 30 km and demonstrated at Kunming Changshui International Airport at an altitude of 2102 m. Firstly, the detection accuracy and maximum detection range of the lidar are verified. Through the analysis of the horizontal wind field under two typical convective weather conditions, it is found that convective weather often accompanies low-level convergence and divergence structures, leading to headwind shear and crosswind shear on the airport runway. From the vertical profile, it is shown that the triggering of convective weather is accompanied by low-level southwest winds and high-altitude northeastern winds. According to the statistics of wind speed and direction on clear and rainy days over 9 months, rainy days are usually caused by the invasion of cold air from Northeast China, resulting in airport windshear. In summary, the enhanced lidar can effectively identify and analyze windshear during rainy days, which is very useful for aviation safety, especially for takeoff and landing in all weather conditions.

1. Introduction

Low-altitude windshear refers to a sudden and significant change in wind speed or direction in the atmosphere below a height of 600 m [1,2], such as microbursts and gust fronts. In the field of aviation meteorology, windshear seriously affects passenger experience and the safety of aircraft during takeoff and landing. Windshear occurs on rainy days, with a high probability of strong intensity [3,4]. In particular, convective rainfall is often accompanied by thunderstorms, strong winds, and strong windshear, with the characteristics of high intensity, fast change, and intermittent occurrence. According to the fast development of air transportation, it has become urgent to improve the detection and recognition ability of windshear in clean air as well as on rainy days to ensure aircraft safety and efficiency [2].
There are numerous wind detection and warning instruments available in airports, suitable for different scenarios [1,5,6]. For example, ultrasonic anemometers are used for surface single-point measurement, and wind profile radars can detect changes in wind direction and speed in the vertical direction. Doppler weather radars are used for detecting wind fields in convective cloud systems, thunderstorms, and precipitation weather [7,8,9]. However, most radar stations are built at the tops of high mountains. Due to the influence of radar location selection, range resolution, and ground clutter, weather radars have difficulties in detecting the fine dynamic structure of wind fields for the glide path of aircraft.
Coherent Doppler wind lidars (CDWLs) have the advantages of low blind zones, high spatiotemporal resolution, and flexible scanning methods. They have been applied in airport atmospheric wind field detection in recent years [10,11,12,13,14,15]. Since 2002, Hong Kong International Airport (HKIA) has applied a coherent Doppler wind lidar for low-altitude windshear and clear air turbulence detection [16]. HKIA developed the low-altitude windshear warning system using glide path scanning [17,18,19,20,21,22,23,24], achieving dense monitoring of glide paths. In addition to HKIA, windshear detection experiments based on lidar have been carried out at a lot of international airports, such as Toulouse Braniac Airport [25], Narita International Airport [26], Bratislava Airport [27], Lanzhou Zhongchuan International Airport [28], Beijing Daxing International Airport [29], Xining Caojiapu Airport [30], Beijing Capital International Airport [31,32], etc. Low-altitude windshear detection and identification based on lidar under clear-air conditions have been verified [27,28,31,33,34,35]. There have been some studies on improving detection distance [36,37,38]. However, the signals of lidars are attenuated rapidly under rainfall conditions [39], limiting their ability to detect windshear on rainy days. In addition, raindrops bring spectrum distortion in the Doppler wind lidar, which has a significant impact on the inversion of true wind speed in rain [3,40].
By enhancing the detection capability of lidar on rainy days and distinguishing the interference of raindrops in the aerosol signal, the quality of wind field detection and inversion accuracy can be improved in rainy weather. In this paper, an enhanced all-fiber CDWL is proposed to solve this problem. It is organized as follows: The site and instruments are introduced in Section 2. The detection accuracy and detection range of CDWL are verified in Section 3. Characteristics and mechanism analysis of windshear structure in typical rainy weather are described in Section 4. Finally, a conclusion is drawn in Section 5.

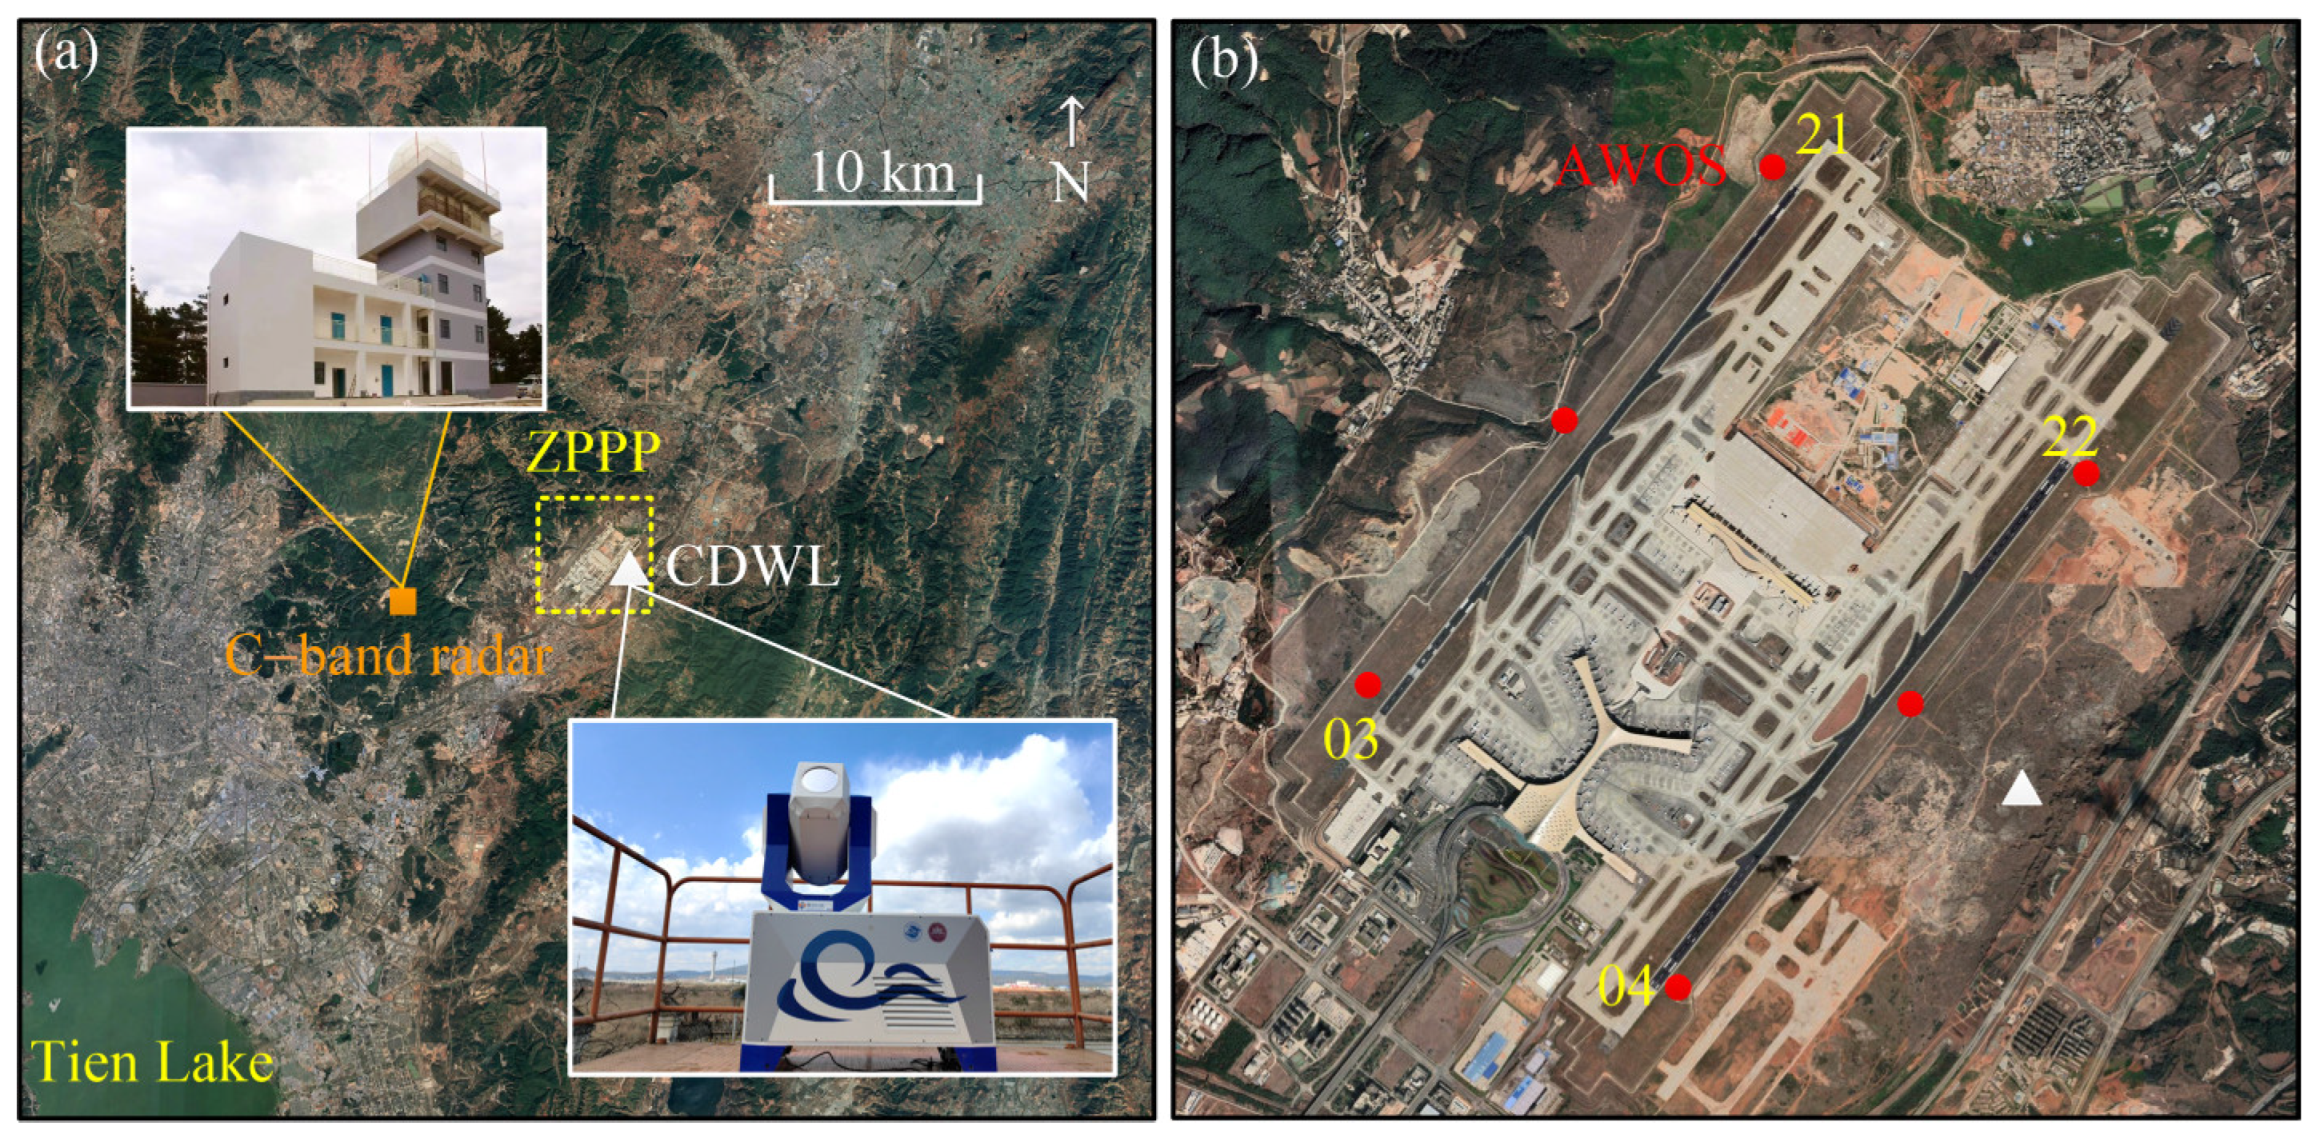
2. Site and Instruments

The experiment was carried out at Kunming Changshui International Airport (KCIA), located in Kunming City, Yunnan Province, China (25°06′N,102°56′E), with an altitude of 2102 m. The airport has two runways, with lengths of 4500 m and 4000 m, respectively. The runways are along the southwest–northeast direction, depending on the prevailing wind direction of the site. The two ends of the runways are labeled as 03/21 and 04/22, respectively. According to the local meteorological log, the average annual precipitation at the airport is 1207.1 mm, with an average of 141.2 days of precipitation and 54.2 days of thunderstorm per year. Thunderstorms are prevalent mainly from April to September, accounting for 89.2% of the total events. The airport is prone to heavy rainfall and thunderstorms, with frequent windshear occurring. Its climate conditions are suitable for the research of this work.
Figure 1 shows the locations of ground-based meteorological observation instruments used in the field experiment. Auto-Weather Observing Systems (AWOSs) made by Vaisala are installed on the middle side and at both ends of each runway, as marked in red solid circles. AWOSs provide data from ultrasonic anemometers and rain sensors [29,30]. The location of the CDWL and C-band radar is shown in Figure 1a. To cover the wind field of all glide paths, the CDWL is located on the southeast side of the airport, at a distance of 870 m from the middle of the 04/22 runway, as marked with a white triangle. The C-band radar is located on the top of a mountain 11 km southwest of the airport, at an elevation of 250 m relative to the ground level of the airport, as marked with an orange square.
The key parameters of the CDWL and the C-band radar are summarized in Table 1. The all-fiber CDWL operates at an eye-safe wavelength of 1.5 µm with a pulse repetition rate of 5 kHz. The pulse duration and energy of the laser are 800 ns and 300 μJ, respectively. A series of updates were applied to improve the detection capability on rainy days. In our previous rainfall detection studies [3,40], we found that a temperature difference between the internal and external environments of the telescope may form a water film on the lens in humid conditions, introducing wavefront distortion and energy loss. Therefore, the telescope is coated with a hydrophobic film and temperature controlled to protect against dew condensation inside and the formation of water films outside. On top of that, the signal attenuates severely when it propagates in rain. Compared with the previous system [3,29], the diameter of the telescope is increased from 80 mm to 200 mm to enhance the detection probability at a long range. Adaptive spectral accumulation is adopted to enhance the retrieval of weak signals [39]. The adjustable temporal resolution of a single radial direction is set from 0.2 s to 1 s. In order to better capture the details of the near-field wind field, an oversampling strategy is adopted by shortening the window size to obtain a space sampling interval of 30/60 m of the wind field. Specifically, Fourier transforms were performed using 100 or 200 sampling points, with a sample rate of 500 MS/s. The radial spatial resolutions with overlaps are set at 30/60/150 m in the range of 0–2.5/3.5–5.5/5.5–30 km. The range resolution is sacrificed for guaranteeing the detection probability at the far field.
The experiment was conducted during the rainy season at KCIA, from January to September. Plan Position Indicator (PPI) scanning and velocity–azimuth display (VAD) scanning mode were applied in an alternating sequence, with a period of 1 min for each scan. The elevation angles of PPI scanning were set to 1°, 3°, and 5° to capture the structure of low-level horizontal wind fields. The elevation angle of VAD scanning was set as 60° for vertical profiling.
The C-band radar is a new-generation weather radar developed by Anhui Sun-Create Electronics Co., Ltd. (Heifei, China) [30]. The radar is capable of detecting the location and intensity of precipitation, hail, and other meteorological targets within a vertical altitude of 24 km and an effective horizontal radius of 450 km. The radar works in the volume cover pattern (VCP) with several low-elevation-angle scans within 6 min.

3. Verification

To evaluate the performance of the CDWL, it is necessary to confirm the measurement accuracy and the detection ability of the CDWL. A comparison between the measurements from the lidar and the anemometers of the AWOS was carried out. The accuracies of the ultrasonic anemometer for wind speed and wind direction are better than ±0.5 m/s and ±5°, respectively. The lidar data of PPI scanning with a 1° elevation angle were used for comparison. Considering that the height between the anemometer and the laser beam increases with detection distance [41], the comparison results are mainly based on the data near the eastern runway.
The influence of raindrop signals on power spectrum distortion is small in low-elevation scanning and is thus not considered in horizontal wind estimation [3]. The wind speed and direction of lidar were retrieved via the variational method [29,42]. The comparison results between the lidar and three anemometers from January to September 2022 are shown in Figure 2.
The horizontal wind speed and direction from the lidar agree well with those from the anemometers. The bias is marginal between the results of the lidar and anemometers. The magnitude of the Root Mean Square (RMS) for wind speed is less than 0.69 m/s, and the magnitude of the RMS for wind direction is less than 13.81°. The correlation coefficients (R2) of wind speed and speed direction are >0.94 and >0.97, respectively. The wind speed mainly concentrates in 3–5 m/s. The wind direction is mainly southwest, with a slight northeast.
The detection range of CDWL is affected by weather conditions, such as aerosol loading and hygroscopicity, water vapor absorption, and precipitation conditions. In this work, the weather conditions are roughly divided into two categories: clear-air and rainy weather. The detection ranges are counted statistically based on continuous experiments from January to September 2022, as shown in Figure 3. The rain rate is the average result of the six AWOSs. The detection range is defined as the maximum radial detection range in one PPI scan at an elevation of 1°. Due to the coexistence of local rainy and local clear-air conditions, when the value of the rain rate is not 0, it is categorized as rainy weather. Figure 3a shows the relationship between rainfall intensity and the maximum detection range. The detection range of lidar deteriorates as the rain rate increases. Figure 3b shows the statistical results of detection probability under clear-air and rainy weather. The detection probability of exceeding 10 km/15 km/20 km/25 km in clear-air weather is 97.91%/86.42%/61.51%/29.91%, respectively. The detection probability of exceeding 10 km/15 km/20 km/25 km in rainy weather is 92.79%/23.53%/4.13%/0.61%. Overall, the detection range of the CDWL can almost cover the runways in all weather conditions.
Figure 4(a1–c1) show three typical PPI scanning results of the CDWL under different weather conditions; the corresponding signal spectra are shown in Figure 4(a2–c2). Figure 4(a1) shows the line-of-sight (LOS) results of a PPI scan on 16 August 2022. Aerosol loading on this day is abundant and the weather is clear. The maximum detection range of every azimuth reaches 30 km. Figure 4(b1) shows the LOS results of a PPI scan on 4 August 2022, with a rain rate of 6 mm/h. The detection distance on the west side of the runways has decayed to 10 km due to the precipitation. The detection range at both ends of the runway reaches 20 km. Figure 4(c1) shows the CDWL results of a PPI scan on 4 July 2022, with a rain rate of 24 mm/h. The detection range of lidar still covers all runways and glide paths. The detection range of the lidar under rainy conditions is higher in the direction of the runway than in any other direction. The power spectrum distribution in the direction of the runway during rainfall is shown in Figure 4(b2,c2). This may be due to factors such as terrain, distribution of rainfall intensity, aerosol pollution, and dust from aircraft and urban activities.

4. Experiment and Result

4.1. Windshear Event Reports

Table 2 shows the windshear event reports from crews during the observation experiment in 2022. The crew reported a total of eighteen windshear events during takeoff and landing at the KCIA, with six in clear-air weather, two in sleet weather, and ten in rainy weather. The proportion of precipitation weather reached 67%. There were still many severe convective and rainy weather conditions, and due to radar and lidar warning services, flights were canceled or delayed in advance, resulting in low-level windshear existing without corresponding crew reports. Therefore, the problem of windshear on rainy days is very serious and has a significant impact on the operations of KCIA.

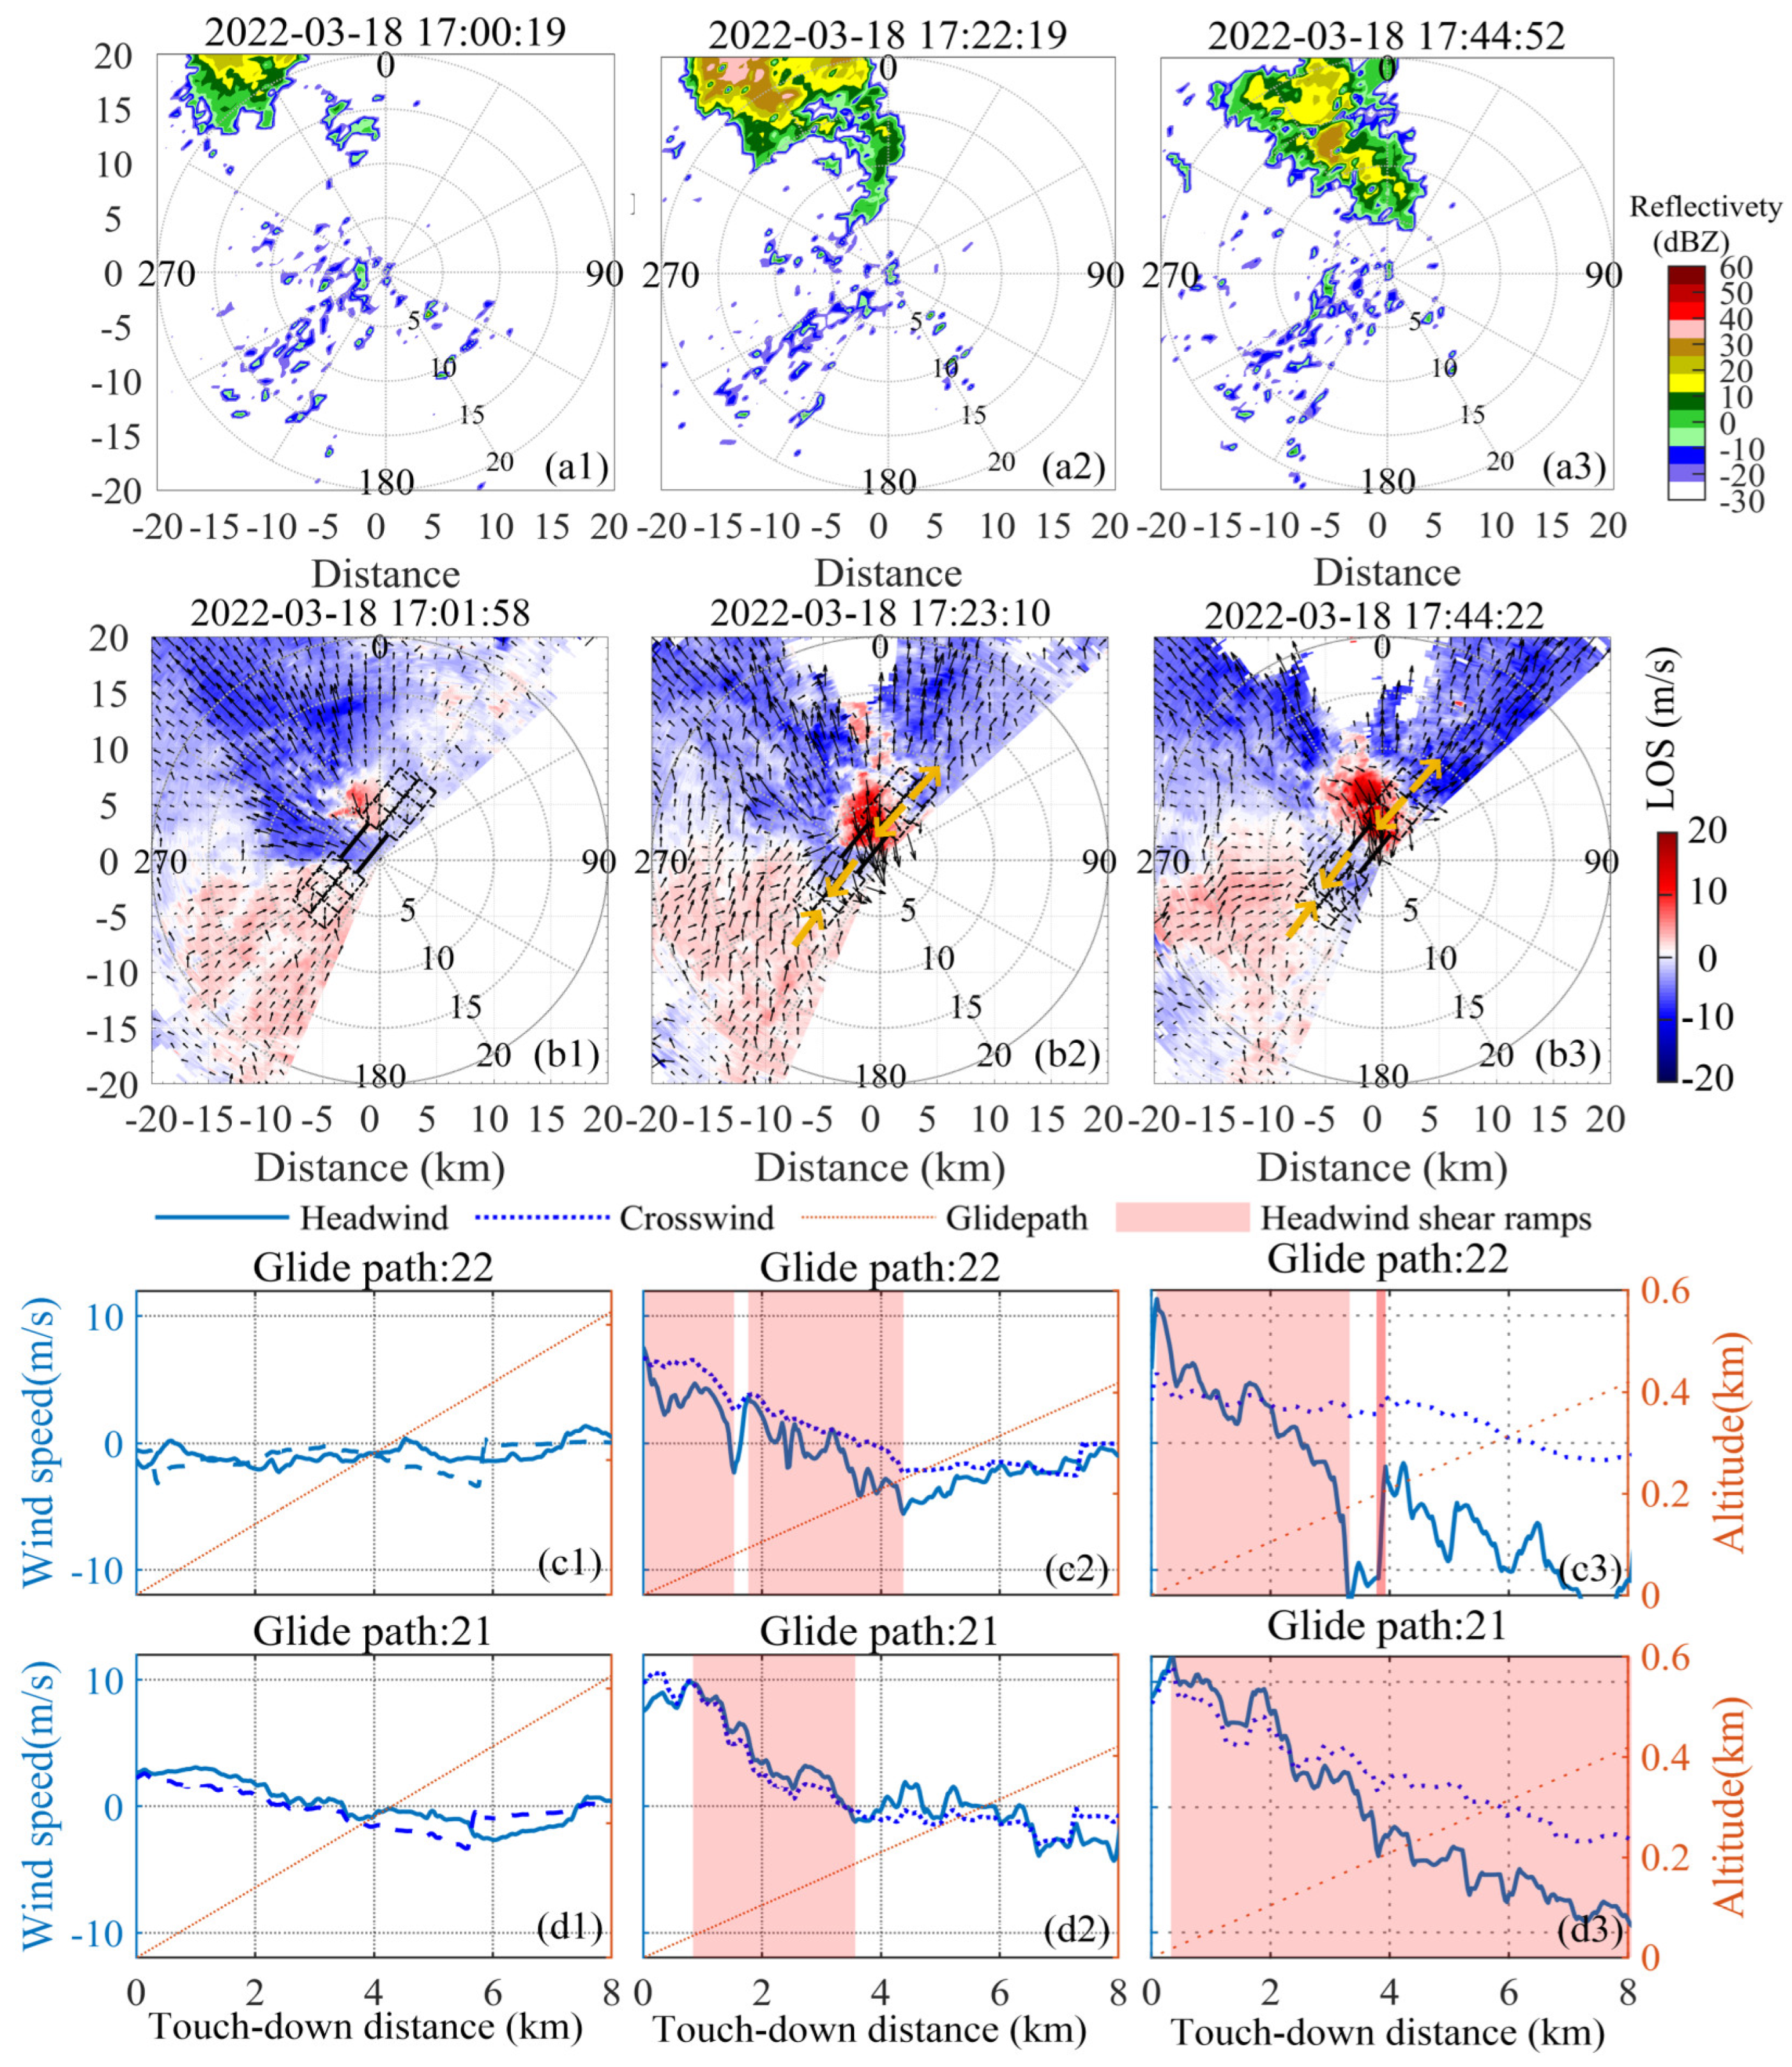
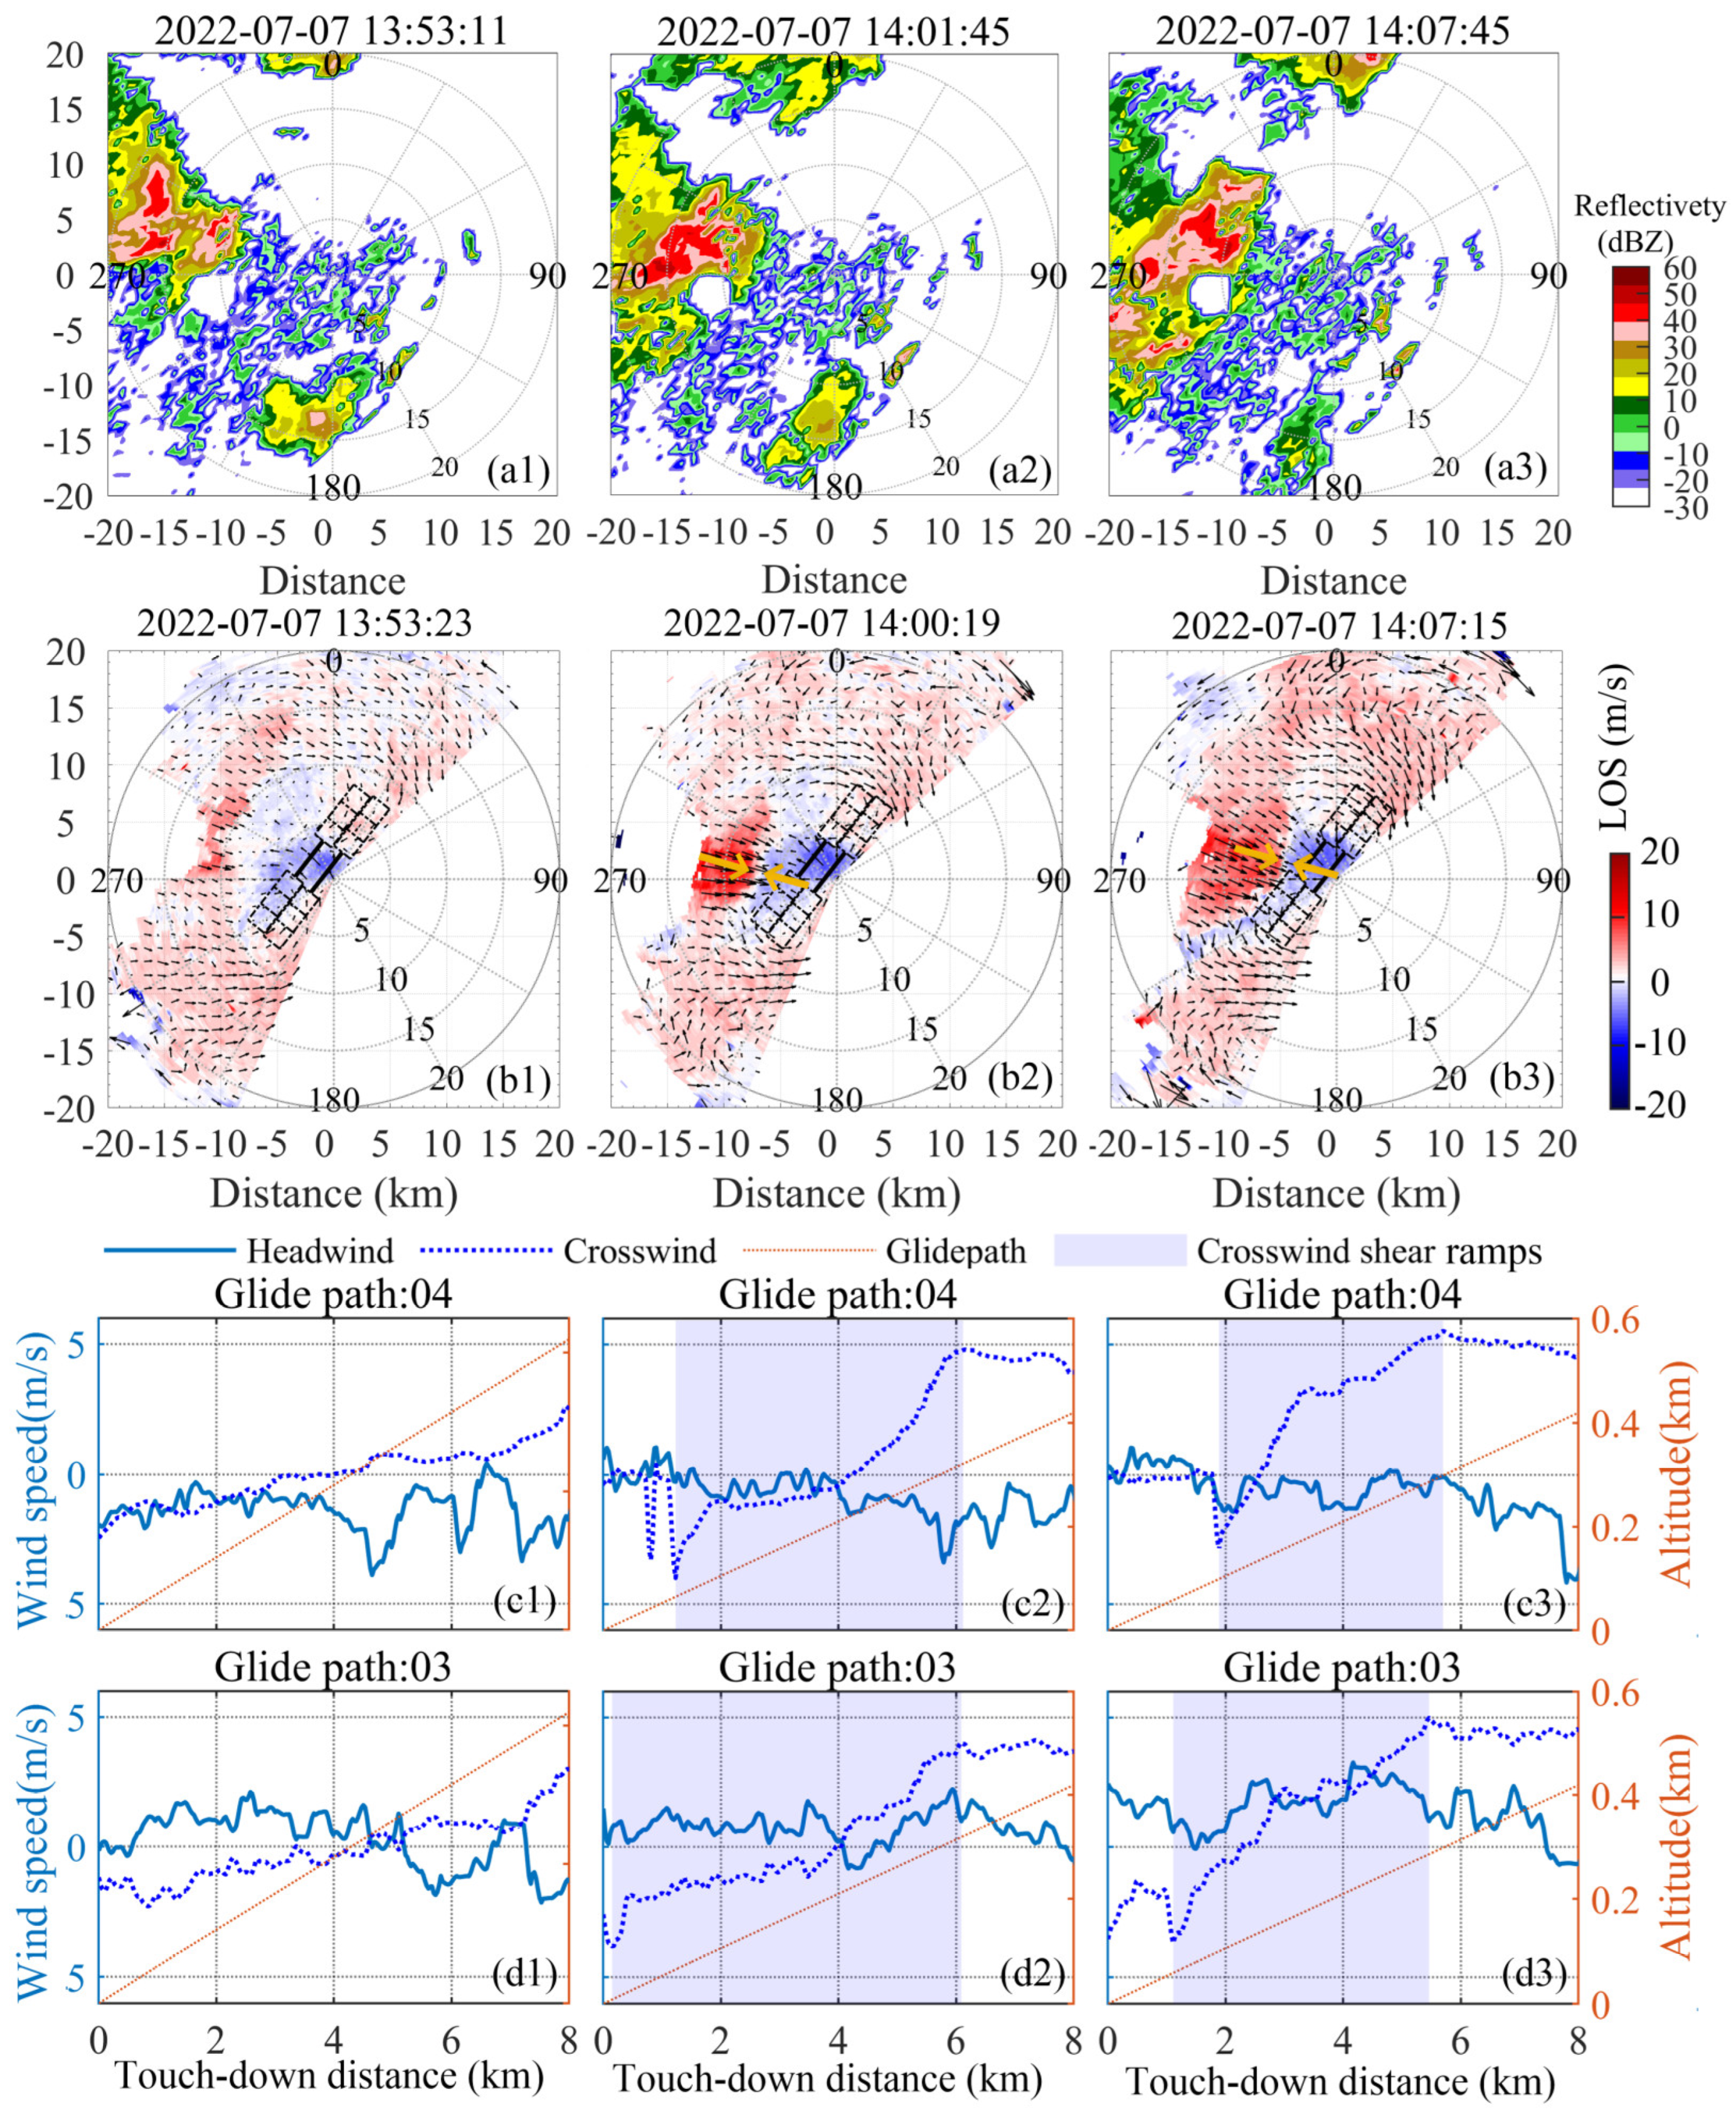
4.2. Convective Weather Detected in Horizontal Scanning

To study the characteristics of low-level wind fields under typical convective rainfall conditions, a deep analysis based on CDWL results was conducted on two convective cases in spring and summer, respectively. Figure 5 shows the detection results of typical spring convective rainfall conditions on 18 March 2022. The reflectivity intensity of C-band radar at an elevation of 1.2° is shown in Figure 5(a1–a3). In order to maintain coordinate consistency, the coordinate origin of the radar data was translated to the location of the CDWL.
At 17:00, a convective cloud system appeared in the southwest of the airport and developed towards the airport. At 17:22, the convective cloud reached a mature stage and the maximum reflectivity intensity reached 35 dBz, accompanied by precipitation. At 17:44, due to the dissipation of precipitation, convective clouds began to vanish and moved 5 km away from the airport. From the direction of radar echo movement, it can be inferred that the convective clouds were accompanied by northwest wind. Since the strong radar echo signal did not cover the entire field, it was difficult to obtain the entire wind field. And the altitude of the strong echo relative to the airport exceeded 500 m. Therefore, although the radar can monitor convective activity well, it has difficulty in obtaining a fine dynamic structure of the low-level wind field in the glide path.
In contrast, the low-level horizontal wind field detected by the lidar is shown in Figure 5(b1–b3). In the early stage, the background wind field was southeast with a speed of 8 m/s. The development of convective cloud systems brought a strong southwest gust front with wind speeds reaching 20 m/s, which mainly affected the north glide paths 22 and 21 of the airport. There was a strong divergence structure in the north of the airport, while there was a convergence structure in the south of the runway. The corresponding headwind and crosswind of glide paths 22 and 21 were extracted as shown in Figure 5(c1–c3) and Figure 5(d1–d3). When the convective cloud system approached the airport, headwind shear occurred with a maximum windshear of 24 m/s. As reported by the crew, an aircraft descended from the southern glide path but still encountered windshear at 17:38 because there was a convergence structure that affected the glide path at the southern end.
Figure 6 shows the detection results of typical summer convective rainfall conditions on 7 July 2022. The reflectivity intensity of C-band radar is shown in Figure 6(a1–a3). At 13:53, a convective cloud system appeared in the west of the airport and developed towards the airport. In summer, due to the abundant water vapor transported from the southwest, convection develops vigorously. At 14:01, the maximum reflectivity intensity reached 60 dBz. At 14:07, due to the dissipation of precipitation, the strong echo area began to vanish and moved to 10 km away from the airport.
The low-level horizontal wind field detected by the lidar is shown in Figure 6(b1–b3). The development of convective cloud systems brought a strong west gust front with wind speeds reaching 15 m/s, mainly affecting the south glide paths 04 and 03 of the airport. There was a strong convergence structure in the west of the airport. The corresponding headwind and crosswind of glide paths 04 and 03 were extracted as shown in Figure 6(c1–c3) and Figure 6(d1–d3), respectively. When the convective cloud system approached the airport, crosswind shear occurred with a maximum windshear of 10 m/s.

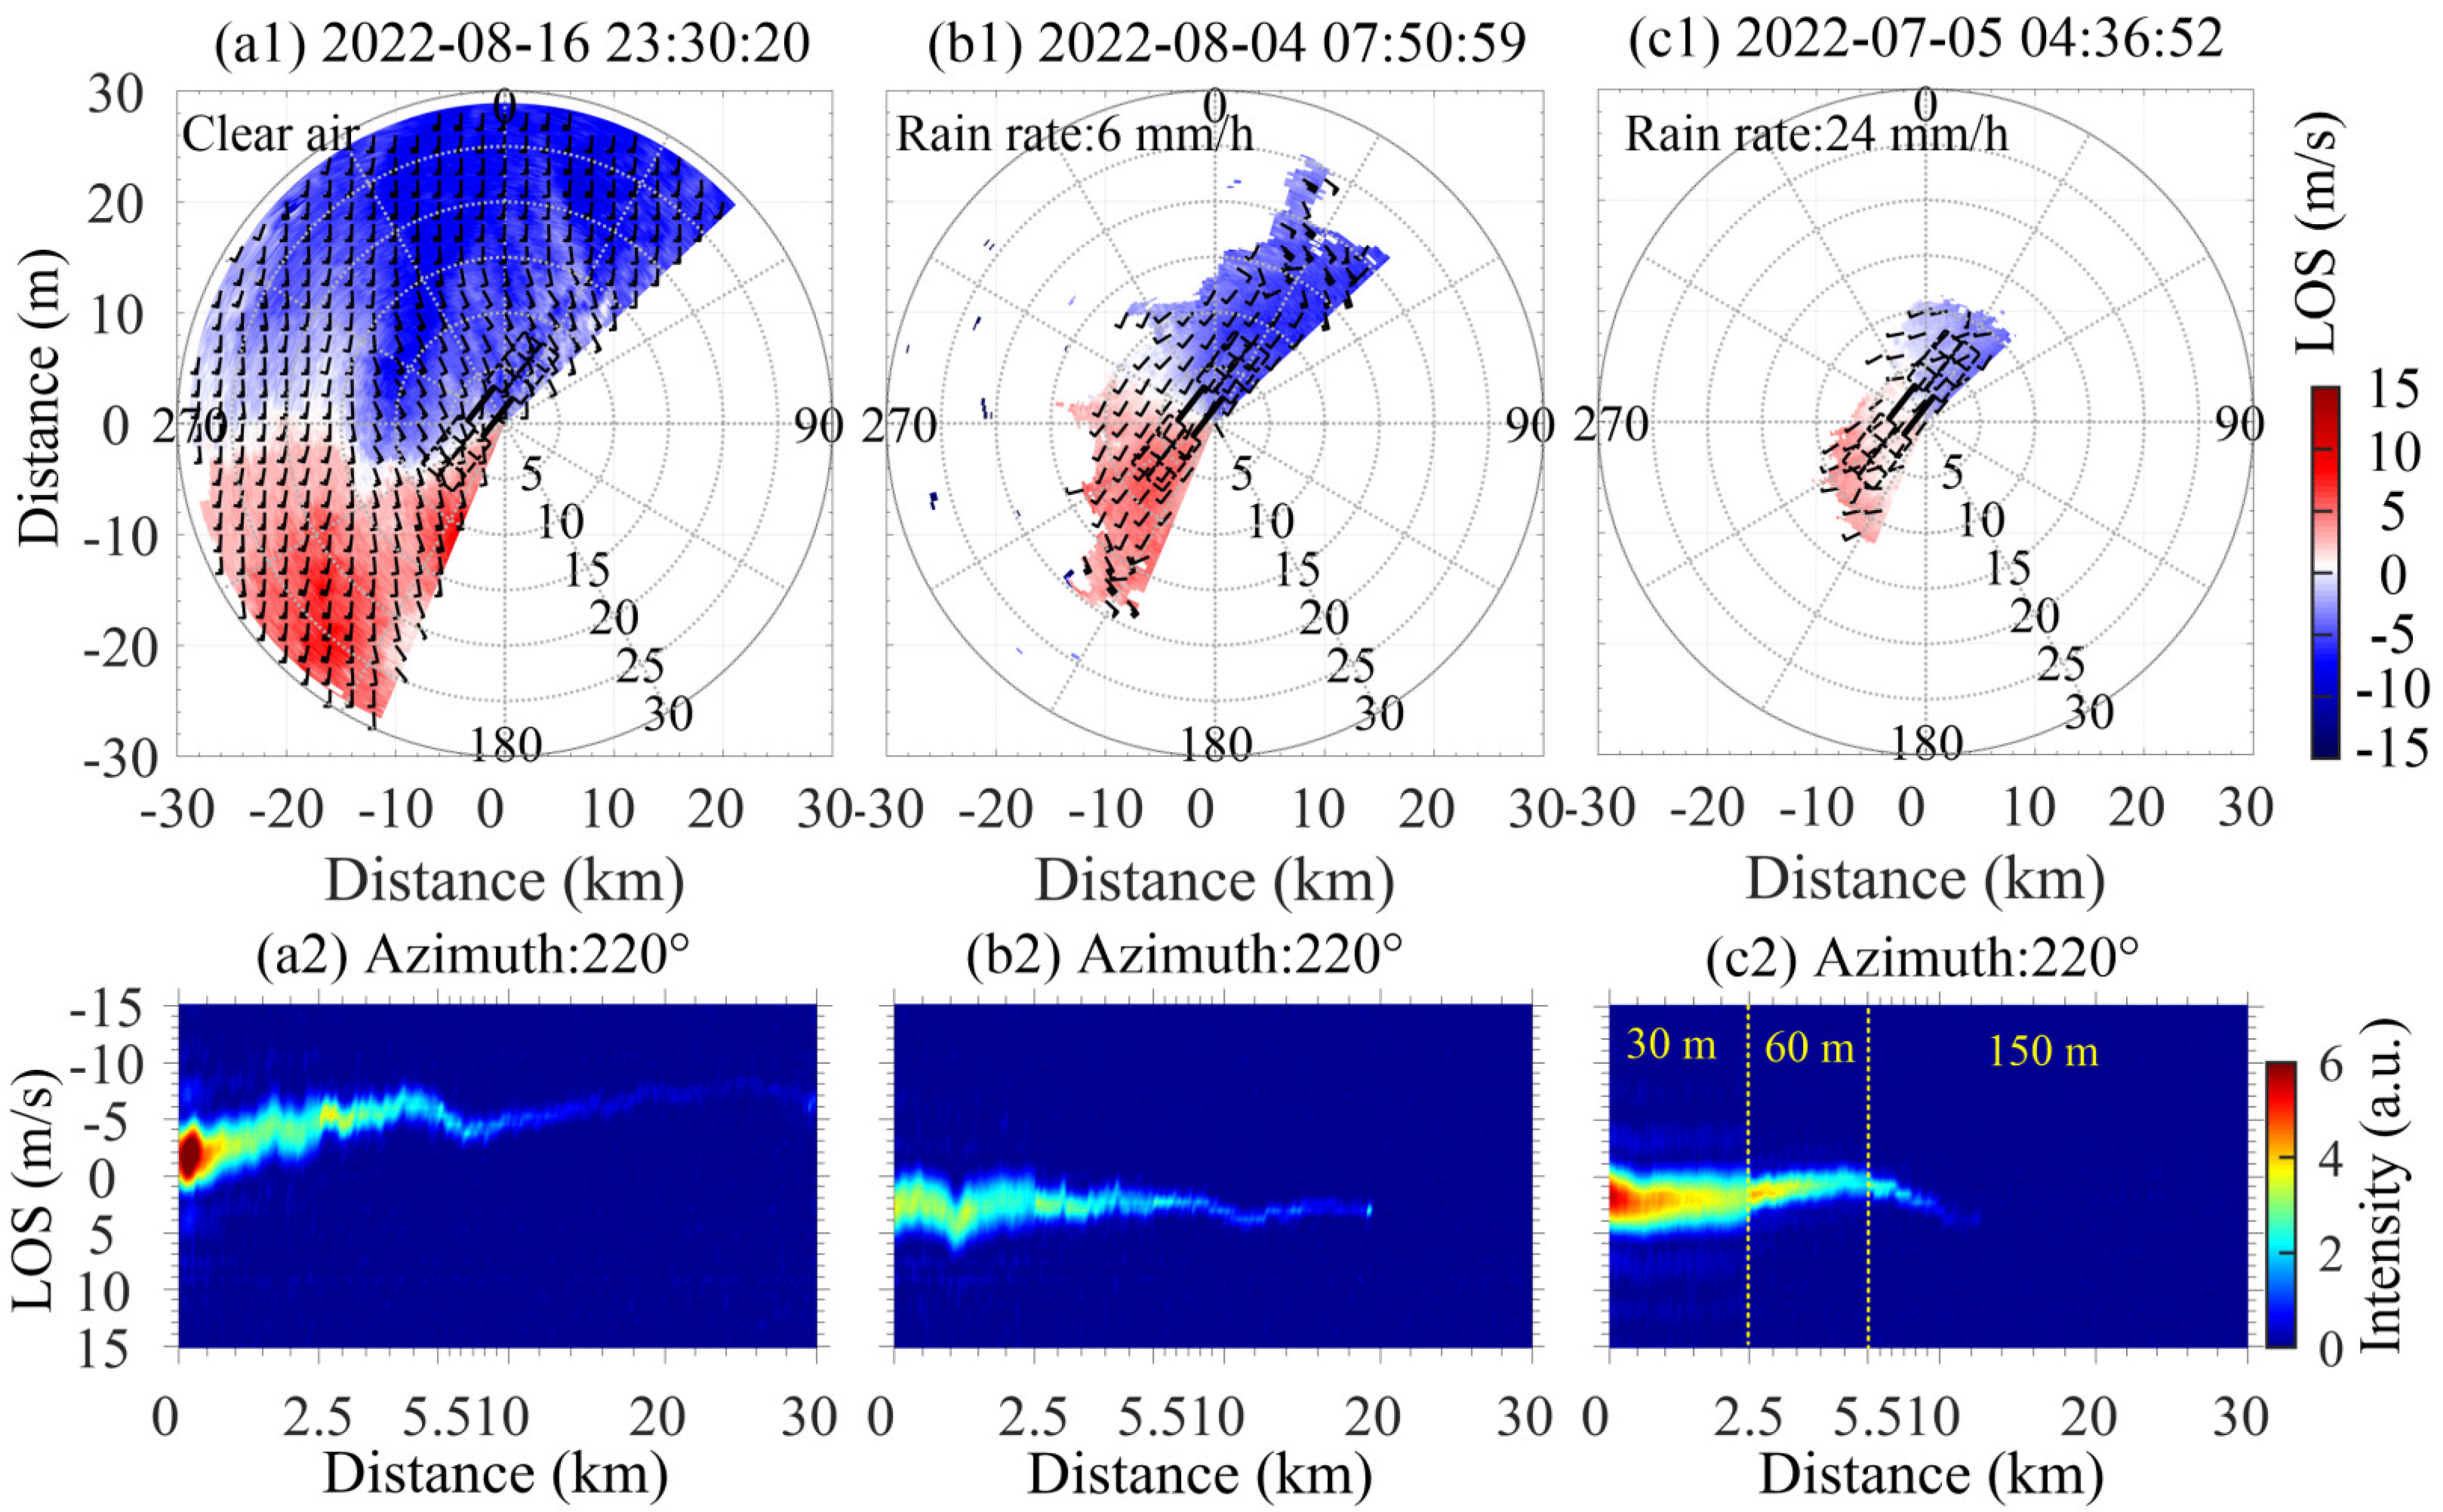
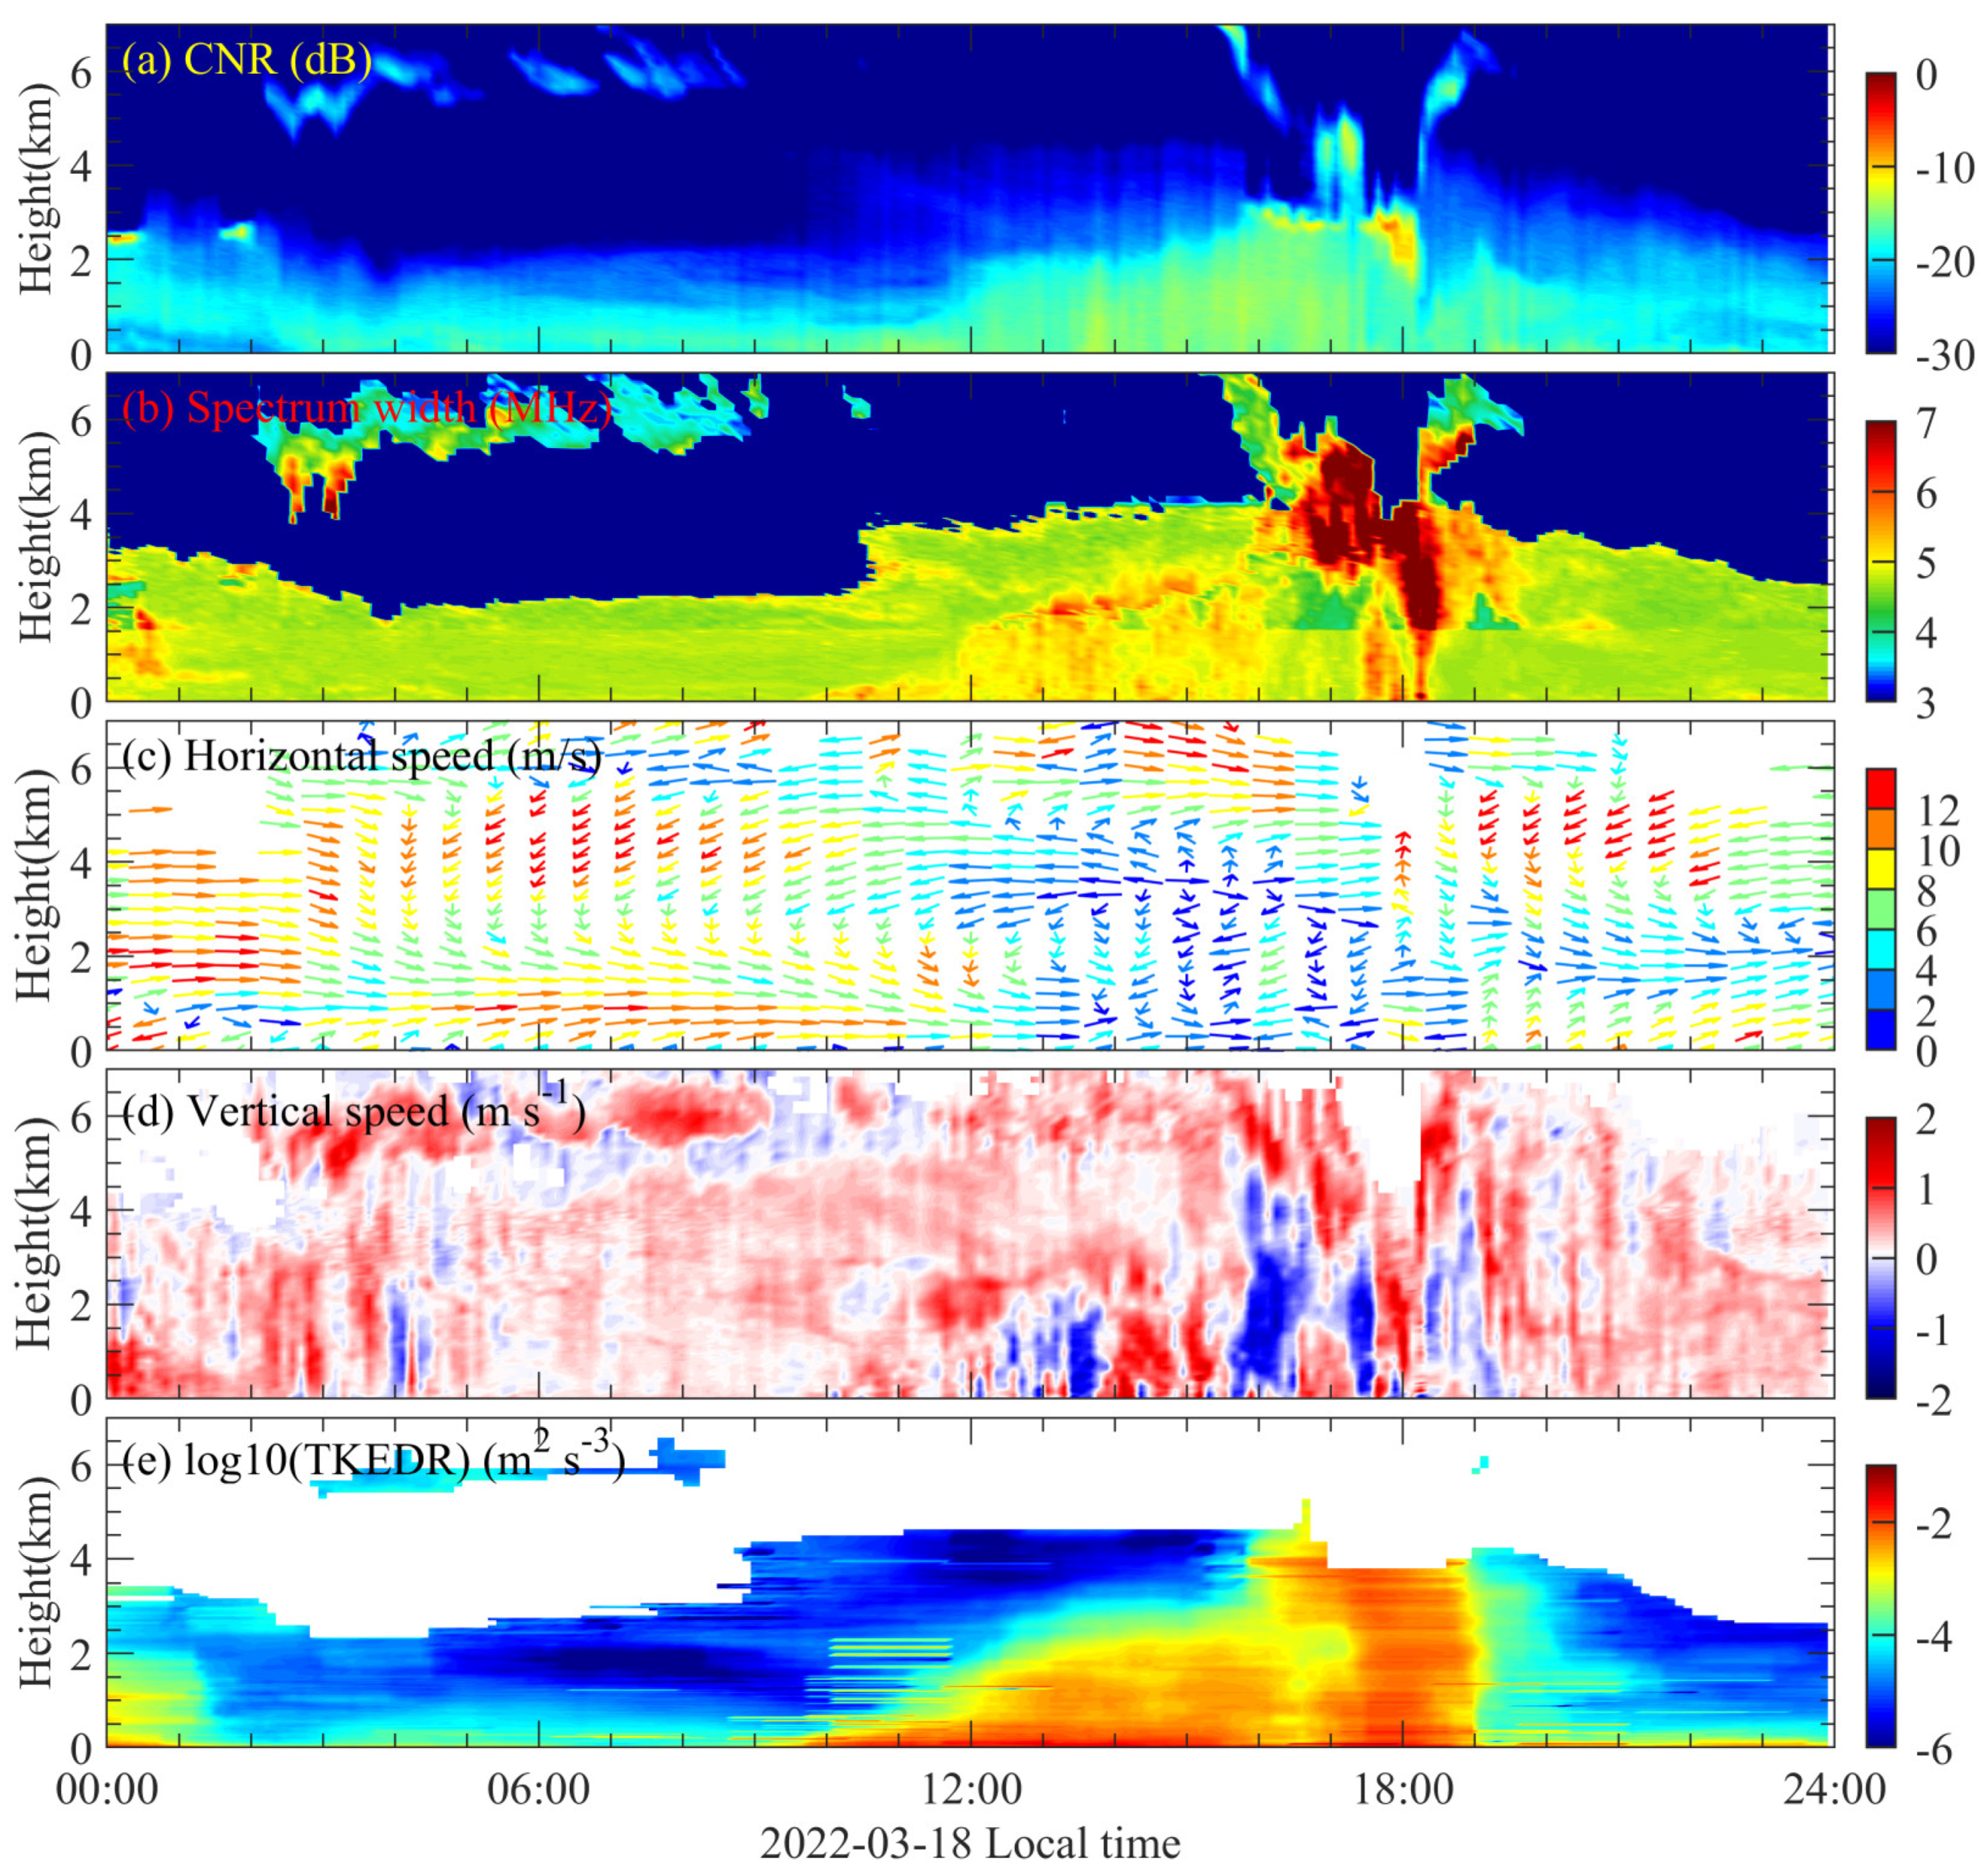
4.3. Convective Weather Detected in Vertical Direction

In addition to the low-level horizontal wind field, the vertical wind profiles from the CDWL provide useful information for further understanding the process of convective weather and its impact on airport operations. Figure 7 shows the vertical profiles on 18 March 2022. The effective detection height of the lidar reached 7 km. When convective clouds formed and moved over the lidar, it was difficult for the laser to penetrate the cloud, resulting in a ‘V-cloud’ [43], as shown in Figure 7a.
As shown in Figure 7b, spectral width layering is caused by the difference in the radial spatial resolutions with overlap. Spectrum width broadening can be observed during this period, which means the lidar spectrum has multiple components with different vertical velocities. Multiple peaks coexist in and under the cloud due to the distinct signals of wind and raindrops [3]. The increasing spectral width can effectively indicate the detailed structure of cloud and precipitation regions [40]. By using the lidar, it can be inferred that it was raining from 17:30 to 18:20, and the rainfall intensity and area at high altitudes were larger than those on the surface. To eliminate the interference of raindrop signals, power spectrum separation was performed to obtain high-precision wind fields [3], as shown in Figure 7c,d. Before the formation of convective cloud systems, southwest winds of about 9 m/s were dominant below 2.5 km, while northeast winds of 11 m/s were dominant above 2.5 km. At noon, due to the heating effect of sun radiation, an upward airflow was generated. The warm and humid air at the bottom was transported to the dry and cold environment at the top, providing a foundation for the formation of convective systems. The wind speed and direction indicate turbulent air movement during convection formation. The turbulent kinetic energy dissipation rate (TKEDR) is shown in Figure 7e. The increase in turbulence intensity at 12:00–16:00 was due to enhanced convective motion by radiative heating. The increase in turbulence intensity at 15:00–17:00 was caused by the existence of complex convergent, divergent, and convective motions in the convective process. The region with strong turbulence intensity was derived from convective clouds, which increase the risk of aircraft experiencing bumps and windshear.
KCIA is affected by the southwest monsoon; southwesterly winds prevail all year round. The wind rose diagram was obtained from all effective detection heights during the observation experiment, as shown in Figure 8. Southwest winds are dominant under clear-sky conditions. However, northeast winds are dominant under rainy conditions, as shown in Figure 8b. The formation of rainy days is highly correlated with wind direction. The cause of rainy weather is mainly the formation of an unstable layer structure with cold air at the top and warm air at the bottom of the atmosphere. With the progress of the transition from spring to summer, such conditions become increasingly common. Specifically, the southwest warm and humid airflow brings a lot of water vapor and heat. At the same time, solar radiation heats up the ground, which leads to a very favorable low-altitude atmospheric temperature rise. The dual effects of warm and humid airflow transportation and solar radiation make it easy to form a high-temperature and high-humidity warm and humid structure at low levels. The cold air at high altitudes also has a certain strength, especially the dry cold air brought by the western high-altitude trough, which is superimposed on the warm and humid airflow at low levels, forming an unstable layer structure with upper cold and lower warmth. Thus, rainy weather is usually accompanied by northeast winds at KCIA.

5. Conclusions

An enhanced all-fiber CDWL was proposed to study the airport windshear under rainy conditions. The maximum horizontal and vertical detection range reached 30 km and 7 km, respectively. The CDWL achieved a detection probability exceeding 92.79% for distances exceeding 10 km under rainy weather conditions, effectively covering the airport runway. In situations such as extreme rainfall or light rainfall accompanied by heavy water vapor and fog, the problem of insufficient detection distance still exists. By combining C-band radar, two typical convective weather processes were well analyzed with low-level horizontal wind field and vertical profiles obtained by the CDWL. The results show that the CDWL can capture convergent and divergent structures due to the convective process, which leads to headwind shear and crosswind shear on the airport runway. The vertical profiles of CDWL provided useful information for the triggering of convective systems, which revealed the mechanism of easy formation of rainy days and windshear in KCIA.
Detecting low-level horizontal wind fields and vertical profiles accurately before and after convection formation is crucial for early windshear warning. This study is beneficial for improving aircraft safety and airport operational efficiency in rainy weather. In the future, we will deploy comparisons between different CDWL systems in the conventional detection field and further extend the capability of the CDWL to cope with various complex and harsh weather conditions.

Author Contributions

Conceptualization, H.X.; Methodology, J.Y.; Software, Y.C. and L.S.; Formal Analysis, H.X. and J.Y.; Investigation, J.Y; Resources, Z.Y., S.H. and D.Z.; Data Curation, J.Y.; Writing—Original Draft Preparation, H.X. and J.Y.; Writing—Review and Editing, H.X. and J.Y.; Visualization, J.Y.; Supervision, H.X. All authors have read and agreed to the published version of the manuscript.

Funding

This work was financially supported by the Natural Science Foundation of Jiangsu Province (No. BK20230434) and the Aeronautical Science Foundation of China (No. 202300220R2001).

Data Availability Statement

Data underlying the results presented in this paper can be obtained from the authors upon reasonable request.

Acknowledgments

We are grateful to KCIA for providing anemometer data and flight crew reports. We thank Chengzhong Mao, Wenzheng Zi, Aibing Nian, and Qirong Tai for their contribution to the field experiment.

Conflicts of Interest

The authors declare no conflicts of interest.

References

  1. ICAO. Manual on Low-Level Wind Shear; International Civil Aviation Organization: Montreal, QC, Canada, 2005. [Google Scholar]
  2. Lin, C.; Zhang, K.; Chen, X.; Liang, S.; Wu, J.; Zhang, W. Overview of Low-Level Wind Shear Characteristics over Chinese Mainland. Atmosphere 2021, 12, 628. [Google Scholar] [CrossRef]
  3. Yuan, J.; Xia, H.; Wei, T.; Wang, L.; Yue, B.; Wu, Y. Identifying cloud, precipitation, windshear, and turbulence by deep analysis of the power spectrum of coherent Doppler wind lidar. Opt. Express 2020, 28, 37406–37418. [Google Scholar] [CrossRef]
  4. Luers, J.; Hairies, P. Heavy rain influence on airplane accidents. J. Aircr. 1983, 20, 187–191. [Google Scholar] [CrossRef]
  5. Menitt, M.W.; Klingle-Wilson, D.; Campbell, S.D. Wind Shear Detection with Pencil-Beam Radars. Linc. Lab. J. 1989, 2, 483–510. [Google Scholar]
  6. Goff, R.C. The Low-Level Wind Shear Alert System (LLWSAS); National Aviation Facilities Experimental Center: Atlantic City, NJ, USA, 1980.
  7. Wu, B.; Du, S.; Li, W.; Shen, Y.; Luo, L.; Li, Y.; Wei, M.; Wang, D.; Xi, L. The Kinematic and Microphysical Characteristics of Extremely Heavy Rainfall in Zhengzhou City on 20 July 2021 Observed with Dual-Polarization Radars and Disdrometers. Remote Sens. 2023, 15, 5688. [Google Scholar] [CrossRef]
  8. Zheng, J.; Liu, L.; Chen, H.; Gou, Y.; Che, Y.; Xu, H.; Li, Q. Characteristics of Warm Clouds and Precipitation in South China during the Pre-Flood Season Using Datasets from a Cloud Radar, a Ceilometer, and a Disdrometer. Remote Sens. 2019, 11, 3045. [Google Scholar] [CrossRef]
  9. Li, Y.; Zhang, G.; Zhang, Y. Evolution of the Charge Structure and Lightning Discharge Characteristics of a Qinghai-Tibet Plateau Thunderstorm Dominated by Negative Cloud-to-Ground Flashes. J. Geophys. Res. Atmos. 2020, 125, e2019JD031129. [Google Scholar] [CrossRef]
  10. Hon, K.-K. Predicting Low-Level Wind Shear Using 200-m-Resolution NWP at the Hong Kong International Airport. J. Appl. Meteorol. Climatol. 2020, 59, 193–206. [Google Scholar] [CrossRef]
  11. Brooks, B.J.; Davies, F.; Hogan, R.J.; Westbrook, C.D.; Brooks, I.M.; Illingworth, A.J.; O’Connor, E.J. A Method for Estimating the Turbulent Kinetic Energy Dissipation Rate from a Vertically Pointing Doppler Lidar, and Independent Evaluation from Balloon-Borne In Situ Measurements. J. Atmos. Ocean. Technol. 2010, 27, 1652–1664. [Google Scholar] [CrossRef]
  12. Banakh, V.; Smalikho, I. Lidar Studies of Wind Turbulence in the Stable Atmospheric Boundary Layer. Remote Sens. 2018, 10, 1219. [Google Scholar] [CrossRef]
  13. Li, J.; Shen, C.; Gao, H.; Chan, P.W.; Hon, K.K.; Wang, X. Path integration (PI) method for the parameter-retrieval of aircraft wake vortex by Lidar. Opt. Express 2020, 28, 4286–4306. [Google Scholar] [CrossRef] [PubMed]
  14. Jia, M.; Yuan, J.; Wang, C.; Xia, H.; Wu, Y.; Zhao, L.; Wei, T.; Wu, J.; Wang, L.; Gu, S.Y.; et al. Long-lived high-frequency gravity waves in the atmospheric boundary layer: Observations and simulations. Atmos. Chem. Phys. 2019, 19, 15431–15446. [Google Scholar] [CrossRef]
  15. Zhou, A.; Han, F.; Sun, D.; Han, Y.; Zheng, J.; Jiang, S. 1.55-μm pulse coherent LIDAR with 10-km detection range. Opt. Eng. 2019, 58, 096103. [Google Scholar] [CrossRef]
  16. Choy, B.; Lee, O.S.; Shun, C.; Cheng, C. Prototype Automatic LIDAR-based Wind Shear Detection Algorithms. In Proceedings of the 10th Conference on Aviation Range & Aerospace Meteorology, Portland, OR, USA, 13–16 May 2002. [Google Scholar]
  17. Hon, K.; Chan, P. Application of LIDAR-derived eddy dissipation rate profiles in low-level wind shear and turbulence alerts at H ong K ong I nternational A irport. Meteorol. Appl. 2014, 21, 74–85. [Google Scholar] [CrossRef]
  18. Chan, P.W. LIDAR-based turbulence intensity calculation using glide-path scans of the Doppler LIght Detection And Ranging (LIDAR) systems at the Hong Kong International Airport and comparison with flight data and a turbulence alerting system. Meteorol. Z. 2010, 19, 549–563. [Google Scholar] [CrossRef]
  19. Chan, P.W.; Hon, K.K.; Shin, D.K. Combined use of headwind ramps and gradients based on LIDAR data in the alerting of low-level windshear/turbulence. Meteorol. Z. 2011, 20, 661–670. [Google Scholar] [CrossRef] [PubMed]
  20. Hon, K.K.; Chan, P.W.; Chiu, Y.Y.; Tang, W. Application of Short-Range LIDAR in Early Alerting for Low-Level Windshear and Turbulence at Hong Kong International Airport. Adv. Meteorol. 2014, 2014, 162748. [Google Scholar] [CrossRef]
  21. Chan, P.W. Severe wind shear at Hong Kong International Airport: Climatology and case studies. Meteorol. Appl. 2017, 24, 397–403. [Google Scholar] [CrossRef]
  22. Chan, P.W.; Lai, K.K.; Li, Q.S. High-resolution (40 m) simulation of a severe case of low-level windshear at the Hong Kong International Airport—Comparison with observations and skills in windshear alerting. Meteorol. Appl. 2021, 28, e2020. [Google Scholar] [CrossRef]
  23. Lee, Y.F.; Chan, P.W. Application of Short-Range Lidar in Wind Shear Alerting. J. Atmos. Ocean. Technol. 2012, 29, 207–220. [Google Scholar] [CrossRef]
  24. Chan, P.W.; Shun, C.M. Applications of an Infrared Doppler Lidar in Detection of Wind Shear. J. Atmos. Ocean. Technol. 2008, 25, 637–655. [Google Scholar] [CrossRef]
  25. Oude Nijhuis, A.C.P.; Thobois, L.P.; Barbaresco, F.; De Haan, S.; Dolfi-Bouteyre, A.; Kovalev, D.; Krasnov, O.A.; Vanhoenacker-Janvier, D.; Wilson, R.; Yarovoy, A.G. Wind Hazard and Turbulence Monitoring at Airports with Lidar, Radar, and Mode-S Downlinks: The UFO Project. Bull. Am. Meteorol. Soc. 2018, 99, 2275–2293. [Google Scholar] [CrossRef]
  26. Yoshino, K. Low-Level Wind Shear Induced by Horizontal Roll Vortices at Narita International Airport, Japan. J. Meteorol. Soc. Jpn. 2019, 97, 403–421. [Google Scholar] [CrossRef]
  27. Nechaj, P.; Gaal, L.; Bartok, J.; Vorobyeva, O.; Gera, M.; Kelemen, M.; Polishchuk, V. Monitoring of Low-Level Wind Shear by Ground-based 3D Lidar for Increased Flight Safety, Protection of Human Lives and Health. Int. J. Environ. Res. Public Health 2019, 16, 4584. [Google Scholar] [CrossRef]
  28. Li, L.; Shao, A.; Zhang, K.; Ding, N.; Chan, P.-W. Low-Level Wind Shear Characteristics and Lidar-Based Alerting at Lanzhou Zhongchuan International Airport, China. J. Meteorol. Res. 2020, 34, 633–645. [Google Scholar] [CrossRef]
  29. Yuan, J.; Su, L.; Xia, H.; Li, Y.; Zhang, M.; Zhen, G.; Li, J. Microburst, Windshear, Gust Front, and Vortex Detection in Mega Airport Using a Single Coherent Doppler Wind Lidar. Remote Sens. 2022, 14, 1626. [Google Scholar] [CrossRef]
  30. Huang, X.; Zheng, J.; Che, Y.; Wang, G.; Ren, T.; Hua, Z.; Tian, W.; Su, Z.; Su, L. Evolution and Structure of a Dry Microburst Line Observed by Multiple Remote Sensors in a Plateau Airport. Remote Sens. 2022, 14, 3841. [Google Scholar] [CrossRef]
  31. Zhang, H.; Wu, S.; Wang, Q.; Liu, B.; Yin, B.; Zhai, X. Airport low-level wind shear lidar observation at Beijing Capital International Airport. Infrared Phys. Technol. 2019, 96, 113–122. [Google Scholar] [CrossRef]
  32. Zhang, H.; Liu, X.; Wang, Q.; Zhang, J.; He, Z.; Zhang, X.; Li, R.; Zhang, K.; Tang, J.; Wu, S. Low-Level Wind Shear Identification along the Glide Path at BCIA by the Pulsed Coherent Doppler Lidar. Atmosphere 2020, 12, 50. [Google Scholar] [CrossRef]
  33. Liu, Z.; Barlow, J.F.; Chan, P.-W.; Fung, J.C.H.; Li, Y.; Ren, C.; Mak, H.W.L.; Ng, E. A Review of Progress and Applications of Pulsed Doppler Wind LiDARs. Remote Sens. 2019, 11, 2522. [Google Scholar] [CrossRef]
  34. Thobois, L.; Cariou, J.P.; Gultepe, I. Review of Lidar-Based Applications for Aviation Weather. Pure Appl. Geophys. 2018, 176, 1959–1976. [Google Scholar] [CrossRef]
  35. Huang, J.; Ng, M.K.P.; Chan, P.W. Wind Shear Prediction from Light Detection and Ranging Data Using Machine Learning Methods. Atmosphere 2021, 12, 644. [Google Scholar] [CrossRef]
  36. Dai, H.; Gao, C.; Lin, Z.; Wang, K.; Zhang, X. Wind lidar signal denoising method based on singular value decomposition and variational mode decomposition. Appl. Opt. 2021, 60, 10721–10726. [Google Scholar] [CrossRef] [PubMed]
  37. Zhou, Y.; Li, L.; Wang, K.; Zhang, X.; Gao, C. Coherent Doppler wind lidar signal denoising adopting variational mode decomposition based on honey badger algorithm. Opt. Express 2022, 30, 25774–25787. [Google Scholar] [CrossRef] [PubMed]
  38. Kliebisch, O.; Uittenbosch, H.; Thurn, J.; Mahnke, P. Coherent Doppler wind lidar with real-time wind processing and low signal-to-noise ratio reconstruction based on a convolutional neural network. Opt. Express 2022, 30, 5540–5552. [Google Scholar] [CrossRef] [PubMed]
  39. Kotake, N.; Sakamaki, H.; Imaki, M.; Miwa, Y.; Ando, T.; Yabugaki, Y.; Enjo, M.; Kameyama, S. Intelligent and compact coherent Doppler lidar with fiber-based configuration for robust wind sensing in various atmospheric and environmental conditions. Opt. Express 2022, 30, 20038–20062. [Google Scholar] [CrossRef] [PubMed]
  40. Wei, T.; Xia, H.; Hu, J.; Wang, C.; Shangguan, M.; Wang, L.; Jia, M.; Dou, X. Simultaneous wind and rainfall detection by power spectrum analysis using a VAD scanning coherent Doppler lidar. Opt. Express 2019, 27, 31235–31245. [Google Scholar] [CrossRef] [PubMed]
  41. Ibrahim, I.; Kopp, G.A.; Sills, D.M.L. Retrieval of Peak Thunderstorm Wind Velocities Using WSR-88D Weather Radars. J. Atmos. Ocean. Technol. 2023, 40, 237–251. [Google Scholar] [CrossRef]
  42. Chan, P.W.; Shao, A.M. Depiction of complex airflow near Hong Kong International Airport using a Doppler LIDAR with a two-dimensional wind retrieval technique. Meteorol. Z. 2007, 16, 491–504. [Google Scholar] [CrossRef]
  43. Wu, K.; Wei, T.; Yuan, J.; Xia, H.; Huang, X.; Lu, G.; Zhang, Y.; Liu, F.; Zhu, B.; Ding, W. Thundercloud structures detected and analyzed based on coherent Doppler wind lidar. Atmos. Meas. Tech. Discuss. 2023, 16, 5811–5825. [Google Scholar] [CrossRef]
Figure 1. (a) Photograph of the CDWL and the radar station; (b) distribution diagram of the instruments. The CDWL, C-band radar, and AWOS are marked as a white triangle, orange square, and red solid circle, respectively.
Remotesensing 16 00924 g001
Figure 2. Comparison results of wind speed and direction retrieved from the lidar and measured by anemometers. (a)–(c) and (d)–(f) show the comparison result of wind speed and wind direction, respectively. The detailed linear fitting results and positions of the anemometers are given in each subgraph. The color of each point represents the normalization probability density using the kernel density estimation.
Remotesensing 16 00924 g002
Figure 3. Statistical results of lidar detection distance over 9 months. (a) The relationship between rainfall intensity and detection range. (b) Statistical results of detection probability in clear-air and rainy weather.
Remotesensing 16 00924 g003
Figure 4. Typical PPI scan results of the CDWL under different weather conditions. (a1,a2) Clear-air weather. (b1,b2) and (c1,c2) Rainy weather. (a2c2) show the power spectrum distribution in the direction of the runway. The distribution of distance resolution is marked in a yellow font in (c2).
Remotesensing 16 00924 g004
Figure 5. Detection results of a typical spring convective rainfall condition on 18 March 2022. (a1a3) The reflectivity of C-band radar at an elevation of 1.2°. (b1b3) PPI scanning results of CDWL at an elevation of 3°. (c1c3) and (d1d3) are the headwind and crosswind of glide path 22 and glide path 21, respectively.
Remotesensing 16 00924 g005
Figure 6. Detection results of typical summer convective rainfall conditions on 7 July 2022. (a1a3) The reflectivity of C-band radar at an elevation of 1.2°. (b1b3) PPI scanning results of CDWL at an elevation of 3°. (c1)–(c3) and (d1)–(d3) are the headwind and crosswind of glide path 04 and glide path 03, respectively.
Remotesensing 16 00924 g006
Figure 7. Vertical profile on 18 March 2022. (a) Carrier-to-noise ratio (CNR); (b) spectrum width; (c) horizontal speed and vector; (d) vertical wind speed; (e) log10(TKEDR).
Remotesensing 16 00924 g007
Figure 8. The wind rose diagram of (a) clear-air weather and (b) rainy weather.
Remotesensing 16 00924 g008
Table 1. Key parameters of CDWLs and C-band radar.
ParameterCDWL in This WorkCDWL in [29]C-Band Radar
Wavelength1.5 µm1.5 µm5.31~5.55 cm
Pulse duration800 ns800 ns1 μs/2 μs
Transmitter power1.5 W (mean)3 W (mean)250 kW (peak)
Pulse repetition rate5 kHz10 kHz300~1300 Hz
Time resolution1 min/PPI 1 min/PPI 6 min/VCP
Range resolution30~150 m with overlap30 m with overlap50~450 m
Maximum detection range30 km13 km450 km
Minimum detection range30 m30 m2 km
Telescope diameter200 mm 80 mm4.5 m (Antenna)
Beam full divergence46 μrad46 μrad
Table 2. Windshear event report from crew in 2022.
Time (UTC)RunwayHeight (m)Weather
5 February, 14:002215Rainy
6 February, 17:402191Rainy
10 February, 16:0921152Clear air
11 February, 14:5921137Clear air
12 February, 10:23not available7900Rainy
17 February, 13:0521not availableClear air
18 February, 10:402230Clear air
26 February, 11:18not available30Sleet
3 March, 11:222190Sleet
18 March, 17:38032133Rainy
27 April, 17:1221122Clear air
28 April, 16:2822122Clear air
13 June, 18:1321701Rainy
5 July, 12:37210Rainy
7 July, 17:0721487Rainy
28 July, 17:4403100Rainy
20 August, 16:5503183–244Rainy
24 August, 16:55unrecordedunrecordedRainy
Disclaimer/Publisher’s Note: The statements, opinions and data contained in all publications are solely those of the individual author(s) and contributor(s) and not of MDPI and/or the editor(s). MDPI and/or the editor(s) disclaim responsibility for any injury to people or property resulting from any ideas, methods, instructions or products referred to in the content.

