Abstract
Arctic shipping activities are increasing in the context of sea ice decline. However, research gaps persist in studying recent Arctic shipping activities across various vessel types and their connection with sea ice conditions. Utilizing Automatic Identification System (AIS) data and sea ice satellite observations between 2015 and 2020, these matters are delved into this study. A discernible overall growth trend in Arctic traffic occupancy occurs from 2015 to 2020 during summer and autumn. Excluding passenger ships, the traffic occupancy trend for each ship type closely parallels that for all ships. Variations in traffic occupancy along the Northeast Passage dominate that in the entire Arctic. As sea ice diminishes, both Arctic traffic occupancy and its variability noticeably increase. Further examination of the relationship between shipping activities and ice conditions reveals that increased traffic occupancy corresponds significantly to diminishing sea ice extent, and the constraint imposed by sea ice on Arctic traffic occupancy weakens, while the 6-year AIS data could lead to uncertainties. In summary, as the Arctic sea ice declines continuously, not only sea ice but also additional social, military, and environmental factors constraining marine activities should be considered in the future operation of Arctic shipping.
1. Introduction
Arctic shipping is assumed to play an increasingly crucial role in global maritime activities [1]. The Arctic waterway provides an efficient transportation route with 40% shorter sailing distances compared to conventional routes via the Suez Canal [2,3]. Given the Northern Sea Route acts as a primary conduit for the transportation of Arctic oil resources [4], amplified demands for Arctic marine transportation are propelled by the vast undiscovered Arctic resources, which comprise roughly 22% of the global undiscovered oil and gas reserves [5]. Moreover, in the context of global warming, the Arctic sea ice condition has continued to retreat [6,7,8]; consequently, opportunities for trans-Arctic shipping have emerged [9,10,11,12]. Therefore, an escalating number of scholars have embarked on related research [13].
These studies can be broadly classified into two main categories according to distinct research objectives. The first category typically explores Arctic navigational opportunities [14,15,16,17,18]. Utilizing natural and ship factors, the investigation of ships’ feasibility to navigate through the Arctic waters safely, referred to as the Arctic navigational opportunities [19], facilitates strategic planning of shorter and less risky routes tailored to different ships. Copland et al. [19], leveraging sea ice data from the Canadian Ice Service archives, observed a gradual enhancement in the potential navigational opportunities of all ships in the Canadian Arctic from 1972 to 2016. By applying sea ice simulations from the Coupled Model Intercomparison Project Phase 5 (CMIP5) in conjunction with the Arctic Transportation Accessibility Model (ATAM), Smith and Stephenson [20] reported a notable northward shift in optimal routes for both Open-Water (OW) ships and Polar Class 6 (PC6) ships under both high- and low-emission scenarios by midcentury. Given the improved performance of CMIP6 models in simulating Arctic sea ice volume and extent compared to CMIP5 [21,22,23], Min et al. [15] built upon sea ice projections from the CMIP6 and the ATAM model and anticipated a consistent expansion of the September navigable area for OW and PC6 ships through the 2050s and 2040s, respectively. Nevertheless, Arctic navigational opportunities based on natural factors may deviate from actual shipping activities.
Another commonly explored research category investigates Arctic shipping activities and their changes, with the help of Automatic Identification System (AIS) data that facilitates real-time tracking of ship movements. Gunnarsson [24] focused on shipping activities along the Northern Sea Route and uncovered a swift upsurge in shipping activities in 2016–2019. Exploring passenger ships in the Arctic, Chen et al. [25] identified concentrated activities near Svalbard and the Barents Sea in 2012–2017. While recent studies have scrutinized Arctic shipping in specific passages or focused on specific ship types, assessments involving multi-ship activities across the entire Arctic were conducted several years ago. For instance, Silber and Adams [26] observed an increase in the number of ships sailing in the entire Arctic in 2015–2017, coupled with a decrease in operational hours. Notably, the exploration of the current actual shipping activity towards the Arctic only spans up to 2017. Given the noteworthy changes in the Arctic Polar Code shipping activities, such as a 25% and 75% increase in ship numbers and sailing distances from 2013 to 2019 [27], there exists a gap in exploring recent actual shipping activities of various ship types across the entire Arctic, drawing upon the latest AIS data. Moreover, existing AIS-based investigations often overlook the crucial impacts of natural factors, such as the Arctic sea ice, on shipping activities.
In this study, we leverage the recent AIS data and satellite observations of sea ice concentration from 2015 to 2020 to address the above-mentioned research gaps.
2. Methods
2.1. Data
AIS enables the electronic exchange of navigation data between ships, with onboard transceivers, terrestrial, and/or satellite bases [28]. Mandatorily equipped for all ships with a gross tonnage >300 tons engaged in international voyages [29], AIS provides both static information (ship’s callsign, International Maritime Organization (IMO) number, Maritime Mobile Service Identity (MMSI) number, ship type, etc.) and dynamic information (time steps, speed over ground, course over ground, positions, etc.). AIS transmits signals at intervals ranging from every three seconds to a few minutes, furnishing detailed information regarding the ship’s speed and position. These high-precision data ensure accuracy in navigation and emission estimation. The satellite-derived sea ice concentration (SIC) data employed in this study were obtained from the National Snow and Ice Data Center (NSIDC) [30], featuring monthly resolution SIC data and generated using the NASA Team algorithm developed by the Cryospheric Sciences Laboratory at the NASA Goddard Space Flight Center (GSFC). SIC data are presented in the polar stereographic projection with a grid cell size of 25 25 km. This dataset offers a consistent time series depicting the fraction of the ocean area covered by sea ice, ranging from 0% to 100% [30].
2.2. Data Processing
To ensure accuracy and reliability, the preprocessing steps filter out unqualified ships and abnormal navigation by eliminating those with invalid MMSI numbers, incomplete time and location records, and fewer than five AIS records or three sailing hours in a month. After preprocessing, the data are interpolated onto polar stereographic grid cells with 0.25° of longitude and latitude. Following Eguíluz et al. [29] and according to the ship type provided by AIS, ships in this study were categorized as cargo ships, fishing boats, passenger ships, tankers, and other types of ships, encompassing any other ships not included in the aforementioned categories. Following March et al. [31], traffic occupancy is adopted as a metric to explore Arctic shipping activities. In this context, traffic occupancy is defined as the cumulative area traversed by each ship type, representing the total area covered by that particular type of ship. The annual growth rate for a specific year is determined by subtracting the value of the previous year from the value of this specific year and then dividing the resulting difference by the value of this specific year. Sea ice extent (SIE) in this study is defined as the cumulative area of all grid cells with SIC values exceeding 15%.
2.3. Study Area
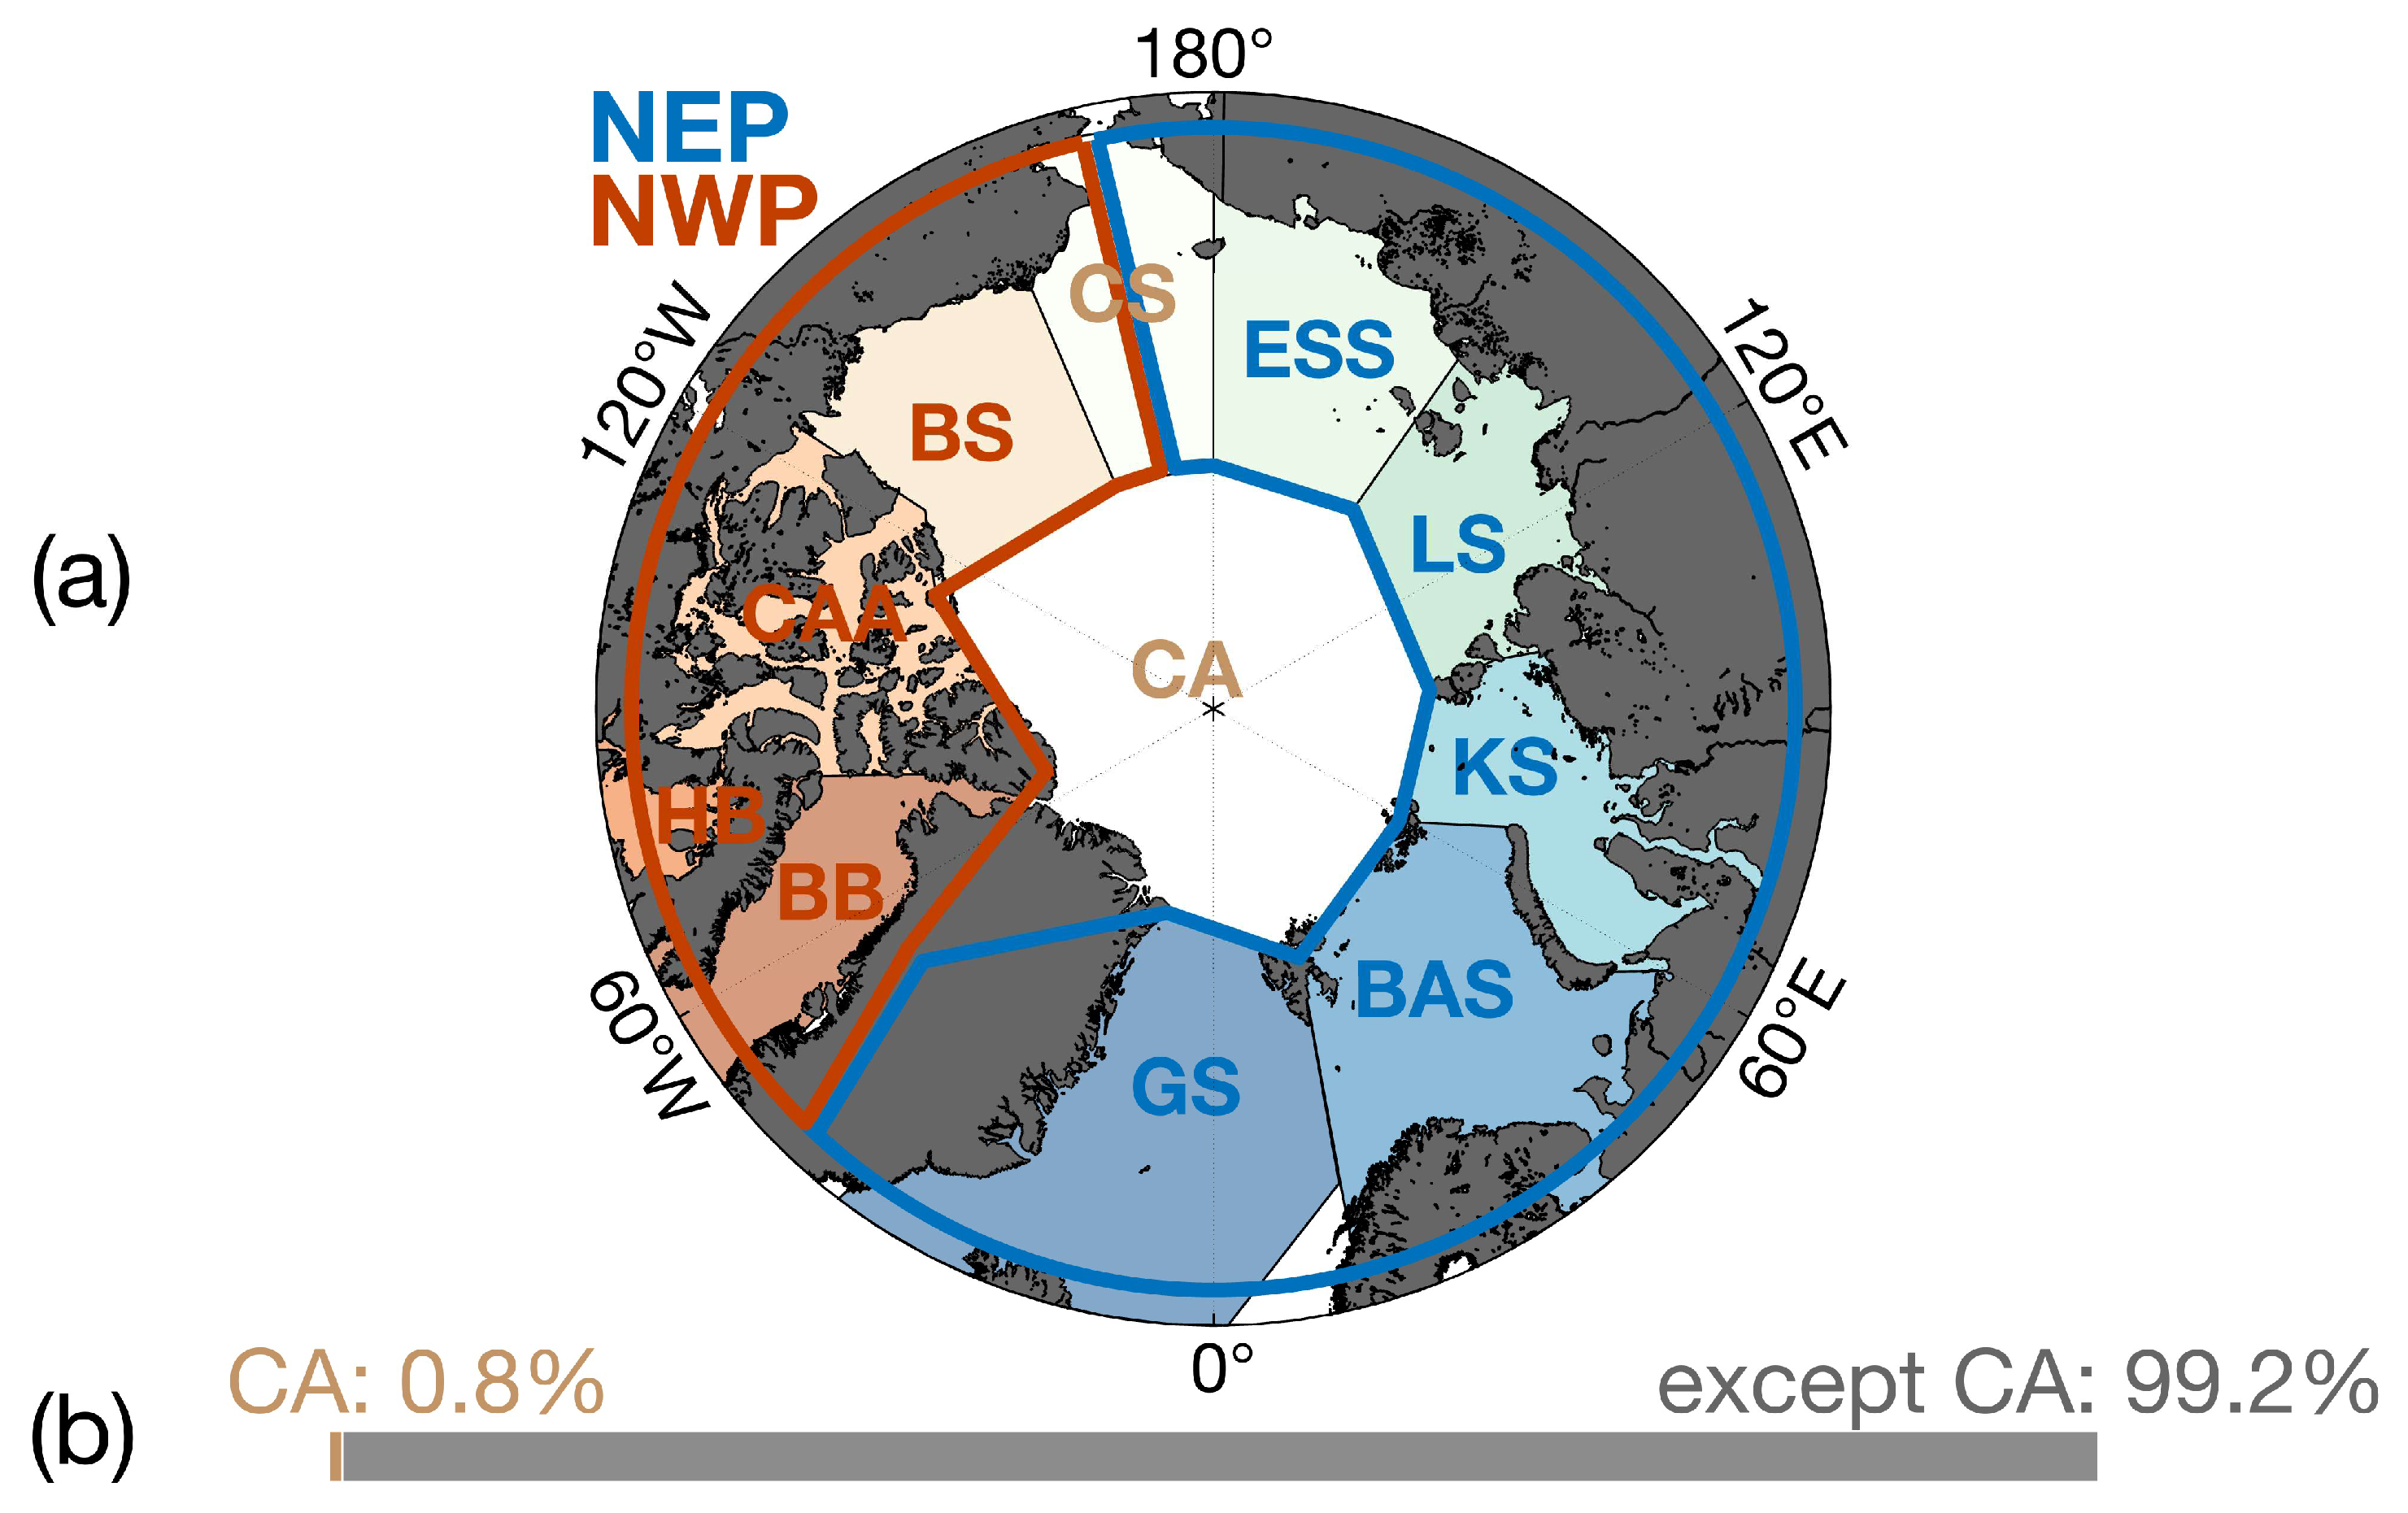
This study aims to investigate shipping activities north of the Arctic Circle (66.4°N) between 2015 and 2020. The region within the Arctic Circle is partitioned into 11 bodies of water (Figure 1) based on the NSIDC Marine Regions division [32]. The Central Arctic, characterized by notably low ship traffic occupancy averaging 0.8% of the overall traffic and peaking at 1.65% in August 2018, is excluded from consideration when ship traffic occupancy is estimated. The area north of 66.4°N, excluding the Central Arctic, is then partitioned into two passages: the Northeast Passage (NEP) and the Northwest Passage (NWP), with spatial extents shown in Figure 1. The NEP passes across the Greenland Sea, Barents Sea, Kara Sea, Laptev Sea, East Siberian Sea, and the eastern part of Chukchi Sea. The NWP traverses the Baffin Bay, Hudson Bay, Canadian Arctic Archipelago, Beaufort Sea, and the western part of Chukchi Sea.
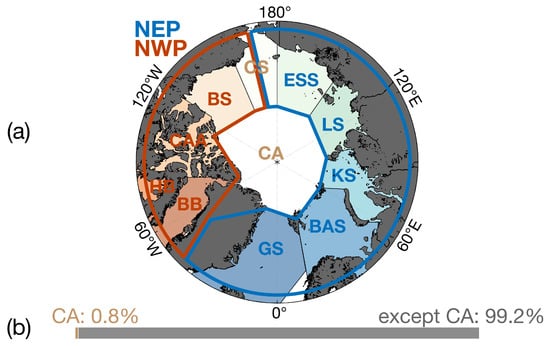
Figure 1.
(a) The spatial range of two Arctic shipping passages and corresponding marine regions. The polygons surrounded by red and blue solid lines are defined as the Northeast Passage (NEP) and Northwest Passage (NWP), respectively. Marine regions inside the Arctic Circle (66.4°N) include the Central Arctic (CA), Baffin Bay (BB), Barents Sea (BAS), Beaufort Sea (BS), Chukchi Sea (CS), East Siberian Sea (ESS), Greenland Sea (GS), Laptev Sea (LS), Kara Sea (KS), Hudson Bay (HB), and Canadian Arctic Archipelago (CAA). (b) The proportion of traffic occupancy for the Central Arctic and the rest of the Arctic.
3. Results
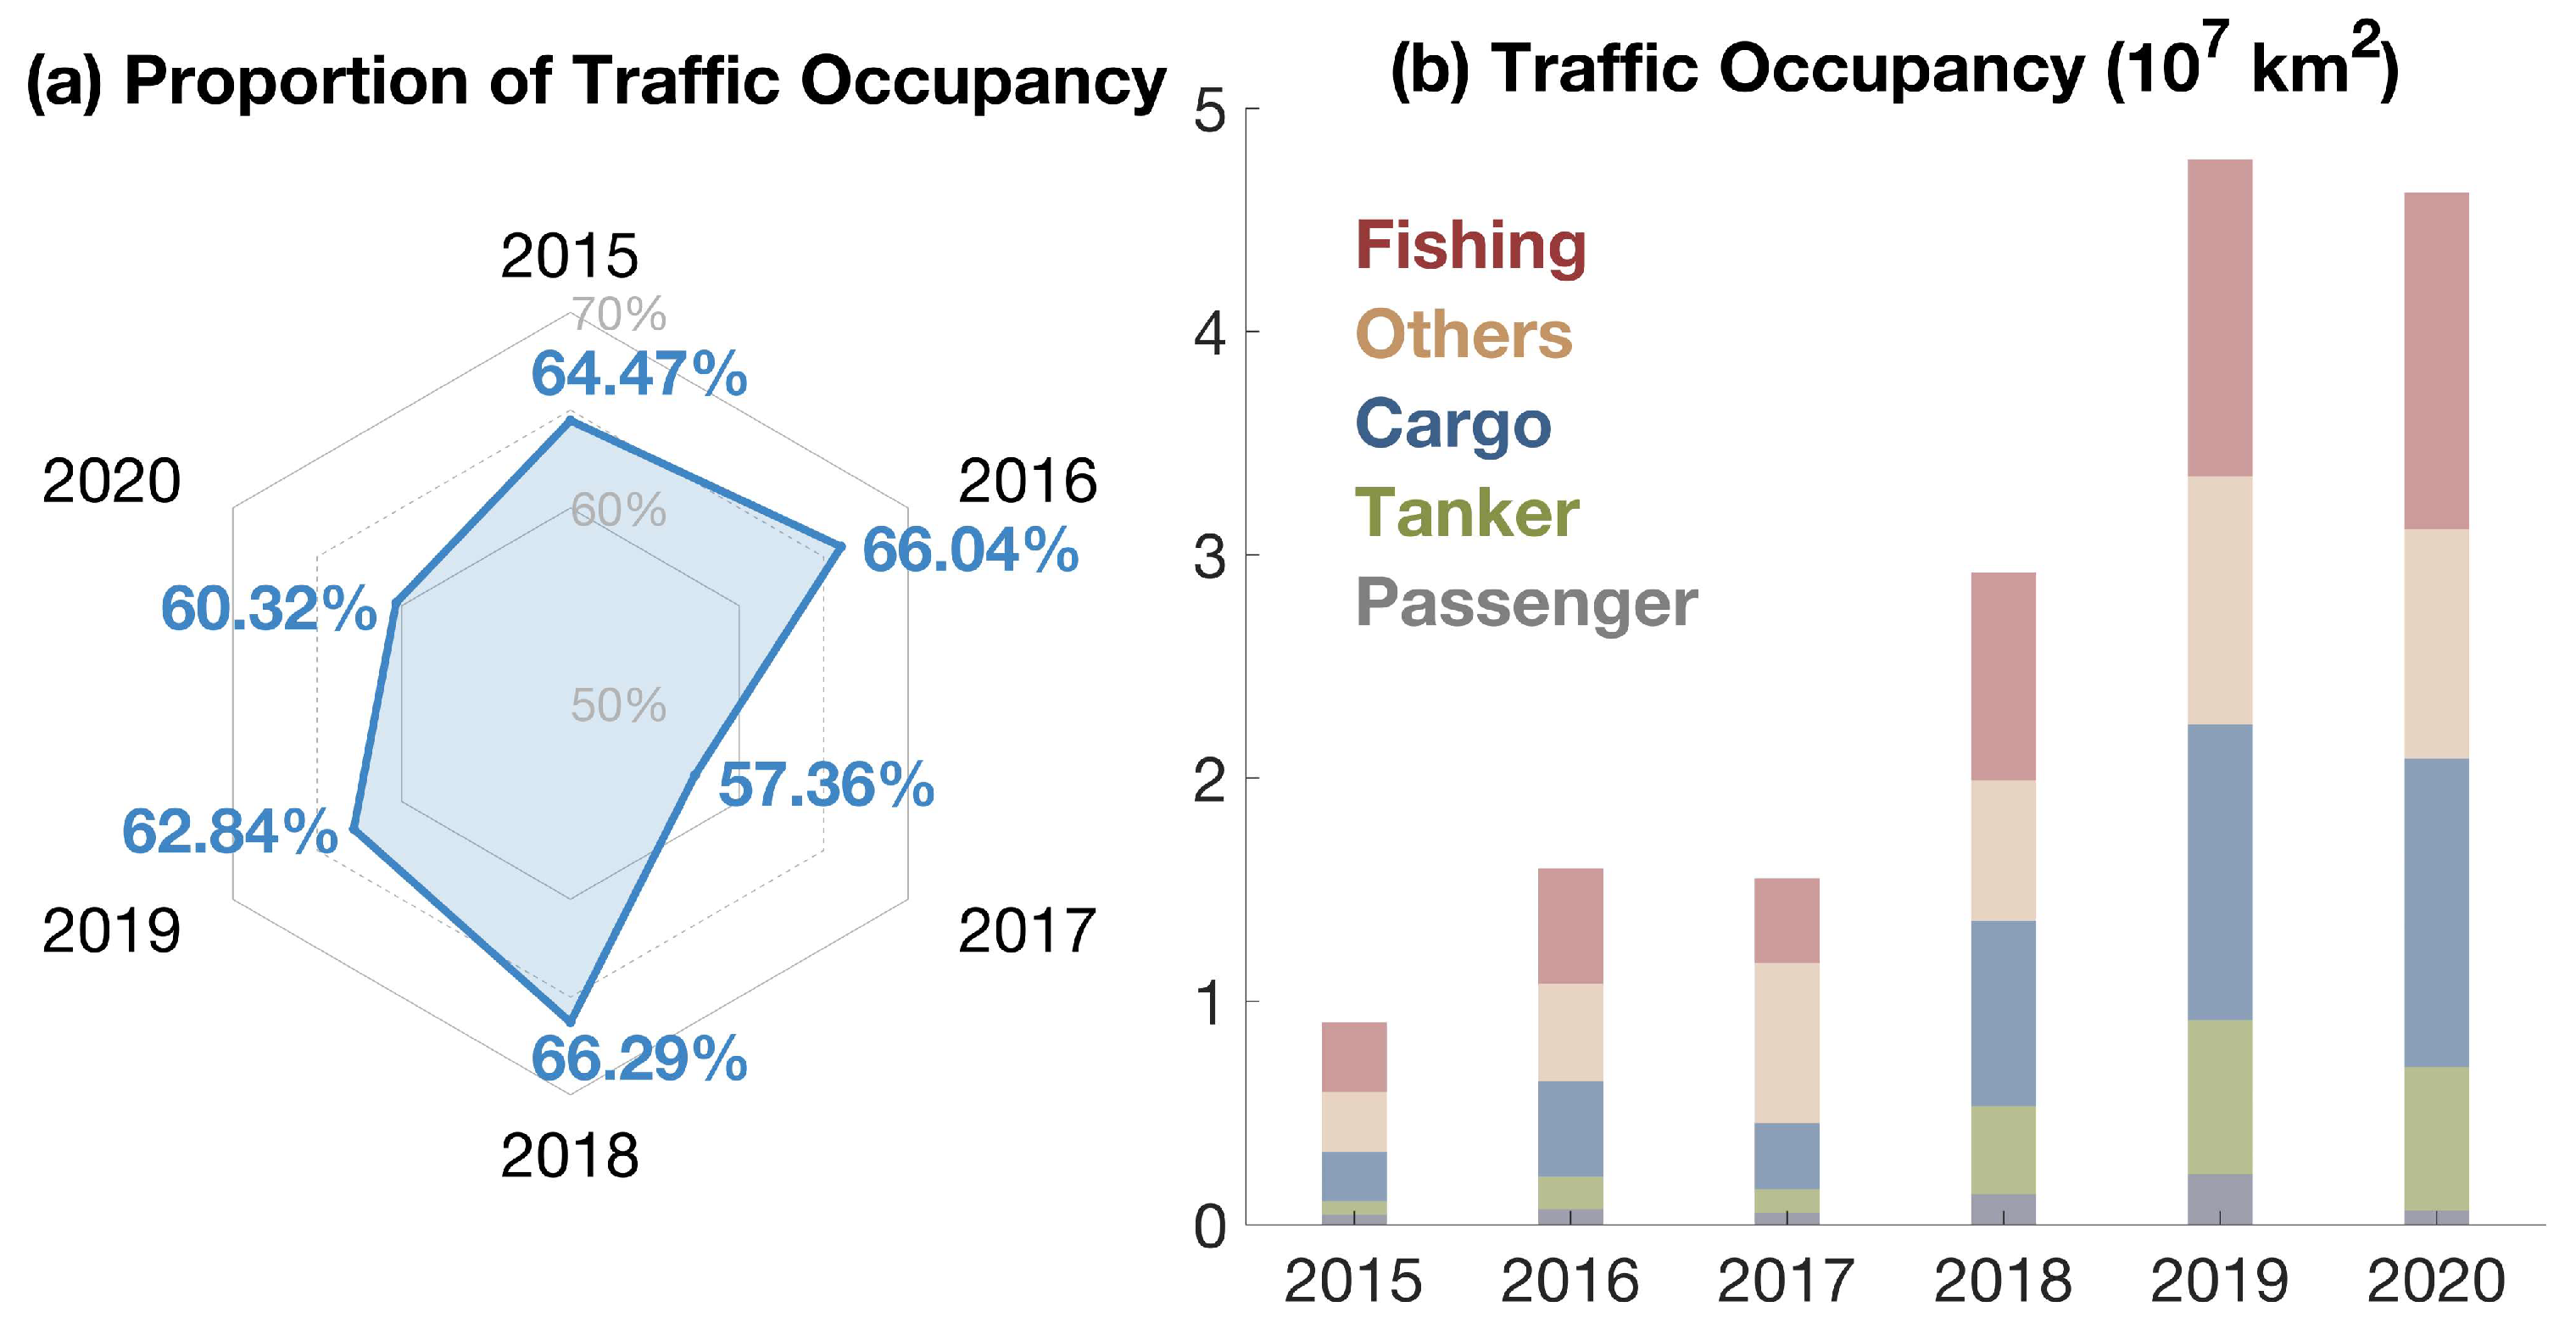
Figure 2a illustrates the proportion of traffic occupancy in summer (June–August) and autumn (September–November) relative to the entire year in 2015–2020. Over six years, the average traffic occupancy in these seasons remained relatively stable, consistently exceeding 57.36% and constituting an average of 62.89% of the annual total. This underscores that summer and autumn are the primary timeframes for Arctic shipping, and as a result, shipping activities in these two seasons are the main focus of this study. Figure 2b illustrates the Arctic traffic occupancy of various types of ships in summer and autumn from 2015 to 2020. Over the six years, the average annual growth rate of traffic occupancy was 44.37%. In general, the traffic occupancy of all ships exhibited fluctuating growth, with both the amplitude and frequency of increases (averaging a growth rate of 75.91% over the three years in 2016, 2018, and 2019) surpassing those of decreases (averaging a growth rate of −2.94% over the two years in 2017 and 2020). Fishing boats comprise the largest average proportion at approximately 30.90% within the overall traffic occupancy, possibly owing to productive fisheries in the Arctic [33]. Other types of ships, cargo ships, tankers, and passenger ships, follow with average proportions of approximately 28.39%, 26.02%, 10.73%, and 3.95%, respectively. Differences in average proportions among various ship types within the overall traffic occupancy may be attributed to variations in their purposes and functionalities [34]. From 2015 to 2020, cargo ships, tankers, passenger ships, fishing boats, and other types all exhibit an overall increasing trend in traffic occupancy, with average traffic occupancy growth rates of 61.51%, 92.38%, 35.11%, 48.66%, and 36.56%, respectively. Throughout this period, except for passenger ships, annual traffic occupancy trends for each ship type show a strong correlation with that for all ships. This has been validated by all correlation coefficients being greater than 0.92 and the correlations passing the 99% significance test. This implies that the trend in traffic occupancy for each ship type excluding passenger ships closely aligns with that for all ships.
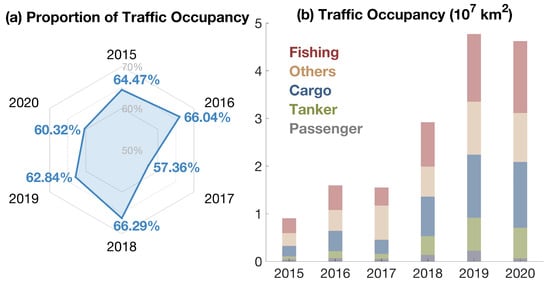
Figure 2.
(a) Proportion of Arctic traffic occupancy in summer and autumn relative to the whole year in 2015–2020. (b) Average Arctic traffic occupancy in summer and autumn by ship types from 2015 to 2020.
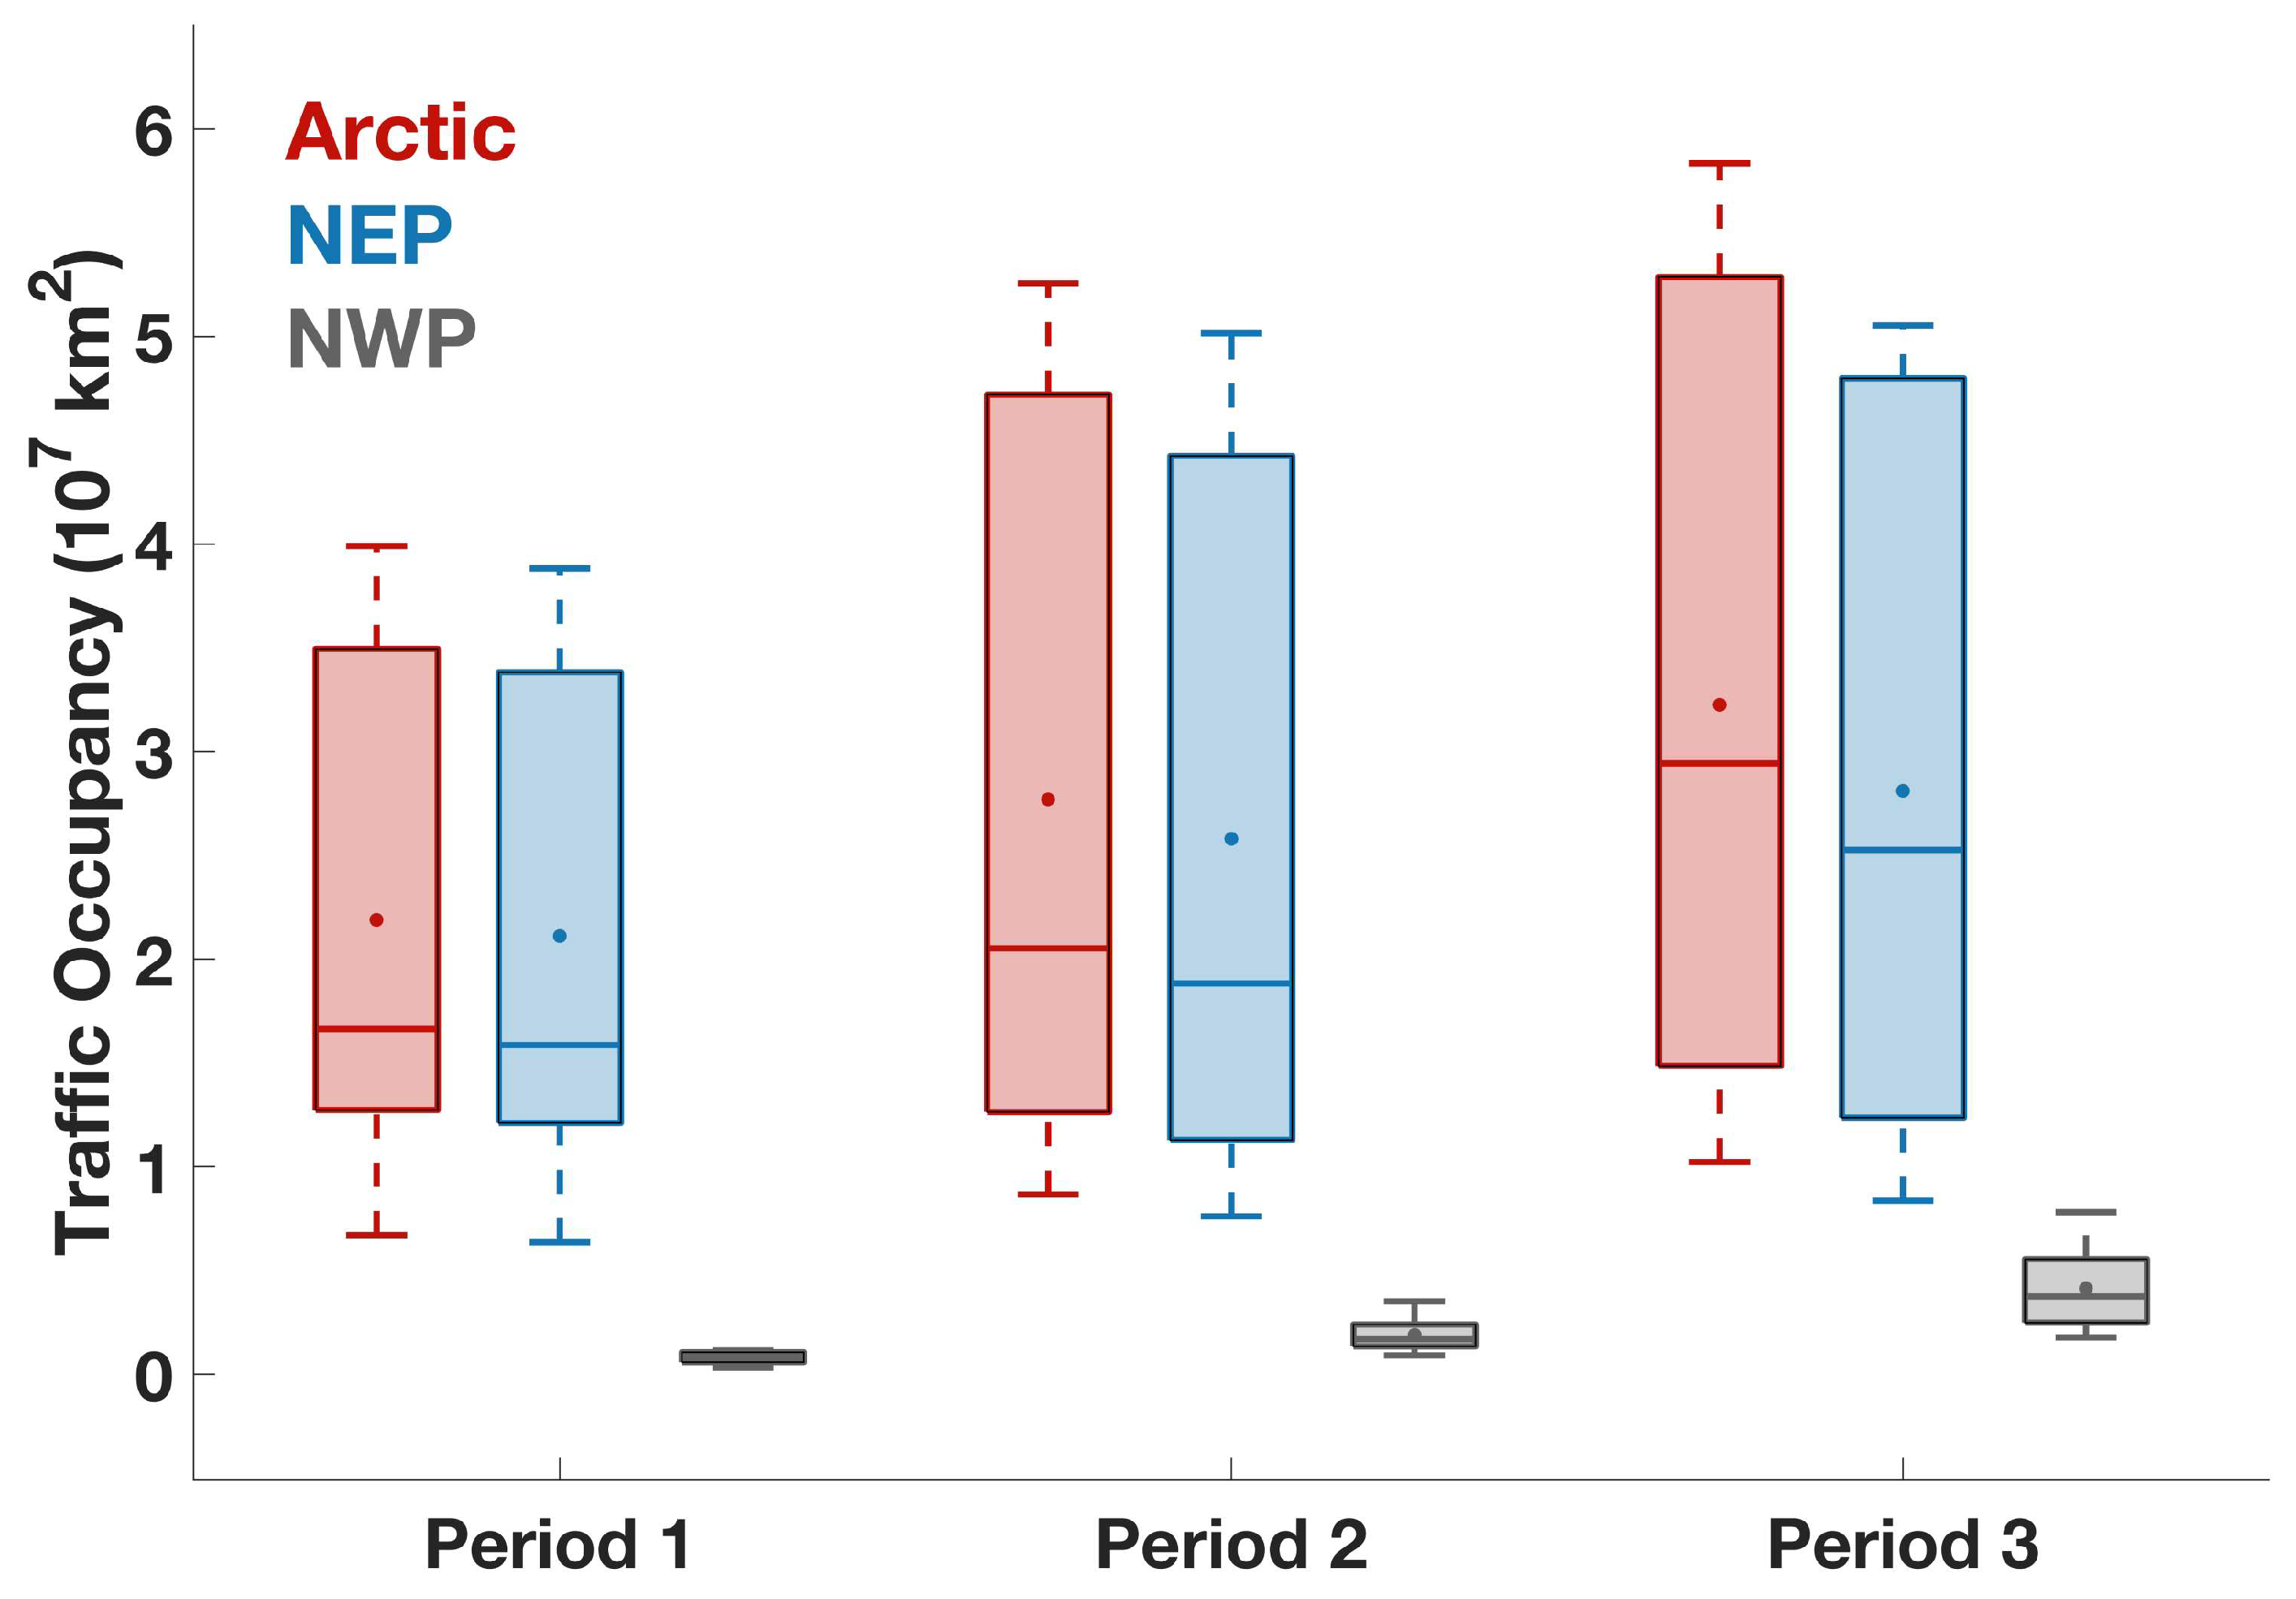
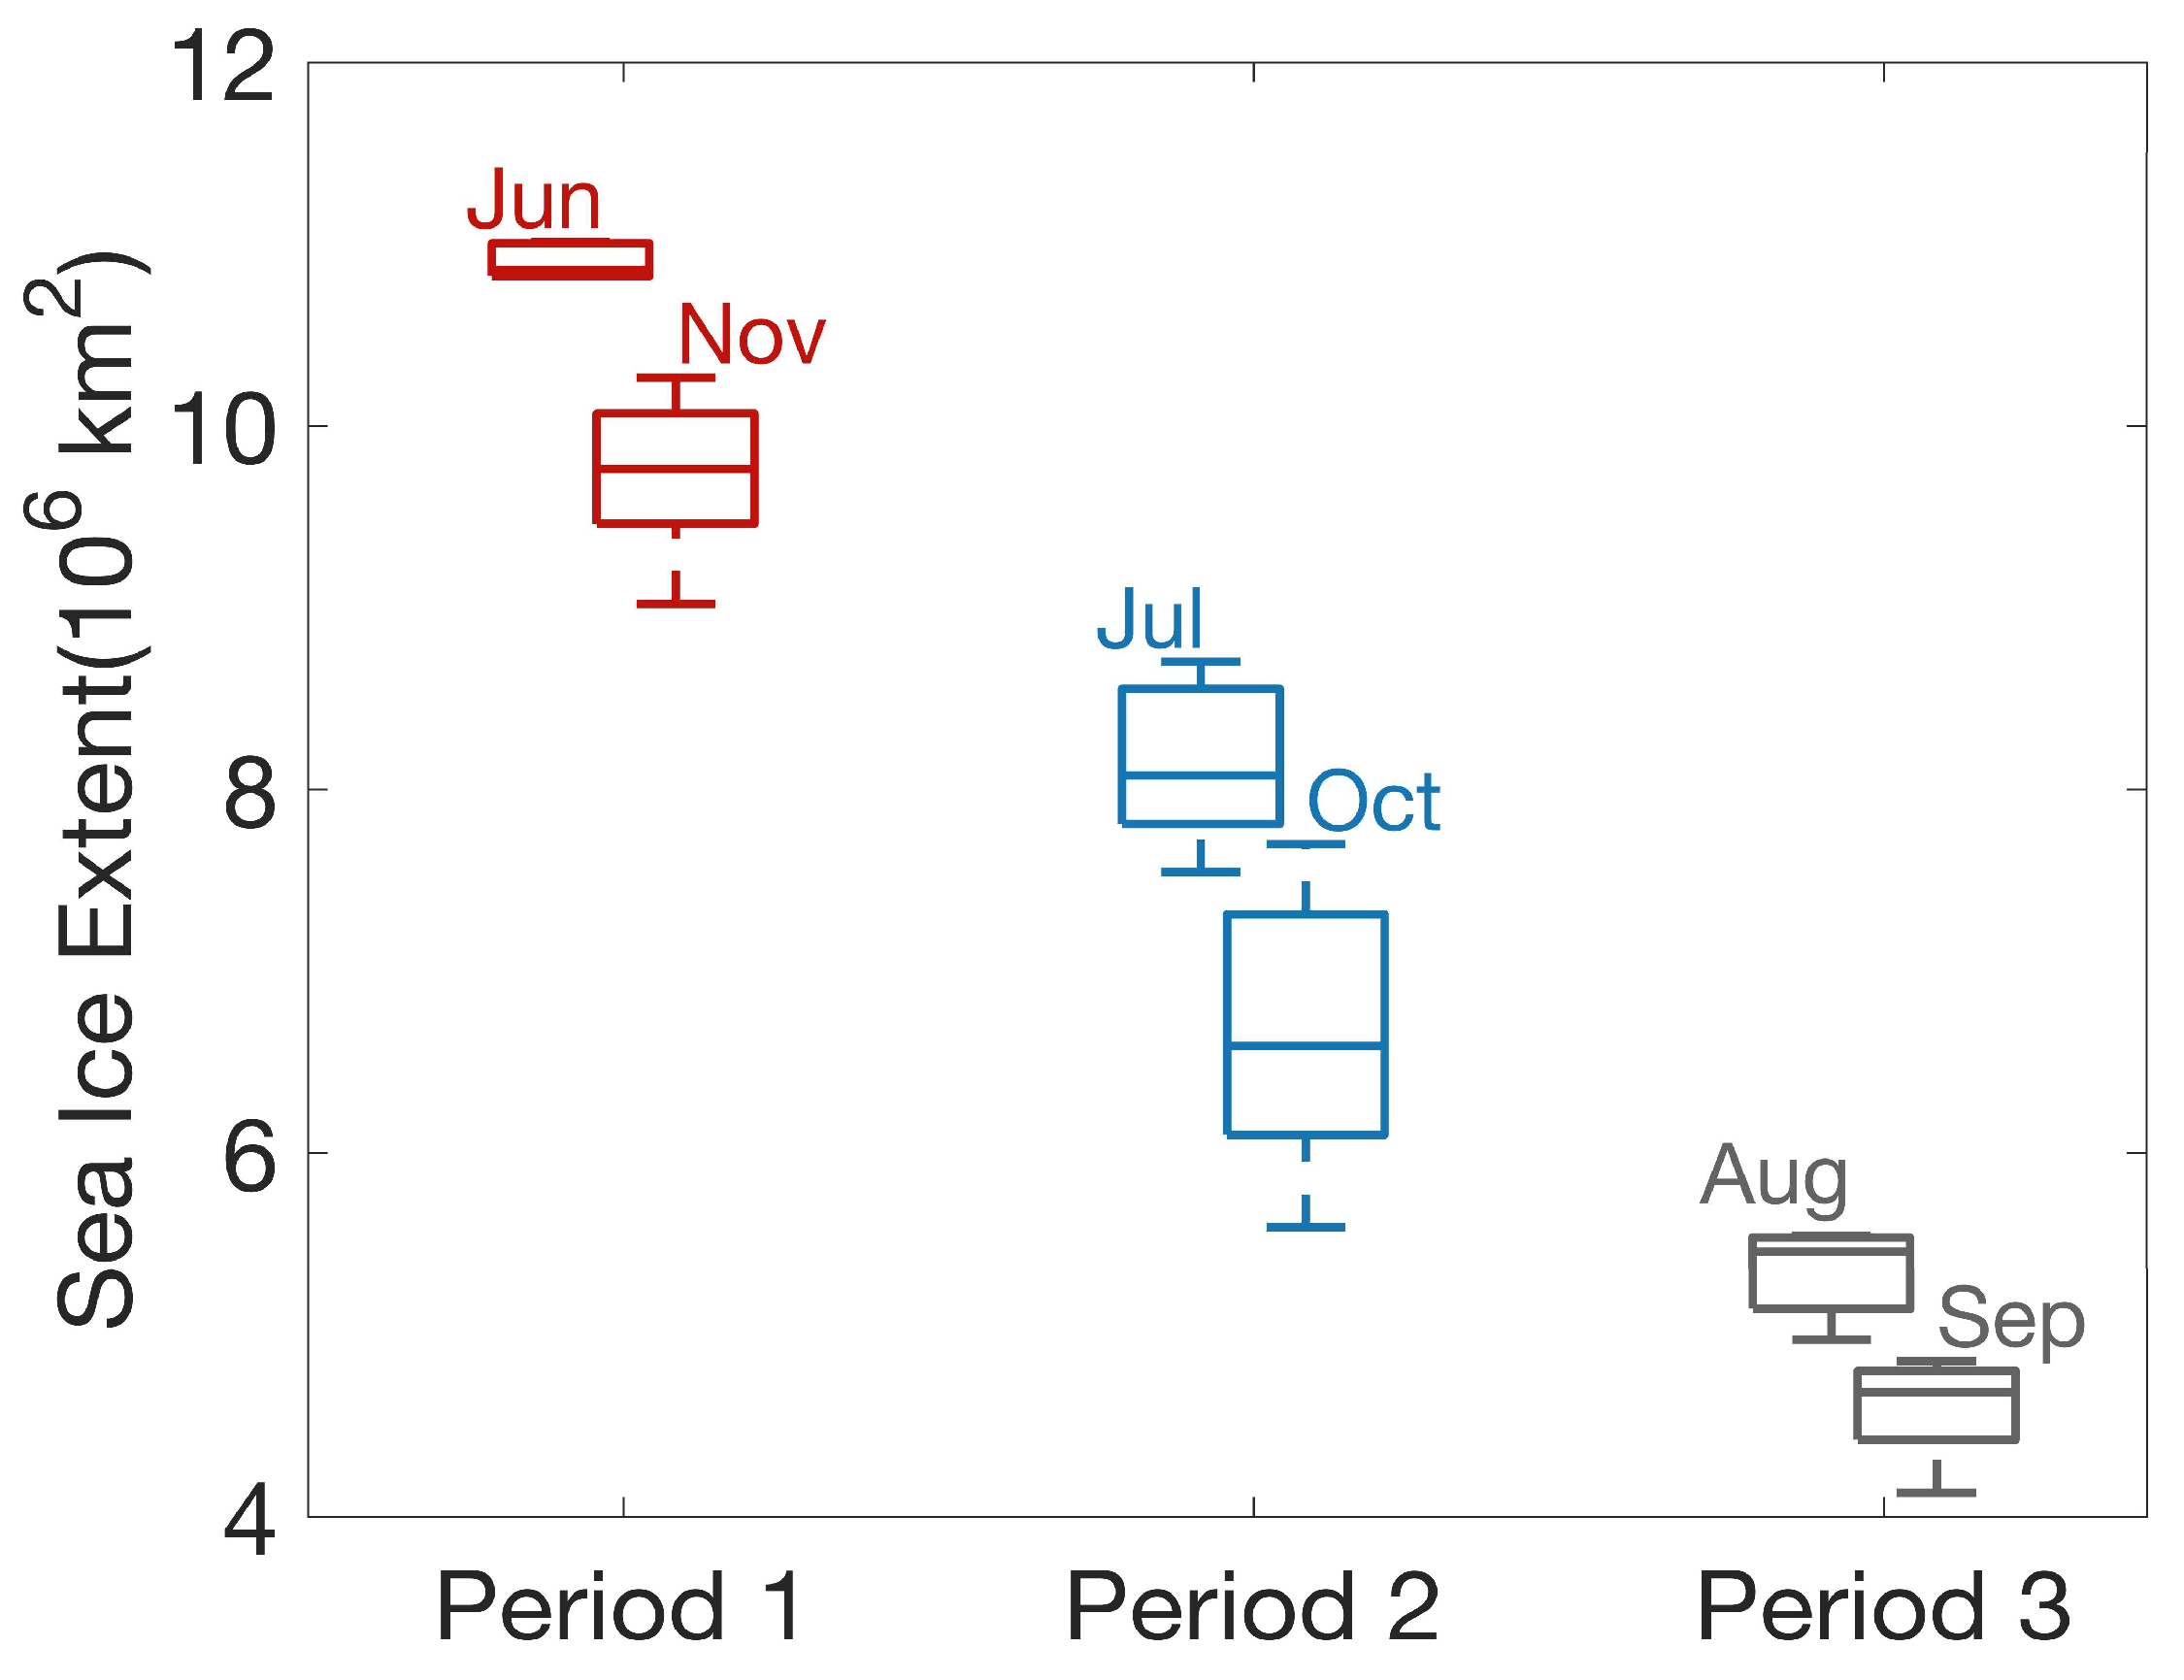
Given Arctic environmental factors, particularly sea ice conditions, could affect Arctic shipping [20] and the significant variations in sea ice conditions occurring between seasons [35,36], it can be speculated that shipping activities exhibit notable variations in different seasons. Figure 3 illustrates traffic occupancy and its variations among the Arctic and different passages in three periods, which are grouped based on similarities in the Arctic sea ice conditions in specific months (Figure A1). Summer and autumn seasons are grouped into three periods (hereinafter): Period 1 (June and November), Period 2 (July and October), and Period 3 (August and September).
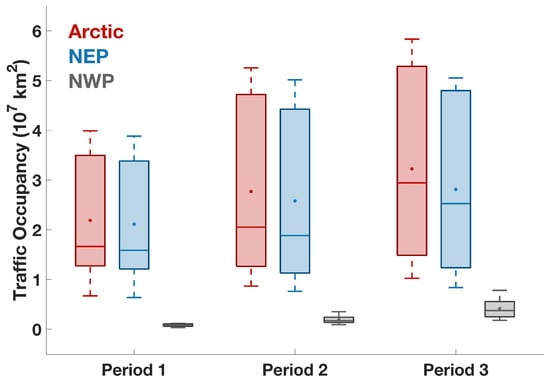
Figure 3.
Sailing conditions in the Arctic and different passages in Periods 1 (June and November), 2 (July and October), and 3 (August and September). The central markers of each box denote their median and the scatters indicate their average, with the bottom and top edges indicating the 25th and 75th percentiles. The box length indicates the interquartile range.
Throughout all three periods, the median of the overall Arctic traffic occupancy consistently lies lower than the average condition, signifying that the majority of ships in the Arctic sailed with relatively limited traffic occupancy. From Periods 1 to 3, the median of the entire Arctic traffic occupancy gradually rises (from 1.66 × 10⁷ to 2.94 × 10⁷ km2) and so does the box length (from 2.22 × 10⁷ to 3.80 × 10⁷ km2). This implies that, with a decrease in sea ice conditions, ships are progressively broadening their traffic occupancy throughout the Arctic, accompanied by a growing level of variability. From Periods 1 to 3, the median progressively shifts towards the center of the box, which is also reflected by a decreasing skewness. This indicates that, with the reduction in sea ice, the traffic occupancy of the majority of ships is approaching its average condition. Whether it is the median, box length, or skewness, ship traffic occupancy performance on NEP resembles that in the entire Arctic. This emphasizes that the performance and variations of ship traffic occupancy on the NEP determine that in the entire Arctic.
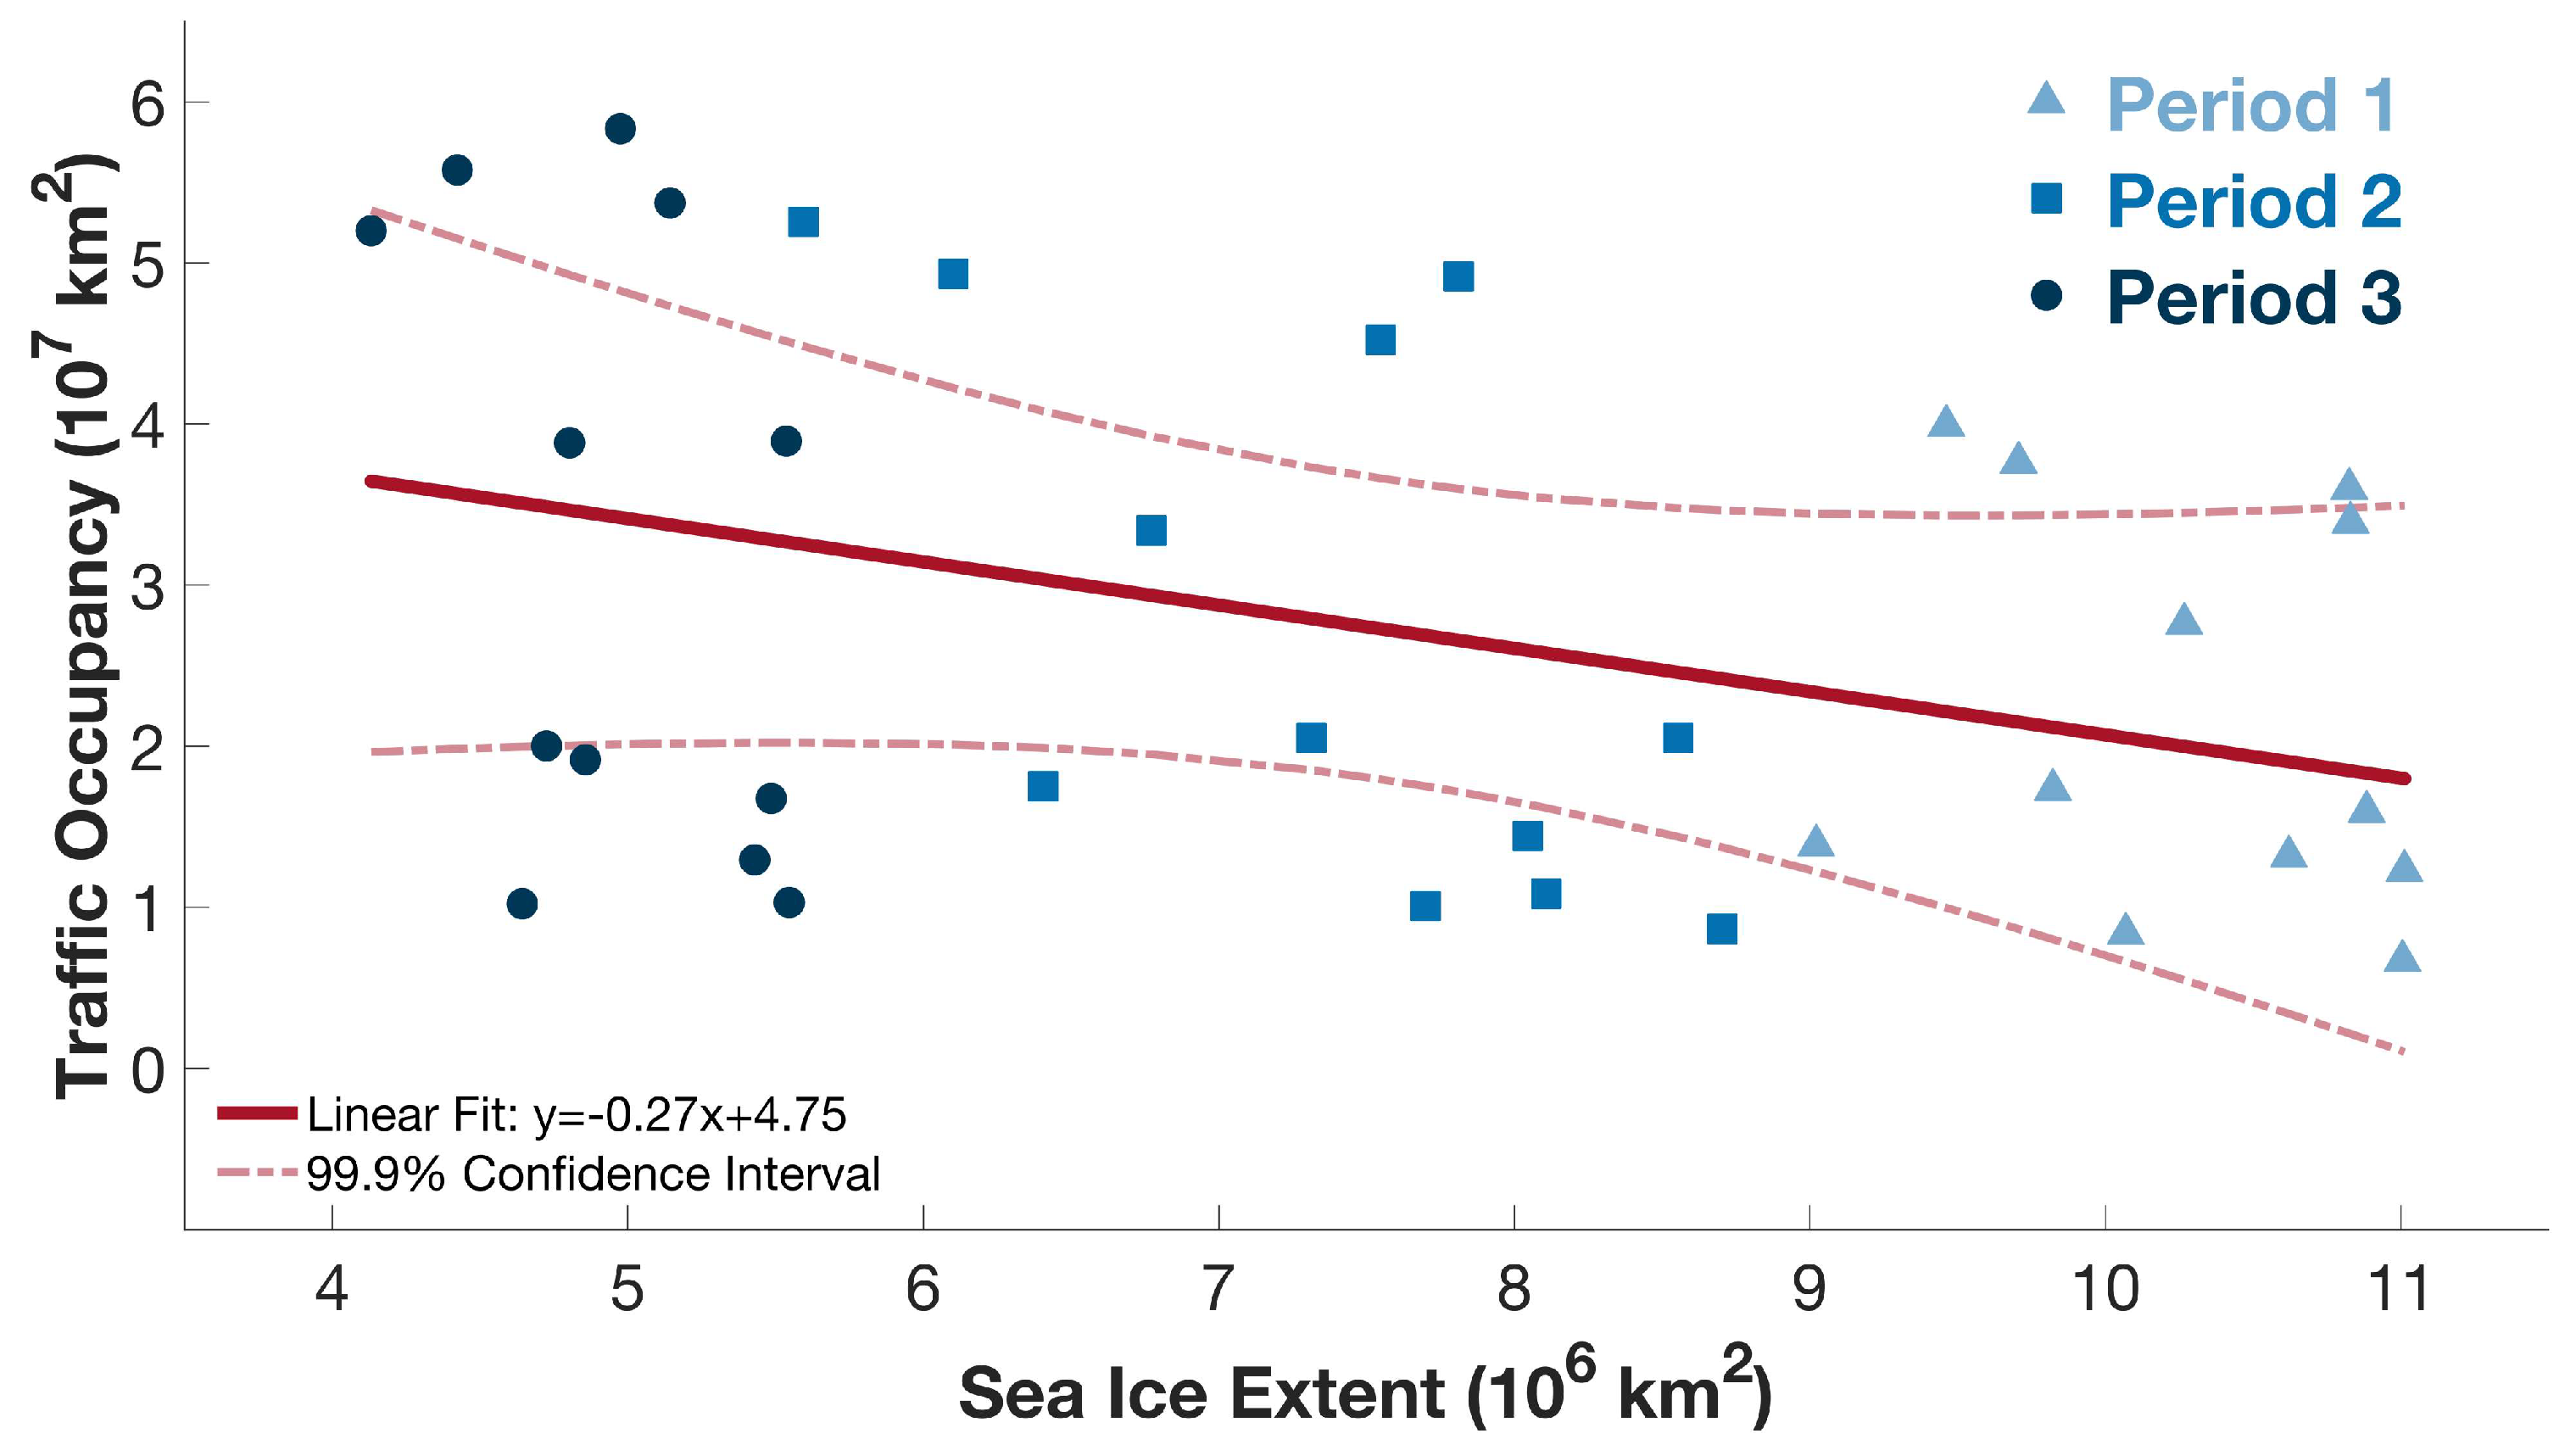
To further investigate the relationship between the Arctic sea ice conditions and shipping activities, the relationship between SIE and traffic occupancy in 2015–2020 is illustrated in Figure 4. A reduction in SIE correlates with a gradual increase in traffic occupancy with a correlation coefficient of −0.38. Specifically, a decrease of 106 km2 in SIE corresponds to a significant traffic occupancy increase of 0.27 × 10⁷ km2 throughout the entire period, validated at the 95% confidence level. As SIE decreases, the dispersion of scatter plots increases, as evidenced by the variability (standard deviations) of scatters for traffic occupancy, which are 1.22 × 10⁷ km2, 1.71 × 10⁷ km2, and 1.92 × 10⁷ km2 from Period 1 to Period 3, respectively. While most scatters fall within the 99.9% confidence interval of the linear regression model for SIE and traffic occupancy when SIE is relatively large, the majority fall outside the 99.9% confidence interval as SIE decreases. This suggests a gradual weakening of the SIE constraint on traffic occupancy. It should be noted that despite the notable variability in Arctic traffic occupancy across different periods (Figure 3 and Figure 4), a consistent negative correlation between SIE and traffic occupancy was observed throughout these three periods, similar to that of the entire period.
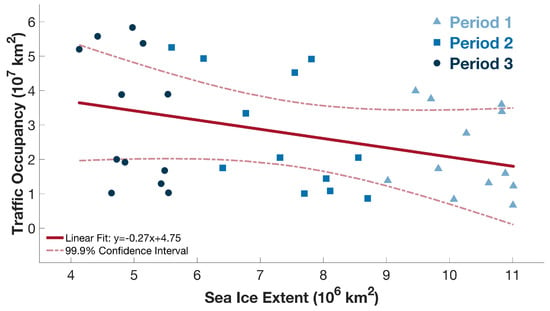
Figure 4.
The relationship between SIE and traffic occupancy from 2015 to 2020 during Periods 1, 2, and 3, which span summer and autumn. From right to left, Period 1 (June and November), Period 2 (July and October), and Period 3 (August and September) are represented by triangles, squares, and circles, respectively.
4. Discussion
The substantial decline in the Arctic sea ice observed over the past decades [6,7,8,37] is anticipated to persist [38], creating increasingly favorable conditions for Arctic maritime navigation [11,15]. As Arctic SIE diminishes, the constraining effect of sea ice on traffic occupancy gradually decreases (Figure 4), suggesting that other factors may assume increasingly important roles in constraining Arctic shipping activities. With approximately 20–30% of Arctic routes experiencing frequent sea fog, the travel time increases 23–27% and 4–11% along the NWP and Northern Sea Route. Furthermore, the safety of navigation encounters heightened challenges near ice margins, with an expected escalation of sea fog under the backdrop of global warming [18]. During Arctic winters, intensified winds and waves, combined with subzero temperatures, can increase the risk of ship superstructures icing, potentially resulting in numerous accidents and shipwrecks [39]. This presents significant challenges for offshore exploration, maritime insurance sectors [12], vessels, and coastal shipping infrastructures [40]. Moreover, alterations in the Arctic Ocean’s surface and subsurface currents will influence maritime operation planning [12]. Storms in the Arctic have become stronger and more intense [41], potentially posing threats to Arctic shipping.
Beyond geographical and environmental factors, societal considerations may also exert constraints on Arctic transits. For instance, policies enacted by certain nations amid the COVID-19 outbreak, restricting or outright prohibiting passenger ships from entering their territorial waters [42,43], might lead to noticeable reductions in the traffic occupancy of passenger ships in 2020 compared to other types of vessels (Figure 2). Additional societal factors, such as the global mandate by IMO member countries to utilize low-sulfur fuels for mitigating sulfur emissions in shipping, thereby substantially elevating fuel expenses, may also contribute to a downturn in maritime activities [44]. The Arctic region, subject to various geopolitical interpretations, is undergoing modernization and expansion of military installations and forces [45]. Military presence in the Arctic is poised to influence Arctic shipping and the development of shipping passages [46,47]. In summary, amidst diminishing sea ice conditions, it is imperative to consider not only the impact of ice conditions but also the constraining influence of geographical, societal, and military factors on Arctic shipping, enhancing overall Arctic navigation safeguards.
Current and projected increases in Arctic shipping activities harbor the potential to exert broad-ranging impacts on water bodies, air emissions, and animal survival [48], thereby posing environmental, climate, and ecological risks to both the Arctic and the global sphere [49]. These activities contribute to the accumulation of microplastics from ship anti-fouling coatings in Arctic waters [50] and heighten the risk of oil spills [51], posing longstanding threats to the Arctic marine environment. The climate implications of Arctic shipping emissions are intricate, contingent upon emission timing and location [52]. For example, shipping along the Northern Sea Route is anticipated to exacerbate Arctic and global warming, with nitrogen oxides and black carbon emissions exerting notable impacts on global and Arctic climates, respectively [53]. Hence, when utilizing Arctic shipping routes, it is essential to prioritize the protection of the ecological environment.
5. Conclusions
Melting Arctic sea ice has unlocked trans-Arctic shipping routes. Simultaneously, the value of Arctic shipping has been greatly enhanced by the higher traffic efficiency compared to traditional routes. While exploring Arctic navigation capabilities helps formulate efficient and low-risk routes, inferred potential navigational capabilities may not precisely represent actual shipping activities. In addition, while some studies have utilized real-time navigation data to track and analyze actual changes in Arctic shipping activity, there remains a lack of analysis for various ship types across the entire Arctic Ocean in recent years. Furthermore, insufficient attention has been given to potential impacts from natural factors. Leveraging AIS data and satellite-derived SIC observations, this study investigates actual shipping activities within the Arctic Circle from 2015 to 2020 and their relationship with sea ice conditions.
In analyzing actual Arctic shipping activities, it is observed that ships exhibit a relatively small traffic occupancy in the Central Arctic, with summer and autumn being the primary periods. Therefore, this study specifically focuses on Arctic shipping activities during these two seasons and within 66.4°N, excluding the Central Arctic. The findings indicate that the Arctic traffic occupancy of all ships exhibited fluctuating growth, characterized by higher rates and frequencies of increase compared to those of decrease, leading to an average growth rate of 44.26% over the six-year period. While different ship types contributed varied proportions to the overall traffic occupancy, their annual evolution closely aligned with the overall pattern. In summer and autumn, the traffic occupancy mainly concentrates on NEP and exerts a dominating influence on the overall Arctic traffic occupancy changes. As the Arctic sea ice retreats, both the traffic occupancy and its variability undergo noticeable changes. The intricate relationship between traffic occupancy and sea ice conditions is further explored in this study. With decreasing SIE, there is a gradual increase in traffic occupancy, showing a statistically significant correlation in summer and autumn, where a reduction of 106 km2 in SIE corresponds to a 0.27 × 10⁷ km2 increase in traffic occupancy at a 95% confidence level. As the Arctic SIE decreases, the constraint imposed by ice conditions on ships’ traffic occupancy weakens.
We note that the limited timeframe of AIS data may introduce uncertainties in the statistics. Nevertheless, there is a clear negative relationship between SIE and traffic occupancy in the Arctic. As AIS data continue to evolve, we anticipate obtaining more reliable and robust results.
Author Contributions
Conceptualization, H.L., C.M. and Q.Y.; methodology, Y.L., H.L. and C.M.; validation, H.L., C.M. and Q.Y.; formal analysis, Y.L.; investigation, Y.L.; resources, Q.Y.; data curation, Q.Y.; writing—original draft preparation, Y.L.; writing—review and editing, H.L., C.M., Q.C. and Q.Y.; visualization, Y.L.; supervision, Q.Y.; project administration, Q.Y.; funding acquisition, Q.Y. All authors have read and agreed to the published version of the manuscript.
Funding
This study was funded by the Southern Marine Science and Engineering Guangdong Laboratory (Zhuhai) (Nos. SML2023SP207, SML2022SP401, and SML2023SP217), the Program of Marine Economy Development Special Fund under the Department of Natural Resources of Guangdong Province (No. GDNRC [2022]18), and the Ocean Negative Carbon Emissions (ONCE) Program.
Data Availability Statement
The sea ice concentration product (10.5067/MPYG15WAA4WX) and marine regions (https://nsidc.org/data/user-resources/help-center/does-nsidc-have-tools-extract-and-geolocate-polar-stereographic-data#anchor-7, accessed on 28 December 2023) are accessible from the National Snow and Ice Data Center. The AIS data are available upon request to the authors.
Acknowledgments
Thanks are given to Yijun Yang of the School of Atmospheric Sciences, Sun Yat-sen University for constructive communication to improve this study. We also thank the National Snow and Ice Data Center (NSIDC) for providing satellite observations of sea ice concentration.
Conflicts of Interest
The authors declare no conflicts of interest.
Appendix A

Figure A1.
Arctic sea ice conditions during summer and autumn. Red, blue, and gray colors represent Period 1 (June and November), 2 (July and October), and 3 (August and September), respectively, and correspond to the average Arctic SIE for these months from 2015 to 2020.
Figure A1.
Arctic sea ice conditions during summer and autumn. Red, blue, and gray colors represent Period 1 (June and November), 2 (July and October), and 3 (August and September), respectively, and correspond to the average Arctic SIE for these months from 2015 to 2020.
References
- Bekkers, E.; Francois, J.F.; Rojas-Romagosa, H. Melting ice caps and the economic impact of opening the Northern Sea Route. Econ. J. 2018, 128, 1095–1127. [Google Scholar] [CrossRef]
- Schøyen, H.; Bråthen, S. The Northern Sea Route versus the Suez Canal: Cases from bulk shipping. J. Transp. Geogr. 2011, 19, 977–983. [Google Scholar] [CrossRef]
- Furuichi, M.; Otsuka, N. Proposing a common platform of shipping cost analysis of the Northern Sea Route and the Suez Canal Route. Marit. Econ. Logist. 2015, 17, 9–31. [Google Scholar] [CrossRef]
- Agarcov, S.; Kozmenko, S.; Teslya, A. Organizing an oil transportation system in the Arctic. IOP Conf. Ser. Earth Environ. Sci. 2020, 434, 012011. [Google Scholar] [CrossRef]
- Henderson, J.; Loe, J.S.P. The Prospects and Challenges for Arctic Oil Development. 2016. Available online: https://fni.brage.unit.no/fni-xmlui/bitstream/handle/11250/2485922/2016-JH-JPL-OGEL-The+Prospects+and+Challenges+for+Arctic+Oil+Development.pdf (accessed on 25 February 2023).
- Kwok, R. Arctic sea ice thickness, volume, and multiyear ice coverage: Losses and coupled variability (1958–2018). Environ. Res. Lett. 2018, 13, 105005. [Google Scholar] [CrossRef]
- Cai, Q.; Wang, J.; Beletsky, D.; Overland, J.; Ikeda, M.; Wan, L. Accelerated decline of summer Arctic sea ice during 1850–2017 and the amplified Arctic warming during the recent decades. Environ. Res. Lett. 2021, 16, 034015. [Google Scholar] [CrossRef]
- Yadav, J.; Kumar, A.; Mohan, R. Dramatic decline of Arctic sea ice linked to global warming. Nat. Hazard. 2020, 103, 2617–2621. [Google Scholar] [CrossRef]
- Min, C.; Zhou, X.; Luo, H.; Yang, Y.; Wang, Y.; Zhang, J.; Yang, Q. Toward quantifying the increasing accessibility of the Arctic Northeast Passage in the past four decades. Adv. Atmos. Sci. 2023, 40, 2378–2390. [Google Scholar] [CrossRef]
- Zhou, X.; Min, C.; Yang, Y.; Landy, J.C.; Mu, L.; Yang, Q. Revisiting Trans-Arctic Maritime Navigability in 2011–2016 from the Perspective of Sea Ice Thickness. Remote Sens. 2021, 13, 2766. [Google Scholar] [CrossRef]
- Chen, J.; Kang, S.; Du, W.; Guo, J.; Xu, M.; Zhang, Y.; Zhong, X.; Zhang, W.; Chen, J. Perspectives on future sea ice and navigability in the Arctic. Cryosphere 2021, 15, 5473–5482. [Google Scholar] [CrossRef]
- Aksenov, Y.; Popova, E.E.; Yool, A.; Nurser, A.G.; Williams, T.D.; Bertino, L.; Bergh, J. On the future navigability of Arctic sea routes: High-resolution projections of the Arctic Ocean and sea ice. Mar. Policy 2017, 75, 300–317. [Google Scholar] [CrossRef]
- Theocharis, D.; Pettit, S.; Rodrigues, V.S.; Haider, J. Arctic shipping: A systematic literature review of comparative studies. J. Transp. Geogr. 2018, 69, 112–128. [Google Scholar] [CrossRef]
- Chen, J.; Kang, S.; Chen, C.; You, Q.; Du, W.; Xu, M.; Zhong, X.; Zhang, W.; Chen, J. Changes in sea ice and future accessibility along the Arctic Northeast Passage. Glob. Planet. Chang. 2020, 195, 103319. [Google Scholar] [CrossRef]
- Min, C.; Yang, Q.; Chen, D.; Yang, Y.; Zhou, X.; Shu, Q.; Liu, J. The emerging Arctic shipping corridors. Geophys. Res. Lett. 2022, 49, e2022GL099157. [Google Scholar] [CrossRef]
- Li, X.; Stephenson, S.R.; Lynch, A.H.; Goldstein, M.A.; Bailey, D.A.; Veland, S. Arctic shipping guidance from the CMIP6 ensemble on operational and infrastructural timescales. Clim. Chang. 2021, 167, 23. [Google Scholar] [CrossRef]
- Wei, T.; Yan, Q.; Qi, W.; Ding, M.; Wang, C. Projections of Arctic sea ice conditions and shipping routes in the twenty-first century using CMIP6 forcing scenarios. Environ. Res. Lett. 2020, 15, 104079. [Google Scholar] [CrossRef]
- Song, S.; Chen, Y.; Chen, X.; Chen, C.; Li, K.F.; Tung, K.K.; Shao, Q.; Liu, Y.; Wang, X.; Yi, L. Adapting to a Foggy Future along Trans-Arctic Shipping Routes. Geophys. Res. Lett. 2023, 50, e2022GL102395. [Google Scholar] [CrossRef]
- Copland, L.; Dawson, J.; Tivy, A.; Delaney, F.; Cook, A. Changes in shipping navigability in the Canadian Arctic between 1972 and 2016. Facets 2021, 6, 1069–1087. [Google Scholar] [CrossRef]
- Smith, L.C.; Stephenson, S.R. New Trans-Arctic shipping routes navigable by midcentury. Proc. Natl. Acad. Sci. USA 2013, 110, E1191–E1195. [Google Scholar] [CrossRef]
- Shu, Q.; Wang, Q.; Song, Z.; Qiao, F.; Zhao, J.; Chu, M.; Li, X. Assessment of sea ice extent in CMIP6 with comparison to observations and CMIP5. Geophys. Res. Lett. 2020, 47, e2020GL087965. [Google Scholar] [CrossRef]
- Notz, D.; Community, S. Arctic sea ice in CMIP6. Geophys. Res. Lett. 2020, 47, e2019GL086749. [Google Scholar] [CrossRef]
- Davy, R.; Outten, S. The Arctic surface climate in CMIP6: Status and developments since CMIP5. J. Clim. 2020, 33, 8047–8068. [Google Scholar] [CrossRef]
- Gunnarsson, B. Recent ship traffic and developing shipping trends on the Northern Sea Route—Policy implications for future arctic shipping. Mar. Policy 2021, 124, 104369. [Google Scholar] [CrossRef]
- Chen, Q.; Lau, Y.-Y.; Ge, Y.-E.; Dulebenets, M.A.; Kawasaki, T.; Ng, A.K. Interactions between Arctic passenger ship activities and emissions. Transp. Res. Part D-Trans. Environ. 2021, 97, 102925. [Google Scholar] [CrossRef]
- Silber, G.K.; Adams, J.D. Vessel operations in the Arctic, 2015–2017. Front. Mar. Sci. 2019, 6, 573. [Google Scholar] [CrossRef]
- Hreinsson, H. The Increase in Arctic Shipping 2013–2019-Arctic Shipping Status Report (ASSR)# 1. 2020. Available online: https://www.pame.is/document-library/pame-reports-new/pame-ministerial-deliverables/2021-12th-arctic-council-ministerial-meeting-reykjavik-iceland/793-assr-1-the-increase-in-arctic-shipping-2013-2019/file&ved=2ahUKEwihhMXG85CFAxXPsVYBHSgTB0gQFnoECBIQAQ&usg=AOvVaw1NRZP4mn_3O5Fh0iw88YTc (accessed on 17 April 2023).
- Tu, E.; Zhang, G.; Rachmawati, L.; Rajabally, E.; Huang, G.-B. Exploiting AIS data for intelligent maritime navigation: A comprehensive survey from data to methodology. IEEE Trans. Intell. Transp. Syst. 2017, 19, 1559–1582. [Google Scholar] [CrossRef]
- Eguíluz, V.M.; Fernández-Gracia, J.; Irigoien, X.; Duarte, C.M. A quantitative assessment of Arctic shipping in 2010–2014. Sci. Rep. 2016, 6, 30682. [Google Scholar] [CrossRef]
- DiGirolamo, N.; Parkinson, C.L.; Cavalieri, D.J.; Gloersen, P.; Zwally, H.J. Sea Ice Concentrations from Nimbus-7 SMMR and DMSP SSM/I-SSMIS Passive Microwave Data, Version 2. 2022. Available online: https://nsidc.org/data/nsidc-0051/versions/2 (accessed on 25 November 2023).
- March, D.; Metcalfe, K.; Tintoré, J.; Godley, B.J. Tracking the global reduction of marine traffic during the COVID-19 pandemic. Nat. Commun. 2021, 12, 2415. [Google Scholar] [CrossRef]
- NSIDC. Explore Data by Arctic Region. 2022. Available online: https://nsidc.org/data/user-resources/help-center/does-nsidc-have-tools-extract-and-geolocate-polar-stereographic-data#anchor-7 (accessed on 28 December 2023).
- Loe, J.S.; Fjærtoft, D.B.; Swanson, P.; Jakobsen, E.W. Arctic Business Scenarios 2020. 2014. Available online: https://www.menon.no/publication/arctic-business-scenarios-2020-2/?lang=en (accessed on 22 July 2023).
- Ellis, B.; Brigham, L. Arctic Marine Shipping Assessment 2009 Report. 2009. Available online: https://www.researchgate.net/profile/Hajo-Eicken/publication/255891922_Arctic_Marine_Shipping_Assessment_2009_Report/links/5ad39ab30f7e9b2859360173/Arctic-Marine-Shipping-Assessment-2009-Report.pdf (accessed on 6 January 2024).
- Stroeve, J.; Notz, D. Changing state of Arctic sea ice across all seasons. Environ. Res. Lett. 2018, 13, 103001. [Google Scholar] [CrossRef]
- Shokr, M.; Ye, Y. Why Does Arctic Sea Ice Respond More Evidently than Antarctic Sea Ice to Climate Change? Ocean-Land-Atmos. Res. 2023, 2, 0006. [Google Scholar] [CrossRef]
- Wang, Y.; Bi, H.; Huang, H.; Liu, Y.; Liu, Y.; Liang, X.; Fu, M.; Zhang, Z. Satellite-observed trends in the Arctic sea ice concentration for the period 1979–2016. J. Oceanol. Limnol. 2019, 37, 18–37. [Google Scholar] [CrossRef]
- Shen, Z.; Zhou, W.; Li, J.; Chan, J.C. A frequent ice-free Arctic is likely to occur before the mid-21st century. NPJ Clim. Atmos. Sci. 2023, 6, 103. [Google Scholar] [CrossRef]
- Marchenko, N. Russian Arctic Seas: Navigational Conditions and Accidents; Springer Science & Business Media: Berlin/Heidelberg, Germany, 2012. [Google Scholar]
- Ng, A.K.; Andrews, J.; Babb, D.; Lin, Y.; Becker, A. Implications of climate change for shipping: Opening the Arctic seas. Wiley Interdiscip. Rev. Clim. Chang. 2018, 9, e507. [Google Scholar] [CrossRef]
- Sepp, M.; Jaagus, J. Changes in the activity and tracks of Arctic cyclones. Clim. Chang. 2011, 105, 577–595. [Google Scholar] [CrossRef]
- Doumbia-Henry, C. Shipping and COVID-19: Protecting seafarers as frontline workers. WMU J. Marit. Aff. 2020, 19, 279–293. [Google Scholar] [CrossRef]
- Yazir, D.; Şahin, B.; Yip, T.L.; Tseng, P.-H. Effects of COVID-19 on maritime industry: A review. Int. Marit. Health 2020, 71, 253–264. [Google Scholar] [CrossRef] [PubMed]
- ICS. Annual Review 2020. Available online: https://www.ics-shipping.org/publication/annual-review-2020/ (accessed on 25 December 2023).
- Hilde, P.S. The” new” Arctic–the Military Dimension. J. Mil. Strateg. Stud. 2013, 15, 130–153. [Google Scholar]
- Bhagwat, J.V. Arctic Military Posturing and Its Influence on the Development of the Northern Sea Route. Arctic 2022, 48, 77–102. [Google Scholar] [CrossRef]
- Sergunin, A.; Gjørv, G.H. The politics of Russian Arctic shipping: Evolving security and geopolitical factors. Polar J. 2020, 10, 251–272. [Google Scholar] [CrossRef]
- Qi, X.; Li, Z.; Zhao, C.; Zhang, Q.; Zhou, Y. Environmental impacts of Arctic shipping activities: A review. Ocean Coast. Manag. 2024, 247, 106936. [Google Scholar] [CrossRef]
- Stephenson, S.R.; Wang, W.; Zender, C.S.; Wang, H.; Davis, S.J.; Rasch, P.J. Climatic responses to future trans-Arctic shipping. Geophys. Res. Lett. 2018, 45, 9898–9908. [Google Scholar] [CrossRef] [PubMed]
- Peeken, I.; Primpke, S.; Beyer, B.; Gütermann, J.; Katlein, C.; Krumpen, T.; Bergmann, M.; Hehemann, L.; Gerdts, G. Arctic sea ice is an important temporal sink and means of transport for microplastic. Nat. Commun. 2018, 9, 1505. [Google Scholar] [CrossRef] [PubMed]
- de Aguiar, V.; Dagestad, K.-F.; Hole, L.R.; Barthel, K. Quantitative assessment of two oil-in-ice surface drift algorithms. Mar. Pollut. Bull. 2022, 175, 113393. [Google Scholar] [CrossRef] [PubMed]
- Winther, M.; Christensen, J.H.; Plejdrup, M.S.; Ravn, E.S.; Eriksson, Ó.F.; Kristensen, H.O. Emission inventories for ships in the arctic based on satellite sampled AIS data. Atmos. Environ. 2014, 91, 1–14. [Google Scholar] [CrossRef]
- Chen, J.; Kang, S.; Wu, A.; Chen, L. Projected emissions and climate impacts of Arctic shipping along the Northern Sea Route. Environ. Pollut. 2024, 341, 122848. [Google Scholar] [CrossRef]
Disclaimer/Publisher’s Note: The statements, opinions and data contained in all publications are solely those of the individual author(s) and contributor(s) and not of MDPI and/or the editor(s). MDPI and/or the editor(s) disclaim responsibility for any injury to people or property resulting from any ideas, methods, instructions or products referred to in the content. |
© 2024 by the authors. Licensee MDPI, Basel, Switzerland. This article is an open access article distributed under the terms and conditions of the Creative Commons Attribution (CC BY) license (https://creativecommons.org/licenses/by/4.0/).

