Technical Note

Infrared Maritime Small-Target Detection Based on Fusion Gray Gradient Clutter Suppression

1
School of Electrical and Electronic Engineering, Chongqing University of Technology, Chongqing 400054, China
2
School of Microelectronics and Communication Engineering, Chongqing University, Chongqing 400044, China
*
Author to whom correspondence should be addressed.
Remote Sens. 2024, 16(7), 1255; https://doi.org/10.3390/rs16071255
Submission received: 7 February 2024 / Revised: 26 March 2024 / Accepted: 30 March 2024 / Published: 2 April 2024
(This article belongs to the Section Remote Sensing Image Processing)

Abstract

:
The long-distance ship target turns into a small spot in an infrared image, which has the characteristics of small size, weak intensity, limited texture information, and is easily affected by noise. Moreover, the presence of heavy sea clutter, including sun glints that exhibit local contrast similar to small targets, negatively impacts the performance of small-target detection methods. To address these challenges, we propose an effective detection scheme called fusion gray gradient clutter suppression (FGGCS), which leverages the disparities in grayscale and gradient between the target and its surrounding background. Firstly, we designed a harmonic contrast map (HCM) by using the two-dimensional difference of Gaussian (2D-DoG) filter and eigenvalue harmonic mean of the structure tensor to highlight high-contrast regions of interest. Secondly, a local gradient difference measure (LGDM) is designed to distinguish isotropic small targets from background edges with local gradients in a specific direction. Subsequently, by integrating the HCM and LGDM, we designed a fusion gray gradient clutter suppression map (FGGCSM) to effectively enhance the target and suppress clutter from the sea background. Finally, an adaptive constant false alarm threshold is adopted to extract the targets. Extensive experiments on five real infrared maritime image sequences full of sea glints, including a small target and sea–sky background, show that FGGCS effectively increases the signal-to-clutter ratio gain (SCRG) and the background suppression factor (BSF) by more than 22% and 82%, respectively. Furthermore, its receiver operating characteristic (ROC) curve has an obviously more rapid convergence rate than those of other typical detection algorithms and improves the accuracy of small-target detection in complex maritime backgrounds.

1. Introduction

Maritime infrared target detection plays a vital role in the field of safeguarding marine security and marine rescue [1,2,3,4,5], where accuracy and robustness are essential. A long-distance infrared target on the sea surface is a typical small weak signal, lacking effective information such as texture and structure and being easily disturbed by noise. Moreover, heavy changeable background sea clutter such as dense sea glints and thick sea fog drown out small-target signals, hindering the accuracy of weak target detection performance. Therefore, it is a challenging issue in the field of target detection and recognition to suppress clutter interference.
Small weak target detection methods can be divided into two strategies: track-before-detection (TBD) and detection-before-tracking (DBT). Traditional TBD methods assume that background clutter can be whitened as spatial-temporal uncorrelated stationary Gaussian white noise and utilize trajectory continuity to identify target signals by applying multi-frame correlation. Representative of such algorithms are the spatial-temporal local contrast filter [6] and pipeline-filtering integrating visual attention model [1]. However, sea glints fail to satisfy the Gaussian white noise model, resulting in a large number of false alarms. DBT methods initially filter infrared sequence images, and then utilize multi-frame correlation to determine true targets from candidate measurement points that exceed a given threshold. DBT methods do not require extensive prior information for motion analysis and are computationally efficient. There are four main types of state-of-the-art DBT algorithms: background prediction filtering, target sparse reconstruction, feature pattern analysis, and the human visual system detection strategy.
Max-median [7], morphological top-hat transform [8,9], and two-dimensional least mean square filter (TDLMS) [10] are common background prediction filtering algorithms, having a good detection effect on the flat sea region with a stable background and uniform intensity. However, these methods have a poor estimation ability for the strong edge and non-stationary sea glints, which often lead to persistent residual clutter despite the background suppression efforts. The sparse reconstruction method treats small targets and backgrounds as sparse and low-rank components, respectively. These include the infrared patch-image model (IPI) [11] and reweighted infrared patch-tensor model (RIPT) [12]. However, recovering both sparse and low-rank matrices poses challenges. Moreover, when the clutter intensity fluctuates in a large range and the texture is complex, the target signal and high grayscale interference become mixed, resulting in a decrease in detection performance. The performance of deep neural networks in a detection method based on feature pattern analysis [13] mainly depends on the training samples and the effectiveness of feature extraction, such as a lightweight convolutional neural network (L-CNN) and multisource feature cascade decision method [14], target-oriented shallow-deep features and effective small-anchor-based convolutional neural network (CNN) detection method [15], and the salient target detection for infrared and visible image fusion (STDFusionNet) [16]. When the test data are inconsistent with the training samples, the detection performance tends to be poor, especially when dealing with infrared small-target signals that belong to a limited number of small samples.
Recently, there has been a growing trend in imitating the robustness of the human visual system (HVS) to enhance the performance of small infrared target detection. HVS-based methods have demonstrated significant potential in target detection tasks. However, there is still room for enhancing and optimizing these methods to maximize their effectiveness. For instance, multiscale gray difference weighted image entropy (MGDWIE) [17] distinguishes small targets from the background by using local correlation and gray difference. However, there is a limitation that the strong edge is prone to residual clutter. The local contrast measure (LCM) [18] extracts targets by calculating the minimum difference between the central region and its neighborhoods in eight directions. However, it assumes that the targets are brighter than the background. The multiscale patch-based contrast measure (MPCM) [19] analyzes directional differences between the target and surrounding background cells to reduce the impact of sharp structural edges during detection. However, the high local contrast characteristics of sea glints can lead to the potential for confusing targets with false alarms in the detection results.
To effectively suppress the background in infrared images, it is essential to utilize the spatial characteristics of the target signal in DBT methods. In infrared maritime small-target detection, the presence of high-intensity sea glints with prominent edges poses significant challenges. To address these challenges, a novel and effective detection strategy called fusion gray gradient clutter suppression (FGGCS) is proposed. The contributions to this work are given as follows.
(1) The proposed FGGCS detection scheme addresses the problems of small-target detection in infrared images by leveraging the differences in intensity and gradient between the target and the surrounding background;
(2) HCM is designed by using a 2D-DoG filter and eigenvalue harmonic mean of the structure tensor to highlight high-contrast regions of interest. This improves the visibility of small targets in infrared images by leveraging their higher brightness compared to the surrounding background;
(3) LGDM is designed to analyze the difference in gradient direction between isotropic small targets and background edges in the gradient vector field. This measure effectively distinguishes between small targets and background edges with local gradients in a specific direction;
(4) FGGCSM is designed by integrating HCM and LGDM, combining their complementary information. This integration enhances the target signal while suppressing clutter from the sea background;
(5) On all five real infrared maritime image sequences full of sea glint, FGGCS achieves the best overall performance compared to existing infrared maritime small-target detection methods.
The remainder of the paper is organized as follows: the proposed detection method is described in Section 2. The simulation experiment and discussion are shown in Section 3. Finally, the conclusions are drawn in Section 4.

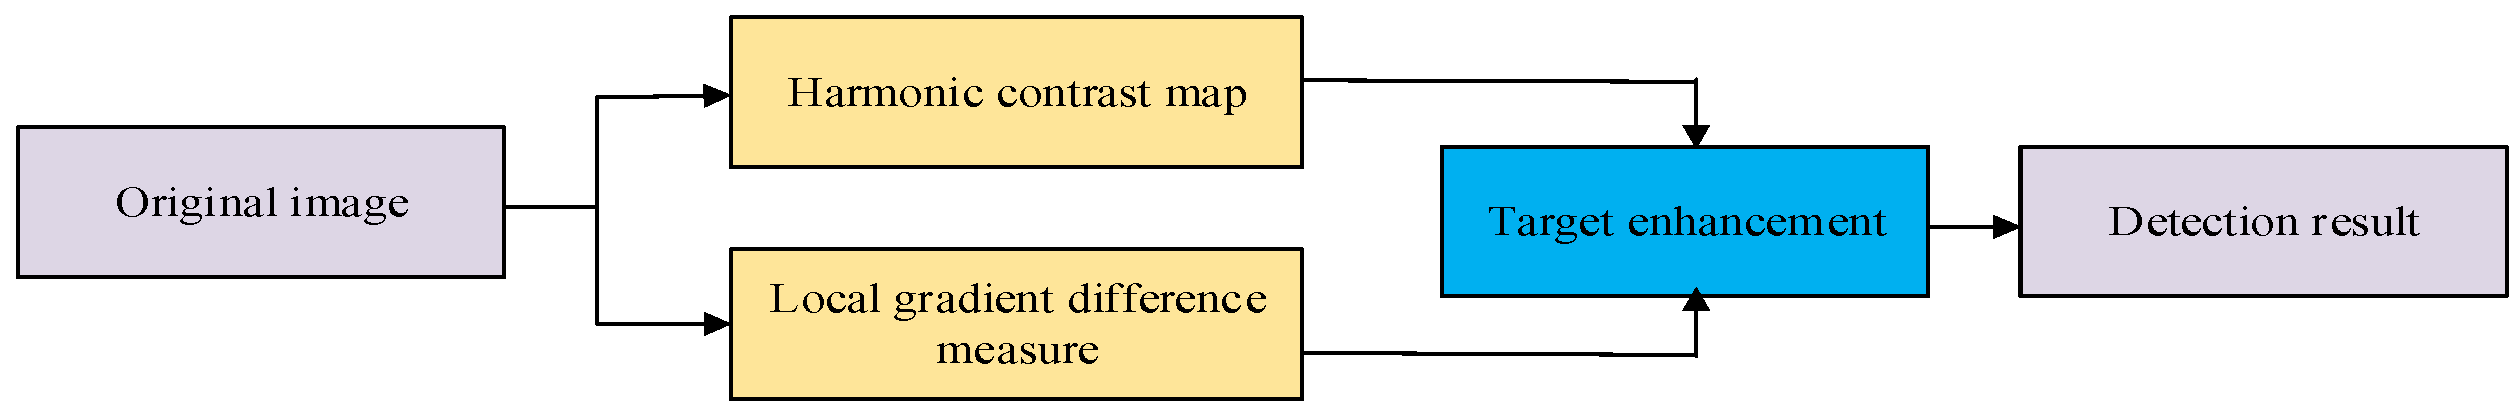
2. Small-Target Detection Based on Fusion Gray Gradient Clutter Suppression

In this section, FGGCS is introduced to suppress background clutter and highlight the candidate target, and an adaptive constant false alarm threshold is adopted to detect the targets. The flowchart is given in Figure 1, which consists of three phases: Firstly, the harmonic contrast map and local gradient difference measure map are calculated from the original infrared image to characterize the global and local properties of the target. Secondly, the harmonic contrast map and local gradient difference measure map are fused to enhance the small target. Finally, the target is extracted by constant false alarm criteria.

2.1. Harmonic Contrast Map

Due to the influence of external factors such as atmospheric diffraction, optical defocusing, and energy fading, the long-distance ship in the infrared thermal imaging system turns into an isotropic, small spot similar to a two-dimensional Gaussian-like shape, which conforms to the optics point spread function (PSF) [8,9,20]. The approximate equation can be expressed as
f t ( x , y ) = A m × exp ( ( x x 0 ) 2 2 σ x 2 ( y y 0 ) 2 2 σ y 2 )
where f t ( x , y ) represents the intensity of target at (x, y), ( x 0 , y 0 ) indicates the center location, and A m , σ x , and σ y are the peak intensity, horizontal, and vertical extend scales of the small targets, respectively. Figure 2 shows the two-dimensional Gaussian spatial distribution. Small targets with Gaussian-like shapes exhibit a characteristic of local high frequency, appearing brighter than the surrounding background. However, noise in raw infrared images generated by sensors possesses the highest frequency and can disrupt the relationship between the high-frequency property of these small targets and their distinguishability from the background. Consequently, it becomes essential to enhance the contrast between the target and its surroundings to facilitate improved target detection.
The human visual system (HVS) enables individuals to efficiently perceive features that exhibit significant differences between a target and its background, even in complex scenes. Notably, contrast is more effective than shape and color in HVS, and human eyes can quickly identify regions of interest by detecting changes in grayscale value. Consequently, the imperative arises to enhance the target region while concurrently suppressing the local neighborhood background, ensuring a balanced visual perception and improved focus. The 2D-DoG operator has the characteristics of central excitation and lateral inhibition simulating the HVS well, which can suppress the local neighborhood background and filter noise. The 2D-DoG operator is defined as
D o G ( x , y ) = 1 2 π σ 1 2 e x 2 + y 2 2 σ 1 2 1 2 π σ 2 2 e x 2 + y 2 2 σ 2 2
where σ 1 and σ 2 are the excitation parameter and inhibition parameter, respectively. Generally, σ 1 < σ 2 and σ 2 / σ 1 = 2 can better guarantee the positive center and negative periphery. σ 1 determines the size of the positive center of the DoG kernel, and it is set as 3 in the experiment. By preprocessing the infrared image with a 2D-DoG filter, the contrast between the target and the background is improved and the saliency is enhanced.
Given a two-dimensional image f, the corresponding structure tensor ST can be calculated as
S T ( x , y ) = G σ [ ( f x ) 2 2 f x y 2 f x y ( f y ) 2 ] = [ S T x x S T x y S T x y S T y y ]
f x = f ( x + 1 , y ) f ( x 1 , y ) 2
f y = f ( x , y + 1 ) f ( x , y 1 ) 2
where G σ is a Gaussian filter with standard deviation σ , often viewed as a window for perceiving local image information, and is convolution operator. f / x and f / y are partial derivative values in the x direction and y direction, respectively.
The structure tensor summarizes the gradient distribution in the neighborhood area of a specific point. Furthermore, the eigenvalues and eigenvectors of the structure tensor can indicate the predominant direction and the coherence degree of the gradient vectors. The corresponding eigenvalues and eigenvectors can be obtained via eigen-decomposition.
The large eigenvalue of the local structure tensor is λlarge, the small eigenvalue of the local structure tensor is λsmall, and the eigenvalue harmonic mean is R; they are defined as
λ large = 1 2 ( S T x x + S T y y + ( S T x x S T y y ) 2 + 4 S T x y 2 )
λ s m a l l = 1 2 ( S T x x + S T y y ( S T x x S T y y ) 2 + 4 S T x y 2 )
R = 2 λ large 1 + λ s m a l l 1
In this paper, the eigenvector of λ large is denoted as e large ( x , y ) , and the eigenvector of λ s m a l l is denoted as e s m a l l ( x , y ) . The eigenvector e large ( x , y ) indicates the predominate direction of the gradient trend. On the contrary, e s m a l l ( x , y ) cannot indicate the predominate direction of the gradient trend. The relationship of λ large and λ s m a l l reflects some characteristics of the processed region. When λ large λ s m a l l ≈ 0, it indicates that the pixel is located in a smooth area; when λ large >> λ s m a l l ≈ 0, it indicates that the area where the pixel is located is an edge; when λ large > λ s m a l l >> 0, it indicates the position of the pixel is the candidate target point of the image. Therefore, the large eigenvalue and small eigenvalue can be utilized to further suppress the background of the preprocessed image. The two eigenvalues and eigenvalue harmonic mean of the 2D-DoG filtered infrared image are λ large , λ s m a l l , and R . The harmonic contrast map (HCM) is approximately half of R :
H C M ( x , y ) = λ large ( x , y ) × λ s m a l l ( x , y ) λ large ( x , y ) + λ s m a l l ( x , y ) + φ
where φ is a constant that tends to zero. It is easy to obtain from Equation (9) that HCM(x, y) is approximately equal to zero in smooth background and edge areas, and target areas are protruded.

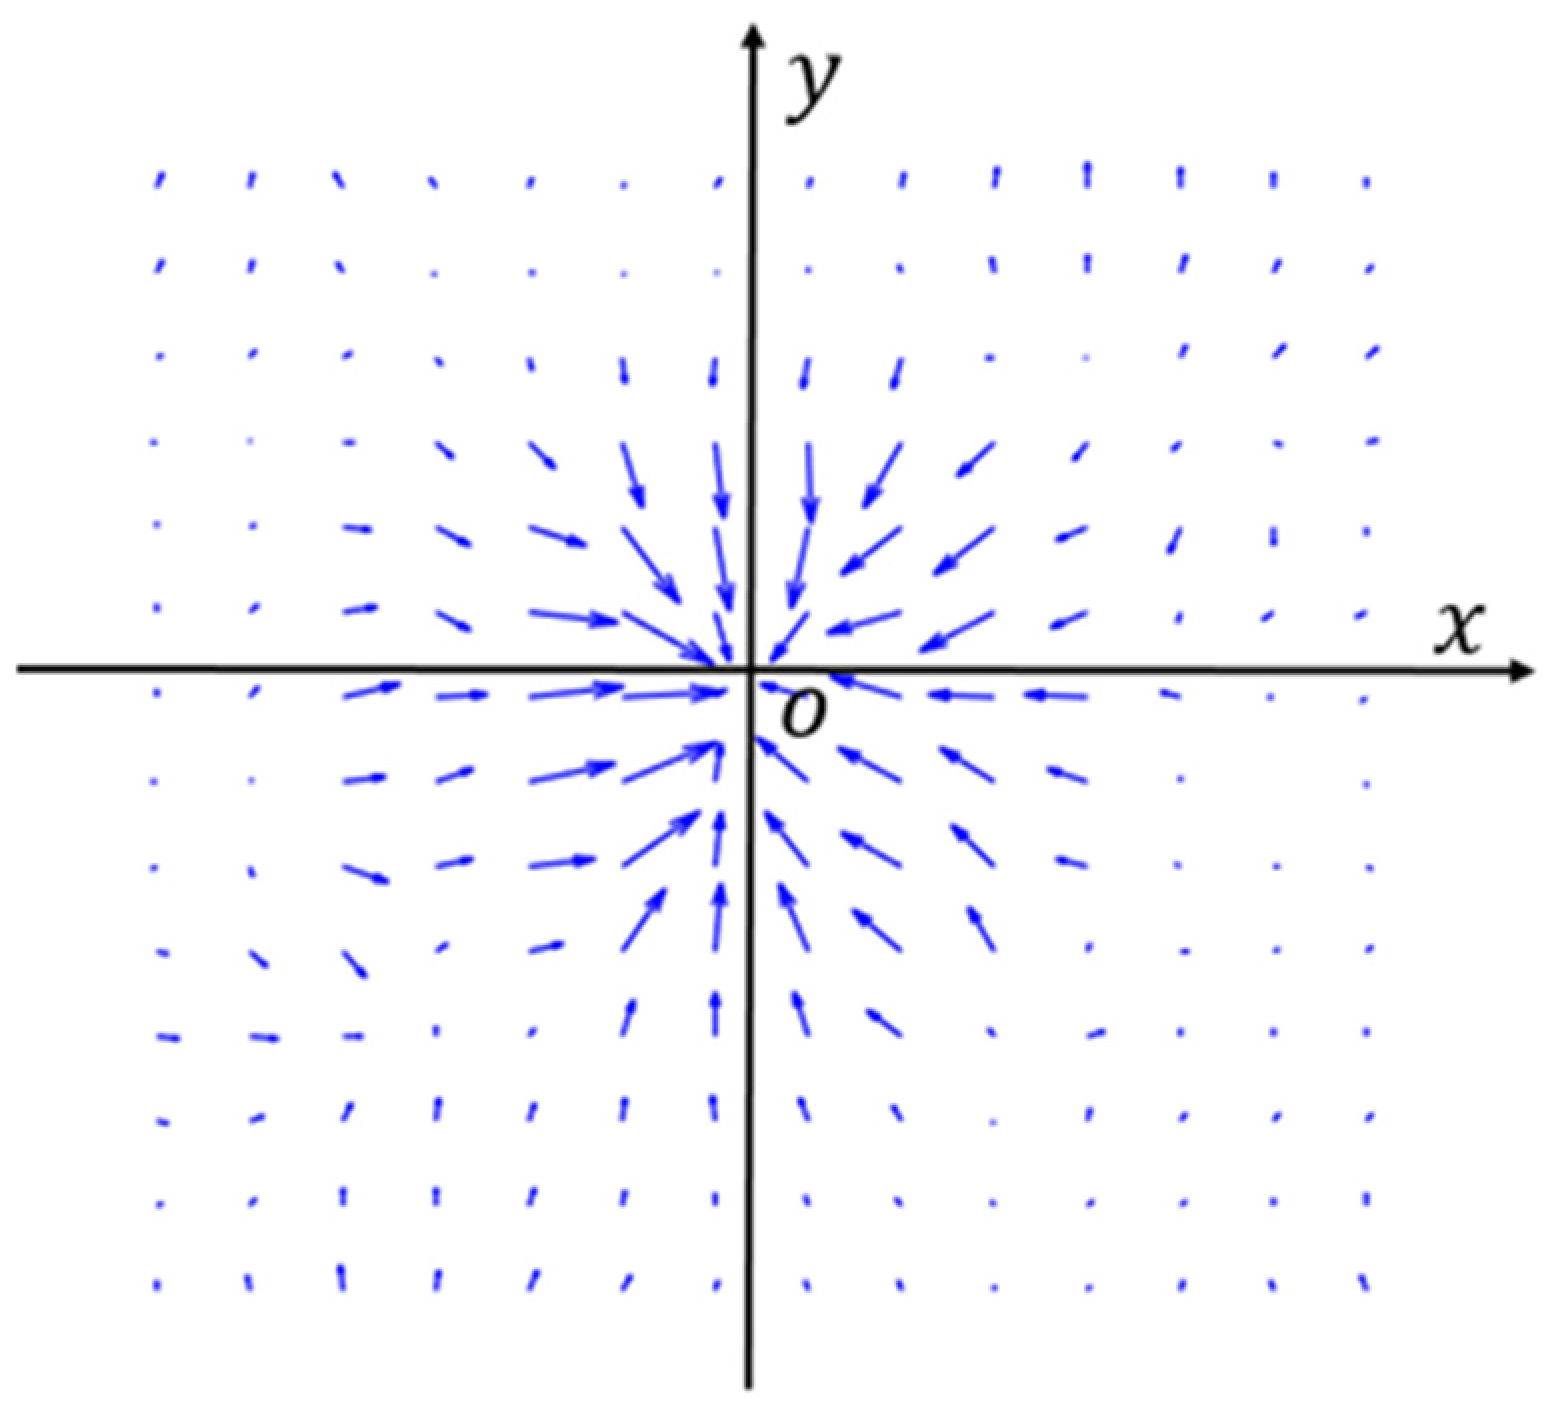
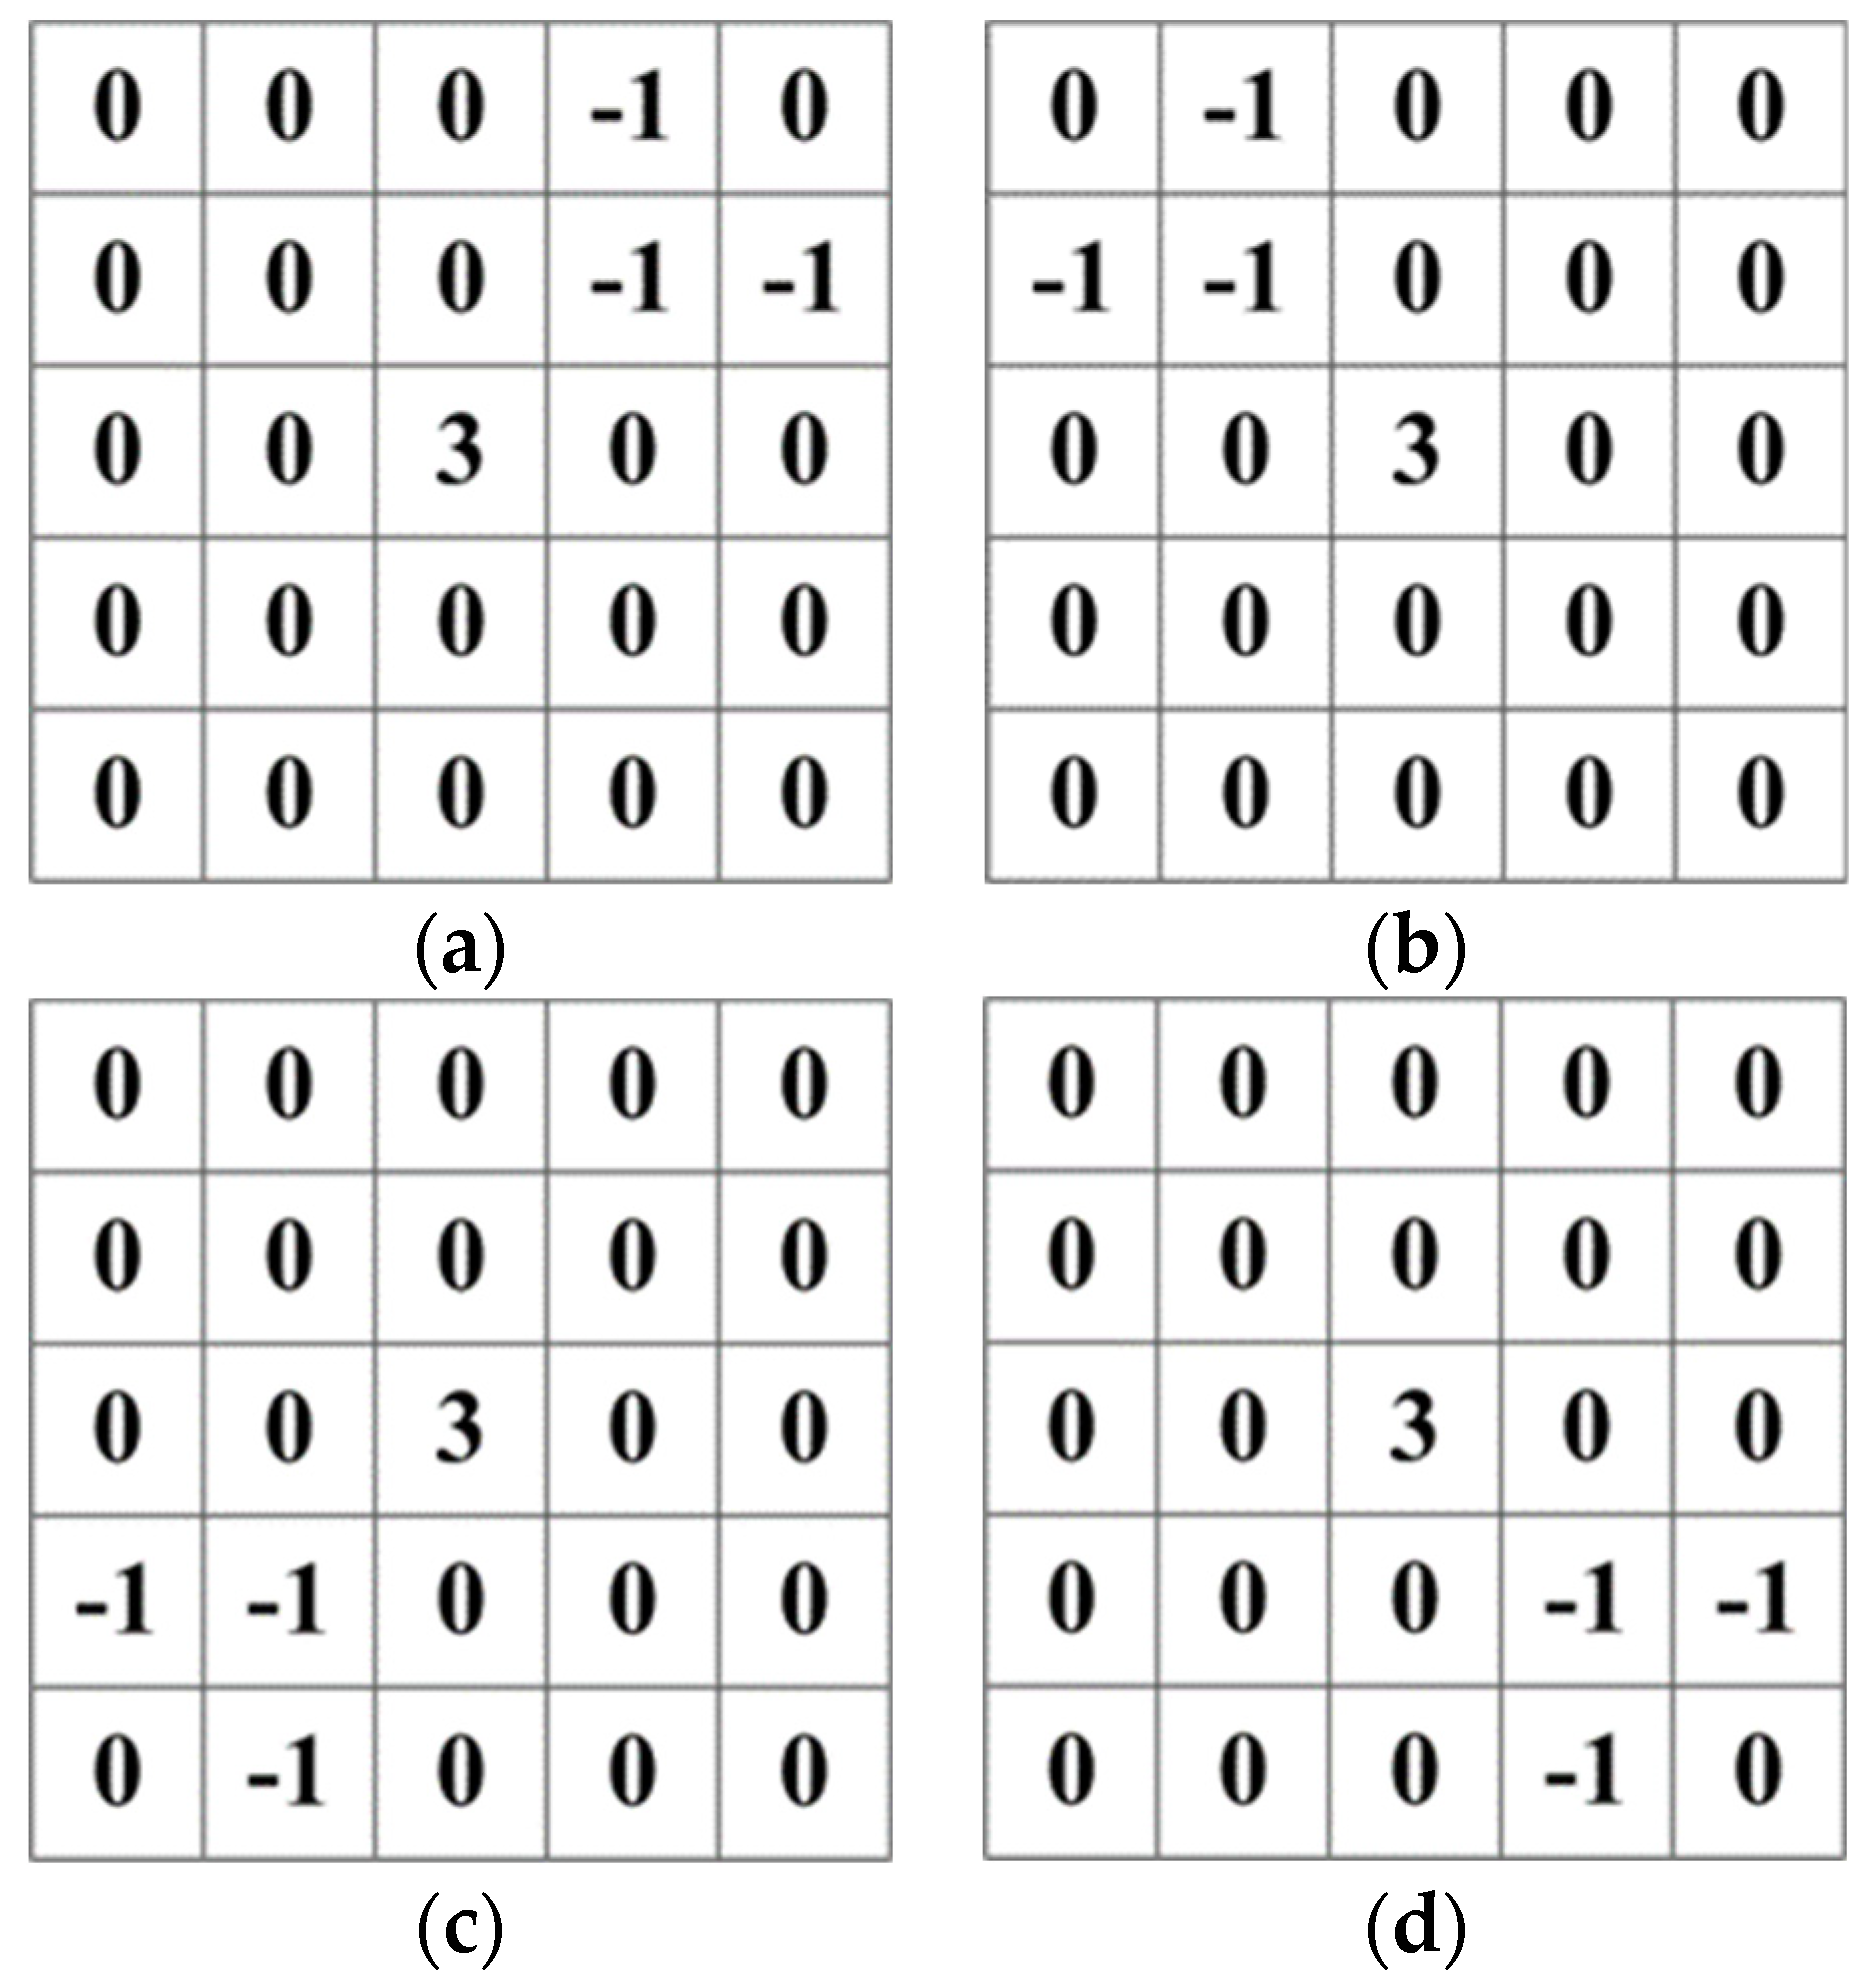
2.2. Local Gradient Difference Measure

Owing to the Gaussian-like shape, the small target is isotropic, the local intensity differences in all directions of the target are consistent, and the gradient can well reflect the intensity difference property of the desired image patch. An infrared gradient vector field (IGVF) [21] is constructed to illustrate the gradient of an infrared image. Each pixel in an infrared image is represented by a two-dimensional gradient vector with size and direction. In IGVF, a single pixel point not only contains the relative intensity information of it and the surrounding pixels, but also reflects the variation rule of the gray value between pixels. The size of the gradient vector reflects the changing degree of the surrounding pixels, and the direction of the gradient vector reflects the changing trend. Figure 3 shows a small-target image patch and a sharp sea clutter edge image patch with a high gray value change and their corresponding IGVF patches. In the vector field, a directed line segment is used to describe the gradient vector, the length of a segment describes the magnitude of the gradient vector, and the pointing of an arrow represents the direction of the gradient vector. It can be seen from Figure 3c that gradient vectors are evenly distributed in all directions and point towards the center of the target, where this situation nicely illustrates the isotropic nature of small targets. It can be seen from Figure 3d that the gradient vectors consistently point down: the arrow points from the high gray value area to the low gray value area.
Taking the target center in Figure 3c as the origin of the coordinate axis, the gradient region partition map is obtained as shown in Figure 4. The gradient vectors of the four quadrants are close in number and all point to the origin of the coordinates. Obviously, the background edge does not have a gradient partition map similar to the target. Four filtering templates are constructed to simulate the target gradient pointing towards the target center. They are presented in Figure 5.
To obtain four filtering results (C1, C2, C3, C4), the original infrared image is convolved with four designed templates (W1, W2, W3, W4), respectively. Given a point with coordinates ( x 0 , y 0 ) , the corresponding neighborhood Φ(x,y) is calculated using Equation (10), where r is an integer (such as 3, 5, 7, or 9).
Φ ( x , y ) = { ( x , y ) | | x x 0 | r , | y y 0 | r }
When dealing with a target located at the coordinate position ( x 0 , y 0 ) in the original infrared image, the neighborhood around the target is divided into four quadrants. The filtering results C1, C2, C3, and C4 are obtained in the first, second, third, and fourth quadrants, respectively, in counterclockwise order. This process results in the local mean gradient amplitude for each quadrant, providing information about the intensity variations and gradients in different regions around the target, calculated as
G r a d i = 1 N i S m = 1 N i S H ( C i ) 3 i = 1 , 2 , 3 , 4
H ( x ) = { x x > 0 0 x 0
where N i S is the quantity whose C i values of the selected quadrant image patch are not less than zero, representing the gradient magnitudes obtained for each filtering result in the respective quadrant. Since the small targets exhibit isotropic properties, the difference between the obtained Gradi is small, and their amplitudes are roughly close, while the gradients at the background edges, as shown in Figure 3d, are locally orientated, which inevitably causes the average gradient amplitude in other directions to be very small.
To capture the differences between the target and background clutter, the mean gradient amplitudes are multiplied in each direction pairwise, and their mean value is taken as the local gradient difference measure (LGDM). LGDM is denoted as
L G D M = m e a n ( G r a d i × G r a d i ) i { 1 , 2 , 3 , 4 } , j { 2 , 3 , 4 } , i < j
The LGDM value for background clutter tends to be much lower compared to the target. By utilizing the LGDM map, both the targets can be highlighted, while the background clutters are suppressed simultaneously.

2.3. Fusion Grayscale Gradient Clutter Suppression

The designed FGGCSM combines the information from HCM and FLGM to achieve effective target enhancement and clutter suppression from the sea background. To be specific, the HCM component of the FGGCSM captures the image filtering outcomes that are influenced by the local high-brightness characteristics of small targets present in the infrared images. It emphasizes the regions that exhibit high brightness, which are often associated with the presence of potential targets. On the other hand, the FLGM component of the FGGCSM characterizes the clutter suppression results based on the specific inward directivity property of the gradient within the target neighborhood. It also considers the consistency of the intensity difference of the target in all directions. This helps in reducing the impact of clutter and enhancing the visibility of the targets. By leveraging the FGGCSM, our approach FGGCS achieves a comprehensive and balanced approach to target highlighting and clutter suppression in infrared images, enabling improved target detection and analysis in challenging scenarios, particularly in the presence of cluttered sea backgrounds, defined as
F G G C S M ( x , y ) = H C M ( x , y ) × L G D M ( x , y )

2.4. Target Detection

To detect small targets in infrared imagery, an adaptive constant false alarm threshold technique is applied to the FGGCSM map, defined as
T h = F G G C S M ¯ + δ × σ ( F G G C S M )
where the threshold value, denoted as Th, is calculated based on the average F G G C S M ¯ and standard deviation σ ( F G G C S M ) of the FGGCSM. F G G C S M ¯ represents the typical intensity level of the FGGCSM, while σ ( F G G C S M ) measures the variation or spread of the intensity values. These statistical measures provide insights into the overall distribution of intensities in the FGGCSM. Additionally, an experimentally selected threshold adjustment constant, denoted as δ , is introduced to fine-tune the threshold value Th. This constant allows for adjusting the sensitivity of the technique, balancing the trade-off between correctly identifying targets and minimizing false alarms. By incorporating the F G G C S M ¯ , σ ( F G G C S M ) , and δ , Th is dynamically determined to adapt to the specific characteristics and intensity distribution of the FGGCSM. Once the threshold value is determined, each pixel’s intensity value in the FGGCSM is compared to Th. If a pixel’s intensity value exceeds Th, it is classified as part of a potential target region. On the other hand, pixels in the FGGCSM with intensity values below Th are considered part of the background. To visualize the detected targets, the identified target regions in the FGGCSM are mapped back to the corresponding locations in the original infrared image. This mapping facilitates the spatial localization and visualization of the small targets. By employing the adaptive constant false alarm threshold technique, the proposed detection algorithm FGGCS effectively distinguishes small targets from the background clutter in infrared imagery. It leverages statistical properties of the FGGCSM, allowing for adaptive and accurate detection of targets based on their intensity values. In the experiment, δ is set as 3.

3. Simulation Experiments and Discussion

In this section, to evaluate the performance of the proposed FGGCS method for small-target detection under a strong sea clutter background, a series of experiments are conducted on five maritime image sequences.

3.1. Test Dataset and Metrics
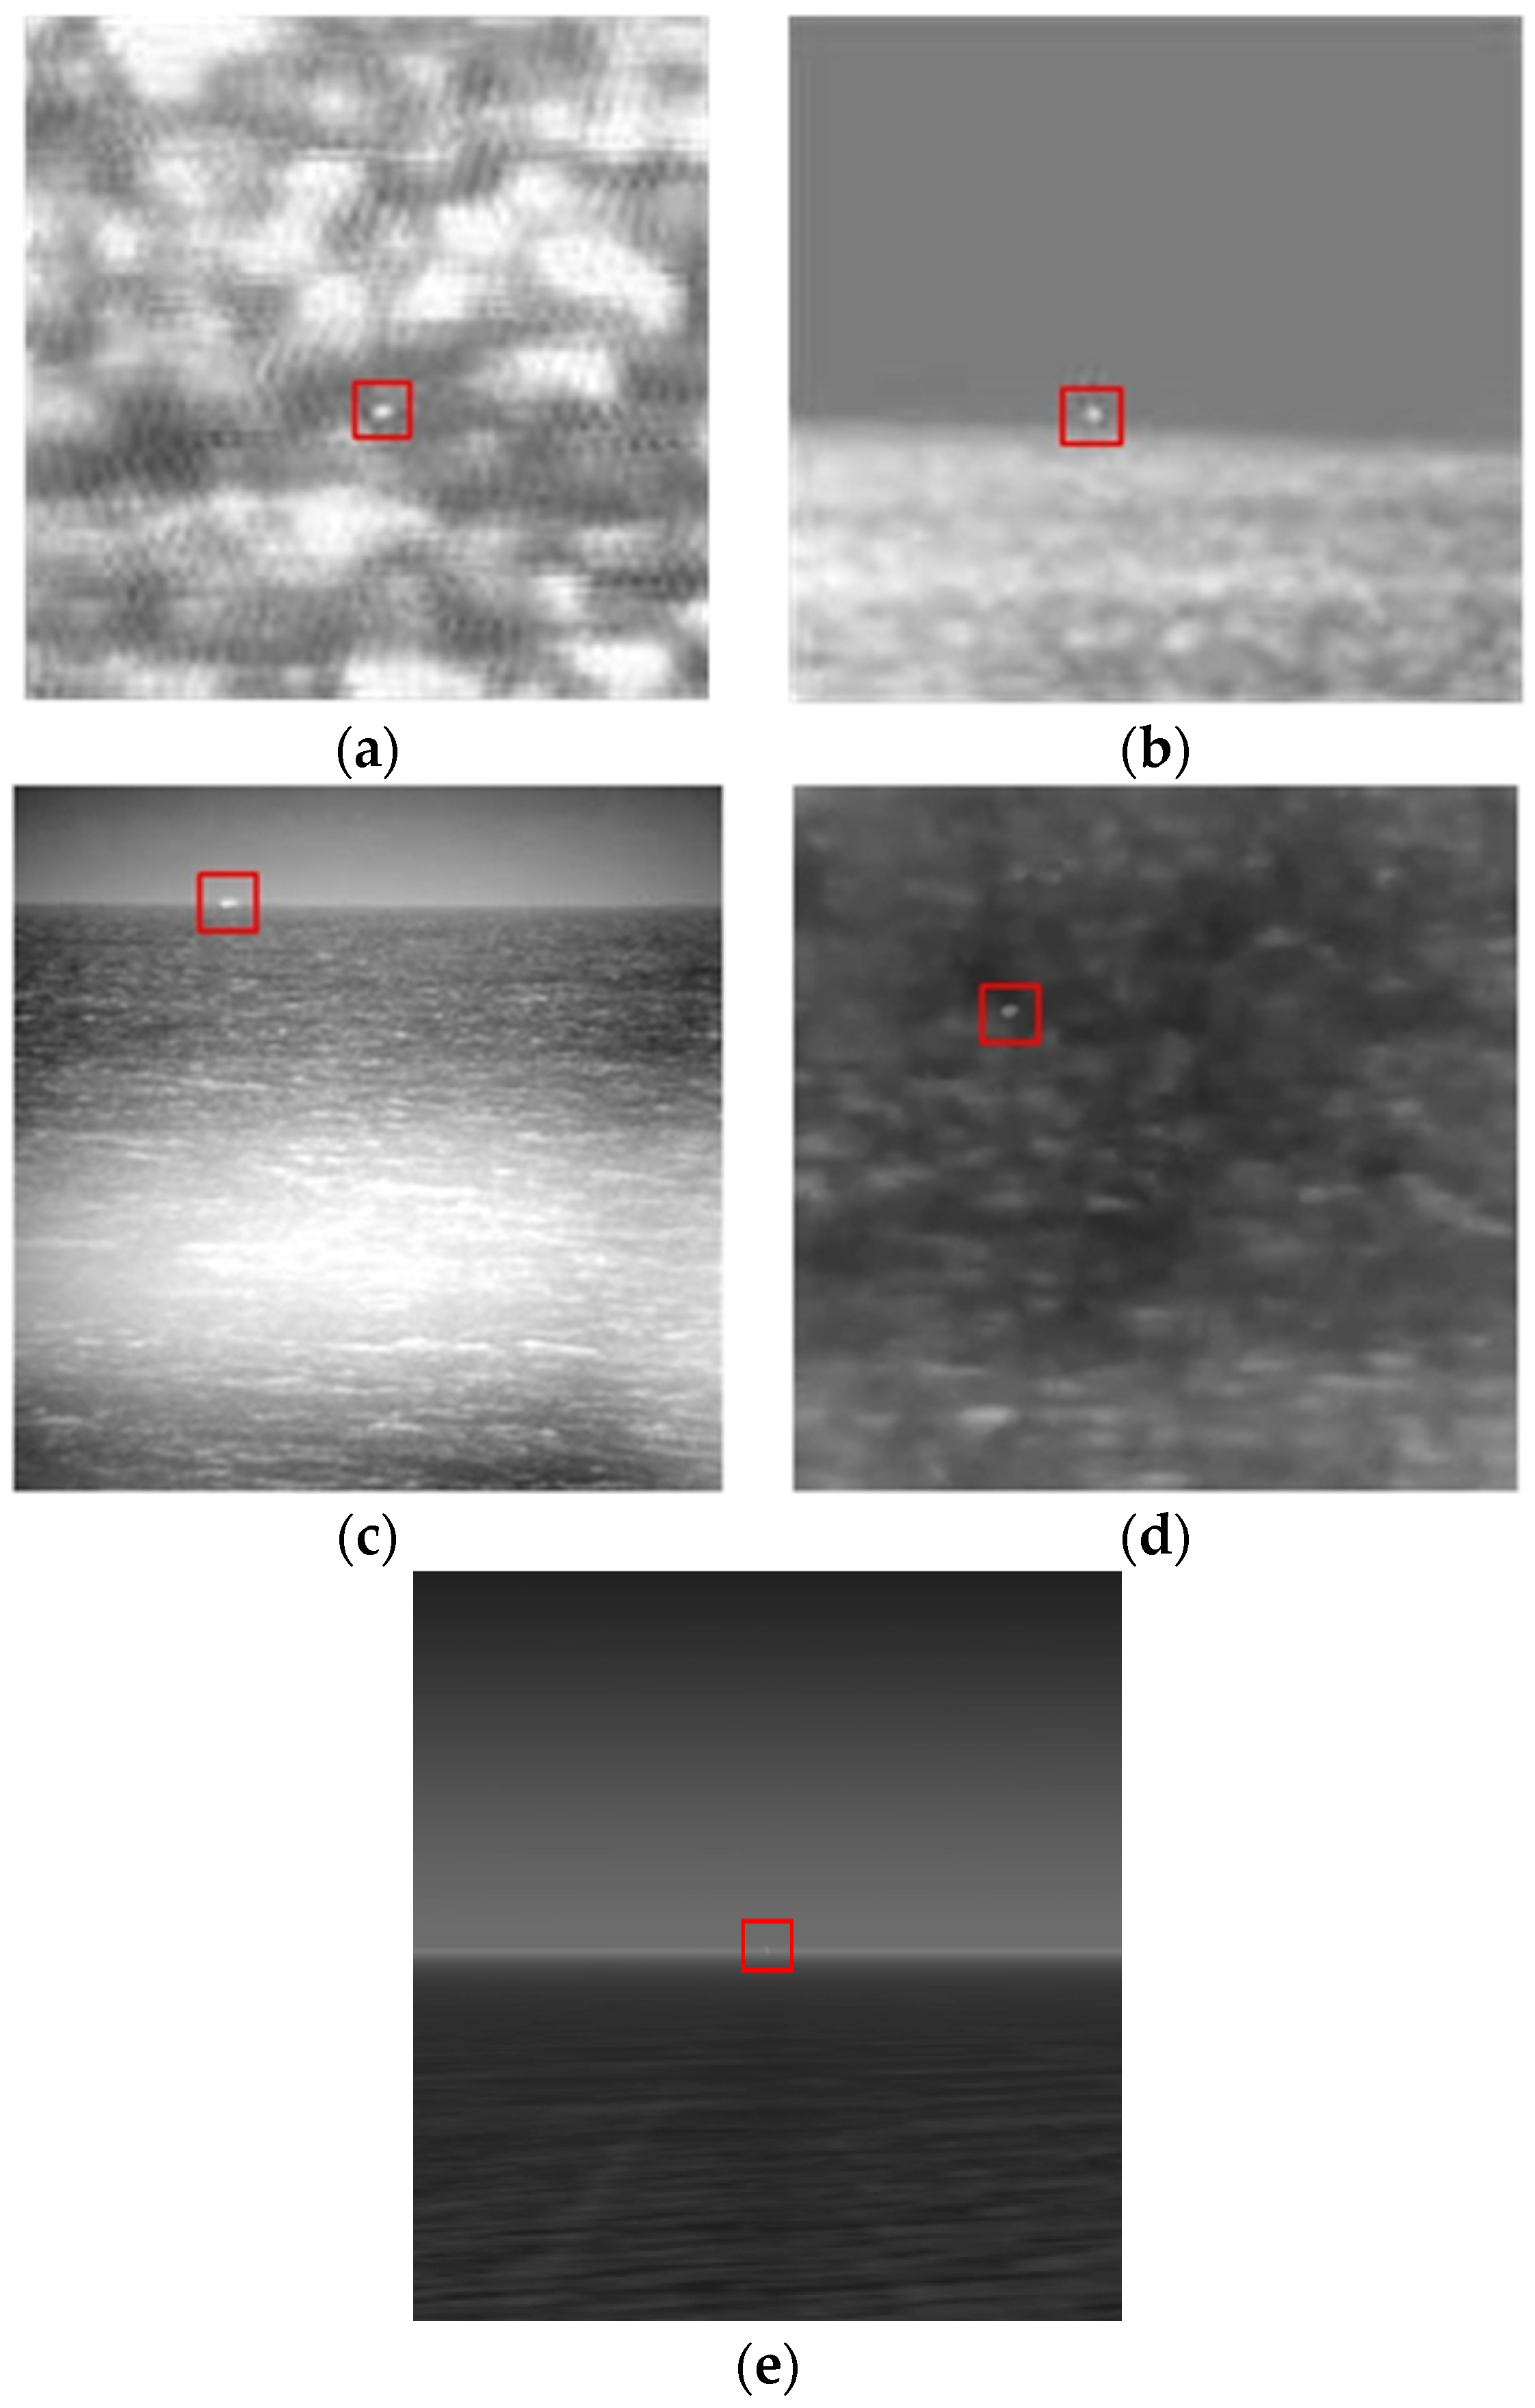
3.1.1. Test Dataset

The test dataset is composed of five real infrared maritime image sequences full of sea glints. They are denoted as Sequences 1–5. Figure 6 shows the representative images of five sequences, and the small targets are marked by red rectangle boxes. Figure 6a shows small targets embedded in large chunks of bright fish scale-like sea clutters. Figure 6b,c,e show a scenario that small targets against a sea–sky background with lots of high-intensity sun glittering sea clutter. Figure 6d represents small targets submerged in strongly undulating sea clutter. The image resolutions are from 127 × 127 to 768 × 1024, and the pixels of target are from 9 to 32. There is only one small target in all the test sequences. The small target is located at the intersection of sea and sky in Sequence 2, Sequence 3, and Sequence 5. The signal-to-clutter ration (SCR) range of the targets in the test sequences is from 0.7029 to 4.3801. The detailed information of the test image sequences is listed in Table 1.

3.1.2. Metrics

To evaluate the performance of proposed method FGGCS, we adopt five commonly used metrics: signal-to-clutter ration (SCR), signal clutter ration gain (SCRG), background suppression factor (BSF), detection rate (DR) and false alarm rate (FAR).
SCR is adopted to express the difficulty of target detection.
S C R = | m t m b | σ b
where m t is the average gray value of the pixels in the target region, and m b and σ b are the average gray and standard deviation value g of the pixels in the surrounding background region except the target. A smaller SCR means that the corresponding target signal is weaker and the surrounding clutter is stronger. As a result, detecting the target becomes more challenging due to the stronger interference from the clutter.
SCRG and BSF are widely applied to evaluate the background clutter suppression performance, defined as
S C R G = S C R f S C R 0 + ε B S F = σ 0 σ f + ε
where S C R 0 and S C R f are the SCR values of targets in the original image and the filtered image, σ 0 and σ f are the standard deviations of background without and with image filtering, and ε is a small positive constant to prevent the denominator from being zero. A higher SCRG value indicates the target enhancement is better, and a higher BSF value expresses the background suppression level is significant.
To assess the effectiveness of background clutter suppression in a sequence of images, the average SCRG and average BSF metrics are utilized, defined as
S C R G ¯ = 1 N target i = 1 N target S C R G target ( i ) , B S F ¯ = 1 N f r a m e j = 1 N f r a m e B S F f r a m e ( j )
where Ntarget is total number of targets in a test sequence, SCRGtarget (i) denotes the SCRG value of the ith target, Nframe is the number of images contained in a test sequence, and BSFframe (j) denotes the BSF value of the jth frame.
Moreover, DR and FAR are utilized to quantitatively evaluate the performance of small-target detection algorithms, which can be computed as
D R = N T P N target F A R = P N F P P N i m a g e
where NTP is number of detected true targets, Ntarget is number of actual targets, PNFP is pixel number of detected false targets, and PNimage is pixel number of the test sequence image. The receiver operating characteristic (ROC) curve is usually used to assess the performance of a classifier. Small-target detection can be regarded as a binary classification event between background and target. The ROC curve is a chart of the DR value versus the FAR value to analyze the tradeoff between DR and FAR by setting different thresholds.

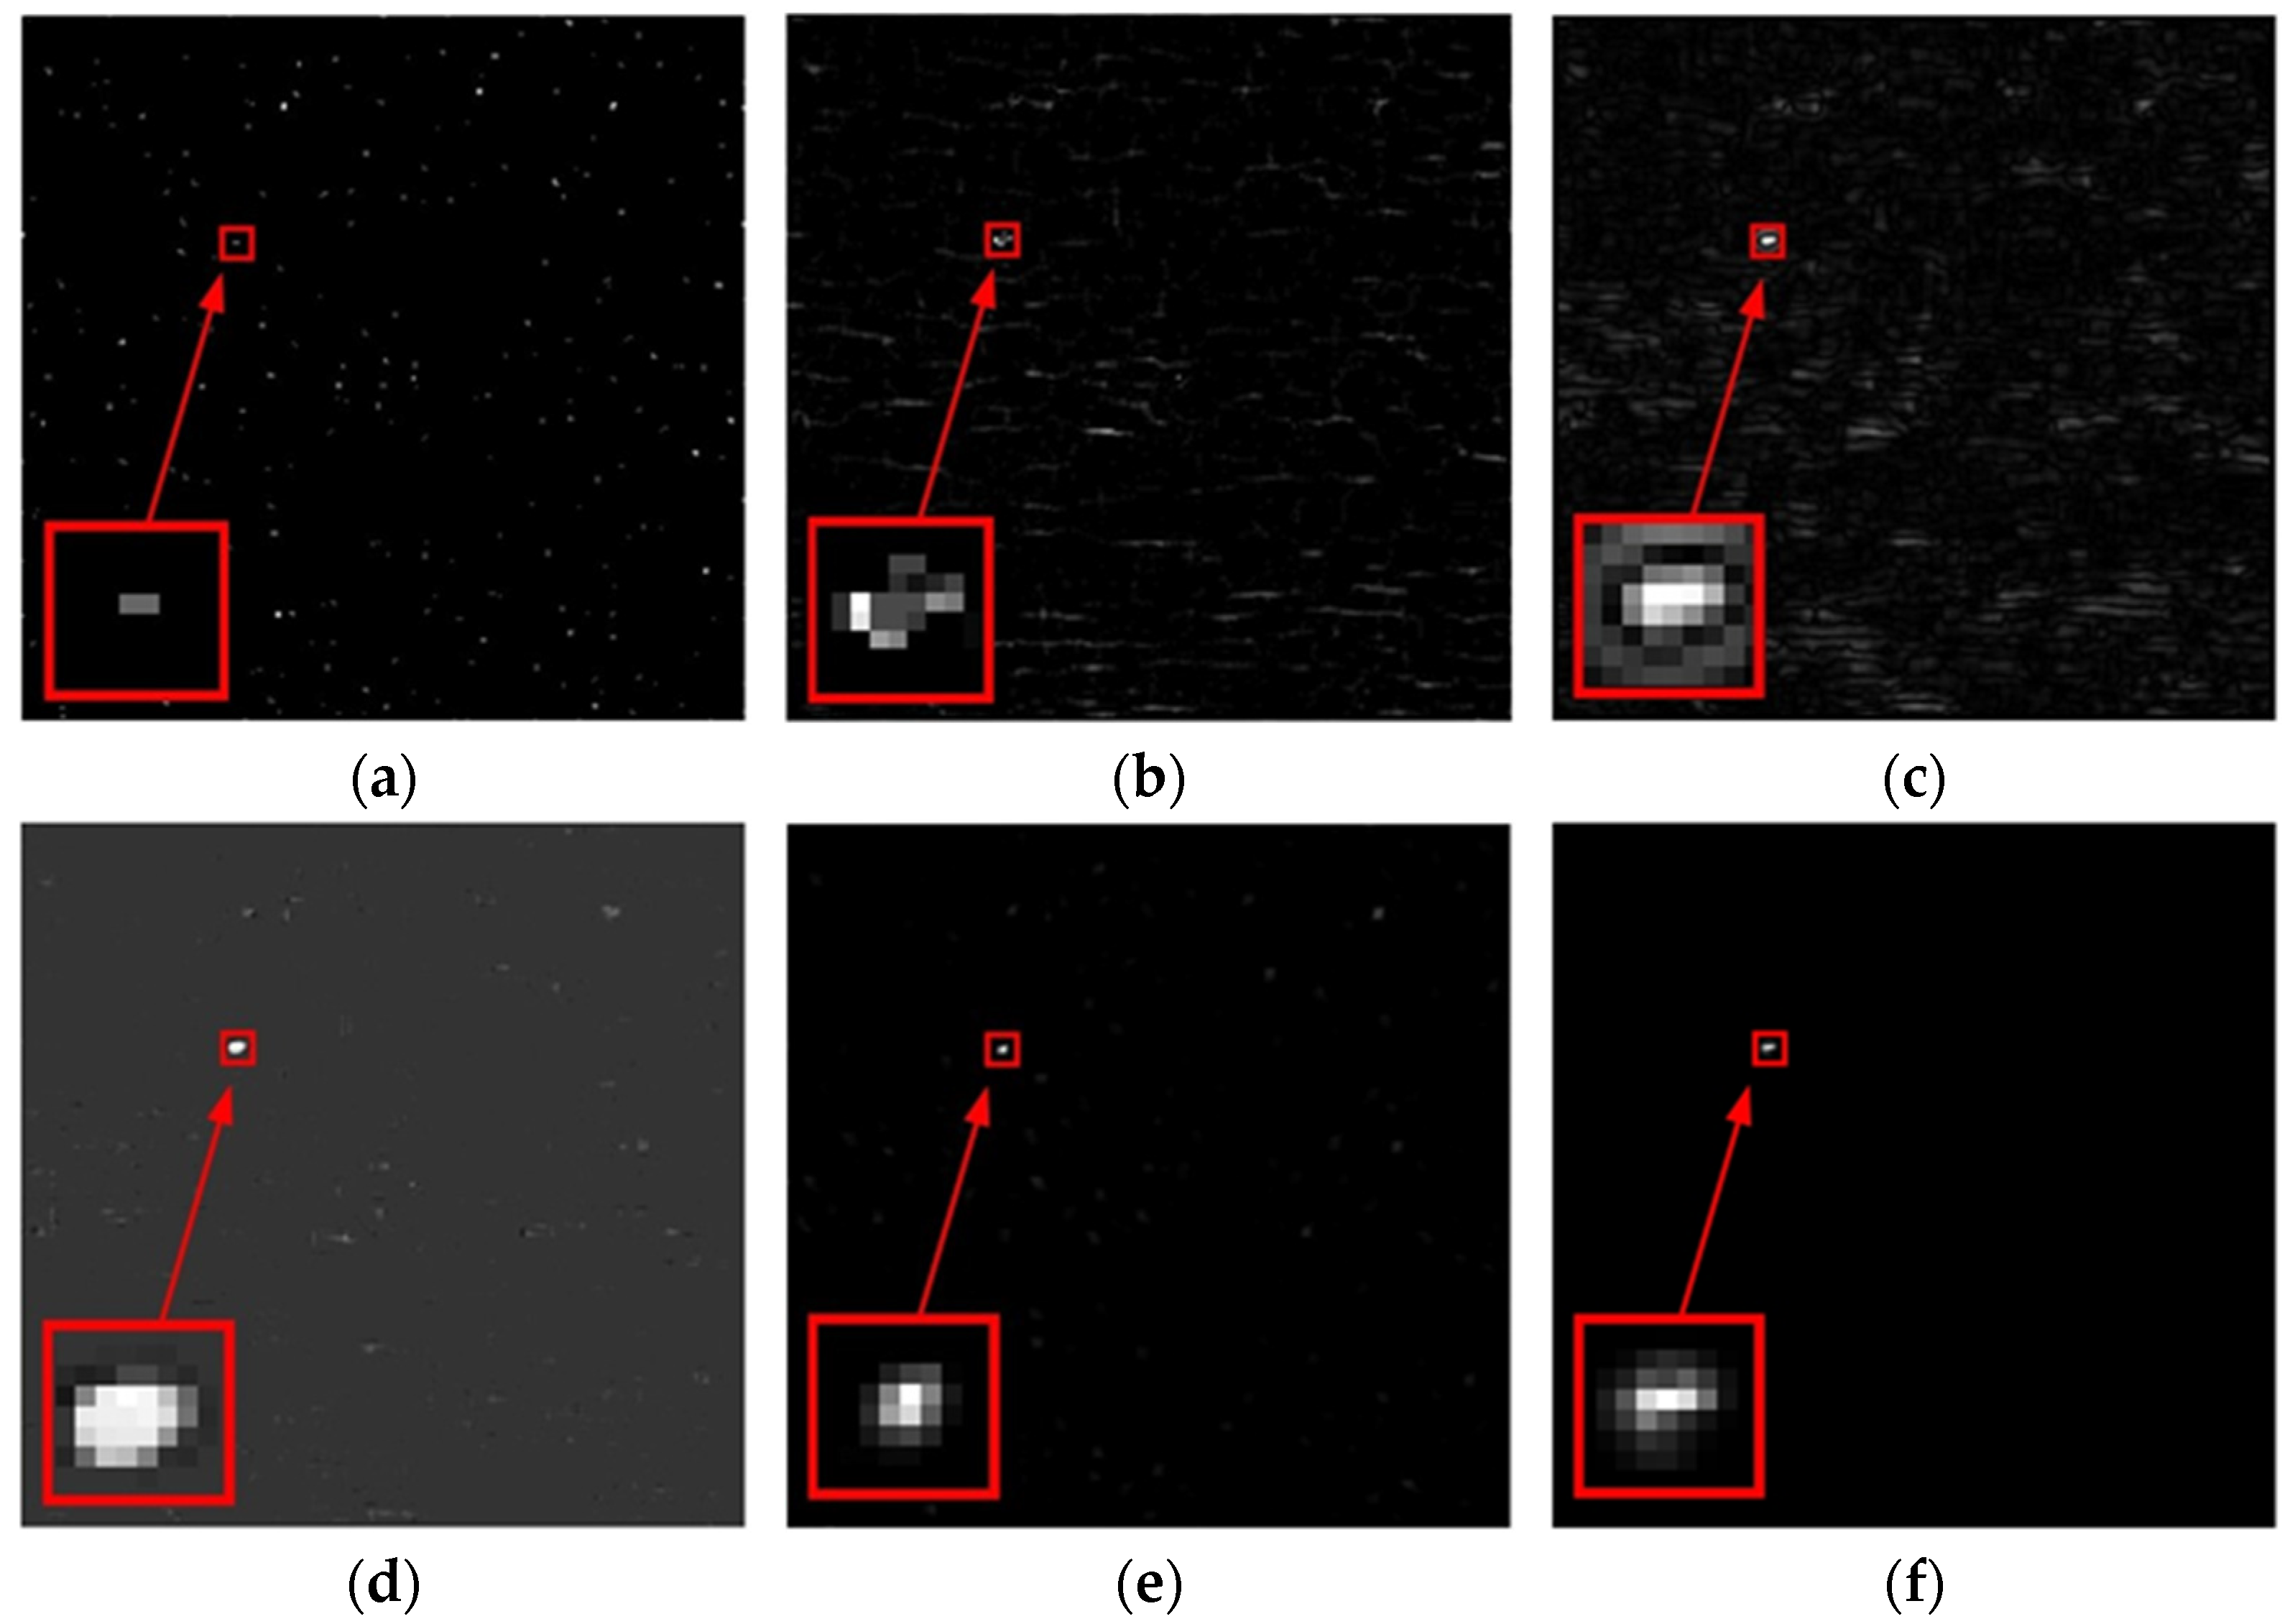
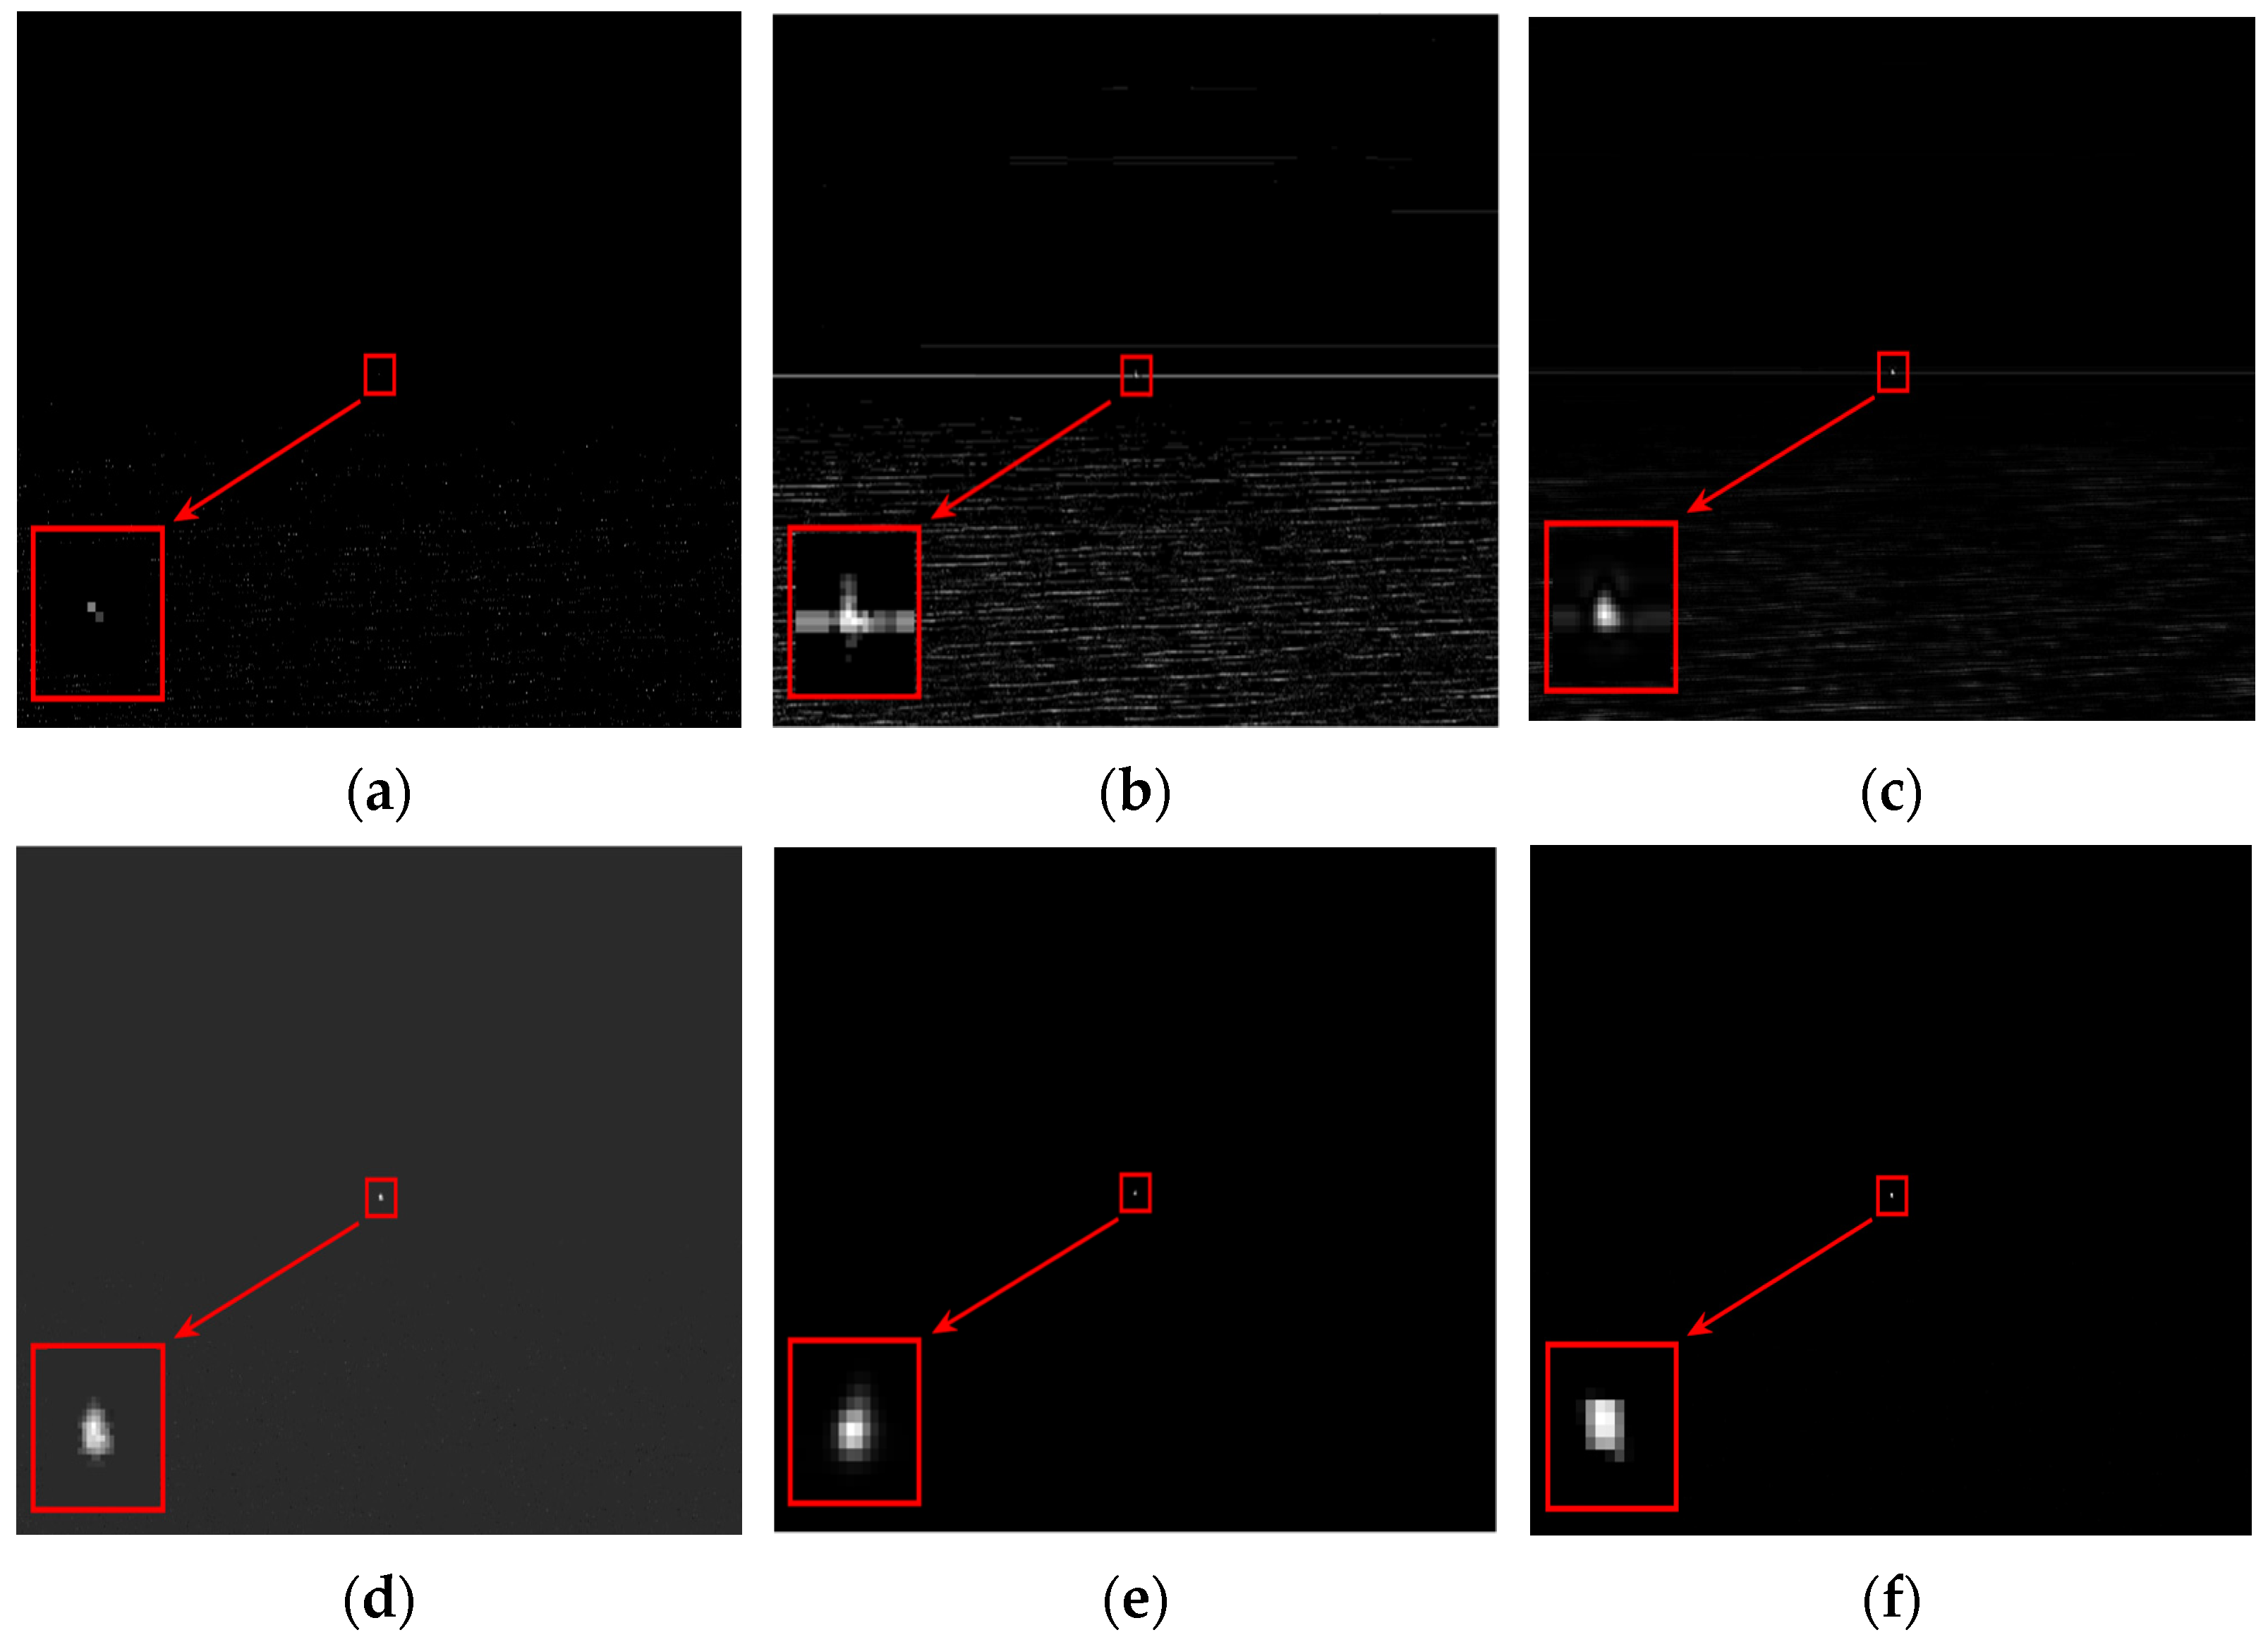
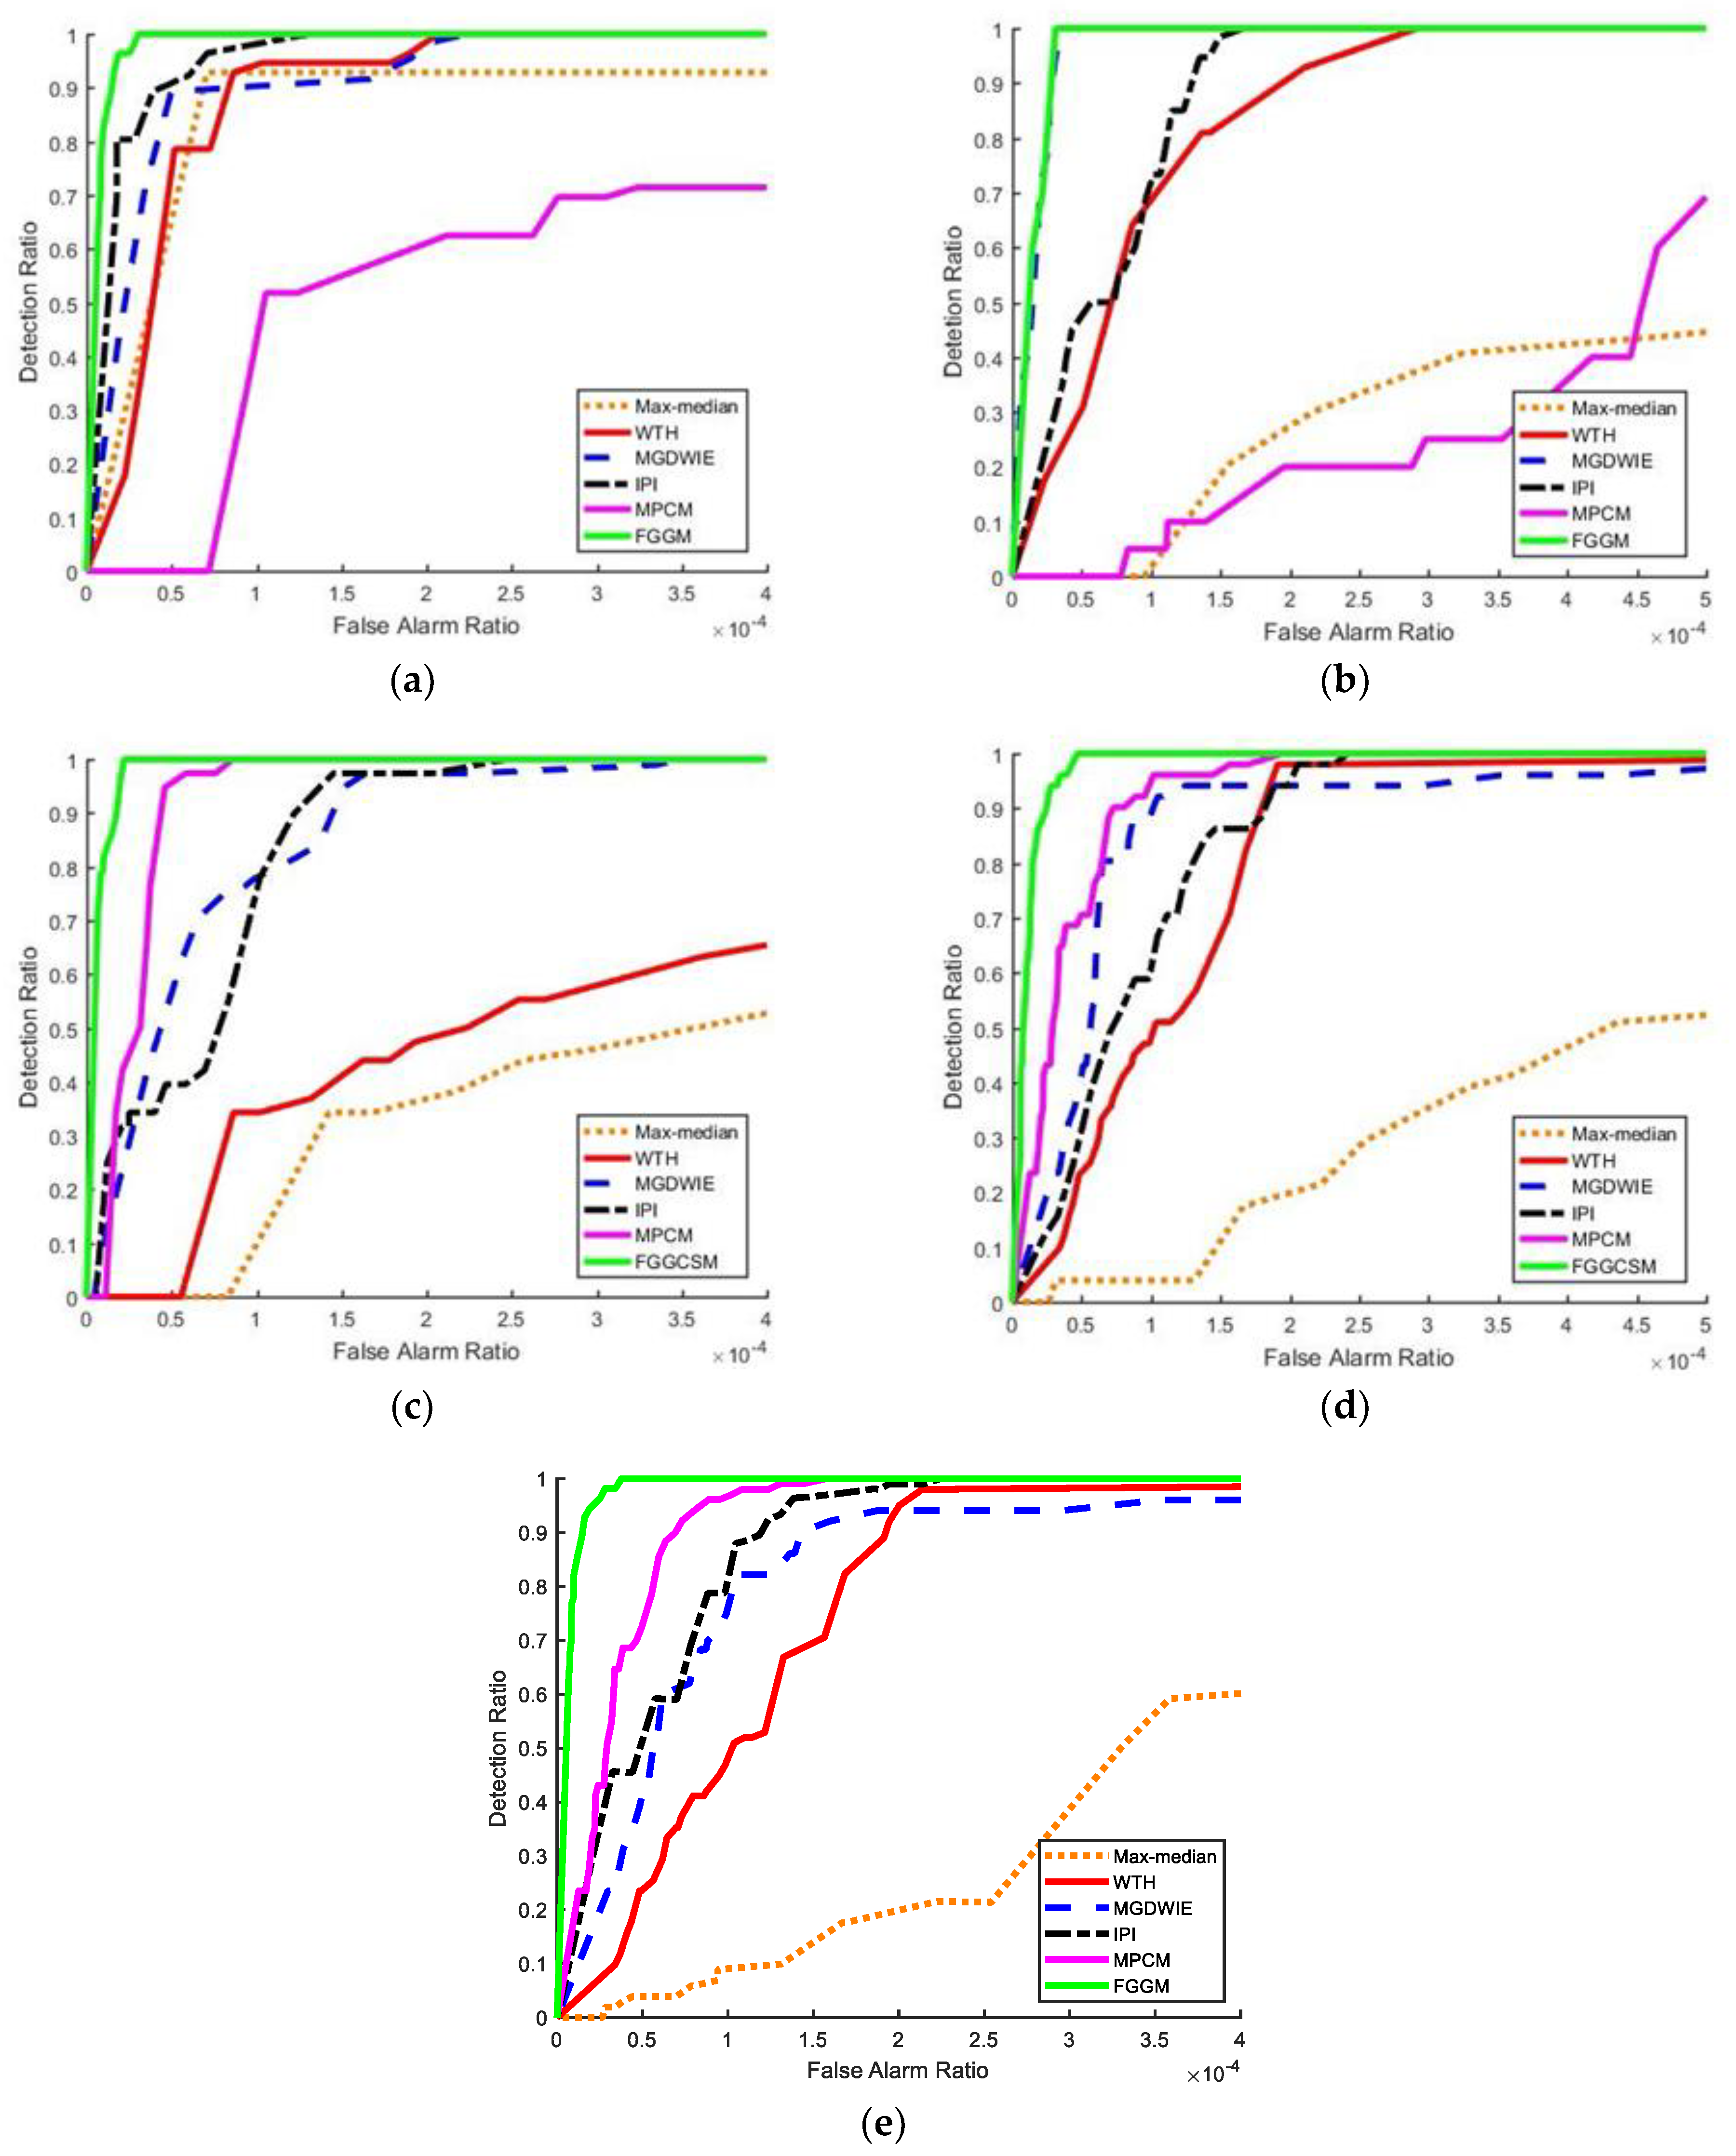
3.2. Detection Result and Disscussion

To demonstrate the effectiveness of the proposed method FGGCS in the presence of strong sea clutter backgrounds, five representative single-frame target detection methods are included in the comparison experiments. The max-median [7] and white top-hat (WTH) transform [8] are selected as they are widely used to assess new methods, whereas the multiscale gray difference weighted image entropy (MGDWIE) [17], infrared path-image model (IPI) [11], and multiscale path based contrast measure (MPCM) [19] are state-of-the-art methods.
Figure 7, Figure 8, Figure 9, Figure 10 and Figure 11 show the background suppression results of different algorithms on five test image sequences. The targets are marked with red rectangle boxes and enlarged for better observation. The max-median algorithm attempts to estimate and remove the sea glints caused by bright sunlight reflection through five directional median filters. Although part of the background is suppressed, a large number of false alarm points are generated, and the target region is relatively dim, as shown in Figure 7a, Figure 9a, Figure 10a and Figure 11a. Furthermore, the max-median overly suppress the targets of part of the test images, resulting in missed detection, as shown in Figure 8a.
The traditional WTH algorithm obtains the suppression result by subtracting the image of the high grayscale detail area eroded by the morphological opening operation from the original image, which produces a lot of residual clutter and lowers the amplitude value of the target below the clutter, as shown in Figure 7b, Figure 8b, Figure 9b and Figure 10b. Additionally, the highlighted structure in the center of the target area may be compromised, as shown in Figure 10b. Furthermore, the sea–sky line has been enhanced as a false alarm in Figure 11b.
The MGDWIE algorithm combines the information of the gray difference and image entropy to describe the dissimilarity between the target area and the surrounding neighborhood. However, it overlooks the fact that highlighted sea glint edges also exhibit dissimilarity with the background. As a result, there is a significant amount of clutter residue present at strong clutter edges, as shown in Figure 7c, Figure 8c, Figure 9c and Figure 10c.
The IPI model reconstructs the small target with sparse components from the background, but when the intricate high-intensity sea clutter is mixed with the target signal, the sea clutter sea clutter will be erroneously identified as the target, resulting in a large amount of noise residue, as Figure 7d, Figure 8d and Figure 9d depict.
MPCM adds the direction information of the neighborhood sub-blocks in the local contrast measurement, resulting in significantly lower clutter residue in the results of Sequence 3, Sequence 4, and Sequence 5 compared to the max-median, WTH, MGDWIE, and IPI algorithms, as shown in Figure 9e, Figure 10e and Figure 11e. However, when the target is embedded in the background with intense sun glints, the high-intensity clutter seriously affects the detection performance of MPCM. Furthermore, the intensity of the residual clutter in these scenarios is higher than that of the target, as shown in Figure 7e and Figure 8e.
It can be seen from Figure 7f, Figure 8f, Figure 9f, Figure 10f and Figure 11f that FGGCS can effectively suppress the background and enhance the contrast of the target area, even in challenging conditions with strong sunlight flickering sea clutter backgrounds. This improvement significantly simplifies the process of distinguishing between the background and the target in infrared images. This approach could potentially lead to significant advancements in the field of infrared image analysis.
Table 2 and Table 3 presents the experimental results of six methods on the five test sequences containing sea glint clutter. The maximum S C R G ¯ or B S F ¯ values of each test sequence are highlighted in bold. Our model FGGCS on the test sequences containing sea glint clutter outperforms the existing infrared small-target detection methods. Regarding details, our model ranks first in the S C R G ¯ metrics for Sequences 1–3 and Sequence 5, and second for Sequence 4 as shown in Table 2. Regarding Sequence 4, the values of IPI, MPCM, and FGGCS are very close, with FGGCS’s value being only 0.4135 lower than the maximum value. Whereas our model ranks first in the B S F ¯ metrics for Sequences 1–5 as shown in Table 3, which quantitatively indicates that FGGCS has the best background suppression effect. The comprehensive analysis shows that the proposed FGGCS clutter suppression method, which is designed for background target separation based on FGGCSM, exhibits strong applicability for detecting and recognizing small targets within complex solar scintillation sea clutter backgrounds.
Figure 12 shows ROC curves of different methods on the five test sequences containing solar scintillation sea clutter. The ROC curve of MPCM is at a relatively low level in Sequence 1 and 2, with the starting point of the curve deviating from the origin of coordinates, whereas the ROC curves of the max-median, WTH, MGDWIE, and IPI algorithms fluctuate greatly in each test sequence and have poor stability. Figure 12 shows that the proposed target detection method FGGCS consistently achieves higher detection rates than the comparison algorithms at the same false alarm rate across multiple scenarios. Moreover, the algorithm demonstrates a relatively stable performance across these scenarios. These findings highlight the robustness and accuracy of the FGGCSM-based detection method, further confirming its potential for clutter suppression and target enhancement in scenarios involving fluctuating sea surfaces.

4. Conclusions

The detection of a small target in an infrared image becomes challenging when it is submerged in noise and sea clutter, as these factors significantly degrade the performance of target detection. To address these challenges, we proposed a novel and effective detection scheme called FGGCS, which made use of the differences between the target and the surrounding background in intensity and gradient. Firstly, HCM is designed by using a 2D-DoG filter and eigenvalue harmonic mean of the structure tensor to highlight high-contrast regions of interest by leveraging the property that Gaussian-like small targets are brighter than their local surroundings, which leads to improved visibility of these targets in infrared images. Secondly, LGDM is designed by analyzing the difference in the gradient direction between a isotropic small target and the background edge in the gradient vector field, which effectively distinguishes isotropic small targets from background edges with local gradients in a specific direction. Subsequently, FGGCSM is designed by integrating HCM and LGDM to effectively enhance the target and suppress clutter from the sea background. Finally, an adaptive constant false alarm threshold is adopted to extract the targets. On all five real infrared maritime image sequences full of sea glint, FGGCS achieves the best overall performance compared to existing models, improving the accuracy of small-target detection in complex maritime backgrounds by enhancing SCRG and BSF.
There are often islands in maritime scenes in addition to sea clutter. The island clutter is often higher in complexity than sea clutter, and the edge gradient model proposed in this paper has difficulty in accurately characterizing island clutter, which would increase the false alarms and reduce the small-target detection performance. Our future study will focus on infrared target detection in island clutter environments to verify the adaptability of the proposed method.

Author Contributions

Conceptualization, W.W. and Z.L.; methodology, W.W. and Z.L.; software, W.W.; validation, Z.L.; investigation, Z.L. and A.S.; formal analysis, W.W., Z.L. and A.S.; writing—original draft preparation, W.W.; writing—review and editing, W.W., Z.L. and A.S. All authors have read and agreed to the published version of the manuscript.

Funding

This research was partially supported by the National Natural Science Foundation of China under Grant No. 61675036, and the Equipment Pre-Research Fund under Grant No. 6140415020312.

Data Availability Statement

The raw data supporting the conclusions of this article will be made available by the authors on request.

Conflicts of Interest

The authors declare no conflicts of interest.

References

  1. Dong, L.; Wang, B.; Zhao, M.; Xu, W. Robust Infrared Maritime Target Detection Based on Visual Attention and Spatiotemporal Filtering. IEEE Trans. Geosci. Remote Sens. 2017, 55, 3037–3050. [Google Scholar] [CrossRef]
  2. Prasad, D.K.; Rajan, D.; Rachmawati, L.; Rajabally, E. Video Processing from Electro-Optical Sensors for Object Detection and Tracking in a Maritime Environment: A Survey. IEEE Trans. Intell. Transp. Syst. 2017, 18, 1993–2016. [Google Scholar] [CrossRef]
  3. Wu, J.; Mao, S.; Wang, X.; Zhang, T. Ship target detection and tracking in cluttered infrared imagery. Opt. Eng. 2011, 50, 057207. [Google Scholar] [CrossRef]
  4. Xu, X.W.; Zhang, X.L.; Zhang, T.W. Lite-YOLOv5: A Lightweight Deep Learning Detector for On-Board Ship Detection in Large-Scene Sentinel-1 SAR Images. Remote Sens. 2022, 14, 1018. [Google Scholar] [CrossRef]
  5. Xu, X.W.; Zhang, X.L.; Shao, Z.K.; Shi, J.; Wei, S.J.; Zhang, T.W.; Zeng, T.J. A Group-Wise Feature Enhancement-and-Fusion Network with Dual-Polarization Feature Enrichment for SAR Ship Detection. Remote Sens. 2022, 14, 5276. [Google Scholar] [CrossRef]
  6. Zhao, B.; Xiao, S.; Lu, H. Spatial-temporal local contrast for moving point target detection in space-based infrared imaging system. Infrared Phys. Technol. 2018, 95, 53–60. [Google Scholar] [CrossRef]
  7. Deshpande, S.D.; Er, M.H.; Venkateswarlu, R.; Chan, P. Max-mean and max-median filters for detection of small targets. In Proceedings of the SPIE Signal and Data Processing of Small Targets, Denver, CO, USA, 20–22 July 1999; pp. 74–84. [Google Scholar]
  8. Zhang, F.; Li, C.; Shi, L. Detecting and tracking dim moving point target in IR image sequence. Infrared Phys. Technol. 2005, 46, 323–328. [Google Scholar] [CrossRef]
  9. Bai, X.; Zhou, F. Infrared small target enhancement and detection based on modified top-hat transformations. Comput. Electr. Eng. 2010, 36, 1193–1201. [Google Scholar] [CrossRef]
  10. Cao, Y.; Liu, R.M.; Yang, J. Small Target Detection Using Two-Dimensional Least Mean Square (TDLMS) Filter Based on Neighborhood Analysis. Int. J. Infrared Millim. Waves 2008, 29, 188–200. [Google Scholar] [CrossRef]
  11. Gao, C.; Meng, D.; Yang, Y. Infrared Patch-Image Model for Small Target Detection in a Single Image. IEEE Trans. Image Process. 2013, 22, 4996–5009. [Google Scholar] [CrossRef] [PubMed]
  12. Dai, Y.; Wu, Y. Reweighted infrared patch-tensor model with both nonlocal and local priors for single-frame small target detection. IEEE J. Sel. Top. Appl. Earth Obs. Remote Sens. 2017, 10, 3752–3767. [Google Scholar] [CrossRef]
  13. Gao, Z.; Dai, J.; Xie, C. Dim and small target detection based on feature mapping neural networks. J. Vis. Commun. Image Represent. 2019, 62, 206–216. [Google Scholar] [CrossRef]
  14. Wang, N.; Li, B.; Wei, X.; Wang, Y.; Yan, H. Ship detection in spaceborne infrared image based on lightweight CNN and multisource feature cascade decision. IEEE Trans. Geosci. Remote Sens. 2021, 59, 4324–4339. [Google Scholar] [CrossRef]
  15. Ma, J.; Tang, L.; Xu, M.; Zhang, H.; Xiao, G. STDFusionNet: An infrared and visible image fusion network based on salient target detection. IEEE Trans. Instrum. Measure. 2021, 70, 1–13. [Google Scholar] [CrossRef]
  16. Du, J.; Lu, H.; Hu, M.; Zhang, L.; Shen, X. CNN-based infrared dim small target detection algorithm using target-oriented shallow-deep features and effective small anchor. IET Image Process 2021, 15, 1–15. [Google Scholar] [CrossRef]
  17. Deng, H.; Sun, X.; Liu, M. Infrared small-target detection using multiscale gray difference weighted image entropy. IEEE Trans. Aerosp. Electron. Syst. 2016, 52, 60–72. [Google Scholar] [CrossRef]
  18. Chen, C.; Li, H.; Wei, Y. A Local Contrast Method for Small Infrared Target Detection. IEEE Trans. Geosci. Remote Sens. 2013, 52, 574–581. [Google Scholar] [CrossRef]
  19. Wei, Y.; You, X.; Li, H. Multiscale patch-based contrast measure for small infrared target detection. Pattern Recognit. 2016, 58, 216–226. [Google Scholar] [CrossRef]
  20. Kim, S.; Lee, J. Scale invariant small target detection by optimizing signal-to-clutter ratio in heterogeneous background for infrared search and track. Pattern Recognit. 2012, 45, 393–406. [Google Scholar] [CrossRef]
  21. Liu, D.; Cao, L.; Li, Z. Infrared small target detection based on flux density and direction diversity in gradient vector field. IEEE J. Sel. Top. Appl. Earth Obs. Remote Sens. 2018, 11, 2528–2554. [Google Scholar] [CrossRef]
Figure 1. The flowchart of the proposed algorithm.
Remotesensing 16 01255 g001
Figure 2. Two-dimensional Gaussian spatial distribution.
Remotesensing 16 01255 g002
Figure 3. (a) Target image patch. (b) Sea clutter edge image patch. (c) IGVF of target. (d) IGVF of sea clutter edge.
Remotesensing 16 01255 g003
Figure 4. Gradient region partition map of target.
Remotesensing 16 01255 g004
Figure 5. (a) Template W1. (b) Template W2. (c) Template W3. (d) Template W4.
Remotesensing 16 01255 g005
Figure 6. The representative images: (a) 8th frame of Sequence 1. (b) 19th frame of Sequence 2. (c) 22th frame of Sequence 3. (d) 86th frame of Sequence 4. (e) 10th frame of Sequence 5.
Remotesensing 16 01255 g006
Figure 7. The background suppression saliency map of Figure 6a by different methods. (a) Max-median. (b) WTH. (c) MGDWIE. (d) IPI. (e) MPCM. (f) FGGCS.
Remotesensing 16 01255 g007
Figure 8. The background suppression saliency map of Figure 6b by different methods. (a) Max-median. (b) WTH. (c) MGDWIE. (d) IPI. (e) MPCM. (f) FGGCS.
Remotesensing 16 01255 g008
Figure 9. The background suppression saliency map of Figure 6c by different methods. (a) Max-median. (b) WTH. (c) MGDWIE. (d) IPI. (e) MPCM. (f) FGGCS.
Remotesensing 16 01255 g009
Figure 10. The background suppression saliency map of Figure 6d by different methods. (a) Max-median. (b) WTH. (c) MGDWIE. (d) IPI. (e) MPCM. (f) FGGCS.
Remotesensing 16 01255 g010
Figure 11. The background suppression saliency map of Figure 6e by different methods. (a) Max-median. (b) WTH. (c) MGDWIE. (d) IPI. (e) MPCM. (f) FGGCS.
Remotesensing 16 01255 g011
Figure 12. The ROC curves of different methods under five scenes with sea glint clutter. (a) Sequence 1. (b) Sequence 2. (c) Sequence 3. (d) Sequence 4. (e) Sequence 5.
Remotesensing 16 01255 g012
Table 1. Detailed information of the test image sequences.
Sequence
Number
Image
Resolution
Target
Number
Target AreaMinimum
SCR
Maximum
SCR
1127 × 12719∼200.70291.9217
2127 × 12719∼161.22903.0872
3256 × 256112∼301.98843.4885
4246 × 246116∼301.91784.3801
5768 × 1024118∼321.01231.4575
Table 2. The S C R G ¯ with various methods under the background of five sea glint clutters.
MethodSequence 1Sequence 2Sequence 3Sequence 4Sequence 5
Max-median1.51561.00091.12321.13654.1365
WTH3.194325.29212.51972.73833.2121
MGDWIE6.437817.96811.87512.93155.7624
IPI7.775922.054810.471916.0526 *17.1025
MPCM15.1403145.590728.571715.554318.5409
FGGCSM24.6023 *224.5436 *34.8075 *15.639120.1227 *
* The maximum S C R G ¯ values of each test sequence.
Table 3. The B S F ¯ with various methods under the background of five sea glint clutters.
Method Sequence 1Sequence 2Sequence 3Sequence 4 Sequence 5
Max-median3.11294.73365.02722.521512.6923
WTH2.20782.49482.82812.34816.9023
MGDWIE6.03617.89058.05368.317716.7334
IPI6.44819.470116.927212.641920.1245
MPCM3.65024.731320.371511.621823.7876
FGGCSM14.2953 *17.2398 *42.6285 *23.9201 *26.5823 *
* The maximum B S F ¯ values of each test sequence.
Disclaimer/Publisher’s Note: The statements, opinions and data contained in all publications are solely those of the individual author(s) and contributor(s) and not of MDPI and/or the editor(s). MDPI and/or the editor(s) disclaim responsibility for any injury to people or property resulting from any ideas, methods, instructions or products referred to in the content.

