1. Introduction
Land use and land cover are considered central variables to understand the physical environment and its interactions with anthropogenic activity. Mapping land use and land cover is mandatory for a wide set of purposes, being used as input in several scientific fields and policy purposes, ranging from local to global extents. For example, Land Use Land Cover (LULC) maps are used as input for climate change monitoring [
1,
2] and forecast [
3], population mapping [
4], urban planning [
5], and institutional guideline documents [
6], among others [
7,
8].
Satellite imagery systems are often used to map LULC given both their high revisit capability and their large areal coverage. Satellite constellations, such as Landsat and Sentinel, further eased the production of LULC maps by making the large bulk of global earth observation images available to the general public. These maps are often produced with supervised classification methods, where a set of training data deemed representative of the target classes of the map is collected and used to train a classifier. A central part of the map generation process is the thematic accuracy assessment [
9,
10], in which the correspondence between the map and a “gold quality” reference database is assessed and reported.
Several map producers have been releasing regional and global LULC maps over the last years. For example, GlobeLand30 [
11] mapped 10 LULC classes globally at a 30 m spatial resolution, using Landsat data and data collected using the satellites HJ-1 (China Environment and Disaster Reduction Satellite) and GD-1 (China High Resolution Satellite). However, only more recently was it practical to deliver such global LULC maps at a 10 m spatial resolution given the European Space Agency (ESA) Sentinel-2 satellite constellation. Finer Resolution Observation and Monitoring—Global Land Cover (FROM-GLC) [
12] was the first global map produced with a 10 m spatial resolution, having as the reference year 2017 and produced with Landsat and Sentinel-2 imagery. Sentinel-2 Global Land Cover (S2GLC) [
13] is also mapping LULC for most of the European countries at a 10 m spatial resolution using only Sentinel-2 imagery. Another global LULC map with a 10 m spatial resolution is the ESRI 2020 Land Cover, which is totally based on Sentinel-2 imagery and maps 10 LULC classes for the year 2020 [
14]. A 2022 version of the product is already available. The Norwegian Institute for Nature Research also released in 2018 a yearly updatable global LULC map [
15]. Recently made available in late 2021, the ESA WorldCover 2020 (WC20) product [
16] was released by the European Space Agency and aims at globally mapping 11 land cover classes also at a 10 m resolution and is based on both Sentinel-1 and Sentinel-2 imagery for the reference year 2020. A new version for 2021 is now available. The Copernicus program is starting a new series of LULC products for Europe called CLC+ (the next generation of the CORINE Land Cover). These products include the CLC+ Backbone (CLC+ BB) product, which includes a raster map with 10 m spatial resolution and 11 LULC classes, now available for the year 2018. These global and regional maps are often made public alongside a validation report, e.g., [
17], which contains overall accuracy and user’s and producer’s accuracy for each class but often considers the overall extent of the final product (i.e., global and continental wide accuracy assessment).
While such efforts enable a synoptic view of the trends regarding LULC over regions/globe the different products are often difficult to compare due to differences in their technical specification, which include the classes’ definitions, minimum mapping unit and classification approaches used. Besides this, these products may not be optimal for several applications that have a more localized focus. For example, more detailed information in some land use or land cover classes may be needed, requiring smaller minimum mapping units, or classification approaches that are able to identify particular characteristics, such as the continuity of linear features. Another issue is the fact that global and continental LULC maps may not represent specific types of landscape occurring within countries and this may not be properly represented in the training used to generate the classifications [
8,
18]. To this regard, national mapping agencies aim at providing not only LULC maps that are focused on the needs for each country, often with more thematic detail, but at the same time focus on improving the classification of country specific landscapes.
Given the wide set of products currently available, either from regional/global map producers or national mapping agencies, a given user is often confronted with the decision regarding which of the maps to use within in its own application. Moreover, given that the thematic accuracy of the products is usually assessed globally and/or for each continent, such an accuracy assessment may not be reliable for smaller areas with particular characteristics, hence falling short when the objective is to use it for a specific country [
19]. In this way, it is mandatory not only to assess the thematic quality of the several products for specific study areas, but also to make a comparison between these maps and corresponding metrics in a bid to aid a potential user.
Several thematic accuracy assessment contributions exist, often focusing on a single LULC product [
20,
21,
22,
23] with no comparative analysis with other datasets for the same study area. Other authors made a comparison of products at a regional [
24,
25] or global scale. For example, Bie et al. [
24] compared three harmonized products obtained from three different 10 m spatial resolution global products considering nine classes. Venter et al. [
26] compared three harmonized products at a global and regional scale considering nine harmonized classes, extracted from three global 10 m resolution maps (Dynamic World, World Cover and ESRI Land Cover). Zheng et al. [
27] made a comparison of seven 10 m and 30 m spatial resolution products for impervious surfaces in a region of China. Wang and Mountrakis [
28] compared harmonized versions with seven classes of eleven products with spatial resolutions of 1 km, 500 m, 30 m and 10 m for the conterminous United States of America. However, such comparisons have limitations: (1) they often perform a nomenclature harmonization, where the harmonized product is being validated instead of the original map [
24,
25,
28]; (2) they use already available reference data, which may raise limitations of either class representativeness in the reference database for all class or bias effects due to the considered sampling approach [
26]; or (3) only focusing on a single class for comparison purposes [
27]. Such limitations mostly arise from the effort needed to build a thematically detailed reference database that can be used to assess the accuracy of all maps, which is the most time and resource consuming aspect of the thematic accuracy assessment.
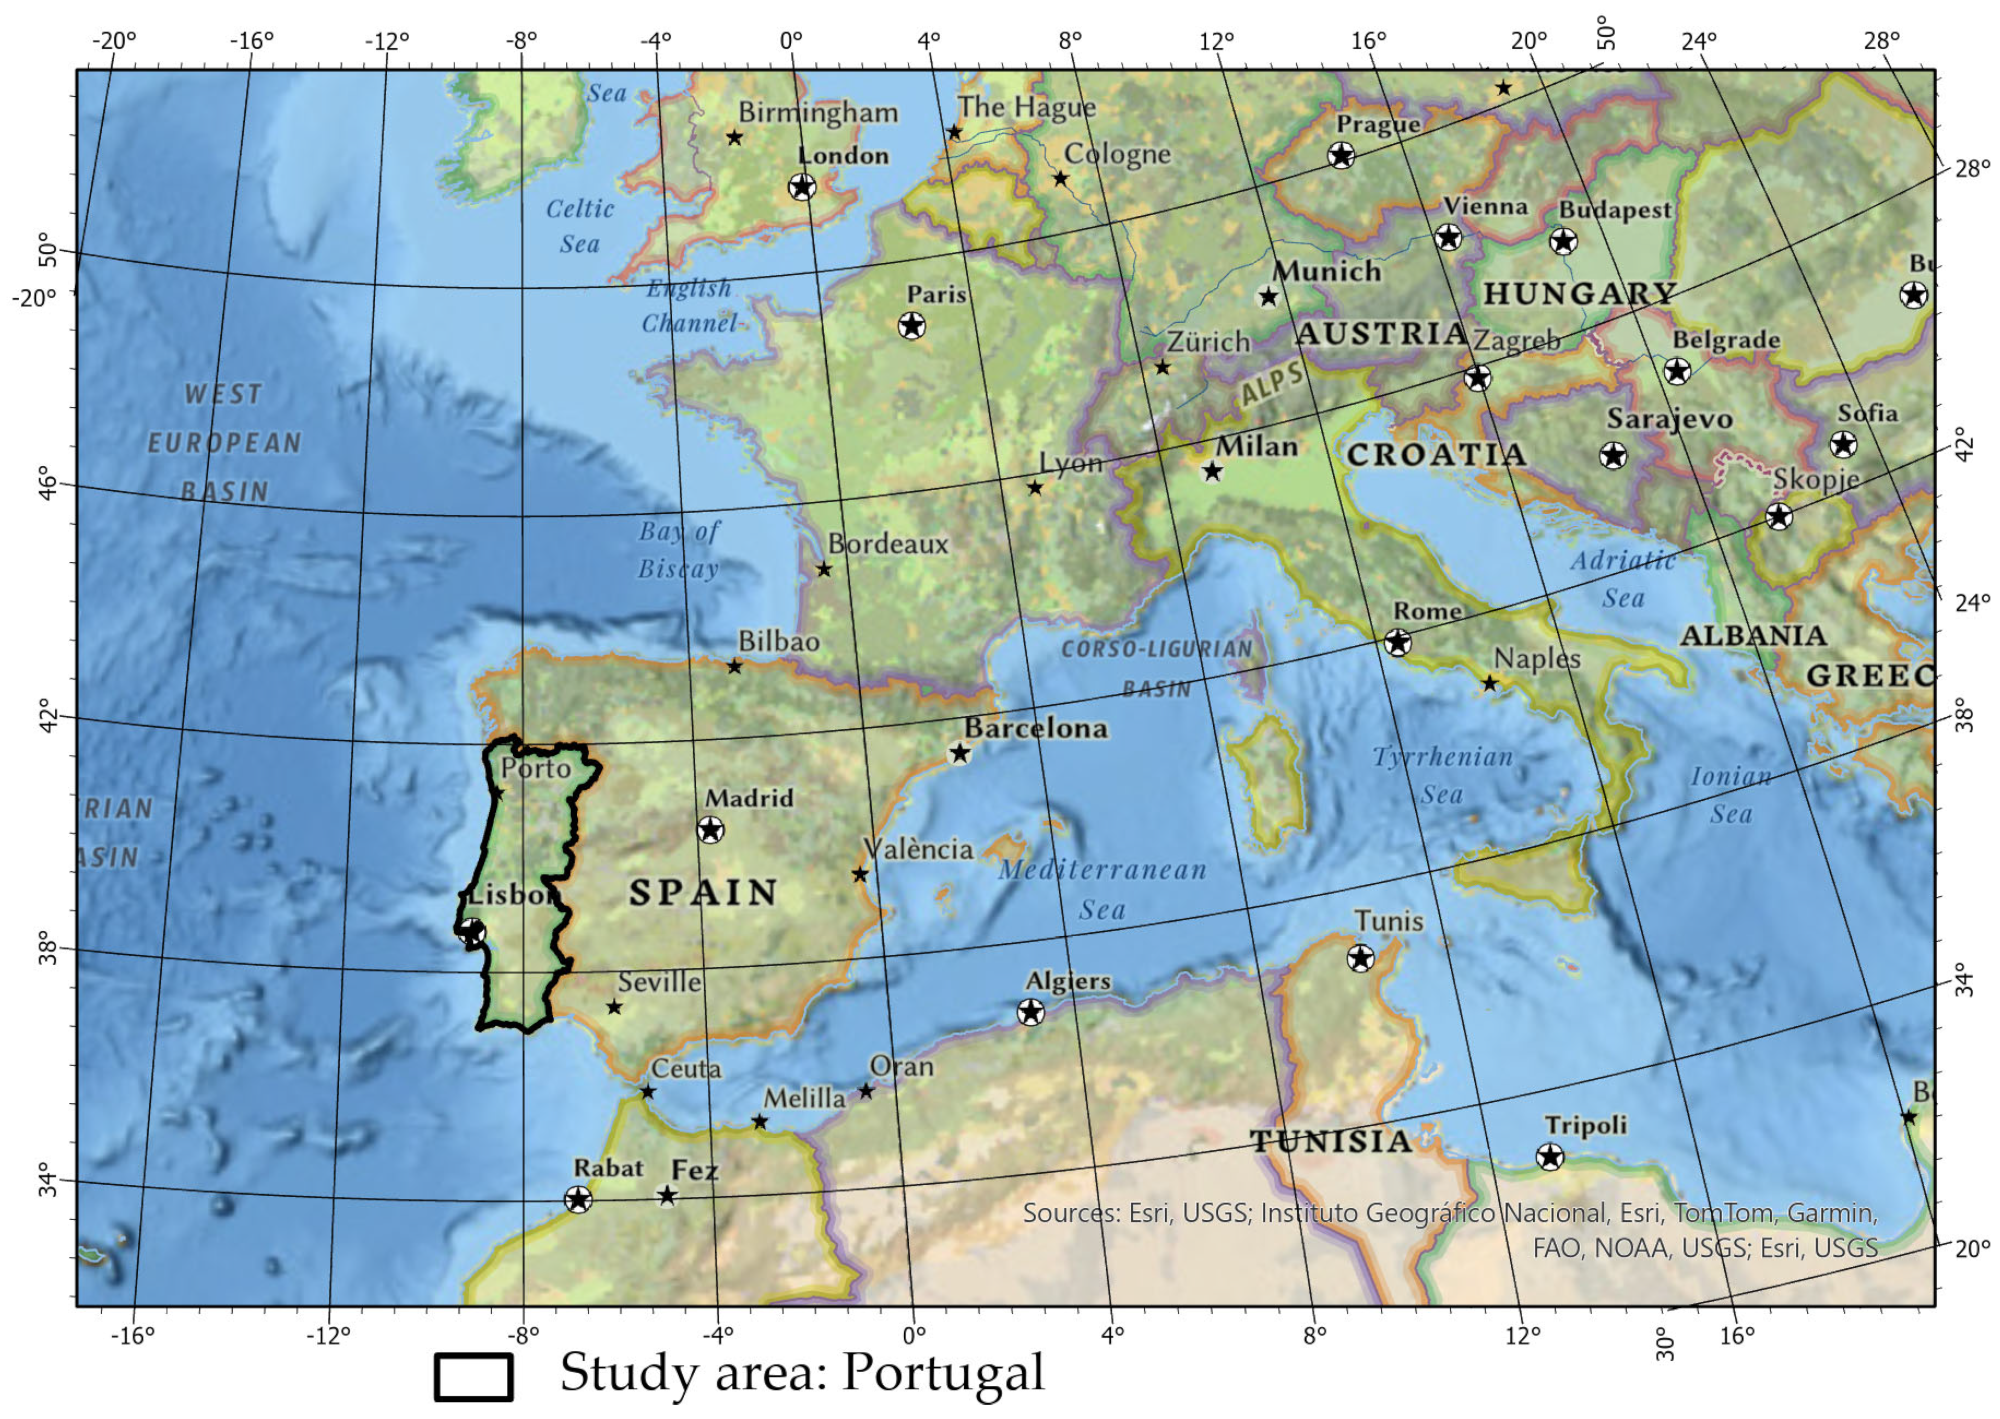
In this paper, we report the results of the thematic accuracy of six 10 m spatial resolution LULC products (global, continental and national) for the same study area: continental Portugal. The thematic accuracy assessment evaluates the following: (1) the original products and all their original classes, hence enabling a comparison between the quality of original products; (2) the accuracy of the harmonized maps obtained from the original products considering a harmonized nomenclature; (3) a direct comparison of the characteristics of the harmonized products.
The reference database used to validate the products was generated considering the good practices’ recommendations for accuracy assessment. To assure that reference database could be used to assess the thematic accuracy of all original products, a stratified random sample, e.g., [
29], was generated with strata extracted from existing ancillary data that provided enough detail to be mapped into the original classes of all products. This enabled the generation of a reference database independently of the products to validate, while overcoming the limitations of a simple random sample that would not provide enough sample units in the rare classes. In the response design phase, classes had to be used that could be mapped onto the original classes of all products. Therefore, nineteen classes were used in the reference database. Moreover, the considered methodology enables the quantification of the effect of the uncertainty in the selection of the “true class” for each sample unit, by selecting a primary and secondary class whenever necessary [
20,
21,
22,
23]. The accuracy indices were then computed using the accuracy estimators applicable to the validation of maps when a sampling design uses strata different from the map classes [
30].
The work presented in this paper is structured as follows: The characteristics of the study area and the products under analysis are presented in
Section 2. The methodology used to assess the thematic accuracy of the original maps, the methodology to obtain the harmonized maps, their accuracy and their comparison is described in
Section 3. The results are presented in
Section 4, discussed in
Section 5 and conclusions are drawn in
Section 6.
3. Methodology
The methodology used to validate and compare the LULC maps described in the previous section includes three phases, illustrated in
Figure 3.
The first phase corresponds to the accuracy assessment of the original products with a reference database. The methodology used to generate the reference database and compute the accuracy indices is fully described in
Section 3.1, along with the used accuracy indices.
The second phase aims to assess the accuracy of the harmonized maps with the reference database generated in Phase 1. To this aim, after the class definitions were analyzed, the nomenclatures of the six LULC maps were converted into a common and comparable nomenclature, henceforth referred to as harmonized nomenclature (HN). All maps were then converted into this HN generating harmonized and comparable maps. Then, accuracy indices were computed for the harmonized maps derived from each of the original maps, using the reference database generated in Phase 1. The details of the methodology used in this phase are further explained in
Section 3.2.
The third phase corresponds to the direct comparison of the harmonized maps, with the identification of similarities and differences between the products, in particular the area occupied by each corresponding class in each map and the regions equally mapped in all harmonized maps. Further explanations of this process are made in
Section 3.3.
3.1. Thematic Accuracy Assessment of the Original LULC Maps
Given the number of products to validate and the aim to compare the obtained accuracy results, the same reference database was used to validate all products, so that accuracy differences would not be due to the use of different reference databases. To consider a different reference database for each map would, on one hand, introduce variability in the accuracy results and, on the other hand, would significantly increase the effort and costs necessary to generate six reference databases. Therefore, the reference dataset was designed in such a way that it enables the assessment of the accuracy of each original LULC map, with its own nomenclature. The methodology used to generate this reference database and validate the products is described in this section and includes the three main steps of accuracy assessment, namely: (1) sampling design; (2) response design; (3) computation of accuracy indicators.
3.1.1. Sampling Design
The sampling design defines the protocol to select the reference spatial units where the “true class” will be identified and then compared with the map classes. Several sampling approaches may be used for this aim, such as simple random, systematic or stratified sampling, but all have advantages and disadvantages, e.g., [
29,
43]. In this analysis, a stratified random sample of points was used. The stratified sampling approach satisfies several major design criteria regarding the sampling design: (1) it follows a probability sampling design, (2) it is cost-effective and practical by reducing the number of sampling points, (3) it enables the distribution of the sampling points in strata that represent the diversity of the landscape under analysis, (4) it enables the collection of sample data at rare classes. The strata most commonly used when validating a LULC map are the map classes. However, due to the different classes used in the products under analysis, such an approach would result in the identification of a different set of sampling points for each map. These could then be merged into only one reference database but the points selected in each one would have different selection probabilities, which would make the accuracy assessment more complex, and would also increase the sample size and therefore the effort and cost of the response design phase. Hence, it would neither be practical nor cost-effective, which are two major criteria when selecting the sampling design [
29]. Therefore, the strata were defined by using 19 classes, listed in
Table 1, extracted from the 83 classes of COS 2018, described in
Section 2.2.7, and considered in this study as reflecting the diversity of the landscape in Portugal.
These strata were selected so that all classes of the original LULC maps would be represented in the selected sample.
For each of the selected strata, 60 sampling units were randomly selected. Therefore, the reference database includes a total of 1140 points. In spite of the use of the main landscape components of continental Portugal as strata, with such a sampling approach, there may be land cover classes in some products that have less samples, which is not desirable as it will increase the amplitude of the confidence intervals associated with the accuracy indices, e.g., [
44,
45]. However, as the alternative would require a very large reference database, this was the chosen option. The reference system used in the reference database was the PT-TM06/ETRS89 (EPSG code: 3763).
Figure 4 shows the obtained reference points and the considered strata.
3.1.2. Response Design
The response design defines the protocol used to select the reference class at each sample location, frequently called “ground truth” class. It involves several aspects, including the selection of the reference classes that may be used and the method and rules used to select the “true class” or the possible “true classes” at each reference location [
46].
The reference database used in this study was generated by selecting the reference class for each LULC product (considering their original classes) through the photo interpretation of the 2018 orthorectified aerial images with 0.25 m spatial resolution, along with the ones available for the years 1995, 2004–2006, 2007, 2010, 2012 and 2015, and a time series of Sentinel-2 satellite imagery between 2017 and 2019. Additional data were also used, such as the burned areas between 2017 and 2019 provided by the Portuguese National Institute for Nature and Forest Conservation (Instituto da Conservação da Natureza e das Florestas—ICNF) and the Portuguese Land Parcel Identification System (Sistema de Identificação Parcelar) of the Institute for Funding Agriculture and Fishery (Instituto de Financiamento da Agricultura e Pescas—IFAP). The use of all these data sources enabled the photointerpreters to consider variability when selecting the reference class, as the identification of some classes, such as “Agriculture”, “Permanent herbaceous” or “Periodically herbaceous” require an analysis of variability over time.
Given that the maps to be validated have a 10 m spatial resolution, a 100 m
2 square cell centered around the sample point was considered to identify the reference class. The four interpreters performing this work were instructed to choose the reference class that was dominant in the considered 100 m
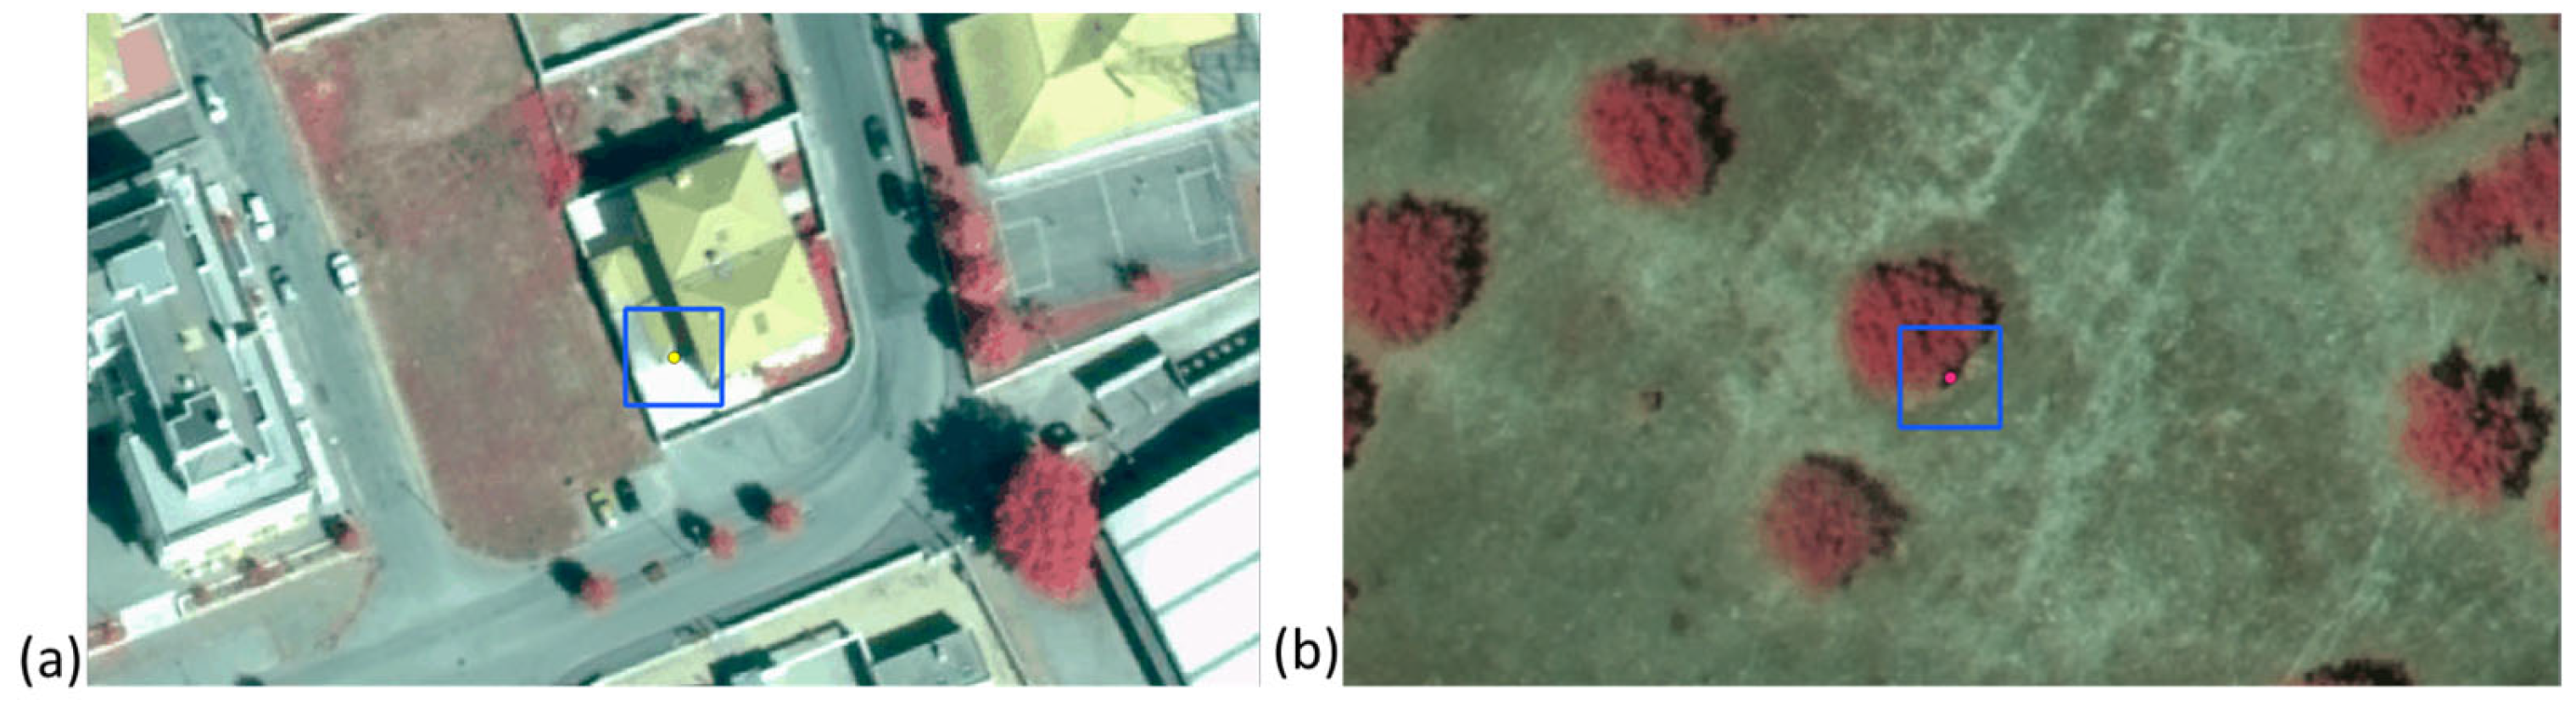
2 cell. When more than one class was present in the cell, the one with larger percentage (equal or larger than 60%) was considered as the primary class and a secondary class could be chosen (corresponding to the remaining 40%). In rare cases where it was very difficult to identify the dominant class in the cell, the interpreter labeled the sample point considering the area surrounding the square cell.
Figure 5 illustrates this procedure with two examples. In (a) there is no doubt that the class to be selected should be “Artificial Land”, while in (b) it was not possible to choose which of the classes “Permanent herbaceous” and “Woody Broadleaved evergreen trees” was dominant in the cell. In this case, the region surrounding the cell was considered to choose the class “Permanent herbaceous” as primary and the class “Woody broadleaved evergreen trees” as the secondary class.
A secondary class was selected for 48% of the 1140 considered sample units.
Table 2 shows the percentage of the 60 sample units per strata for which a secondary class was identified. These values show the difficulty to select one class for pixels with 100 m
2, as, due to the landscape characteristics, many pixels are in fact mixed pixels. It is also clear that some strata are less sensitive to this difficulty, such as Water and Managed grasslands, due to their homogeneity.
To solve any doubts that might occur in the photo-interpretation phase, in the first step, three photo interpreters classified the same 10 sampling points from each of the strata, adding up to 190 points. The results allowed us to identify divergencies between photo interpreters, and additional rules were defined to assess these situations. Afterward, the remaining points were split using the same three interpreters for labeling, assuring that all photo interpreters had points from all strata. In the end, all the points were revisited by a fourth photo interpreter and a meeting was held between the four interpreters to solve any remaining inconsistencies between them.
3.1.3. Accuracy Indicators
The computation of accuracy indices requires the comparison, at each sample location, between the reference class and the map class. As the different maps were originally available in different reference systems, to minimize the impact of possible displacements, distortions and the need to resample pixels when applying transformations between reference systems, the reference database reference system was converted into the reference system of the original LULC maps to be validated.
The comparison between the LULC maps and the reference data is made building confusion matrices. However, as the strata used to select the sample points are not the classes of the maps to be validated, the confusion matrices need to keep the information about the class in the map and the reference data, but also about the original strata that contained each reference point. Therefore, the overall accuracy is estimated using Equation (1), its standard deviation is estimated with Equation (2), the user’s and producer’s accuracy are estimated using Equation (3) and their standard deviations are estimated using Equation (4), and the estimation of the area of class j e is given by Equation (5) [
30],
where:
N is the total number of sample units;
H is the number of strata;
h is one of the H strata;
is the amount of sample units within stratum h;
u represents a sample unit;
A is the total area of the map;
, and are variables that take values either 1 or 0, such that:
To compute the overall accuracy:
To compute the user’s accuracy of class
k:
To compute the producer’s accuracy of class
k:
To compute the estimation of the area of class
j:
is the population mean based on a census of pixels;
estimator of ;
estimator of the ratio ;
is the average of for the sample units in stratum ;
is the amount of sample units which were selected from stratum ;
is the average of for the sample units in stratum ;
is the average of for the sample units in stratum ;
is the sample variance of from stratum h;
is the sample variance of within stratum h;
is the sample covariance between and for stratum h;
.
The 90% confidence intervals (
CI90) were computed using Equation (6), where
SD stands for standard deviation and
EA for the estimated accuracy.
The accuracy indices were computed following the two approaches below, given that the reference database considers not only a primary class but, in some cases, also a secondary class.
There is an agreement between the map and the reference data only when the map pixel that contains the reference point is coincident with the primary class of the reference database;
There is an agreement between the map and the reference data when the map pixel that contains the reference point is coincident with the primary or the secondary class of the reference database.
As the second approach considers that there is agreement in more cases than the first one, the accuracy results are always equal or higher than the ones obtained with the first approach. This second approach also aims at decreasing the effect of small co-registration problems between the products and the reference database.
As the products under comparison have different classes, and also a different number of classes (three products have only eight classes, and there is one with nine classes, another with eleven and another with thirteen classes), the simple comparison of the overall accuracy does not provide enough information for a user to assess which product is more likely to provide accurate information for a particular application. Moreover, when the analysis is made per class, very different accuracy values may be obtained for the user’s and producer’s accuracy indices, which means that there may be very different levels of omission and commission errors in each map for each class. To help to assess which product has more classes that show a high level of reliability regarding both omission and commission errors, the F1-score per class was computed, e.g., [
47]. This measure is computed for each class with Equation (7), where
represents the class under assessment, and
and
represent, respectively, the user’s and producer’s accuracy of class
.
This measure enables to assess the quality of each class in each map separately. This is useful to assess if a certain map may be a good data source for a particular class or not independently of its performance in other classes, which may not be of interest for a particular application.
3.2. Nomenclature Comparison and Harmonization
All maps under analysis have different nomenclatures, with classes that may be land-cover oriented, land-use oriented, or a mixture of both. Therefore, to perform the nomenclature harmonization it is necessary to analyze the definitions of LULC classes of each product. Then, to generate maps that can be compared, a set of classes into which the original classes of the products may be mapped needs to be identified.
Table 3 shows the mapping of all classes of the six products under analysis into the classes considered in the HN. This mapping enables a direct comparison of the maps obtained once the original products are reclassified into this common nomenclature. However, due to the difficulties associated with the class’s definitions in the several products, which make correspondences difficult in several cases as the same land cover may be included in different classes due, for example, to different land uses, only four classes were considered in the HN, which are “Built area”, “Vegetated areas”, “Bare ground” and “Water”. Most of the difficulties that implicated the choice of only four classes are in the vegetated classes, which may include, for example, vineyards in different classes (in some cases they correspond to a separate class, in others they are included in agriculture and in other in shrubs). Similar difficulties are found for LULC classes, such as orchards (which in some cases are included in the trees class and in other cases in agriculture) and other types of vegetation, so only one class was considered for all vegetated areas. All products were then converted into the classes of the HN.
To assess the accuracy of the harmonized products, the reference database generated in
Section 3.1 was used. As each sample point was already associated with the classes of each original product, additional attributes were added to the reference database with the corresponding classes of the HN, according to the mapping listed in
Table 3. As the classes of the harmonized maps to be validated also do not correspond to the strata used to select the sample points, Formulas (1)–(4) were used to compute the accuracy indices, as explained in
Section 3.1.3.
3.3. Comparison of the Harmonized Maps
To enable a direct comparison of all harmonized maps, they were converted into the same reference system (PT-TM06/ETRS89—EPSG code: 3763). Three types of analysis were then performed: (1) a comparison using visual analysis, (2) the area occupied by each class in each harmonized map was computed and the results obtained for all maps compared, (3) the regions classified with the same harmonized class in all maps was identified, the area per class was computed, as well as the percentage of regions equally classified in relation to the minimum and maximum class area in all maps.
5. Discussion
Several challenges had to be faced to perform the comparison presented in this paper. When it comes to the selection of the products to compare, raster products with the same spatial resolution were selected (10 m) so that comparable detail could be found in the products. Regarding temporal data, the ideal would be to compare only products with a coincident time stamp (same reference year or months). However, this is not the case, as different products consider different temporal strategies and reference dates. Therefore, as the analysis of national LULC products of different years shows the rate of change in the study area (continental Portugal) between products with time stamps differing between one to three years is not expected to be larger than 2% to 5%, it was decided that even though there are some temporal differences between the products, their comparison would provide useful information, not to assess change, as that would only be feasible if a time series of consistent products would be used [
49], but to assess their differences and similarities.
To compare the product’s accuracy, the first challenge was to define a methodology that, following the recommended best practices for thematic accuracy assessment, e.g., [
41,
43], would enable the use of the same reference database to validate all products with their original nomenclature with an acceptable workload, so that the results would be comparable. Venter et al. [
26] used existing reference data to validate the global products (the ground truth validation dataset produced by the Dynamic World team and the Land Use/Cover Area Frame Survey (LUCAS) points). In our case, the use of existing reference data, such as LUCAS data, was discarded due to the characteristics of the sampling approach (systematic sampling) and the associated limitations [
29]. If a simple random sampling approach would have been used, such as the one used by Wang and Mountrakis [
28] to validate harmonized products with seven classes, as the classes of the considered products have considerable differences in terms of definition and spatial extent, some of them would have been underrepresented in the reference database, and consequently it would not be possible to obtain accurate estimates of the accuracy indices. Bie et al. [
24] used a stratified random sample considering the harmonized nine classes extracted from one of the products to be validated to assess the accuracy of harmonized versions of three 10 m global land cover maps for a region of China. As in this study we also aimed to assess the accuracy of the original products, a stratified random sample was also used, but considering strata independent from the maps to be validated with characteristics that would most likely provide sample units in all classes of all maps. This approach provided good results, as the standard deviation of most classes was lower than 10%, with only a few exceptions. With this approach, as the strata used in the sampling approach were not coincident with the classes of the maps to validate, the common approaches used to estimate accuracy indices could not be used, and instead the ones presented by Stehman [
30] were considered, as these account for such differences between the considered strata and the map classes. Regarding response design, given the difficulty in selecting a reference class for mixed pixels, and the impact that uncertainty in the reference database may have over the accuracy estimates, especially when the reference database includes a large percentage of mixed pixels [
50,
51,
52], the methodology used allows the selection of a primary and a secondary class whenever necessary [
21,
22,
23]. This enabled the assessment of the impact uncertainty in the reference database and its influence over the final accuracy indicators. Alternative approaches, such as considering subpixels [
27,
53], could have been used. These would enable the assessment of proportions of pixels well classified, e.g., [
54], but were discarded given that the aim of the paper was to compare the existing maps and it would also increase the workload. The results show that by considering only the primary class to compare the map with the reference database, or the primary or secondary class, the user’s and producer’s accuracy estimates may vary in 19% of the cases more than 15% and in 5% of the cases more than 20%. This aspect is particularly relevant for classes such as Evergreen oak (COSc) due to the landscape characteristics (see
Figure 5), and shows the importance of considering uncertainty within accuracy assessment methods.
As the accuracy indices such as the overall accuracy and user’s and producer’s accuracy do not provide any information about the spatial variability of accuracy, and do not provide any information on map similarity such as level of detail and class continuity, additional comparisons were performed. This included a direct comparison of the maps, which required map harmonization and the comparison of the HC accuracy. Due to the differences in class definitions, and the always challenging mapping between different classes, only four classes were selected for the harmonization of the six considered maps, even though difficult decisions had to be made, for example, the mapping of vegetated flooded areas into the vegetated or water class. For a more detailed analysis, it would be necessary to compare, for example, the percentage of areas that were assigned to each class on a map and to another class on another map, to assess possible misclassification or differences due to different class definitions. This may be completed in the future for particular classes of interest, but due to the extent of such analysis, this was not considered in this paper.
6. Conclusions
This paper aimed to compare six LULC products, all with 10 m spatial resolution, focusing on thematic accuracy and mapping similarities. A key aspect of the used approach is the evaluation of the original classes of the maps being compared, rather than using only a harmonized nomenclature, which is common in the literature. By assessing the accuracy of the original classes with a methodology that enables comparisons among the products, this study provides valuable insights for end-users, facilitating more informed decision-making. Additionally, it highlights the differences between evaluating original map classes versus using harmonized nomenclatures.
Comparing maps with different classification schemas is always a challenging task, as the choice of a source map over another for a particular class or set of classes is in most cases dependent upon the type of application the map is needed for. Even when a user has a particular class of interest, such as “Shrublands” or “Forested areas”, it is essential to analyze the definitions of the classes used in each product, as despite often sharing similar names the classes’ semantics may be different.
To perform the proposed task, in the first phase, a reference database was generated to assess the accuracy of all products with their original nomenclatures. The reference database was stratified by class, considering 19 classes selected from a national vector LULC map with 83 classes, so that the stratification would be independent of the maps to be validated but would be representative of the classes of all products under analysis. The response design to generate the reference database included the selection of a primary and when necessary secondary class among the original classes of the products to be validated, mainly through the photo interpretation of 0.25 m orthophoto maps.
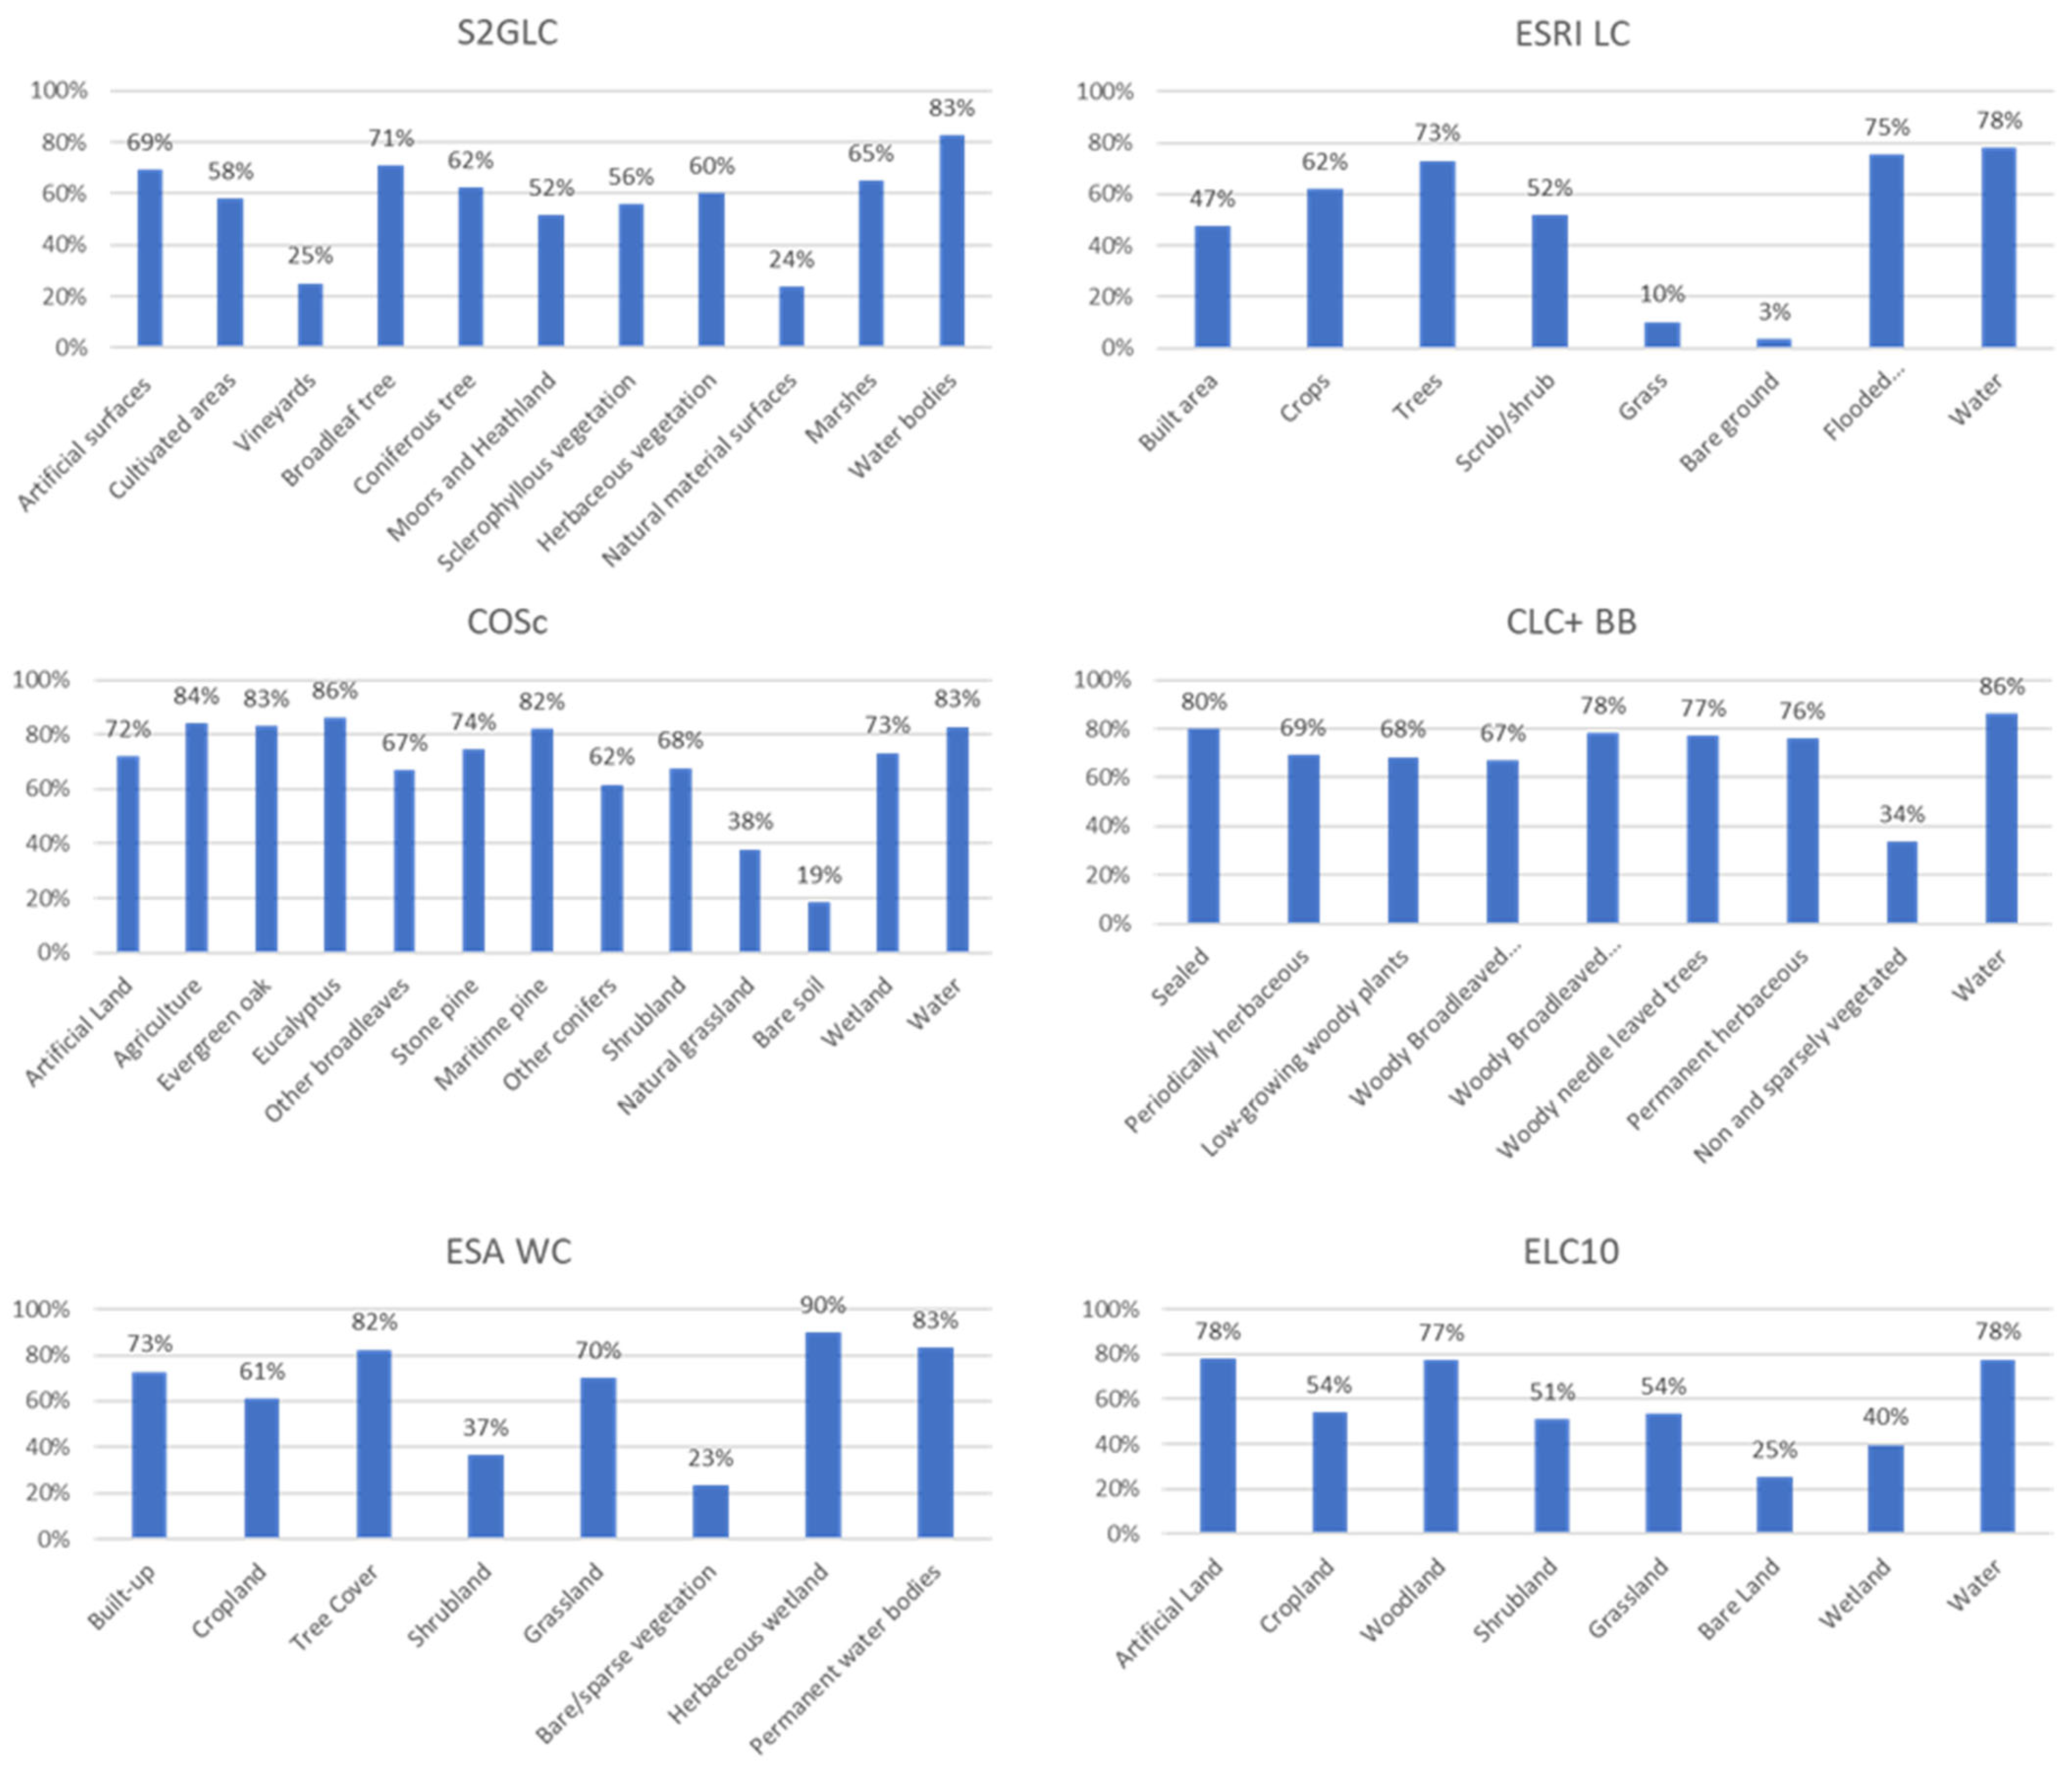
The accuracy results showed that all products had an overall accuracy between 51% and 72% when agreement between the map and reference database was considered, and whenever the map class was equal to the primary or secondary class identified in the reference database. If the agreement was only considered when the map equaled the primary class, the overall accuracy of the maps varied between 42% and 62%. In both situations, the maps with the highest overall accuracy were CLC+ BB and COSc, and the one with the least accuracy was ESRI LC. The F1-score values obtained for the classes of each product showed that there are classes in four of the six products analyzed with F1-score larger than 80% (one class in S2GLC, two in CLC+ BB, three in ESA WC and five in COSc), which means that the omission and commission errors were both small and therefore the class was very likely well represented in the map. In the same way, it is also clear that in all products there are classes mapped with low accuracy, which in most cases was the class “Bare land”.
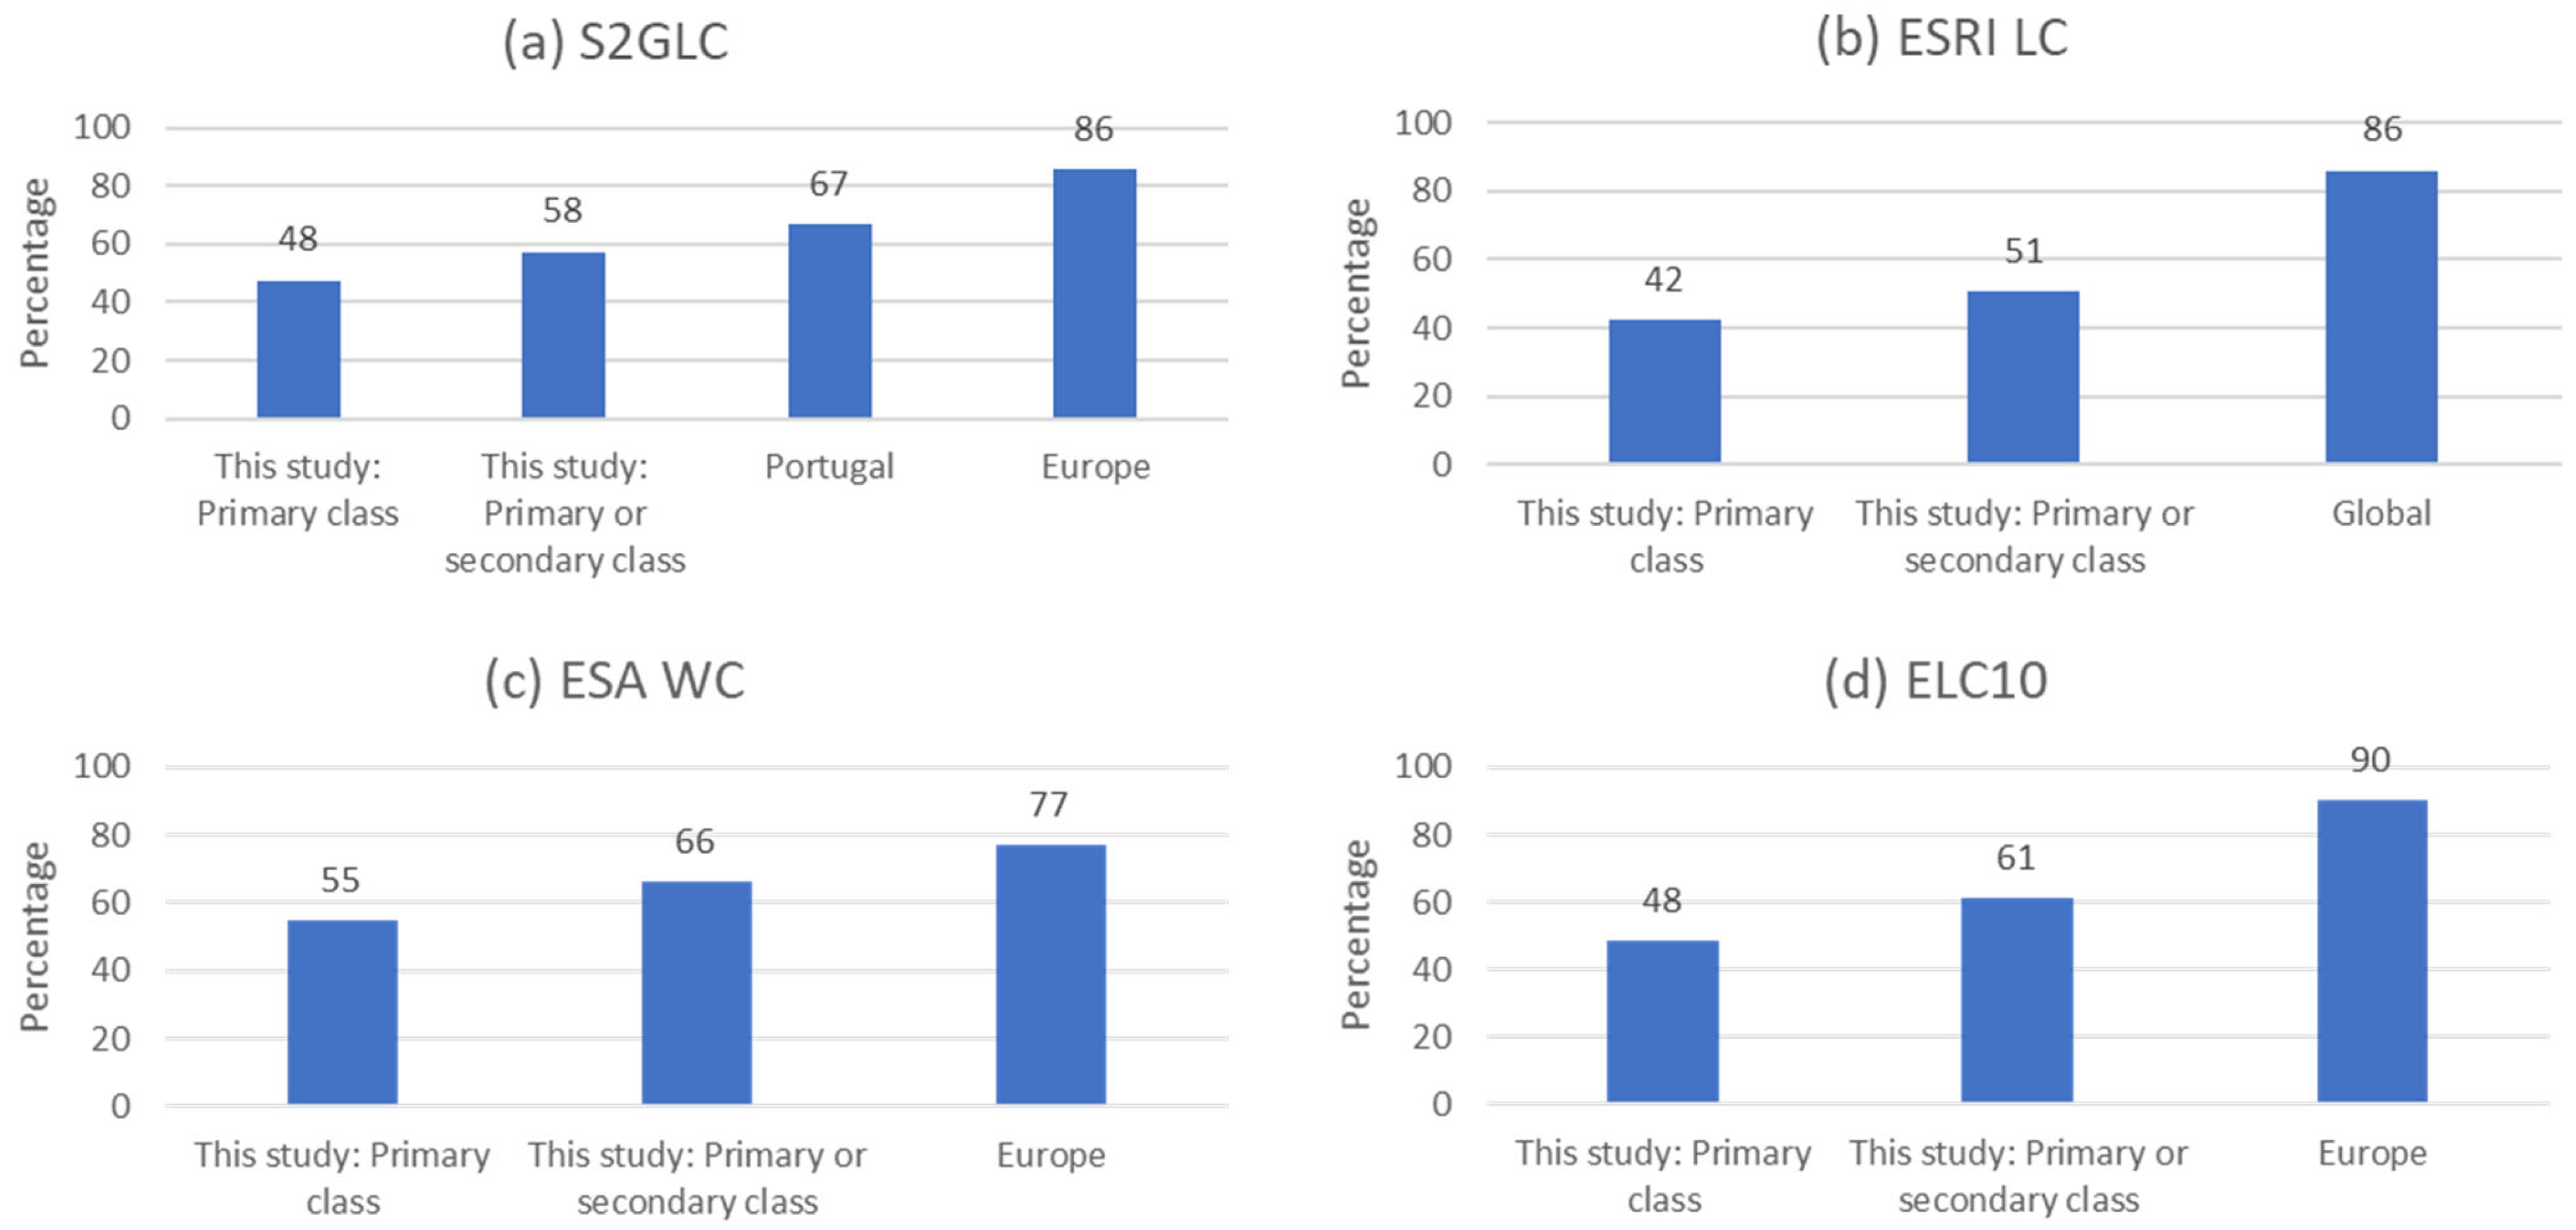
The overall accuracy values obtained in this study for the products were much lower than the accuracy values reported by the map producers for Portugal, Europe, and the globe, depending on what was made available by the producers. The values of per class user’s and producer’s accuracy varied even more for some classes in all products, which shows that for applications that have a particular interest in certain classes, their accuracy needs to be assessed in order to determine the fit for purpose of each map.
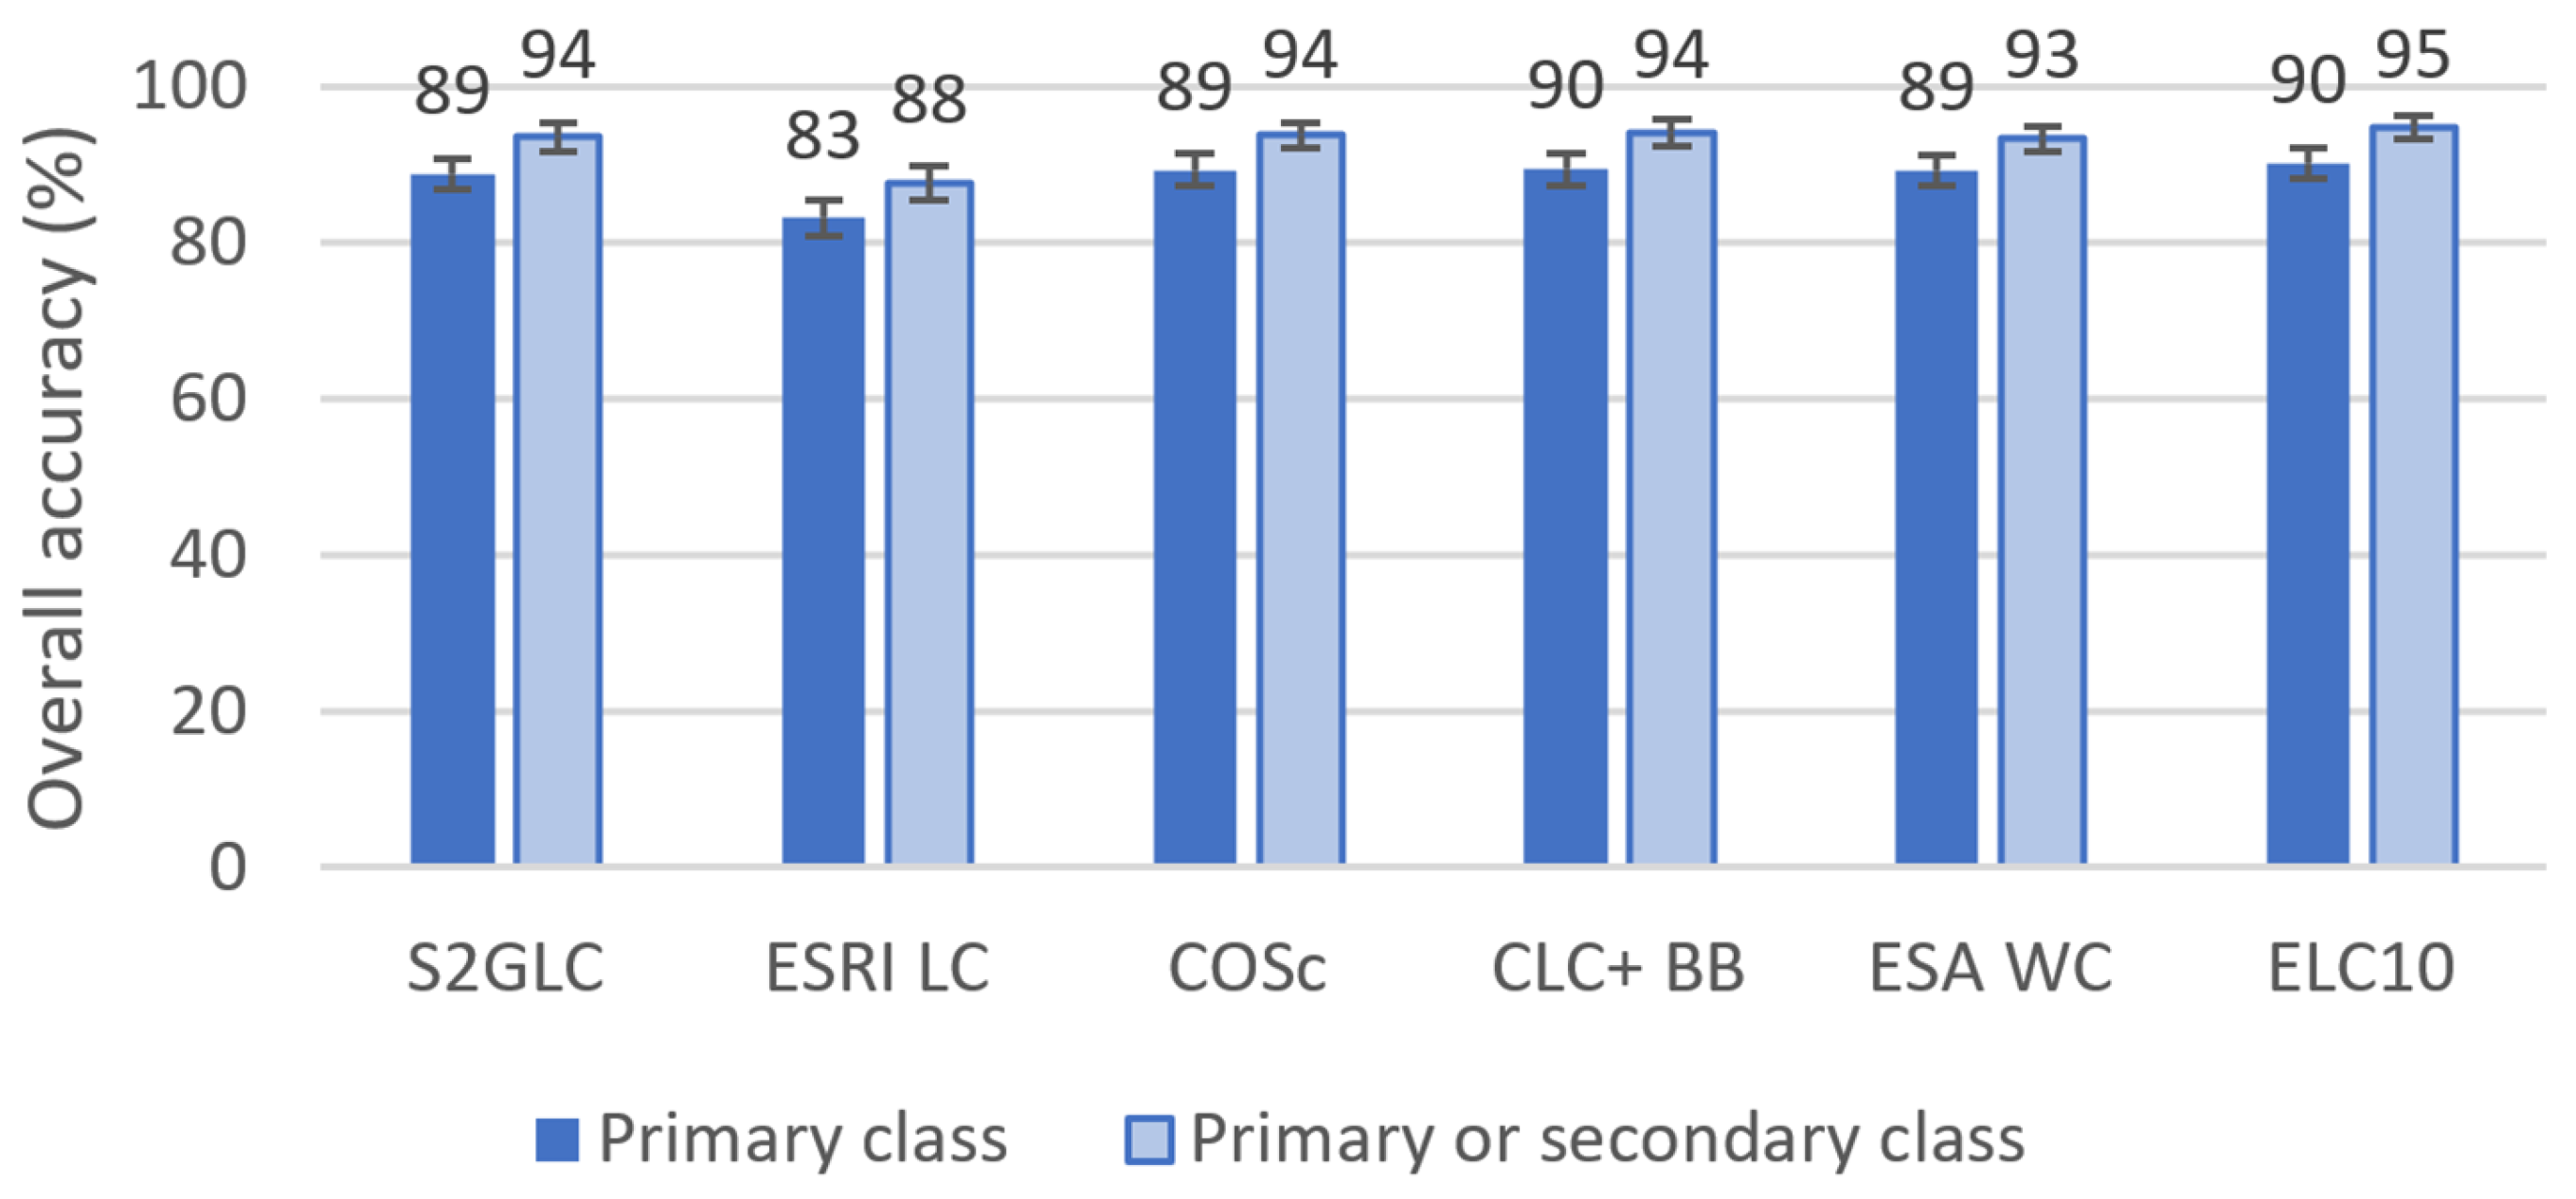
Since the products have different nomenclatures, a harmonization was made between all products into a four class HN: “Built area”, “Vegetated areas”, “Bare land” and “Water”. The overall accuracies of the harmonized products were higher, varying between 83% and 95%, depending on the original map and the methodology to assess the accuracy (see
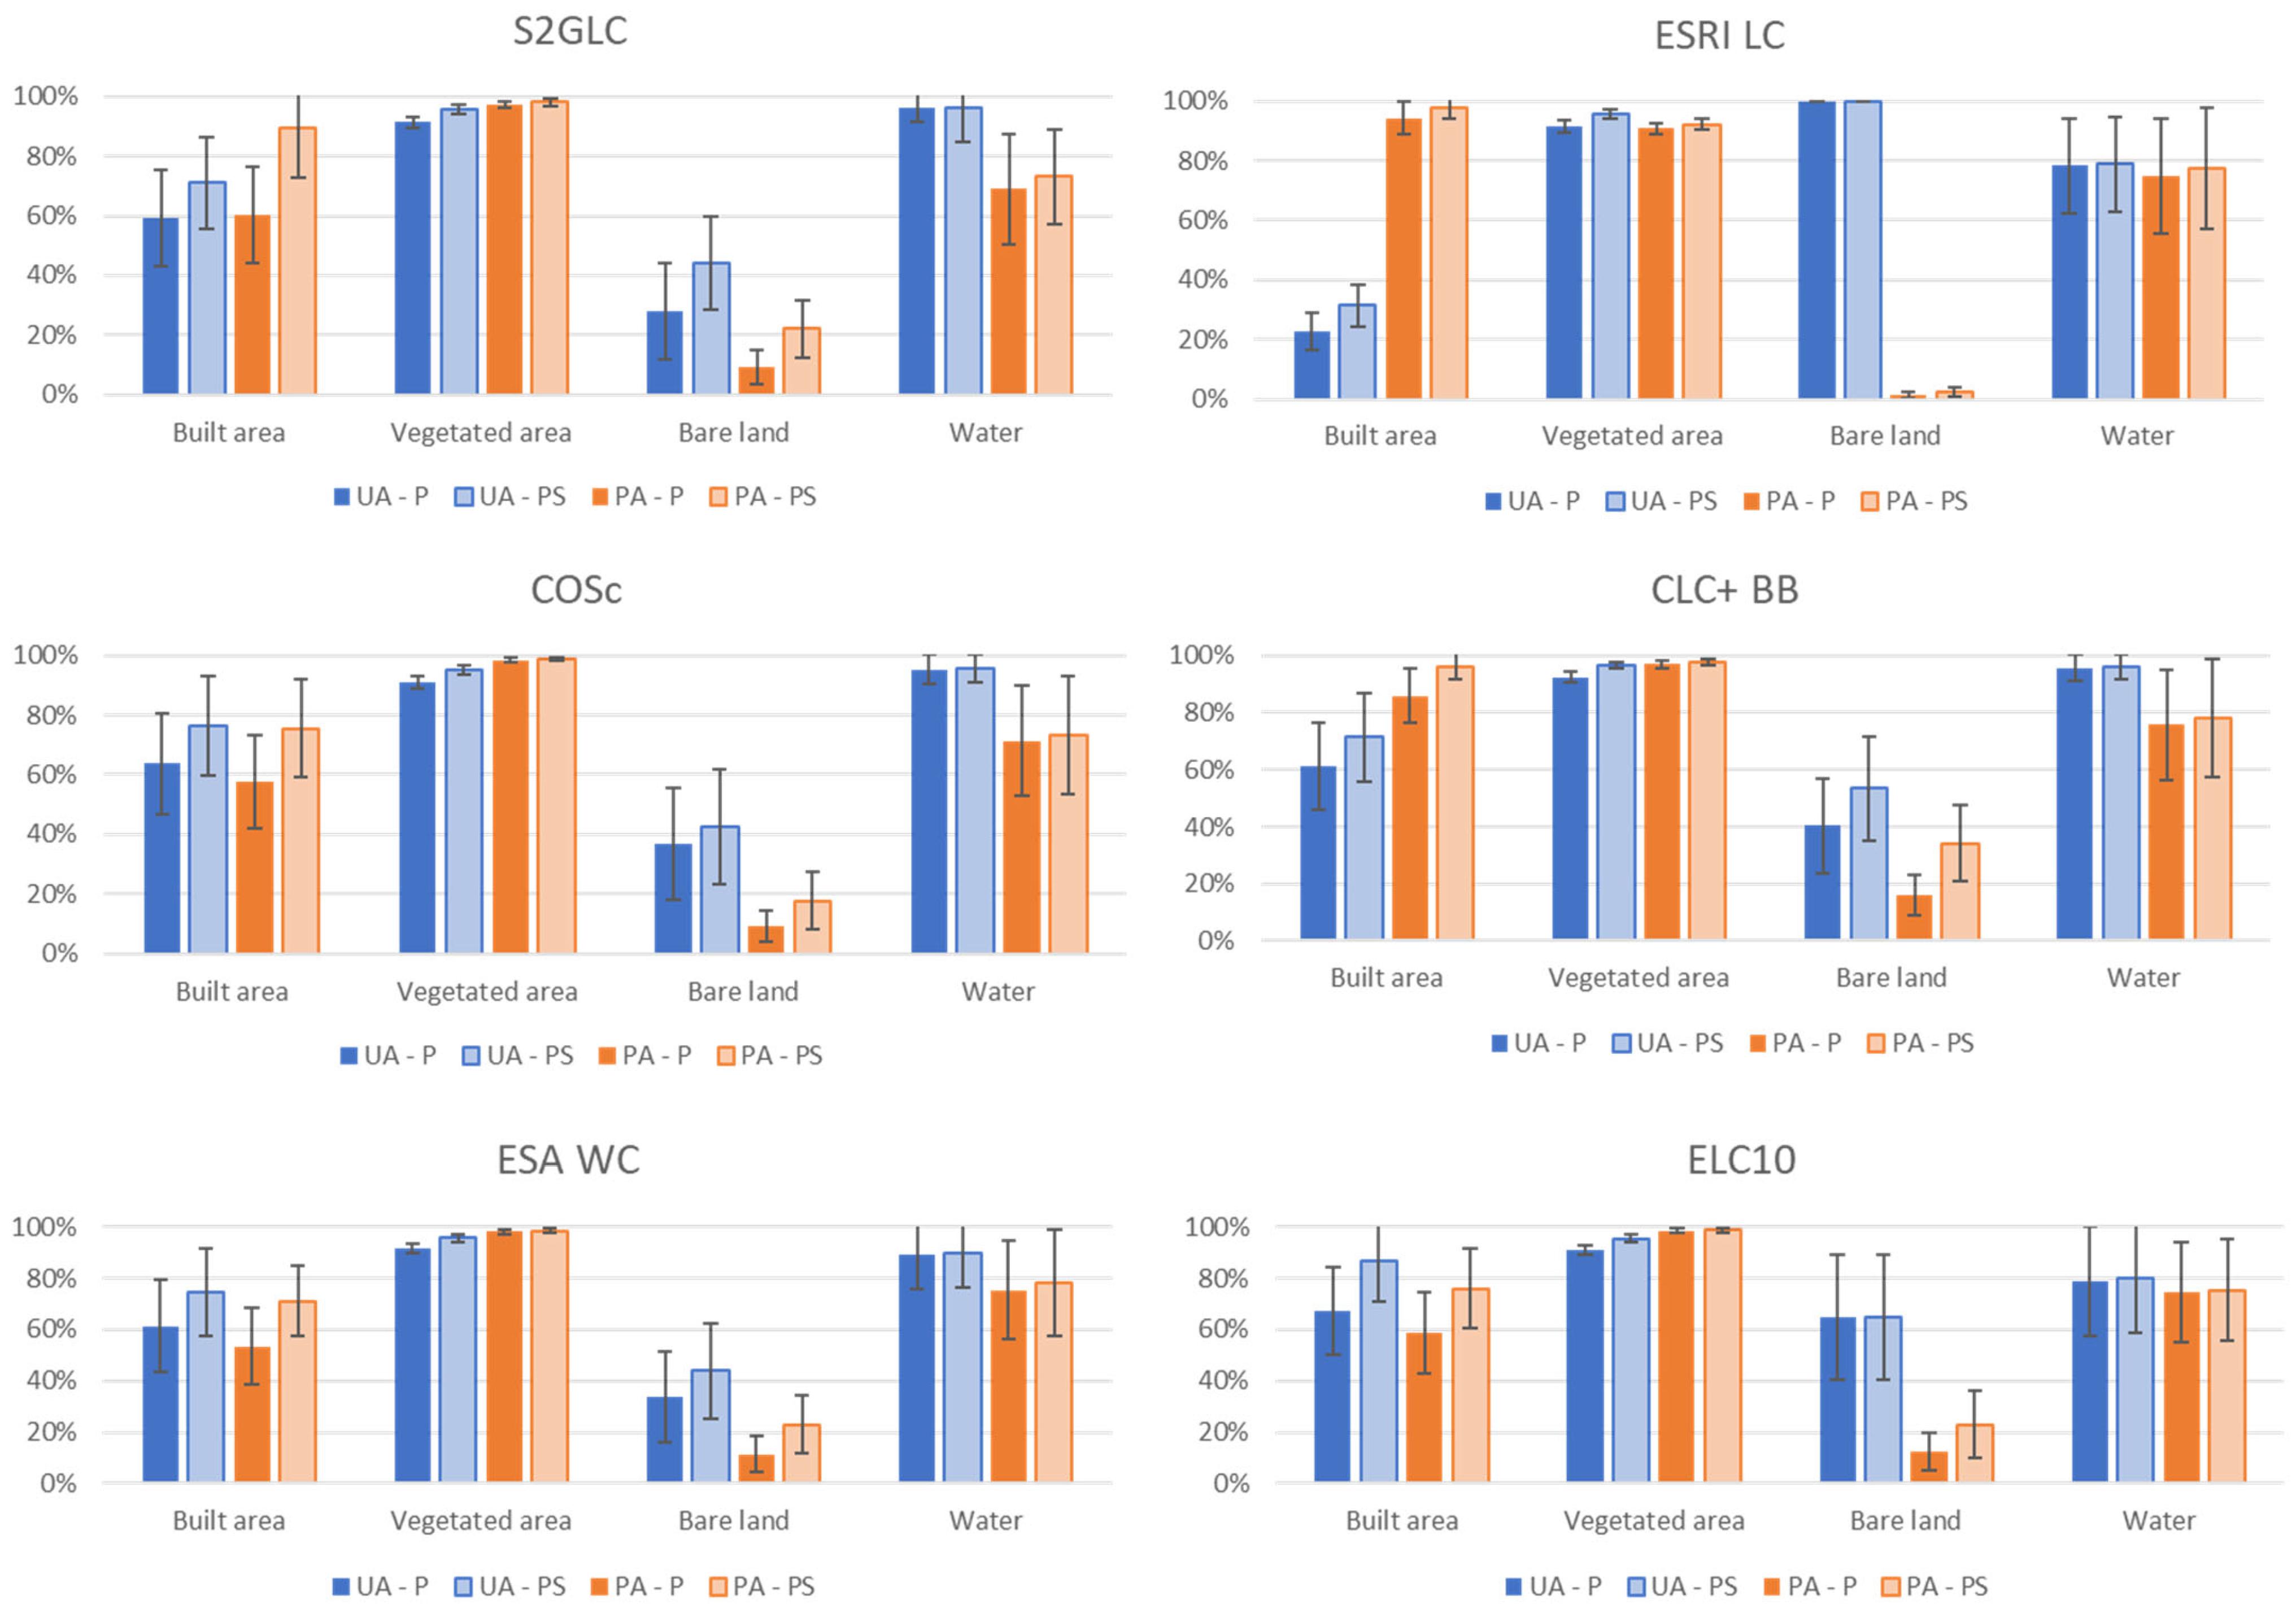
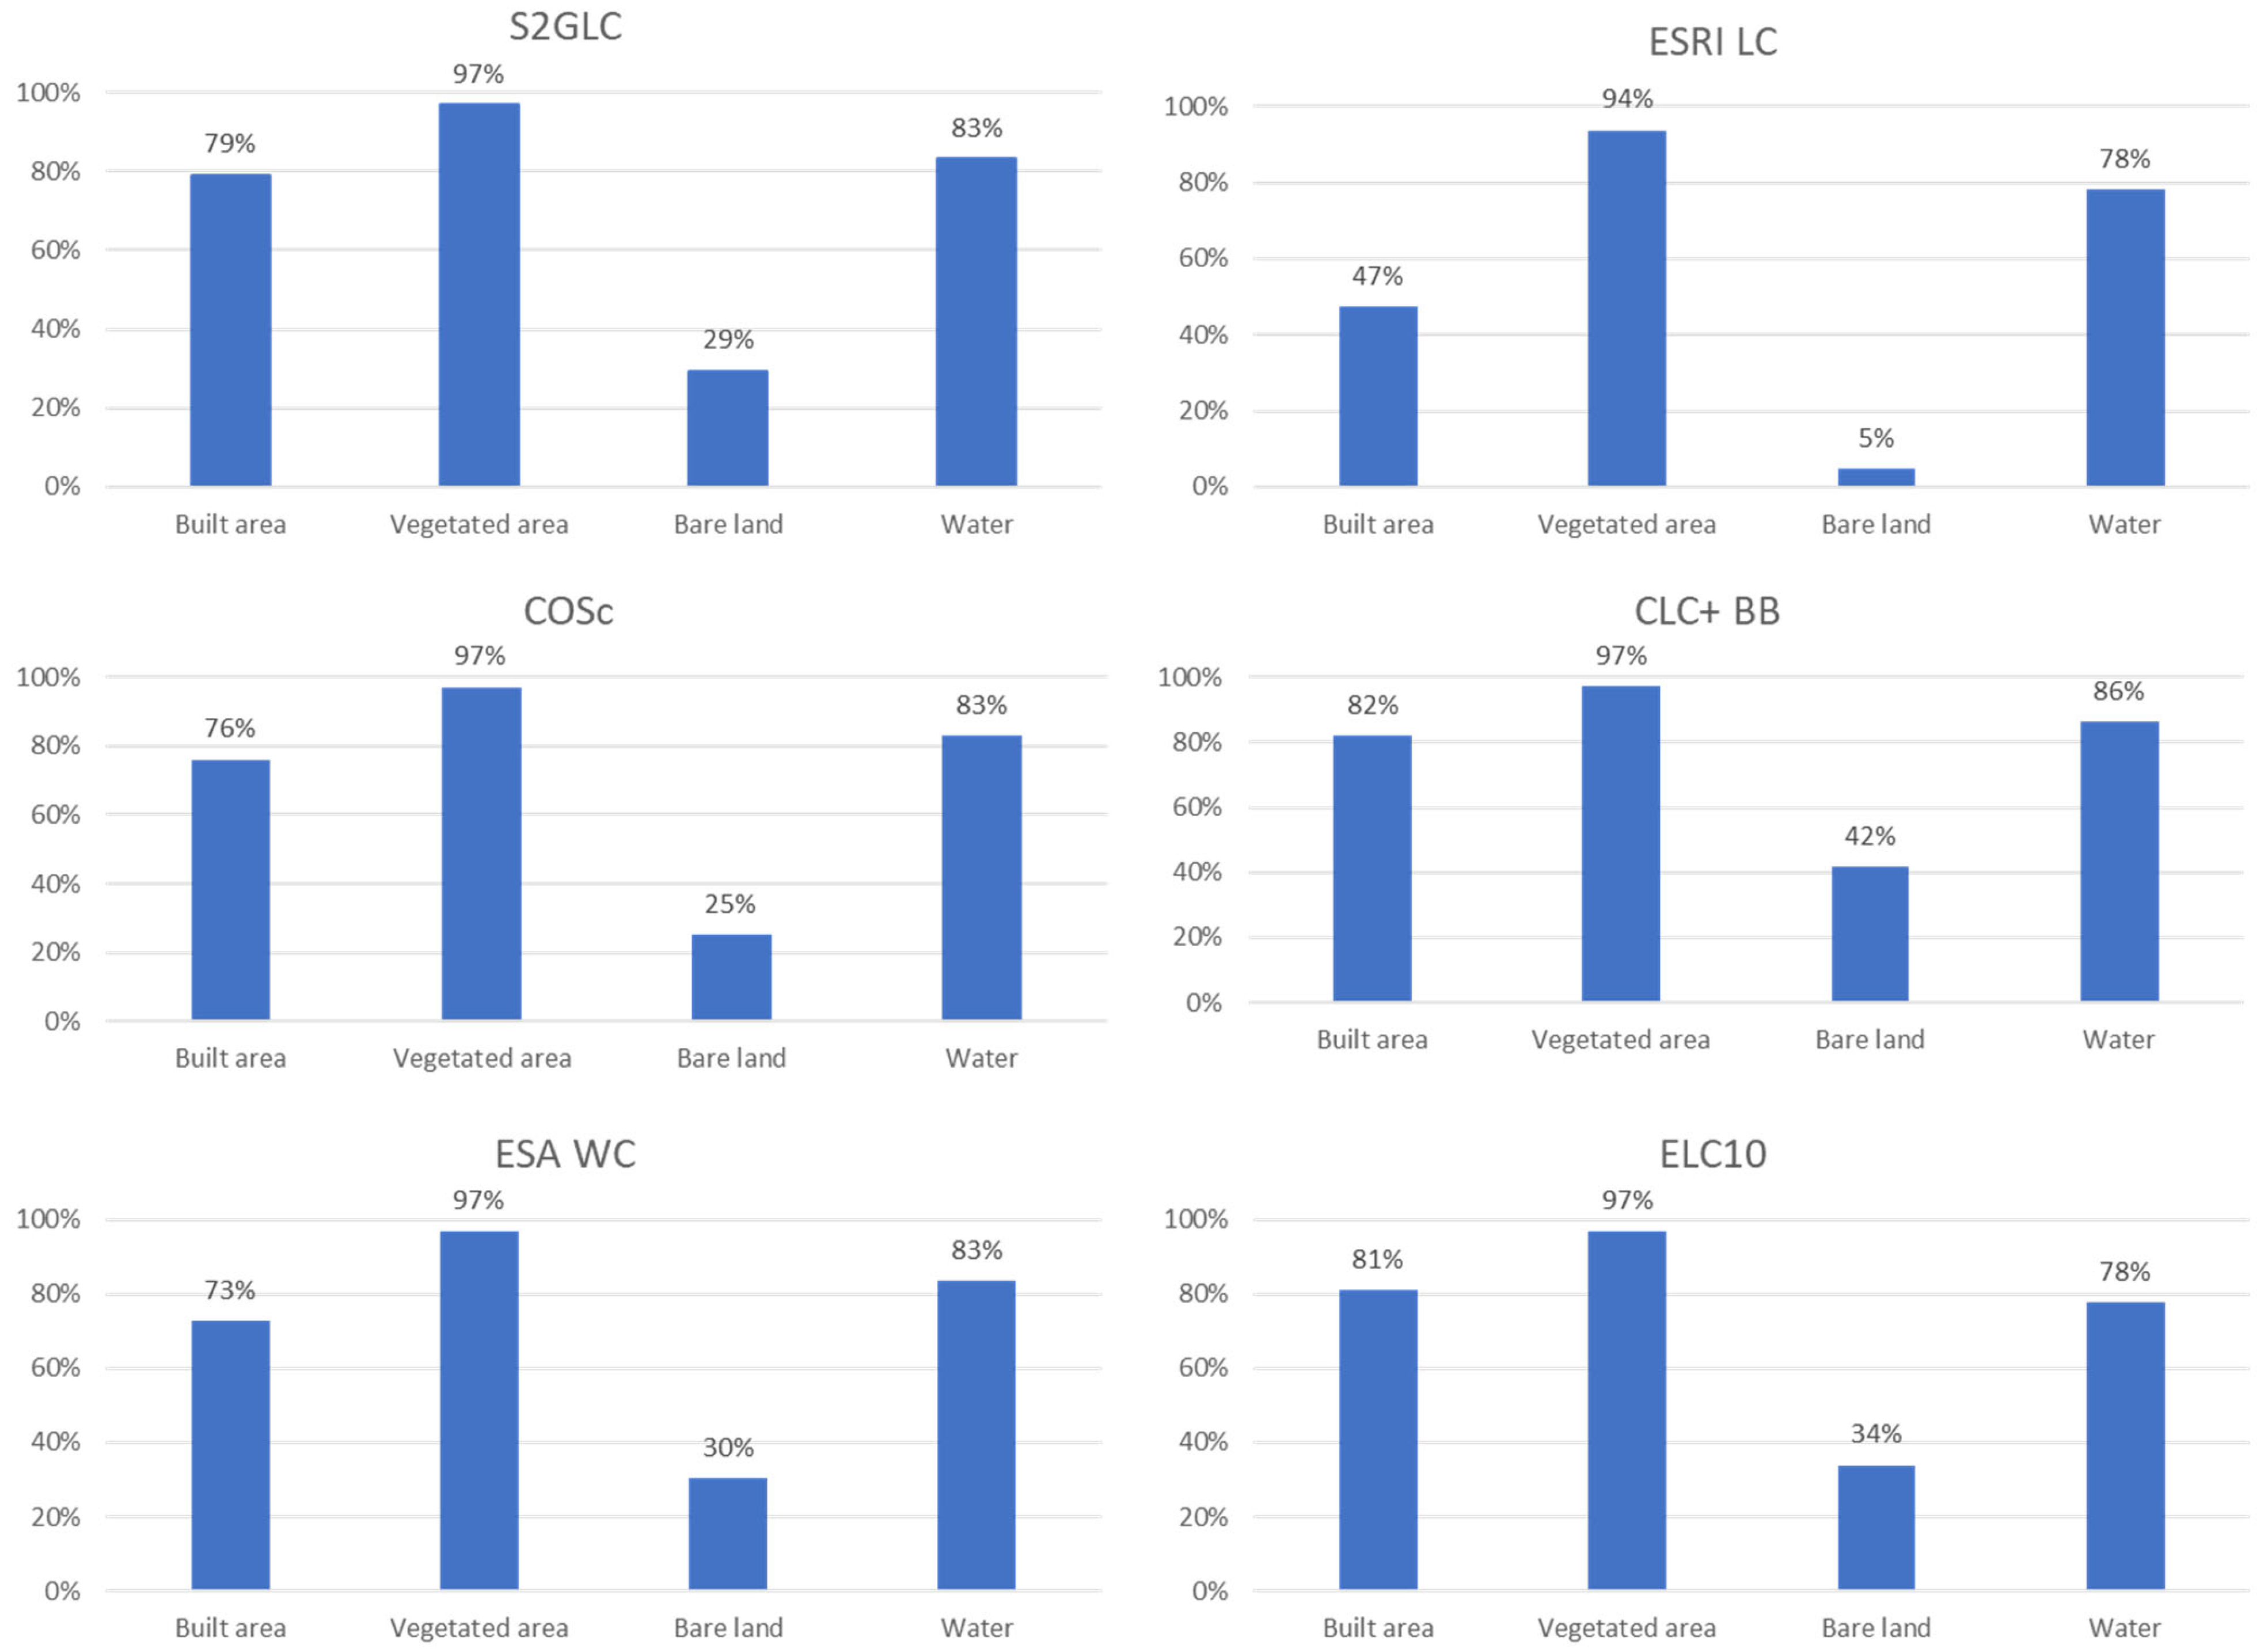
Figure 15). However, this is mainly due to the class “Vegetated areas”, which occupies most of the map, as there are very large differences in the user’s and producer’s accuracy for mainly “Built area” and “Bare land” classes. Nevertheless, it is important to stress that having fewer classes on a map does not imply superiority over maps with more detailed classes. While maps with fewer classes typically exhibit higher thematic quality, they lack the level of detail required for many applications. A direct comparison of the products regarding these four classes showed there are many important differences between the products, in terms of areas occupied by each class but also in terms of detail and feature’s continuity. The product showing more differences from the others was ESRI LC. The regions equally classified with all classes correspond to 83% of the study area. However, this region corresponds mostly to the class “Vegetated area”, while the large differences in the classes “Bare land” and “Built area” can be easily spotted.
The presented results show that the selection of a map to use for a particular application is not an easy task and the available products need to be assessed to determine which provide the necessary information. Methodologies that take into consideration the relative importance of different classes may also be used, to assess how each map may be fit for each application [
55]. It is also relevant to point out that the production of global or European products is optimized to provide better results for the whole region to be mapped, which may imply that the mapping methodologies are not able to correctly map smaller regions with specific landscapes. Therefore, for demanding applications, even though European or global products are available, it may be necessary to generate local products, so that the specificities of the country’s landscapes are taken into consideration. This is in accordance with the fact that the accuracy results obtained with this analysis for Portugal were lower than the ones obtained for the European and global products, which is consistent with what has been found for other areas of the world.
The analysis performed within this paper stresses the importance of accuracy assessment. In fact, the obtained results may change if different approaches are used (both in terms of sampling strategy, response design, spatial representativeness, etc.), so it is important to use statistical best practices so that meaningful and reliable results are obtained for a specific need. On the other hand, validation is a resource consuming task. So, given the increasing number of maps made available every year, this topic is becoming more challenging, and new more automated approaches might need to be developed so that at least a preliminary estimation of the maps thematic accuracy may be obtained before a more thorough analysis can be performed.


 ,
, 


