1. Introduction
Cities contribute more than 85% of global carbon emissions, highlighting the crucial role of urban forests as the main source of carbon sinks in the pursuit of carbon neutrality [
1]. Vegetation biomass in urban forests is a key indicator of their carbon sink capacity [
2]. Accurate estimation of biomass in urban forests is essential for understanding their potential for carbon sequestration [
3]. However, unlike natural forest ecosystems, urban forest vegetation exhibits disperse distribution, fluctuating phenological traits, and high variation due to both natural and artificial selection [
4,
5,
6,
7]. As a result, estimating biomass on an urban forest scale is a complex and systematic problem considering the intricate and variable nature of urban forest ecosystems [
8].
In arge-scale forest scenarios, AI technologies have proven to be efficient, cost-effective, and accurate in estimating vegetation biomass, primarily due to the dense and uniform nature of trees in these areas [
9,
10,
11]. For example, Ref. [
11] used a neural network to evaluate biomass in forest samples on a regional evel. Nevertheless, it is a great challenge to apply AI for biomass estimation in urban areas [
12]. One reason is that individual trees of the same species exhibit substantial variation caused by factors such as ight and soil conditions [
4,
13,
14]. For instance, the growth patterns and biomass of identical vegetation species may differ significantly between suburban areas and central parks within a city [
13]. As another reason, urban vegetation also undergoes dynamic changes due to urban construction and expansion [
15,
16]. For example, selected green areas were transformed into towering structures, and desolate and was converted into ornamental gardens [
17]. Hence, we are motivated to investigate AI technologies for estimating urban vegetation biomass.
Commonly, using AI technologies to estimate vegetation biomass involves a combination of Remote Sensing Artificial Intelligence (RSAI) and anisotropic growth equations due to their accuracy and efficiency [
18,
19,
20]. RSAI has the potential to efficiently and cost-effectively solve a wide range of complex system problems due to its superior modeling capabilities [
21]. While RSAI is mainly applied to arge-scale scenarios such as forests, its application to fine modeling of urban forests is still in its early stages [
22]. Many of the ightweight models commonly used in RSAI have demonstrated high accuracy at a fine evel of detail. Unfortunately, their usage has proven to be insufficient when dealing with the complex systems that occur in urban forests [
4]. Additionally, the anisotropic growth equation (AGE) of trees is widely used to calculate vegetation biomass. To use the equation, one needs to obtain the parameters ike species information, vegetation height, and diameter at breast height (DBH) of a tree, which usually has a high abor cost [
23,
24]. Using RSAI to extract information that AGE needs from remote sensing data significantly reduces the cost. Regrettably, it is also a challenge to extract these forest parameter information accurately by using AI technologies with remote sensing data, especially in urban forests [
25].
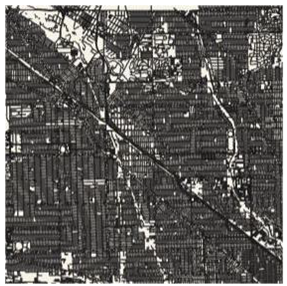
To accurately obtain the urban forest parameters required by the AGE, we introduced three-dimensional Light Detection and Ranging (LiDAR) [
26] and open street map (OSM) data [
27]. This is expected to be useful in estimating urban vegetation biomass. By actively utilizing multiple data sources, more comprehensive information can be obtained. LiDAR data accurately reflects the three-dimensional geographic characteristics of urban forests and provides detailed information about the city [
3]. This capability can assist in resolving intricate issues, such as significant alterations in the distribution of urban vegetation [
21,
24]. The functional zoning and construction of urban forest areas exhibit relative stability and consistency. Therefore, urban road network data from OSM can offer valuable insights into the evolution of the urban forest over time. This study utilizes LiDAR and urban road network data to expand the urban vegetation model into a three-dimensional space, enhancing the precision of biomass estimation for intricate urban forest systems.
In addition, considering that the existing RSAI model cannot effectively handle the rich LiDAR and OSM data in urban areas [
4], there is a need to introduce more powerful AI models. Fortunately, the AI field, where research is in full swing, offers a wealth of options, such as Segment Anything Model (SAM) [
28], Contrastive Language–Image Pre-training (CLIP) [
29], Informer [
30], etc. Those foundation models have demonstrated high potency in industrial modeling, computer vision, and other domains [
31,
32,
33]. Therefore, we are motivated to employ these deep earning foundation models to address the challenges and issues involved in estimating vegetation biomass in urban forests, thereby enhancing the modeling capability in the field of urban carbon sinks. Specifically, SAM displays excellent performance in image segmentation, accurately segmenting scattered areas of vegetation in urban forest scenes. CLIP demonstrates high accuracy in image recognition, efficiently capturing similar features across images, making it well-suited for species recognition of segmented tree images. Informer is an exceptional prediction model for ong-term series, enabling simple numerical prediction of future urban forest vegetation biomass.
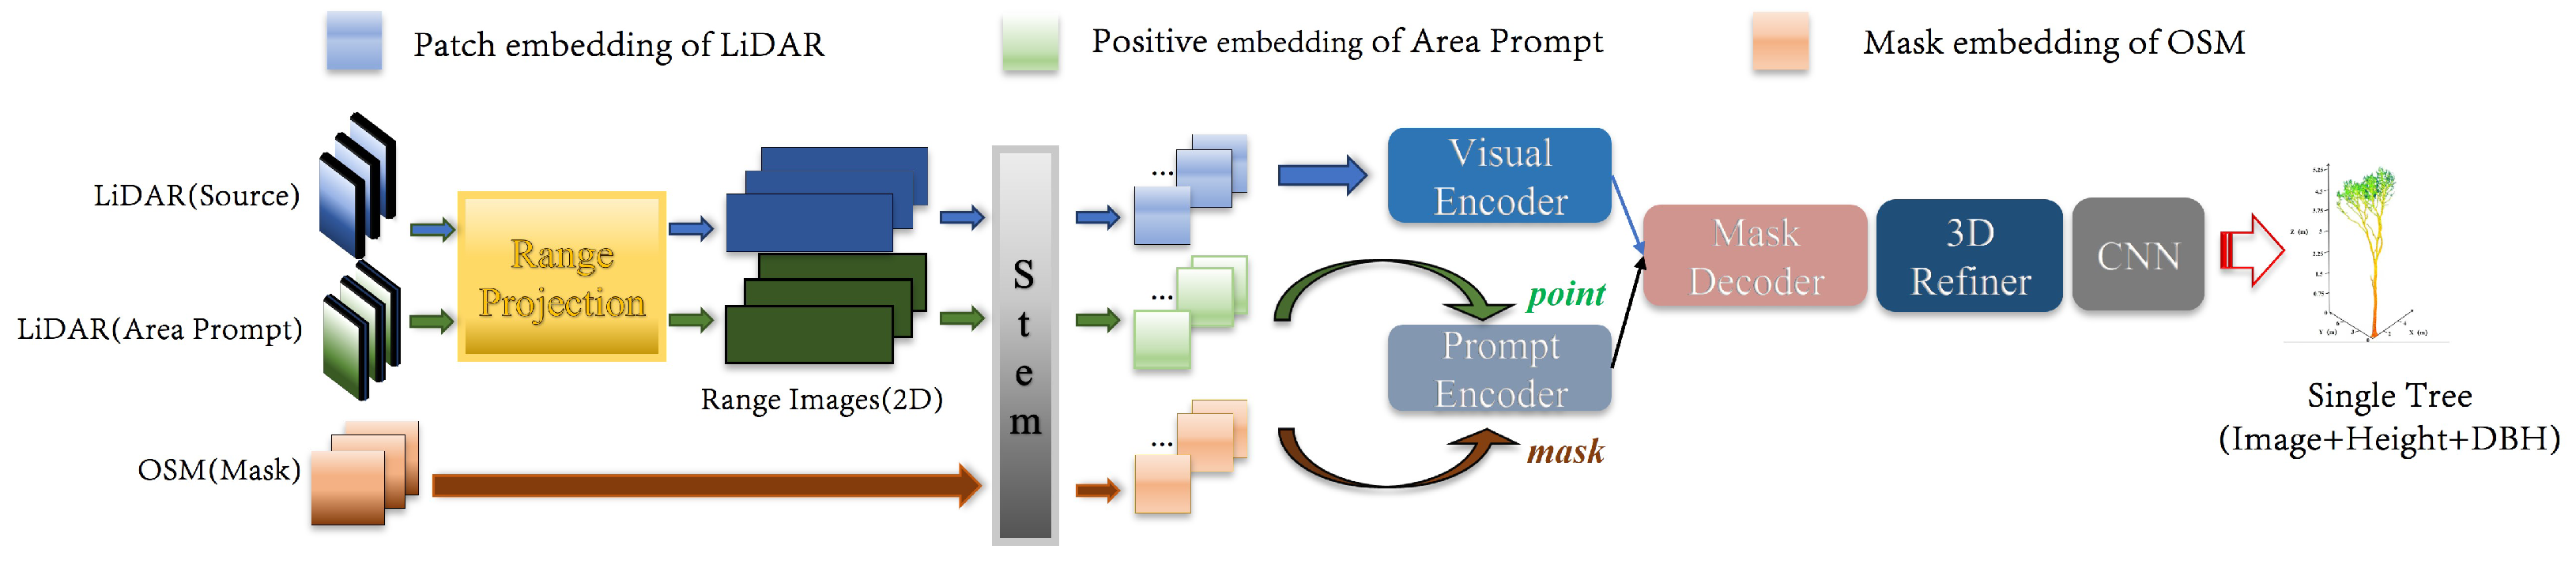
Based on the motivations to employ foundation models and multi-source data for estimating vegetation biomass, we propose the 3D-CiLBE (
3D City
Long-term
Biomass
Estimation) method to solve the ong-term biomass estimation problem in complex urban forests by using the LiDAR and OSM data, incorporating state-of-the-art SAM, CLIP, and Informer models. Firstly, the LiDAR-SAM method was developed, which possesses outstanding modeling capabilities for remote sensing. By adapting the SAM to the 3D scene, more comprehensive and detailed information on the urban forests in three-dimensional space can be extracted. Secondly, the MLiDAR-CLIP (More-Vision LiDAR-CLIP) method was created to incorporate CLIP, a sophisticated AI model for extracting and recognizing multimodal features, into RSAI. By integrating CLIP, the accuracy of RSAI in identifying vegetation species at the urban forest scale was enhanced. Additionally, the Informer model, an advanced time-series perception model, was refined to improve the understanding ability of RSAI in comprehending vegetation phenological characteristics. The remaining sections of this paper are structured as follows.
Section 2 provides a detailed account of the datasets and data processing flows involved in the study, as well as the framework and implementation details of 3D-CiLBE.
Section 3 presents the design of all experiments, the results of those experiments, and the analysis and discussion of those results. Finally,
Section 4 describes the conclusions of this study.
3. Results and Discussions
This research aims to establish the viability of 3D-CiLBE in the estimation of vegetation biomass in urban forest environments, through undertaking three different forms of experimentation; comparative experiments, ablation experiments, and case studies. In the comparison experiments, we employ benchmark models selected from the best methods recognized in published studies. We compare the accuracy of these benchmark models with 3D-CiLBE in two specific areas: vegetation area segmentation and species detection. We use this result to determine the accuracy of biomass estimation. Afterward, we compare the prediction accuracy by conducting inear regression and St-Informer predictions on the acquired biomass data series. In the ablation experiments, we plan to compare the performance of the original model with the improved model for each part of 3D-CiLBE. This will present the capacity of 3D-CiLBE for time-series processing. The case studies seek to intuitively and vividly demonstrate the recognition results of 3D-CiLBE in a vast urban area.
3.1. Experiment Setup
3.1.1. Experimental Configurations
Since 3D-CiLBE has the advantage of requiring few training resources, we perform both the training and inference on a CPU. However, we also test other baseline deep models in GPU environments. In our experiments, we use a 12th Gen Intel(R) Core(TM) i7-12400 2.50 GHz CPU (FP32 557 GFLOPS, Intel Corporation, Beijing, China) and four NVIDIA Tesla T4 GPU (FP32 8.1 TFLOPS, NVIDIA Corporation, Beijing, China). We ascertain the training earning rate to be 1e-3, the batch size to be 16, the number of epochs to be 500, the optimizer to be Adam, and the regularization to be L1.
Moreover, to create a clear set of abeled training and testing data, we uniformly select 1160 images sized at 224 m by 224 m (145 per city) from the LiDAR data of eight urban areas. These 1160 carefully chosen images exhibit topographical conditions and vegetation cover in multiple functional areas of the cities. The quality of these images can assist the model in earning fundamental features. The abeled data are separated into a training dataset and test dataset using a 5:1 ratio. The training set consists of 967 tiles, and the test set consists of 193 tiles.
3.1.2. Metrics
The main evaluation metrics in this study are shown in
Table 2. Firstly, the main function of LIDAR-SAM is to segment vegetation areas in LiDAR images, and we need to evaluate the accuracy of image segmentation. The image segmentation metrics comprise OA, mIoU, Recall, Precision, and Kappa. Secondly, the function of MLiDAR-CLIP is to recognize the species of a single tree, and we need to evaluate its recognition accuracy. The recognition accuracy is evaluated using
. Thirdly, error analysis of biomass data is performed using MSE, RMSE, and
.
To assess the precision of 3D-CiLBE, it is necessary to establish the factual vegetation biomass in the region. This can be obtained via field measurements, which is a convoluted process, involving the felling and drying of trees [
41]. This waste of human resources and the unwarranted environmental damage it causes renders it unsuitable for urban areas. This has resulted in a ack of biomass statistics for urban regions. In this study, since there is no officially defined dataset of urban vegetation biomass, we decide to measure the accuracy of 3D-CiLBE by error comparison. The calculation of vegetation biomass from multi-source remote sensing images is a mature and widely used technology, which is currently the mainstream method for inversion of biomass in sample plots, and is considered to be highly accurate [
42,
43,
44,
45]. According to the multi-source remote sensing method, we measure the biomass data in the study area, obtain the estimated value of the multi-source remote sensing data, and deduce the true value of biomass through the error results given in the paper [
46,
47]. If the estimated value of 3D-CiLBE is closer to the true value than the estimate of multi-source remote sensing data, it can be concluded that 3D-CiLBE has better performance in estimating vegetation biomass.
In addition,
DR is used in our study to analyze whether 3D multi-source data have advantages in the field of biomass estimation as shown in Equation (
16).
where
is the biomass estimated using multi-source two-dimensional remote sensing data,
is the biomass estimated by 3D-CiLBE, and
is the mean error range, which is set to 0.68% according to [
48]. When
is greater than 1, 3D-CiLBE is closer to the real biomass data, and the accuracy rate is higher than that of two-dimensional remote sensing estimation method. The arger the
, the more obvious the advantage of 3D-CiLBE.
3.2. Comparative Experiments
3.2.1. LiDAR-SAM
We compare the accuracy of PointNet++ [
49], SAM [
50], and LiDAR-SAM in the segmentation of correlated images of green areas. Through this performance evaluation, we aim to demonstrate the superiority of the LiDAR-SAM model in the domain of green area segmentation.
Table 3 details the performance metrics of the models with respect to LiDAR green area segmentation. The LiDAR-SAM achieves an mIoU of 0.94 (the 95% confidence interval is [0.93214, 0.94786]) and an OA of 0.98 (the 95% confidence interval is [0.97476, 0.98524]) in image segmentation. The mIoU for image segmentation by LiDAR-SAM is 9.0% higher than PointNet++ and 3.0% higher than SAM. OA is 9.0% higher than PointNet++ and 6.0% higher than SAM. The final results of the LiDAR-SAM segmentation approaches show increase accuracy compared to the PointNet++ and SAM.
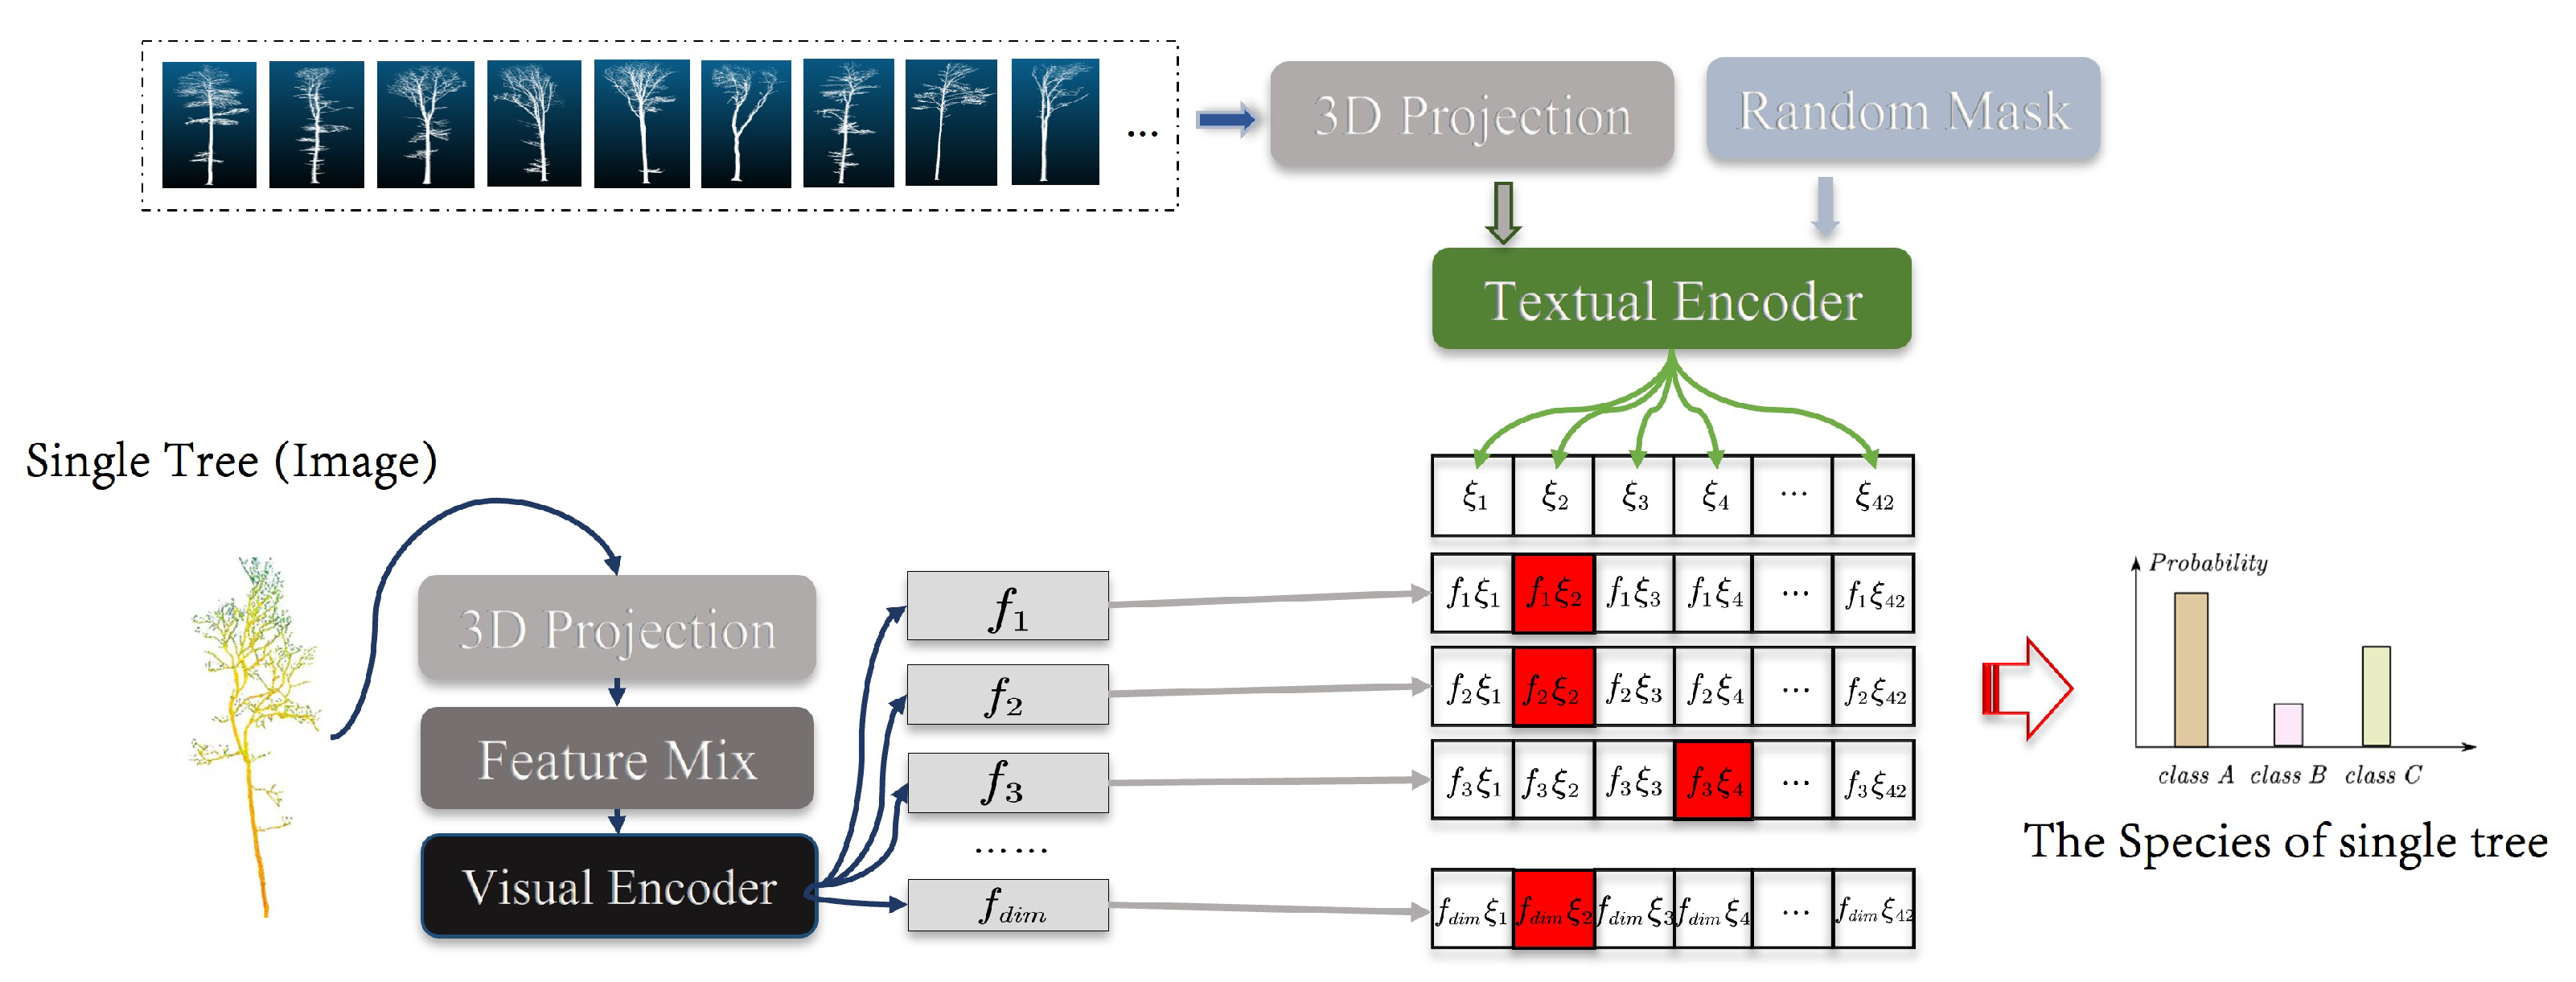
3.2.2. MLiDAR-CLIP
We compare the accuracy of SVM [
51], CLIP, PointCLIP [
29], and MLiDAR-CLIP in performing species recognition on single-tree point cloud images. Through these comparative experiments, we aim to investigate the differences in the performance of these models in the field of vegetation species recognition. As shown in
Figure 5, the final error of the classification methods using MLiDAR-CLIP is ower than the excellent classification method SVM and PointCLIP.
Figure 5 details the relevant values for the arithmetic probability of being fully correct
. Tests conducted in eight cities show that MLiDAR-CLIP had an average recognition accuracy of 92.72% (the 95% confidence interval is [0.91087, 0.94353]), which is 11.5% higher than SVM and 4.8% higher than PointCLIP.
3.2.3. Data Dimensions
The experiment is conducted in selected areas of eight cities in the United States, using two-dimensional remote sensing methods and 3D-CiLBE to calculate annual biomass data for each city from 2012 to 2018. The evaluation index DR is used to determine which method is more accurate. Biomass estimates for each of the eight cities are calculated using 2D and 3D methods.
Table 4 displays the estimates for the second half of 2017. When comparing the final DR, the average DR is 1.8 in 2017. The 3D estimation method shows a smaller gap and higher accuracy when compared to the true value. The table also displays the values estimated by the 3D method with significantly smaller errors. The error of biomass estimates using the 3D-CiLBE method is 8.2% ower on average than that of the 2D method.
3.2.4. St-Informer
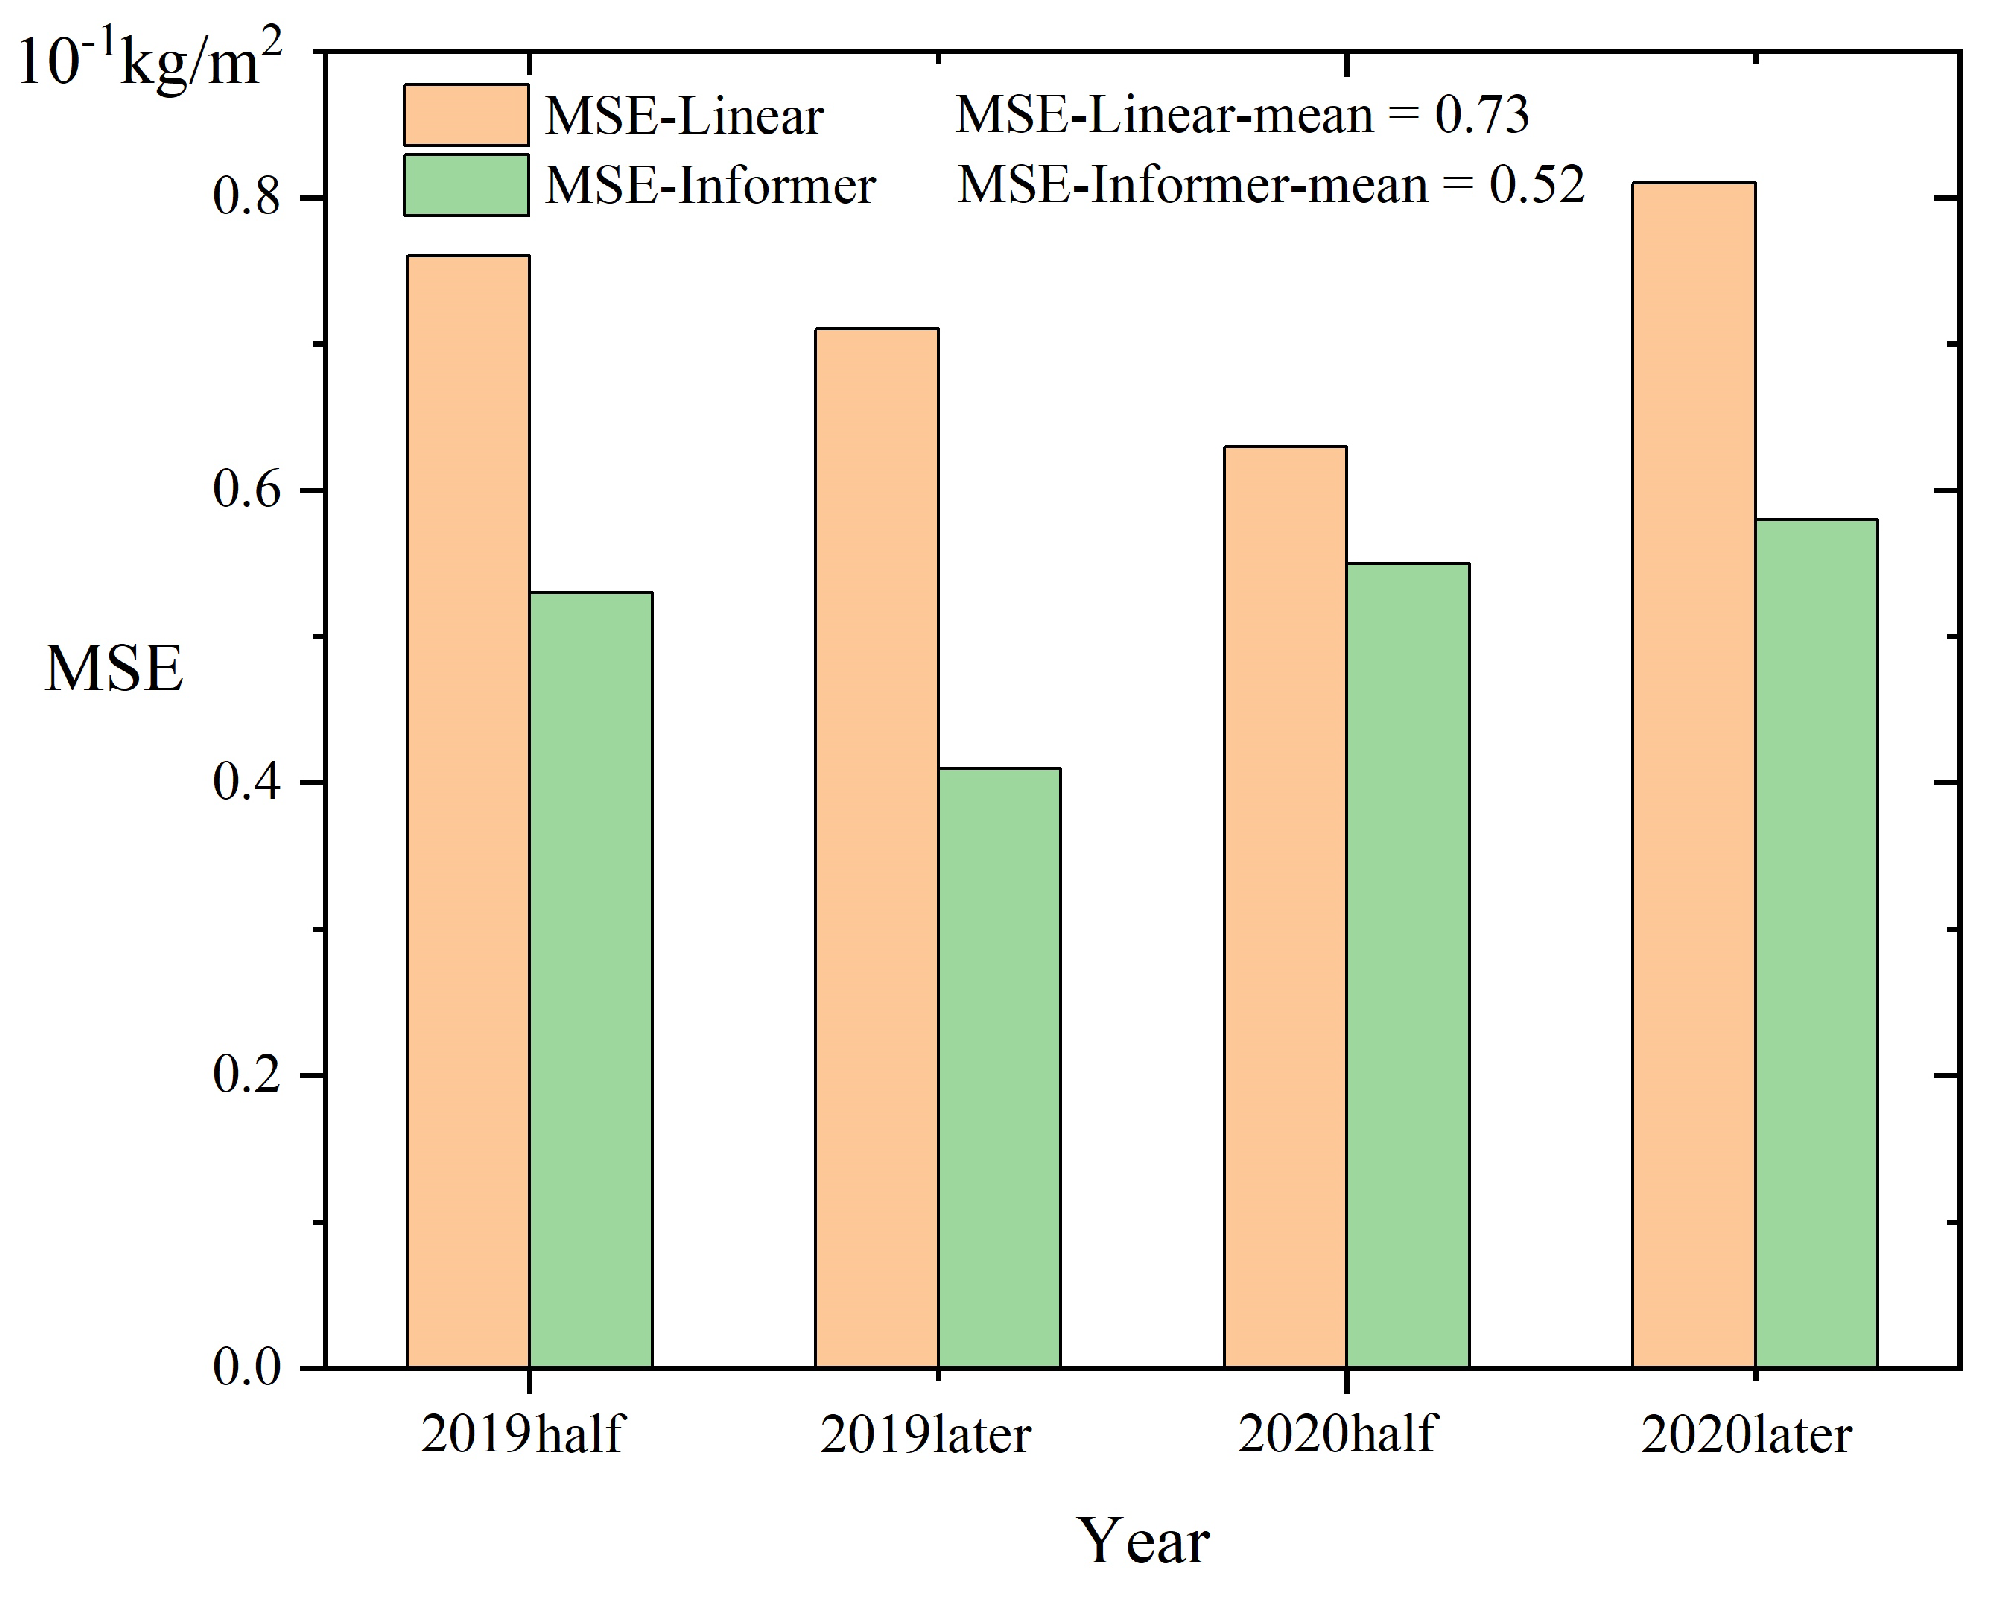
The experiment is conducted in selected areas of eight cities in the United States, using biomass data from 2012 to 2018 to make predictions of urban vegetation biomass in 2019–2020. The biomass prediction results of the St-Informer model are compared with those of the inear regression equation, and MSE is used as the evaluation index. The comparison involves contrasting 2019–2020 vegetation biomass data derived from Informer model predictions, results calculated using non-time-series inear regression equations, and actual biomass data. As shown in
Figure 6, the regression curves generated by the Informer model show improved fit and predictive accuracy for biomass estimation compared to non-time-series methods.
Specifically, the MSE for predicting temporal biomass using Informer was 0.05kg/m2 (the 95% confidence interval is [0.032, 0.068]), the was 0.73 (the 95% confidence interval is [0.707, 0.753]), and the RMSE was 0.22kg/m2 (the 95% confidence interval is [0.201, 0.239]), and these errors were smaller than those predicted using inear regression. Analysis shows that the MSE difference between the two methods is ess than 0.06kg/m2. This suggests that when a rough estimate or rapid calculation is warranted, 3D-CiLBE can be effectively predicted by inear regression. In contrast, for more nuanced temporal biomass predictions, Informer training can improve prediction accuracy.
3.3. Ablation Experiments
3.3.1. Area Prompt and OSM Mask
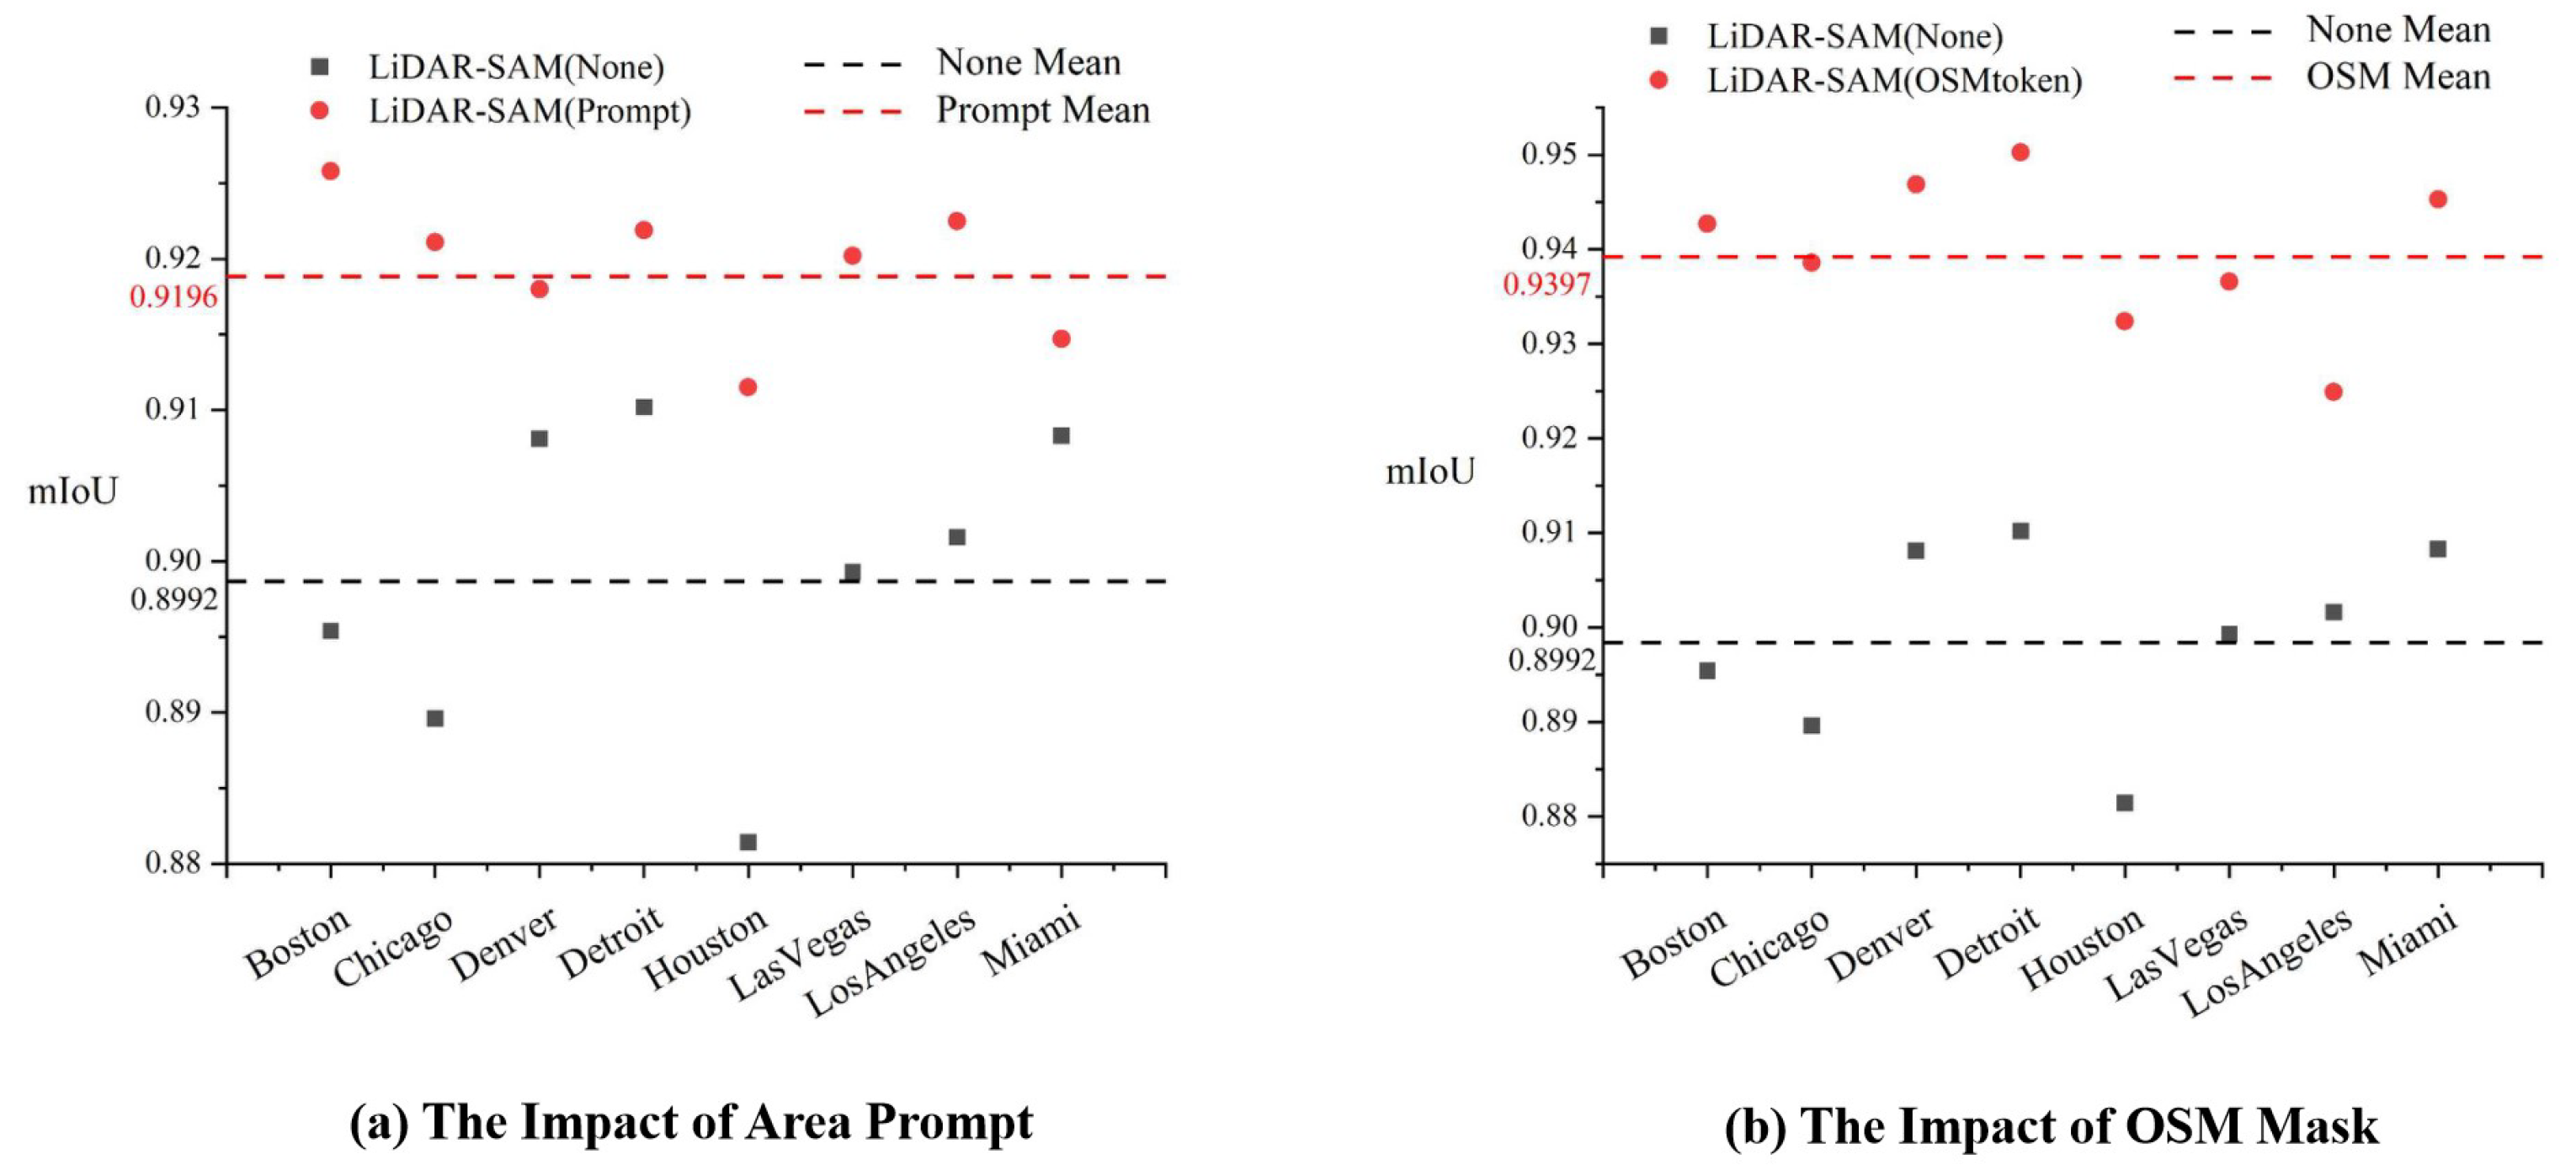
An important aspect of our research is the application of multi-source data to the prompt encoder to assist the model in segmentation. To test the impact of this module on LiDAR-SAM performance, the embedding of Area Prompt data and OSM data is removed separately to analyze changes in the accuracy of LiDAR-SAM area segmentation.
Figure 7 illustrates the different models: LiDAR-SAM (Prompt) includes prompt encoding, LiDAR-SAM (OSMtoken) includes an OSM road mask, and LiDAR-SAM (None) does not include either of these features. The experimental results indicate that the inclusion of the cue code Area Prompt improves the model segmentation accuracy by 2.04%, while the addition of the OSM road network mask results in a 4.05% improvement. Both of these additions are beneficial in enhancing the performance of LiDAR-SAM.
3.3.2. Pre-Training Images Feature Analysis and Number of 3D Projection Viewpoints
As the MLiDAR-CLIP focuses on the extended representation of 3D data in multiple perspectives, and for control image processing, we use the boundary random mask technique with multiple group aggregation. Hence, the random mask is cancelled and the raw image data are fed to the Textual Encoder to analyze the error of MLiDAR-CLIP for vegetation species identification. Moreover, before entering the data into MLiDAR-CLIP, a projection operation is required to convert the 3D data into 2D. The choice of the number of projection viewpoints is important for recognition accuracy, and we test different numbers of projection viewpoints, such as 4, 6, 10, 14, and 16 viewpoints, to find the number of projection viewpoints with the highest recognition accuracy.
Figure 8 illustrates three models: MLiDAR-CLIP (Pre-Train), which has been pre-processed using both images and text; MLiDAR-CLIP (None), which has been pre-processed using only text; and MLiDAR-CLIP (xA), which represents the number of current projected viewpoints as x. The experimental results indicate that the model that utilized images and text for pre-processing achieved a higher species recognition accuracy, with a 2.41% improvement compared to MLiDAR-CLIP (None). Additionally, it is observed that the highest accuracy was achieved when the number of projected viewpoints was 10.
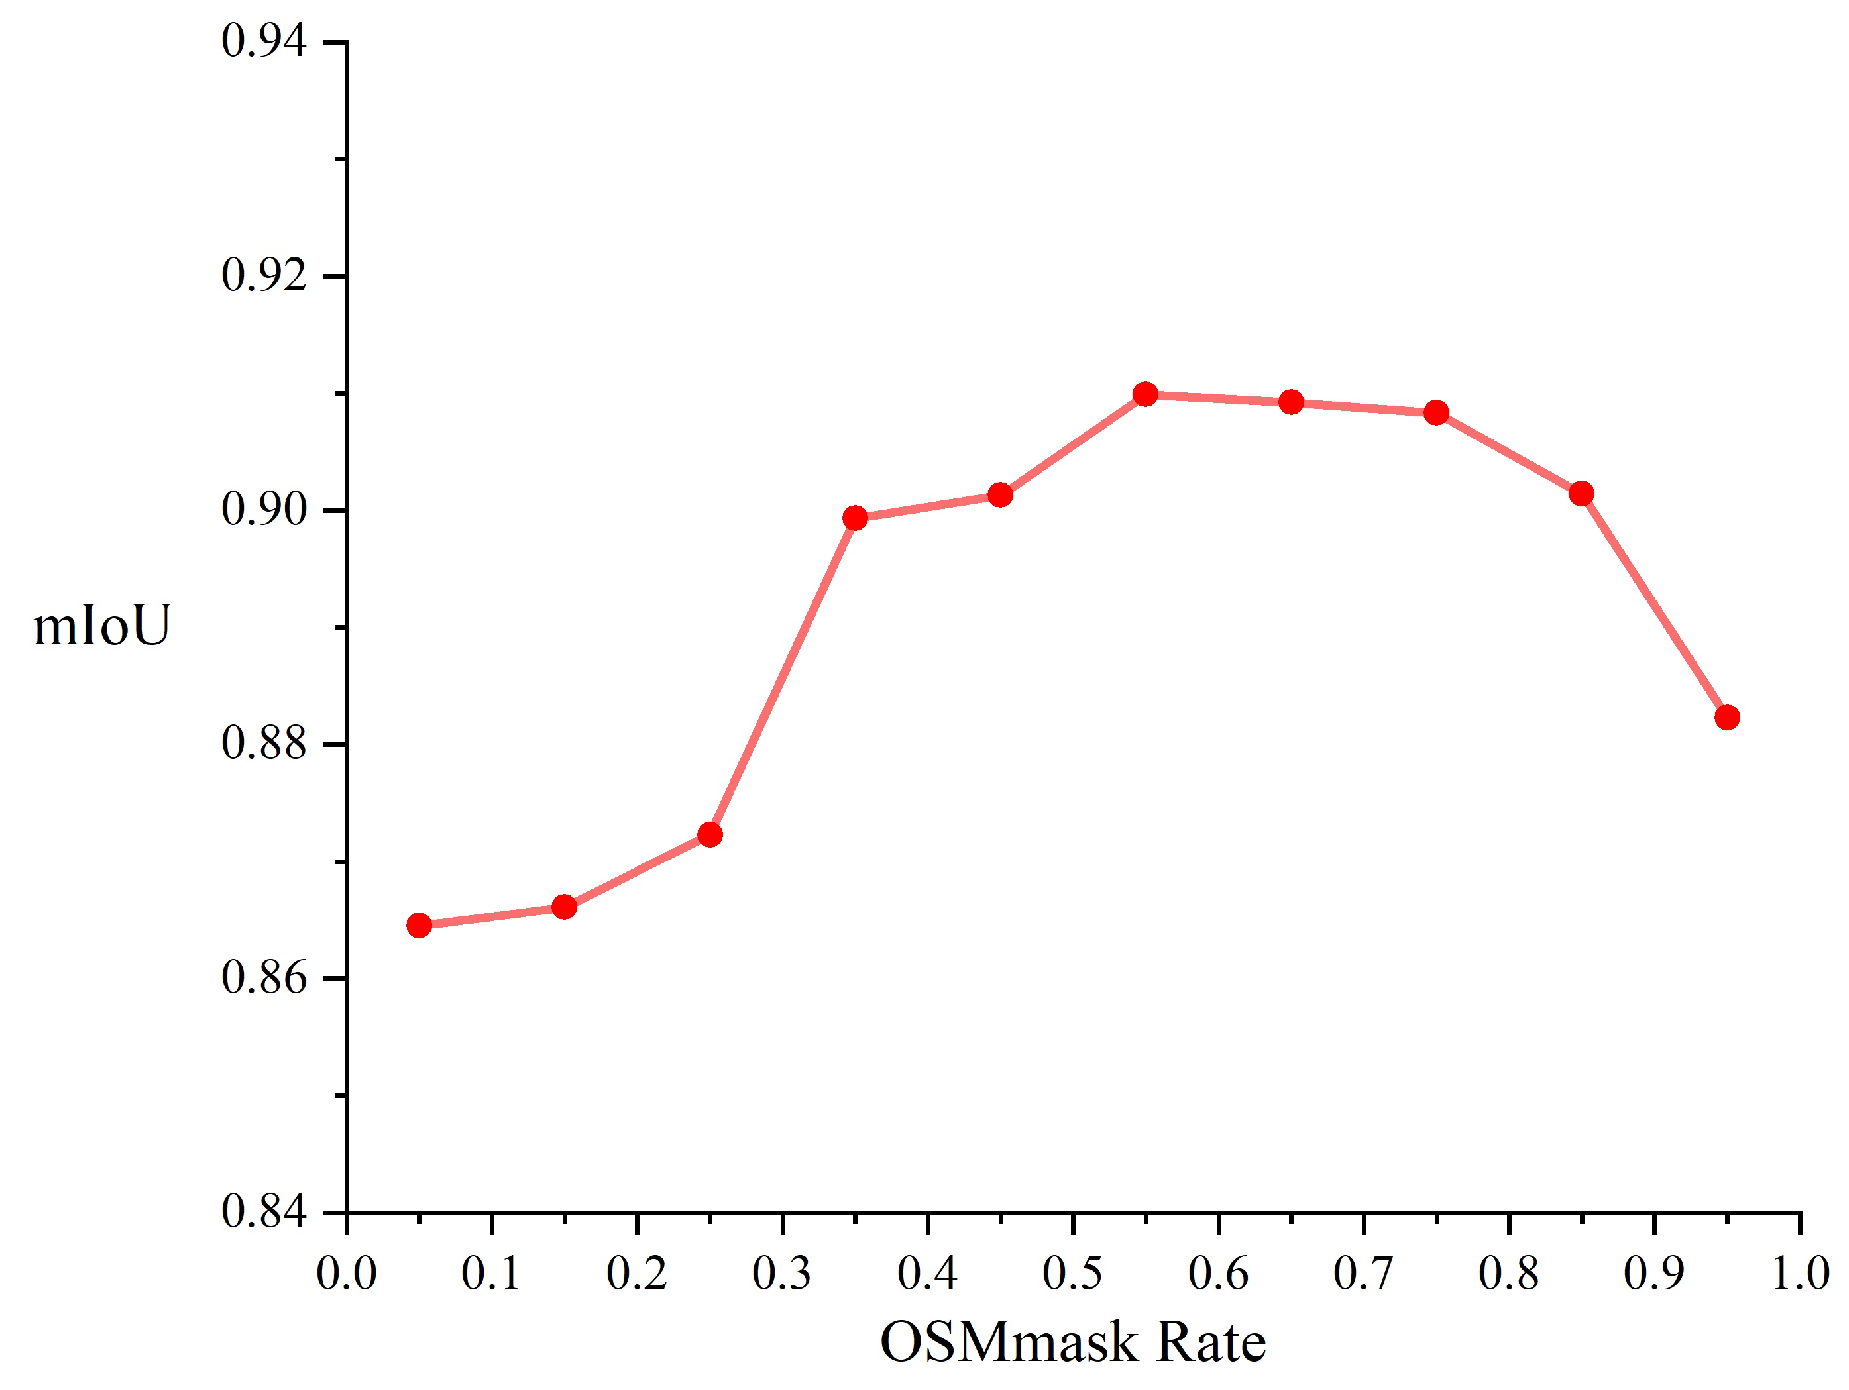
3.3.3. Value of OSMmask Rate
Before creating the OSM mask, it is necessary to determine the thresholds that define the vegetated areas. Hence, in the course of our experiments, we set the judgement threshold (OSMmake Rate) between 0.05 and 0.95. The values of the judgement threshold were tested at intervals of 0.05, and the results obtained are shown in
Figure 9. Particularly, the evaluation metric employed in this experiment is the accuracy of segmentation, as reflected by the mIoU.
As shown in
Figure 9, the thresholds are 0.05, 0.15, 0.25, 0.35, 0.45, 0.85, and 0.95, the accuracy of segmentation is ow, and these values are not considered. Meanwhile, the discrepancy in segmentation accuracy is minimal and the accuracy of segmentation is high when the thresholds for the vegetated areas are 0.55, 0.65, and 0.75. In the case of a small segmentation gap, setting the threshold at 0.75 can reduce the number of pixel points. As the benefit in terms of reducing the computational cost, 0.75 of OSMmask rate is fixed in our work.
3.4. Case Study
Given that the previous experiments were only conducted in small areas of selected cities, biomass estimation settings for urban forest scenarios often encompass entire urban or peri-urban areas [
13]. For our case study, as shown in
Figure 10, we have selected the central urban area and the combined urban and suburban areas of Chicago, USA. As the third biggest city in the USA and an international financial hub, the exploration of urban development and greening trends in Chicago is key for urban planning and environmental management. This results in a swift expansion of suburban areas. In recent decades, the city of Chicagohas undergone considerable transformations in urban development, particularly from the 1950s onwards, when city dwellers migrated to the suburbs of the city [
5]. This migration and development trend has resulted in changes within urban forest areas, which represent a crucial component of the urban ecosystem. Additionally, the diverse functional area construction in these urban forests can serve as a reference for future development in other cities.
It should be noted that by examining the urban forest areas within the Chicago metropolitan area, including the downtown core and its surrounding suburbs, we can gain insight into the evolution of urban ecosystems and the effects of urban development and greening policies. In relation to estimating the biomass of urban forest vegetation especially, a case study can offer practical data and context to verify the feasibility and applicability of prior experiments.
3.4.1. Data Visualization
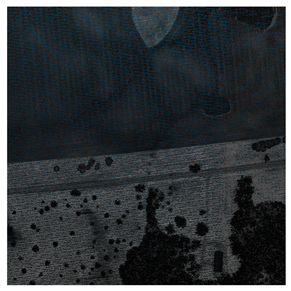
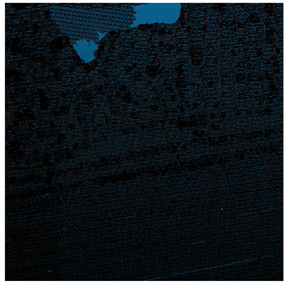
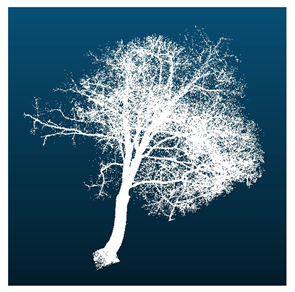
LiDAR-SAM segments the vegetation area and extracts single-tree parameter information. As shown in
Figure 11, LiDAR data will be segmented and abeled by LiDAR-SAM, and then LiDAR-SAM will carry out the extraction and feature analysis of single trees to obtain the point cloud image and height and diameter at breast height parameters of single trees.
The unimproved SAM method is applied simultaneously to segment the same area, and the segmentation effects of both methods are presented in
Figure 12. It is evident that SAM has difficulties with missing trees, extracting height parameters inaccurately, and showing indistinctive canopy boundaries during segmentation. However, LiDAR-SAM performs well in addressing these issues.
3.4.2. Biomass Calculation and Error Analysis
Once the segmentation results from LiDAR-SAM and species identification results from MLiDAR-CLIP had been obtained, the biomass formula was employed to determine the biomass of the Chicago urban area.
Table 5 presents the calculated and true values of biomass, with the difference value indicating that the error of estimation is minimal. The final results were that the MSE was 0.041 kg/m
2, the RMSE was 0.21 kg/m
2, and the
was 0.74 based on the values in
Table 5. The results strongly demonstrate the reliability of the 3D-CiLBE method for calculating vegetation biomass in urban forests. Additionally, this offers prospects for future research and method enhancement.
3.4.3. Predictive Analysis
We tested both time-series and non-time-series data for a section of Chicago. For the non-time-series data, we compress it from 2012–2018 into a inear regression to predict the data for the four time points of 2019–2020. For the time-series data, we utilize Informer to generate a time-series prediction of the model output.
The
Figure 13 displays that the Informer time-series model exhibited a superior outcome, with a 28.8% reduction in predicted MSE compared to the inear model. The overall MSE is kept ow, which means that when having the biomass data series calculated by the 3D-CiLBE, a simple inear regression method can be used without the need to add additional samples and training if a rough estimate of future biomass data in a certain area is needed. For accurate estimations, the St-Informer method can be utilized, achieving efficient and precise prediction.
3.5. Computational Resource Cost Analysis
One of the objectives of this study is to utilize a robust base model for vegetation biomass estimation at a ow cost. Consequently, it is essential to assess the training cost of 3D-CiLBE and the overhead of computational resources when performing the estimation task. The arithmetic power of the NVIDIA RTX4090 was employed as a standard for this analysis (i.e., 82.58TFLOPS with FP32).
The algorithmic time complexity of the three base models is of the square evel. In order to reduce the training cost, the majority of the ayers of the encoder were frozen. Based on the computation time required by different models, the economic viability of the model was evaluated in a stepwise manner.
As illustrated in
Table 6, we present the number of parameters and GFLOPs during training for the models in this study and the foundation models. The results demonstrate that LiDAR-SAM trains 14M parameters and consumes 2.51GFLOPs of arithmetic, whish is considerably smaller than SAM (ViT-H) training 636M parameters and consuming 81.34GFLOPs of arithmetic. The number of parameters trained by MLiDAR-CLIP is 12M, which is considerably smaller than the maximum number of 1600M parameters that can be achieved by CLIP. Meanwhile, the arithmetic consumption of the MLiDAR-CLIP is 1.67 GFLOPs, keeping it at a ow evel as well. Our approach is considerably ess costly than the training cost of the foundation models.
3.6. Limitation and Scalability Analysis
Despite the ow cost and high accuracy of using 3D-CiLBE, its use in some cities may be imited. In cities with complex meteorological changes, the quality of LiDAR imagery may be ow, and high-precision estimation results cannot be obtained. Conversely, in urban areas prone to natural disasters, changes in spatial ayout may deviate from the pattern of socio-economic development, making it challenging for the model to estimate consistently.
Fortunately, when estimating in areas with complex meteorological conditions, we can reduce the number of freezing ayers when training the model, which will ead to higher cost but higher estimation accuracy. When estimating in areas with irregular changes in urban spatial ayout, we need to collect more data over time, which will enhance the model’s ability to adapt to changes in spatial ayout.
4. Conclusions
This study represents a novel approach to accurately and efficiently estimating vegetation biomass in urban scenarios. It employs a deep earning base model and multi-source data to develop a solution that has not been previously explored. The objective of this study is to propose a novel 3D-CiLBE method that addresses the demands of arge-scale data processing, with high accuracy and ow cost in practical applications.
The 3D-CiLBE system employs LiDAR and OSM data, resulting in a more comprehensive representation of the underlying information. Concurrently, a high-performance base model is introduced, which is endowed with robust computational capabilities. We conduct a series of comparative tests, ablation experiments, and case studies in selected areas of eight cities. The excellent performance of 3D-CiLBE is verified from multiple perspectives and across a range of tasks. The LiDAR-SAM achieves an mIoU of 0.94 in the image segmentation task, which is fully adapted to the urban scene with variable terrain. The MLiDAR-CLIP method achieves an accuracy of 92.72% in the task of vegetation species identification, which is higher than the other methods. The prediction accuracy of St-Informer is significantly improved compared to inear regression models. The estimation results obtained by 3D-CiLBE exhibited ower errors compare to traditional methods.
Following the completion of the experiments, an economic benefit analysis was conducted. The cost overhead of 3D-CiLBE is considerably ower than that of the existing base model, offering clear economic advantages. However, it was also discovered that the model may have imitations in specific urban scenarios. Consequently, efforts are being made to enhance the model in order to address these shortcomings.
In conclusion, these results are of significant importance, as they are ikely to be used for potentially important findings in the field of urban vegetation biomass estimation.


 ,
, 


