Article

Potential of Apple Vision Pro for Accurate Tree Diameter Measurements in Forests

1
Department of Forest- and Soil Sciences, Institute of Forest Growth, University of Natural Resources and Life Sciences (BOKU University), 1180 Vienna, Austria
2
Department of Forest- and Soil Sciences, Institute of Forest Engineering, University of Natural Resources and Life Sciences (BOKU University), 1180 Vienna, Austria
*
Author to whom correspondence should be addressed.
Remote Sens. 2025, 17(1), 141; https://doi.org/10.3390/rs17010141
Submission received: 5 November 2024 / Revised: 16 December 2024 / Accepted: 30 December 2024 / Published: 3 January 2025
(This article belongs to the Special Issue Remote Sensing and Smart Forestry II)

Abstract

:
The determination of diameter at breast height (DBH) is critical in forestry, serving as a key metric for deriving various parameters, including tree volume. Light Detection and Ranging (LiDAR) technology has been increasingly employed in forest inventories, and the development of cost-effective, user-friendly smartphone and tablet applications (apps) has expanded its broader use. Among these are augmented reality (AR) apps, which have already been tested on mobile devices for their accuracy in measuring forest attributes. In February 2024, Apple introduced the Mixed-Reality Interface (MRITF) via the Apple Vision Pro (AVP), offering sensor capabilities for field data collection. In this study, two apps using the AVP were tested for DBH measurement on 182 trees across 22 sample plots in a near-natural forest, against caliper-based reference measurements. Compared with the reference measurements, both apps exhibited a slight underestimation bias of −1.00 cm and −1.07 cm, and the root-mean-square error (RMSE) was 3.14 cm and 2.34 cm, respectively. The coefficient of determination (R2) between the reference data and the measurements obtained by the two apps was 0.959 and 0.978. The AVP demonstrated its potential as a reliable field tool for DBH measurement, performing consistently across varying terrain.

Graphical Abstract

1. Introduction

Accurate forest inventories are essential for informed forest management decisions, as they provide critical data and characteristics of forest stands, including timber stock [1]. Growing stock timber volume is calculated from the sum of individual tree volumes, which are typically determined using the diameter at breast height (DBH), defined as 1.3 m above ground level [2], along with tree height and a form factor [3]. In addition to its role in volume estimation, DBH is a key parameter from which many other forestry-relevant metrics are derived, such as tree growth, basal area, and biomass of the root system [4,5,6].
Traditionally, DBH is measured manually using tools like calipers or tape measures [2]. While effective, these methods can be time-consuming and labor-intensive [7,8]. To overcome these challenges, alternative approaches have emerged, such as remote sensing technologies like Light Detection and Ranging (LiDAR) sensors, as well as advanced digital applications that use video and photo analysis [9,10,11,12,13]. With their integration into low-cost, user-friendly smartphone and tablet applications (apps), these technologies have gained significant popularity [14]. Most recently, LiDAR-based augmented reality (AR) and mixed-reality (MR) smartphone apps have been used to determine the DBH [11,12,13,15,16,17,18,19,20,21].
AR involves the projection of virtual content into the real-world environment. In contrast, virtual reality (VR) refers to a fully immersive experience where the user’s entire environment is rendered virtually, and interactions with this virtual space can be manipulated haptically. When aspects of both AR and VR are combined, allowing the operator to interact with both the physical and virtual environments simultaneously, this is referred to as mixed reality (MR) or extended reality (XR) [22,23]. Apple (Apple Inc. Cupertino, CA, USA) first launched the Apple Vision Pro (AVP) in the United States in February 2024. The device became available for purchase in Europe by mid-July 2024, with a retail price of approximately € 4.000 [24]. The AVP enables interactive control of the environment and can blend virtual elements over the real environment, creating a mixed-reality interface (MRITF) [23,24,25,26], very similar to Microsoft’s HoloLens (Microsoft Corp., Redmond, WA, USA) [27]. Although the Microsoft HoloLens has been available for several years and has been the focus of numerous studies [28,29,30,31], the AVP distinguishes itself as a newer technology that incorporates an integrated LiDAR scanner, a feature not present in the HoloLens. This advancement offers significant opportunities for exploration within our research context, making the AVP a particularly suitable choice for this study.
The AR and MR apps used for measuring DBH in various scientific studies to date include ‘Arboreal Forest’ [32], ‘ForestScanner’ [16], ‘ARTreeWatch’ [20], and ‘Measure App’ [33]. These applications rely on various technologies to capture tree dimensions, enabling rapid DBH measurements. ‘Arboreal Forest’ is a Swedish app developed for iOS devices that leverages close-range LiDAR sensing and augmented reality to assist in measuring tree dimensions, such as DBH and height [32]. For DBH measurements, the app requires the user to maintain a distance of around 50 cm from the trunk, ensuring that both edges of the trunk are visible on the smartphone’s screen to obtain an accurate diameter measurement [17,32].
‘ForestScanner’ uses a time-of-flight LiDAR sensor, operating on iOS devices with built-in LiDAR sensors, to acquire a 3D point cloud of the surrounding surfaces as the user moves the device. The point cloud is generated in real-time and displayed on the screen with colorized RGB information from the camera. The app tracks the device’s relative position using the inertial measurement unit (IMU), although it does not employ simultaneous localization and mapping (SLAM), a method used to map an environment while keeping track of the device’s location within it. For DBH measurements, ‘ForestScanner’ applies instance segmentation using the YOLACT++ network [34], which detects tree stems in real time. The app then fits a circle to the tree’s cross-section by minimizing the sum of squares, using the Levenberg–Marquardt algorithm [35] to estimate the tree’s diameter [16].
‘ARTreeWatch’, in contrast, uses RGB images from the smartphone’s camera, along with its position and orientation data from the IMU, to generate point clouds through ARCore’s application programming interface (API). ARCore, a platform developed by Google [36], allows augmented reality experiences on smartphones without requiring a time-of-flight (TOF) camera, making AR applications more accessible [20]. Key ARCore features, such as motion tracking and plane detection, are used to position an AR-ruler at 1.3 m on the tree trunk, which serves as a reference for capturing the point cloud around the trunk. The DBH is then calculated by projecting the point cloud into a 2D stem profile and using the least squares method to estimate the diameter [20].
The ‘Measure App’ offers a simpler approach to tree measurement, using the LiDAR sensor in combination with augmented reality to assist in manual diameter measurements. While it provides a basic, free solution, it lacks advanced features such as automated data processing or the ability to handle large-scale inventories. Data can be shared via email or messaging, but the app does not include dedicated data transfer protocols [11,18,33].
Although these apps provide practical tools for field measurements, they are limited by the capabilities of handheld devices, such as smartphones and tablets. The interaction with these devices is limited to the screen, and while their environmental tracking works, it does not offer the same immersive experience as more advanced mixed-reality systems.
The main objective of this study was to assess the feasibility of DBH measurements using the AVP across different natural forest stands, tree species, and terrain conditions. To achieve this, DBH measurements from two different MRITF-derived applications were compared against manual reference measurements conducted by two different field workers. The measurement accuracy was evaluated by calculating the differences between the app-based and manual reference measurements.
The reference and app measurements, first-person-view application videos, and application pictures from the field measurements were made freely available (Creative Commons Attribution 4.0 International License—CC BY 4.0) under doi: https://zenodo.org/records/14040646 (accessed on 5 November 2024).

2. Materials and Methods

2.1. Study Area and Sample Plots

Data were recorded in the BOKU University training forest, which is located near the village of Forchtenstein on the border between the Austrian federal states of Lower Austria and the Burgenland (UL: 47.73691°N, 16.25093°E; LR: 47.67911°N, 16.30909°E). The BOKU Institute of Forest Growth has been conducting a permanent forest inventory in the training forest since 1989, measuring 554 systematically arranged sample plots [37].
To capture a range of stand and environmental variability, 22 sample plots were selected from these 554 available plots. These selected plots, which have also been used in previous studies [10,38,39,40], were measured in August 2024 under sunny and dry weather conditions. A total of 182 trees were recorded across the 22 plots, representing six different species: Picea abies (L.) H. Karst. (n = 53), Abies alba Mill. (n = 2), Pinus sylvestris L. (n = 8), Fagus sylvatica L. (n = 117), Alnus glutinosa (L.) Gaertn. (n = 1) and Ulmus glabra Huds. (n = 1). Of the total number of trees, 63 were conifers and 119 were deciduous trees. For the purposes of analysis, all conifers and deciduous trees were grouped into their respective tree species classes and will be referred to as ‘tree classes’ throughout the remainder of this study. On average, each sample plot contained 8.27 trees. The diameter at breast height ranged from 5.4 cm to 61.1 cm, with a mean of 28.02 cm and a standard deviation of 14.05 cm. The tree density across the plots ranged from 195 to 1040 trees per hectare, with a mean of 538 trees/ha and a standard deviation of 237.50 trees/ha. The slope of the plots varied between 3.8° and 28.9°, with a mean slope of 15.97° and a standard deviation of 7.66°.
All trees with a DBH greater than 5 cm, measured on a circular sample plot with a constant radius of 7 m, were selected. The DBH was measured with a caliper at a height of 1.3 m above the ground, ensuring that the measurement was taken perpendicularly to a radial line towards the center of the sample plot. The exact position of the calipers’ arms touching the tree was marked with chalk (see Figure 1a). Additionally, the species of each individual tree was recorded.

2.2. Specification of the AVP and Apps Used

The Apple Vision Pro (AVP) (256 GB model, Apple Inc., Cupertino, CA, USA) used in this study weighs approximately 600 g. The device is powered by an external battery, adding an additional weight of 353 g, which provides operational power for up to 2 h [24]. The AVP is controlled exclusively through eye and hand tracking, without the use of a remote control, and also supports voice input for word commands [26]. If objects, side panels, or positions are ‘clicked’, they must be focused on with the eyes and then selected with a defined movement of the index and ring fingers, or they can be directly ‘clicked’ by tapping with any fingertip [24]. To enable this type of control and visualization, numerous sensors are built into the AVP (Figure 2), turning the device into an MRITF.
Two different mobile applications were used for the DBH measurements with the AVP:
  • Handsruler 1.1.1 [41] which will be referred to as ‘app HR’ in the following, did not allow changing any settings for the measurements. All measurements with this app are automatically rounded to whole centimeters. Only measurements greater than 10 cm were automatically stored in a chronological list within the app.
  • Tape Measure 3.4.9 [42] which will be referred to as ‘app TM’ in the following, was set to the ‘finger-ruler’ mode. This app also rounded measurements larger than 10 cm to whole centimeters. Measurements less than 10 cm are recorded with 0.1 cm accuracy. No measurement results could be saved within this app, as they could in the app HR.

2.3. Data Collection

At each sample plot, data collection was conducted by two field workers. The primary field worker at each sample plot first marked trees within a 7 m radius of the sample plot center, using chalk to assign an internal tree ID and to indicate the reference measurement height on each tree. Stem distribution maps from [10] were used to aid in locating and orienting within the sample plots. The second field worker recorded the tree species and the calipered DBH for the respective trees.
After completing the reference measurements, the same field worker who performed the caliper proceeded to measure DBH using the two AVP apps, beginning at the sample plot center. Measurements were consistently taken first with app HR, followed by app TM. The second field worker then noted the DBH values for each app as announced by the measuring field worker. Although app HR did automatically log measurement results (see Section 2.2), these stored values were not used, and only the values announced by the measuring field worker were recorded. Each field worker measured the respective trees at 11 different sample plots (see Table A1). Due to the different number of trees on the sample plots, person 1 measured 81 trees, while person 2 measured 101 trees.
To ensure data accuracy and reliability, screen recordings were made with the AVP during each measurement session, capturing the process from a first-person perspective. However, these recordings served solely as a supplementary measure and were not used to obtain measurement results. Only the values verbally reported by the measuring field worker were recorded. The roles of measuring and noting results were alternated between the two field workers in every sample plot.
For app HR, the thumb and index finger of the right and left hand were recognized as the limits of the measuring tape. These were positioned at the height of the reference measurement mark in the direction of the sample plot center on both sides of the tree. Pressing the thumb and index finger together started the measurements; repeating this movement with the other pair of fingers ended them and saved the result (see Figure 1b,c).
App TM also recognized the thumb and index finger of both hands as the boundary for the measurement. These were also placed at the height of the reference measurement mark in the direction of the center of the test circle on the respective trunk (see Figure 1b,d). No movement of the fingertips was necessary to start and end the measurements and no measurement results could be saved in this app with the measurement setting used. The complete sequence of measurements across all sample plots can be accessed in the images and videos at ‘https://zenodo.org/records/14040646’ (accessed on 5 November 2024), with the exception of five videos pertaining to app TM.

2.4. Accuracy of DBH Measurements

The precision and accuracy of the DBH measurements were assessed by means of the root-mean-square error (RMSE) and the bias. RMSE and bias were calculated based on the deviation between the AVP DBH measurement d b h ^ i and the corresponding clipped reference measurement d b h i . All calculations in this paper were carried out using the statistical computing language R (version 4.4.1) [43].
δ d b h = d b h ^ i d b h i
RMSE = 1 n i = 1 n δ d b h 2 .
bias = 1 n i = 1 n δ d b h .
R 2 = 1 i = 1 n d b h ^ d b h i   2 i = 1 n d b h i d b h   ¯ 2  
with
d b h ¯ = 1 n i = 1 n d b h i
RMSE and bias were calculated as relative measures (RMSE% and bias%) with these formulas too:
RMSE % = RMSE d b h ¯ × 100
bias % = bias d b h ¯ × 100

2.5. Evaluation of Statistic Significant Differences

To assess the statistical significance of differences between the two apps, a series of hypothesis tests were carried out on the residuals of the DBH measurements ( δ d b h ).
The assumption of normality was tested using the Shapiro–Wilk test. This test, applied using the shapiro.test() function from the STAT R package [44], indicated that the residuals significantly deviated from normality, with p-values less than 0.05. As a result, non-parametric methods were employed to ensure the robustness of the analysis.
A total of four Wilcoxon signed-rank tests were conducted using the wilcox.test() function from the STAT R package [44]. Two tests compared the residuals of the two apps (app HR and app TM) for coniferous and deciduous trees separately, and two additional tests compared the residuals for each measuring person. The p-values obtained from these tests were adjusted using Holm’s sequential Bonferroni procedure [45] to address the issue of inflated type I error rates due to multiple comparisons [46]. The corrected p-values are reported as pHolm. Statistical significance is indicated in the figures and the text as * p < 0.05, ** p < 0.01 and ns indicates that the difference is not statistically significant (p ≥ 0.05).
Effect sizes were calculated to provide a measure of the magnitude of the observed differences. Cohen’s d (d) was used for pairwise comparisons and was calculated using the cohensD() function from the lsr R package [47]. According to [48], a small effect size is defined as d = 0.2, a medium effect size as d = 0.5, and a large effect size as d = 0.8.
For analyses involving multiple factors, the absence of normality necessitated an alternative to traditional ANOVA. To address this, a permutation-based ANOVA was implemented, using a bootstrap approach to create a null distribution for the F-statistics. Bootstrapping, a resampling method described by [49], is particularly suited for situations where distributional assumptions are violated. This procedure ensures the robustness of the statistical conclusions by circumventing the limitations posed by non-normal data. The permutation ANOVA examined the main effects of the app and tree class, as well as their interaction.
Cohen’s f-values (f) were also calculated as a measure of effect size for the ANOVA models. First, the Eta-squared statistic (η2) was computed using the EtaSq() function from the DescTools R package [50]. The formula f = η 2 1 η 2 was then applied to convert the Eta-squared values into f. As outlined by [48], f = 0.1 indicates a small effect, f = 0.25 a medium effect, and f = 0.4 a large effect.
Pairwise post hoc comparisons were conducted using a permutation approach. These comparisons evaluated differences between specific combinations of the app and tree class. The procedure calculated mean differences and associated p-values through resampling, replacing the traditional Tukey test. The adjusted p-values from these post hoc analyses are reported as padj..

3. Results

3.1. Measurement Error of the AVP Apps

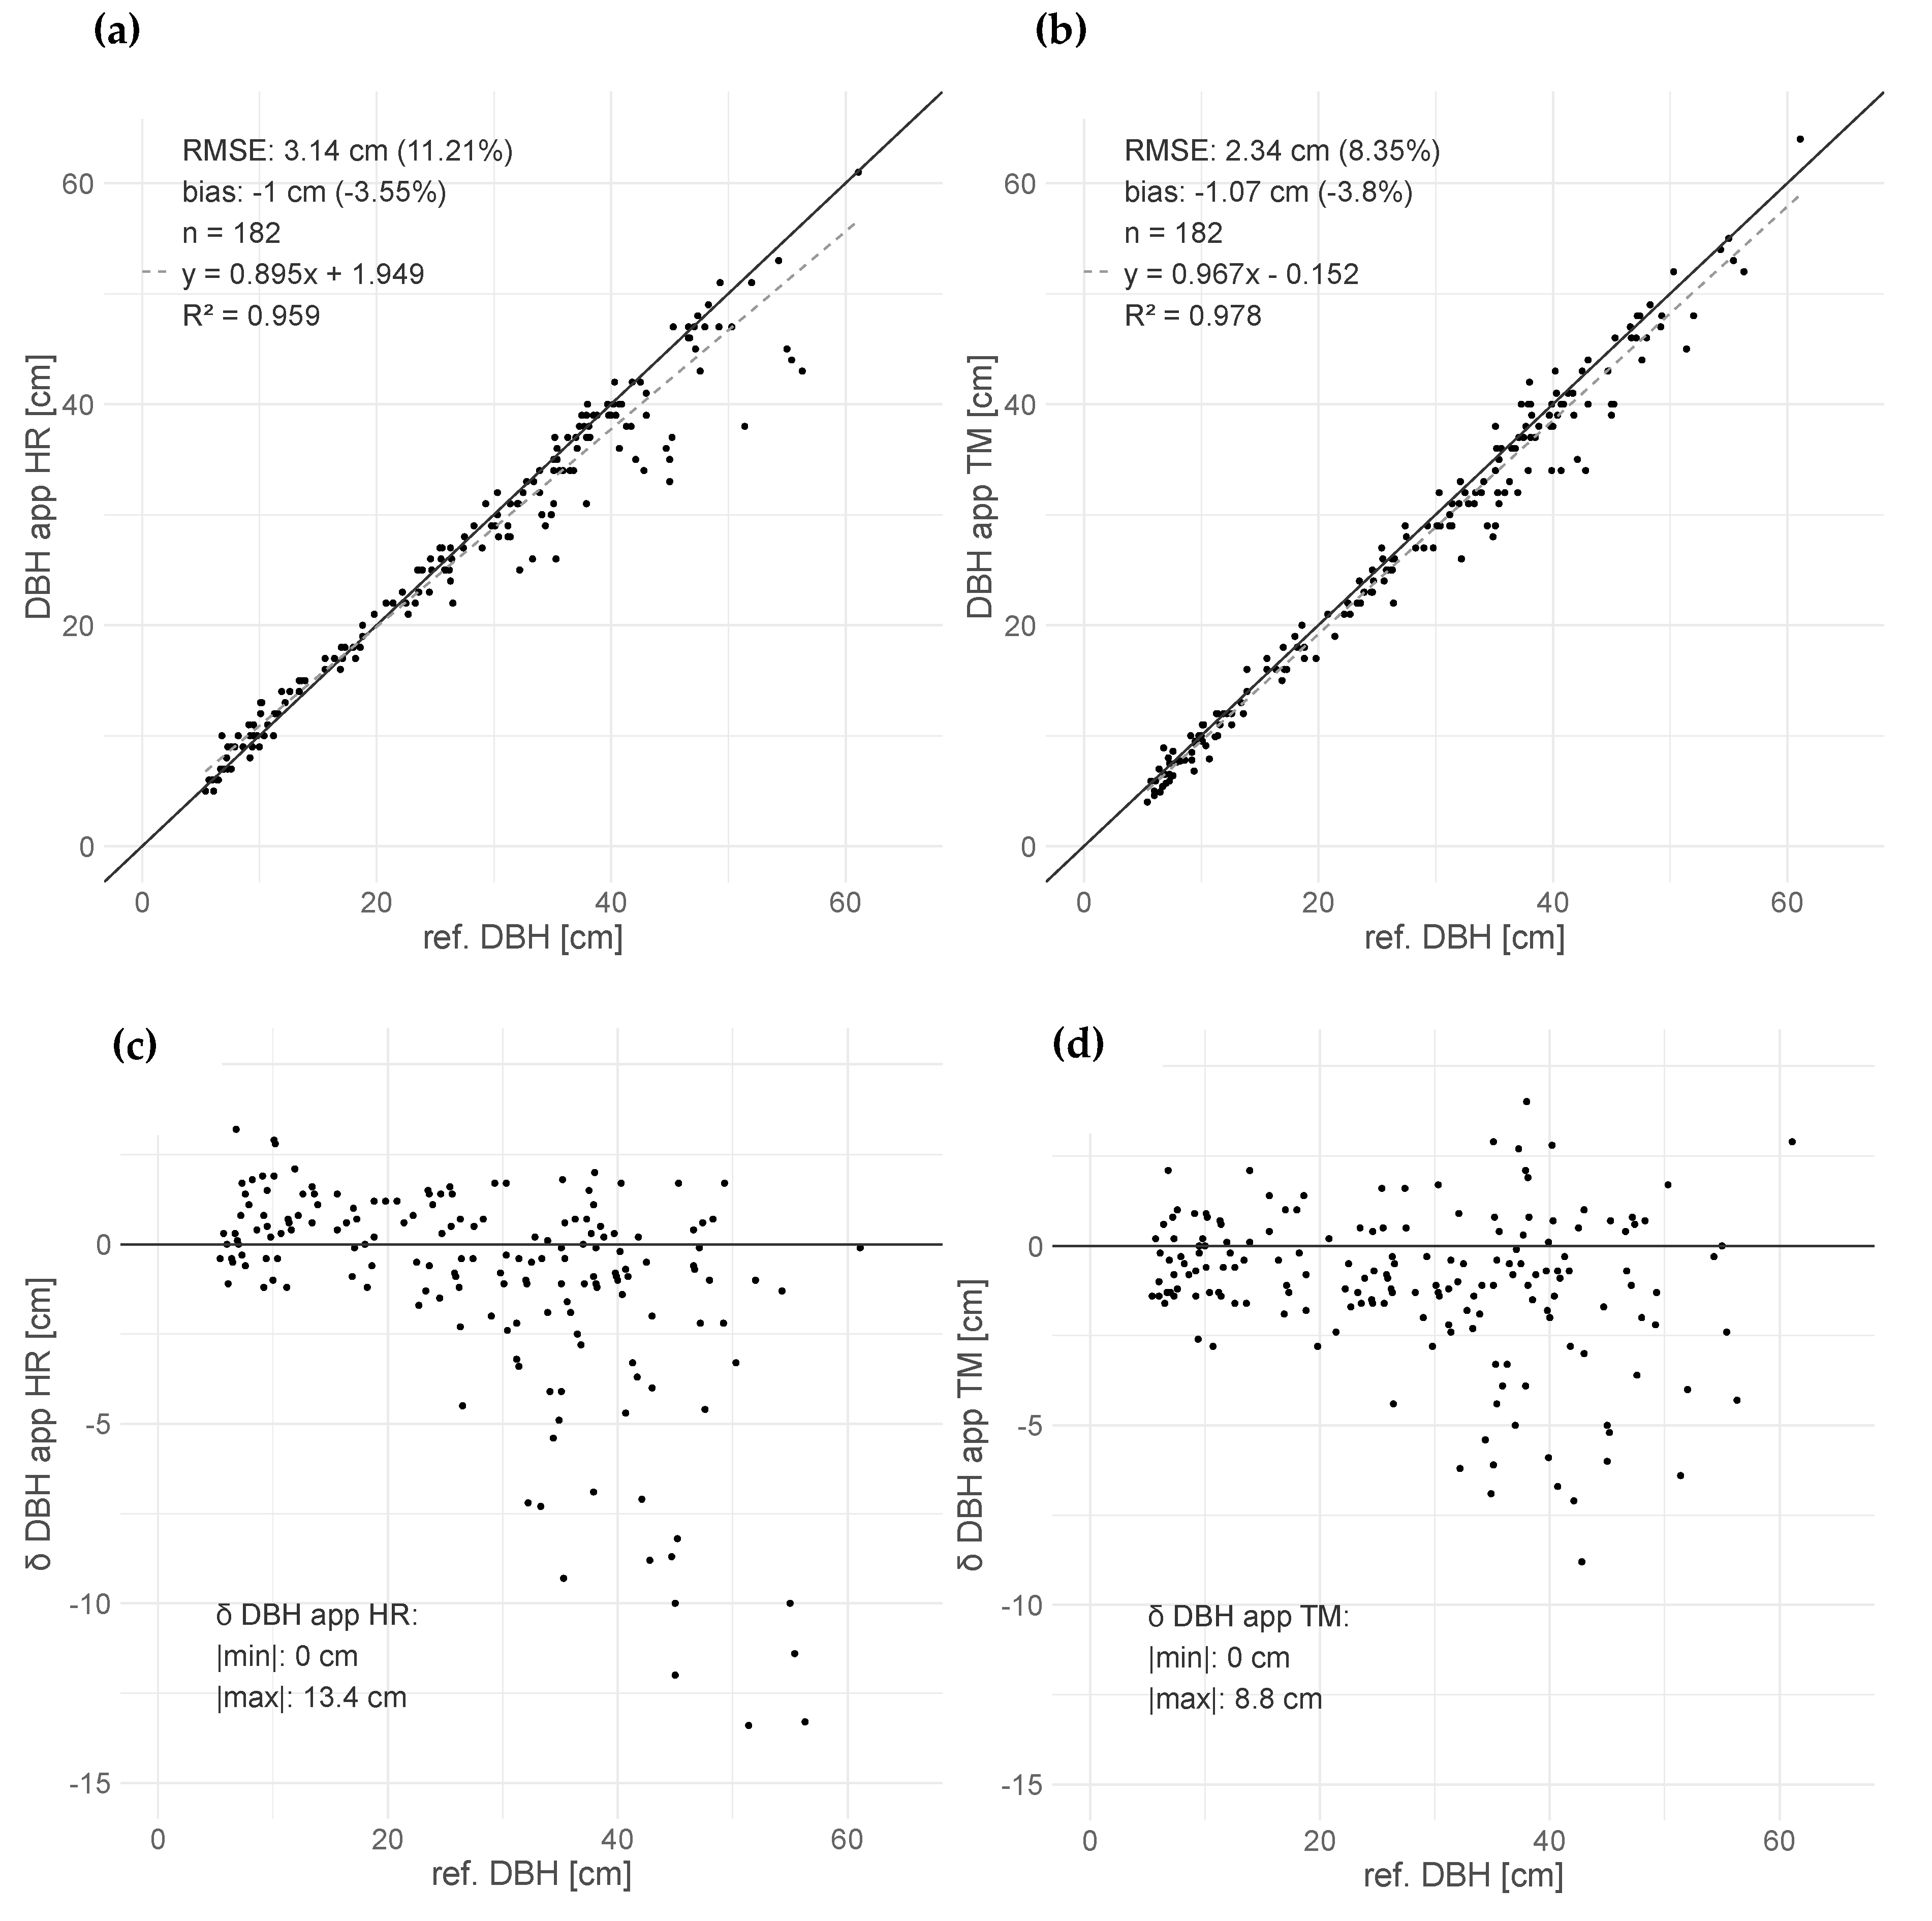
The measuring error ( δ d b h ) of both apps can be seen in Figure 3c,d. App HR shows the largest deviation of all measurements with an absolute error of 13.4 cm. App TM has a significantly lower maximum error of 8.8 cm. The RMSE is 3.14 cm (11.21%) and 2.34 cm (8.35%) for app HR and app TM, respectively. The bias of both apps is very close to each other with −1.00 cm (−3.55%) for app HR and −1.07 cm (−3.80%) for app TM (see Figure 3a,b). Both apps show an increasing underestimation with increasing DBH. App HR also shows a slight overestimation of the DBH up to approximately 10 cm DBH, which cannot be observed with app TM.
The Shapiro–Wilk test revealed that the residuals for app HR (W = 0.77619, p-value = 2.152 × 10⁻¹⁵, see Figure A1a) and app TM (W = 0.93425, p-value = 2.32 × 10⁻⁷, see Figure A1b) were not normally distributed. A paired Wilcoxon test indicated no significant difference between the residuals of the two apps (p = 0.1025 ns, d = 0.0289), with d suggesting a negligible effect size, indicating that the difference between the two apps is minimal.

3.2. Measuring Time with the AVP

The shortest time required for both apps at a sample plot was 1 min, the maximum duration was 10 min for app HR and 7 min for app TM. The average times per sample plot were 3.86 min (3 min 52 s) for app HR, and 3.23 min (3 min 14 s) for app TM, respectively. A comparison of the time required per sample plot showed that app TM was 16.47% faster than app HR, but this difference was not statistically significant (pholm = 0.0569 ns; see Figure 4). The effect size was d = 0.355, indicating a medium effect.

3.3. Comparison of Measurement Errors by Species and Field Worker

A total of 182 measurement trees were divided into two different tree classes. The tree class ‘conifers’ contained 63 trees, which included Picea abies (L.) H. Karst., fir (Abies alba Mill.), and Scots pine (Pinus sylvestris L.). The tree class ‘deciduous trees’ contained 119 trees, including beech (Fagus sylvatica L.), alder (Alnus glutinosa (L.) Gaertn.), and elm (Ulmus glabra Huds.). Across both applications, conifers exhibited a larger bias (−1.62 cm) compared to deciduous trees (−0.72 cm). App HR displayed a slightly larger bias for conifers (−1.91 cm) than app TM (−1.34 cm). For the deciduous trees, app TM showed a larger bias (−0.92 cm) compared to app HR (−0.51 cm).
To investigate the interaction effects between the applications and tree classes on the residuals, a permutation-based ANOVA was performed. The Shapiro–Wilk test indicated a significant deviation from normality (W = 0.85781, p-value = < 2.2 × 10⁻¹⁶), necessitating the use of the permutation approach. The analysis revealed no significant interaction between the app and tree class on the residuals (p = 0.0779 ns). The main effect of the app was not significant (p = 0.7854 ns), while the main effect of tree class was significant (p = 0.0011 **, f = 0.169), indicating that tree class plays a meaningful role in influencing residual differences.
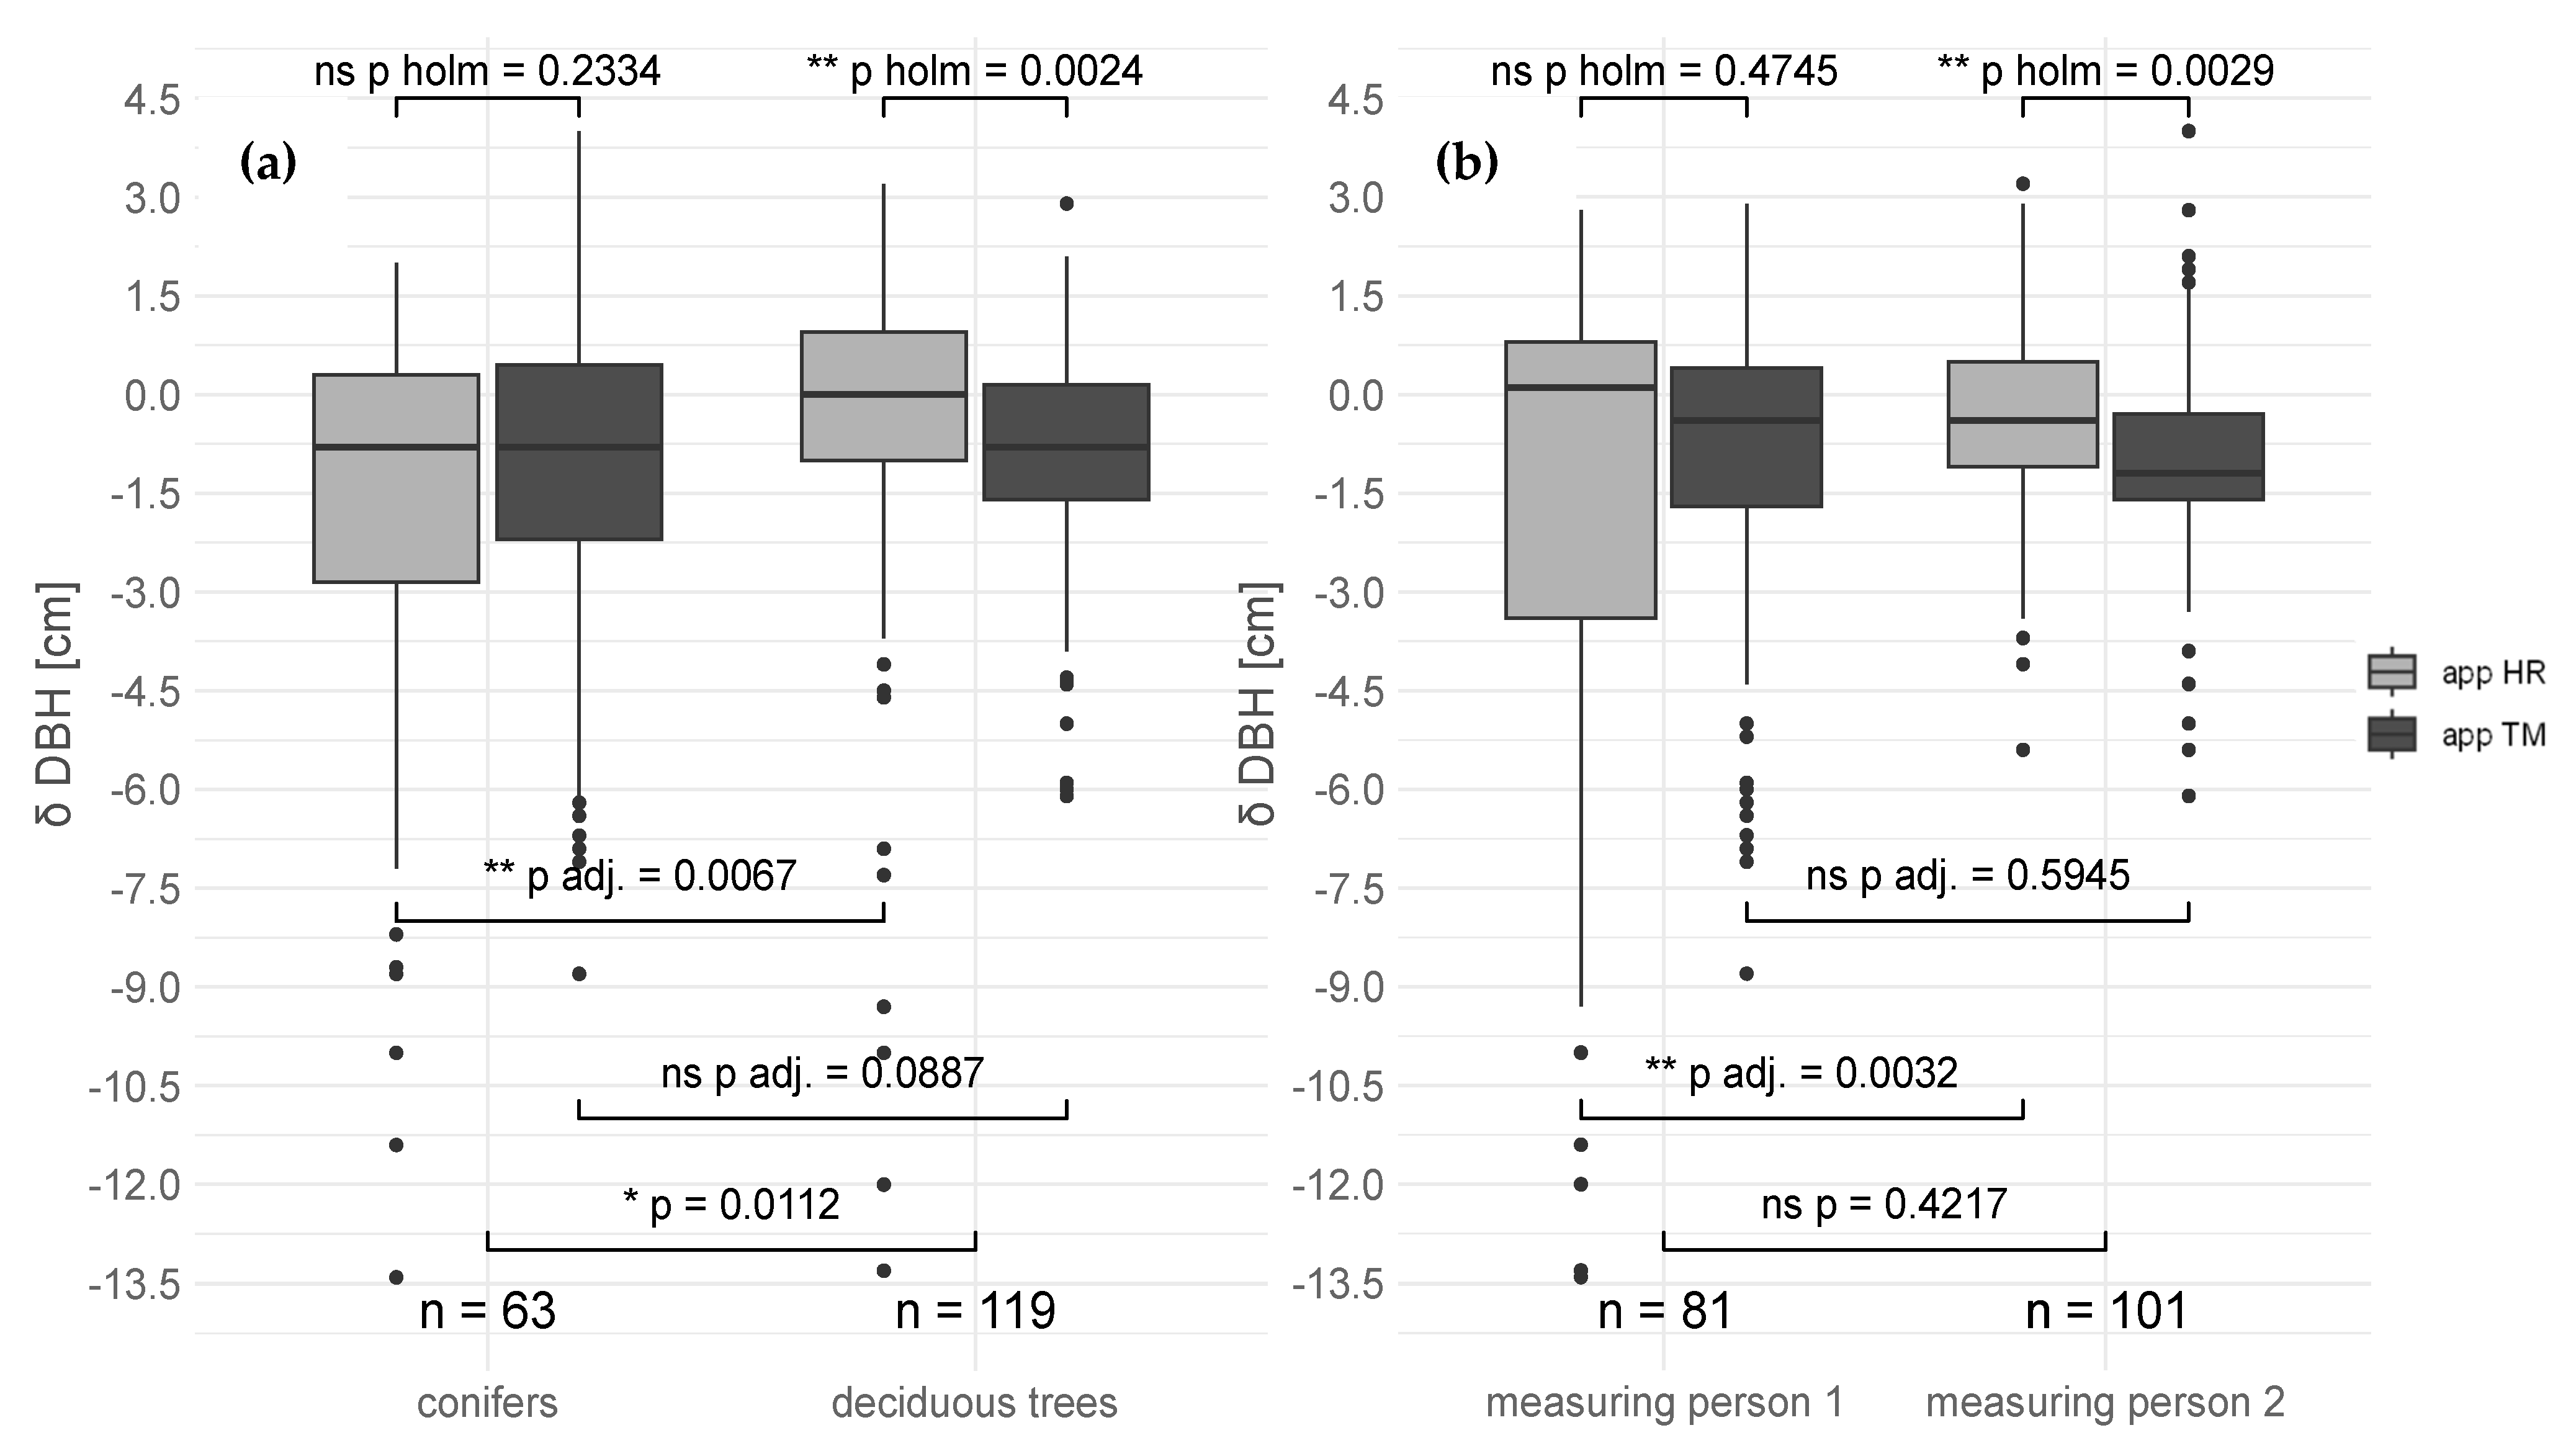
Post hoc pairwise comparisons showed a significant difference between coniferous and deciduous trees for app HR (padj. = 0.0067 **), while no significant differences were found between the tree classes for app TM (padj. = 0.2699 ns). Additionally, a significant difference was observed between app HR and app TM within deciduous trees (padj. = 0.0024 **), but no significant differences were detected for coniferous trees (padj. = 0.3052 ns) (see Figure 5a).
Paired Wilcoxon signed-rank tests were used to compare the residuals of app HR and app TM within each tree class. For coniferous trees, no significant difference was detected (pholm = 0.2334 ns, d = 0.185). For deciduous trees, a significant difference was found (pholm = 0.0024 **, d = 0.185), indicating that app TM and app HR yield systematically different results for this tree class (see Figure 5a).
Across tree classes, a Wilcoxon rank-sum test showed a significant difference between conifers and deciduous trees (pholm = 0.0112 *, d = 0.355). This result underscores that tree class significantly influences the residuals, particularly for app HR (see Figure 5a).
The bias across both applications was −1.44 cm for measuring person 1 and was lower for measuring person 2 at −0.70 cm. The mean error of app HR and app TM was lower for measuring person 2 than for measuring person 1. The mean error of app TM was only lower for measuring person 1 (−1.17 cm) compared to app HR (−1.72 cm). The results from measuring person 2 indicated that app HR (−0.41 cm) had a lower bias than app TM (−0.99 cm).
A permutation-based ANOVA was used to assess the effect of measuring person, as the Shapiro–Wilk test revealed significant non-normality (W = 0.89136, p-value = 2.072 × 10⁻¹⁵). The ANOVA indicated no significant interaction between the app and measuring person (p = 0.5945 ns). The main effect of the app was not significant (p = 0.7854 ns), while the main effect of the measuring person showed a small effect size (f = 0.146).
Unpaired Wilcoxon tests were conducted to compare the residuals between the two measuring persons. No significant difference was found between app HR and app TM for measuring person 1 (pholm = 0.4745 ns, d = 0.193), while a significant difference was identified for measuring person 2 (pholm = 0.0029 **, d = 0.302) (see Figure 5b).
Post hoc pairwise comparisons further revealed significant differences between measuring person 1 and measuring person 2 for app HR (padj. = 0.0032 **), while no significant difference was found between the measuring persons for app TM (padj. = 0.5945 ns) (see Figure 5b).

4. Discussion

The findings of this study demonstrate that both AVP apps achieved reliable measurement precision for DBH measurements and no significant differences in accuracy were detected between them. No statistically significant difference between the two apps was found in the measurement time per sample plot. However, app TM was approximately 16% faster than app HR on average. The shortest measurement time for both apps was similar, but the maximum duration was longer for app HR compared to app TM. This difference is probably due to the way in which the measurement process was completed. App HR must recognize a specific finger movement to end the measurement (see Section 2.3). This recognition can often take several attempts and thus explains the slightly longer measuring time. However, it should be noted that the average time difference between the two apps is negligible. A direct comparison between the measurement times for manual calipers and the AVP apps was not feasible. The time recorded for the manual caliper included additional tasks, such as locating and marking the trees, which considerably extended the total measurement time, making it unsuitable for comparison with the app-based measurements.
Both apps show an underestimation of around 1 cm (−3.68%) and an RMSE of 2.34 cm to 3.14 cm. The tendency to underestimate is greater than in other studies investigating the accuracy of AR and MR apps for measuring DBH (see Table 1).
However, a tendency to overestimate small DBH (up to 10 cm), as observed in this study with the app HR, was also reported by [16]. In that study, this overestimation was attributed to the LiDAR scanner installed in various Apple devices [51], a conclusion that may also apply to the LiDAR scanner used in the AVP. Similarly, the increasing error with increasing DBH, which occurred mainly in app HR, was also observed by [19] in the evaluation of the AR app ‘Arboreal Forest’.
When comparing the RMSE to other studies, the values for the two AVP apps are in some cases higher [13,15], in some cases lower [11,17,18,20], and in some instances nearly identical [12,16] to those reported in other studies (see Table 1).
One possible explanation for the observed increase in bias with larger DBH values is that, although DBH is typically measured tangentially, in cases of a larger DBH, measurements may not be taken at the center of the trunk’s diameter but rather slightly in front of it. This positioning results in an underestimation of the actual DBH, as the measurement reflects a smaller cross-section of the tree (see Table 1). However, a direct comparison with the mentioned studies is difficult, as no other study used MRITF technology with comparable apps. In addition, not all measurements took place in forests, but also in urban environments [12,20] or plantations [16].
Within the 182 DBH measurements that were conducted with the AVP in this study, no instabilities in the app and no “motion sickness” were observed. Both measuring persons performed the measurements without issues, irrespective of forest type, tree density, terrain characteristics, or slope inclination. These tests, which can be considered the first of their kind in forest-related research, suggest that the AVP, with either of the apps, is a reliable tool for conducting DBH measurements across various forest and terrain conditions.
No statistically significant difference was found between the two operators. However, as we did not perform repeat measurements, the sensitivity of the test used is relatively low, meaning that it cannot be excluded that there are actually differences between the two operators. A portion of the observed measurement deviations might still be attributed to the use of eye-tracking technology for controlling and targeting measurement points [26], which can affect the precision of measurements. According to [26], the general inaccuracy of eye-tracking is approximately 1°. While this may seem minor, given the maximum measurement distance to the tree (~0.75 m), it could introduce notable deviations in centimeter-precise measurements. Additionally, the results were influenced by the fact that the measurements collected via the app TM were rounded to the nearest centimeter for values exceeding 10 cm (see Section 2.2), whereas the reference measurements were recorded to one decimal place. While this study provides insights into the application of the AVP system in a forest environment, it does not allow for conclusions about whether the eye-tracking technology is inherently unsuitable or whether superior alternatives exist. This limitation arises because this research was restricted to the AVP device and did not include comparisons with another MRITF.
It is also important to note that the accuracy comparison between the two operators is limited by the fact that they measured different trees, introducing variability that can affect the reliability of the results. The observed discrepancy in the number of measured trees, with one operator measuring 81 and the other measuring 101 trees, can be attributed to the random allocation of sample plots between the two individuals. Each operator was assigned 11 out of a total of 22 sample plots, and the variation in tree counts arose naturally from this distribution. To address this issue, it would be beneficial to standardize the number of trees measured by each operator in future studies. Additionally, it would be valuable in future research to have both operators measure the same trees within the same sample plots using both applications to directly compare measurement consistency between individuals and apps.
The manually measured diameters, which served as a reference in this study, are themselves subject to potential errors. As highlighted by a previous study [52], inaccuracies in diameter measurements can arise when using manual calipers, which could also influence the results of this study. A notable limitation of this study is that the selected apps used with the AVP do not perform automatic measurements, such as those obtained via 3D scanning. Additionally, tree positions could not be measured with the AVP, nor could tree species be automatically identified. Despite the built-in LiDAR scanner, the AVP was not utilized as a 3D scanner, unlike other devices like the Apple iPad, where 3D point clouds were generated. These limitations arise because, at the time of data collection, there were no AVP apps capable of generating 3D point clouds, as seen with apps like ‘3D Scanner App’ [53] or ‘Polycam’ [54] available for Apple iPads/iPhones. Furthermore, no AVP measurement apps currently fulfill all the requirements mentioned, including automatic tree positioning, species identification, or other advanced forestry parameters.
However, the development of an AVP app that enables 3D scans is anticipated, and such an app could potentially be tailored specifically for forestry applications. This should include an estimation of the nearest millimeter and capturing the measurements in a list, which could also include details about the measured object. Furthermore, apps might even expand their usability by visualizing previously captured 3D point clouds, localizing trees, automatically recording tree species, noting tree characteristics (e.g. damage), and even calculating individual tree volume. It has been shown that precision forestry data allowed for targeted forest operations at the individual tree level. By calculating raw material resources more accurately, sustainable and economically efficient forest management is supported while minimizing the use of resources and environmental impacts and maximizing economic returns [55].
The AVP, as one example of an MRITF, also holds significant potential for broader use in forestry, beyond just measurement tasks. Applications such as virtual forests could be utilized for education and training purposes, forest management, and even communication strategies within the forestry sector [22]. The versatility of the AVP could revolutionize how we interact with forest environments, both virtually and in practice.

5. Conclusions

The findings of this study demonstrate that the Apple Vision Pro (AVP), as a Mixed-Reality Interface (MRITF), is a useful tool for measuring DBH across various natural forest stands. However, with the existing apps, the diameter for large trees (>25 cm) was systematically underestimated. The comparison of measurements obtained from two different AVP apps with manual reference measurements revealed slight underestimations, with biases of −1.00 cm and −1.07 cm, and root-mean-square errors (RMSE) of 3.14 cm and 2.34 cm, respectively. The strong linear correlation (R2 values between 0.959 and 0.978) indicates that the AVP is effective in diverse terrains and among different tree species.
Beyond its application for DBH measurements, the AVP has significant potential for broader forestry applications, including educational tools, forest management, and enhanced communication strategies within the forestry sector. The tested apps are still quite rudimentary, offering limited settings and options, which suggests that the results could improve significantly with the addition of more adjustable features. Future research should involve larger datasets, incorporating additional tree measurements, and exploring the development of new applications. Furthermore, advancements in image analysis techniques may enable future evaluations based on recorded video data, enhancing the capabilities of the AVP in forestry research and practice.

Author Contributions

Conceptualization, T.O.-G., V.S., P.S., A.T., S.W., L.M., R.K., C.G., T.R., M.K., K.S. and A.N.; data curation, T.O.-G. and P.S.; investigation, T.O.-G.; formal analysis, T.O.-G., C.G., T.R. and A.N.; methodology, T.O.-G., C.G., T.R. and A.N.; software, T.O.-G.; supervision, C.G., T.R. and A.N.; validation, C.G. and T.R.; writing—original draft, T.O.-G., V.S., P.S., A.T., S.W., L.M., R.K., C.G., T.R., M.K., K.S. and A.N.; writing—review and editing, T.O.-G., V.S., P.S., A.T., S.W., L.M., R.K., C.G., T.R., M.K., K.S. and A.N. All authors have read and agreed to the published version of the manuscript.

Funding

This study was supported by the project LaDiWaldi (project number 102046) and was financed by the Austrian Federal Ministry of Agriculture, Forestry, Regions, and Water Management within the Waldfonds program. The work of Tobias Ofner-Graff, Valentin Sarkleti, and Philip Svazek was completely financed by the LaDiWaldi project.

Institutional Review Board Statement

Not applicable.

Informed Consent Statement

Not applicable.

Data Availability Statement

The data presented in this study are openly available (Creative Commons Attribution 4.0 International License—CC BY 4.0) in Zenodo repository at https://zenodo.org/records/14040646 (accessed on 5 November 2024).

Acknowledgments

The authors would like to thank the anonymous reviewers for their thoughtful comments and suggestions on the original manuscript.

Conflicts of Interest

The authors declare no conflicts of interest.

Appendix A

Table A1. Plot descriptions of the 22 sample plots and summary statistics of sample plots.
PlotDBH Range (cm)Number of Trees (n)Trees Per Hectare (N/ha)Measuring PersonSlope (°)p_dec (%)p_con (%)Measuring Time
App HR
(min)
Measuring Time
App TM
(min)
3605.4–48.38520213.7100034
33821.4–50.31171525.1366443
3366.9–39.9161040128.6100085
3509.5–46.66390125.8673332
38917–42.511715219.2188244
4229.2–458520123.3100054
45813.6–40.210650228.9406057
4647.2–45.2161040115.1693177
4248.6–35.911715218.51882105
3805.7–40.73195212.4010031
38133.9–49.2319528.2100011
38610.1–61.17455123.8435733
37435.1–525325111.6010022
3049.4–438520222.4100044
40438.5–45.3426015.9257521
41611.6–49.38520110.5100032
42616.9–54.37455213.1100033
4256.4–47.212780214.4584255
2806–48958526.4100033
2587.3–40.4852023.8100022
15515.6–56.33195120.8100011
1769.8–51.48520119.9386242
Figure A1. Residual analysis for two AVP apps: (a) Q-Q plot for residuals of app HR, (b) Q-Q plot for residuals of app TM, (c) histogram of residuals for app HR, (d) histogram of residuals for app TM.
Remotesensing 17 00141 g0a1

References

  1. Scott, C.T.; Gove, J.H. Forest Inventory. Encycl. Environmetrics 2002, 2, 814–820. [Google Scholar]
  2. Avery, T.E.; Burkhart, H.E. Forest Measurements, 5th ed.; Waveland Press: Long Grove, IL, USA, 2002; ISBN 978-1-4786-2908-5. [Google Scholar]
  3. Kershaw, J.A.; Ducey, M.J.; Beers, T.W.; Husch, B. Forest Mensuration, 5th ed.; Wiley: Hoboken, NJ, USA, 2016. [Google Scholar]
  4. Pretzsch, H. Grundlagen Der Waldwachstumsforschung; Springer: Berlin/Heidelberg, Germany, 2019; ISBN 9783662581544. [Google Scholar]
  5. Brokaw, N.; Thompson, J. The H for DBH. For. Ecol. Manag. 2000, 129, 89–91. [Google Scholar] [CrossRef]
  6. Drexhage, M.; Colin, F. Estimating Root System Biomass from Breast-Height Diameters. Forestry 2001, 74, 491–497. [Google Scholar] [CrossRef]
  7. Liang, X.; Hyyppä, J.; Kaartinen, H.; Lehtomäki, M.; Pyörälä, J.; Pfeifer, N.; Holopainen, M.; Brolly, G.; Francesco, P.; Hackenberg, J.; et al. International Benchmarking of Terrestrial Laser Scanning Approaches for Forest Inventories. ISPRS J. Photogramm. Remote Sens. 2018, 144, 137–179. [Google Scholar] [CrossRef]
  8. Guenther, M.; Heenkenda, M.K.; Morris, D.; Leblon, B. Tree Diameter at Breast Height (DBH) Estimation Using an IPad Pro LiDAR Scanner: A Case Study in Boreal Forests, Ontario, Canada. Forests 2024, 15, 214. [Google Scholar] [CrossRef]
  9. Aijazi, A.K.; Checchin, P.; Malaterre, L.; Trassoudaine, L. Automatic Detection and Parameter Estimation of Trees for Forest Inventory Applications Using 3D Terrestrial LiDAR. Remote Sens. 2017, 9, 946. [Google Scholar] [CrossRef]
  10. Gollob, C.; Ritter, T.; Nothdurft, A. Forest Inventory with Long Range and High-Speed Personal Laser Scanning (PLS) and Simultaneous Localization and Mapping (SLAM) Technology. Remote Sens. 2020, 12, 1509. [Google Scholar] [CrossRef]
  11. Borz, S.A.; Toaza, J.M.M.; Proto, A.R. Accuracy of Two LiDAR-Based Augmented Reality Apps in Breast Height Diameter Measurement. Ecol. Inform. 2024, 81, 102550. [Google Scholar] [CrossRef]
  12. Gülci, S.; Yurtseven, H.; Akay, A.O.; Akgul, M. Measuring Tree Diameter Using a LiDAR-Equipped Smartphone: A Comparison of Smartphone- and Caliper-Based DBH. Environ. Monit. Assess. 2023, 195, 678. [Google Scholar] [CrossRef]
  13. Sandim, A.; Amaro, M.; Silva, M.E.; Cunha, J.; Morais, S.; Marques, A.; Ferreira, A.; Lousada, J.L.; Fonseca, T. New Technologies for Expedited Forest Inventory Using Smartphone Applications. Forests 2023, 14, 1553. [Google Scholar] [CrossRef]
  14. Vastaranta, M.; Latorre, E.G.; Luoma, V.; Saarinen, N.; Holopainen, M.; Hyyppä, J. Evaluation of a Smartphone App for Forest Sample Plot Measurements. Forests 2015, 6, 1179–1194. [Google Scholar] [CrossRef]
  15. Howie, N.A.; De Stefano, A. Measuring Tree Diameter Using LiDAR Equipped IPad: An Evaluation of ForestScanner and Arboreal Forest Applications. For. Sci. 2024, 70, 304–310. [Google Scholar] [CrossRef]
  16. Tatsumi, S.; Yamaguchi, K.; Furuya, N. ForestScanner: A Mobile Application for Measuring and Mapping Trees with LiDAR-Equipped IPhone and IPad. Methods Ecol. Evol. 2023, 14, 1603–1609. [Google Scholar] [CrossRef]
  17. Lindberg, L. Forest Data Acquisition with the Application Arboreal Forest—A Study About Measurement Precision, Accuracy and Efficiency; Swedish University of Agricultural Sciences: Uppsala, Sweden, 2020. [Google Scholar]
  18. Borz, S.A.; Toaza, J.M.M.; Forkuo, G.O.; Marcu, M.V. Potential of Measure App in Estimating Log Biometrics: A Comparison with Conventional Log Measurement. Forests 2022, 13, 1028. [Google Scholar] [CrossRef]
  19. Ekenstedt, J. Evaluation of Arboreal Forest with Lidar; Sveaskog: Stockholm, Sweden, 2021. [Google Scholar]
  20. Wu, F.; Wu, B.; Zhao, D. Real-Time Measurement of Individual Tree Structure Parameters Based on Augmented Reality in an Urban Environment. Ecol. Inform. 2023, 77, 102207. [Google Scholar] [CrossRef]
  21. Schweizer, D.; Cole, R.J.; Werden, L.K.; Cedeño, G.Q.; Rodriguez, D.; Navarro, K.; Esquivel, J.M.; Max, S.; Chiriboga, F.E.; Zahawi, R.A.; et al. Review and Assessment of Smartphone Apps for Forest Restoration Monitoring. Restor. Ecol. 2024, 32, e14136. [Google Scholar] [CrossRef]
  22. Murtiyoso, A.; Holm, S.; Riihimäki, H.; Krucher, A.; Griess, H.; Griess, V.C.; Schweier, J. Virtual Forests: A Review on Emerging Questions in the Use and Application of 3D Data in Forestry. Int. J. For. Eng. 2024, 35, 34–47. [Google Scholar] [CrossRef]
  23. Cipresso, P.; Giglioli, I.A.C.; Raya, M.A.; Riva, G. The Past, Present, and Future of Virtual and Augmented Reality Research: A Network and Cluster Analysis of the Literature. Front. Psychol. 2018, 9, 2086. [Google Scholar] [CrossRef]
  24. Apple Inc. Apple Vision Pro. Available online: https://www.apple.com/apple-vision-pro/ (accessed on 23 August 2024).
  25. Perez-Huet, M.M.M. Global Litterature Review on the Applications of Virtual Reality in Forestry; University of Eastern Finland: Kuopio, Finland, 2020. [Google Scholar]
  26. Huang, Z.; Zhu, G.; Wang, R.; Zhang, S.; Li, Y.; Wang, Z. Measuring Eye-Tracking Accuracy and Its Impact on Usability in Apple Vision Pro. arXiv 2024, arXiv:2406.00255. [Google Scholar]
  27. Microsoft. Information HoloLense 2. Available online: https://learn.microsoft.com/de-de/hololens/hololens2-hardware (accessed on 25 September 2024).
  28. Gorczynski, D.; Beaudrot, L. Measuring Understorey Vegetation Structure Using a Novel Mixed-Reality Device. Methods Ecol. Evol. 2022, 13, 1949–1954. [Google Scholar] [CrossRef]
  29. Fol, C.R.; Kükenbrink, D.; Rehush, N.; Murtiyoso, A.; Griess, V.C. Evaluating State-of-the-Art 3D Scanning Methods for Stem-Level Biodiversity Inventories in Forests. Int. J. Appl. Earth Obs. Geoinf. 2023, 122, 103396. [Google Scholar] [CrossRef]
  30. Soares, I.; Sousa, R.B.; Petry, M.; Moreira, A.P. Accuracy and Repeatability Tests on Hololens 2 and Htc Vive. Multimodal Technol. Interact. 2021, 5, 47. [Google Scholar] [CrossRef]
  31. Hou, J.; Hübner, P.; Schmidt, J.; Iwaszczuk, D. Indoor Mapping with Entertainment Devices: Evaluating the Impact of Different Mapping Strategies for Microsoft HoloLens 2 and Apple IPhone 14 Pro. Sensors 2024, 24, 1062. [Google Scholar] [CrossRef] [PubMed]
  32. Arboreal. Arboreal Forest. Available online: https://arboreal.se/en/arboreal-forest (accessed on 25 September 2024).
  33. Apple Inc. Measure. Available online: https://apps.apple.com/us/app/measure/id1383426740 (accessed on 25 September 2024).
  34. Bolya, D.; Zhou, C.; Xiao, F.; Lee, Y.J. Yolact. IEEE Trans. Pattern Anal. Mach. Intell. 2022, 44, 1108–1121. [Google Scholar] [CrossRef] [PubMed]
  35. Bu, G.; Wang, P. Adaptive Circle-Ellipse Fitting Method for Estimating Tree Diameter Based on Single Terrestrial Laser Scanning. J. Appl. Remote Sens. 2016, 10, 026040. [Google Scholar] [CrossRef]
  36. Lanham, M. Learn ARCore-Fundamentals of Google ARCore: Learn to Build Augmented Reality Apps for Android, Unity, and the Web with Google ARCore 1.0; Packt Publishing Ltd.: Birmingham, UK, 2018. [Google Scholar]
  37. Schodterer, H. Einrichtung Eines Permanenten Stichprobennetzes Im Lehrforst; University of Natural Resources and Life Sciences: Vienna, Austria, 1987. [Google Scholar]
  38. Gollob, C.; Ritter, T.; Kraßnitzer, R.; Tockner, A.; Nothdurft, A. Measurement of Forest Inventory Parameters with Apple Ipad pro and Integrated Lidar Technology. Remote Sens. 2021, 13, 3129. [Google Scholar] [CrossRef]
  39. Gollob, C.; Ritter, T.; Wassermann, C.; Nothdurft, A. Influence of Scanner Position and Plot Size on the Accuracy of Tree Detection and Diameter Estimation Using Terrestrial Laser Scanning on Forest Inventory Plots. Remote Sens. 2019, 11, 1602. [Google Scholar] [CrossRef]
  40. Ritter, T.; Gollob, C.; Nothdurft, A. Towards an Optimization of Sample Plot Size and Scanner Position Layout for Terrestrial Laser Scanning in Multi-scan Mode. Forests 2020, 11, 1099. [Google Scholar] [CrossRef]
  41. Yamashita, R. HandsRuler. Available online: https://apps.apple.com/at/app/handsruler/id6475769879 (accessed on 23 August 2024).
  42. Level Labs, L. TapeMeasure. Available online: https://apps.apple.com/tt/app/tape-measure/id1271546805?platform=vision (accessed on 23 August 2024).
  43. Core Team. Core Team R. A Language and Environment for Statistical Computing; R Foundation for Statistical Computing: Vienna, Austria, 2024. [Google Scholar]
  44. Bolar, K.; STAT: Interactive Document for Working with Basic Statistical Analysis. R Packackage v 0.1.0. 2022, pp. 1–3. Available online: https://cran.r-project.org/web/packages/STAT/ (accessed on 29 December 2024).
  45. Holm, S. A Simple Sequentially Rejective Multiple Test Procedure. Scand. J. Stat. 1979, 6, 65–70. [Google Scholar]
  46. Aickin, M.; Gensler, H. Adjusting for Multiple Testing When Reporting Research Results: The Bonferroni vs Holm Methods. Am. J. Public Health 1996, 86, 726–728. [Google Scholar] [CrossRef]
  47. Navarro, D. Learning Statistics with R: A Tutorial for Psychology Students and Other Beginners, (Version 0.6); R Foundation for Statistical Computing: Vienna, Austria, 2015.
  48. Cohen, J. Statistical Power Analysis for the Behavioral Sciences, 2nd ed.; Routledge: New York, NY, USA, 1988; ISBN 0-8058-0283-5. [Google Scholar]
  49. Tibshirani, R.J.; Efron, B. An Introduction to the Bootstrap. Monogr. Stat. Appl. Probab. 1993, 57, 1–436. [Google Scholar]
  50. Signorell, A. DescTools: Tools for Descriptive Statistics. 2024. Available online: https://cran.r-project.org/web/packages/DescTools/index.html (accessed on 29 December 2024).
  51. Luetzenburg, G.; Kroon, A.; Bjørk, A.A. Evaluation of the Apple IPhone 12 Pro LiDAR for an Application in Geosciences. Sci. Rep. 2021, 11, 22221. [Google Scholar] [CrossRef] [PubMed]
  52. Witzmann, S.; Matitz, L.; Gollob, C.; Ritter, T.; Kraßnitzer, R.; Tockner, A.; Stampfer, K.; Nothdurft, A. Accuracy and Precision of Stem Cross-Section Modeling in 3D Point Clouds from TLS and Caliper Measurements for Basal Area Estimation. Remote Sens. 2022, 14, 1923. [Google Scholar] [CrossRef]
  53. Laan Labs. 3D Scanner App. Available online: https://3dscannerapp.com/ (accessed on 7 October 2024).
  54. Polycam. Polycam—LiDAR 3D Scanner. Available online: https://poly.cam/ (accessed on 7 October 2024).
  55. Melander, L.; Einola, K.; Ritala, R. Fusion of Open Forest Data and Machine Fieldbus Data for Performance Analysis of Forest Machines. Eur. J. For. Res. 2020, 139, 213–227. [Google Scholar] [CrossRef]
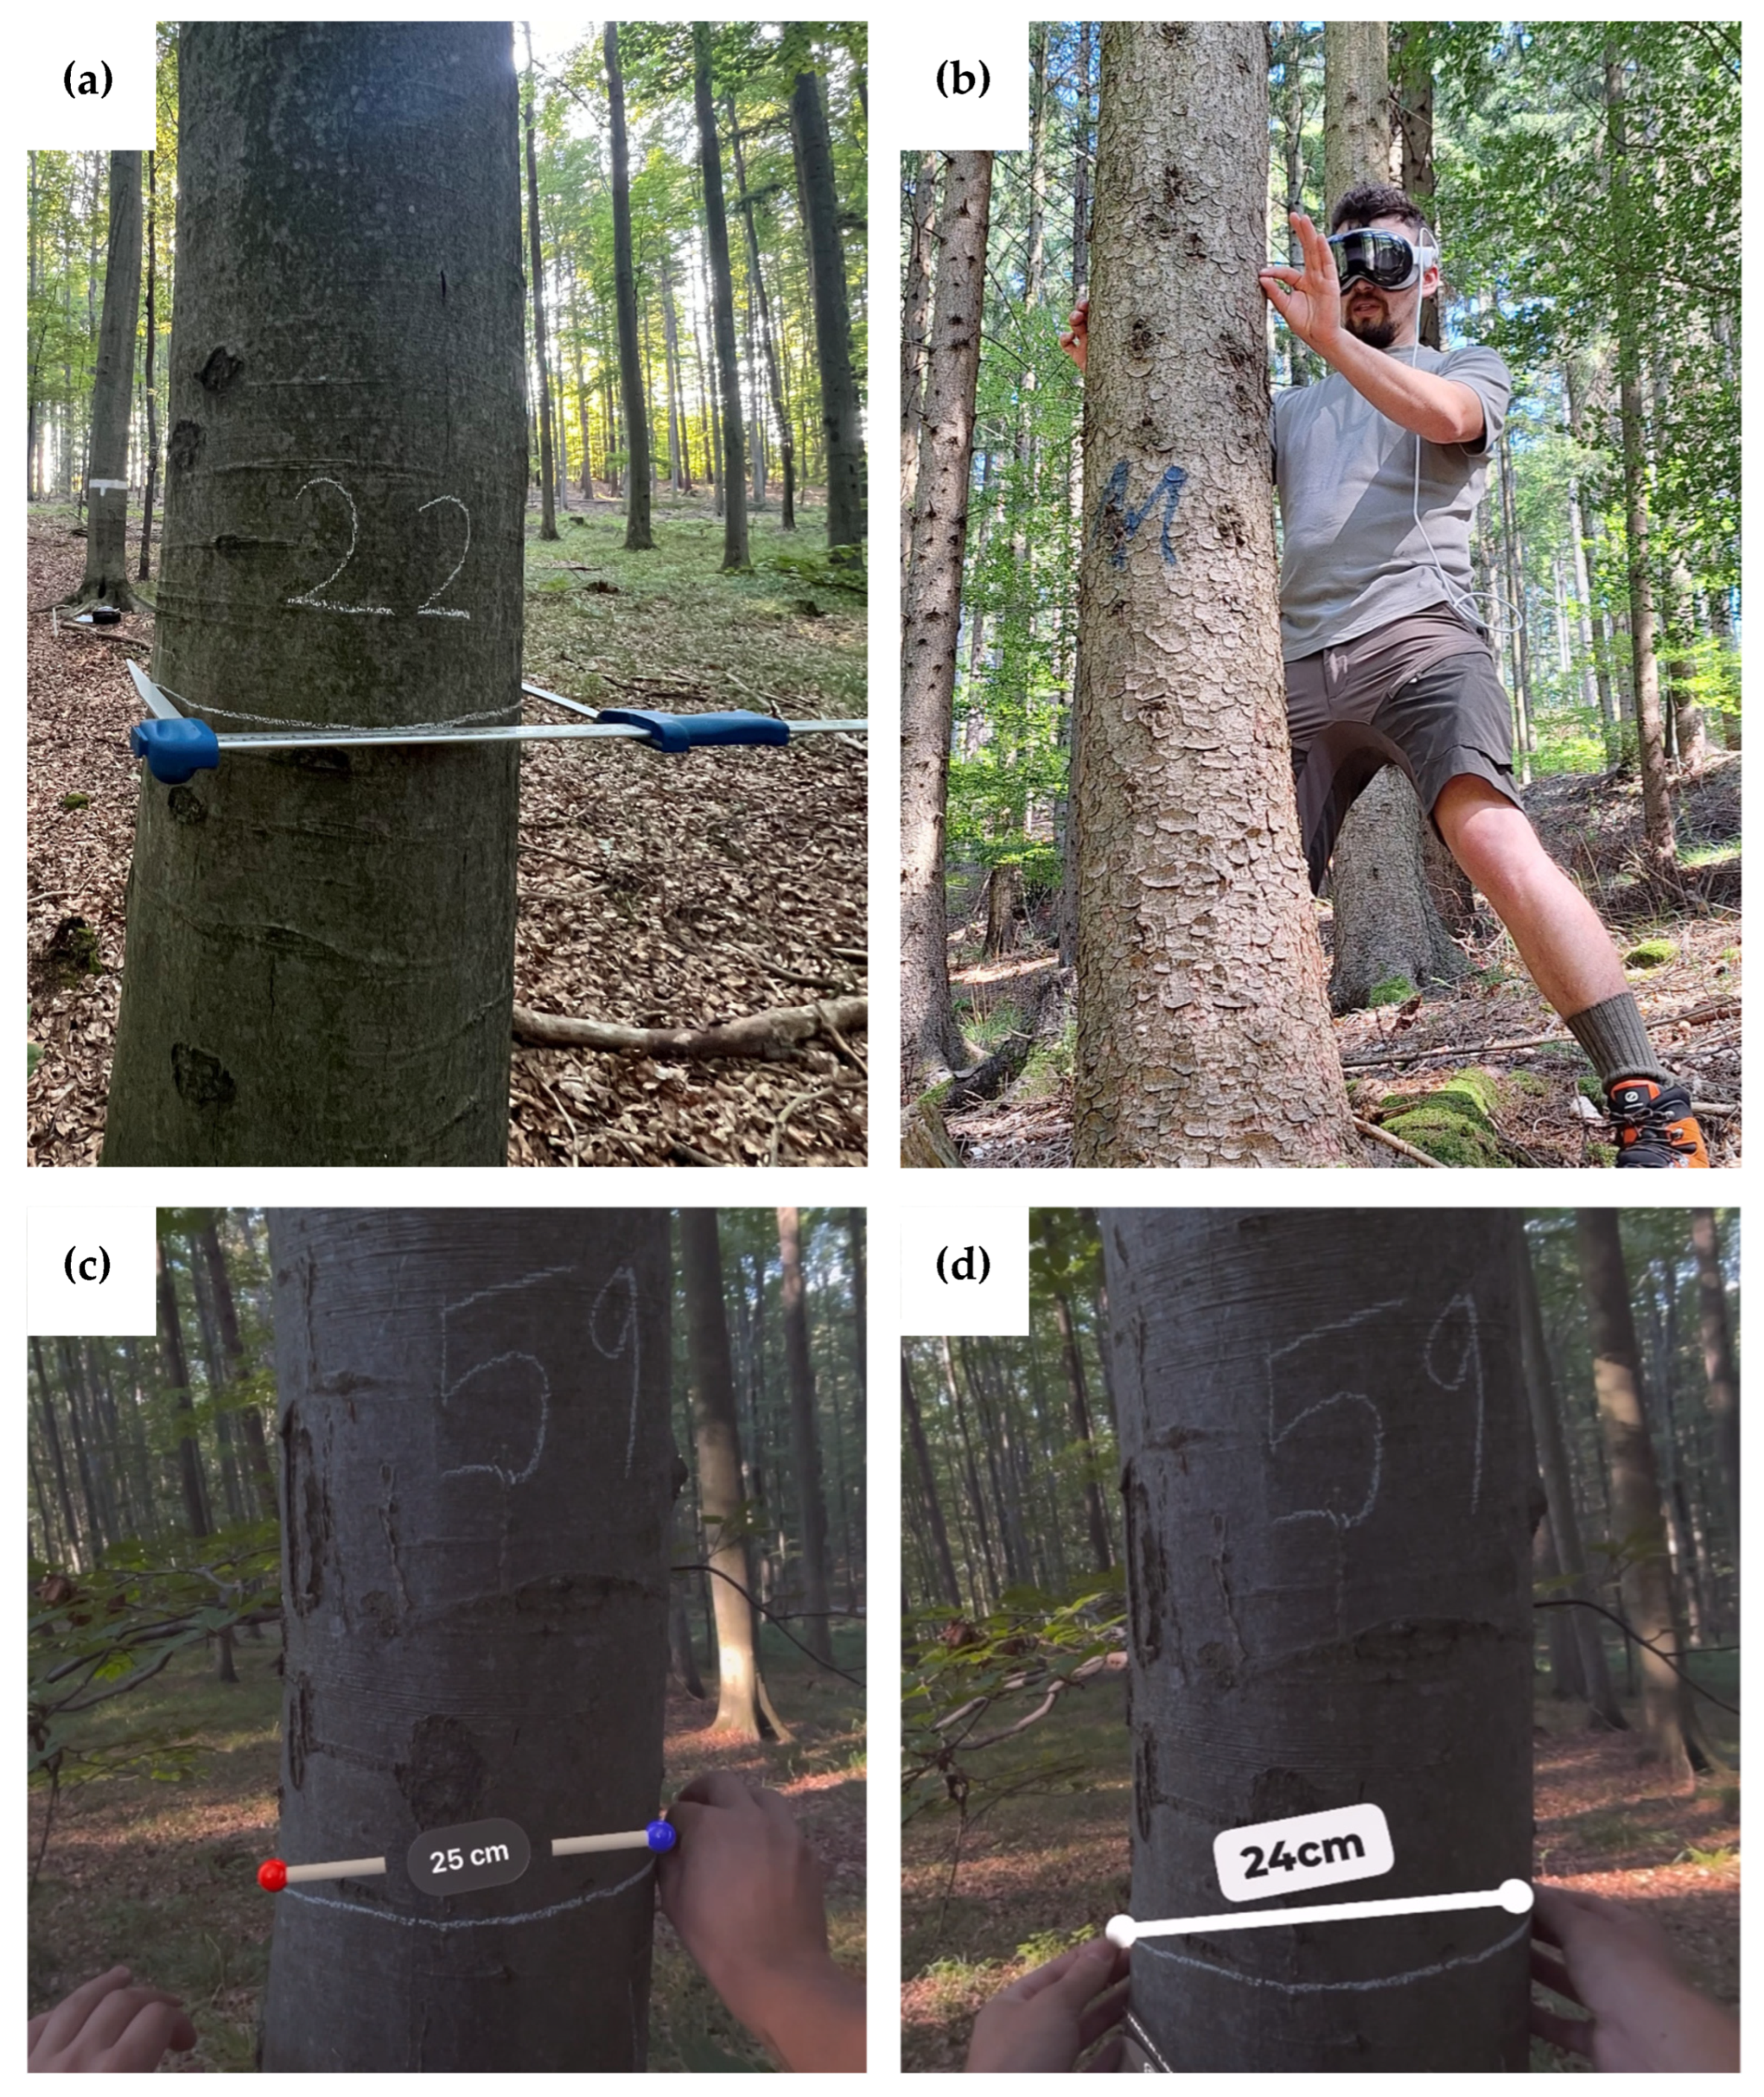
Figure 1. (a) A chalk-marked tree showing the height of the reference measurement in the direction of the sample plot center and a tree ID. (b) Measurement of the DBH with the AVP at the marked point. (c) first-person view at measuring with app HR and (d) Measurement of a DBH with app TM. All measurements larger than 10 cm were rounded by the apps to full centimeters.
Remotesensing 17 00141 g001
Figure 2. Schematic illustration of the AVP in frontal view, highlighting the positions and types of integrated sensors (illustration created by the authors).
Remotesensing 17 00141 g002
Figure 3. Model performance and residual analysis for two AVP apps (a) Predicted vs. reference values for app HR, (b) for app TM, (c) residuals for app HR, (d) residuals for app TM.
Remotesensing 17 00141 g003
Figure 4. Comparison of the time required per sample plot of both apps (n = 22).
Remotesensing 17 00141 g004
Figure 5. (a) difference in δ DBH [cm] for different tree classes, (b) difference in δ DBH [cm] for different measuring persons.
Remotesensing 17 00141 g005
Table 1. Summary of statistical parameters from scientific publications (empty cells indicate unavailable data).
ReferenceApplicationDeviceBias [cm]RMSE [cm]R2n
Howie and De Stefano [15]ForestScannerApple iPad0.155.270.930116
Arboreal ForestApple iPad2.086.590.920
Sandim et al. [13]Arboreal ForestApple iPhone−0.13–2.041.22–6.87
Tatsumi et al. [16]ForestScannerApple iPhone0.202.300.963672
Apple iPad0.202.300.961
Borz et al. [11]Measure AppApple iPhone0.330.880.998615
Arboreal ForestApple iPhone−0.111.250.996
Lindberg [17]Arboreal ForestApple iPhone−0.401.200.977646
Borz et al. [18]Measure AppApple iPhone0.200.960.999200
Sveaskog [19]Arboreal ForestApple iPhone0.00 336
Gülci et al. [12]ForestScannerApple iPhone 2.330.880105
Wu et al. [20]ARTreeWatchSamsung Galaxy S20+ 1.111.00051
Samsung Galaxy S8 1.140.990
Schweizer et al. [21]ForestScannerApple iPhone 0.890179
Arboreal Forest0.860
This studyHands RulerApple Vision Pro−1.003.140.959182
TapeMeasureApple Vision Pro−1.072.340.978
Disclaimer/Publisher’s Note: The statements, opinions and data contained in all publications are solely those of the individual author(s) and contributor(s) and not of MDPI and/or the editor(s). MDPI and/or the editor(s) disclaim responsibility for any injury to people or property resulting from any ideas, methods, instructions or products referred to in the content.