Abstract
Supraglacial debris cover considerably influences sub-debris ablation patterns and the surface morphology of glaciers by modulating the land–atmosphere energy exchange. Understanding its spatial distribution and temporal variations is crucial for analyzing melting processes and managing downstream disaster mitigation efforts. In recent years, the overall slightly positive mass balance or stable state of eastern Pamir glaciers has been referred to as the “Pamir-Karakoram anomaly”. It is important to note that spatial heterogeneity in glacier change has drawn widespread research attention. However, research on the spatiotemporal changes in the debris cover in this region is completely nonexistent, which has led to an inadequate understanding of debris-covered glacier variations. To address this research gap, this study employed Landsat remote sensing images within the Google Earth Engine platform, leveraging the Random Forest algorithm to classify the supraglacial debris cover. The classification algorithm integrates spectral features from Landsat images and derived indices (NDVI, NDSI, NDWI, and BAND RATIO), supplemented by auxiliary factors such as slope and aspect. By extracting the supraglacial debris cover from 1994 to 2024, this study systematically analyzed the spatiotemporal variations and investigated the underlying drivers of debris cover changes from the perspective of mass conservation. By 2024, the area of supraglacial debris in eastern Pamir reached 258.08 ± 20.65 km2, accounting for 18.5 ± 1.55% of the total glacier area. It was observed that the Kungey Mountain region demonstrated the largest debris cover rate. Between 1994 and 2024, while the total glacier area decreased by −2.57 ± 0.70%, the debris-covered areas expanded upward at a rate of +1.64 ± 0.10% yr−1. The expansion of debris cover is driven by several factors in the context of global warming. The rising temperature resulted in permafrost degradation, slope destabilization, and intensified weathering on supply slopes, thereby augmenting the debris supply. Additionally, the steep supply slope in the study area facilitates the rapid deposition of collapsed debris onto glacier surfaces, with frequent avalanche events accelerating the mobilization of rock fragments.
1. Introduction
Glaciers are crucial freshwater reservoirs globally and are particularly sensitive to climate change [1,2]. Due to global warming, glaciers in many regions are experiencing varying degrees of retreat and thinning [3,4], which will result in a reduction in freshwater resources, particularly in regions dependent on glacial meltwater. This poses a serious threat to the sustainable development of critical sectors such as agricultural irrigation, drinking water supply, and hydropower generation [5,6]. Eastern Pamir, located at the core of the Asian water towers, not only connects Central Asia, South Asia, and East Asia, giving it considerable geopolitical significance, but also provides critical support for regional water security and climate regulation through its substantial glacier reserves [7,8,9]. However, glaciers in eastern Pamir have exhibited a slightly positive mass balance or remained stable in recent years [10,11], a phenomenon referred to as the “Pamir–Karakoram anomaly”. Additionally, the spatial heterogeneity of glacier changes in this region has garnered significant research attention from the academic community [12,13,14].
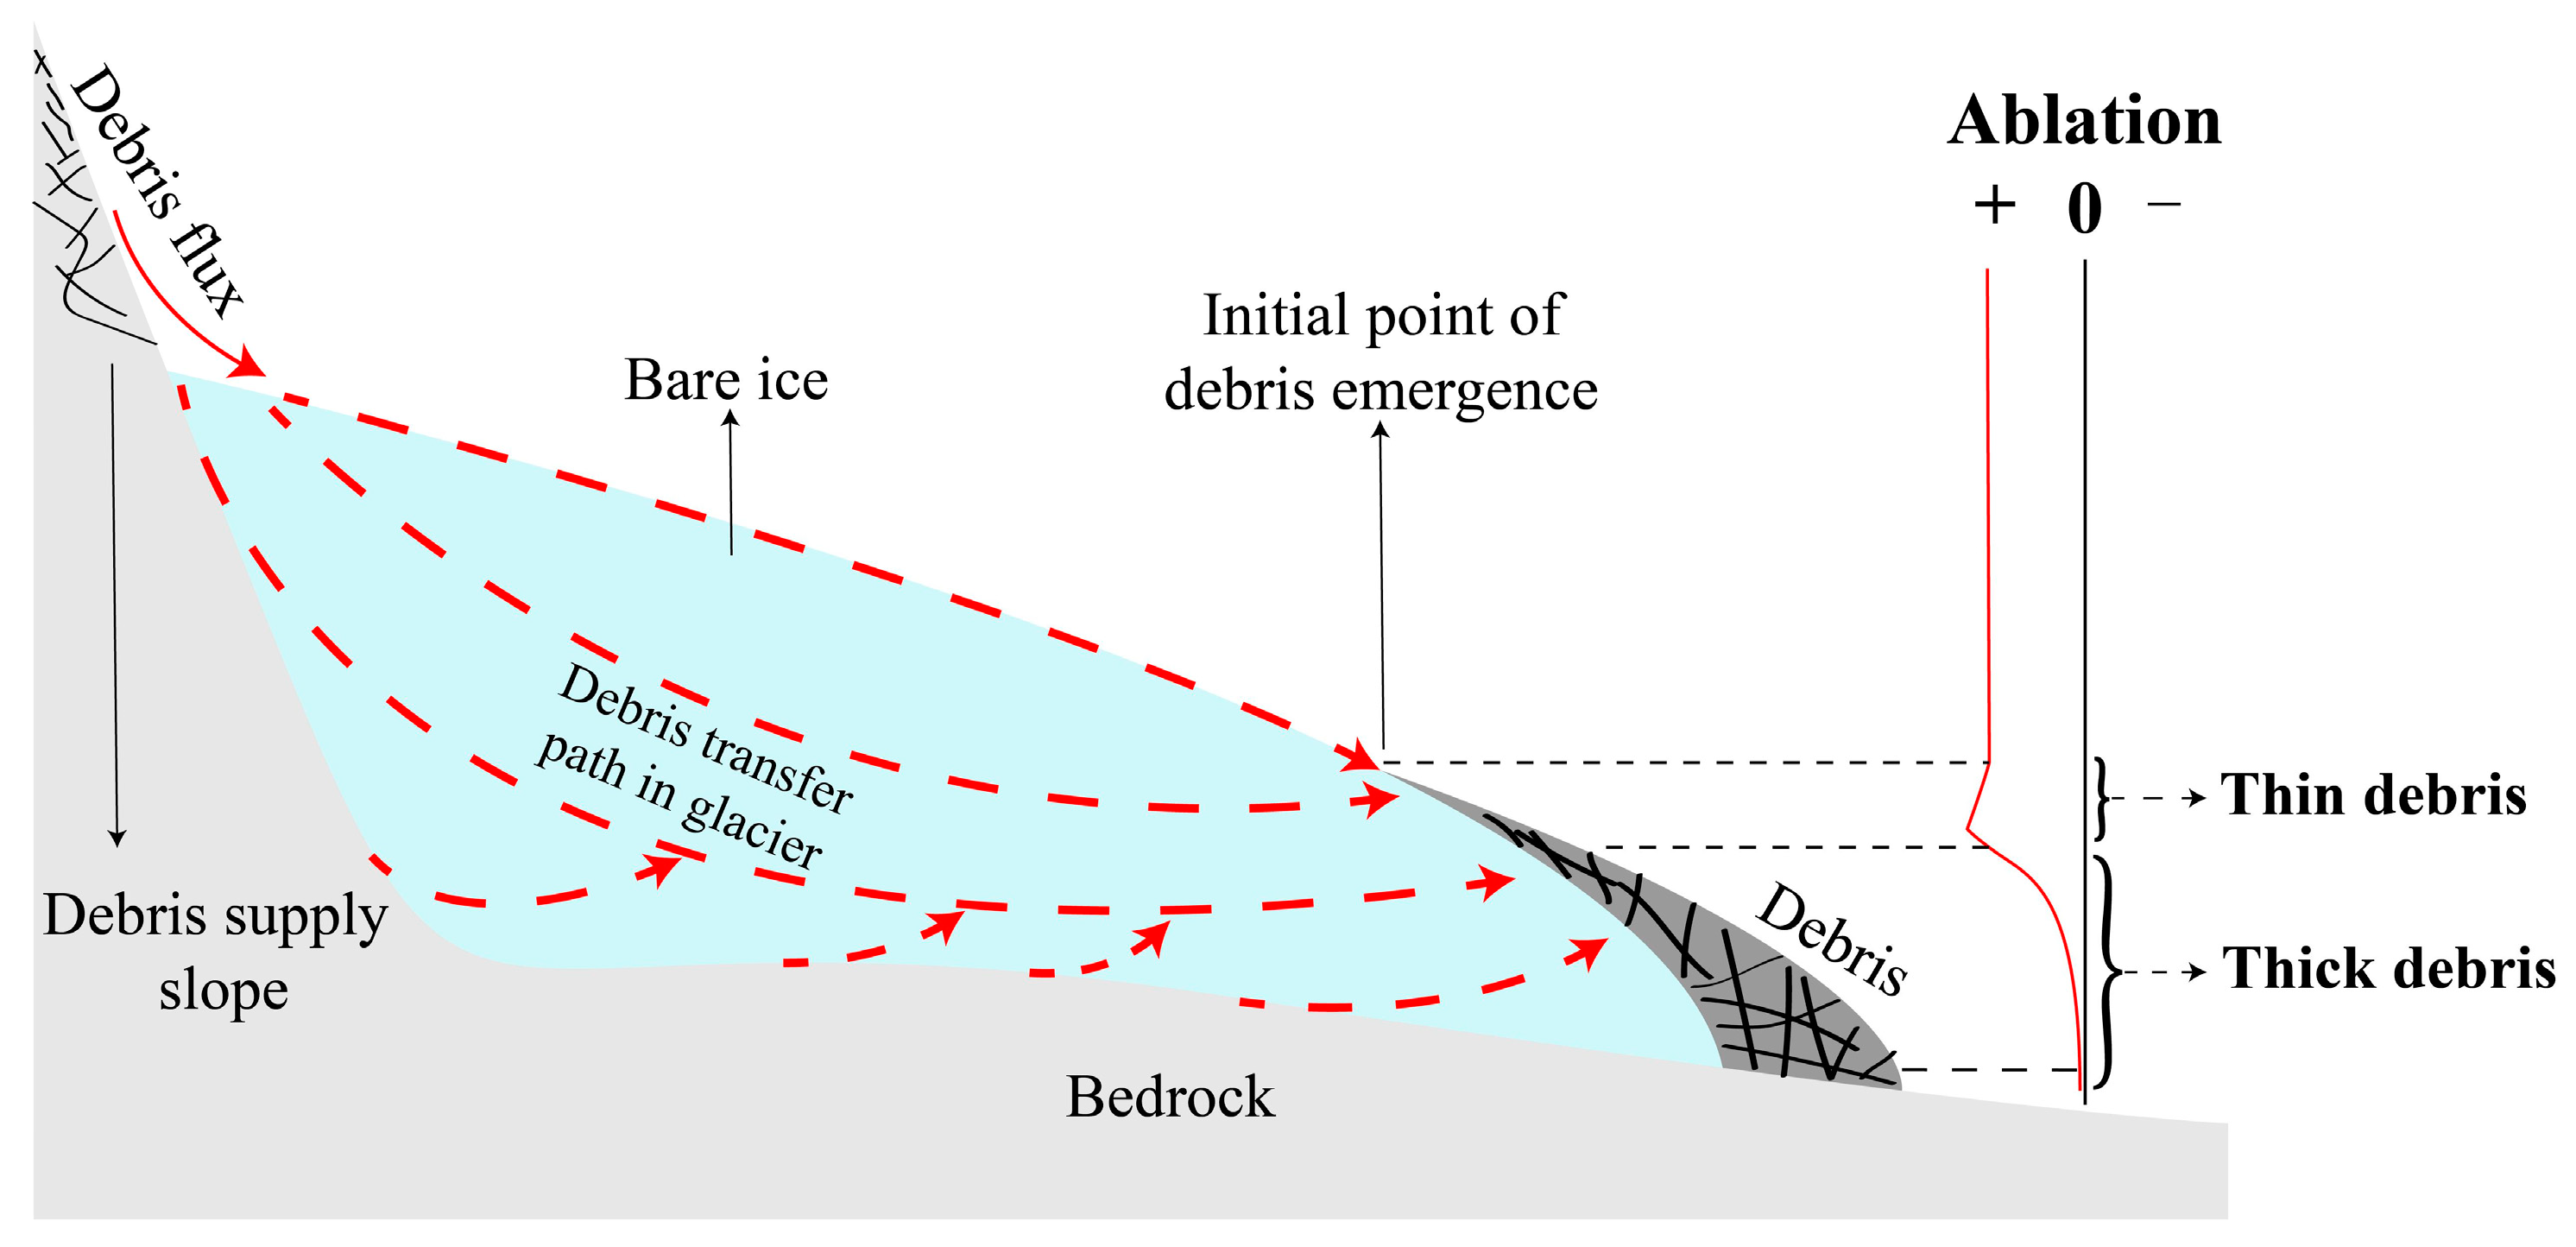
Debris-covered glaciers—a distinct type of glacier—are characterized by an unevenly distributed debris layer on their ablation zone [15]. Supraglacial debris refers to the layer of moraine—consisting of rock fragments, soil, and gravel—that blankets the surface of glaciers, originating from complex geological processes [16]. Its primary sources are twofold: the first is rocks from the surrounding mountain slopes that undergo weathering and fragmentation before rolling onto the glacier, some of which become incorporated into the ice as englacial debris [17]. These englacial debris are subsequently exposed at the glacier surface through movement and melting, contributing to the supraglacial debris cover [18]. The second source is debris generated by the glacial erosion of the bedrock, initially forming englacial debris, which is later transported to the ablation zone [19], where it accumulates into a stable debris layer on the surface (Figure 1). The debris layer plays a critical role in modulating sub-debris ablation rates and influences glacier runoff and hydrological patterns, either amplifying or inhibiting melt depending on its thickness [20]. Additionally, the presence of a debris cover enhances the likelihood of debris-covered glaciers transitioning into rock glaciers, leading to a gradual loss of glacial flow characteristics, a reduction in ice mass ablation rates, and a transformation into a more stable solid state as a “rock glacier”, which can significantly impact regional hydrological cycles and ecosystem dynamics [16,21].
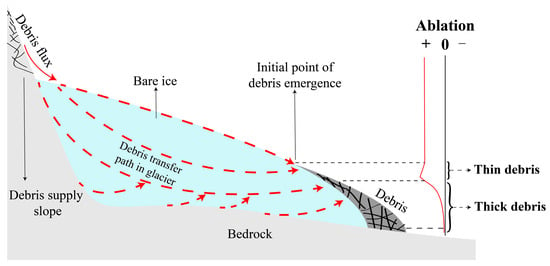
Figure 1.
Schematic of debris sources (the ablation rate in the area above the boundary between supraglacial debris and bare ice is not constant but is shown to highlight the promoting effect of a thin debris cover on ablation).
Due to the uneven distribution of debris, the ablation process of glaciers exhibits significant variability, leading to the formation of ice cliffs and supraglacial ponds [22]. Ice cliffs absorb more solar radiation, accelerating local melting and potentially triggering collapse events; supraglacial ponds collect meltwater, and as their volume increases, they can cause catastrophic outburst floods, posing significant threats to downstream communities and ecosystems [23,24]. Monitoring the spatiotemporal dynamics of supraglacial debris cover is essential for understanding glacier melt patterns and accurately quantifying runoff [25,26], which provides critical data for understanding glacier dynamics, mass balance, hydrological modeling, and disaster risk reduction, in addition to water resource management in downstream areas [27,28]. In eastern Pamir, the supraglacial debris cover spans an extensive area, with Scherler et al. [20] estimating it to be approximately 330 km2, or about 11% of the total glacier area. However, research on the spatiotemporal changes in the debris cover in this region is completely nonexistent, which leads to an inadequate understanding of debris-covered glacier variations.
The spectral similarity among the supraglacial debris cover, exposed rocks, and sediments makes the predictions of traditional classification methods inaccurate [29]. As a consequence, land surface types cannot be effectively distinguished using a single feature [30]. To address this challenge, researchers have developed novel methods and incorporated additional features to enhance the automated classification of debris-covered glaciers. For instance, Bishop et al. [31,32] used artificial neural networks to extract the supraglacial debris cover as early as the 1990s. Racoviteanu et al. [33] introduced decision trees and texture analysis to improve the classification accuracy. However, the practical effectiveness of these methods is constrained by the selection of training samples and the depth of the models, which can impact the efficiency, accuracy, and generalizability of classifications. This drawback highlights the limitations of relying on a single feature or model for classification. Therefore, Bolch et al. [34] introduced thermal infrared bands as supplementary spectral features, although this approach primarily identifies thin debris layers and cannot be used for layers thicker than 50 cm. To address this issue, Bhambri et al. [35] and Bhardwaj et al. [36] integrated features including the terrain slope, surface curvature, and temperature to devise a multi-feature collaborative classification model for debris-covered glaciers. This approach significantly improved the classification accuracy, making it a superior method for complex terrain features and thick debris cover. Consequently, the model supported broader multi-feature classification applications. With advancements in the spatiotemporal resolution of remote sensing images, the associated data analysis workload and complexity have also increased [37]. In this context, machine learning algorithms have emerged as vital tools for managing this complexity, owing to their robust data processing and pattern recognition capabilities. These algorithms adeptly handle complex, multidimensional data, enabling an in-depth exploration of the correlations among spectral features, terrain data, and environmental factors to enhance classification efficiency [38]. For example, in the Kongur region of eastern Pamir and the Nyainqentanglha, Lu et al. [39] applied Random Forest (RF) classification algorithms with multi-feature extraction to delineate the supraglacial debris boundary. This approach validated the effectiveness and feasibility of multi-feature collaborative classification. However, extracting large-scale, long-term land information from high-spatiotemporal-resolution imagery is a computationally intensive task, and robust computing platforms are required to support such analyses [40]. In this regard, the Google Earth Engine (GEE), an open-access cloud computing platform, offers extensive access to a diverse range of mainstream, free satellite data resources. With its superior data processing capabilities, this platform facilitates the rapid and dynamic monitoring of large regions [41].
To address these research gaps, this study utilizes GEE platform Landsat series remote sensing images, applying the RF classification algorithm to extract the supraglacial debris cover of glaciers in eastern Pamir from 1994 to 2024. The study analyzes the current spatial distribution of supraglacial debris cover in the region and examines the trends in debris area changes over the past three decades. Additionally, from the perspective of mass conservation, the study discusses the underlying causes of trends in debris area changes. This study provides an understanding of the spatiotemporal variation in supraglacial debris cover in eastern Pamir and provides valuable data for further investigations of glaciers in this region.
2. Study Area and Dataset
2.1. Study Area
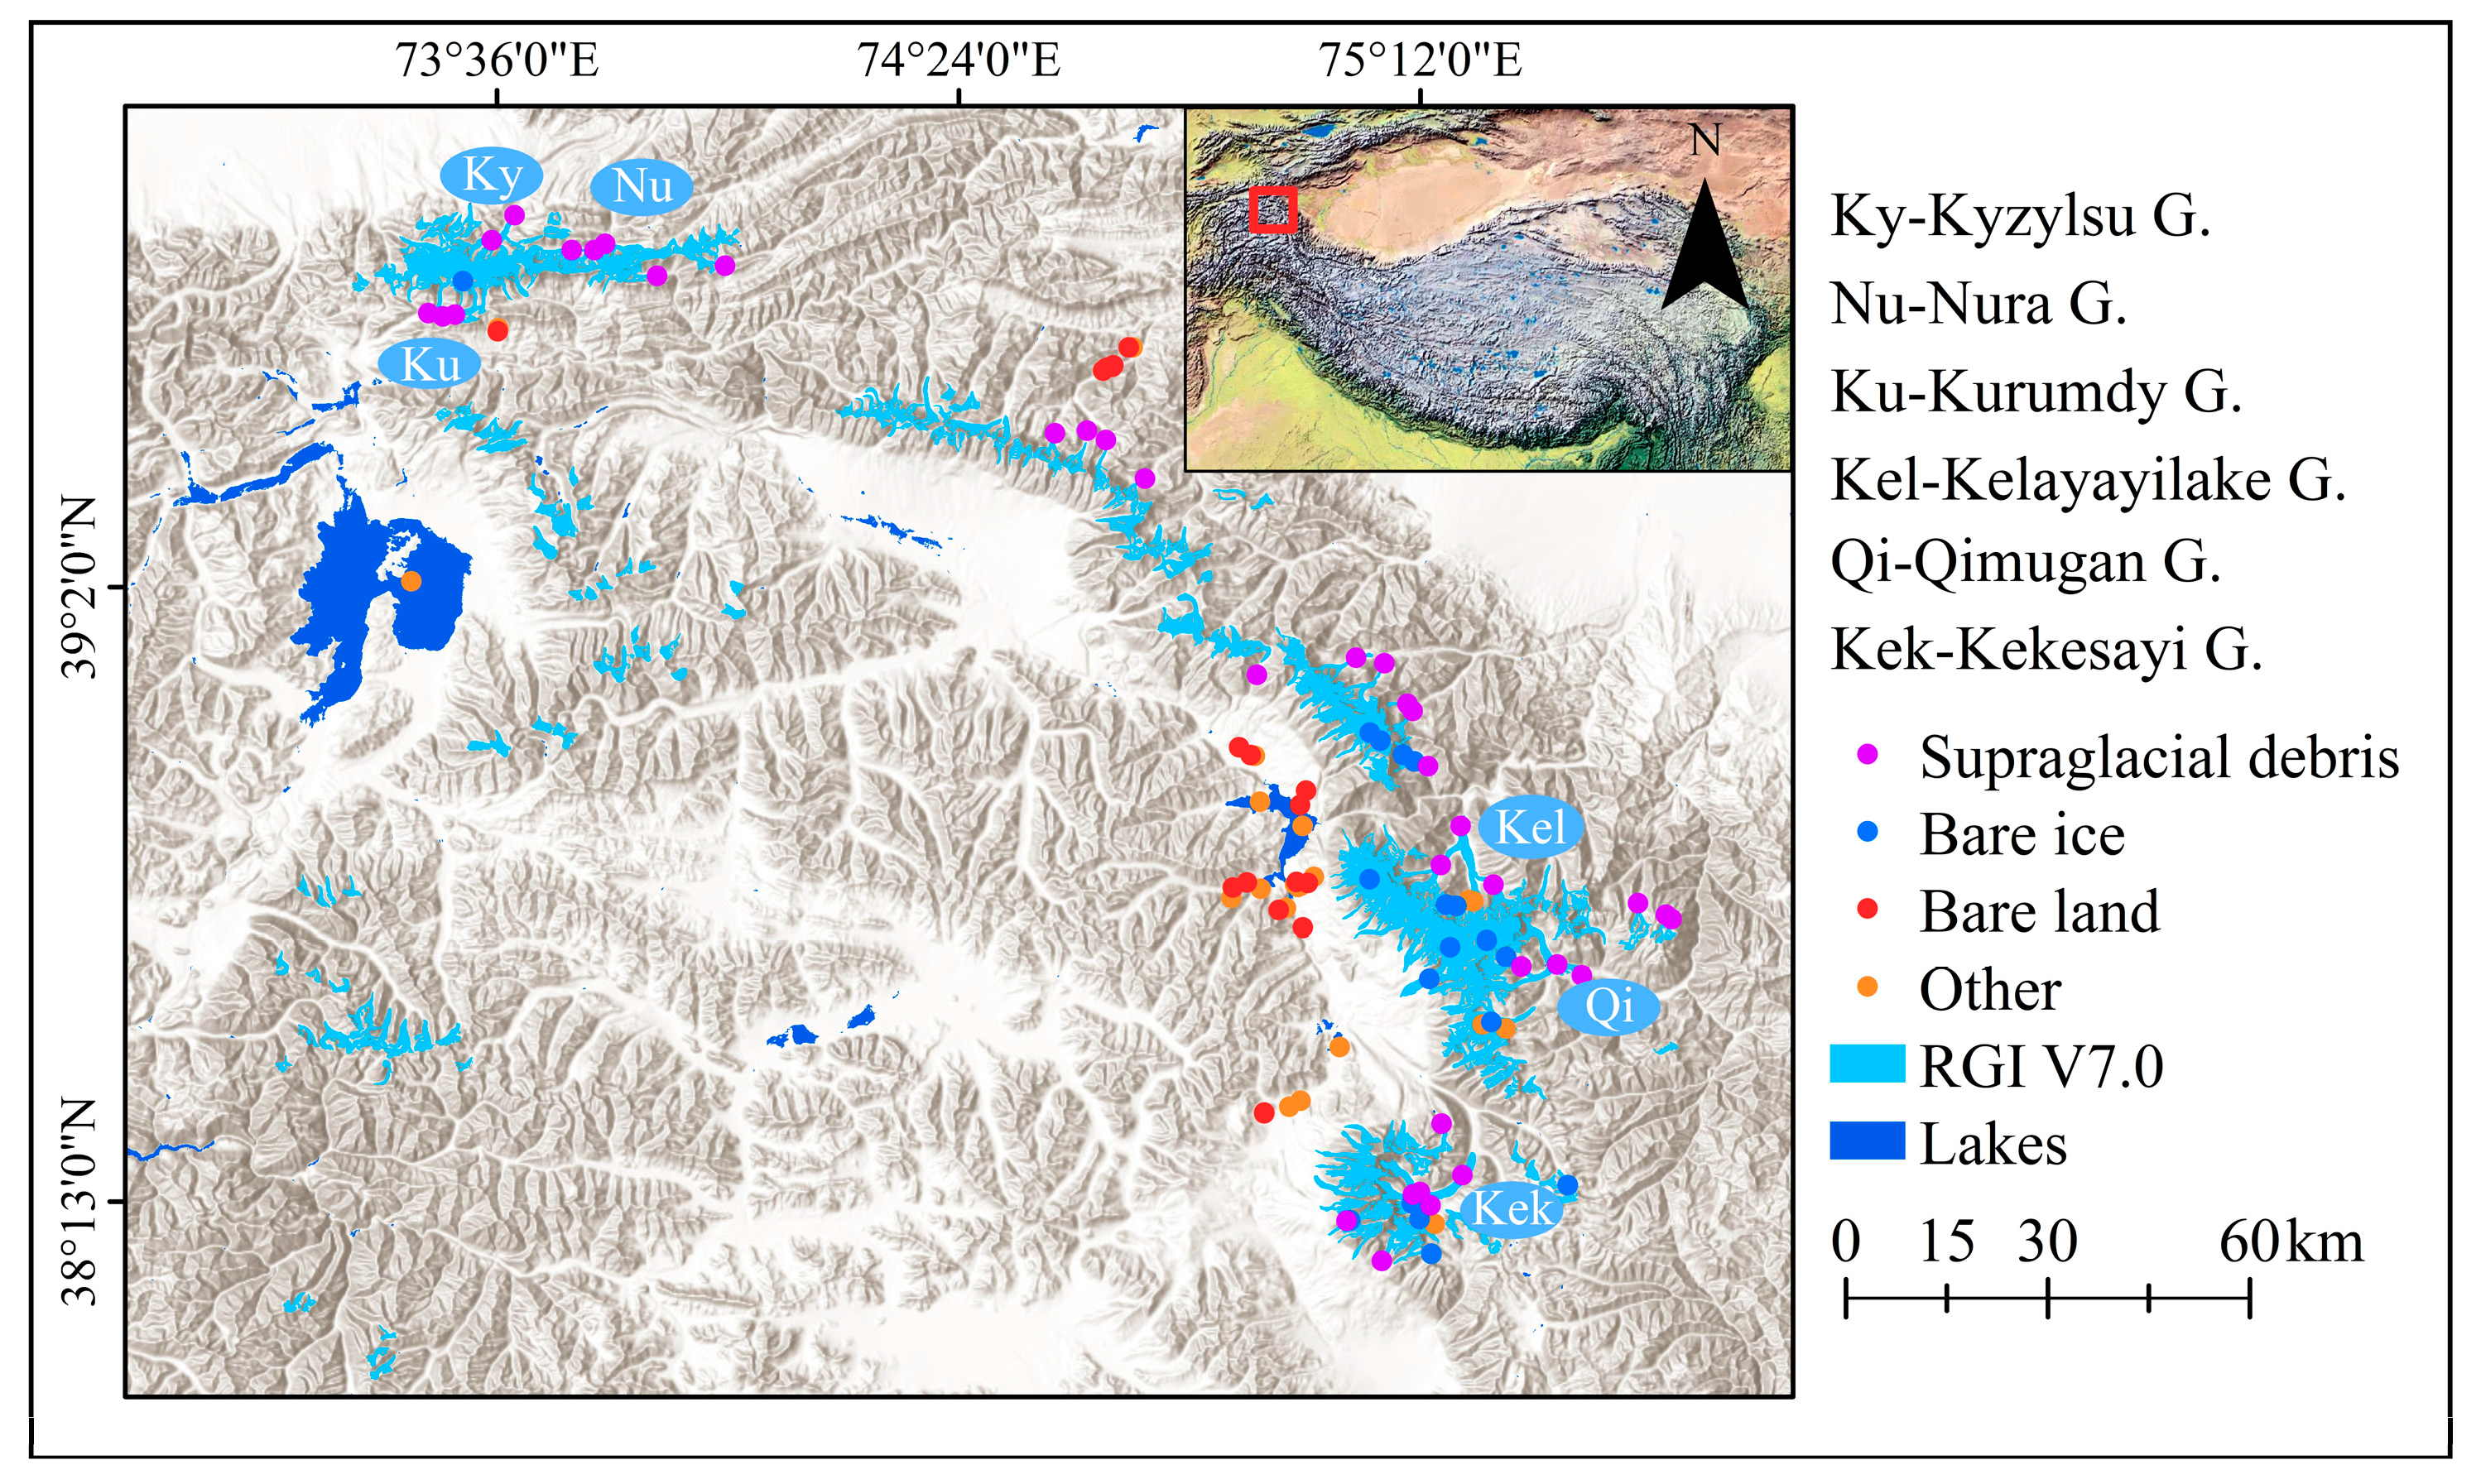
Eastern Pamir, situated in the Tashkurgan Tajik Autonomous County of the Xinjiang Uygur Autonomous Region in western China, lies between 73°E and 76°E and 38°N and 40°N. It represents a prominent extension of the region, characterized by an average elevation exceeding 4000 m and rugged mountain ranges such as Kongur-Muztag, Kungey, and Kuoersaile [7,8]. This area has a cold, arid climate with minimal annual precipitation, predominantly influenced by the Westerlies, and is characterized by a continental highland climate [9]. The precipitation is concentrated in the summer, while winter exhibits extremely low temperatures and limited precipitation [42]. According to Randolph Glacier Inventory Version 7.0 (RGI V7.0), a total of 3587 modern glaciers exist in this area, covering an area of 2497.17 km2. Among these, 212 glaciers exceed 2 km2 in area, collectively covering 1536.46 km2, which constitutes the primary focus of this study (Figure 2). In addition, we selected six representative glaciers for a detailed analysis (Table 1).
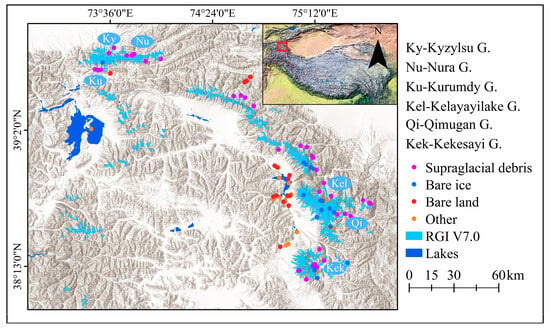
Figure 2.
Overview of glacier and lake distribution in eastern Pamir (points with color represent sample sites selected by the 2024 RF classification model, and the decimal latitude and longitude coordinates of the points can be found in the Supplementary Information).

Table 1.
Basic information on representative glaciers.
2.2. Data Sources
2.2.1. Landsat
The remote sensing dataset analyzed in this study spans the period from 1994 to 2024 (Table 2), comprising images acquired by various Landsat sensors, including the Thematic Mapper (TM) and Operational Land Imager (OLI). The dataset encompasses seven distinct temporal points: 1994, 2000, 2009, 2014, 2017, 2022, and 2024. Cloud cover in the selected images ranged from 0.46% to 15%. To ensure the reliability of the classification results, only high-quality images with minimal cloud cover and no evidence of fresh snow were utilized. This selection process effectively minimized the influence of seasonal snow and cloud shadows, thereby improving the accuracy and consistency of the subsequent analysis.

Table 2.
List of Landsat images used for extracting supraglacial debris cover.
2.2.2. Debris Supply Slope
The debris supply slope refers to sloped areas within a glacier catchment that provide debris to the glacier surface, either through downhill movement from higher elevations or lateral input from adjacent slopes [43]. Rocks and sediments are mobilized from higher elevations through natural processes such as gravity-driven movement, weathering, and collapse [44]. These rocks and sediments ultimately accumulate on the glacier surface to form a supraglacial debris cover [17]. Several studies [18,45,46,47] have been conducted to analyze the sources of debris. For instance, McCarthy et al. [47] analyzed the debris thickness and supply rate in the high mountain regions of Asia through surface energy balance calculations and numerical simulations of glaciers. They identified the extent of the debris supply slope for 4141 glaciers by calculating the area, average slope, and debris supply rate of the debris supply slope. This study utilizes data on the average slope of debris supply slopes (an indicator assessing the roughness of the debris supply slope’s terrain) to analyze the evolution of the supraglacial debris cover area in eastern Pamir.
2.2.3. Auxiliary Data
The elevation data used in this study were obtained from the Shuttle Radar Topography Mission (SRTM) Digital Elevation Model (DEM), with a resolution of 30 m [48]. This dataset served as a basis for deriving critical terrain characteristics, including elevation, slope, and aspect, across the study area. The glacier outlines were obtained from RGI V7.0, which offered comprehensive information on global glacier boundaries and areas, supporting the precise delineation of glacier extents within the study area. Additionally, data from the second Glacier Inventory of China (CGI2) [49] were employed to validate and compare the extracted results [50], providing a foundation for the discussion of uncertainties in the data in subsequent sections.
3. Methods
3.1. Preprocessing
3.1.1. Cloud Filtering
Cloud cover presents a significant challenge in land cover classification based on remote sensing images, as it can severely degrade image quality and decrease the accuracy of the classification results [51]. To address this limitation, this study prioritized the selection of images with minimal cloud cover to enhance classification reliability [37]. Additionally, a cloud-filtering algorithm was implemented within the Google Earth Engine (GEE) platform to further improve image quality. Initially, cloud mask information was derived from the Landsat Quality Assessment (QA) band, enabling the detection and exclusion of heavily cloud-contaminated images. A quality threshold was then defined, and the “maskClouds” function was applied to retain images with minimal or no cloud contamination, thereby enhancing image clarity. For years in which cloud-free imagery was limited (e.g., 2000), data gaps were addressed by incorporating images from adjacent years. Given the relative stability of supraglacial debris cover over short temporal scales, this substitution is unlikely to introduce significant bias, ensuring continuity in the dataset while maintaining a high classification accuracy [52].
3.1.2. Image Composite
To enhance image clarity and mitigate the influence of seasonal and local weather variations, a quartile synthesis method was applied to the cloud-filtered images. This technique selects the optimal brightness value quartile for each pixel across the time series, effectively preserving surface details in regions with pronounced seasonal fluctuations, such as glaciers [22]. By reducing the noise introduced by transient weather events, this method significantly improves data reliability and enhances the accuracy of surface feature classification [53]. The quartile synthesis process was efficiently implemented within the GEE platform, leveraging its computational capabilities to ensure both efficiency and precision during processing. This approach resulted in stable, high-quality composite images, providing a robust foundation for the detailed analysis of glacier surface features.
3.2. Feature Construction
This study utilized feature variables from synthesized images, incorporating both spectral and derived features as inputs. The spectral features included several bands from Landsat images, specifically the blue, green, red, near-infrared (NIR), short-wave infrared 1 (SWIR1), and short-wave infrared 2 (SWIR2) bands. The derived indices included vegetation, snow, and water indices, such as the Normalized Difference Vegetation Index (NDVI), Normalized Difference Snow Index (NDSI), Normalized Difference Water Index (NDWI), and red/SWIR1 (BAND RATIO). Additionally, topographic variables, including slope and aspect, were incorporated as Supplementary Features. This multi-feature classification approach significantly improved the accuracy of identifying complex land cover types, including glaciers, debris-covered areas, and bare land, yielding more precise classification results [54]. The formulas for the spectral indices are as follows:
where , , , and represent the reflectance in the near-infrared band, red band, green band, and short-wave infrared 1 band, respectively.
3.3. RF Classification
3.3.1. RF Parameter Settings
RF, an ensemble method of classification trees introduced by Breiman [55], is known for its robustness in handling complex data. It is particularly effective for classifying complex remote sensing images and can efficiently manage scenarios with multiple classes and features [56]. The performance of the RF classifier is influenced by several key parameters, including the number of decision trees (N) and the number of features selected at each data split (M). Generally, a small value of N may lead to underfitting, while a large value increases the computational burden. Therefore, determining the optimal value of N is necessary. Moreover, when M has a large value, the computational load increases substantially. As per the literature, M is typically estimated as the square root of the total count of input variables [51,57]. In this study, the number of decision trees (N) was set to 200, and the number of features selected at each split (M) was set to 12.
3.3.2. Sample Selection
During the classification process, sample sites representing different land cover types (Figure 1) were selected through the visual interpretation of remote sensing images. These land cover types included supraglacial debris, bare ice, and bare land, alongside other types, such as vegetation, water bodies, and shadows. Seventy percent of the sample points were allocated for model training, while the remaining thirty percent were used to validate the classification accuracy [58]. This division ensures that the model effectively generalizes and produces consistent classification results across images from varying time periods. The sample points used can be found in the Supplementary Information.
3.3.3. Post-Classification Processing
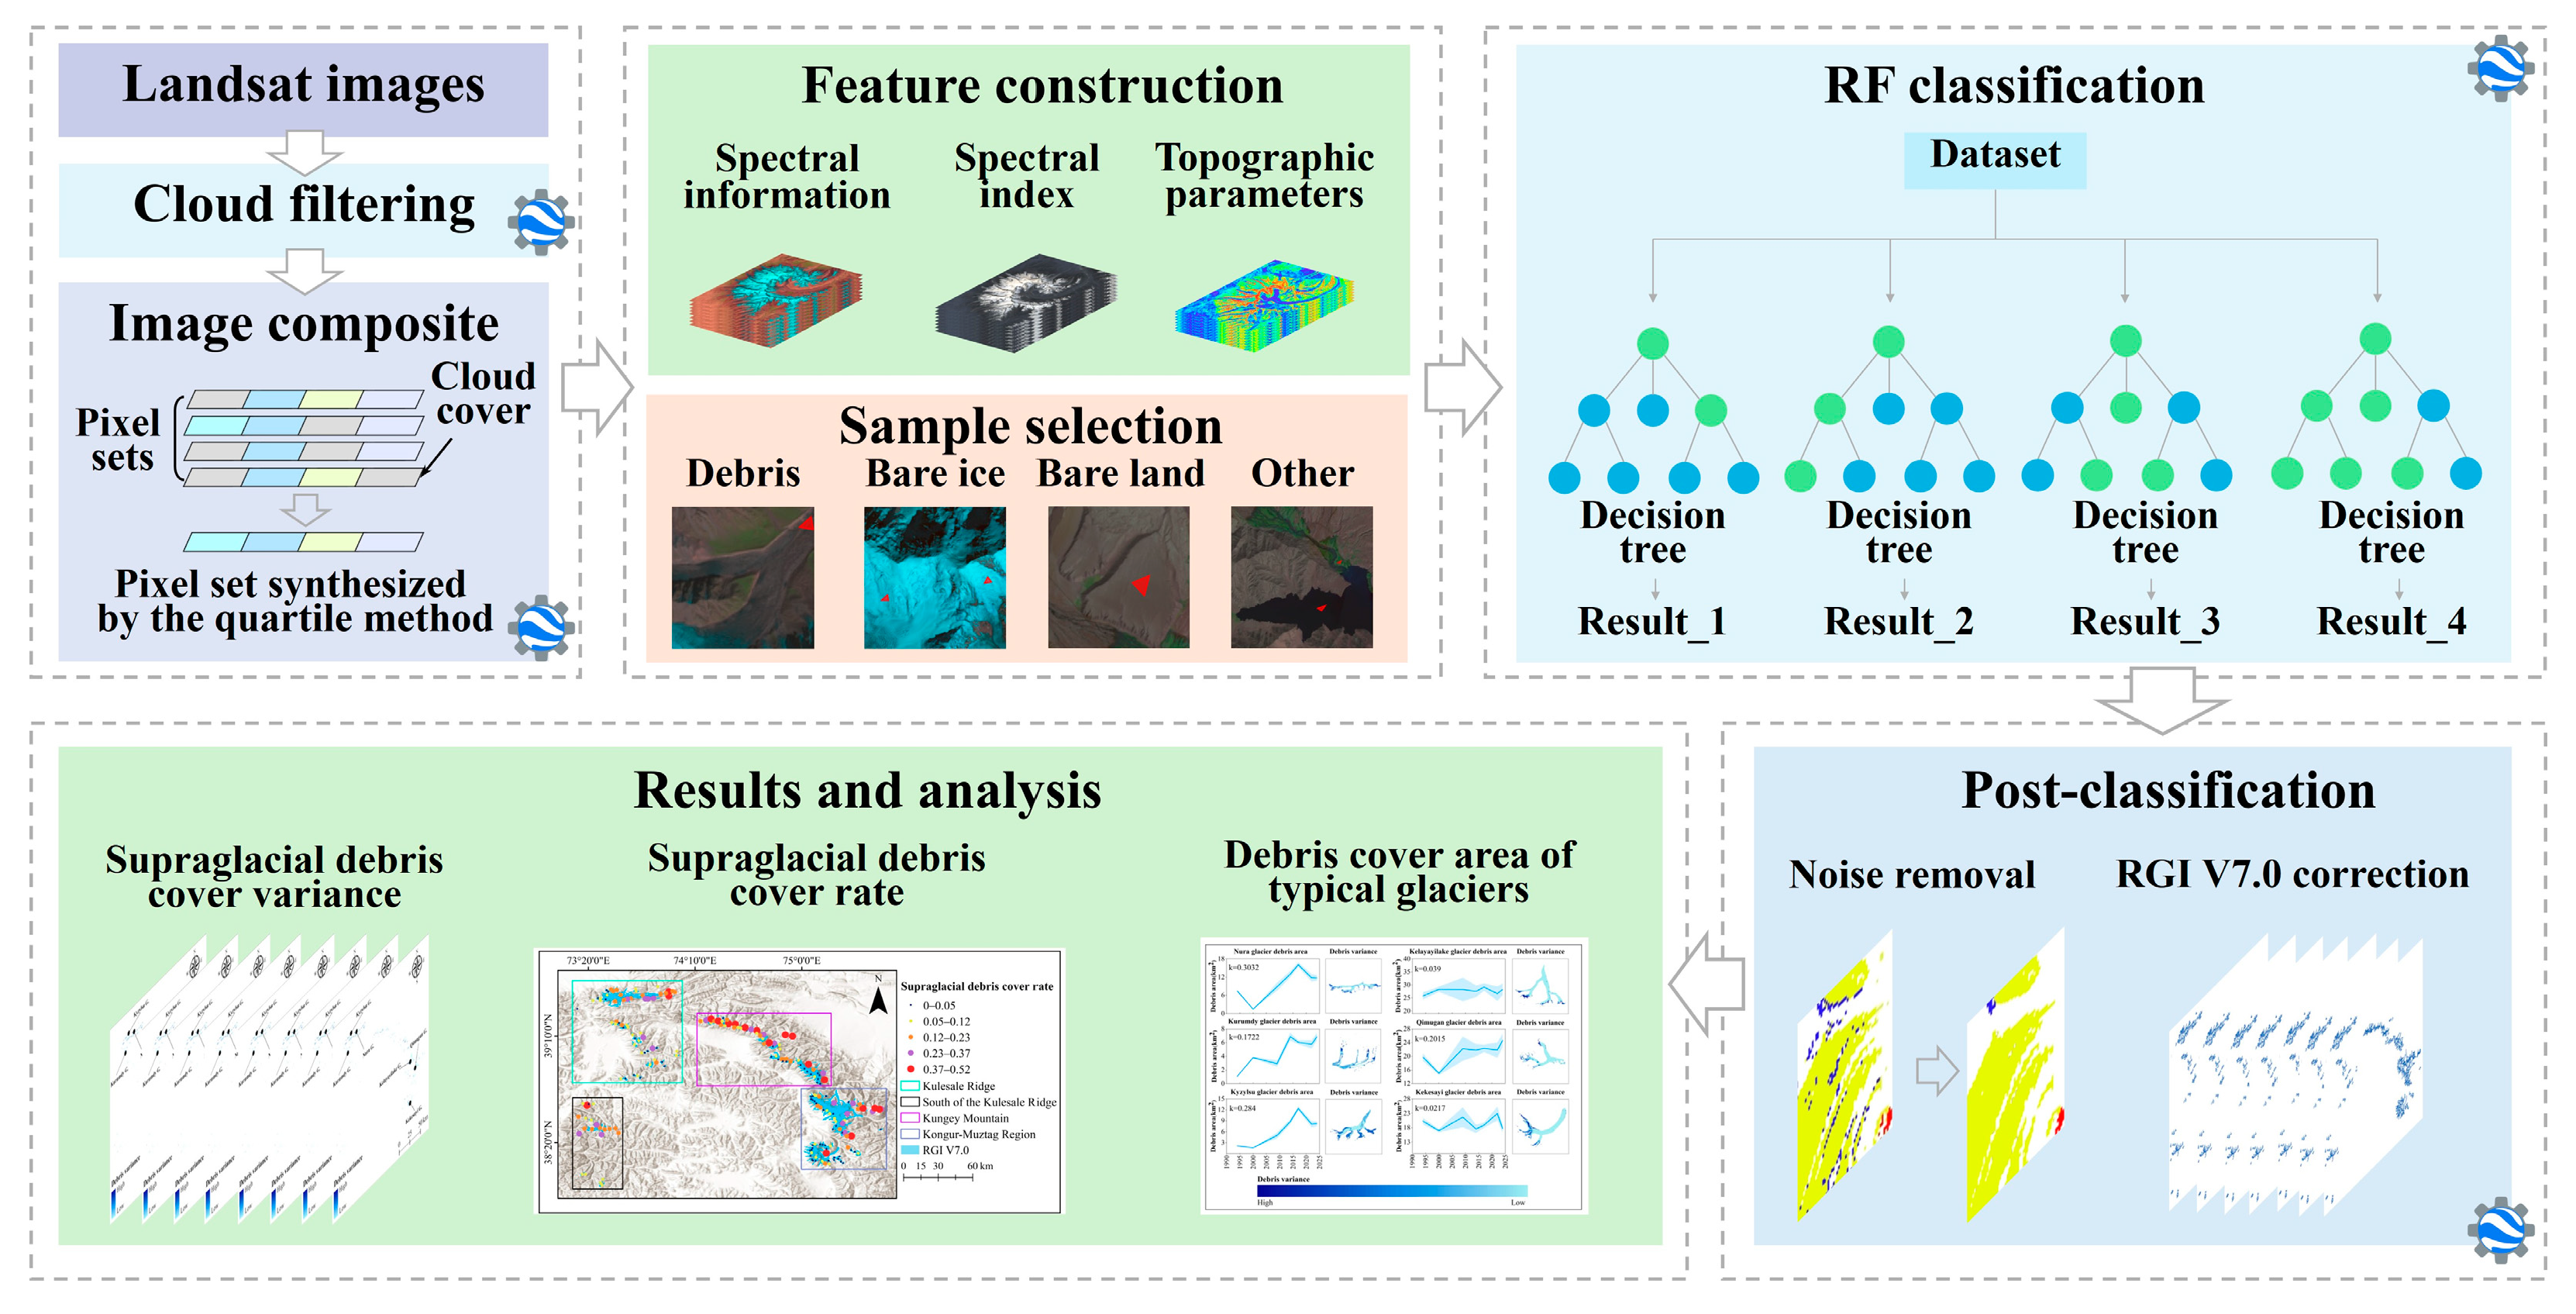
In the land cover classification process, the RF algorithm uses various branching criteria to improve the accuracy but could introduce salt-and-pepper noise, particularly in debris-covered areas. This results in the misclassification of features like ice cliffs or supraglacial ponds [40]. To mitigate noise interference, a 5 × 5 kernel filtering technique was applied [59], thereby smoothing the results and improving image clarity. Additionally, RGI V7.0 data were used to correct the misclassifications between the bare land at the glacier terminus and debris-covered areas (Figure 3).
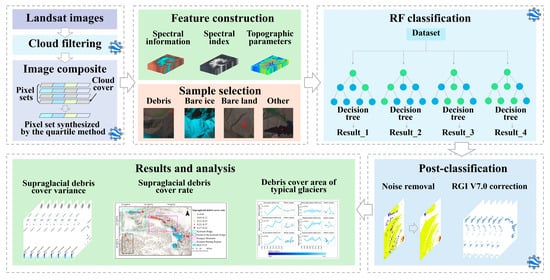
Figure 3.
Workflow schematic for the delineation of the supraglacial debris cover.
3.4. Accuracy Assessment and Error Analysis
During the phase of model evaluation, a confusion matrix was applied to analyze the classification accuracy. This analysis provided a comprehensive overview of the model’s predictive performance and error rates for each category. Furthermore, the Kappa coefficient, a metric used to quantify the overall classification performance, was employed to assess whether the model’s predictions were in agreement with the ground truth; a value approaching 1 reflects stronger agreement. In this study, the Kappa coefficient specifically evaluated the classification accuracy of the Random Forest model across categories such as supraglacial debris, bare ice, and bare land. The calculation methods for each metric are as follows:
where OA represents the overall accuracy; is the user accuracy for the category i; is the producer accuracy for the category i; k is the Kappa coefficient; E is the expected accuracy from random prediction; C is the total number of classification categories; is the value in the i-th row and j-th column of the confusion matrix, indicating the number of samples that were predicted as belonging to category i but actually belonged to category j; and is the value on the diagonal of the confusion matrix, representing the number of samples that were accurately classified in category i.
This study used the following methods to calculate the uncertainty range of supraglacial debris, bare ice, and the glacier area:
where represents the area error of the land cover (km2) and denotes the user accuracy of the land cover classification.
The changes in the land cover area and the corresponding error between year m and year n were calculated as follows:
where represents the change in the land cover area, and represents the error in the change in the land cover area; and represent the land cover areas (km2) in the years n and m, respectively; and and represent the errors in the land cover areas (km2) for the years n and m, respectively.
4. Results and Analysis
4.1. Status of Supraglacial Debris Cover in Eastern Pamir
In 2024, the total glacier area (only counting glaciers with an area greater than 2 km2) in eastern Pamir was 1395.32 ± 21.71 km2, of which 258.08 ± 20.65 km2 (18.5 ± 1.55%) was covered by supraglacial debris. The debris cover commenced at an elevation of 2800 m, progressively decreasing with altitude and reaching its minimum extent at 6600 m (Figure S1). Conversely, the bare ice zone started at 3400 m and extended up to 7600 m. Below 3400 m, the glacier surface was almost entirely covered by debris, with debris coverage nearing 100%. Above 5200 m, bare ice predominated, with debris cover becoming increasingly scarce at higher elevations. This elevation-dependent variation in the debris distribution indicates a heterogeneous balance in the mass of the glaciers, with extensive debris cover at lower altitudes and a gradual transition to bare ice at higher elevations.
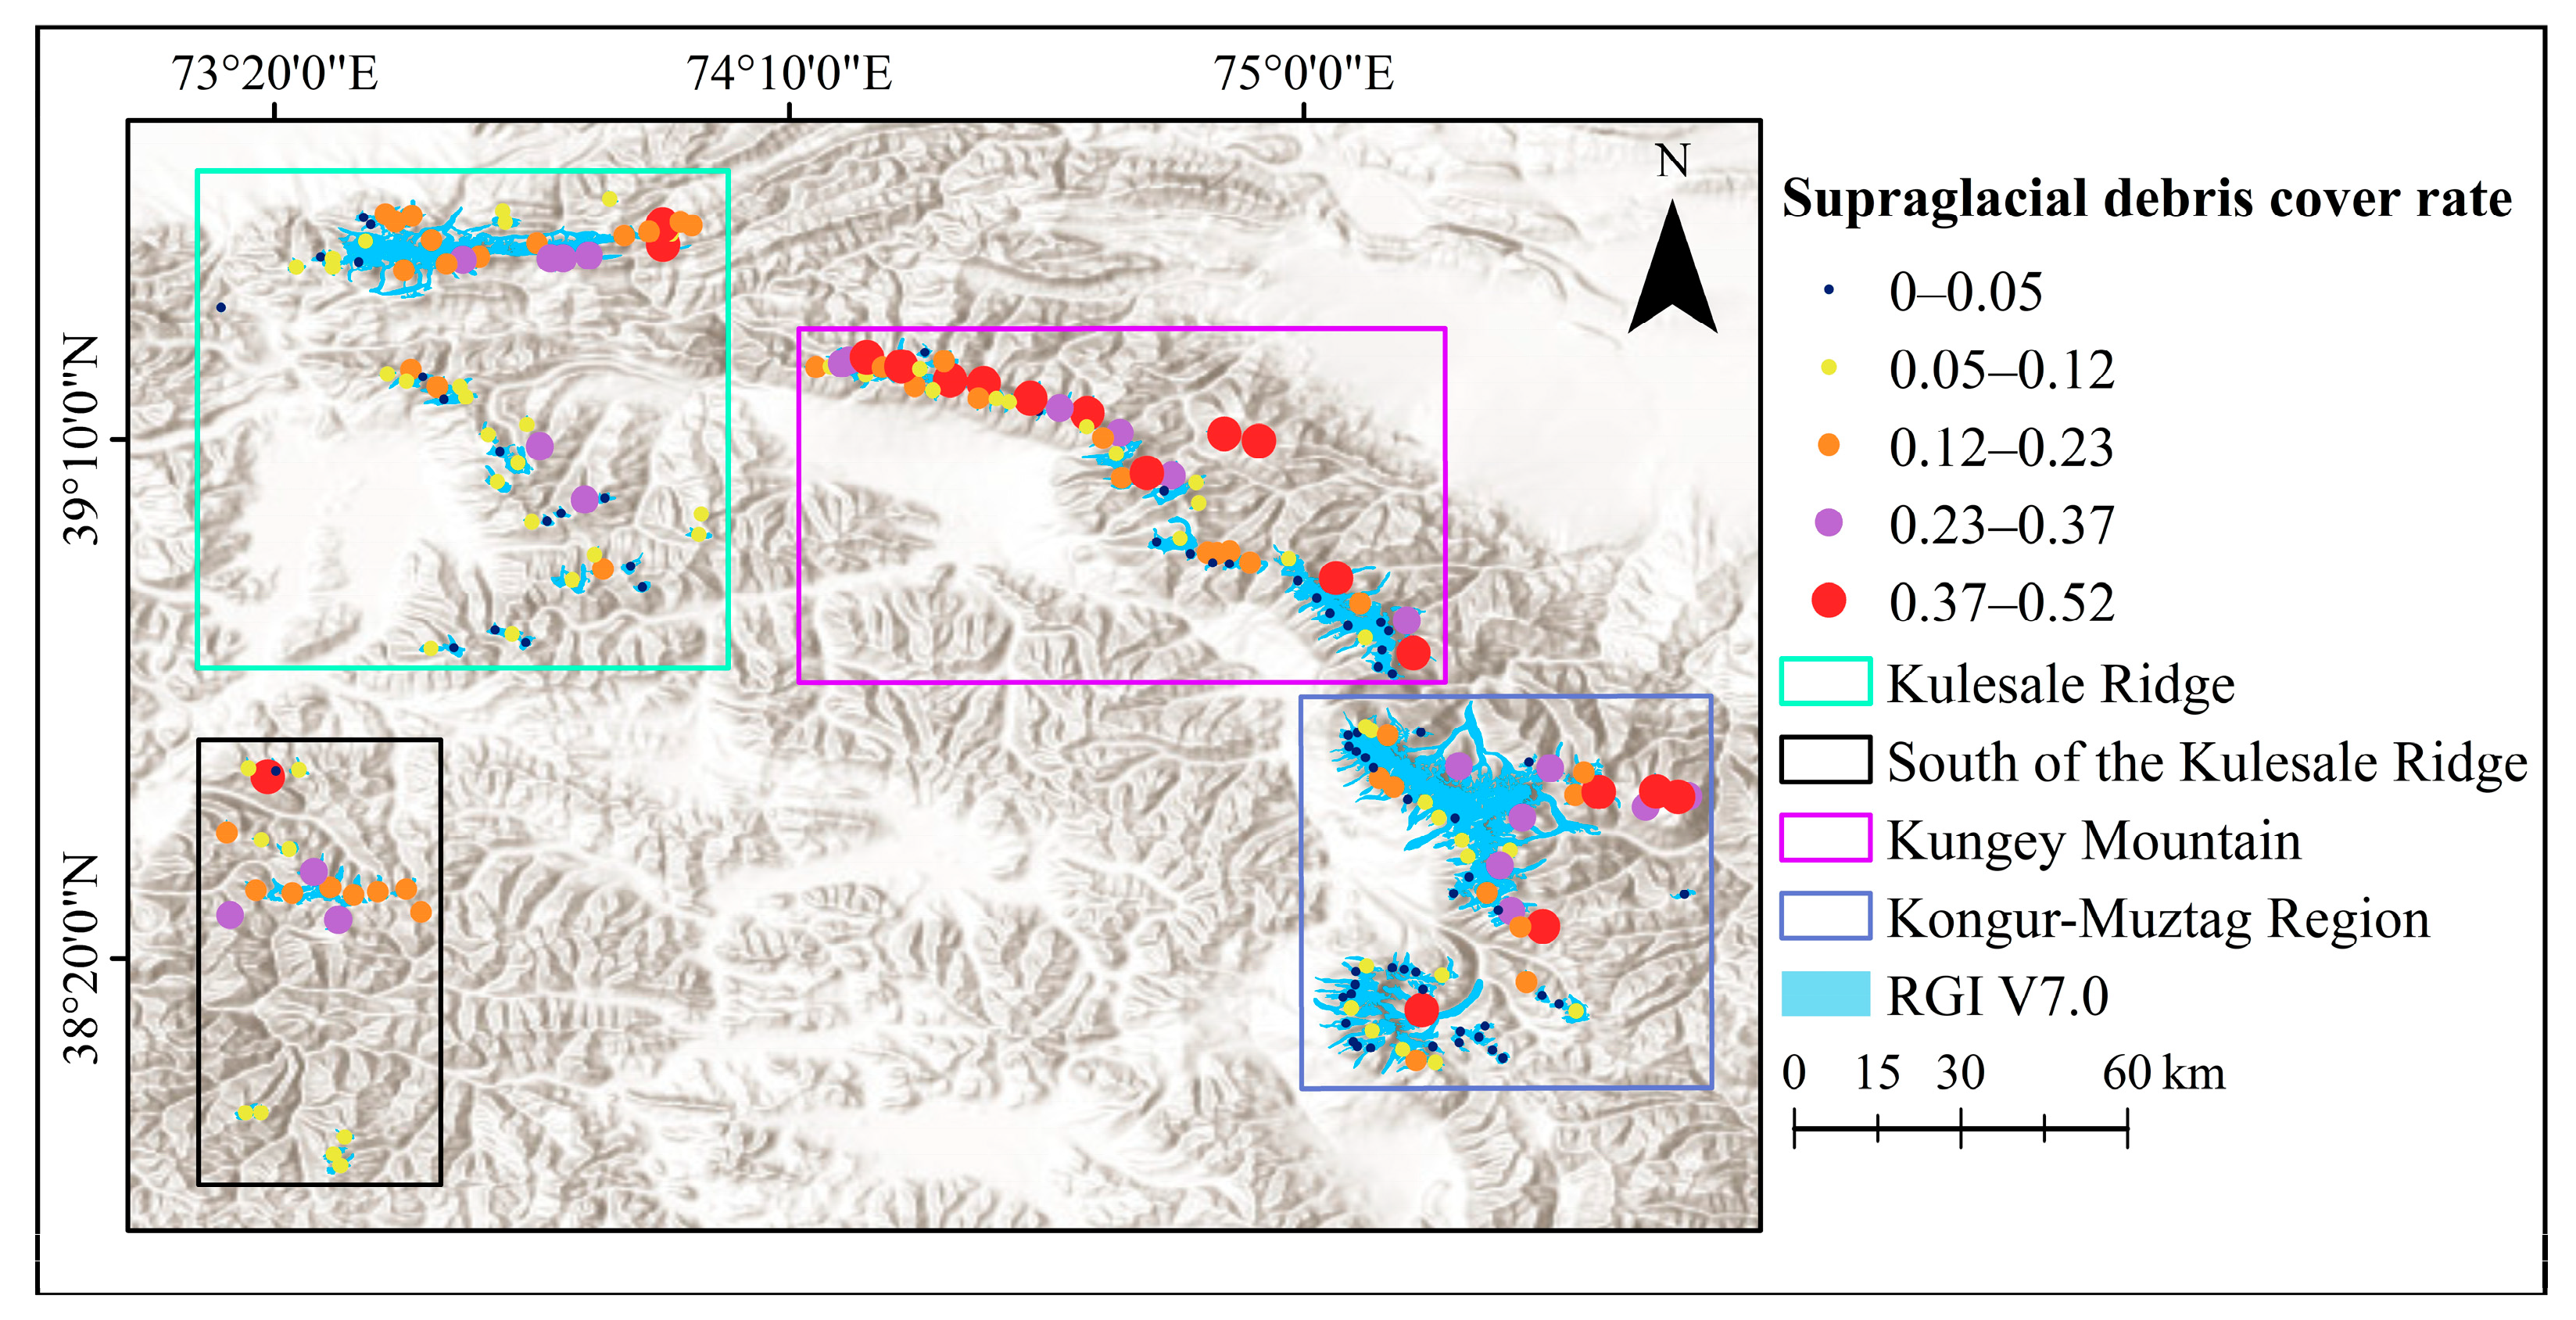
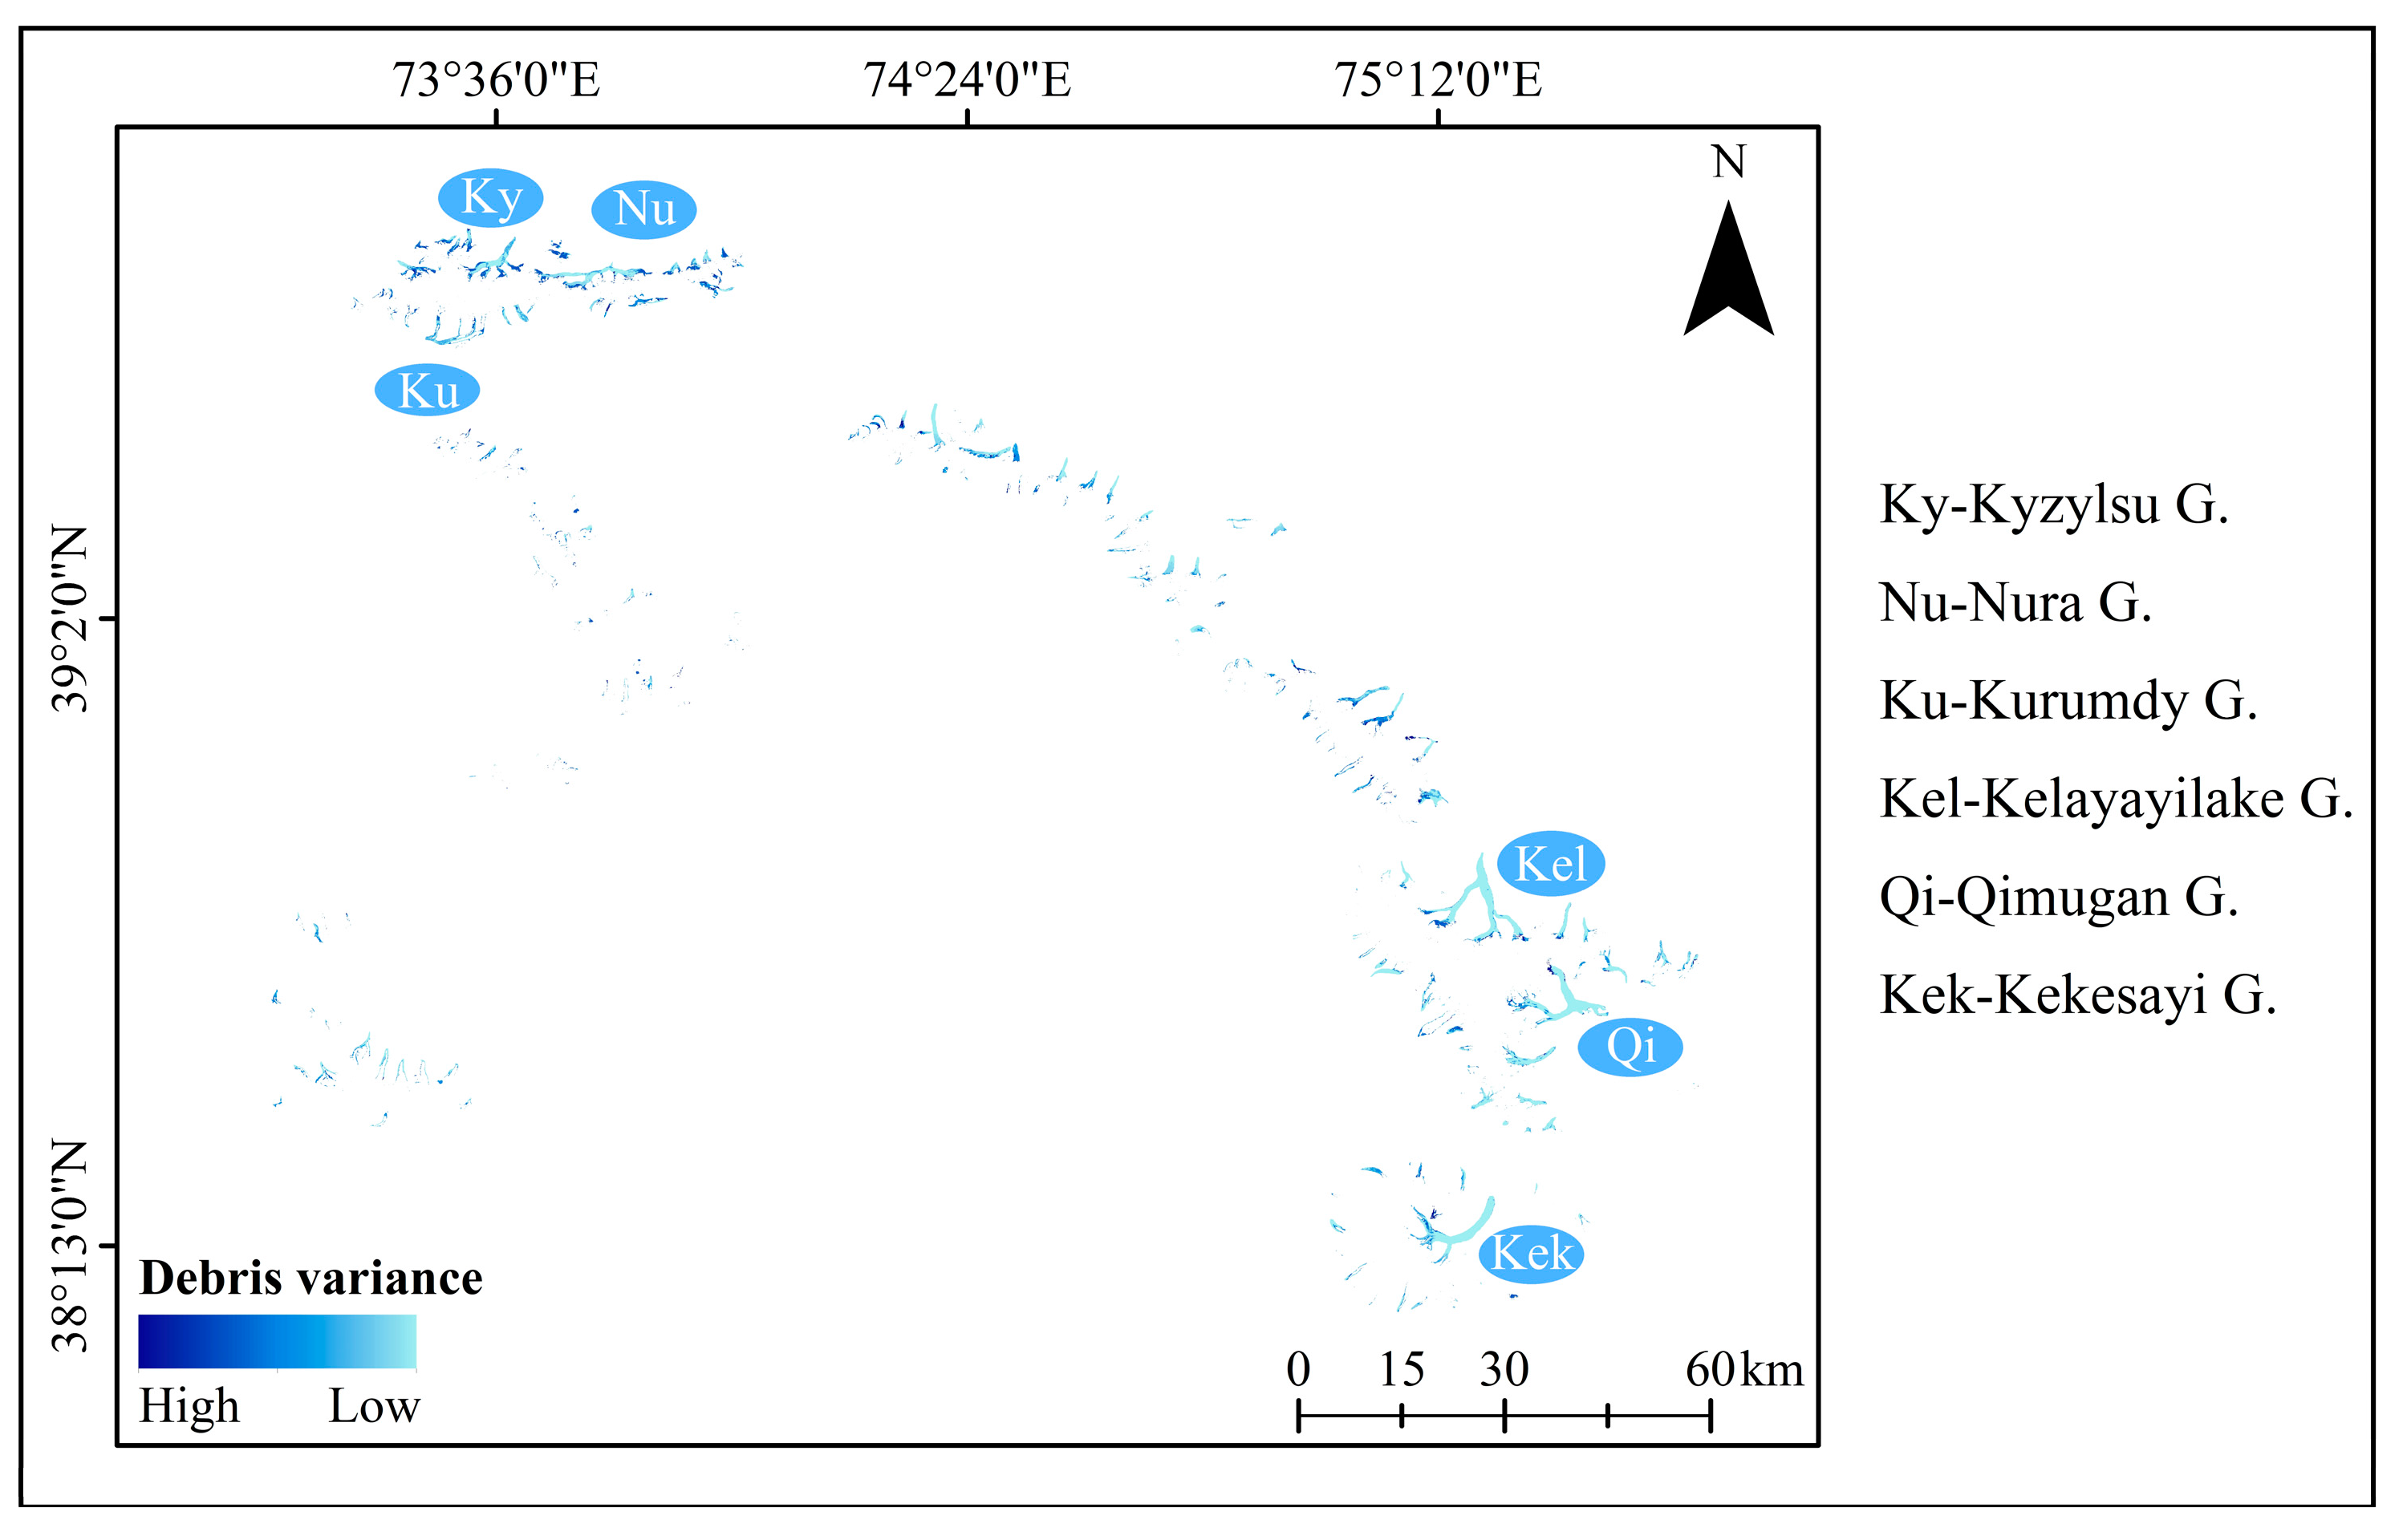
The supraglacial debris cover rate (the ratio of the debris-covered area to the glacier area) in eastern Pamir ranged from 0 to 0.52, with a mean value of 0.14. These results reflected the considerable spatial variability across the region. To further investigate this variability, the study area was delineated into four distinct regions based on the mountain ranges: Kulesale Ridge (KR), Kongur-Muztag Region (KMR), Kungey Mountain (KM), and south of the Kulesale Ridge (SKR). The results revealed considerable regional differences in the debris cover rate (Table 3, Figure 4): the KR generally demonstrated low coverage, although some areas exhibited higher coverage (range 0.41, average 0.12); the SKR had relatively uniform coverage, with a maximum of 0.48 and an average of 0.16; the central region not only exhibited high coverage (maximum 0.52, average 0.18) but also demonstrated the greatest spatial variability (range 0.52); the KMR, despite large areas being covered by debris, had low overall coverage (range 0.49, average 0.10). In summary, the KM exhibited the highest supraglacial debris cover rate and the greatest variation, followed by the SKR. The KR and KMR regions demonstrated relatively lower cover rates, highlighting the heterogeneity in the glacier dynamics and surface processes across these regions.

Table 3.
Overview of debris cover rate in different regions of eastern Pamir.
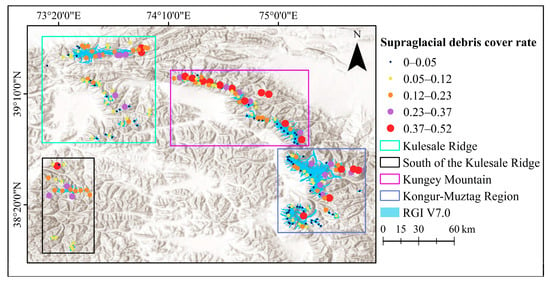
Figure 4.
Debris cover rate of glaciers in eastern Pamir (2024).
4.2. Changes in Supraglacial Debris Cover from 1994 to 2024
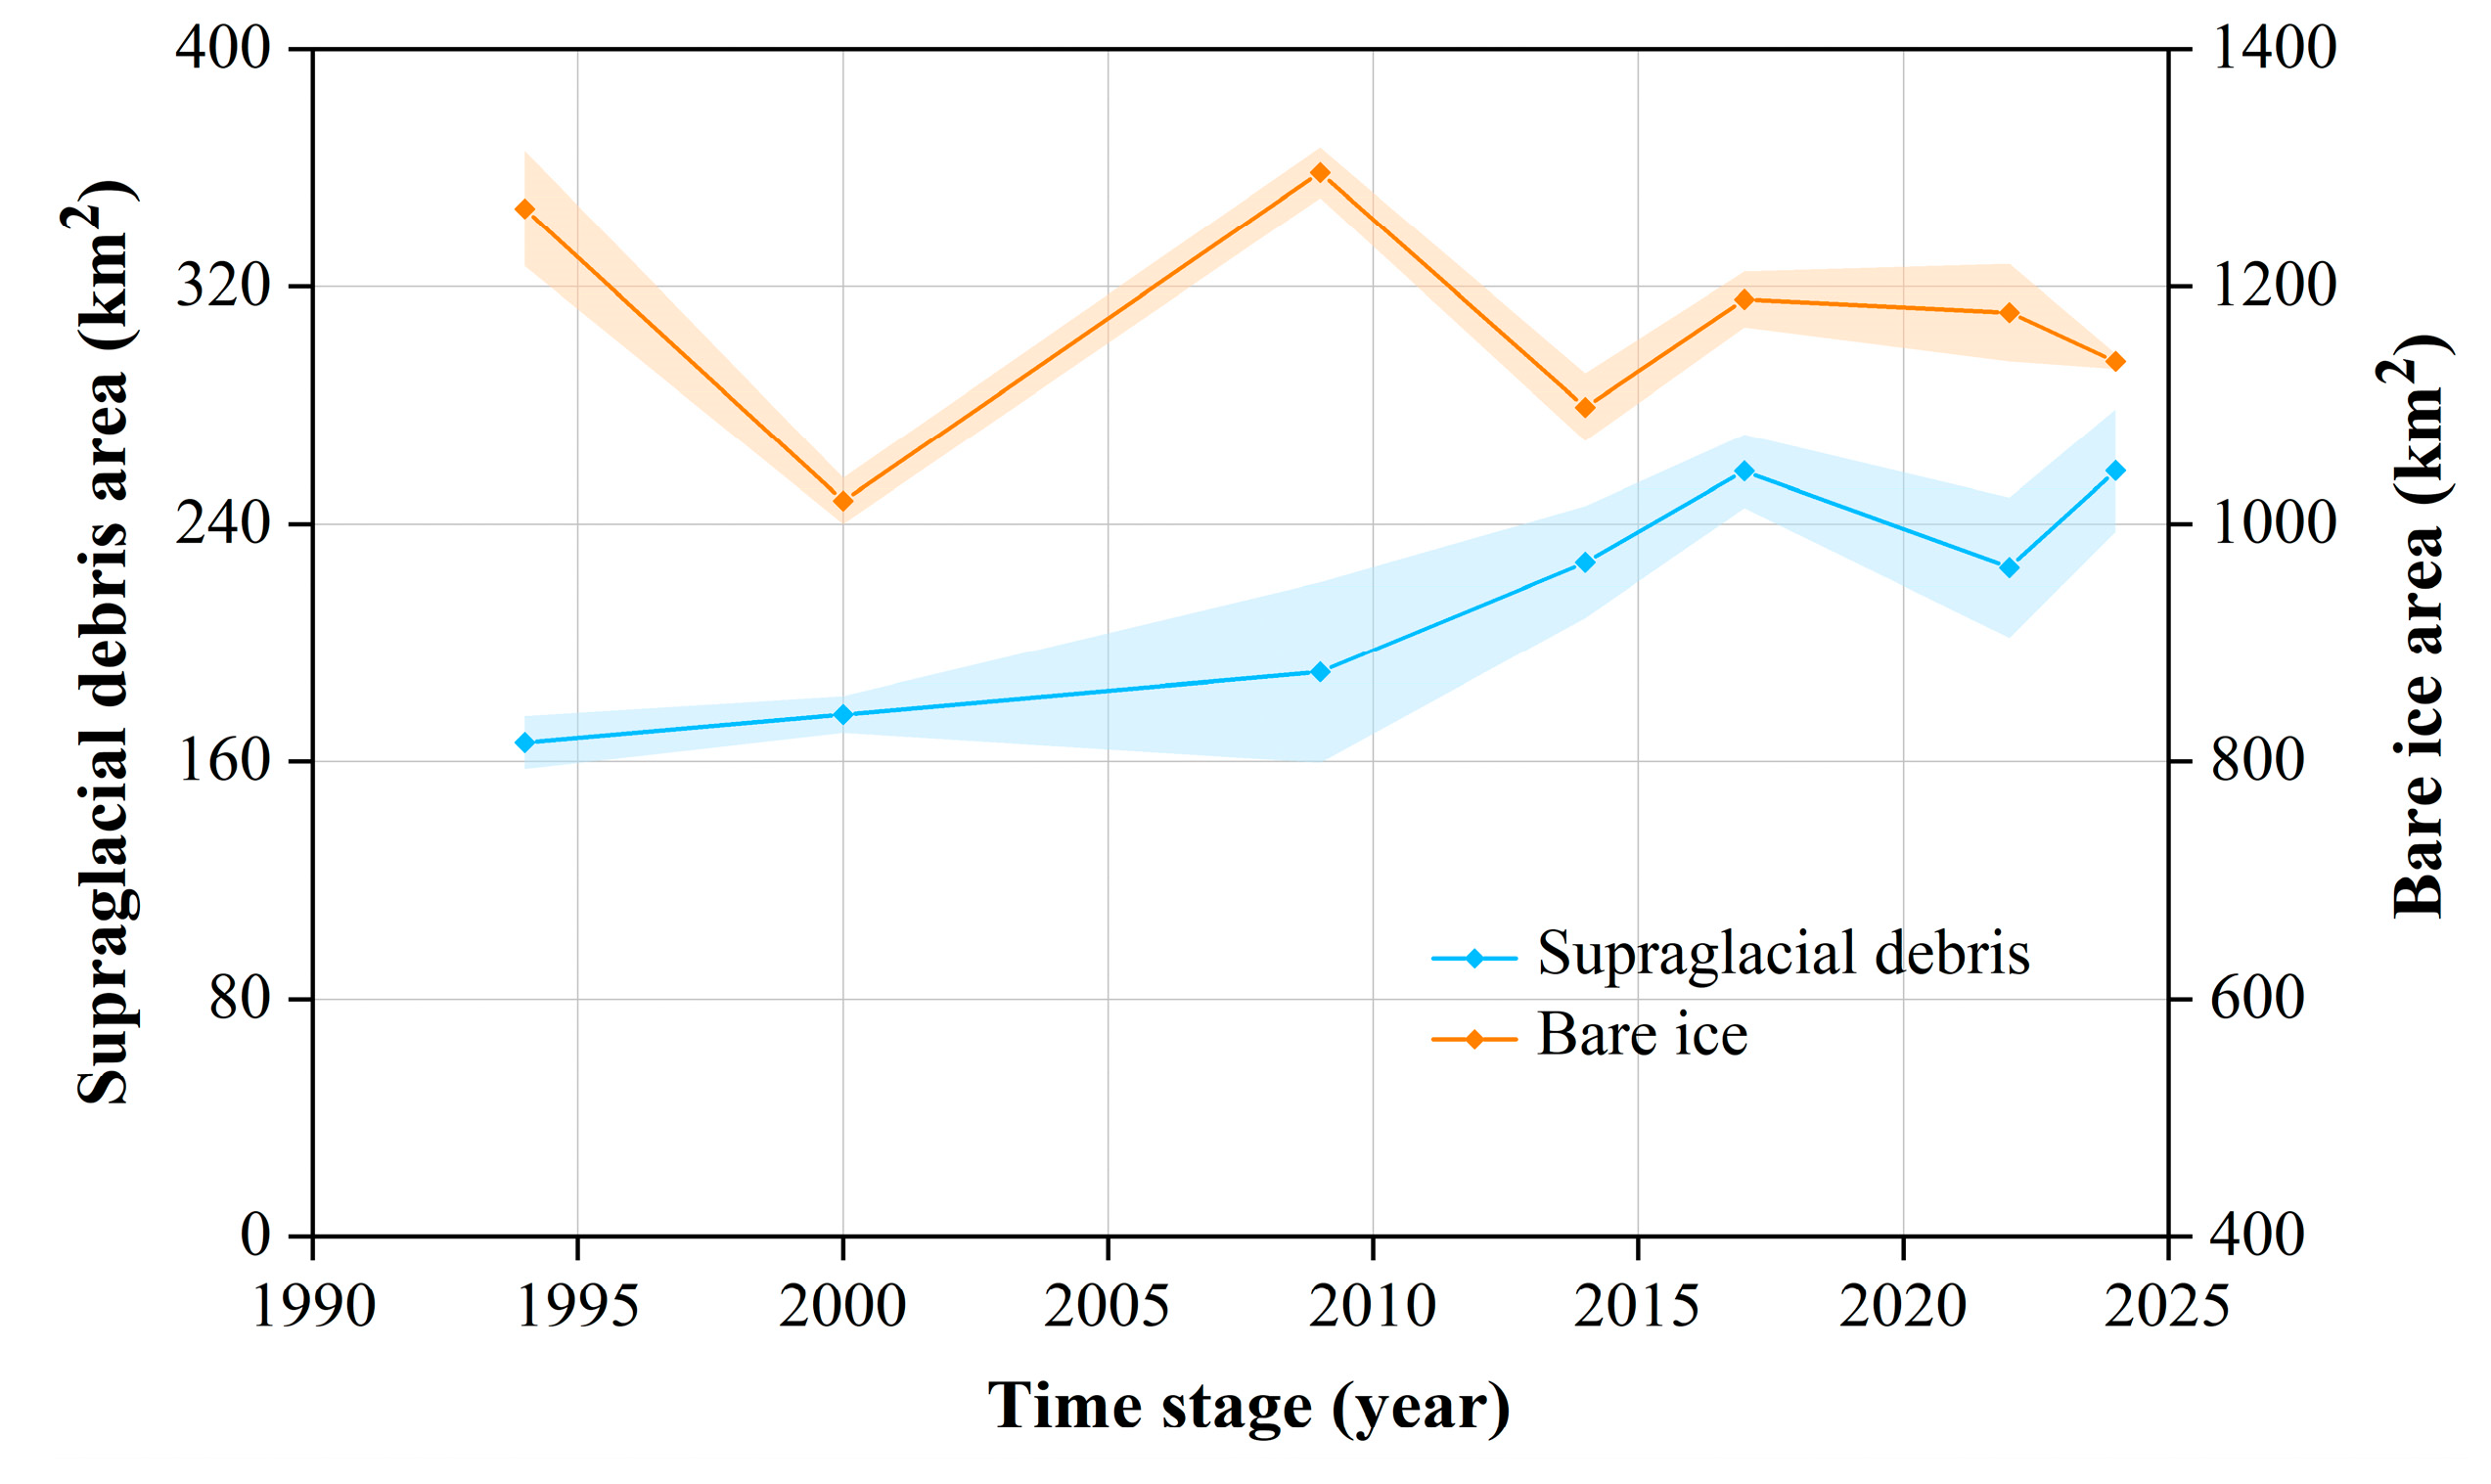
This study identified the extent of the supraglacial debris cover in eastern Pamir across seven distinct time points (Table 4). The results highlighted the high classification performance of the RF model. The Kappa coefficients ranged between 0.93 and 0.98, with an overall accuracy ranging from 95% to 98.4%. The debris area changes during each period were observed to be as follows: +5.68 ± 3.70% from 1994 to 2000, +8.16 ± 17.26% from 2000 to 2009, +19.53 ± 10.06% from 2009 to 2014, +13.52 ± 4.82% from 2014 to 2017, −12.59 ± 10.33% from 2017 to 2022, and +14.52 ± 8.60% from 2022 to 2024. During the same period, the total glacier area decreased from 1432.27 km2 in 1994 to 1395.32 km2 in 2024, representing a reduction of −2.57 ± 0.70%.

Table 4.
Changes in debris cover area in eastern Pamir from 1994 to 2024.
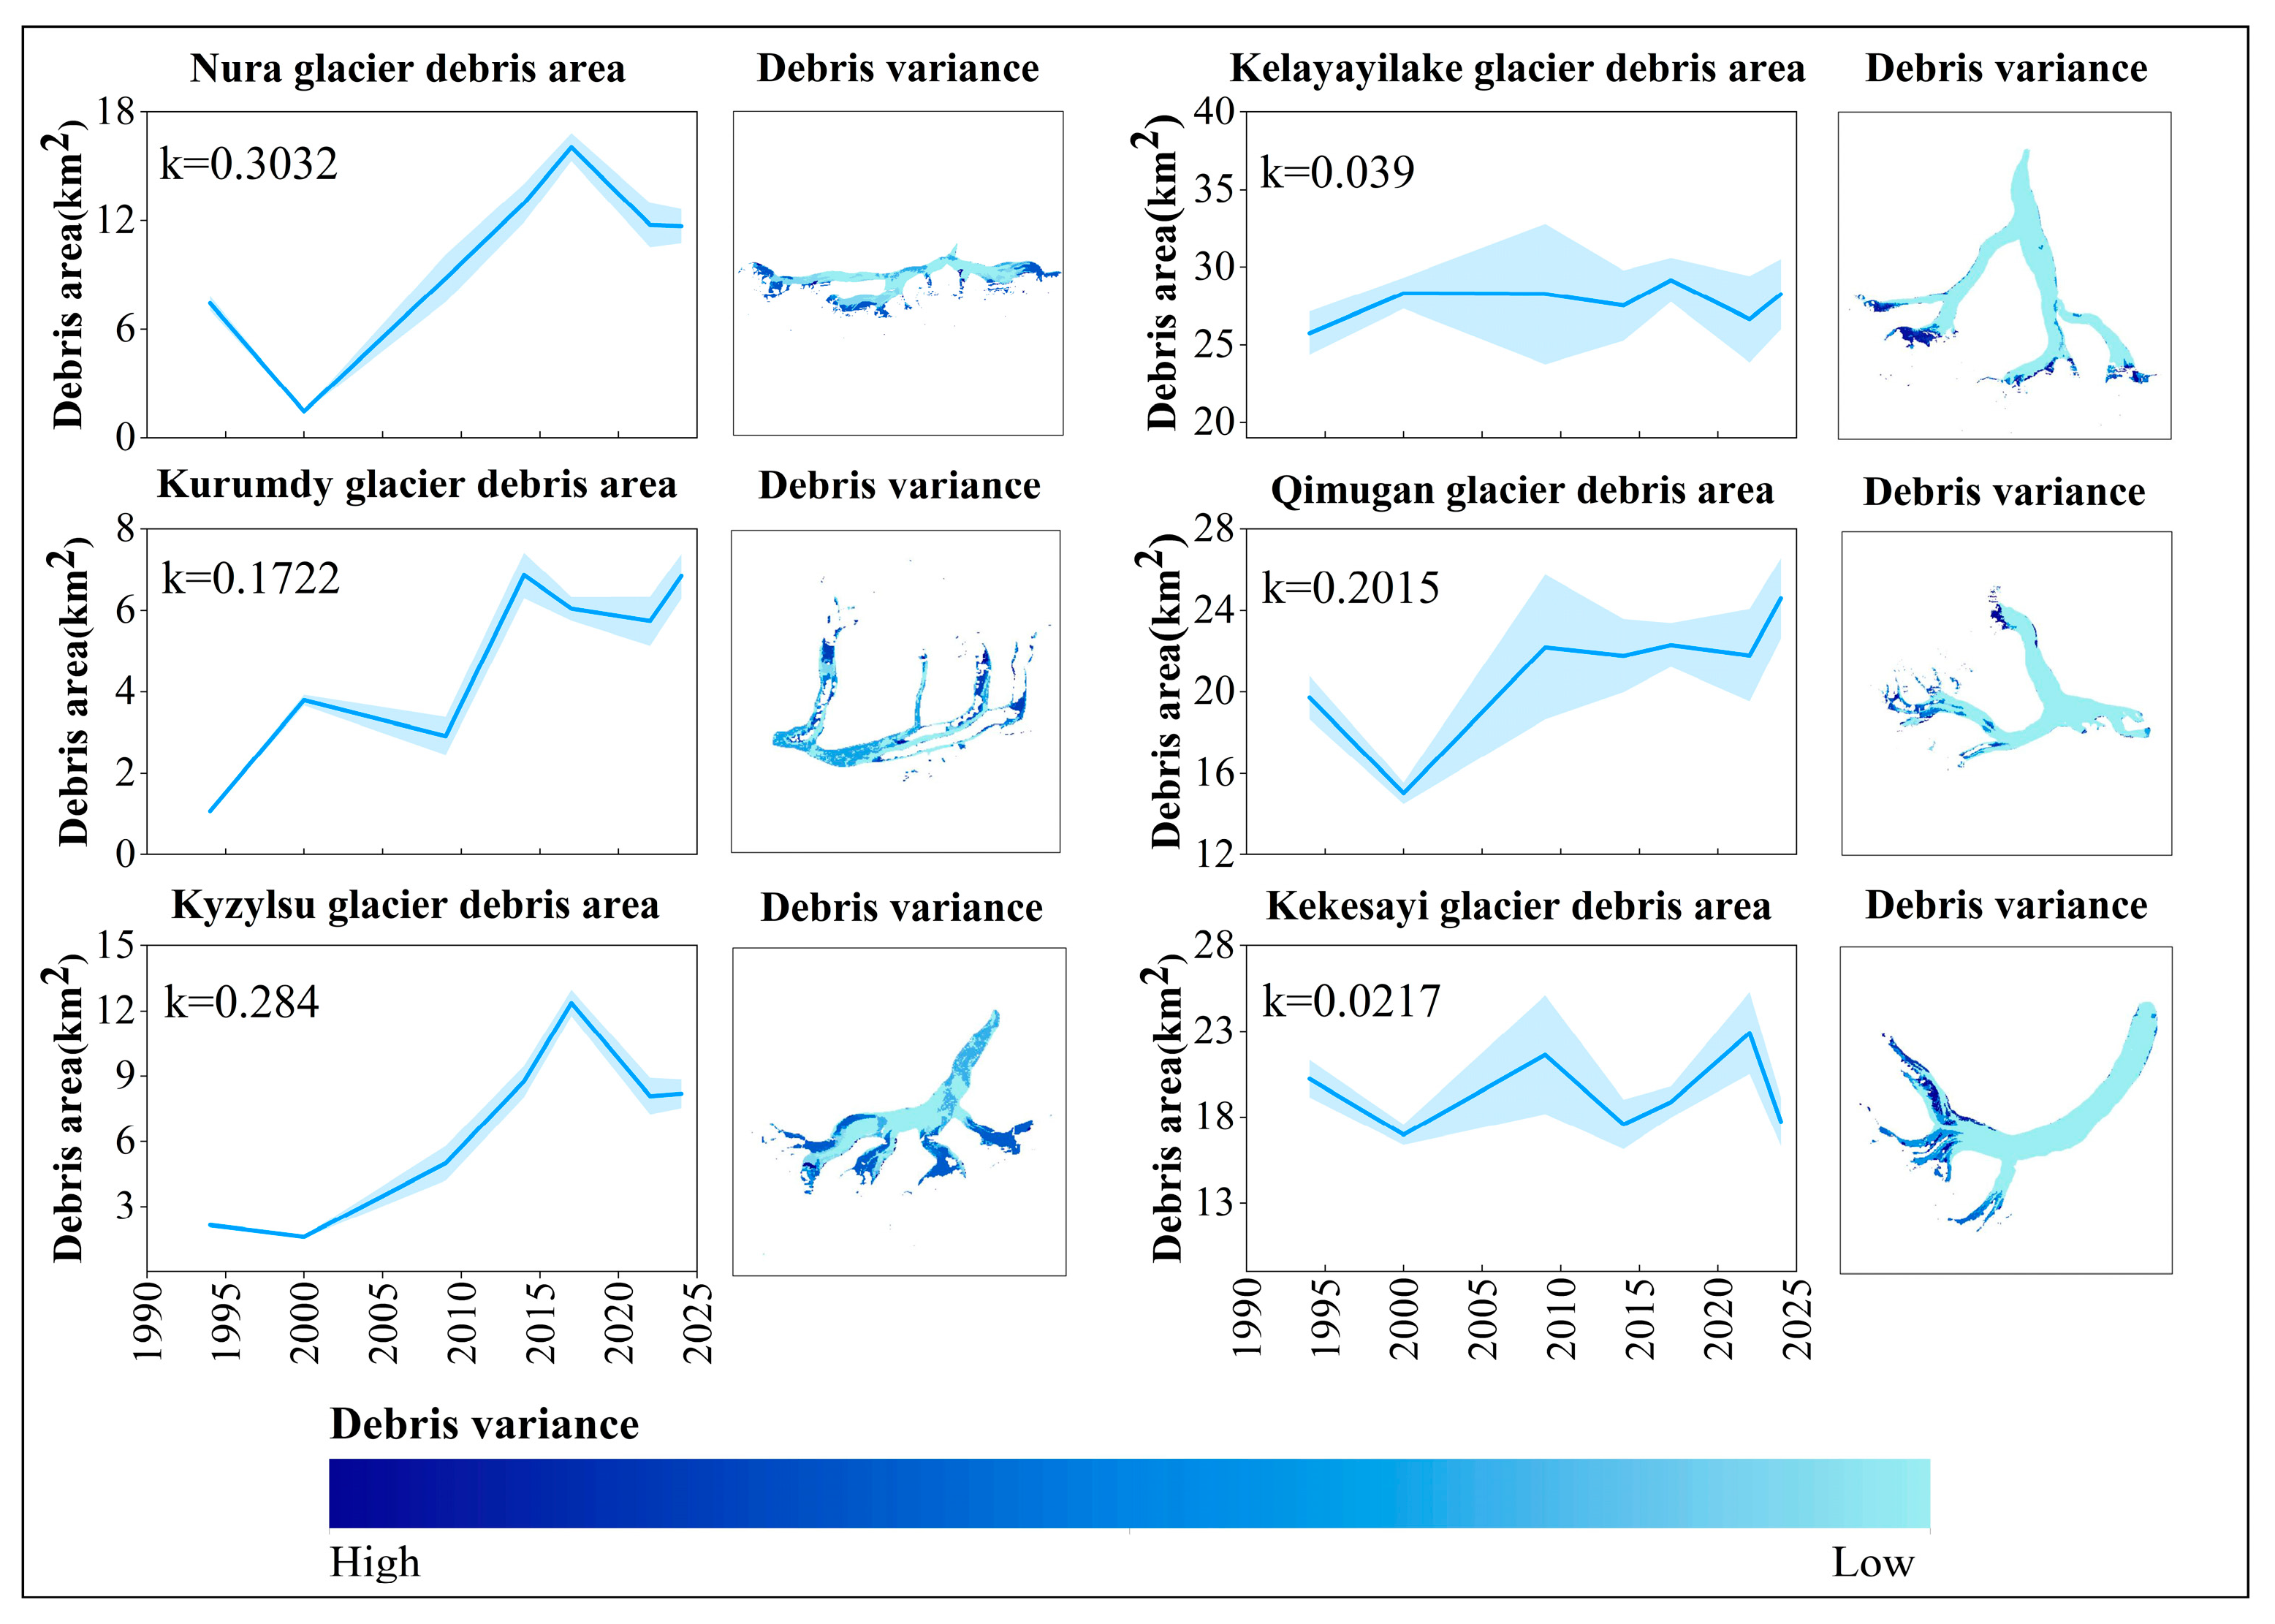
From 1994 to 2024, the extent of supraglacial debris cover on glaciers in eastern Pamir exhibited consistent expansion (Figure 5). This trend was observed across six representative glaciers (Figure 6), whose geographical locations are provided in Table 1. The spatiotemporal variations in debris cover were notable, with some glaciers displaying considerable increases while others exhibited more stable trends. Specifically, the Nura, Kurumdy, and Kyzylsu glaciers experienced substantial increases in supraglacial debris, with average expansions of 0.3032, 0.1722, and 0.284, respectively. In contrast, the Kelayayilake and Kekesayi glaciers demonstrated relatively stable changes, with modest average increases of 0.039 and 0.0217, although fluctuations in the extent of the debris were more pronounced. The Qimugan glacier exhibited marked fluctuations in debris cover during the earlier period but exhibited a stabilizing trend and continued expansion post-2009.
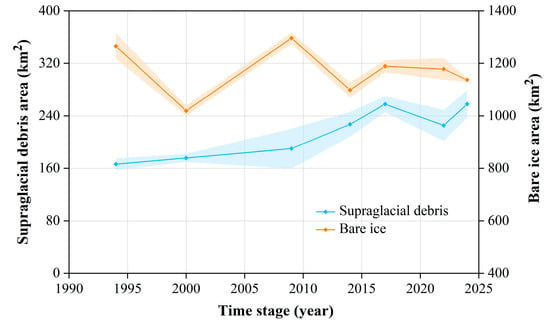
Figure 5.
Trends in debris cover and bare ice area in eastern Pamir from 1994 to 2024.
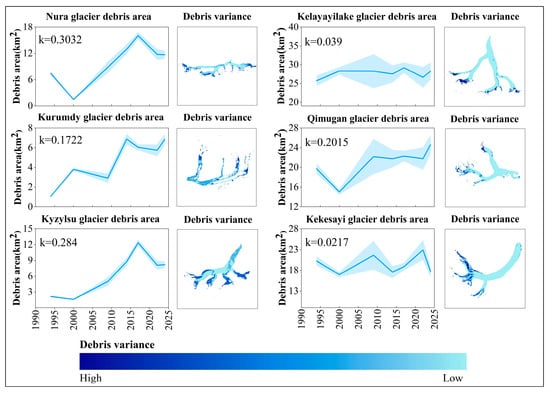
Figure 6.
Trends of changes in the debris cover area of typical glaciers from 1994 to 2024 (k represents the average rate of change in debris-covered areas; “debris variance high” indicates significant changes in the extent of debris cover in that area, while “low” indicates no change in the extent of debris cover).
4.3. Spatial Distribution Characteristics of Supraglacial Debris Change Areas
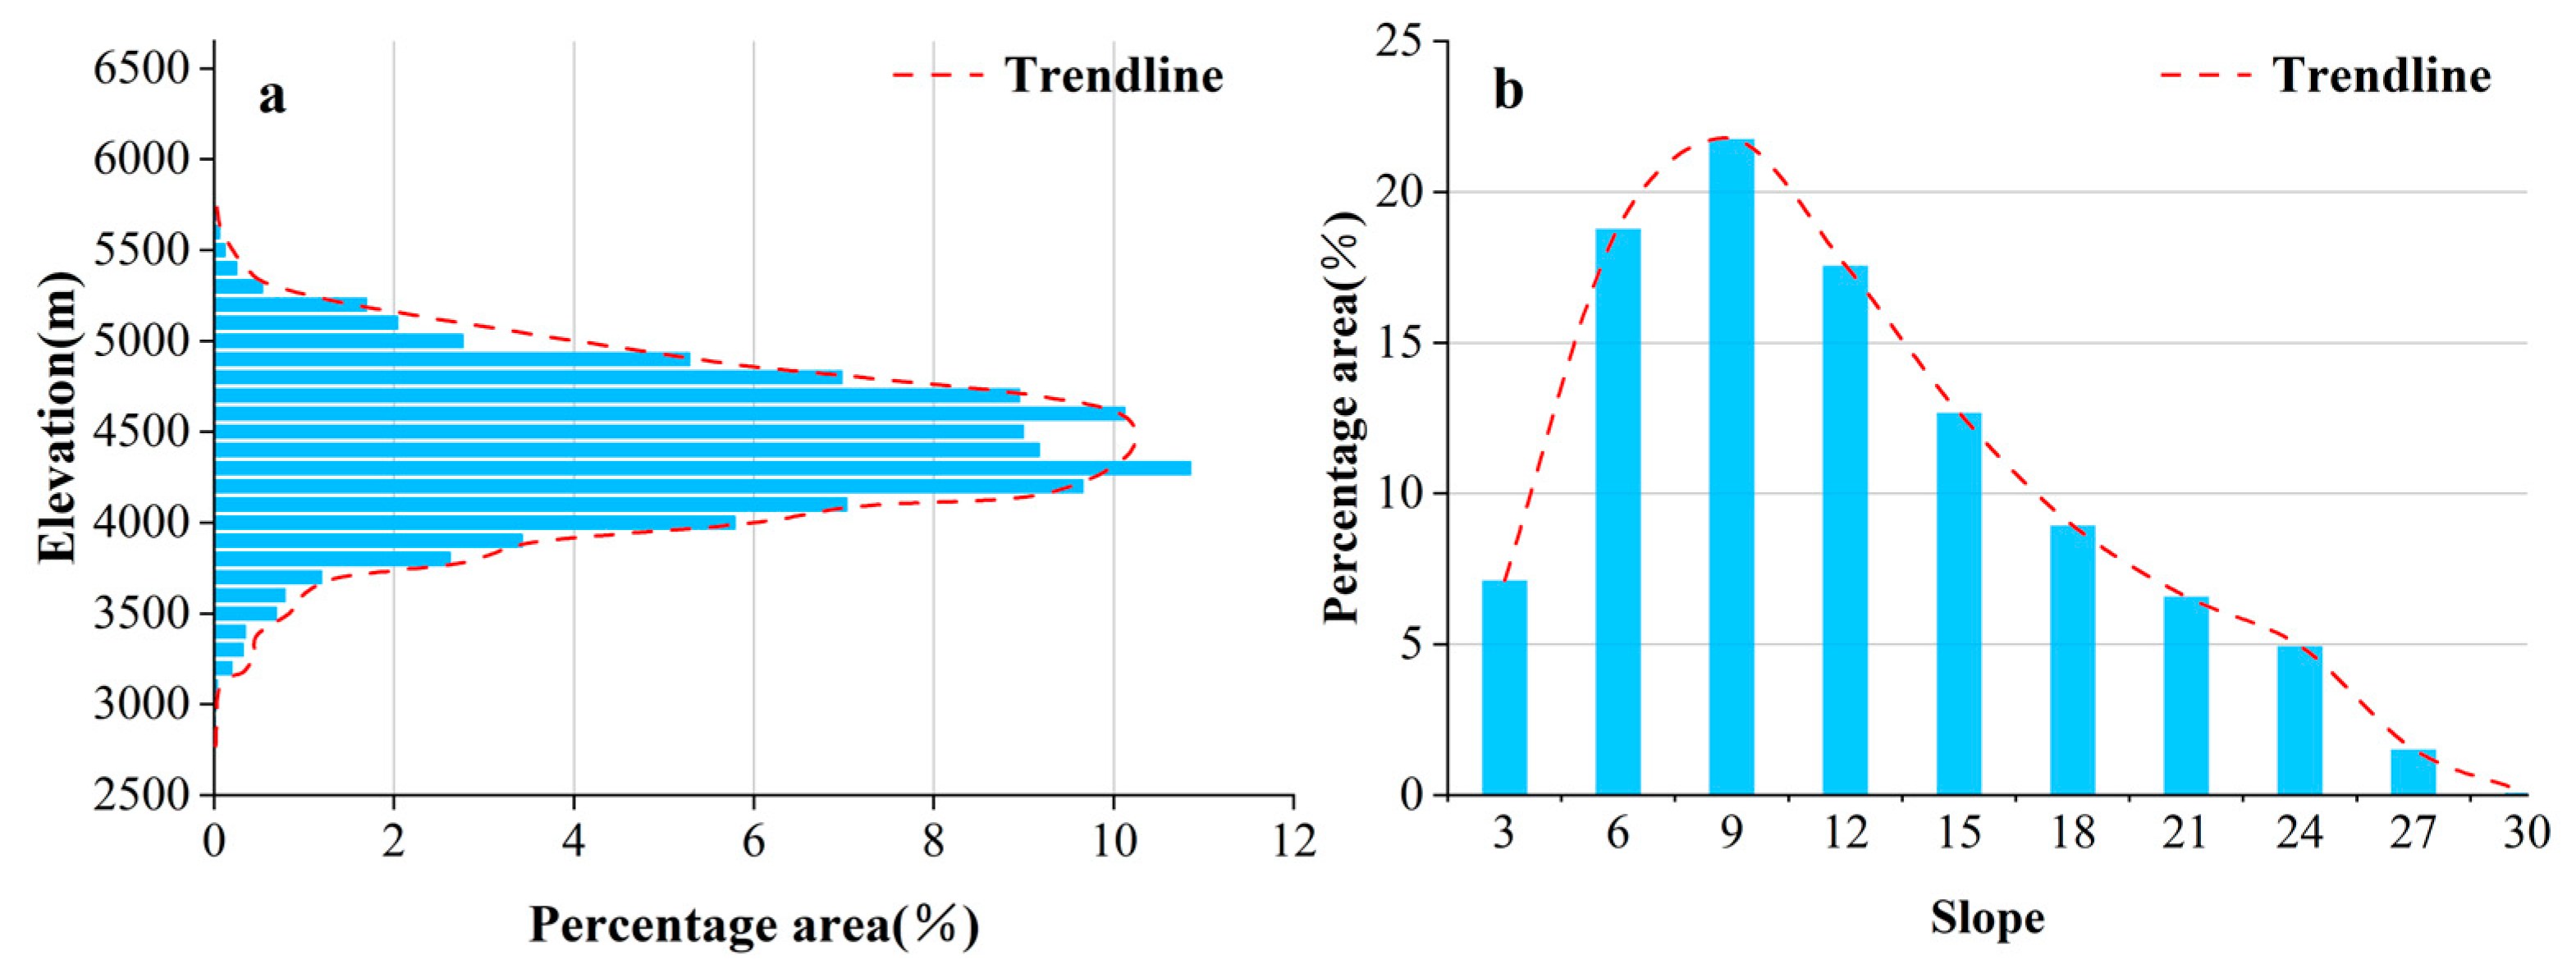
Between 1994 and 2024, the total area of stable supraglacial debris cover was 144.48 km2, while the area experiencing changes amounted to 138.03 km2. These changes were primarily concentrated at the interface between bare ice and the debris-covered area (Figure 7), particularly in the mid- to upper elevations (4000–4500 m). The spatial distribution of changes exhibited a normal distribution pattern in both altitude and slope (Figure 8). Changes were most prominent on the northern, northeastern, and eastern slopes, with areas above 4000 m accounting for 90.33% of the total change. Furthermore, slopes ranging from 0° to 24° encompassed 93.40% of the changed areas.
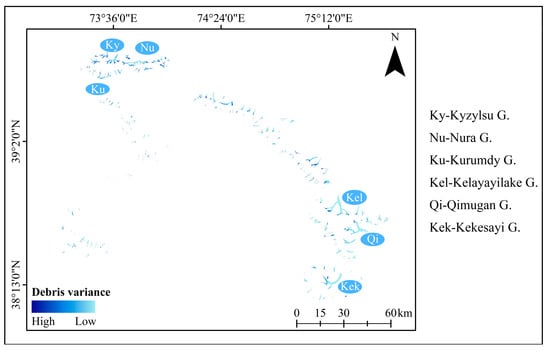
Figure 7.
Spatial distribution of debris cover changes in eastern Pamir from 1994 to 2024.
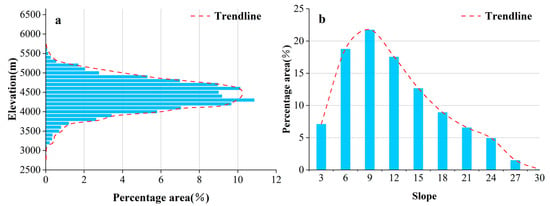
Figure 8.
Proportion (%) of debris cover area changes under different (a) elevations and (b) slopes.
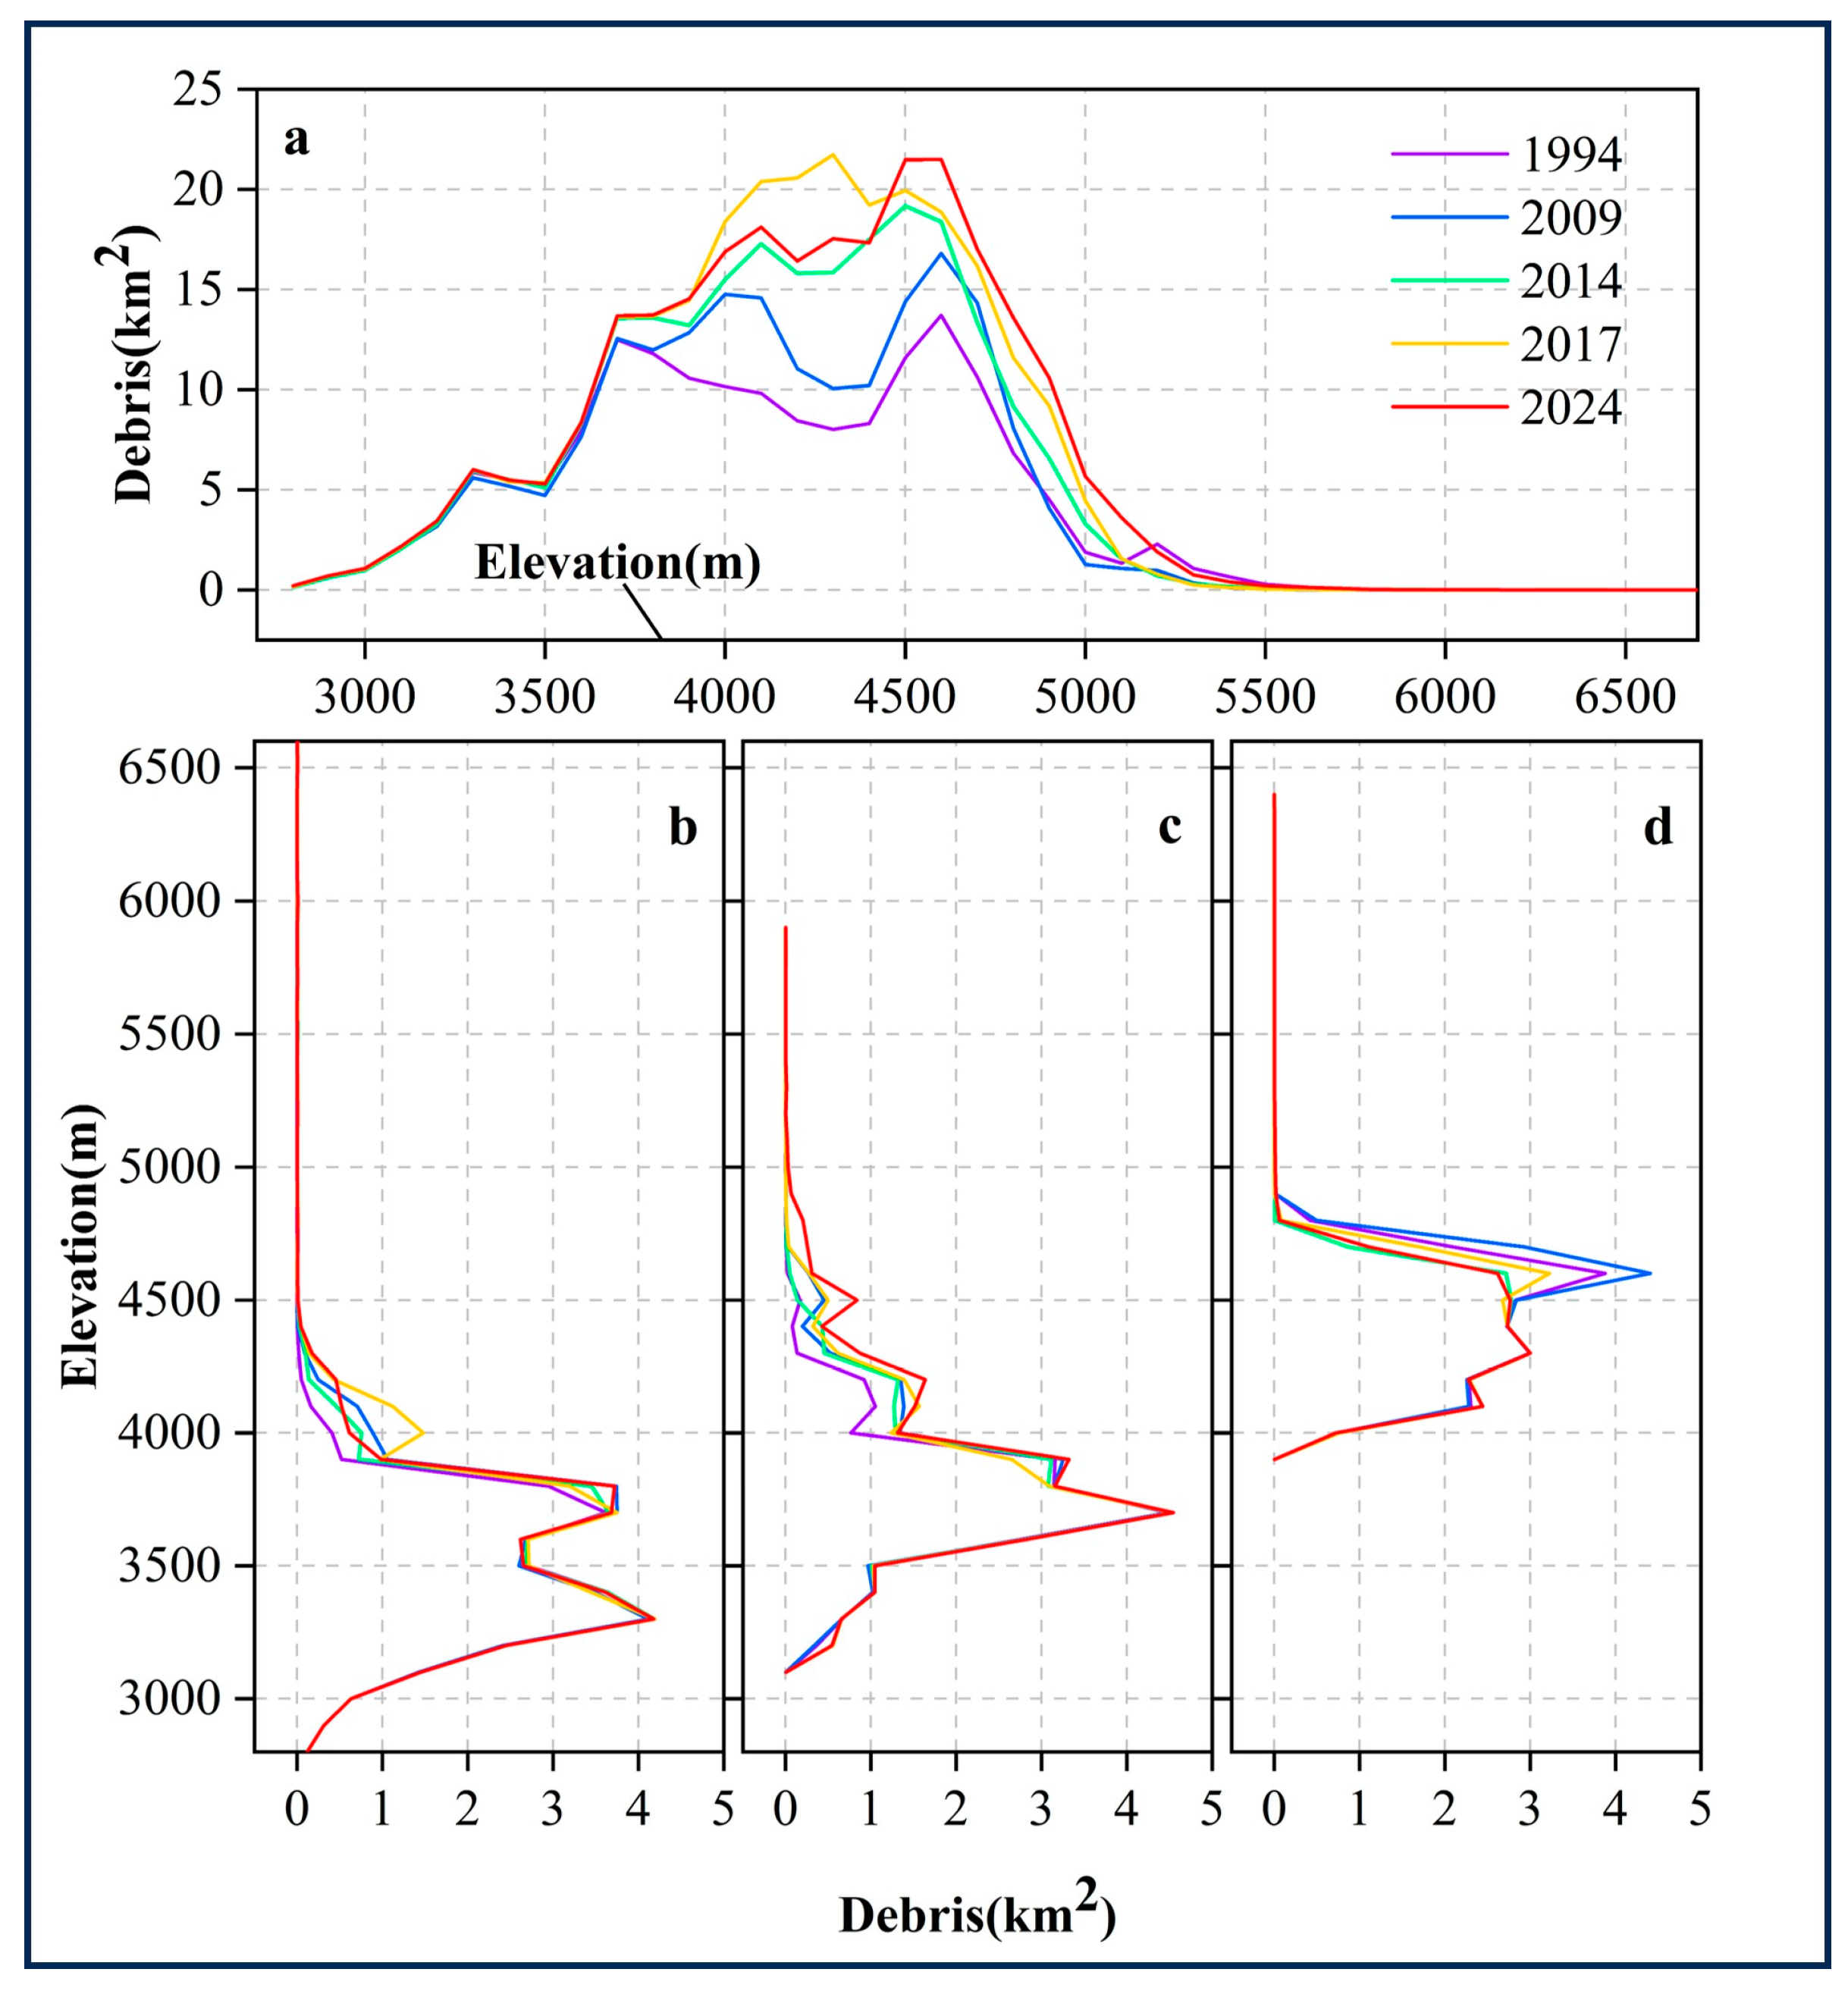
The most significant changes in supraglacial debris cover were observed in the altitude range of 4000–4500 m, which corresponds to the primary distribution zone of both debris and bare ice. The extent of the debris cover progressively expanded, peaking in 2017, followed by another peak in 2024. While the debris coverage remained relatively stable in the mid- to low-altitude range (3000–4000 m), it exhibited notable increases at higher altitudes, especially those above 4500 m. This trend suggests a positive expansion of debris cover towards the upper reaches of the glacier.
Different glaciers exhibited varying trends in the changes in supraglacial debris cover (Figure 9). On the Kelayayilake glacier, debris was primarily distributed between 3000 and 4500 m, showing stability below 3500 m and a marked expansion above 4000 m by 2024. In contrast, the Qimugan glacier displayed a wider distribution of debris, extending from 3000 to 5000 m, with minimal changes observed between 3000 and 4000 m. However, a significant expansion above 4000 m was observed starting from 2014. The Kekesayi glacier, on the other hand, exhibited minimal changes, with few signs of expansion.
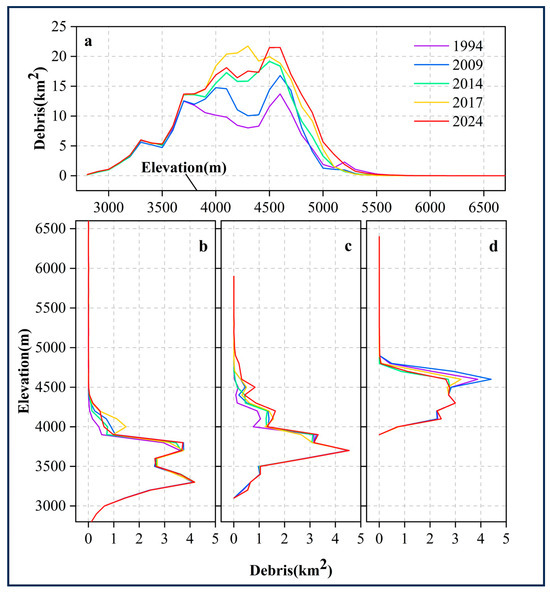
Figure 9.
Changes in debris cover area at different elevation gradients in the study area: (a) study area; (b) Kelayayilake glacier; (c) Qimugan glacier; (d) Kekesayi glacier.
5. Discussion
5.1. Factors Influencing Changes in Supraglacial Debris Cover
Over the past three decades, the gradual expansion of the supraglacial debris cover in eastern Pamir has been driven by a complex interplay of factors. The primary sources of supraglacial debris are shown in Figure 1. Rising temperatures play a key role in driving the expansion of the debris cover by intensifying freeze–thaw cycles on the supply slopes, accelerating both the generation and transport of debris [47,60]. In high-altitude regions, significant diurnal temperature fluctuations cause the repeated expansion and contraction of rocks. This phenomenon further accelerates the weathering and disintegration of rocks [19]. Concurrently, rising temperatures accelerate glacier melting, exposing previously buried englacial debris and increasing the supply of debris [61]. These related processes have driven the persistent expansion of debris cover in eastern Pamir.
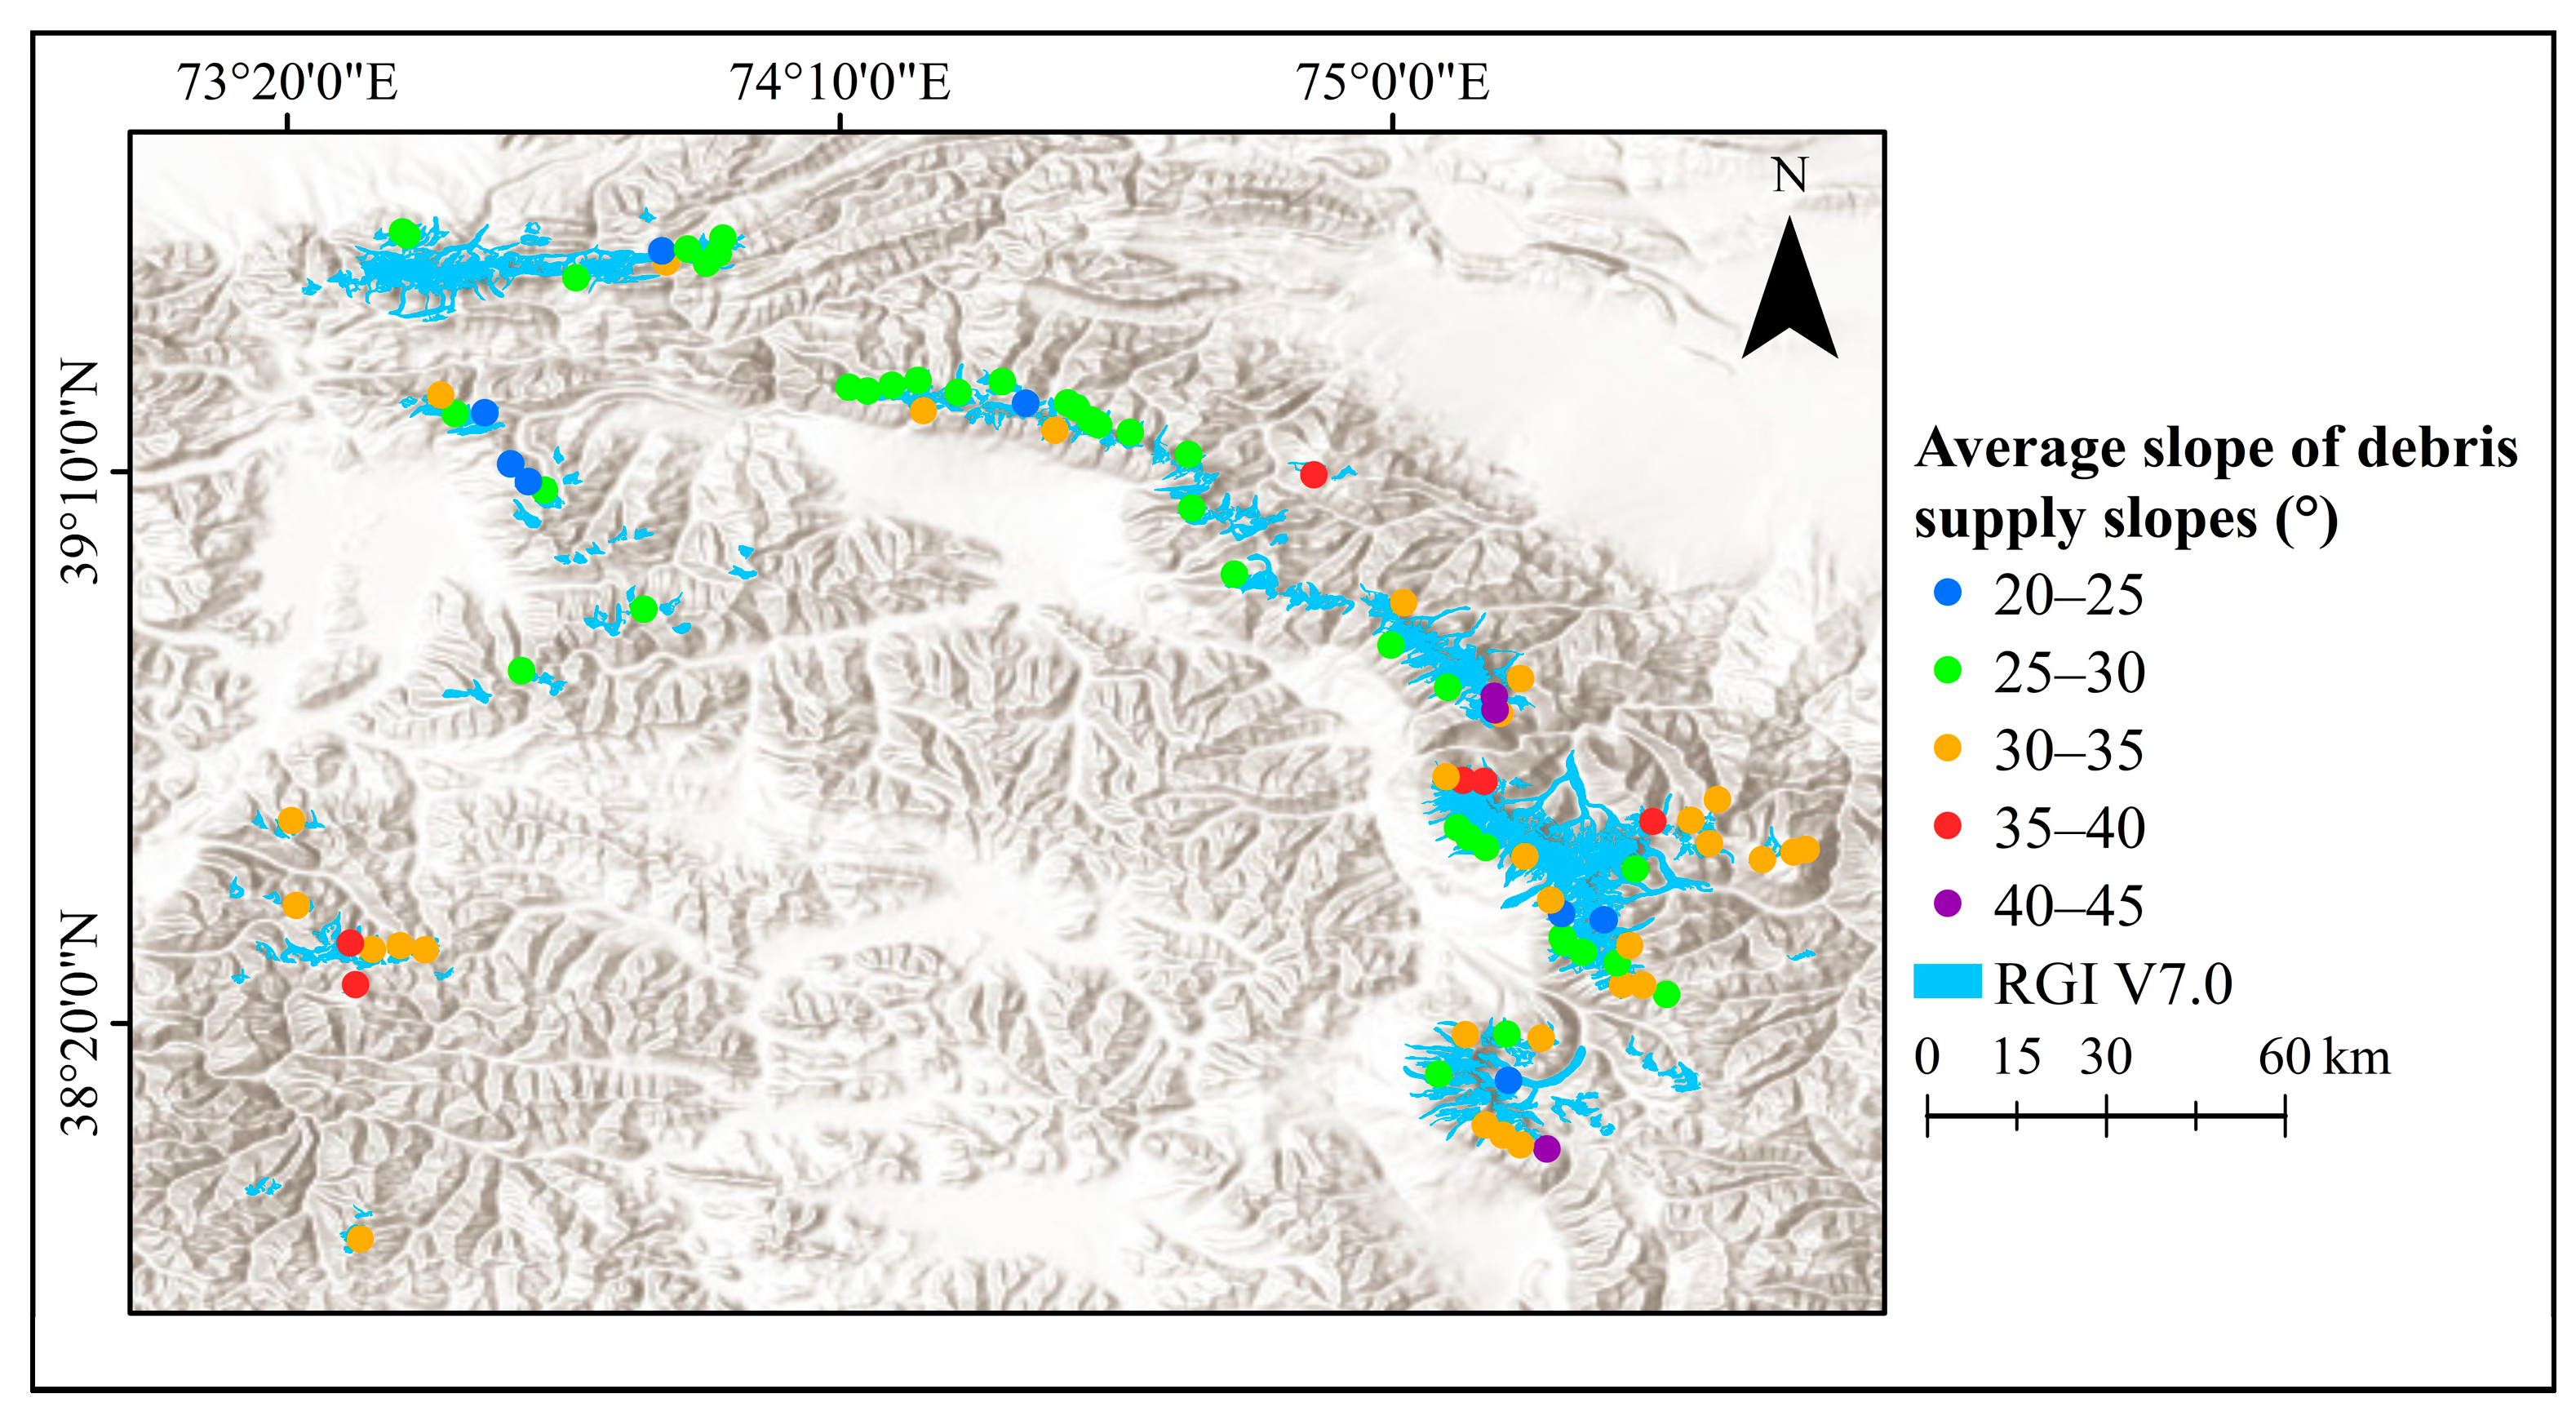
Scherler et al. [62] identified the average slope of debris supply slopes as a key factor when assessing the debris volume flux. They observed an exponential increase in the debris cover area with steeper slopes. It is worth noting that steeper supply slopes are associated with faster rates of debris cover expansion. Notably, supply slopes with gradients exceeding 25 are often associated with frequent avalanches [63], which play a crucial role in transporting loose rock debris to the glacier [64]. In eastern Pamir, we analyzed the data obtained from 85 glaciers with complete information on the debris supply slopes (the basic information of these 85 glaciers can be found in the Supplementary Information). The analysis conducted herein revealed that 77 of these glaciers (accounting for 90.59%) exhibited an average supply slope exceeding 25° (Figure 10). This result strongly suggests that glaciers in the study area have abundant sources of debris. In a permafrost environment, the debris supply to slopes is primarily governed by the intensity of frost weathering [65,66]. Global warming has caused permafrost degradation and slope decompression, likely increasing slope collapses. These processes transport more debris to the glacier system [62,67], thereby accelerating debris cover expansion and significantly influencing the morphology and dynamics of glaciers.
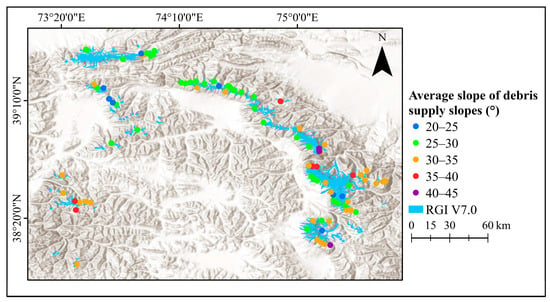
Figure 10.
Glacier distribution map in the study area, showing 85 glaciers with data on the average debris supply slope (each point represents a glacier, with point colors indicating different average slope values).
5.2. Uncertainty Analysis
5.2.1. Comparison with Previous Studies
The debris-covered area extracted in this study falls within a reasonable range and is consistent with the results found in similar studies. For instance, Lu et al. [68] identified a debris-covered area of 85.40 km2 for glaciers in eastern Pamir Kongur region in 2017. The extraction value for this study in 2017 was 88.33 km2, demonstrating a difference of 3.43% from the values reported in the abovementioned study. Similarly, Scherler et al. [20] reported a debris-covered area of 290.40 km2 in eastern Pamir for 2018. In comparison, this study’s extraction value in 2017 was 257.81 km2, which is a difference of 11.22%. Notably, Scherler et al. used a single threshold based on NDSI to extract the glacier debris cover. Further, Xie et al. [22] extracted debris-covered areas using a Random Forest (RF) model that incorporated multiple features. They observed that these extracted areas differed by 9.82–21.63% from those obtained using the NDSI threshold method. These results reveal the lower accuracy of the NDSI approach due to its inability to capture the full complexity of surface types and topographic variations. In contrast, this study incorporated multiple debris cover features, effectively capturing subtle variations and improving the accuracy of the extraction results.
5.2.2. Uncertainty from Glacier Terminus
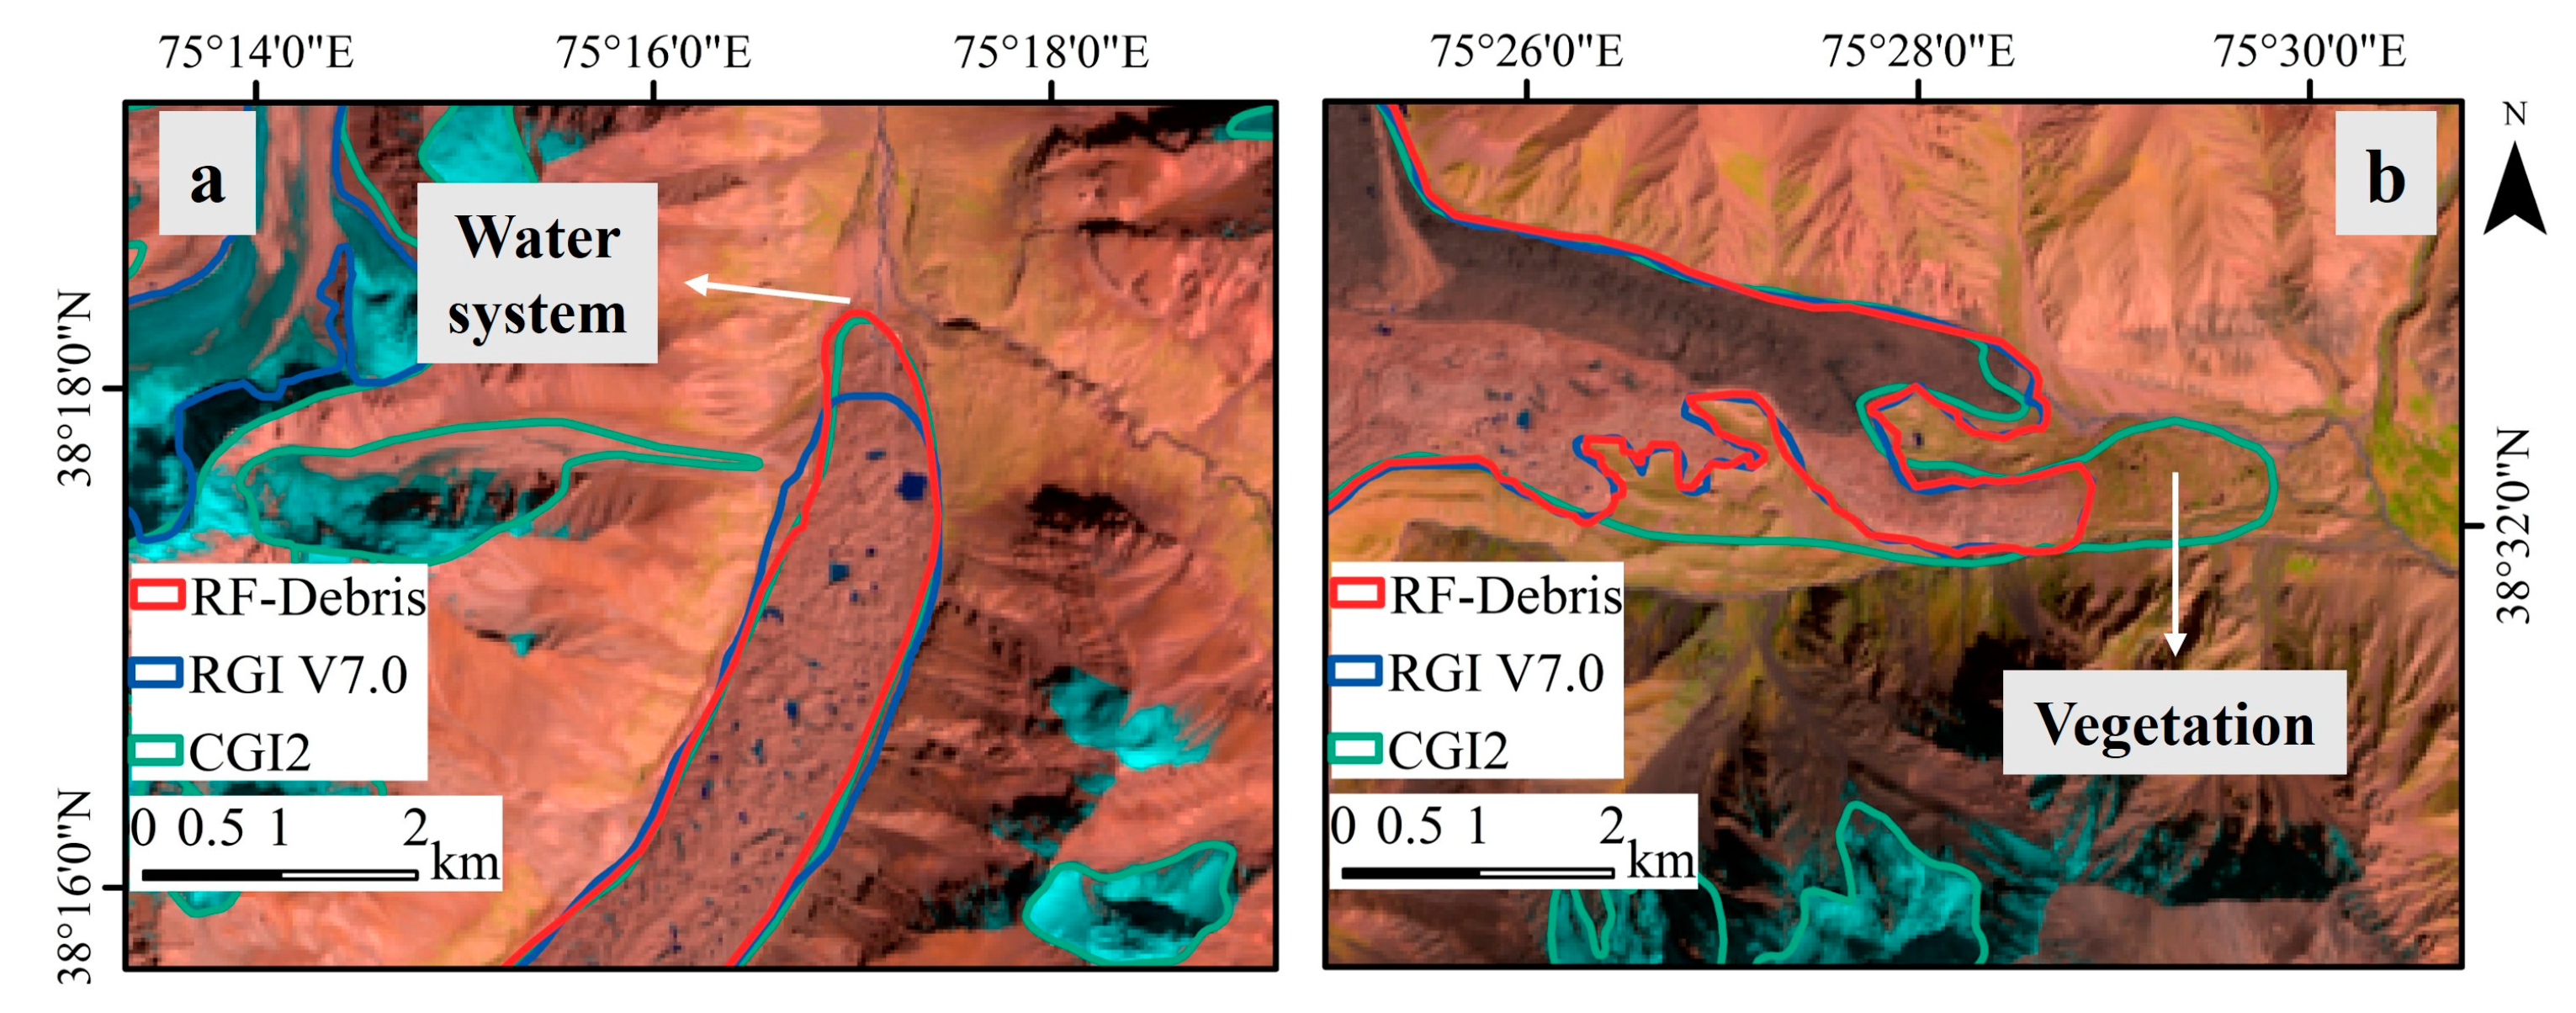
In the case of debris-covered glaciers, the accurate delineation of the glacier terminus boundary is often challenging due to the spectral similarities between the debris cover and the surrounding landscape [68]. In areas with debris cover, the glacier terminus typically exhibits a relatively stable topography. Moreover, the long-term erosive action of the glacial meltwater and subglacial outflows results in the exposure of distinct water systems at the terminus of the glacier [69]. These water system features therefore serve as important indicators for identifying the position of the glacier terminus.
The positions of the glacier terminus extracted in this study exhibited certain discrepancies in comparison to RGI V7.0 and CGI2 (Figure 11). Considering the Kekesayi glacier as an example (Figure 11a), it was observed that the extraction results of this study aligned closely with those of CGI2. Both showed the exposure of water systems at the glacier terminus (for example, the location with decimal latitude and longitude coordinates of [38.30504°, 75.28618°]). In contrast, the terminus location in RGI V7.0 deviated significantly from these water features. This indicates that the automated extraction method used in this study provides a terminus location that is more consistent with the actual conditions, similar to the results obtained using CGI2. Although slight differences were found between this study’s method and CGI2, they can be attributed to the fully automated approach employed here; CGI2 used a semi-automated method combined with manual revision. The differences were within an acceptable error range.
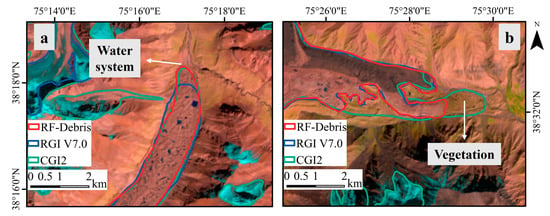
Figure 11.
Comparison of 2000 RF classification results (red line) with RGI V7.0 (blue line) and CGI2 (green line): (a) Kekesayi glacier; (b) Qimugan glacier.
At the terminus of the Qimugan glacier, the extraction results obtained from this study aligned more closely with RGI V7.0 and differed from CGI2 (Figure 11b). It was observed that certain regions identified as being debris-covered in CGI2 were covered by vegetation (for example, the location with decimal latitude and longitude coordinates of [38.53936°, 75.49003°]), making spectral differences difficult to discern. It was not clear whether ice layers existed in this area, and this study did not further research this issue. Future research should integrate multi-source remote sensing data and employ more advanced algorithms to enhance identification accuracy. Notably, this phenomenon was specific to the Qimugan glacier and was not observed in other glaciers.
It is important to note that uncertainties in glacier terminus delineation affect only single-period results and have minimal impact on the primary focus of this study—analyzing trends in supraglacial debris cover changes. This study primarily examines the transitions between bare ice and debris cover, where the pronounced spectral differences ensure a high level of identification accuracy. As a result, the likelihood of misclassification at the boundary between bare ice and debris cover is negligible. Moreover, to maintain objectivity, this study did not adjust the RGI V7.0 glacier boundary data and assumed that no significant terminus changes occurred during the study period. Given the minimal glacier area changes observed in eastern Pamir plateau, the impact of this assumption is considered negligible [10,41].
6. Conclusions
This study utilized Landsat series remote sensing images from the GEE platform and applied the Random Forest (RF) classification algorithm to map the distribution of the supraglacial debris cover. It further examined trends in the debris area changes in eastern Pamir from 1994 to 2024 by exploring the underlying causes of these changes from the perspective of mass conservation. The main conclusions are as follows.
By 2024, the total glacier area on eastern Pamir was 1395.32 ± 21.71 km2 and the supraglacial debris area was 258.08 ± 20.65 km2, comprising 18.5 ± 1.55% of the total glacier area. The Kungey Mountain area had the highest debris cover rate and variation. The total glacier area decreased by 2.57 ± 0.70%, while the debris-covered area exhibited a slow expansion trend (2.57 ± 0.70% yr⁻1). Between 1994 and 2024, the stable debris-covered area was 144.48 km2, while the changing area covered 138.03 km2, primarily at elevations between 4000 and 4500 m. The debris cover changes were concentrated in high-altitude, low-slope regions. The most significant changes occurred between 4000 and 4500 m, expanding toward the upper glacier areas. Supraglacial debris expansion was driven by several factors in the context of global warming. Rising temperatures have resulted in permafrost degradation, slope destabilization, and intensified weathering on supply slopes, thereby augmenting the debris supply. Additionally, the steep supply slope in the study area facilitates the rapid deposition of collapsed debris onto glacier surfaces, with frequent avalanche events accelerating the mobilization of rock fragments.
Supplementary Materials
The following supporting information can be downloaded at: https://www.mdpi.com/article/10.3390/rs17010144/s1.
Author Contributions
Conceptualization, Z.Z.; methodology, H.L., F.X. and Z.Z.; validation, J.D. and S.L.; formal analysis, H.L. and Z.Z.; investigation, H.L. and J.D.; resources, S.L. and F.X.; data curation, H.L., G.L. and H.S.; writing—original draft preparation, H.L.; writing—review and editing, Z.Z., S.L., F.X., J.D., G.L. and H.S.; supervision, S.L. and F.X.; funding acquisition, Z.Z. contributed to reviewing and ensuring the manuscript’s format alignment. All authors have read and agreed to the published version of the manuscript.
Funding
This research was funded by the National Natural Science Foundation of China (Grant No. 42071085), the Major Project on Natural Science Foundation of Universities in Anhui Province (Grant No. 2022AH040111) and the action project of training young and middle-aged teachers in Anhui Province (Grant No. DTR2024011).
Data Availability Statement
The raw data underlying the conclusions of this article will be made available by the authors upon request. Some of the geolocated data in the article can be accessed in the Supplementary Information provided with this article.
Acknowledgments
The authors extend their gratitude to the Google Earth Engine Science Team for providing access to their free cloud-computing platform, the USGS for supplying Landsat imagery and SRTM DEM data, and the National Snow and Ice Data Center (NSIDC) for access to their valuable resources.
Conflicts of Interest
The authors declare no conflicts of interest.
References
- Bolch, T. Asian glaciers are a reliable water source. Nature 2017, 545, 161–162. [Google Scholar] [CrossRef]
- Dehecq, A.; Gourmelen, N.; Gardner, A.S.; Brun, F.; Goldberg, D.; Nienow, P.W.; Berthier, E.; Vincent, C.; Wagnon, P.; Trouvé, E. Twenty-first century glacier slowdown driven by mass loss in High Mountain Asia. Nat. Geosci. 2019, 12, 22–27. [Google Scholar] [CrossRef]
- Hugonnet, R.; McNabb, R.; Berthier, E.; Menounos, B.; Nuth, C.; Girod, L.; Farinotti, D.; Huss, M.; Dussaillant, I.; Brun, F.; et al. Accelerated global glacier mass loss in the early twenty-first century. Nature 2021, 592, 726–731. [Google Scholar] [CrossRef]
- Pritchard, H.D. Asia’s shrinking glaciers protect large populations from drought stress. Nature 2019, 569, 649–654. [Google Scholar] [CrossRef] [PubMed]
- Immerzeel, W.W.; van Beek, L.P.H.; Bierkens, M.F.P. Climate Change Will Affect the Asian Water Towers. Science 2010, 328, 1382–1385. [Google Scholar] [CrossRef]
- Viviroli, D.; Archer, D.R.; Buytaert, W.; Fowler, H.J.; Greenwood, G.B.; Hamlet, A.F.; Huang, Y.; Koboltschnig, G.; Litaor, M.I.; López-Moreno, J.I.; et al. Climate change and mountain water resources: Overview and recommendations for research, management and policy. Hydrol. Earth Syst. Sci. 2011, 15, 471–504. [Google Scholar] [CrossRef]
- Zhang, Z.; Xu, J.L.; Liu, S.Y.; Guo, W.Q.; Wei, J.F.; Feng, T. Glacier changes since the early 1960s, eastern Pamir, China. J. Mt. Sci. 2016, 13, 276–291. [Google Scholar] [CrossRef]
- Zhang, Z.; Tao, P.J.; Liu, S.Y.; Zhang, S.S.; Huang, D.N.; Hu, K.H.; Lu, Y.J. What controls the surging of Karayaylak glacier in eastern Pamir? New insights from remote sensing data. J. Hydrol. 2022, 607, 12. [Google Scholar] [CrossRef]
- Ren, Z.; Su, F.G.; Xu, B.Q.; Xie, Y.; Kan, B.Y. A Coupled Glacier-Hydrology Model and Its Application in Eastern Pamir. J. Geophys. Res. Lett. Atmos. 2018, 123, 13692–13713. [Google Scholar] [CrossRef]
- Holzer, N.; Vijay, S.; Yao, T.; Xu, B.; Buchroithner, M.; Bolch, T. Four decades of glacier variations at Muztagh Ata (eastern Pamir): A multi-sensor study including Hexagon KH-9 and Pleiades data. Cryosphere 2015, 9, 2071–2088. [Google Scholar] [CrossRef]
- Lv, M.; Quincey, D.J.; Guo, H.; King, O.; Liu, G.; Yan, S.; Lu, X.; Ruan, Z. Examining geodetic glacier mass balance in the eastern Pamir transition zone. J. Glaciol. 2020, 66, 927–937. [Google Scholar] [CrossRef]
- Gardelle, J.; Berthier, E.; Arnaud, Y.; Kääb, A. Region-wide glacier mass balances over the Pamir-Karakoram-Himalaya during 1999–2011. Cryosphere 2013, 7, 1263–1286. [Google Scholar] [CrossRef]
- Kääb, A.; Treichler, D.; Nuth, C.; Berthier, E. Brief Communication: Contending estimates of 2003–2008 glacier mass balance over the Pamir-Karakoram-Himalaya. Cryosphere 2015, 9, 557–564. [Google Scholar] [CrossRef]
- Goerlich, F.; Bolch, T.; Paul, F. More dynamic than expected: An updated survey of surging glaciers in the Pamir. Earth Syst. Sci. Data 2020, 12, 3161–3176. [Google Scholar] [CrossRef]
- Kraaijenbrink, P.D.A.; Bierkens, M.F.P.; Lutz, A.F.; Immerzeel, W.W. Impact of a global temperature rise of 1.5 degrees Celsius on Asia’s glaciers. Nature 2017, 549, 257–260. [Google Scholar] [CrossRef]
- Jones, D.B.; Harrison, S.; Anderson, K.; Whalley, W.B. Rock glaciers and mountain hydrology: A review. Earth Sci. Rev. 2019, 193, 66–90. [Google Scholar] [CrossRef]
- Kirkbride, M.P.; Sherriff, S.C.; Rowan, A.V.; Egholm, D.L.; Quincey, D.J.; Miles, E.; Hubbard, B.; Miles, K. Provenance and transport of supraglacial debris revealed by variations in debris geochemistry on Khumbu Glacier, Nepal Himalaya. Earth Surf. Process. Landf. 2023, 48, 2737–2753. [Google Scholar] [CrossRef]
- van Woerkom, T.; Steiner, J.F.; Kraaijenbrink, P.D.A.; Miles, E.S.; Immerzeel, W.W. Sediment supply from lateral moraines to a debris-covered glacier in the Himalaya. Earth Surf. Dyn. 2019, 7, 411–427. [Google Scholar] [CrossRef]
- Scherler, D.; Egholm, D.L. Production and transport of supraglacial debris: Insights from cosmogenic 10Be and numerical modeling, Chhota Shigri Glacier, Indian Himalaya. J. Geophys. Res. Earth Surf. 2020, 125, 26. [Google Scholar] [CrossRef]
- Scherler, D.; Wulf, H.; Gorelick, N. Global Assessment of Supraglacial Debris-Cover Extents. Geophys. Res. Lett. 2018, 45, 11798–11805. [Google Scholar] [CrossRef]
- Jones, D.B.; Harrison, S.; Anderson, K. Mountain glacier-to-rock glacier transition. Glob. Planet. Change 2019, 181, 102999. [Google Scholar] [CrossRef]
- Xie, F.M.; Liu, S.Y.; Wu, K.P.; Zhu, Y.; Gao, Y.P.; Qi, M.M.; Duan, S.M.; Saifullah, M.; Tahir, A.A. Upward Expansion of Supra-Glacial Debris Cover in the Hunza Valley, Karakoram, During 1990~2019. Front. Earth Sci. 2020, 8, 308. [Google Scholar] [CrossRef]
- Kneib, M.; Fyffe, C.L.; Miles, E.S.; Lindemann, S.; Shaw, T.E.; Buri, P.; McCarthy, M.; Ouvry, B.; Vieli, A.; Sato, Y.; et al. Controls on Ice Cliff Distribution and Characteristics on Debris-Covered Glaciers. Geophys. Res. Lett. 2023, 50, e2022GL102444. [Google Scholar] [CrossRef]
- Buri, P.; Miles, E.S.; Steiner, J.F.; Ragettli, S.; Pellicciotti, F. Supraglacial Ice Cliffs Can Substantially Increase the Mass Loss of Debris-Covered Glaciers. Geophys. Res. Lett. 2021, 48, e2020GL092150. [Google Scholar] [CrossRef]
- Huang, L.; Li, Z.; Han, H.; Tian, B.; Zhou, J. Analysis of thickness changes and the associated driving factors on a debris-covered glacier in the Tienshan Mountain. Remote Sens. Environ. 2018, 206, 63–71. [Google Scholar] [CrossRef]
- Zhang, Y.; Fujita, K.; Liu, S.Y.; Liu, Q.; Nuimura, T. Distribution of debris thickness and its effect on ice melt at Hailuogou glacier, southeastern Tibetan Plateau, using in situ surveys and ASTER imagery. J. Glaciol. 2011, 57, 1147–1157. [Google Scholar] [CrossRef]
- Benn, D.I.; Bolch, T.; Hands, K.; Gulley, J.; Luckman, A.; Nicholson, L.I.; Quincey, D.; Thompson, S.; Toumi, R.; Wiseman, S. Response of debris-covered glaciers in the Mount Everest region to recent warming, and implications for outburst flood hazards. Earth Sci. Rev. 2012, 114, 156–174. [Google Scholar] [CrossRef]
- Juen, M.; Mayer, C.; Lambrecht, A.; Han, H.; Liu, S. Impact of varying debris cover thickness on ablation: A case study for Koxkar Glacier in the Tien Shan. Cryosphere 2014, 8, 377–386. [Google Scholar] [CrossRef]
- Huo, D.; Bishop, M.P.; Bush, A.B.G. Understanding Complex Debris-Covered Glaciers: Concepts, Issues, and Research Directions. Front. Earth Sci. 2021, 9, 652279. [Google Scholar] [CrossRef]
- Pope, A.; Rees, W.G. Impact of spatial, spectral, and radiometric properties of multispectral imagers on glacier surface classification. Remote Sens. Environ. 2014, 141, 1–13. [Google Scholar] [CrossRef]
- Bishop, M.P.; Shroder, J.F.; Ward, J.L. SPOT multispectral analysis for producing supraglacial debris-load estimates for Batura glacier, Pakistan. Geocarto Int. 1995, 10, 81–90. [Google Scholar] [CrossRef]
- Bishop, M.P.; Shroder Jr, J.F.; Hickman, B.L. SPOT Panchromatic Imagery and Neural Networks for Information Extraction in a Complex Mountain Environment. Geocarto Int. 1999, 14, 19–28. [Google Scholar] [CrossRef]
- Racoviteanu, A.; Williams, M.W. Decision Tree and Texture Analysis for Mapping Debris-Covered Glaciers in the Kangchenjunga Area, Eastern Himalaya. Remote Sens. 2012, 4, 3078–3109. [Google Scholar] [CrossRef]
- Bolch, T.; Buchroithner, M.F.; Kunert, A.; Kamp, U. Automated delineation of debris-covered glaciers based on ASTER data. In GeoInformation in Europe; Gomarasca, M.A., Ed.; Millpress: Rotterdam, The Netherlands, 2007; pp. 403–410. [Google Scholar]
- Bhambri, R.; Bolch, T.; Chaujar, R.K. Mapping of Debris-covered glaciers in the Garhwal Himalayas using ASTER DEMs and thermal data. Int. J. Remote Sens. 2011, 32, 8095–8119. [Google Scholar] [CrossRef]
- Bhardwaj, A.; Joshi, P.K.; Snehmani; Singh, M.K.; Sam, L.; Gupta, R.D. Mapping debris-covered glaciers and identifying factors affecting the accuracy. Cold Reg. Sci. Technol. 2014, 106–107, 161–174. [Google Scholar] [CrossRef]
- Yang, X.; Xie, F.M.; Liu, S.Y.; Zhu, Y.; Fan, J.H.; Zhao, H.L.; Fu, Y.Y.; Duan, Y.P.; Fu, R.; Guo, S.Y. Mapping Debris-Covered Glaciers Using High-Resolution Imagery (GF-2) and Deep Learning Algorithms. Remote Sens. 2024, 16, 2062. [Google Scholar] [CrossRef]
- Kaushik, S.; Singh, T.; Bhardwaj, A.; Joshi, P.K.; Dietz, A.J. Automated Delineation of Supraglacial Debris Cover Using Deep Learning and Multisource Remote Sensing Data. Remote Sens. 2022, 14, 1352. [Google Scholar] [CrossRef]
- Lu, Y.J.; Zhang, Z.; Shangguan, D.H.; Yang, J.H. Novel Machine Learning Method Integrating Ensemble Learning and Deep Learning for Mapping Debris-Covered Glaciers. Remote Sens. 2021, 13, 2595. [Google Scholar] [CrossRef]
- Xie, F.; Liu, S.; Gao, Y.; Zhu, Y.; Wu, K.; Qi, M.; Duan, S.; Tahir, A. Derivation of supraglacial debris cover by machine learning algorithms on the GEE platform: A case study of glaciers in the Hunza Valley. Int. Arch. Photogramm. Remote Sens. Spatial Inf. Sci. 2020, V-3-2020, 417–424. [Google Scholar] [CrossRef]
- Li, Z.J.; Wang, N.L.; Chen, A.N.; Liang, Q.; Yang, D.Q. Slight change of glaciers in the Pamir over the period 2000–2017. Arct. Antarct. Alp. Res. 2022, 54, 13–24. [Google Scholar] [CrossRef]
- Huang, D.N.; Zhang, Z.; Jiang, L.; Zhang, R.; Lu, Y.J.; Shahtahmassebi, A.; Huang, X.L. Variability of Glacier Velocity and the Influencing Factors in the Muztag-Kongur Mountains, Eastern Pamir Plateau. Remote Sens. 2023, 15, 620. [Google Scholar] [CrossRef]
- Wilkerson, F.D.; Schmid, G.L. Distribution of debris flows in Glacier National Park, Montana, USA. J. Mt. Sci. 2008, 5, 318–326. [Google Scholar] [CrossRef]
- Nagai, H.; Fujita, K.; Nuimura, T.; Sakai, A. Southwest-facing slopes control the formation of debris-covered glaciers in the Bhutan Himalaya. Cryosphere 2013, 7, 1303–1314. [Google Scholar] [CrossRef]
- Anderson, L.S.; Anderson, R.S. Modeling debris-covered glaciers: Response to steady debris deposition. Cryosphere 2016, 10, 1105–1124. [Google Scholar] [CrossRef]
- Kirkbride, M.P.; Deline, P. The formation of supraglacial debris covers by primary dispersal from transverse englacial debris bands. Earth Surf. Process. Landf. 2013, 38, 1779–1792. [Google Scholar] [CrossRef]
- McCarthy, M.; Miles, E.; Kneib, M.; Buri, P.; Fugger, S.; Pellicciotti, F. Supraglacial debris thickness and supply rate in High-Mountain Asia. Commun. Earth Environ. 2022, 3, 269. [Google Scholar] [CrossRef]
- Ouyang, Z.D.; Zhou, C.; Xie, J.; Zhu, J.J.; Zhang, G.; Ao, M.S. SRTM DEM Correction Using Ensemble Machine Learning Algorithm. Remote Sens. 2023, 15, 3946. [Google Scholar] [CrossRef]
- Liu, S.; Yao, X.; Guo, W.; Xu, J.; Shangguan, D.; Wei, J.; Bao, W.; Wu, L. The contemporary glaciers in China based on the Second Chinese Glacier Inventory. Acta Geographica Sinica 2015, 70, 3–16. [Google Scholar] [CrossRef]
- Guo, W.Q.; Liu, S.Y.; Xu, L.; Wu, L.Z.; Shangguan, D.H.; Yao, X.J.; Wei, J.F.; Bao, W.J.; Yu, P.C.; Liu, Q.; et al. The second Chinese glacier inventory: Data, methods and results. J. Glaciol. 2015, 61, 357–372. [Google Scholar] [CrossRef]
- Hu, M.; Zhou, G.; Lv, X.; Zhou, L.; He, X.; Tian, Z. A New Automatic Extraction Method for Glaciers on the Tibetan Plateau under Clouds, Shadows and Snow Cover. Remote Sens. 2022, 14, 3084. [Google Scholar] [CrossRef]
- Liao, H.; Liu, Q.; Zhong, Y.; Lu, X. Supraglacial debris-cover change and its spatial heterogeneity in the Mount Gongga, 1990–2019. Acta Geographica Sinica 2021, 76, 2647–2659. [Google Scholar] [CrossRef]
- Zhang, J.; Jia, L.; Menenti, M.; Zhou, J.; Ren, S. Glacier Area and Snow Cover Changes in the Range System Surrounding Tarim from 2000 to 2020 Using Google Earth Engine. Remote Sens. 2021, 13, 5117. [Google Scholar] [CrossRef]
- Alifu, H.; Vuillaume, J.F.; Johnson, B.A.; Hirabayashi, Y. Machine-learning classification of debris-covered glaciers using a combination of Sentinel-1/-2 (SAR/optical), Landsat 8 (thermal) and digital elevation data. Geomorphology 2020, 369, 107365. [Google Scholar] [CrossRef]
- Breiman, L. Random Forests. Mach. Learn. 2001, 45, 5–32. [Google Scholar] [CrossRef]
- Hu, M.C.; Zhou, G.S.; Lv, X.M.; Zhou, L.; Wang, X.L.; He, X.H.; Tian, Z.H. Warming Has Accelerated the Melting of Glaciers on the Tibetan Plateau, but the Debris-Covered Glaciers Are Rapidly Expanding. Remote Sens. 2023, 15, 132. [Google Scholar] [CrossRef]
- Gislason, P.O.; Benediktsson, J.A.; Sveinsson, J.R. Random Forests for land cover classification. Pattern Recogn. Lett. 2006, 27, 294–300. [Google Scholar] [CrossRef]
- Lu, Y.J.; Zhang, Z.; Kong, Y.R.; Hu, K.H. Integration of optical, SAR and DEM data for automated detection of debris-covered glaciers over the western Nyainqentanglha using a random forest classifier. Cold Reg. Sci. Technol. 2022, 193, 103421. [Google Scholar] [CrossRef]
- Varatharajan, R.; Vasanth, K.; Gunasekaran, M.; Priyan, M.; Gao, X.Z. An adaptive decision based kriging interpolation algorithm for the removal of high density salt and pepper noise in images. Comput. Electr. Eng. 2018, 70, 447–461. [Google Scholar] [CrossRef]
- Cui, T.; Li, Y.K.; Yang, L.; Nan, Y.; Li, K.B.; Tudaji, M.; Hu, H.C.; Long, D.; Shahid, M.; Mubeen, A.; et al. Non-monotonic changes in Asian Water Towers’ streamflow at increasing warming levels. Nat. Commun. 2023, 14, 1176. [Google Scholar] [CrossRef]
- Anderson, L.S.; Anderson, R.S. Debris thickness patterns on debris-covered glaciers. Geomorphology 2018, 311, 1–12. [Google Scholar] [CrossRef]
- Scherler, D.; Bookhagen, B.; Strecker, M.R. Hillslope-glacier coupling: The interplay of topography and glacial dynamics in High Asia. J. Geophys. Res. Earth Surf. 2011, 116, 21. [Google Scholar] [CrossRef]
- Bernhardt, M.; Liston, G.E.; Strasser, U.; Zängl, G.; Schulz, K. High resolution modelling of snow transport in complex terrain using downscaled MM5 wind fields. Cryosphere 2010, 4, 99–113. [Google Scholar] [CrossRef]
- Humlum, O.; Christiansen, H.H.; Juliussen, H. Avalanche-derived rock glaciers in Svalbard. Permafrost Periglac. 2007, 18, 75–88. [Google Scholar] [CrossRef]
- Daanen, R.P.; Grosse, G.; Darrow, M.M.; Hamilton, T.D.; Jones, B.M. Rapid movement of frozen debris-lobes: Implications for permafrost degradation and slope instability in the south-central Brooks Range, Alaska. Nat. Hazards Earth Syst. Sci. 2012, 12, 1521–1537. [Google Scholar] [CrossRef]
- Busby, J.P.; Lee, J.R.; Kender, S.; Williamson, P.; Norris, S. Regional modelling of permafrost thicknesses over the past 130 ka: Implications for permafrost development in Great Britain. Boreas 2016, 45, 46–60. [Google Scholar] [CrossRef][Green Version]
- Watanabe, T.; Dali, L.; Shiraiwa, T. Slope denudation and the supply of debris to cones in Langtang Himal, Central Nepal Himalaya. Geomorphology 1998, 26, 185–197. [Google Scholar] [CrossRef]
- Lu, Y.J.; Zhang, Z.; Huang, D.N. Glacier Mapping Based on Random Forest Algorithm: A Case Study over the Eastern Pamir. Water 2020, 12, 3231. [Google Scholar] [CrossRef]
- Miles, K.E.; Hubbard, B.; Irvine-Fynn, T.D.L.; Miles, E.S.; Quincey, D.J.; Rowan, A.V. Hydrology of debris-covered glaciers in High Mountain Asia. Earth Sci. Rev. 2020, 207, 103212. [Google Scholar] [CrossRef]
Disclaimer/Publisher’s Note: The statements, opinions and data contained in all publications are solely those of the individual author(s) and contributor(s) and not of MDPI and/or the editor(s). MDPI and/or the editor(s) disclaim responsibility for any injury to people or property resulting from any ideas, methods, instructions or products referred to in the content. |
© 2025 by the authors. Licensee MDPI, Basel, Switzerland. This article is an open access article distributed under the terms and conditions of the Creative Commons Attribution (CC BY) license (https://creativecommons.org/licenses/by/4.0/).

