
DamageScope: An Integrated Pipeline for Building Damage Segmentation, Geospatial Mapping, and Interactive Web-Based Visualization


Abstract
1. Introduction
2. Background and Literature Review
2.1. Overview of Remote Sensing and Satellite Technology
2.2. Identification of Damaged Structures from Satellite Images
2.2.1. Early Feature-Based Approaches
2.2.2. Advancement of Convolutional Neural Networks (CNNs)
2.2.3. Transformer and Hybrid Architectures
3. Methodology
3.1. Deep Learning for Building Damage Assessment
3.2. Geolocation Information Derivation
3.3. Web-Based Visualization
3.3.1. Web Server
3.3.2. Model Deployment and Visualization
4. Experiment and Results
4.1. Dataset Preparation
4.2. Implementation Details
4.3. Metrics
4.4. Results
4.5. Case Study: Hurricane Ian
5. Discussion
5.1. Class-Wise Performance and Confusion Matrix Analysis
5.2. Performance Comparison
5.3. Limitations and Future Research Directions
6. Conclusions
Author Contributions
Funding
Data Availability Statement
Acknowledgments
Conflicts of Interest
References
- National Weather Service. 2024 Tornado Activity Reached Near-Historic Levels Across the U.S. Available online: https://www.weather.gov/news/250703_tornado_activity (accessed on 14 June 2025).
- Center for Disaster Philanthropy. 2023 US Tornadoes. Available online: https://disasterphilanthropy.org/disasters/2023-us-tornadoes/ (accessed on 14 June 2025).
- NCEI; NOAA. U.S. Billion-Dollar Weather & Climate Disasters: Time-Series Dataset (1980–2024). Available online: https://www.ncei.noaa.gov/access/billions/ (accessed on 8 May 2025).
- Coppola, D.P. Introduction to International Disaster Management, 3rd ed.; Elsevier/Butterworth-Hein: Amsterdam, The Netherlands, 2015; ISBN 978-0-12-801477-6. [Google Scholar]
- Bloch, T.; Sacks, R.; Rabinovitch, O. Interior Models of Earthquake Damaged Buildings for Search and Rescue. Adv. Eng. Inform. 2016, 30, 65–76. [Google Scholar] [CrossRef]
- Manfré, L.A.; Hirata, E.; Silva, J.B.; Shinohara, E.J.; Giannotti, M.A.; Larocca, A.P.C.; Quintanilha, J.A. An Analysis of Geospatial Technologies for Risk and Natural Disaster Management. ISPRS Int. J. Geo-Inf. 2012, 1, 166–185. [Google Scholar] [CrossRef]
- Li, X.; Wang, B.; Li, X.; Huang, J.; Lyu, H.; Han, X. Principle and Performance of Multi-Frequency and Multi-GNSS PPP-RTK. Satell. Navig. 2022, 3, 7. [Google Scholar] [CrossRef]
- Wartman, J.; Berman, J.W.; Bostrom, A.; Miles, S.; Olsen, M.; Gurley, K.; Irish, J.; Lowes, L.; Tanner, T.; Dafni, J.; et al. Research Needs, Challenges, and Strategic Approaches for Natural Hazards and Disaster Reconnaissance. Front. Built Environ. 2020, 6, 573068. [Google Scholar] [CrossRef]
- Hu, D.; Li, S.; Du, J.; Cai, J. Automating Building Damage Reconnaissance to Optimize Drone Mission Planning for Disaster Response. J. Comput. Civ. Eng. 2023, 37, 04023006. [Google Scholar] [CrossRef]
- Al Shafian, S.; Hu, D. Integrating Machine Learning and Remote Sensing in Disaster Management: A Decadal Review of Post-Disaster Building Damage Assessment. Buildings 2024, 14, 2344. [Google Scholar] [CrossRef]
- Hu, D.; Yee, T.; Goff, D. Automated Crack Detection and Mapping of Bridge Decks Using Deep Learning and Drones. J. Civ. Struct. Health Monit. 2024, 14, 729–743. [Google Scholar] [CrossRef]
- Hu, D. Deep Learning–Based Framework for Bridge Deck Condition Assessment Using Ground Penetrating Radar. J. Struct. Des. Constr. Pract. 2025, 30, 4025041. [Google Scholar] [CrossRef]
- Mårtensson, U. Introduction to Remote Sensing and Geographical Information Systems; Department of Physical Geography and Ecosystems Sciences, Lund University: Lund, Sweden, 2011. [Google Scholar]
- Madry, S. Introduction and History of Space Remote Sensing. In Handbook of Satellite Applications; Pelton, J.N., Madry, S., Camacho-Lara, S., Eds.; Springer New York: New York, NY, USA, 2013; pp. 657–666. ISBN 978-1-4419-7670-3. [Google Scholar]
- Lu, B.; Dao, P.; Liu, J.; He, Y.; Shang, J. Recent Advances of Hyperspectral Imaging Technology and Applications in Agriculture. Remote Sens. 2020, 12, 2659. [Google Scholar] [CrossRef]
- Prudente, V.H.R.; Martins, V.S.; Vieira, D.C.; Silva, N.R.D.F.E.; Adami, M.; Sanches, I.D. Limitations of Cloud Cover for Optical Remote Sensing of Agricultural Areas across South America. Remote Sens. Appl. Soc. Environ. 2020, 20, 100414. [Google Scholar] [CrossRef]
- Karim, S.; Zhang, Y.; Yin, S.; Bibi, I.; Brohi, A.A. A Brief Review and Challenges of Object Detection in Optical Remote Sensing Imagery. MGS 2020, 16, 227–243. [Google Scholar] [CrossRef]
- Yang, L.; Lin, L.; Fan, L.; Liu, N.; Huang, L.; Xu, Y.; Mertikas, S.P.; Jia, Y.; Lin, M. Satellite Altimetry: Achievements and Future Trends by a Scientometrics Analysis. Remote Sens. 2022, 14, 3332. [Google Scholar] [CrossRef]
- Frappart, F.; Ramillien, G. Monitoring Groundwater Storage Changes Using the Gravity Recovery and Climate Experiment (GRACE) Satellite Mission: A Review. Remote Sens. 2018, 10, 829. [Google Scholar] [CrossRef]
- Al Shafian, S.; Hu, D. Integrating Drone Imaging and Deep Learning with Augmented Reality for Disaster Damage Assessment and Response. In Proceedings of the ASCE International Conference on Computing in Civil Engineering (i3CE 2025), New Orleans, LA, USA, 11 May 2025. [Google Scholar]
- Cooner, A.; Shao, Y.; Campbell, J. Detection of Urban Damage Using Remote Sensing and Machine Learning Algorithms: Revisiting the 2010 Haiti Earthquake. Remote Sens. 2016, 8, 868. [Google Scholar] [CrossRef]
- Mehmood, M.; Shahzad, A.; Zafar, B.; Shabbir, A.; Ali, N. Remote Sensing Image Classification: A Comprehensive Review and Applications. Math. Probl. Eng. 2022, 2022, 5880959. [Google Scholar] [CrossRef]
- Blaschke, T. Object Based Image Analysis for Remote Sensing. ISPRS J. Photogramm. Remote Sens. 2010, 65, 2–16. [Google Scholar] [CrossRef]
- Omarzadeh, D.; Karimzadeh, S.; Matsuoka, M.; Feizizadeh, B. Earthquake Aftermath from Very High-Resolution WorldView-2 Image and Semi-Automated Object-Based Image Analysis (Case Study: Kermanshah, Sarpol-e Zahab, Iran). Remote Sens. 2021, 13, 4272. [Google Scholar] [CrossRef]
- Zhu, X.X.; Tuia, D.; Mou, L.; Xia, G.-S.; Zhang, L.; Xu, F.; Fraundorfer, F. Deep Learning in Remote Sensing: A Comprehensive Review and List of Resources. IEEE Geosci. Remote Sens. Mag. 2017, 5, 8–36. [Google Scholar] [CrossRef]
- Bhangale, U.; Durbha, S.; Potnis, A.; Shinde, R. Rapid Earthquake Damage Detection Using Deep Learning from VHR Remote Sensing Images. In Proceedings of the IGARSS 2019—2019 IEEE International Geoscience and Remote Sensing Symposium, Yokohama, Japan, 28 July–2 August 2019; pp. 2654–2657. [Google Scholar]
- Ma, H.; Liu, Y.; Ren, Y.; Yu, J. Detection of Collapsed Buildings in Post-Earthquake Remote Sensing Images Based on the Improved YOLOv3. Remote Sens. 2019, 12, 44. [Google Scholar] [CrossRef]
- Ji, M.; Liu, L.; Buchroithner, M. Identifying Collapsed Buildings Using Post-Earthquake Satellite Imagery and Convolutional Neural Networks: A Case Study of the 2010 Haiti Earthquake. Remote Sens. 2018, 10, 1689. [Google Scholar] [CrossRef]
- Miura, H.; Aridome, T.; Matsuoka, M. Deep Learning-Based Identification of Collapsed, Non-Collapsed and Blue Tarp-Covered Buildings from Post-Disaster Aerial Images. Remote Sens. 2020, 12, 1924. [Google Scholar] [CrossRef]
- Ji, M.; Liu, L.; Du, R.; Buchroithner, M.F. A Comparative Study of Texture and Convolutional Neural Network Features for Detecting Collapsed Buildings After Earthquakes Using Pre- and Post-Event Satellite Imagery. Remote Sens. 2019, 11, 1202. [Google Scholar] [CrossRef]
- Zheng, Z.; Zhong, Y.; Wang, J.; Ma, A.; Zhang, L. Building Damage Assessment for Rapid Disaster Response with a Deep Object-Based Semantic Change Detection Framework: From Natural Disasters to Man-Made Disasters. Remote Sens. Environ. 2021, 265, 112636. [Google Scholar] [CrossRef]
- Deng, L.; Wang, Y. Post-Disaster Building Damage Assessment Based on Improved U-Net. Sci. Rep. 2022, 12, 15862. [Google Scholar] [CrossRef]
- Wu, C.; Zhang, F.; Xia, J.; Xu, Y.; Li, G.; Xie, J.; Du, Z.; Liu, R. Building Damage Detection Using U-Net with Attention Mechanism from Pre- and Post-Disaster Remote Sensing Datasets. Remote Sens. 2021, 13, 905. [Google Scholar] [CrossRef]
- Deng, L.; Wang, Y.; Lan, Q.; Chen, F. Remote Sensing Image Building Change Detection Based on Efficient-UNet++. J. Appl. Rem. Sens. 2023, 17, 034501. [Google Scholar] [CrossRef]
- Ahmadi, S.A.; Mohammadzadeh, A.; Yokoya, N.; Ghorbanian, A. BD-SKUNet: Selective-Kernel UNets for Building Damage Assessment in High-Resolution Satellite Images. Remote Sens. 2023, 16, 182. [Google Scholar] [CrossRef]
- Qi, W.; Wei, M.; Yang, W.; Xu, C.; Ma, C. Automatic Mapping of Landslides by the ResU-Net. Remote Sens. 2020, 12, 2487. [Google Scholar] [CrossRef]
- Da, Y.; Ji, Z.; Zhou, Y. Building Damage Assessment Based on Siamese Hierarchical Transformer Framework. Mathematics 2022, 10, 1898. [Google Scholar] [CrossRef]
- Kaur, N.; Lee, C.; Mostafavi, A.; Mahdavi-Amiri, A. Large-scale Building Damage Assessment Using a Novel Hierarchical Transformer Architecture on Satellite Images. Comput. Aided Civ. Infrastruct. Eng. 2023, 38, 2072–2091. [Google Scholar] [CrossRef]
- Chen, F.; Sun, Y.; Wang, L.; Wang, N.; Zhao, H.; Yu, B. HRTBDA: A Network for Post-Disaster Building Damage Assessment Based on Remote Sensing Images. Int. J. Digit. Earth 2024, 17, 2418880. [Google Scholar] [CrossRef]
- Caye Daudt, R.; Le Saux, B.; Boulch, A. Fully Convolutional Siamese Networks for Change Detection. In Proceedings of the 2018 25th IEEE International Conference on Image Processing (ICIP), Athens, Greece, 7–10 October 2018; pp. 4063–4067. [Google Scholar]
- Alisjahbana, I.; Li, J.; Strong, B.; Zhang, Y. DeepDamageNet: A Two-Step Deep-Learning Model for Multi-Disaster Building Damage Segmentation and Classification Using Satellite Imagery. arXiv 2024, arXiv:2405.04800. [Google Scholar] [CrossRef]
- Gupta, R.; Hosfelt, R.; Sajeev, S.; Patel, N.; Goodman, B.; Doshi, J.; Heim, E.; Choset, H.; Gaston, M. xBD: A Dataset for Assessing Building Damage from Satellite Imagery. arXiv 2019, arXiv:1911.09296. [Google Scholar] [CrossRef]
- Vasu, P.K.A.; Gabriel, J.; Zhu, J.; Tuzel, O.; Ranjan, A. FastViT: A Fast Hybrid Vision Transformer Using Structural Reparameterization. arXiv 2023, arXiv:2303.14189. [Google Scholar] [CrossRef]
- Kim, H.; Kang, I.; Baek, D.; Jung, H.; Morales, C. Lightweight Semantic Segmentation Model for Disaster Area Based on TransUNet. In Proceedings of the 2024 15th International Conference on Information and Communication Technology Convergence (ICTC), Jeju Island, Republic of Korea, 16–18 October 2024; pp. 289–294. [Google Scholar]
- Ronneberger, O.; Fischer, P.; Brox, T. U-Net: Convolutional Networks for Biomedical Image Segmentation. In Medical Image Computing and Computer-Assisted Intervention—MICCAI 2015; Navab, N., Hornegger, J., Wells, W.M., Frangi, A.F., Eds.; Lecture Notes in Computer Science; Springer International Publishing: Cham, Switzerland, 2015; Volume 9351, pp. 234–241. ISBN 978-3-319-24573-7. [Google Scholar]
- ESRI Understanding World Files. Available online: https://webhelp.esri.com/arcims/9.3/General/topics/author_world_files.htm (accessed on 28 May 2025).
- Chen, H.; Song, J.; Dietrich, O.; Broni-Bediako, C.; Xuan, W.; Wang, J.; Shao, X.; Wei, Y.; Xia, J.; Lan, C.; et al. BRIGHT: A Globally Distributed Multimodal Building Damage Assessment Dataset with Very-High-Resolution for All-Weather Disaster Response. arXiv 2025, arXiv:2501.06019. [Google Scholar] [CrossRef]
- Seydi, S.; Rastiveis, H.; Kalantar, B.; Halin, A.; Ueda, N. BDD-Net: An End-to-End Multiscale Residual CNN for Earthquake-Induced Building Damage Detection. Remote Sens. 2022, 14, 2214. [Google Scholar] [CrossRef]
- Neto, A.; Dantas, D. Building Damage Segmentation After Natural Disasters in Satellite Imagery with Mathematical Morphology and Convolutional Neural Networks. In Proceedings of the 26th International Conference on Enterprise Information Systems, Angers, France, 28–30 April 2024; pp. 828–836. [Google Scholar]
- National Oceanic and Atmospheric Administration; National Weather Service National Hurricane Center Tropical Cyclone Report-Hurricane Ian (Al092022). Available online: https://www.nhc.noaa.gov/data/tcr/AL092022_Ian.pdf (accessed on 14 June 2025).
- Zach Rosenthal Where Will Hurricane Ian Hit Hardest? Here’s the Outlook for 9 Cities. Available online: https://www.washingtonpost.com/climate-environment/2022/09/27/hurricane-ian-forecast-florida-southeast-cities/ (accessed on 17 April 2025).
- Powell, E. Hurricane Ian: A Major Hurricane That Brought Wide-Ranging Catastrophic Impacts to Florida; Florida Climate Center, Center for Ocean-Atmospheric Prediction Studies (COAPS), Florida State University: Tallahassee, FL, USA, 2022. [Google Scholar]
- He, K.; Zhang, X.; Ren, S.; Sun, J. Deep Residual Learning for Image Recognition. In Proceedings of the 2016 IEEE Conference on Computer Vision and Pattern Recognition (CVPR), Las Vegas, NV, USA, 27–30 June 2016; pp. 770–778. [Google Scholar]
- Chen, L.-C.; Zhu, Y.; Papandreou, G.; Schroff, F.; Adam, H. Encoder-Decoder with Atrous Separable Convolution for Semantic Image Segmentation. In Proceedings of the European Conference on Computer Vision (ECCV), Munich, Germany, 8–14 September 2018; pp. 801–818. [Google Scholar]
- Seferbekov, S.; Iglovikov, V.; Buslaev, A.; Shvets, A. Feature Pyramid Network for Multi-Class Land Segmentation. In Proceedings of the IEEE Conference on Computer Vision and Pattern Recognition Workshops, Salt Lake City, UT, USA, 18–22 June 2018; pp. 272–275. [Google Scholar]


| Stage | Resolution | Channels In → Out | Block Type | Skip-Conn |
|---|---|---|---|---|
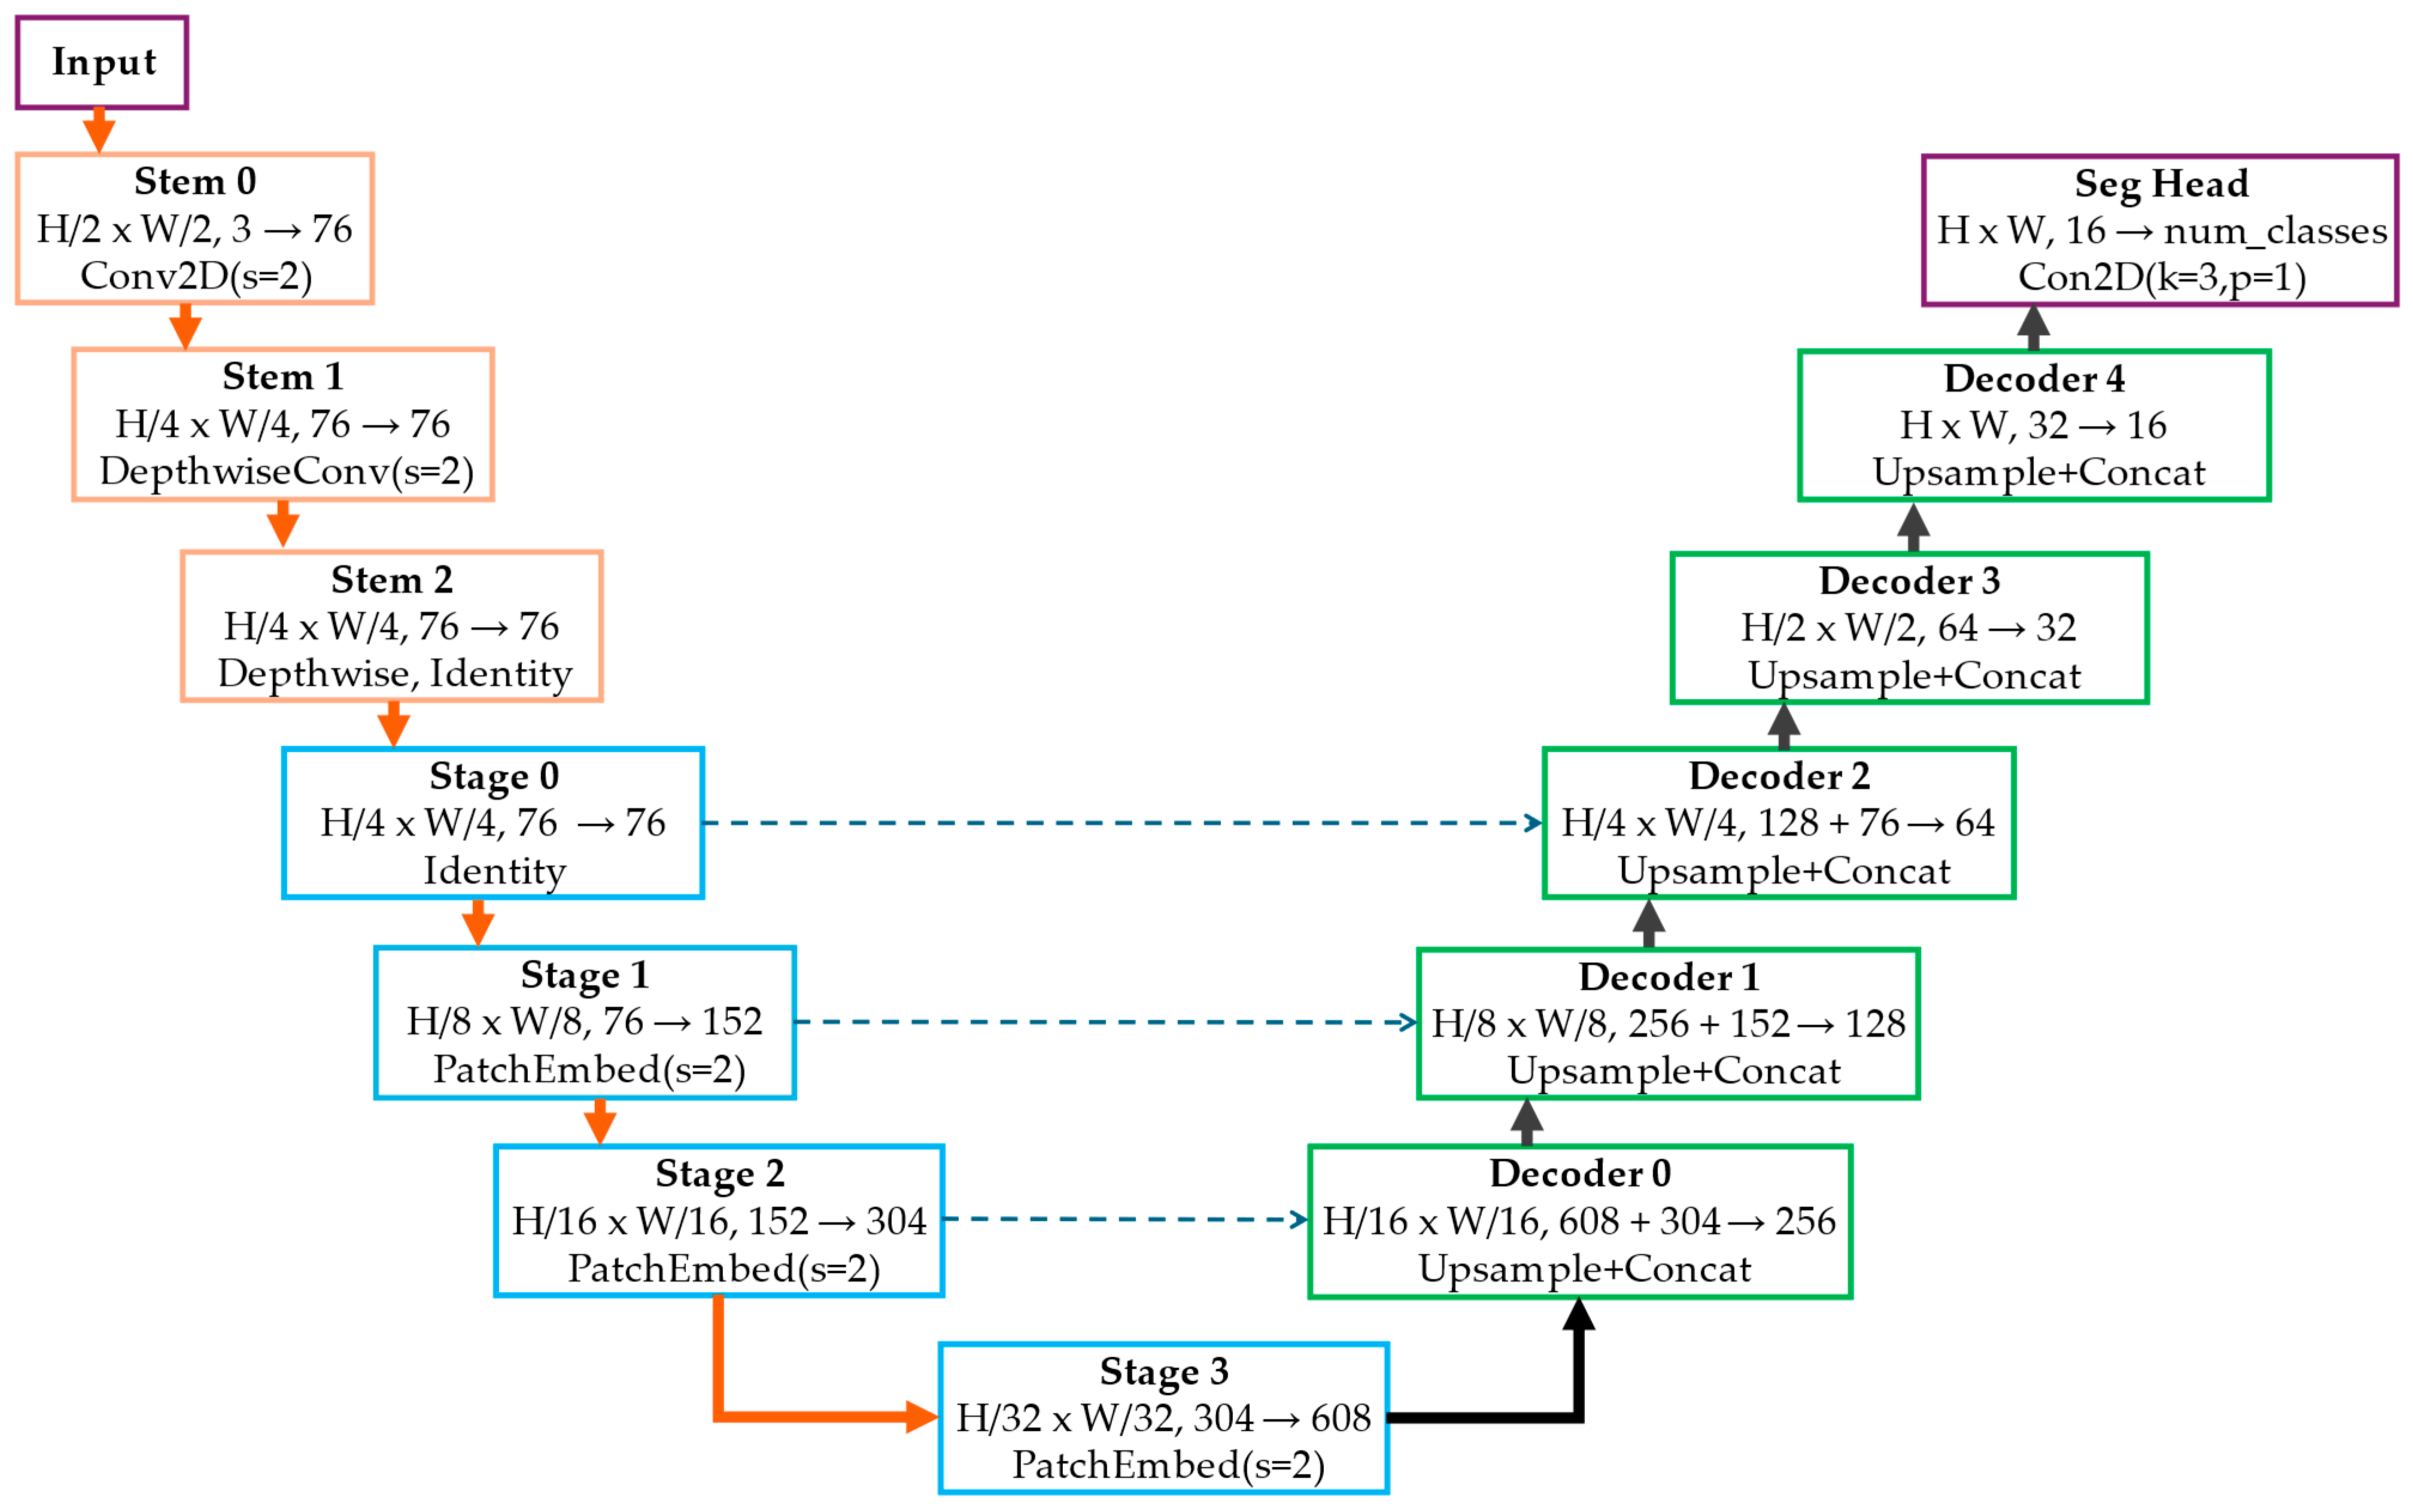
| Input | H × W | 3 → – | – | – |
| Stem 0 | H/2 × W/2 | 3 → 76 | MobileOneBlock: 3 × 3 Conv (stride 2) → BN → GELU | – |
| Stem 1 | H/4 × W/4 | 76 → 76 | MobileOneBlock: Depthwise 3 × 3 Conv (s = 2) → BN → GELU | – |
| Stem 2 | H/4 × W/4 | 76 → 76 | MobileOneBlock: Pointwise 1 × 1 Conv→BN | – |
| Stage 0 | H/4 × W/4 | 76 → 76 | RepMixerBlocks | → Decoder 2 (76 ch) |
| Stage 1 | H/8 × W/8 | 76 → 152 | PatchEmbed (s = 2) → RepMixerBlocks | → Decoder 1 (152 ch) |
| Stage 2 | H/16 × W/16 | 152 → 304 | PatchEmbed (s = 2) → RepMixerBlocks | → Decoder 0 (304 ch) |
| Stage 3 | H/32 × W/32 | 304 → 608 | PatchEmbed (s = 2) → AttentionBlocks | – |
| Decoder 0 | H/16 × W/16 ↑ | (608 + 304) = 912 → 256 | Upsample × 2 → Concat → 2 × Conv2dReLU → Identity | ← Stage 2 (304 ch) |
| Decoder 1 | H/8 × W/8 ↑ | (256 + 152) = 408 → 128 | Upsample × 2 → Concat → 2 × Conv2dReLU → Identity | ← Stage 1 (152 ch) |
| Decoder 2 | H/4 × W/4 ↑ | (128 + 76) = 204 → 64 | Upsample × 2 → Concat → 2 × Conv2dReLU → Identity | ← Stage 0 (76 ch) |
| Decoder 3 | H/2 × W/2 ↑ | 64 → 32 | Upsample × 2 → Concat → 2 × Conv2dReLU → Identity | – |
| Decoder 4 | H × W ↑ | 32 → 16 | Upsample × 2 → 2 × Conv2dReLU → Identity | – |
| Seg Head | H × W | 16 → num_classes | Conv2d(k = 3, p = 1) → Activation | – |
| Damage Level | Description |
|---|---|
| No damage | No sign of water, structural, or shingle damage or burn marks. |
| Minor damage | Building partially burnt, water surrounding structure, volcanic flow nearby, roof elements missing, or visible cracks. |
| Major damage | Partial wall or roof collapse, encroaching volcanic flow, or surrounded by water/mud. |
| Destroyed | Scorched, completely collapsed, partially/completely covered with water/mud, or otherwise no longer present. |
| Damage Level | Validation Set | Test Set | ||
|---|---|---|---|---|
| IoU | F1 | IoU | F1 | |
| No damage | 0.603 | 0.752 | 0.608 | 0.756 |
| Minor damage | 0.276 | 0.432 | 0.299 | 0.460 |
| Major damage | 0.418 | 0.589 | 0.428 | 0.599 |
| Destroyed | 0.387 | 0.558 | 0.406 | 0.577 |
| Macro-average | 0.421 | 0.583 | 0.435 | 0.598 |
Disclaimer/Publisher’s Note: The statements, opinions and data contained in all publications are solely those of the individual author(s) and contributor(s) and not of MDPI and/or the editor(s). MDPI and/or the editor(s) disclaim responsibility for any injury to people or property resulting from any ideas, methods, instructions or products referred to in the content. |
© 2025 by the authors. Licensee MDPI, Basel, Switzerland. This article is an open access article distributed under the terms and conditions of the Creative Commons Attribution (CC BY) license (https://creativecommons.org/licenses/by/4.0/).
Share and Cite
Al Shafian, S.; He, C.; Hu, D. DamageScope: An Integrated Pipeline for Building Damage Segmentation, Geospatial Mapping, and Interactive Web-Based Visualization. Remote Sens. 2025, 17, 2267. https://doi.org/10.3390/rs17132267
Al Shafian S, He C, Hu D. DamageScope: An Integrated Pipeline for Building Damage Segmentation, Geospatial Mapping, and Interactive Web-Based Visualization. Remote Sensing. 2025; 17(13):2267. https://doi.org/10.3390/rs17132267
Chicago/Turabian StyleAl Shafian, Sultan, Chao He, and Da Hu. 2025. "DamageScope: An Integrated Pipeline for Building Damage Segmentation, Geospatial Mapping, and Interactive Web-Based Visualization" Remote Sensing 17, no. 13: 2267. https://doi.org/10.3390/rs17132267
APA StyleAl Shafian, S., He, C., & Hu, D. (2025). DamageScope: An Integrated Pipeline for Building Damage Segmentation, Geospatial Mapping, and Interactive Web-Based Visualization. Remote Sensing, 17(13), 2267. https://doi.org/10.3390/rs17132267