Article

Impact of Plateau Grassland Degradation on Ecological Suitability: Revealing Degradation Mechanisms and Dividing Potential Suitable Areas with Multi Criteria Models

1
Faculty of Geography, Yunnan Normal University, Kunming 650500, China
2
Key Laboratory of Regional Sustainable Development Modeling, Institute of Geographic Sciences and Natural Resources Research (IGSNRR), Chinese Academy of Sciences (CAS), Beijing 100101, China
3
College of Resources and Environment, University of Chinese Academy of Sciences, Beijing 100049, China
4
State Key Laboratory of Cryospheric Science, Koktokay Snow Station, Northwest Institute of Eco-Environment and Resources, Chinese Academy of Sciences, Lanzhou 730000, China
*
Author to whom correspondence should be addressed.
These authors contributed equally to this work.
Remote Sens. 2025, 17(15), 2539; https://doi.org/10.3390/rs17152539
Submission received: 24 March 2025 / Revised: 29 May 2025 / Accepted: 17 June 2025 / Published: 22 July 2025

Abstract

The Qinghai–Tibetan Plateau (QTP), often referred to as the “Third Pole” of the world, harbors alpine grassland ecosystems that play an essential role as global carbon sinks, helping to mitigate the pace of climate change. Nonetheless, alterations in natural environmental conditions coupled with escalating human activities have disrupted the seasonal growth cycles of grasslands, thereby intensifying degradation processes. To date, the key drivers and lifecycle dynamics of Grassland Depletion across the QTP remain contentious, limiting our comprehension of its ecological repercussions and regulatory mechanisms. This study comprehensively investigates grassland degradation on the Qinghai–Tibetan Plateau, analyzing its drivers and changes in ecological suitability during the growing season. By integrating natural factors (e.g., precipitation and temperature) and anthropogenic influences (e.g., population density and grazing intensity), it examines observational data from over 160 monitoring stations collected between the 1980s and 2020. The findings reveal three distinct phases of grassland degradation: an acute degradation phase in 1990 (GDI, Grassland Degradation Index = 2.53), a partial recovery phase from 1996 to 2005 (GDI < 2.0) during which the proportion of degraded grassland decreased from 71.85% in 1990 to 51.22% in 2005, and a renewed intensification of degradation after 2006 (GDI > 2.0), with degraded grassland areas reaching 56.39% by 2020. Among the influencing variables, precipitation emerged as the most significant driver, interacting closely with anthropogenic factors such as grazing practices and population distribution. Specifically, the combined impacts of precipitation with population density, grazing pressure, and elevation were particularly notable, yielding interaction q-values of 0.796, 0.767, and 0.752, respectively. Our findings reveal that while grasslands exhibit superior carbon sink potential relative to forests, their productivity and ecological functionality are undergoing considerable declines due to the compounded effects of multiple interacting factors. Consequently, the spatial distribution of ecologically suitable zones has contracted significantly, with the remaining high-suitability regions concentrating in the “twin-star” zones of Baingoin and Zanda grasslands, areas recognized as focal points for future ecosystem preservation. Furthermore, the effects of climate change and intensifying anthropogenic activity have driven the reduction in highly suitable grassland areas, shrinking from 41,232 km2 in 1990 to 24,485 km2 by 2020, with projections indicating a further decrease to only 2844 km2 by 2060. This study sheds light on the intricate mechanisms behind Grassland Depletion, providing essential guidance for conservation efforts and ecological restoration on the QTP. Moreover, it offers theoretical underpinnings to support China’s carbon neutrality and peak carbon emission goals.

1. Introduction

Grasslands are the largest and most widespread multifunctional ecosystems on Earth, accounting for approximately 40% of the total land area [1]. They play a significant role in soil [2] and water conservation [3], climate regulation [4], carbon sequestration [4], water environment protection and the regulation of biodiversity [5]. Additionally, they provide substantial economic support for global livestock industries [6,7]. It is estimated that the global economic value of grassland ecosystem services amounts to approximately USD 208 billion annually [8,9]. In light of the global ecosystem and human society’s demands, grassland has become a crucial strategic conservation resource [10,11]. However, the deterioration of the natural environment and the continuous expansion of human activities have led to significant degradation issues affecting grassland [12]. Beyond their ecological importance, grasslands also serve as critical resources for sustaining traditional pastoral cultures and supporting regional food security. The transformation of pastoral systems, coupled with rising global demand for livestock products, has exacerbated grassland pressures, raising concerns over their long-term sustainability. This highlights the need to balance ecological conservation with socio-economic development in grassland-dependent regions.
The QTP contains the world’s largest high-altitude grassland, accounting for 2.5% of the global organic carbon stock but only 0.3% of the global land area [13]. As a globally significant ecological zone, the QTP is also a key indicator of climate change impacts due to its high sensitivity to temperature and precipitation fluctuations. The unique interactions between cryosphere processes, hydrological systems, and alpine ecosystems make it an area of particular concern for global climate research. It plays crucial ecological roles in windbreak and sand fixation, soil conservation [14], water conservation, carbon sequestration, and biodiversity maintenance [15]. Considered the ‘third pole’ of the Earth, alongside the North and South Poles [16], it is particularly susceptible to global climate change processes and anthropogenic activities [17]. Grasslands on the QTP have been facing an unprecedented degradation crisis since the beginning of the 21st century, with over 90% of the grasslands experiencing degradation [18]. This undoubtedly has serious impacts on the plateau’s ecological functions.
Critically, the relative importance of various factors causing Grassland Depletion remains unclear. The breakdown of grassland ecosystems is frequently attributable to alterations in natural conditions and the intensification of human activities [12]. Consequently, a comprehensive examination of the influences of natural and anthropogenic factors on these ecosystems is vital for the restoration of grassland ecosystems on the QTP and the ascertainment of their suitability [12,19].
Over the past four decades, extensive research has been conducted on the grasslands of the Qinghai–Tibet Plateau [20]. Early studies primarily relied on field sampling methods, which provided high data accuracy and strong practical value [21,22,23], laying a solid foundation for subsequent research [24,25]. However, increasing climate change and intensified human activities have made local ecosystems more susceptible to external disturbances [26]. These changes underscore the need for advanced technologies that offer high timeliness, wide spatial coverage, and enhanced precision. The emergence of remote sensing, particularly when integrated with geospatial analysis [27], has gradually replaced traditional field surveys and become a key methodology for investigating grassland degradation [28]. Researchers have employed this approach to investigate the effects of climate change and human activities on the QTP [29,30]. Specifically, they have focused on identifying the drivers of grassland degradation, analyzing its response to climatic fluctuations, evaluating the influence of anthropogenic factors on grassland ecosystems.
Numerous scholars tend to link grassland vegetation changes with specific environmental variables, such as temperature [31], precipitation [32], solar radiation [33], and evapotranspiration [34]. For example, the sensitivity of global vegetation to changes in daily rainfall was systematically assessed by quantifying the significant effect of precipitation on vegetation through an atmospheric coupled model by Feldman et al. [35]. McCabe et al. [36] obtained multivariate linear coefficients and correlation coefficients between air temperature, precipitation and solar radiation and grassland cover by performing multivariate linear regression and correlation analyses. In addition, a few scholars have also paid attention to the influence of topography on grassland degradation. This encompasses soil type [33], soil erodibility, elevation [37], slope, and aspect [38], all of which have been identified as significant contributors to Grassland Depletion. It is thought-provoking that the direct influence of human activities on grassland cover has not received much attention at present. While it is found in the investigation that grazing and urbanization processes sometimes tend to play a decisive role in grassland degradation. For example, the demands of local economic development can lead to the rapid development of animal husbandry, resulting in serious damage to the regeneration of their pasture [39,40]. Furthermore, the expansion of impermeable surfaces and road construction [41] during the process of urbanization [9,42] can reduce the available living space for grassland. A review of the above studies shows that they usually associate a single factor, such as temperature, precipitation, solar radiation, population density and roads, with grassland. In the vast system of nature, grassland degradation is often affected by many factors and has obvious spatial heterogeneity, and a single factor often fails to reveal the mechanism of grassland degradation well, which limits people’s understanding of the life cycle of grassland degradation. At the same time, grassland is an annual vegetation, the growing area is in the process of change, and in the current study, the area of grassland is often regarded as a fixed value. Meanwhile, due to the lack of remote sensing image data, the observation period of grassland degradation is often in the period of 2000, which seriously limits the assessment of the growth status of grassland.
To systematically evaluate the full lifecycle of Grassland Depletion during the growing season, this study integrates 30 years of high-precision NDVI data (1982–2020) from GIMMS and MOD13A3 and analyzes over 160 typical observation sites. The study identifies precipitation, grazing intensity, population density, and elevation as the dominant factors driving degradation. These factors not only individually influence grassland productivity but also interact to exacerbate degradation trends, leading to a significant spatial contraction of ecological suitability zones. The degradation process can be divided into three stages: severe degradation around 1990, partial recovery from 1990 to 2005, and renewed degradation since 2006. The most suitable grasslands are progressively concentrated in Baingoin and Zanda—the “grassland ecological suitability twin-star regions.” However, projections for 2030 and 2060 indicate that the highly suitable areas will continue to shrink under the pressures of climate change and human activities, further emphasizing the urgent need for targeted restoration strategies. Short-term protective measures, such as limiting overgrazing and expanding arable and pasture land, have demonstrated limited effectiveness in decelerating degradation. Therefore, the identification of ecologically suitable zones through multifunctional zoning, combined with spot ecological protection measures, is critical for grassland conservation and restoration. This study highlights the importance of understanding degradation mechanisms, identifying ecologically suitable zones, and implementing focused protection measures to support sustainable grassland management. It provides critical insights for achieving China’s carbon neutrality and peak carbon goals, contributing to the long-term ecological stability of the QTP.

2. Materials and Methods

2.1. Overview Geographical Characteristics of the QTP

The QTP is the youngest, highest, the largest plateau on Earth [43], and the “Towering Spring of Asia” [44]. It extends from the Pamirs and Hindu Kush in the west to the Heng Duan Mountains in the east, from the Kunlun and Qilian Mountains in the north to the Himalayas in the south, located between longitudes 73°19′E to 104°47′E and latitudes 26°00′N to 39°47′N, encompassing about 2.6153 million km2 [45]. At an average altitude of around 4500 m [46], it stands as one of Earth’s most unique geological–geographical units, functioning as a natural laboratory for Earth’s evolution, sphere interactions, and human–environment studies. It is also Asia’s ecological core and climate regulator (see Figure 1). The QTP spans six provinces in China, encompassing 154 prefecture-level administrative regions and 182 counties. It has diverse geographical and climatic conditions, with annual average temperatures ranging from −30 to 25 °C [43] with annual average precipitation ranging from 33 mm to 100 mm [46]. It boasts diverse soil types, with grasslands being the predominant vegetation, covering over 60% of the region’s total vegetation [47]. It is essential for preserving biodiversity, regulating soil and water resources, facilitating carbon sequestration and storage, and sustaining economic livelihoods, particularly through animal husbandry. Meanwhile, the plateau’s distinctive geographical position and climatic attributes give rise to considerable spatial heterogeneity in grassland distribution, underscoring the intricate nature of grassland deterioration concerns.

2.2. Data Collection and Preprocessing

The data employed encompass remote sensing vegetation indices, meteorological data, topographic data, soil type data, and human activity data. These datasets were processed using techniques such as data cleaning, resampling, and mask extraction to acquire annual data of the QTP with a spatial resolution of 1000 m. The coordinate system adopted is WGS 1984 Albers, and the QTP boundary is defined by the 2017 administrative boundary [45]. Detailed descriptions and processing methods are presented in Table 1.

2.3. Research Framework

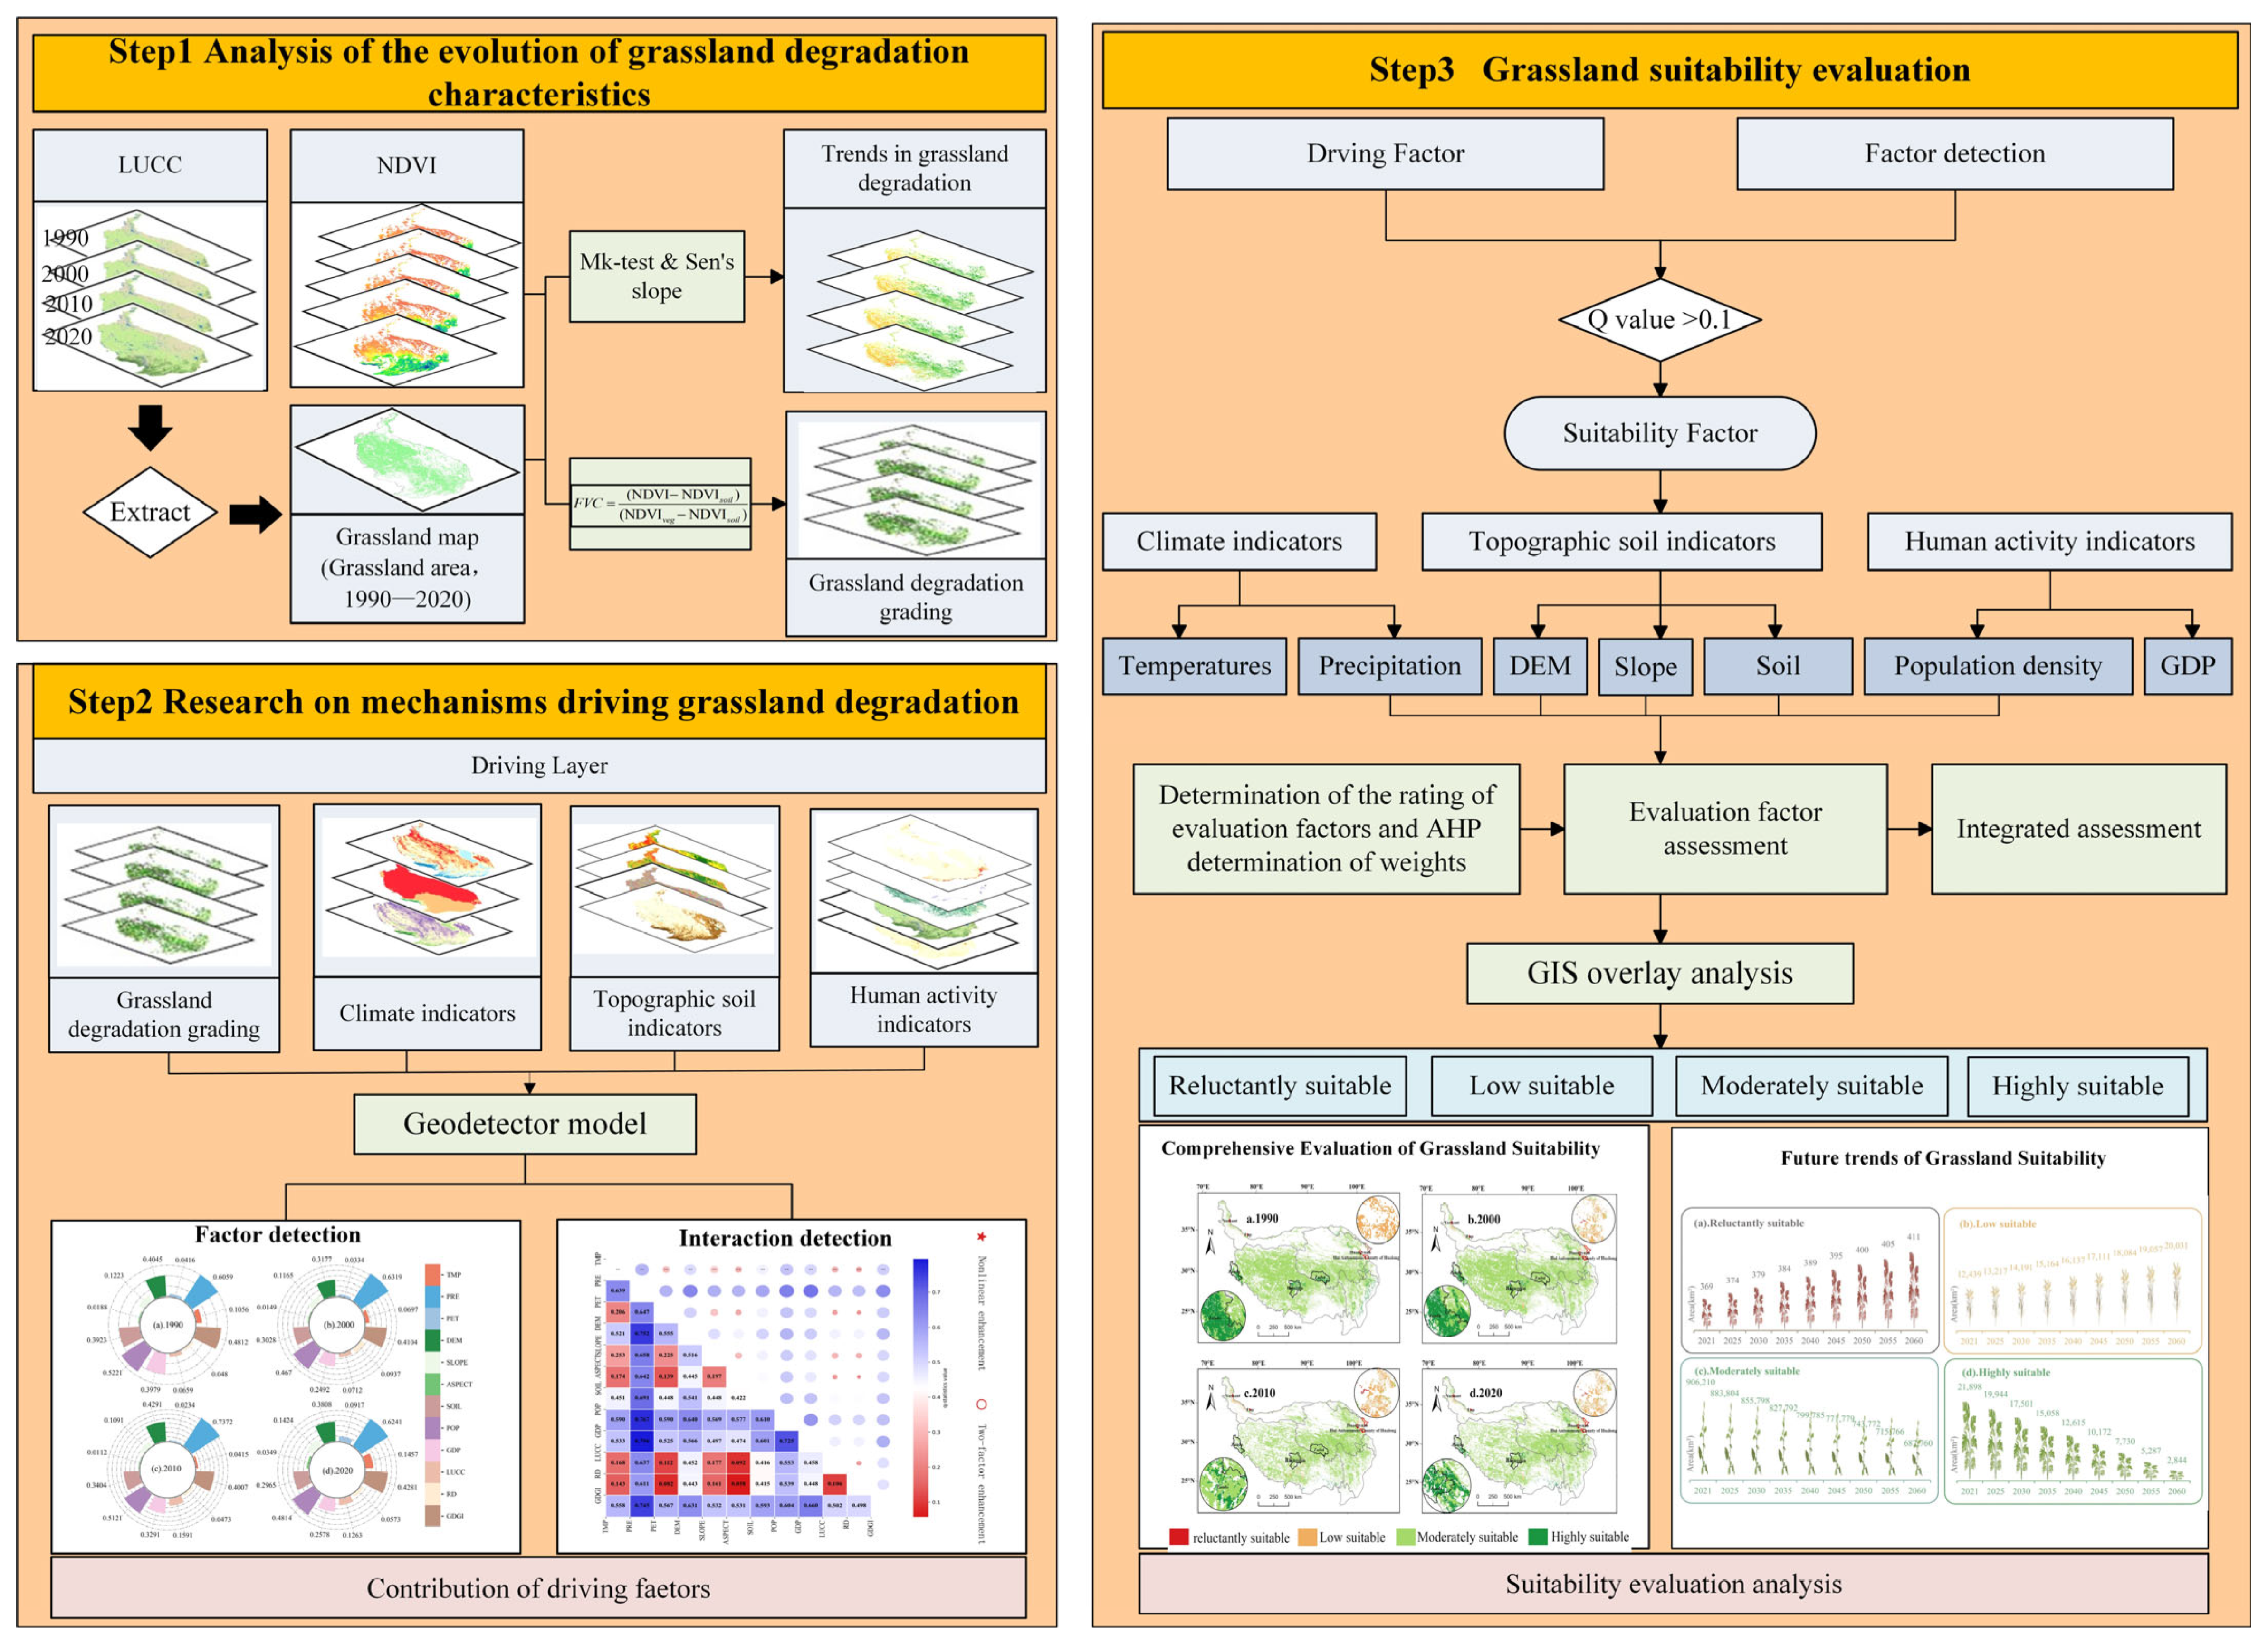
This study establishes a robust analytical framework to investigate Grassland Depletion on the Tibetan Plateau, as illustrated in Figure 2. The primary objective is to examine the dynamic patterns and driving mechanisms behind Grassland Depletion comprehensively. The process begins with the application of the Theil-Sen (T-S) trend analysis method to identify the median trends in NDVI changes for grasslands. This is followed by the Mann–Kendall (M-K) test, which statistically assesses the significance of trends within the NDVI time series data. To further analyze the spatial and temporal distribution of Grassland Depletion, a Grassland Depletion Index (GDI) is constructed using the Fractional Vegetation Cover (FVC), enabling the quantification of annual degradation patterns across the Tibetan Plateau. In the next step, the Geographical Detector model is utilized to identify and analyze the key influencing factors driving Grassland Depletion. This method effectively reveals the spatial heterogeneity in the impacts of natural variables and human activities. Finally, the identified driving factors are assigned weights through the Analytic Hierarchy Process (AHP), which are subsequently integrated with GIS spatial overlay analysis. This approach allows for the assessment of grassland suitability across the Tibetan Plateau, mapping the spatial distribution of suitability zones from 1990 to 2020.

2.3.1. Establishment of Grassland Depletion Evaluation Index System

  • Calculation of grassland vegetation cover
According to the national standard CB19377-2003 for the classification of natural Grassland Depletion, desertification, and salinization, as well as relevant existing research, the vegetation characteristics of the QTP’s grassland types in the early 1980s can serve as a baseline for studying pre-degradation conditions [48]. First, using NDVI data, the grassland coverage is estimated with the pixel dichotomy method, as shown in Formula (1).
F V C = ( NDVI NDVI s o i l ) ( NDVI v e g NDVI s o i l )
Subsequently, the maximum grass vegetation cover value (FVC) was calculated for the years 1982–1985, which served as the baseline image of undegraded grass. Thereafter, the grass cover of other years was classified into five degradation types: Un-degraded, lightly degraded, moderately degraded, severely degraded, and grievously severely degraded. The classification criteria are shown in Table 2.
  • Calculation of the grassland degradation index
Based on the Grassland Depletion levels; the Grassland Depletion Index (GDI) is used to assess the overall annual degradation level of the grassland. The calculation formula is shown in Formula (2).
G D I = i = 1 5 ( D i × A i ) A
Here, G D I represents the Grassland Depletion Index for the QTP, D i is the score for degradation level i , A i is the area of degradation level i , and A is the total grassland area. According to the classification standards for degradation, the analysis of Grassland Depletion is shown in Table 3.

2.3.2. Theil-Sen Slope Estimation

The Theil-Sen (T-S) slope estimation method calculates the slope using the median difference between NDVI values over time. Compared to the conventional least-squares regression approach, the T-S method is robust and less sensitive to outliers, making it more reliable for detecting trends in NDVI time series data. This study adopts the T-S method to analyze pixel-level trends of NDVI changes.
The slope formula is expressed as follows:
s l o p e = m e d i a n ( N D V I j N D V I i ) j i , j > i
Here, NDVIi and NDVIj represent the NDVI values at time i and j, respectively. The calculated slope determines the trend of vegetation change: 1. Positive Slope: Indicates an increasing NDVI trend, suggesting vegetation improvement. 2. Negative Slope: Represents a decreasing NDVI trend, indicating potential vegetation degradation.

2.3.3. Mann–Kendall Test

The Mann–Kendall (M-K) test is a widely used non-parametric method to evaluate the significance of trends in time series data, such as NDVI changes. This test is particularly useful when combining the T-S slope estimator to determine the direction and significance of vegetation trends.
The M-K statistic (S) and standardized Z value are defined as follows:
S = i = 1 n 1 j = j + 1 n s i g n ( N D V I j N D V I i )
sgn ( N D V I j N D V I i ) = 1 ,   i f   ( N D V I j N D V I i ) > 0 0 ,   i f   ( N D V I j N D V I i ) = 0 1 ,   i f   ( N D V I j N D V I i ) < 0
Z = S 1 V ar ( S ) , i f   S > 0 0 , i f   S = 0 S 1 V ar ( S ) , i f   S < 0
In this context, n represents the total number of time series observations under consideration (in this study, n = 10–30). The Mann–Kendall (M-K) test statistic, denoted as S, evaluates the overall trend in the time series, while the standardized statistic Z conforms to a normal distribution, allowing for significance testing of the detected trends.
A significant trend is identified when the calculated Z value exceeds the critical threshold at a 5% significance level. Positive values of S indicate an increasing trend in NDVI, reflecting a marked improvement in vegetation conditions on the QTP. Conversely, negative S values signify a decreasing trend, pointing to significant Grassland Depletion over the study period. In the Mann–Kendall test, the 5% significance level (α = 0.05) is commonly used to determine whether the observed trend is statistically significant. Under a standard normal distribution, this significance level corresponds to a critical Z-value of ±1.96 in a two-tailed test. If the standardized Z statistic exceeds 1.96 (Z > 1.96) or is less than −1.96 (Z < −1.96), the null hypothesis of no trend can be rejected, indicating a statistically significant trend.
By integrating the Mann–Kendall test with the Theil-Sen slope estimator, this study categorizes the observed grassland trends into five distinct classes based on NDVI time series data (Table 4).

2.3.4. Geodetector

The Geodetector model is a powerful tool for identifying geospatial heterogeneity and assessing the influence of various driving factors, including their combined effects. This method has been extensively utilized in research fields such as landscape ecology, health risk evaluation, and the analysis of human–environment interactions [49]. In this study, we propose that the spatial distribution of grassland coverage is influenced by multiple driving factors. Accordingly, the model examines whether the dependent variable, represented by Y (FVC grassland), aligns spatially with the independent variables, denoted as X (12 indicators impacting Grassland Depletion). Through this analysis, we aim to clarify the drivers of Grassland Depletion on the QTP and evaluate the interactions among these factors.
The Geodetector comprises four principal components:
  • Factor Detector—Quantifies the explanatory power of each factor, where the q value measures the degree of heterogeneity in Y caused by X.
  • Ecological Detector—Compares the effects of two factors on the spatial distribution of grassland using statistical significance tests (e.g., F-test) to determine if their influences differ.
  • Interaction Detector—Assesses whether two factors interact synergistically, independently, or in a weakening manner by analyzing the combined q values relative to their individual effects.
  • Risk Detector—Identifies spatially vulnerable areas under potential degradation risks, offering insights into priority zones for conservation and intervention.
The mathematical expression for the q value is as follows:
q = 1 h = 1 L N h = 1 σ h 2 N σ 2 = 1 S S W S S T
In this formula:
  • L represents the number of strata (h = 1, 2, …, L).
  • Nh and N denote the number of units within a stratum and the total number of units, respectively.
  • σ2 is the total variance, while σ h 2 is the variance within each stratum.
The q value ranges between 0 and 1. A value of q = 0 indicates no spatial stratification, meaning that Y is unrelated to X. Conversely, when q = 1, it signifies that the spatial variation in Y is entirely determined by X. Larger q values reflect stronger spatial stratified heterogeneity, highlighting the dominant impact of the associated factor on Grassland Depletion (Table 5).

2.3.5. The Evaluation of Grassland Ecological Suitability Spatial Distribution

  • Grassland Suitability Evaluation Model
This study uses a multi-factor weighted evaluation system to analyze the suitability of grasslands in the QTP. The basic principles and implementation process are as follows: First, factors significantly affecting grasslands are selected based on the results of the Geodetector. Each factor is comprehensively scored to determine its limiting attribute value. Then, the weight of each factor is obtained using the AHP method. Finally, the overall grassland suitability evaluation result is obtained through weighted overlay, and the spatial distribution of grassland suitability is classified. As shown in Formula (8):
S u i t = i = 1 n W i × P i
In the formula, Suit represents the comprehensive evaluation value of grassland suitability in the QTP, Wi is the weight of factor i, Pi is the score of the ith single factor corresponding to the evaluation unit, and n is the total number of evaluation factors.
  • Selection of Evaluation Factors and Quantification of Suitability Levels
In accordance with the outcomes of the factor detector in the Geodetector, factors with a notable influence on grasslands are identified as evaluation factors for grassland suitability and subjected to a quantitative classification. According to current ecological protection standards, the study uses a combination of qualitative and quantitative methods to classify and quantify the evaluation factors based on their impact on Grassland Depletion. The factors are classified into four levels: unsuitable (1 point), less suitable (3 points), moderately suitable (5.2 points), and highly suitable (10 points).
  • Weighted Overlay
The scores of each factor are obtained by classifying and quantifying the above evaluation factors. Then, using the weights of each factor obtained by the AHP method, the suitability distribution of grasslands is obtained through weighted overlay in GIS spatial analysis. According to relevant classification standards <Technical Guidelines for Environmental Impact Assessment for Land Use Planning>, they are divided into four categories (Table 6).

3. Results and Analysis

3.1. Analysis of Grassland Depletion Characteristics

3.1.1. Analysis of Spatial Distribution Patterns of Grassland Depletion

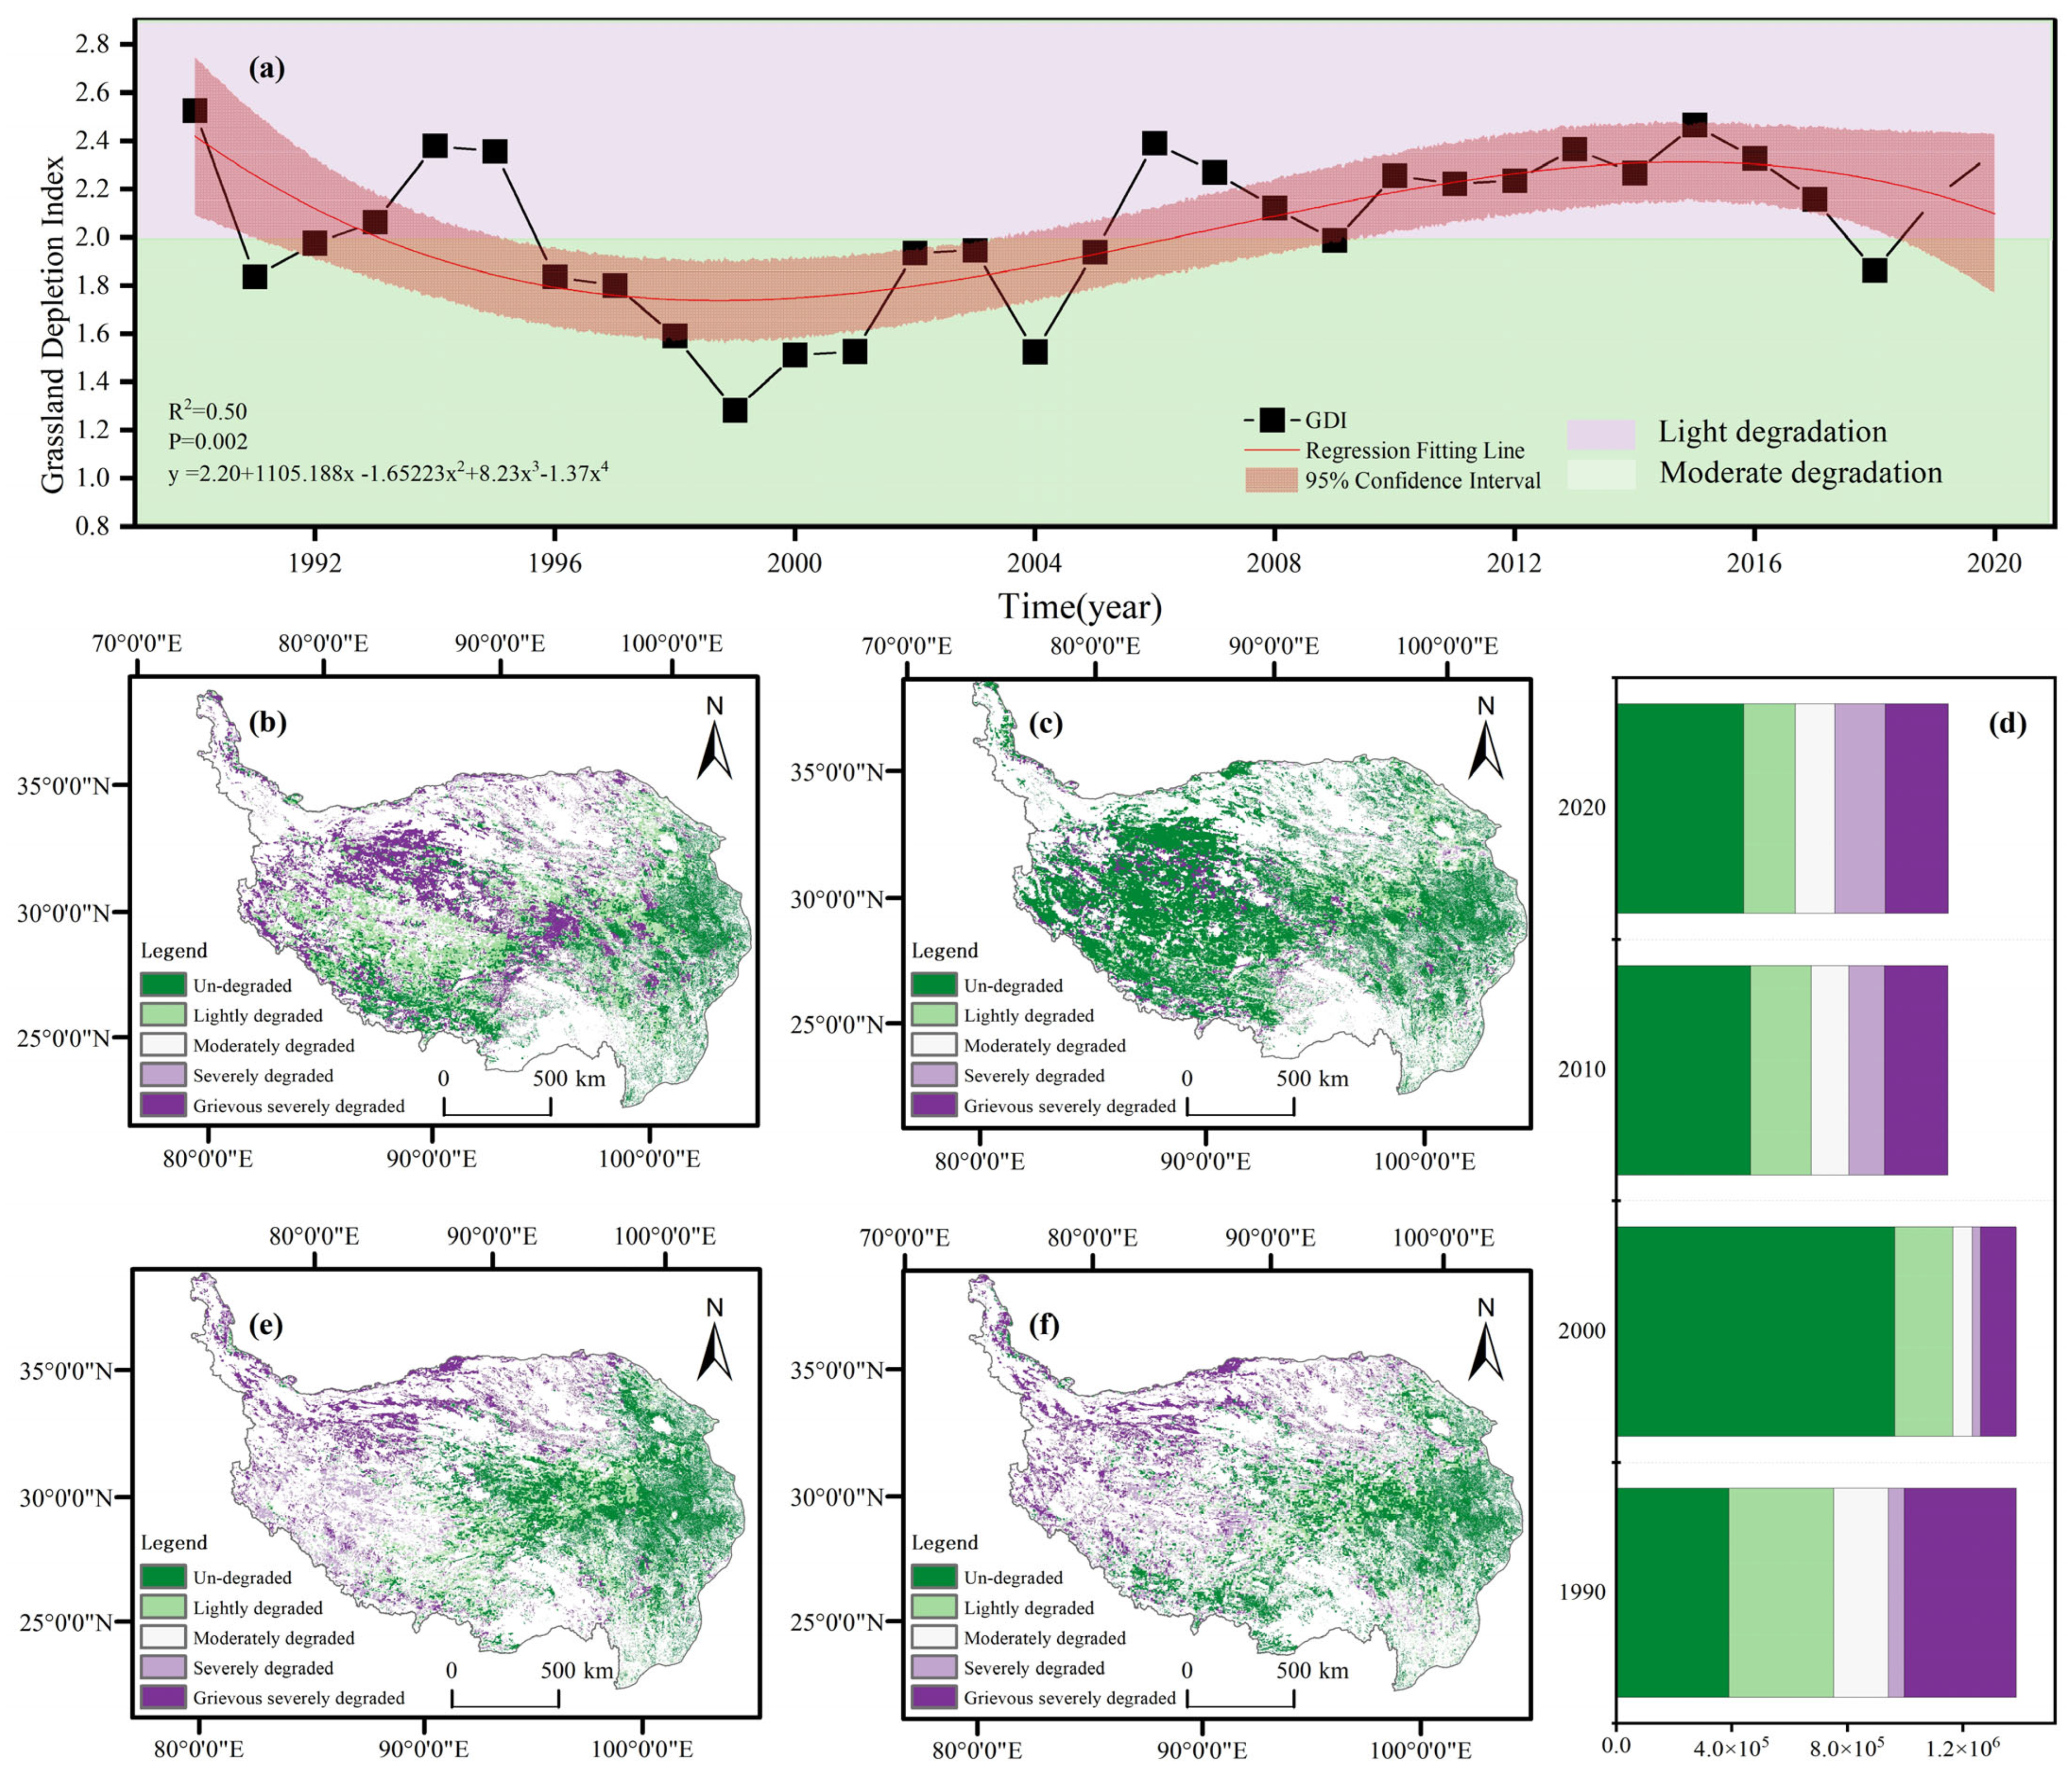
To quantitatively assess the full dynamic lifecycle of Grassland Depletion on the QTP, this study merged GIMMS and MOD13A3 NDVI datasets to produce a high-resolution, long-term NDVI dataset spanning from 1982 to 2020. Using this fused NDVI data, grassland coverage and the Grassland Depletion Index (GDI) were calculated. Additionally, based on the maximum grassland coverage from 1982 to 1985, Grassland Depletion maps for the QTP from 1990 to 2020 were generated, categorizing the degradation levels into five types: UN-degraded, lightly degraded, moderately degraded, severely degraded, and grievously severely degraded (Figure 3).
The overall Grassland Depletion level across the QTP falls between light and moderate degradation, evolving through three distinct phases. The most severe year was 1990, with a GDI as high as 2.53. After 1990, grasslands began to gradually recover, with the GDI falling below 2.0 during the period from 1990 to 2005, indicating a shift to a lightly degraded phase. This phase persisted until 2006, after which the degradation trend began to intensify. From 2006 onwards, the GDI fluctuated around 2.2, marking a transition to a moderate degradation phase, which has continued to the present without significant alleviation.
The spatial patterns of Grassland Depletion indicate substantial changes in degraded areas across the QTP from 1990 to 2020, with degraded grassland covering more than 41% of the total grassland area in the study region. Specifically, lightly degraded and moderately degraded grassland account for over 22% and 8% of the total area, respectively. In terms of degradation trends, the proportion of lightly degraded grassland has decreased, while the areas of moderately and severely degraded grassland have increased. Grievously severely degraded regions are primarily concentrated in the Ali and Nagqu areas, with degraded areas measuring 92,169 km2 and 88,287 km2, respectively. Compared to the lowest degradation levels in 1999, lightly degraded grassland areas declined, and moderately degraded areas expanded between 2010 and 2020. Areas transitioning from light to moderate degradation are mainly distributed in the western plateau, the northern edge of the plateau, and the northeastern plateau.

3.1.2. Spatiotemporal Evolution of Grassland Depletion Characteristics

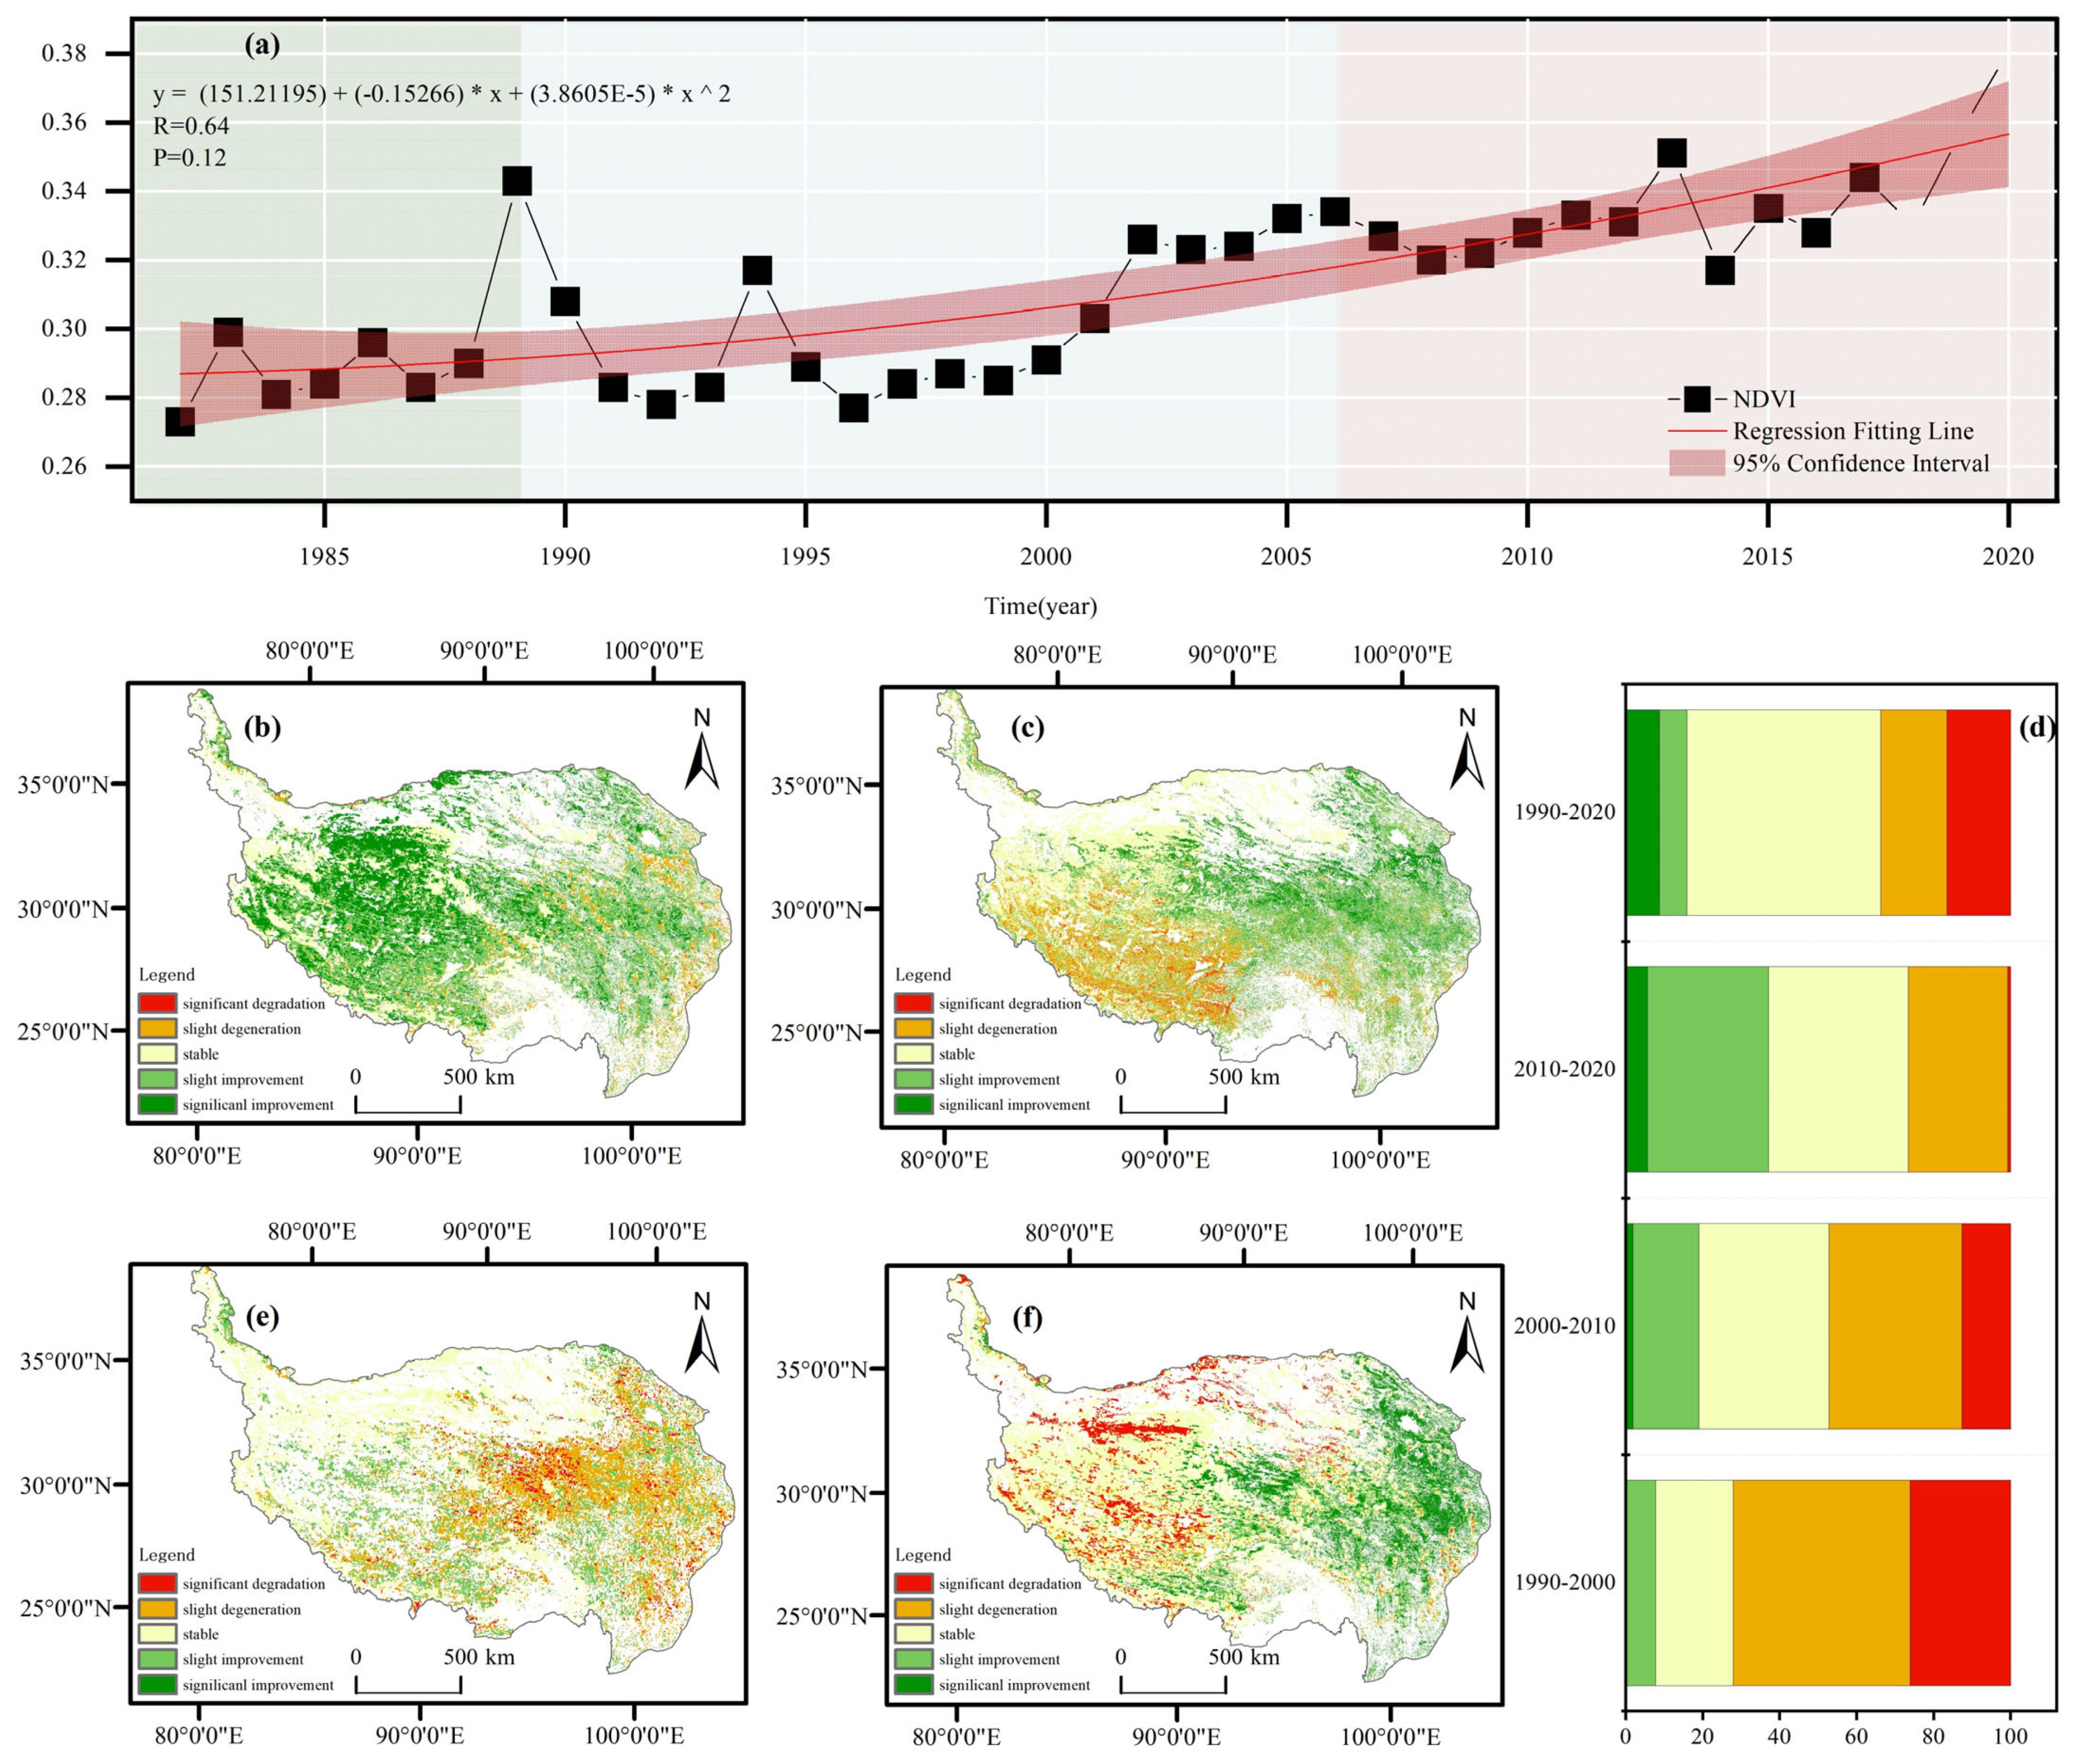
Over the past 40 years, the average NDVI of grasslands on the QTP has remained around 0.3, exhibiting distinct spatiotemporal variations. From 1982 to 1989, NDVI showed a gradual increasing trend, reaching its lowest value of 0.278 in 1992, after which it began to rise slowly, peaking at 0.334 in 2006, and has continued to increase at a modest pace since then. In terms of overall spatial distribution, Grassland Depletion is primarily concentrated in the northwestern and central-western regions of the QTP. Throughout the period from 1990 to 2020, the areas experiencing slight and significant improvement were generally much larger than those undergoing slight and significant degradation (Figure 4).
However, distinct patterns emerged across different historical periods. Between 1990 and 2000, grassland recovery was significant, with restored areas comprising 76.06% of the total, while degraded areas accounted for just 7.87%. After 2000, the recovery of grasslands on the QTP began to decelerate, accompanied by the onset of severe degradation. Between 2000 and 2010, the proportion of recovery area dropped to 47.18%, a decline of 24.88% compared to the previous period, while degraded areas increased to 19.05%, an 11.18% rise from the prior decade. In the period 2010–2020, recovery areas accounted for 26.54%, while degraded areas rose to 37.16%, with degraded areas exceeding recovery areas by 10.62%, indicating that the rate of degradation had surpassed the rate of recovery. These findings suggest that grasslands on the QTP, up to the present, remain in a state of degradation, and the degradation trend is increasingly concerning.

3.2. Study on the Driving Mechanism of Grassland Depletion on the QTP

3.2.1. Contribution of Single Factors to Grassland Depletion

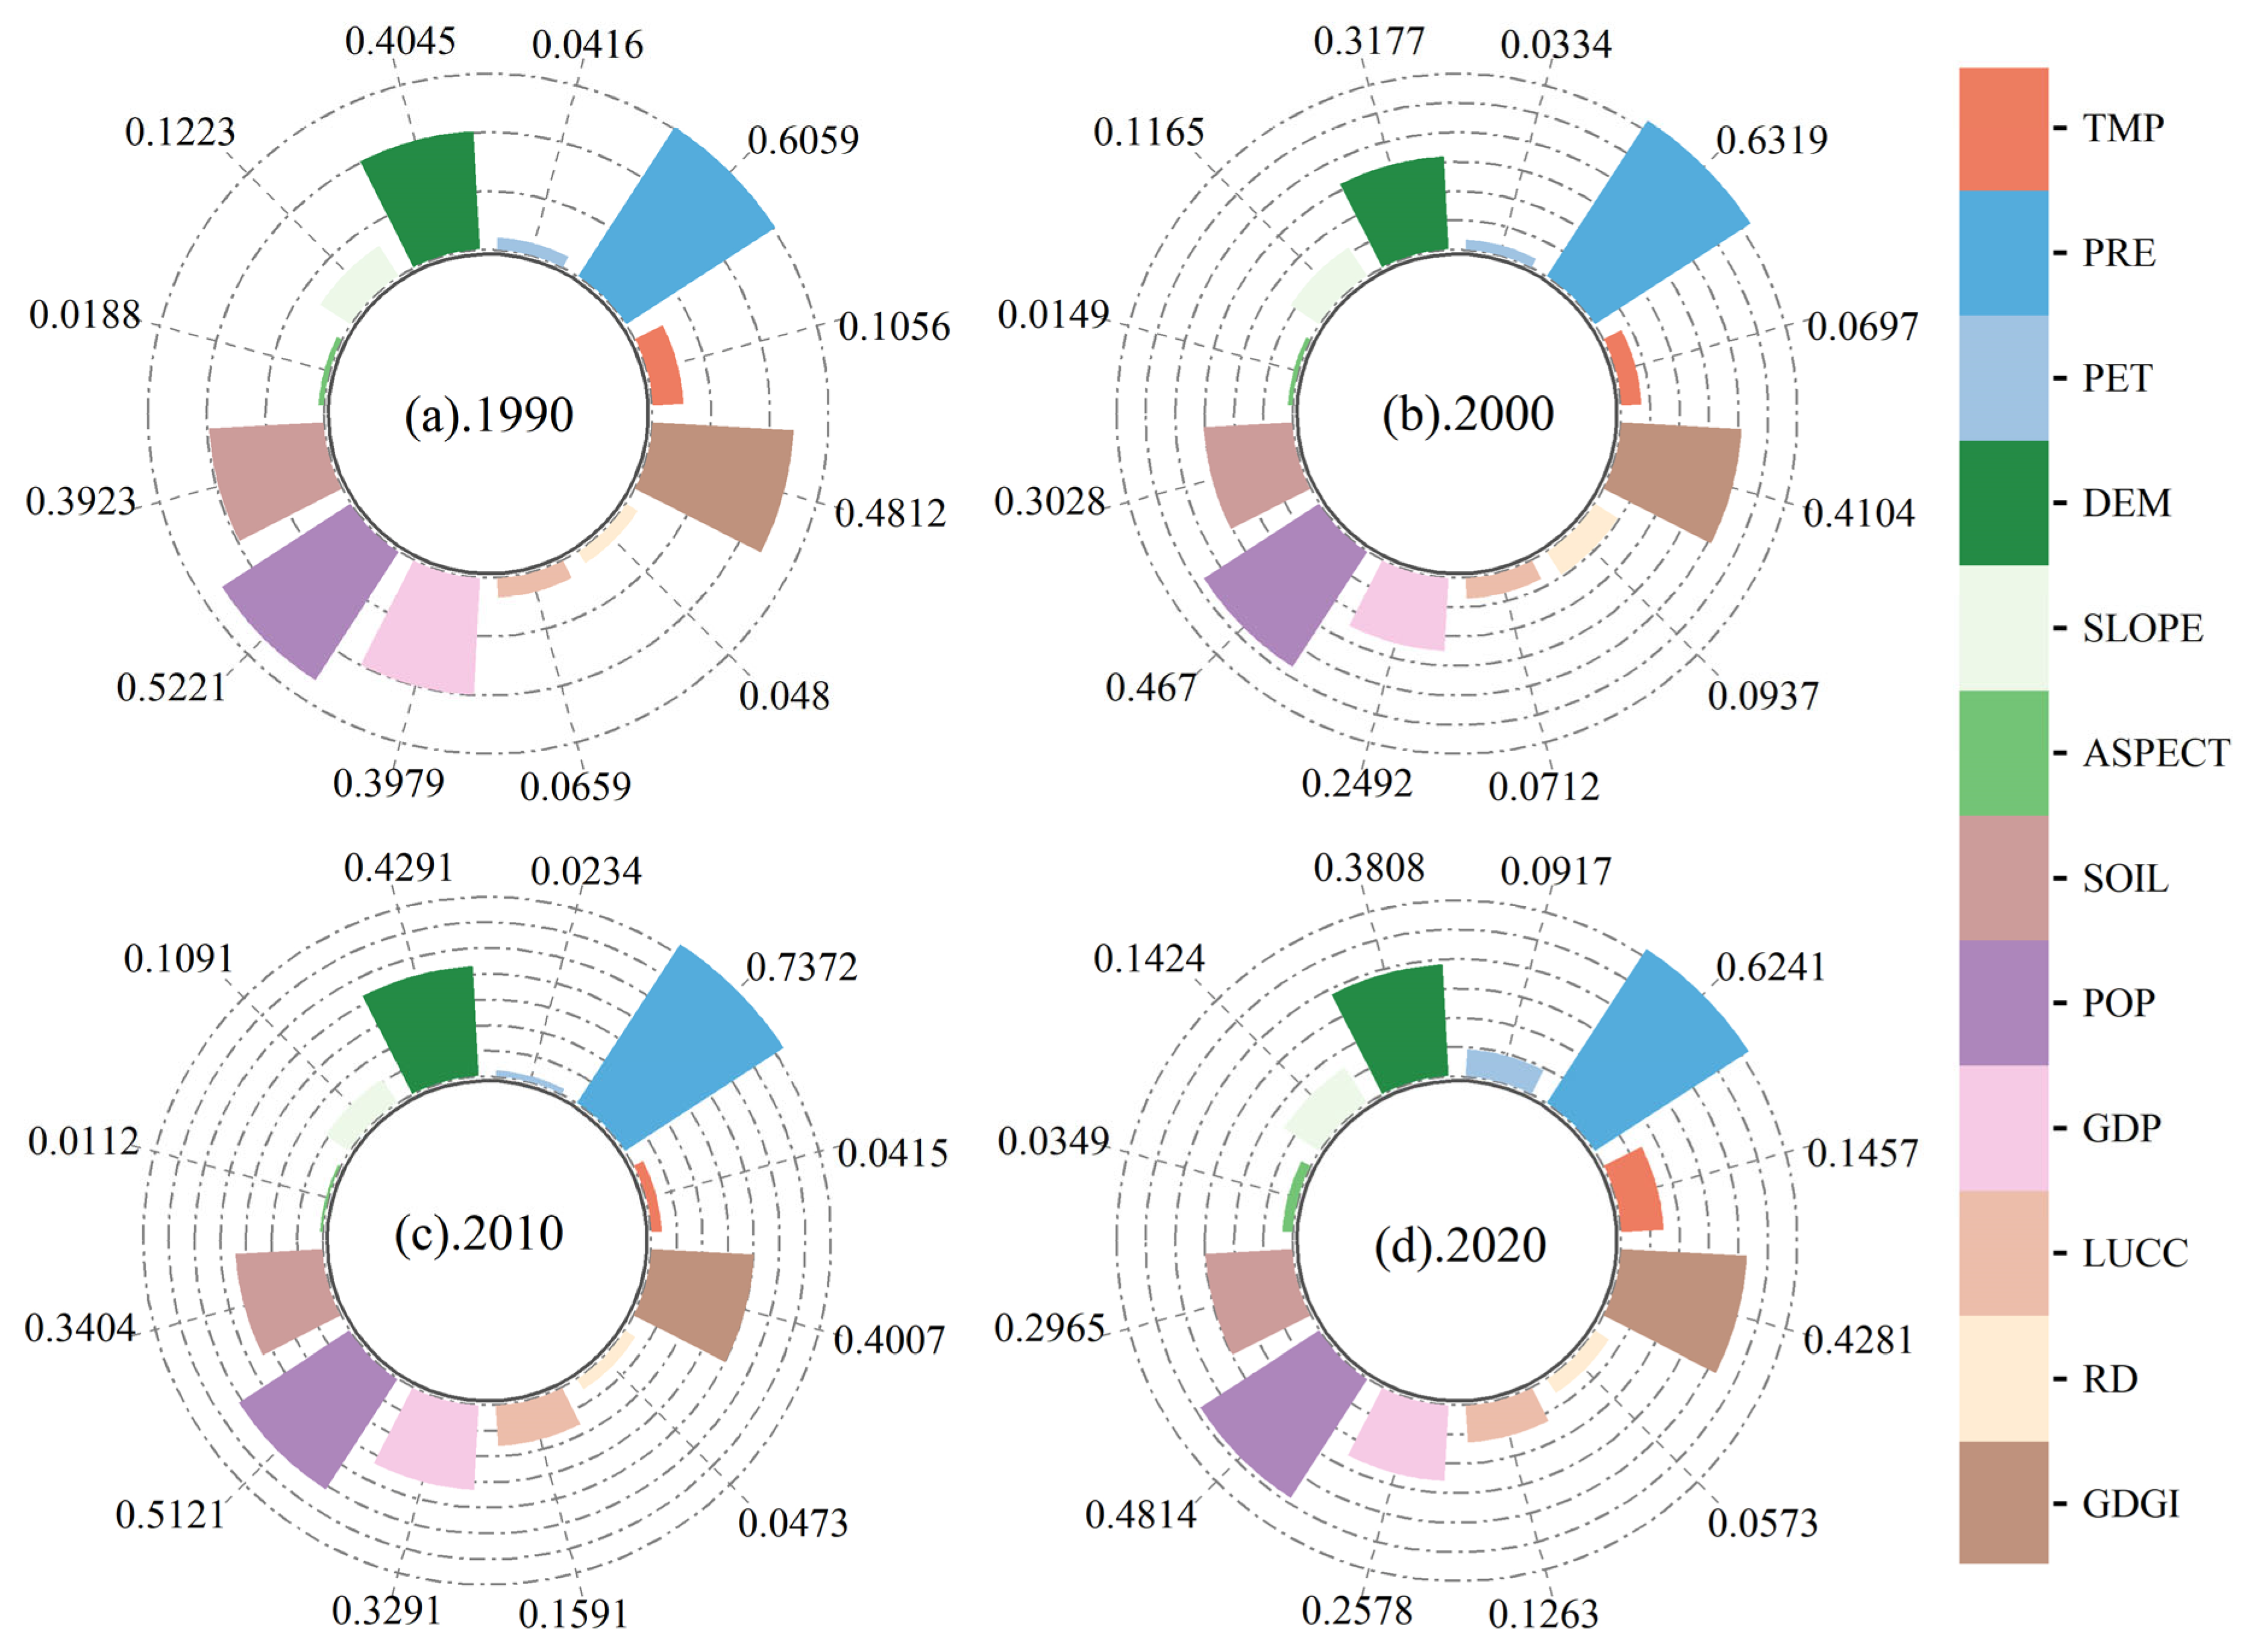
As illustrated in Figure 5, grassland degradation on the QTP results from both natural conditions and human activities, with natural factors exerting a dominant influence. Over time, however, the effect of natural factors wanes, while human-induced impacts intensify. Among the assessed factors, precipitation consistently exhibits a q-value exceeding 0.6 across all four periods, establishing it as the primary driver of degradation. Grazing intensity, population density, and GDP each have q-values above 0.40, confirming their roles as significant contributors to grassland degradation. Conversely, other factors, with q-values below 0.20, have a limited impact on the spatial heterogeneity of grassland vegetation. Thus, precipitation remains the predominant natural driver, while population density and grazing intensity are critical anthropogenic drivers. Elevation also emerges as a key topographic factor influencing these patterns.

3.2.2. Impact of Factor Interactions on Grassland Depletion

Grassland Depletion is not caused by a single factor but rather results from the interwoven effects of natural factors and human activities. The interaction detection module of the Geographical Detector provides a robust tool for uncovering this causal relationship. As shown in Figure 6, the interaction effects between natural and anthropogenic factors demonstrate both nonlinear enhancement and bivariate enhancement. Among the 12 pairs of interacting factors analyzed, the majority exhibit nonlinear enhancement, indicating that Grassland Depletion arises from the combined influence of multiple factors, where the joint effects surpass the impact of any individual factor.
The most significant interactions involve precipitation with other variables, particularly with population density, grazing intensity, and elevation, yielding q-values of 0.796, 0.767, 0.752, and 0.745, respectively. These values are notably higher than those observed for other factor combinations, underscoring the dominant role of precipitation as the primary natural driver. Additionally, significant interactions are observed between population density and grazing intensity with other influencing factors, highlighting the critical role of human activity intensity in exacerbating Grassland Depletion on the QTP. Given the uncontrollable nature of precipitation, strategies for mitigating and restoring degraded grasslands should focus on establishing suitable grassland protection zones. These zones could be instrumental in reducing the impacts of population mobility and managing grazing intensity. Furthermore, the implementation of rotational grazing systems, such as seasonal grazing, would help alleviate the irreversible degradation caused by excessive and continuous grazing pressure.
The most significant interactions involve precipitation with other variables, particularly with population density, grazing intensity, and elevation, yielding q-values of 0.796, 0.767, 0.752, and 0.745, respectively. These values are notably higher than those observed for other factor combinations, underscoring the dominant role of precipitation as the primary natural driver. Additionally, significant interactions are observed between population density and grazing intensity with other influencing factors, highlighting the critical role of human activity intensity in exacerbating Grassland Depletion on the QTP.

3.2.3. Effects of Individual Factors on Grassland Depletion and Restoration Across Different Ranges

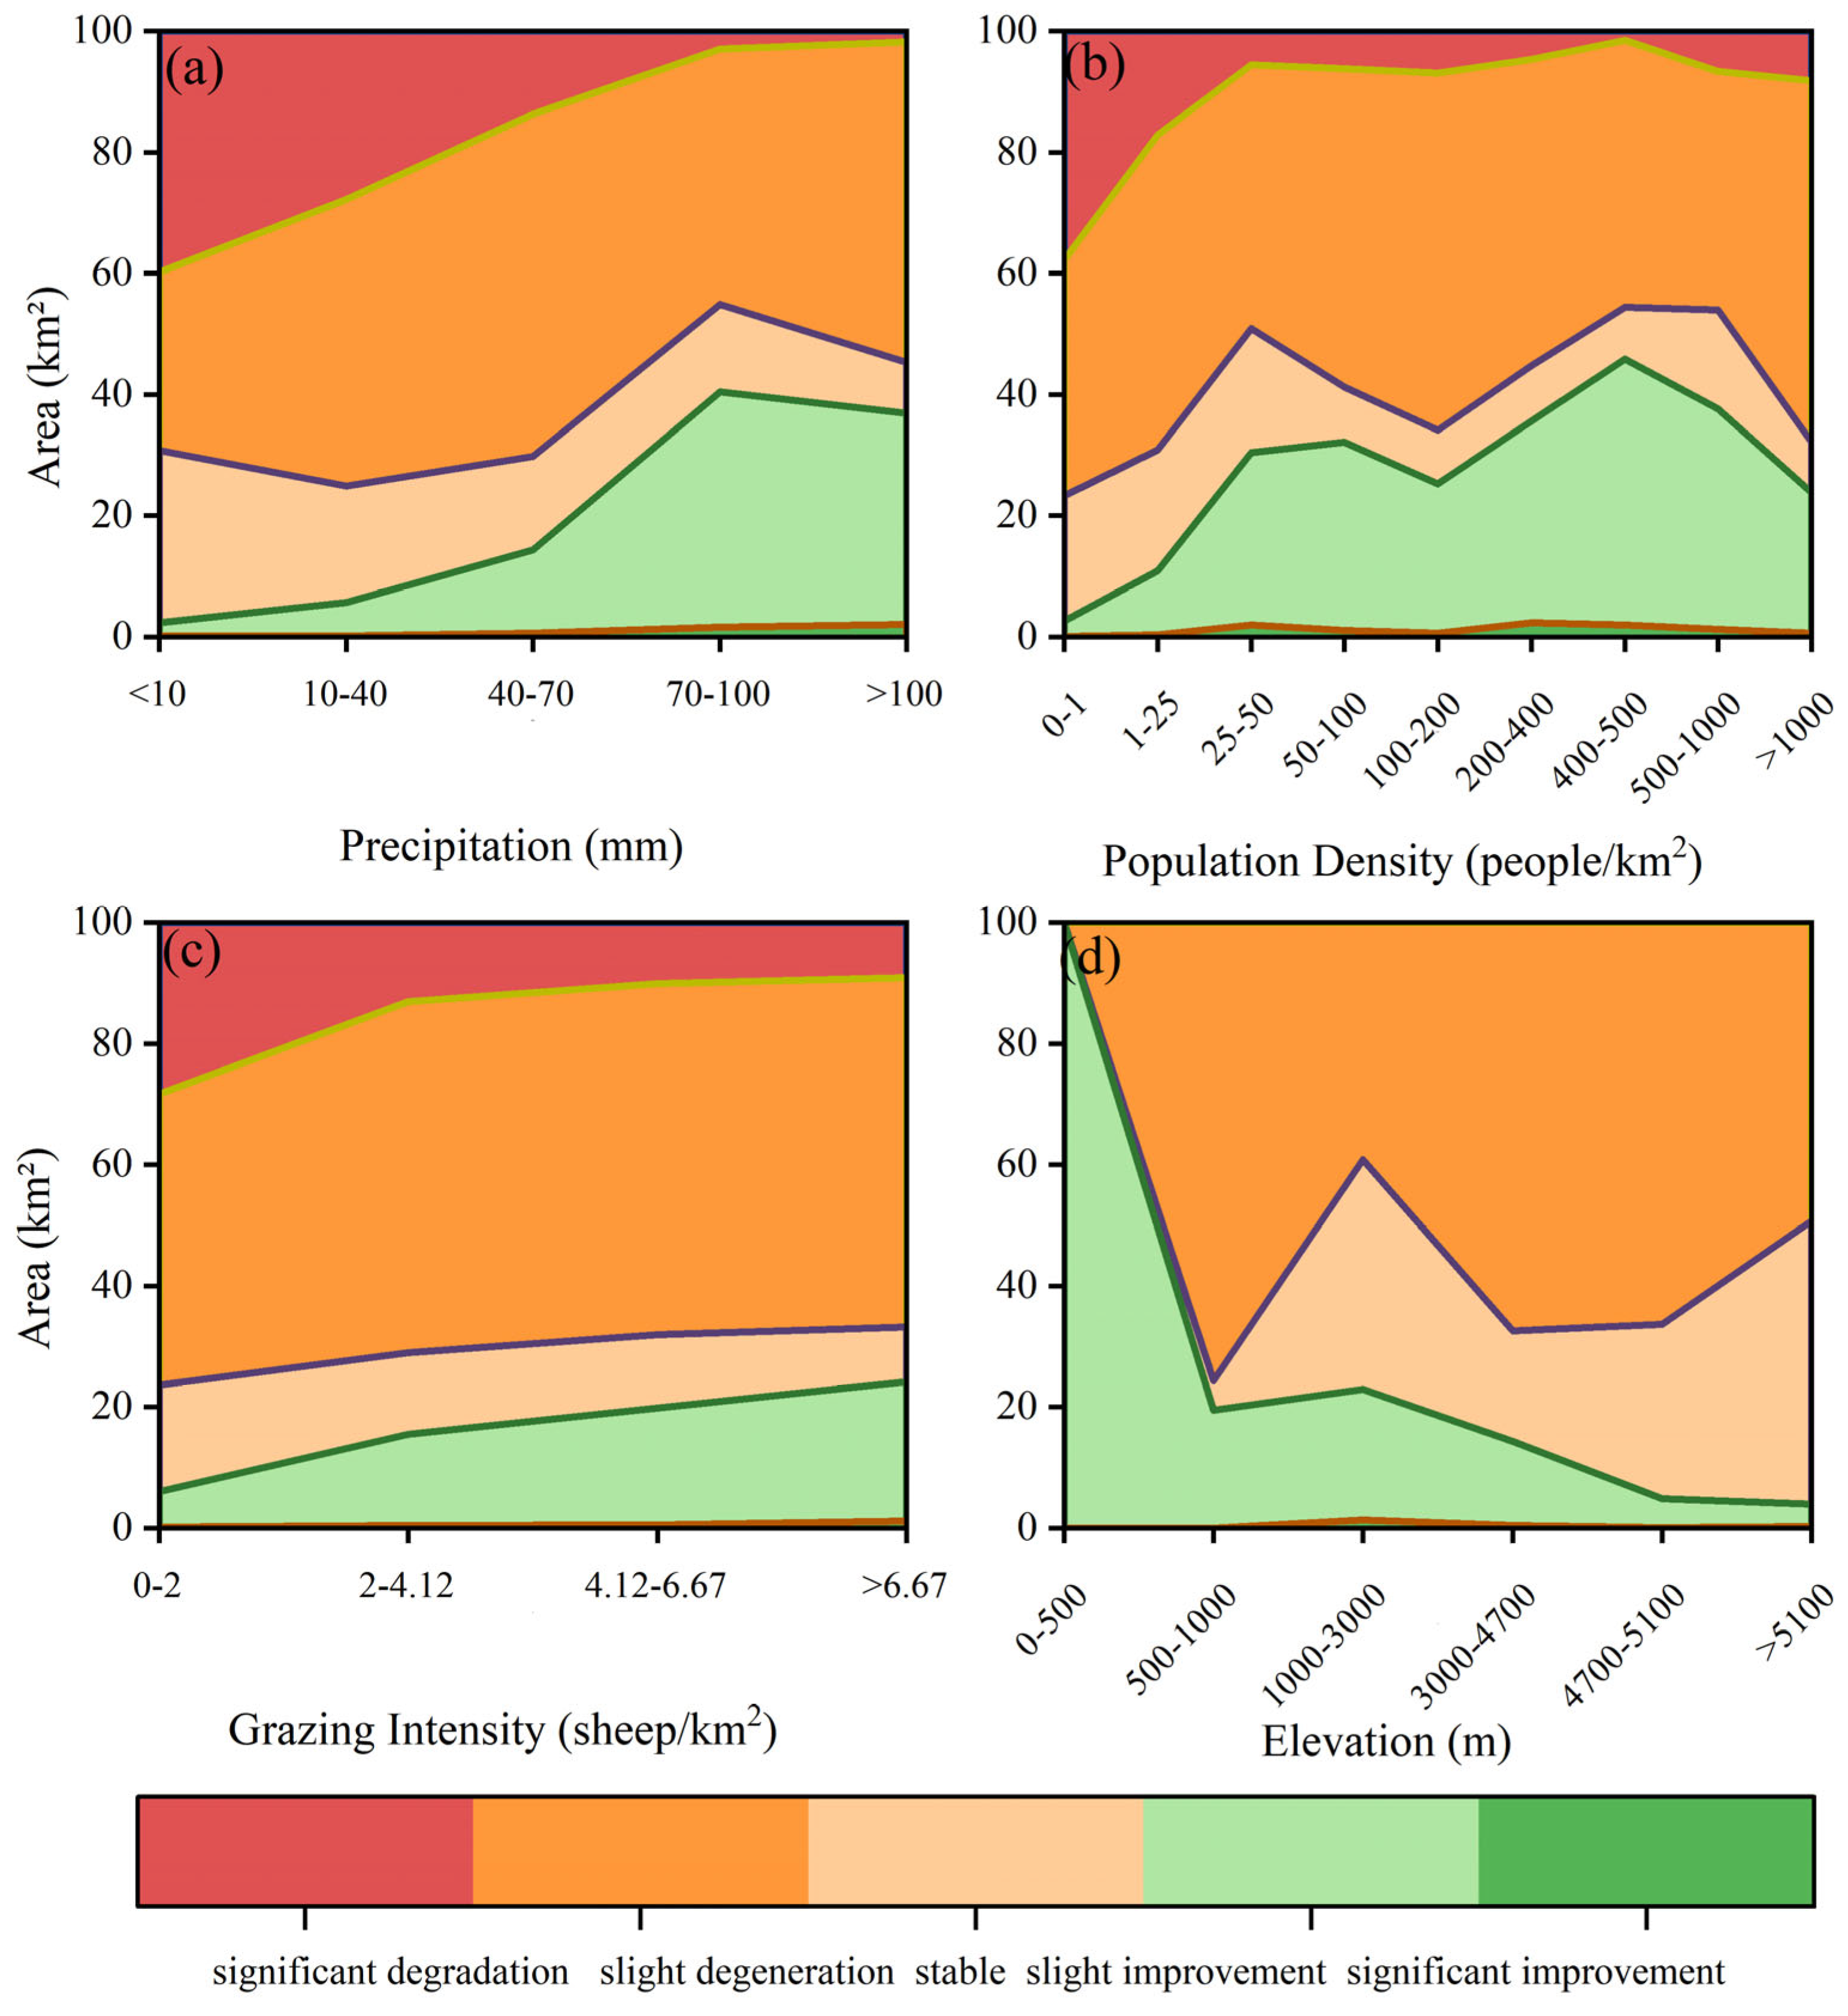
Grassland Depletion and restoration on the QTP occur almost simultaneously. Annual average precipitation has both positive and negative effects on Grassland Depletion and restoration. As precipitation gradually increases, the restoration rate of grasslands significantly exceeds the degradation rate. However, when precipitation exceeds 100 mm, this effect diminishes markedly, with the rates of degradation and restoration becoming almost balanced. The most favorable precipitation range for grassland restoration is between 10 and 70 mm, where the restoration area reaches 857,906 km2. Population density and grazing intensity exhibit notable similarities in their effects on grasslands, both showing an initial increase followed by a decrease in their impact on degradation and restoration. When population density is between 0 and 25 people per square kilometer, the area of restored grassland is maximized, reaching 1,063,294 km2. For grazing intensity, the optimal range is 0–4.2 sheep per square kilometer, with a maximum restoration area of 902,853 km2. Elevation primarily affects grassland in mid-to-high altitude regions. In low-altitude areas, Grassland Depletion on the QTP is minimal. However, as elevation rises to approximately 3000 m, significant characteristics of both degradation and restoration emerge. The optimal elevation range for grassland restoration is between 3000 and 5100 m, with a restoration area of 879,564 km2 (Figure 7).

3.2.4. Effects of Combined Precipitation and Other Factors on Grassland Depletion and Restoration Across Different Ranges

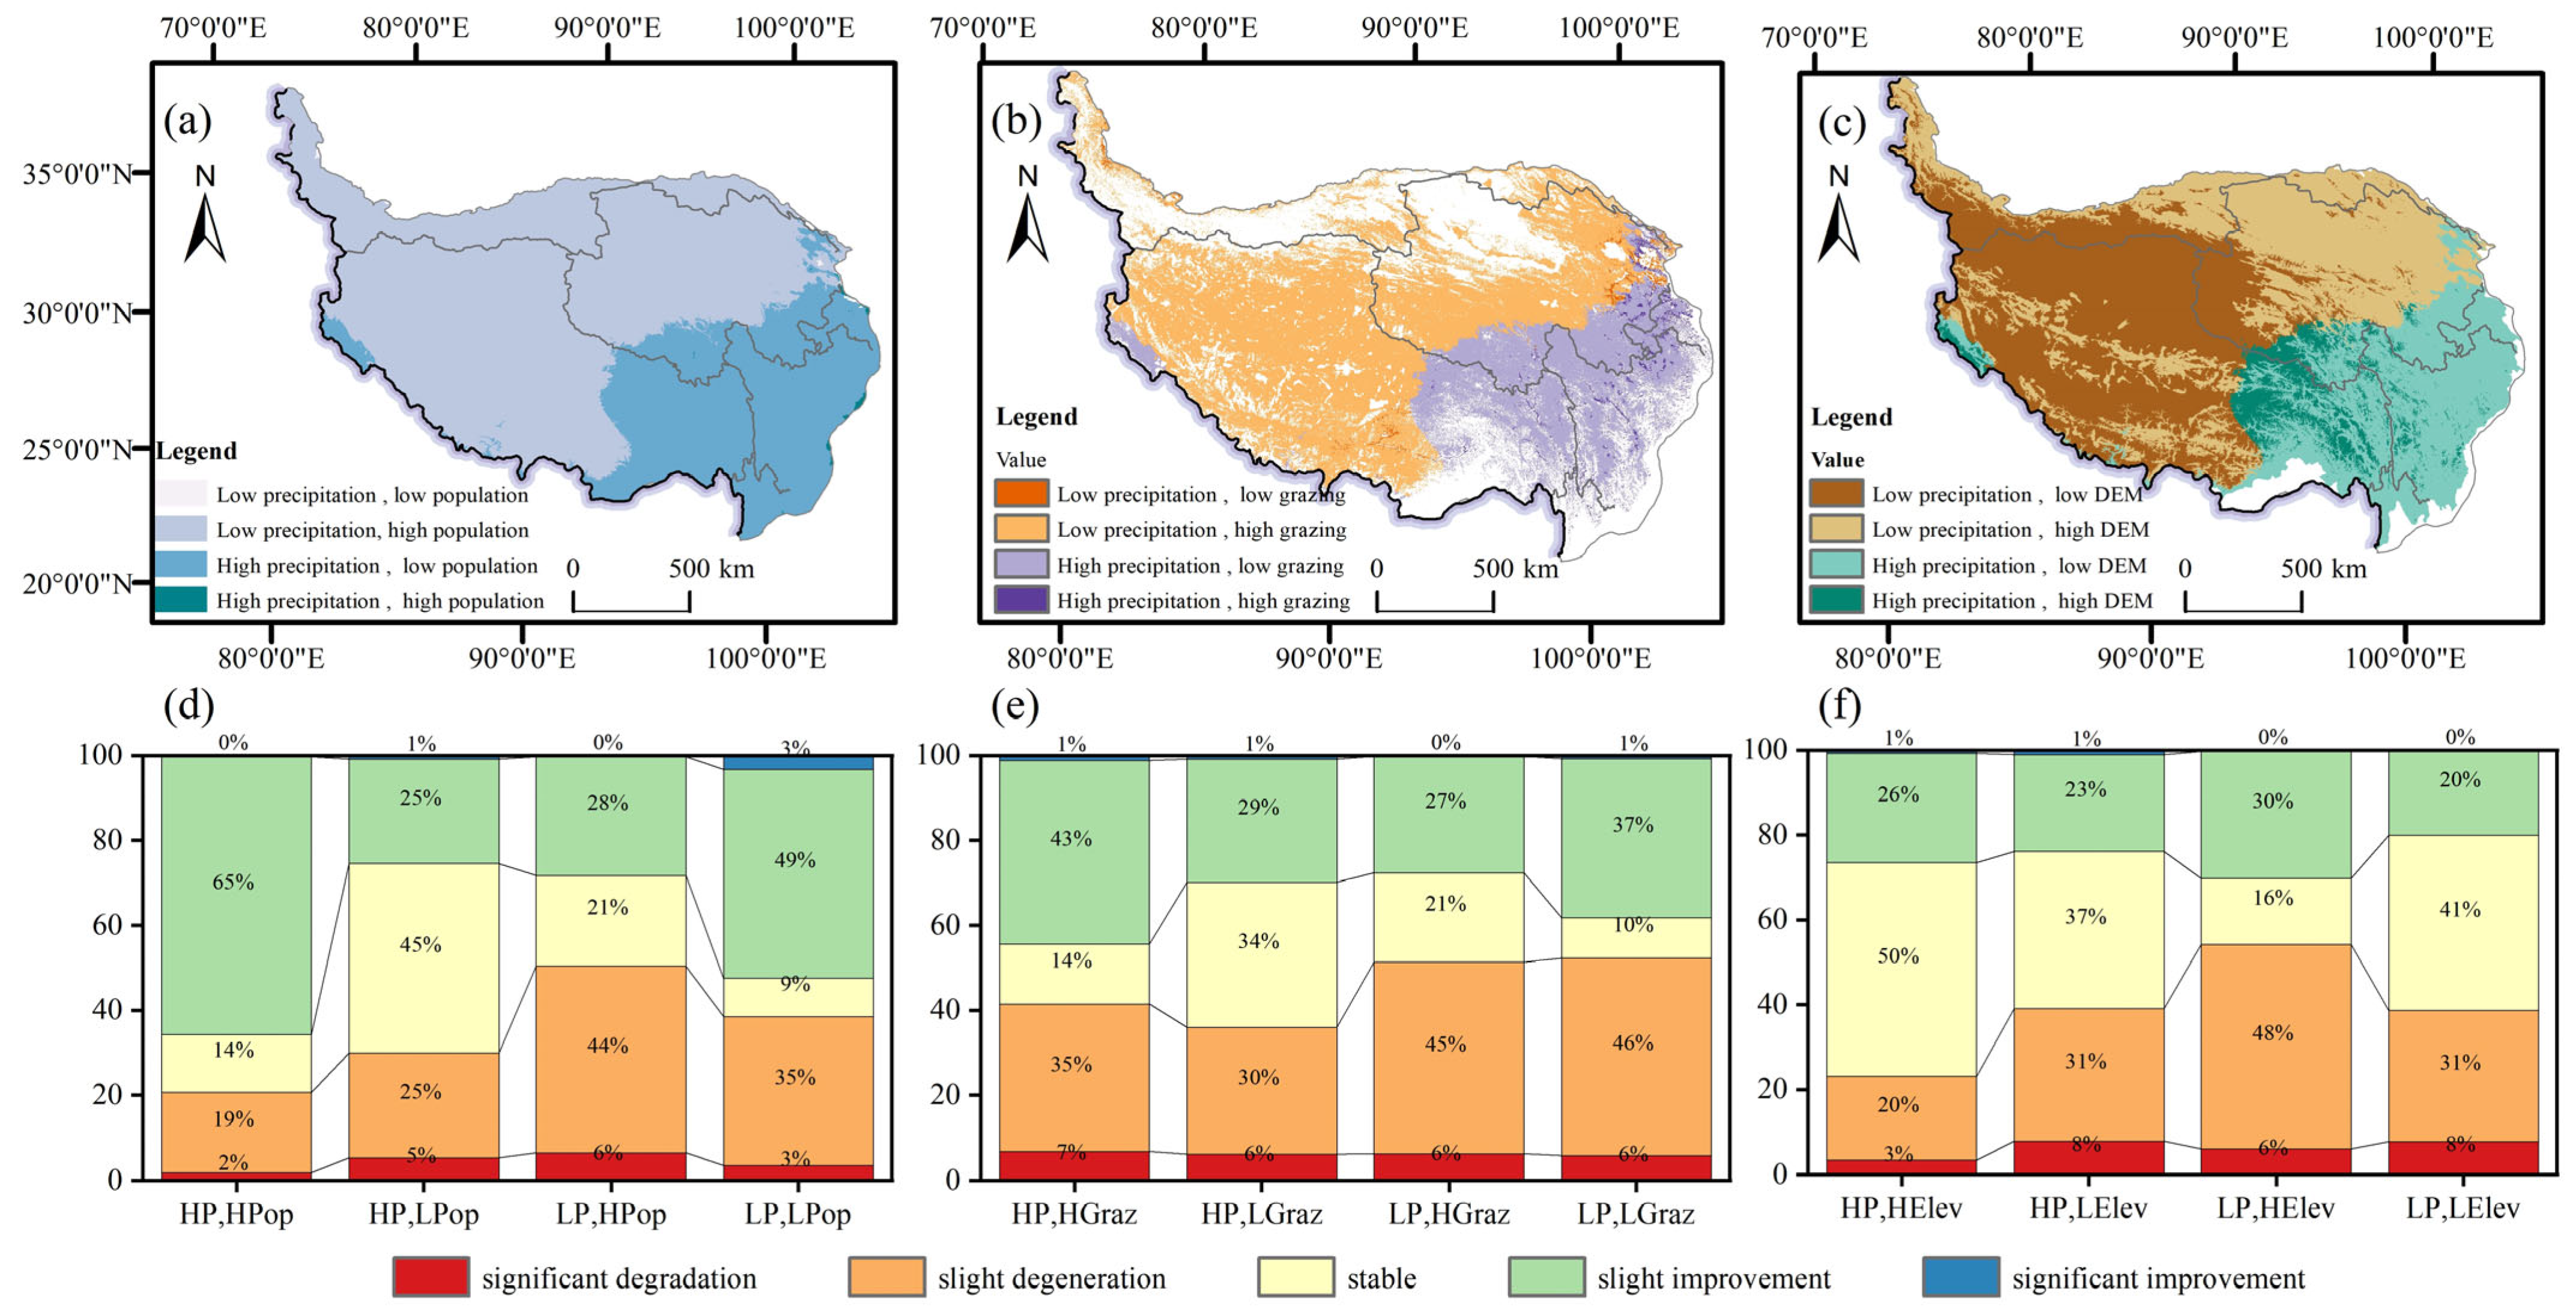
To further investigate the mechanism by which precipitation, population density, grazing intensity, and elevation jointly influence Grassland Depletion, this study designed 12 scenarios: high precipitation with high population, high precipitation with high grazing, high precipitation with high elevation, high precipitation with low population, high precipitation with low grazing, high precipitation with low elevation, low precipitation with high population, low precipitation with high grazing, low precipitation with high elevation, low precipitation with low population, low precipitation with low grazing, and low precipitation with low elevation. These scenarios were used to explore optimal management strategies for grassland growth (Table 7).
The results indicate a high degree of consistency in the coupling mechanism of precipitation with population density and grazing intensity. The combination of high precipitation with low population, and low precipitation with high population, led to 470,699 km2 of Grassland Depletion and 335,120 km2 of restoration. Similarly, the combination of high precipitation with low grazing intensity, and low precipitation with high population, resulted in 387,401 km2 of Grassland Depletion and 272,643 km2 of restoration. In terms of precipitation and elevation, high precipitation combined with high elevation, and high precipitation with low elevation, are significant coupling factors contributing to Grassland Depletion. In high precipitation and high elevation areas, the grassland restoration rate exceeds that of other areas, with 122,574 km2 restored compared to 106,596 km2 degraded. Under the objective conditions of precipitation and elevation, reducing population density and grazing intensity has become an essential strategy for Grassland Depletion mitigation and restoration. By limiting the population within grassland priority conservation areas to below 500 people/km2 and controlling grazing intensity to less than 4.12 sheep/km2, while establishing specific ecological suitability zones and implementing a “grassland-based grazing” approach, substantial improvements in grassland restoration can be achieved (Figure 8).

3.3. Analysis of Grassland Depletion Transitions Driven by Mechanisms

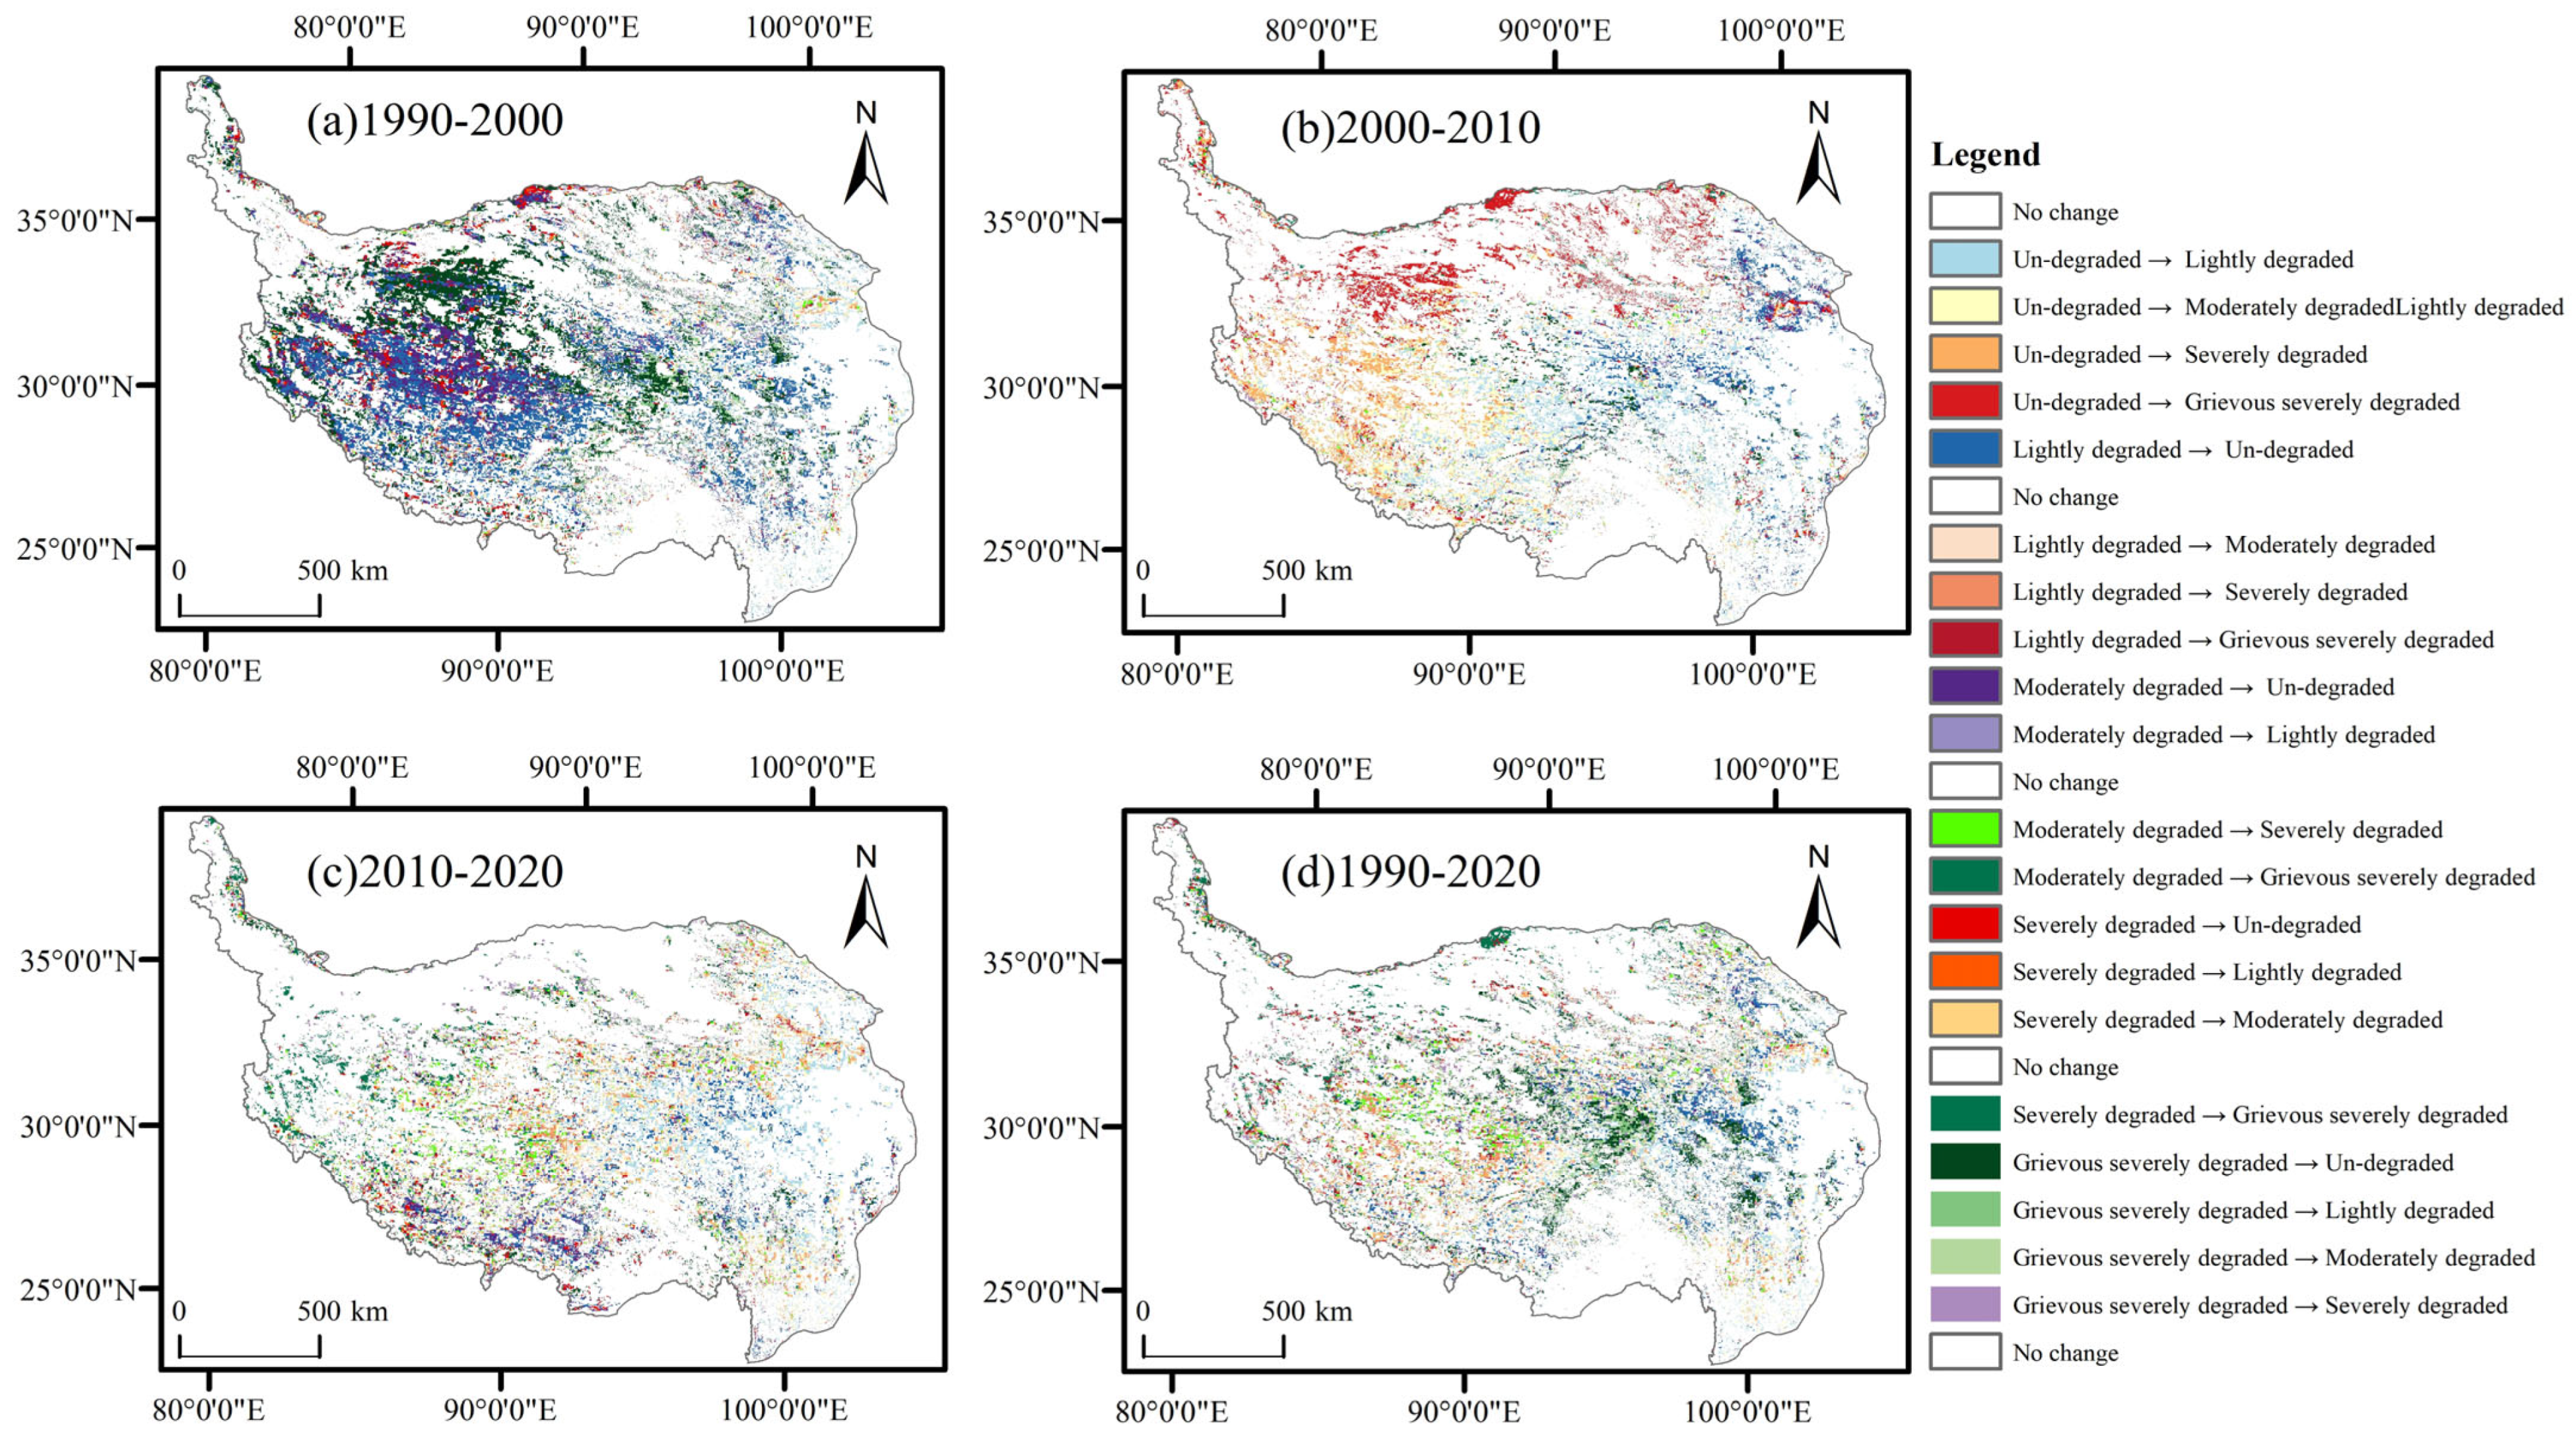
Based on a full lifecycle investigation of Grassland Depletion and quantification of driving mechanisms, the study reveals that, under the combined pressures of natural factors (represented by precipitation) and human activity intensity, grassland has deviated from its original growth foundation, leading to progressive degradation in its growth processes. This degradation primarily manifests as internal type transitions within Grassland Depletion categories. To better understand these transitions, the study employed a transfer matrix approach. By calculating the changes between different types of Grassland Depletion over four periods from 1990 to 2020, and comparing actual transition values with theoretical values, we established rules for determining Grassland Depletion type transitions. This approach provides a clearer understanding of the systematic process of Grassland Depletion dynamics. The results indicate that grassland transitions are complex, with spatial distribution varying significantly across different periods. As shown in Figure 3 and Figure 4 during the 1990–2000 period, the area of undegraded grassland was approximately 309,640 km2, with transitions to severely degraded and grievously severely degraded areas totaling 4662 km2 and 13,691 km2, respectively. In the 1990–2010 period, the area of undegraded grassland was approximately 304,241 km2, with transitions to severely degraded and grievously severely degraded areas totaling 74,789 km2 and 109,651 km2, respectively. In the 2010–2020 period, the area of undegraded grassland was approximately 282,185 km2, with transitions to severely degraded and grievously severely degraded areas totaling 31,755 km2 and 11,302 km2, respectively (Figure 9).

3.4. Evaluation and Future Prediction of Grassland Ecological Suitability Zones on the QTP

3.4.1. Indicator Selection

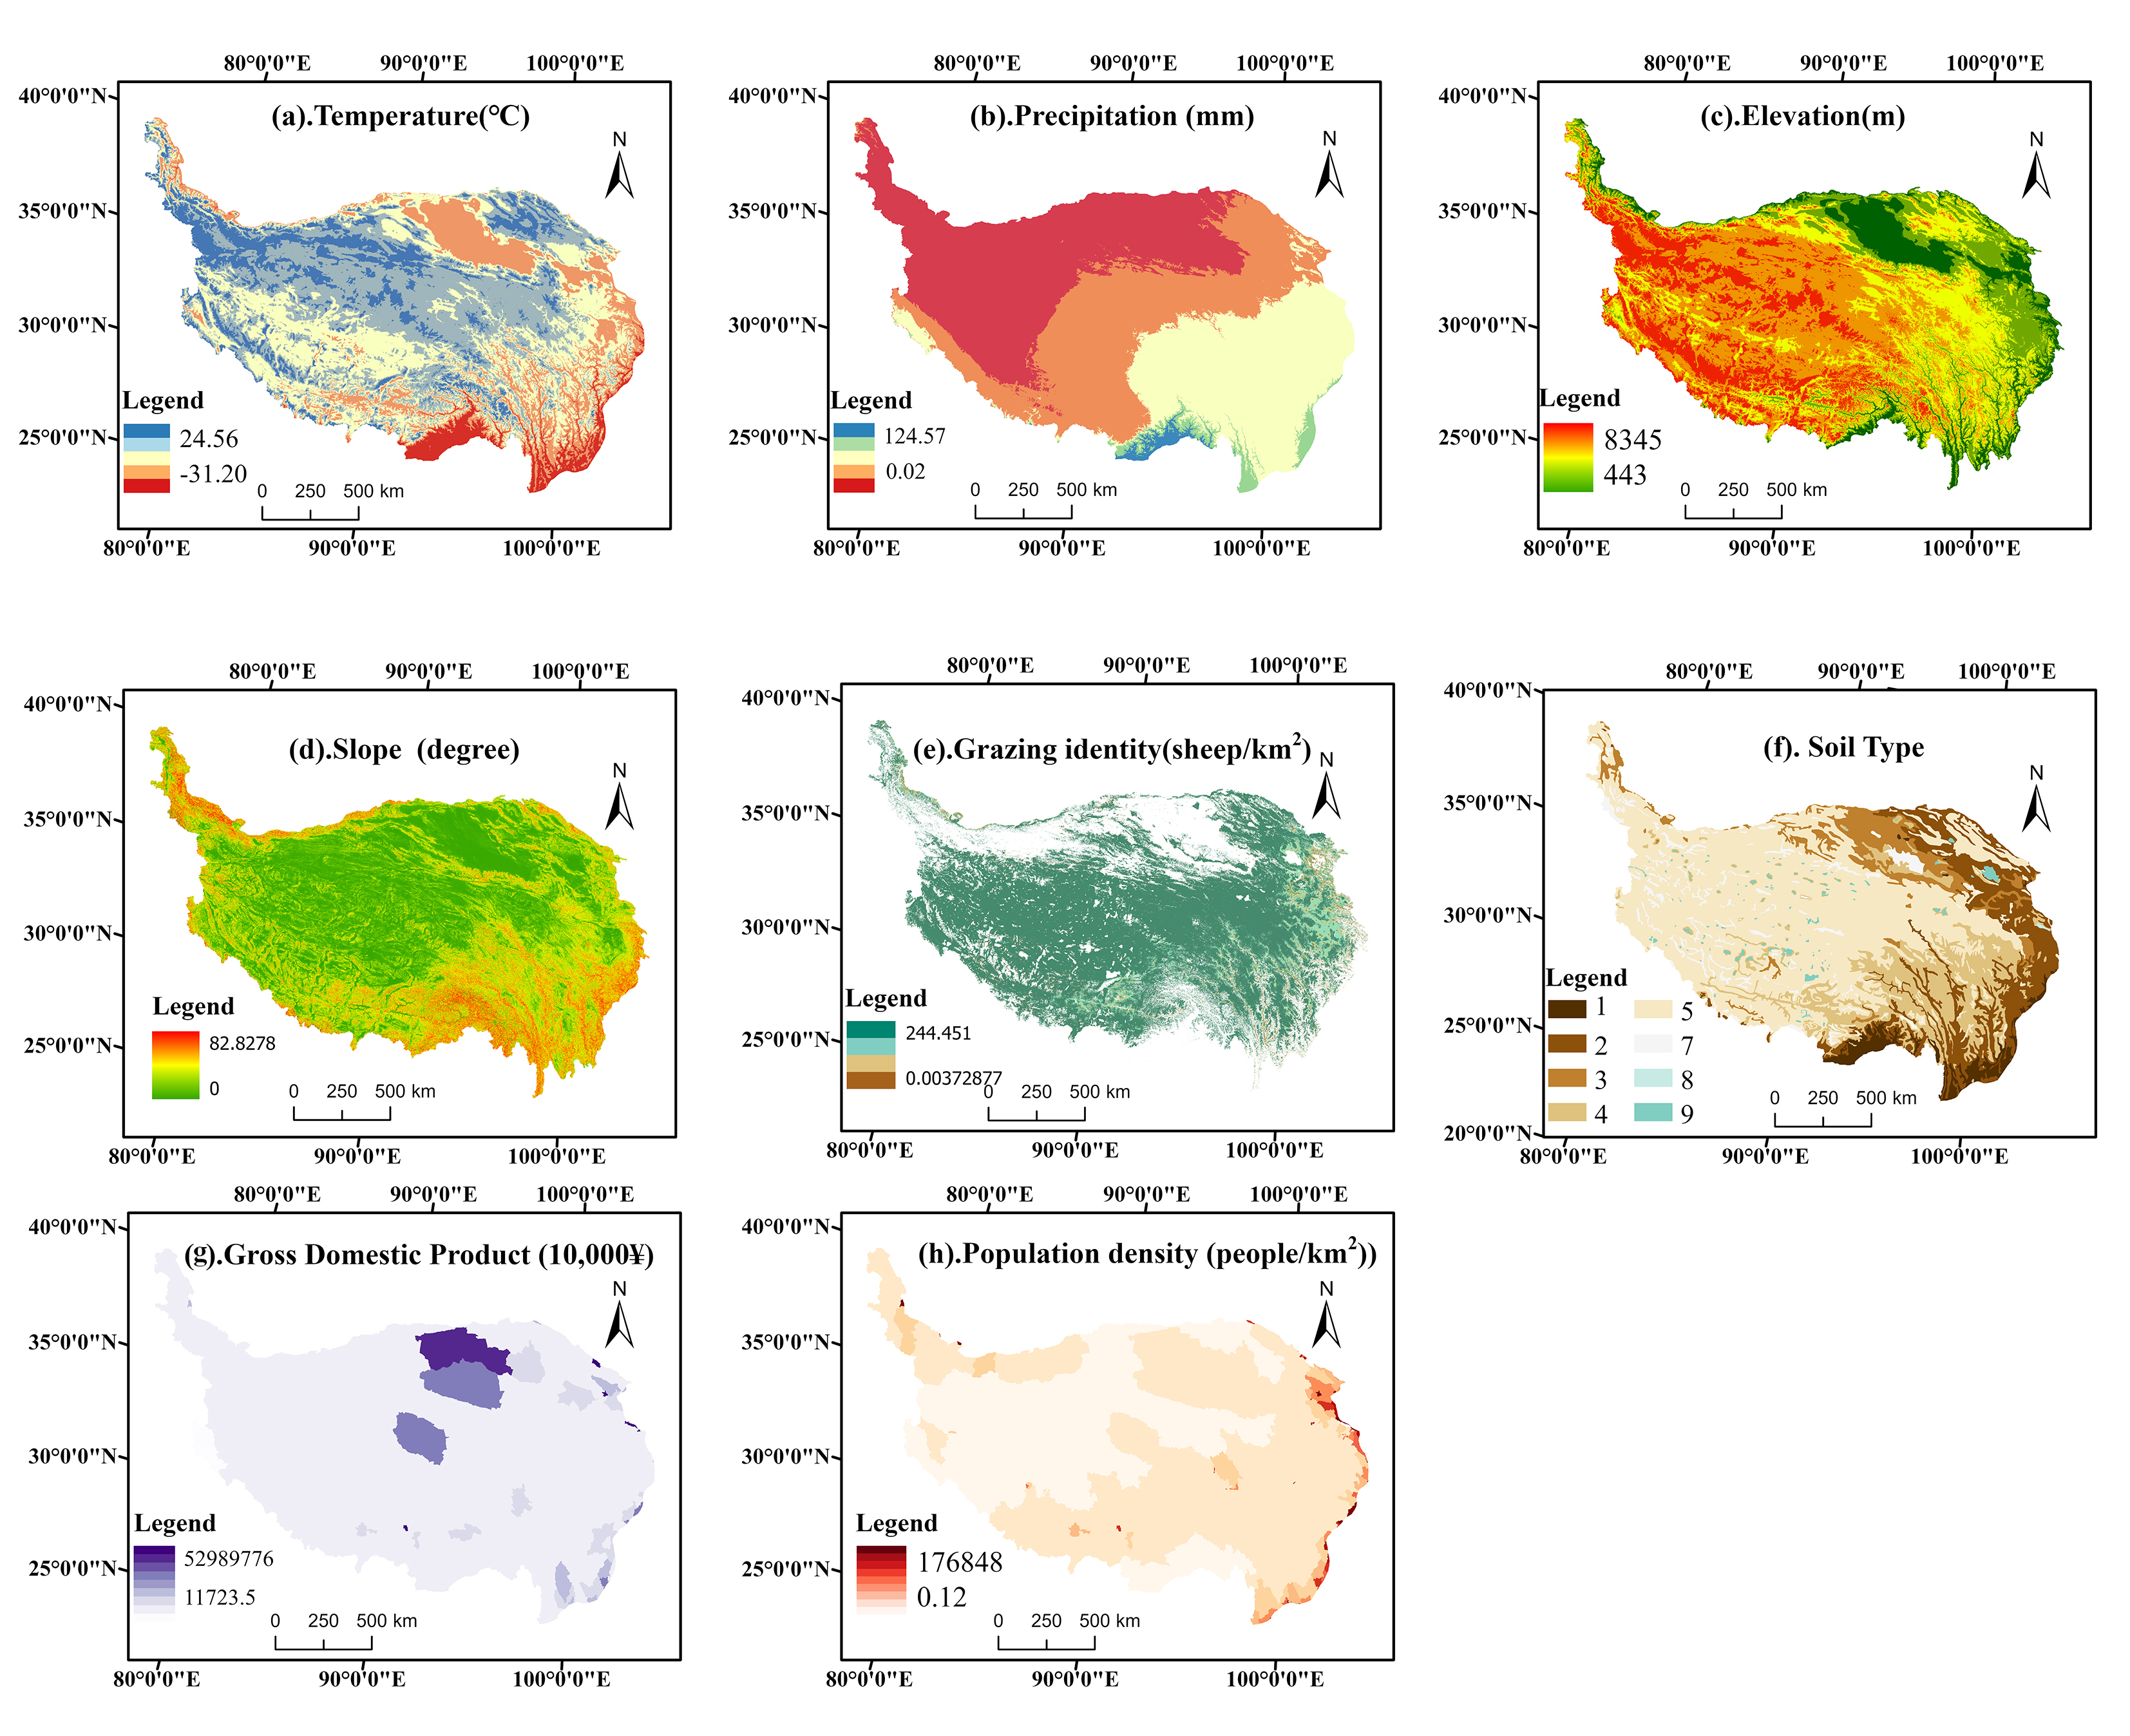
In studying the distribution patterns of Grassland Depletion and the impact of various factors on Grassland Depletion, identifying and establishing suitable grassland zones becomes the foundation for optimizing and protecting Grassland Depletion and implementing restoration projects. Based on the results of the Geodetector, we selected eight indicators with q-values greater than 0.1 to evaluate grassland suitability. This evaluation aims to provide feasible recommendations for local ecological protection. These factors include Temperature (°C), Precipitation (mm), Elevation (m), Slope (degree), Grazing density (sheep/km2), Soil type, Population density (people/km2), and Gross Domestic Product (CNY 10,000). The selected indicators for suitability evaluation are shown in Figure 10:

3.4.2. Comprehensive Evaluation of Grassland Suitability and Spatial Distribution Trends on the QTP

Based on eight selected evaluation factors, the Analytic Hierarchy Process (AHP) was applied to assess and score each factor, calculating their respective weights to accurately represent each factor’s influence on grassland suitability. The indicators were divided into three main categories: climate, topography, and human activity. Each category was structured to score the factors based on their relative influence, ranking the eight factors from 1 to 8. This process minimized subjectivity and ensured objectivity in the results. The quantified and categorized factors were then weighted using AHP, resulting in a comprehensive distribution map of grassland suitability across the QTP (Figure 11).
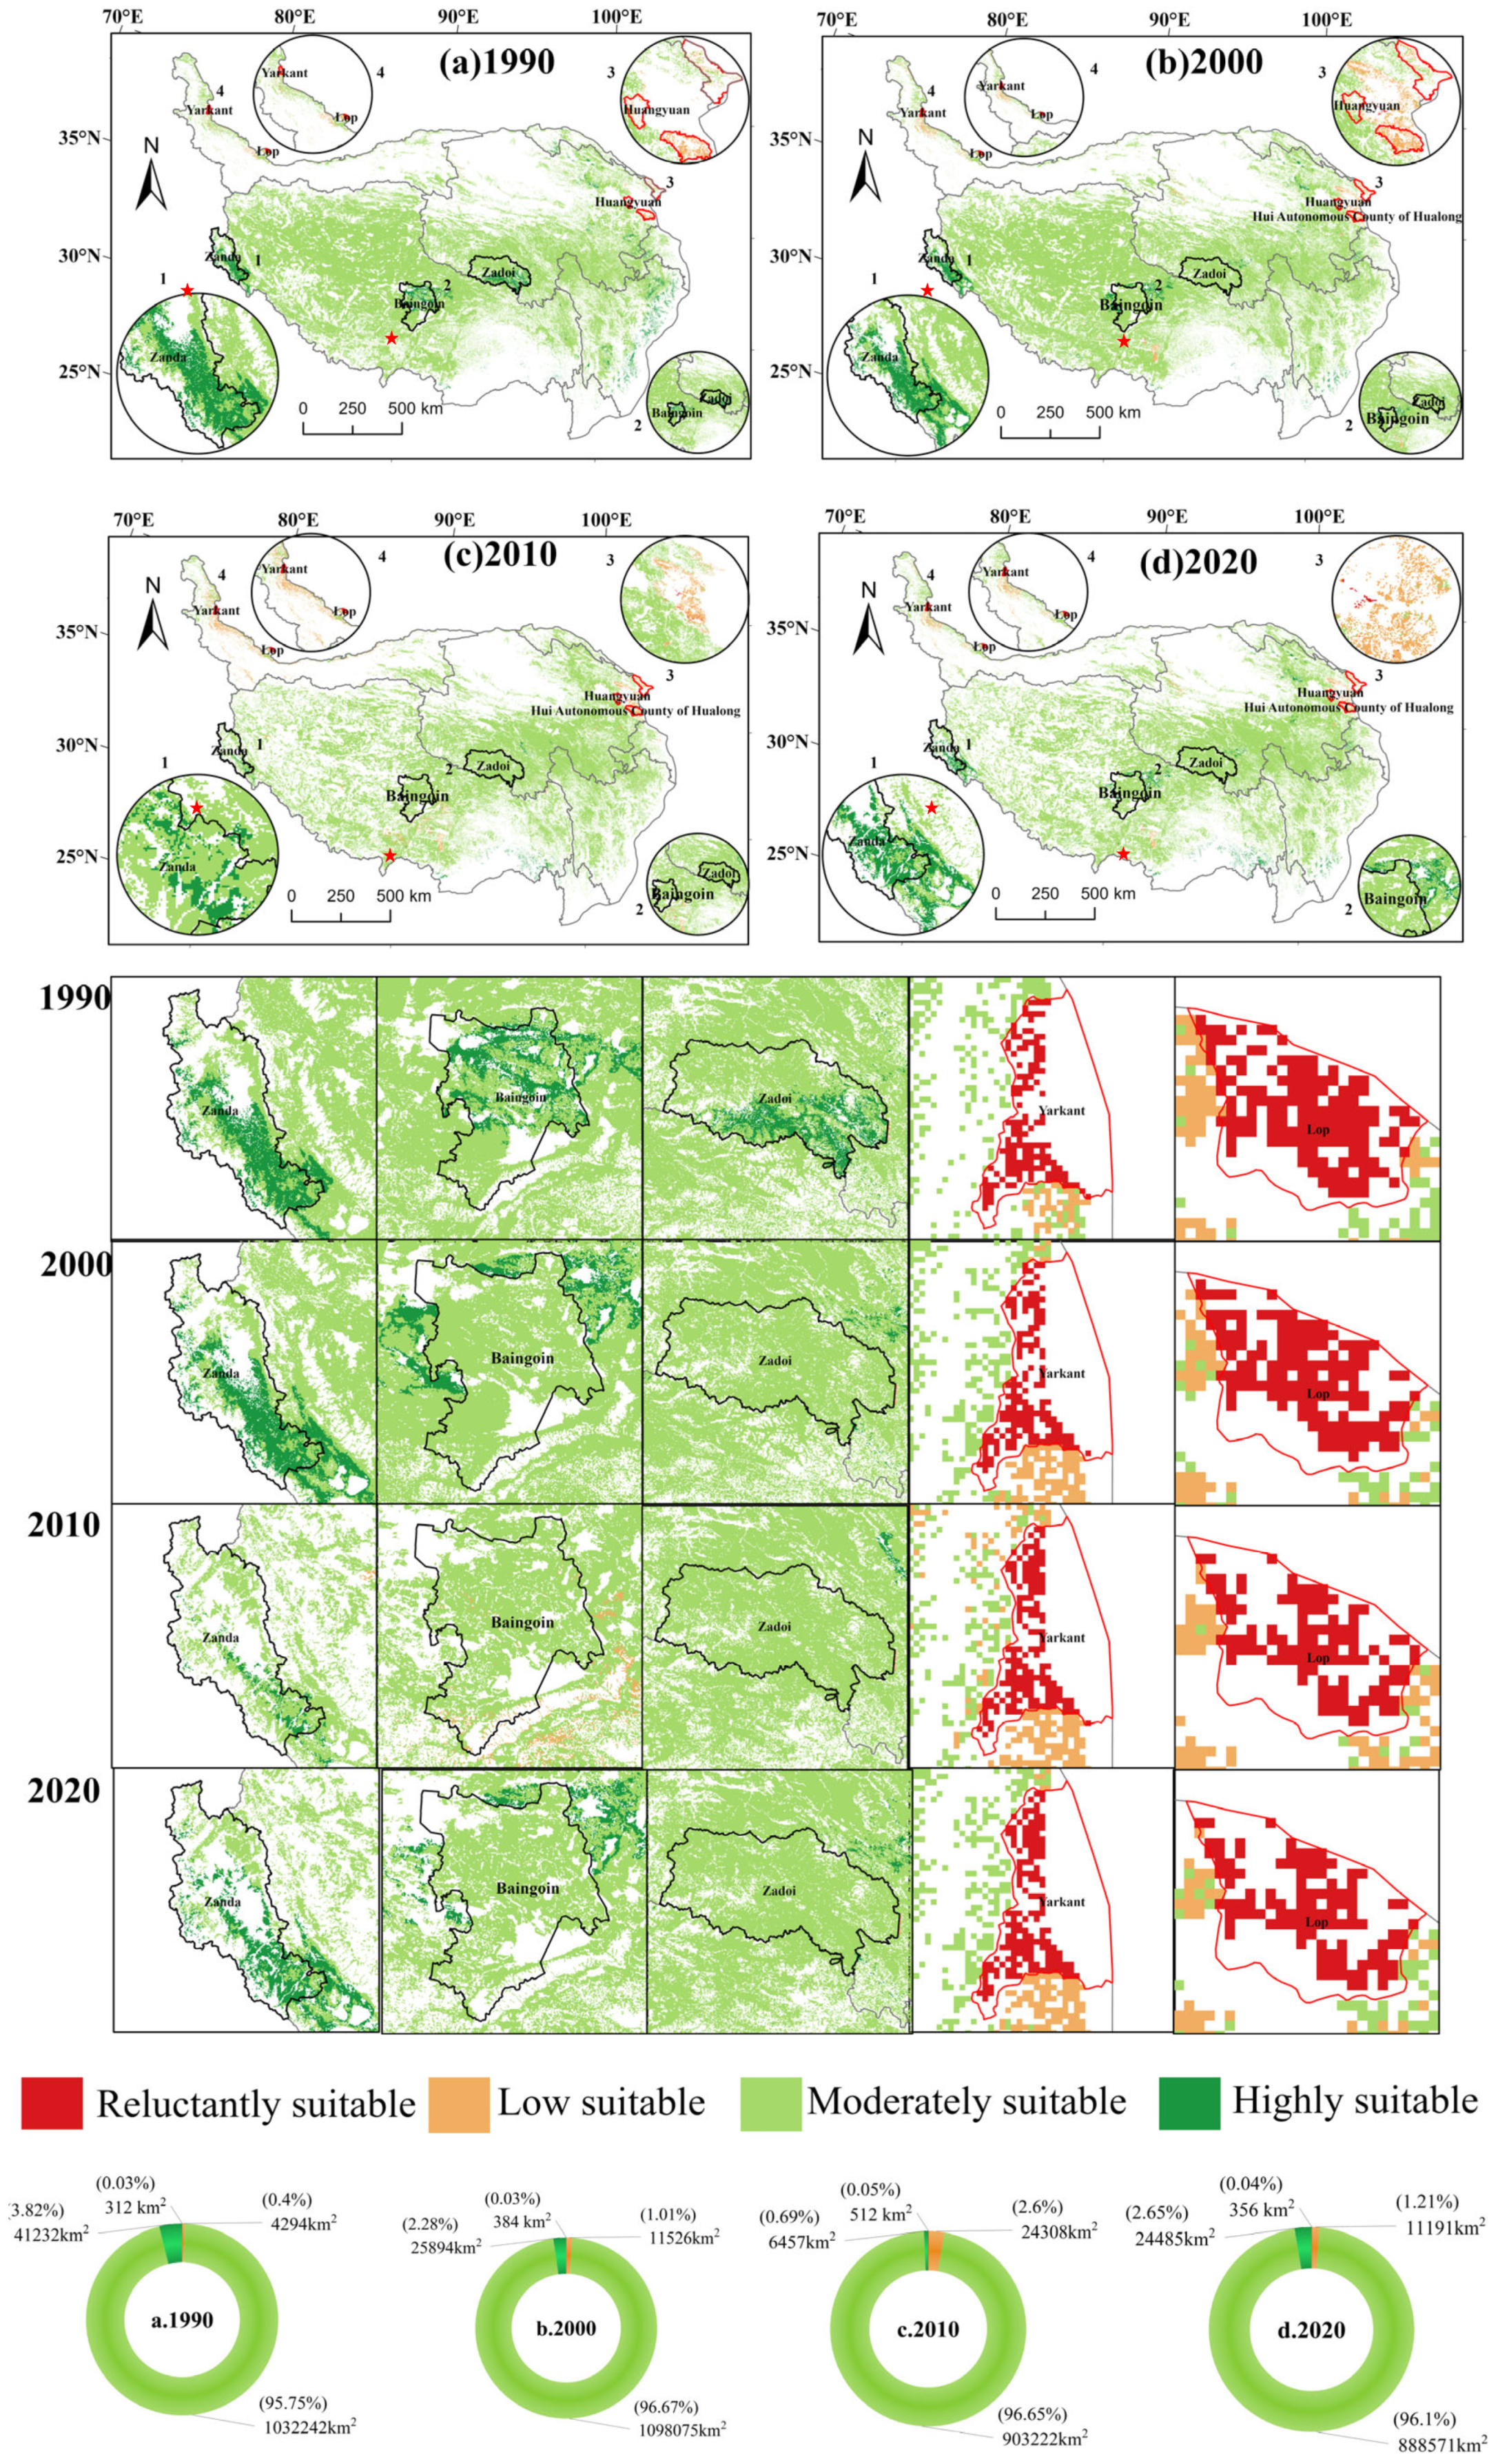
The results indicate that from 1990 to 2020, the QTP’s grassland ecosystem predominantly remained in the “Moderately Suitable” category, covering over 95% of the total grassland area. “Reluctantly Suitable” and “Low Suitable” zones are mainly concentrated along the northwestern and northeastern edges of the plateau. Over the three decades from 1990 to 2020, areas classified as “Reluctantly Suitable” and “Low Suitable” expanded progressively, particularly toward the northern plateau, reflecting the impact of ongoing environmental pressures on Grassland Depletion.
Spatially, “Highly Suitable” zones are concentrated in counties such as Anduo, Baingoin, Zaduo, and Zanda. However, the extent of “Highly Suitable” grasslands declined from 3.82% in 1990 to 2.65% in 2020. Conversely, “Reluctantly Suitable” and “Low Suitable” zones, including counties such as Shache, Huangyuan, Luopu, Tianzhu Tibetan Autonomous County, and Hualong Hui Autonomous County, have expanded from 0.43% in 1990 to 2.65% in 2020.
Future projections indicate a continued reduction in ecologically suitable grassland areas, posing risks to ecosystem stability, carbon sequestration, and regional biodiversity. Establishing designated ecological suitability zones and incorporating these regions into protected areas is crucial for maintaining ecological balance, achieving carbon balance, and supporting carbon neutrality goals. Driven by factors such as precipitation, population density, grazing intensity, and elevation, grassland productivity and ecological function are declining, contributing to a trend toward degradation. These driving factors have intensified the spatial contraction of grassland suitability zones, concentrating suitable areas within specific regions, notably the “Grassland Ecological Suitability Twin-Star Regions” (Baingoin and Zanda Grasslands). These key regions represent some of the plateau’s most resilient ecological zones, making their preservation essential to sustaining the plateau’s overall ecological health.

3.4.3. Future Trends of Grassland Ecological Suitability on the QTP

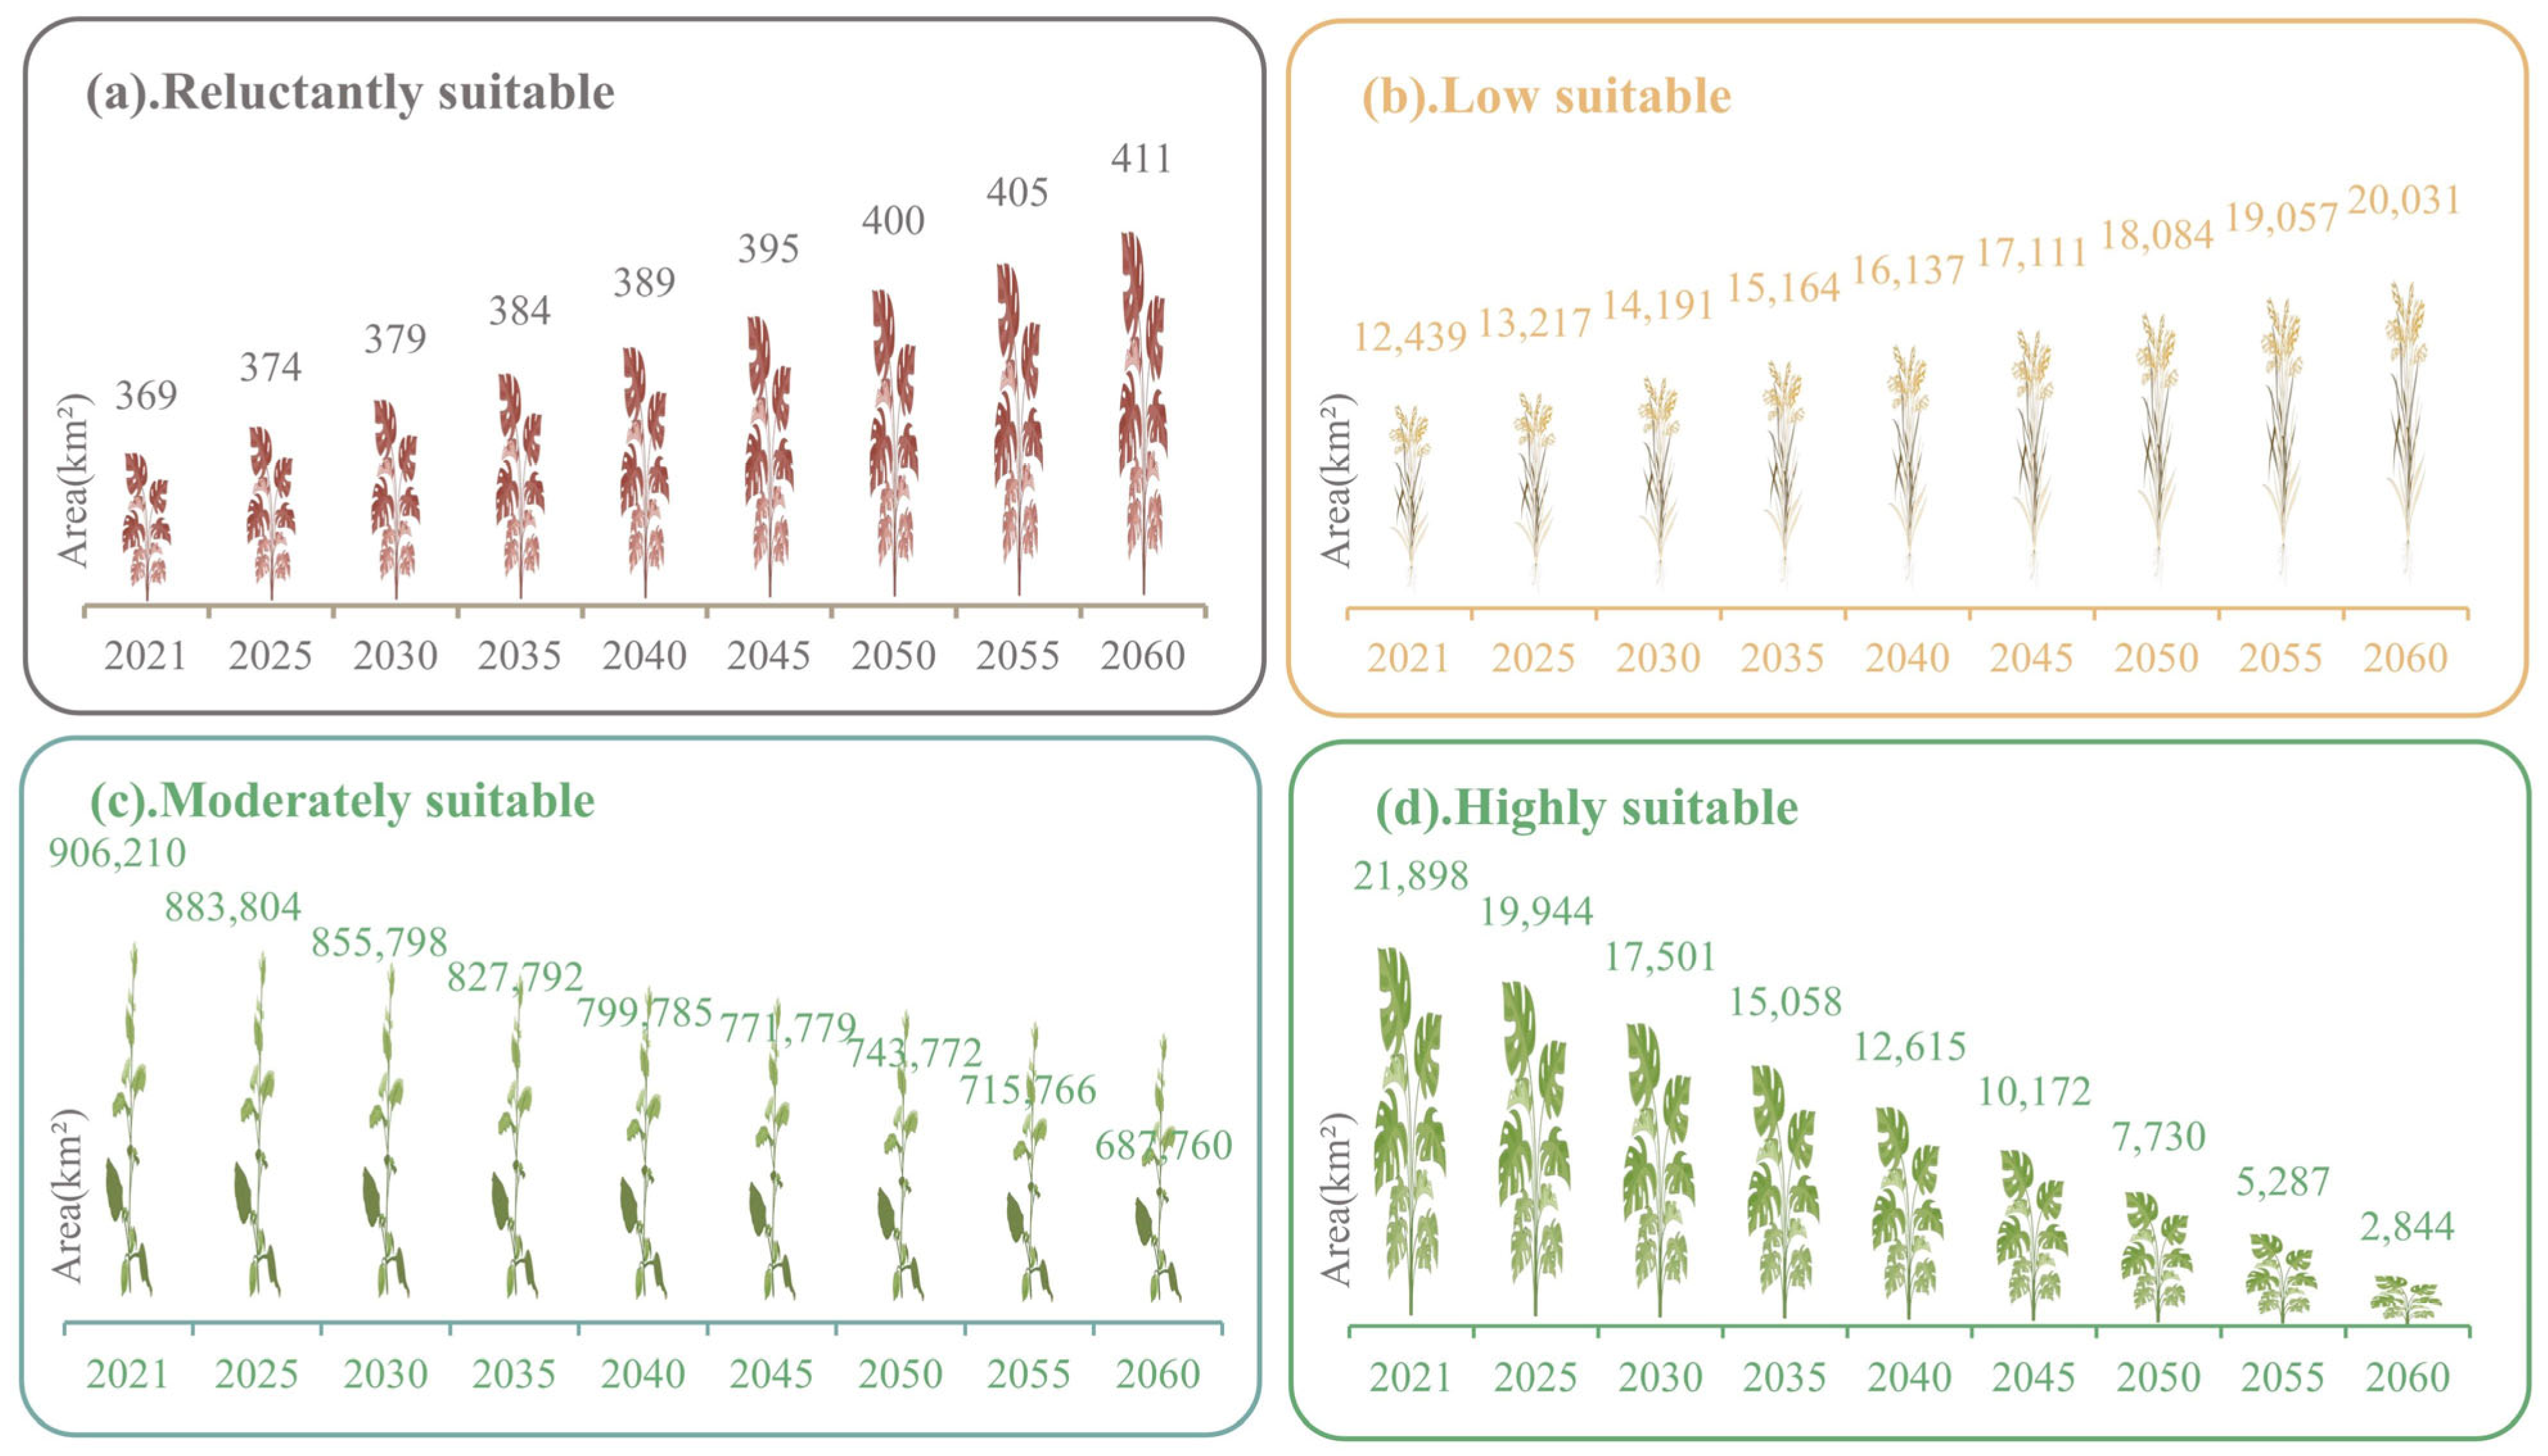
Based on historical trends in grassland ecological suitability, this study employed a linear model to predict the spatial extent of suitable grassland areas for the years 2030 and 2060. The results indicate that, under ongoing climate change and intensified human activities, the areas classified as “Reluctantly Suitable” and “Low Suitable” are expected to expand, whereas “Moderately Suitable” and “Highly Suitable” areas will continue to decline. By 2030, the area highly suitable for grassland ecosystems is projected to shrink significantly to 17,501 km2, with a further reduction to approximately 2844 km2 by 2060. This substantial reduction in suitable grassland areas poses a severe threat to the ecological balance of the Tibetan Plateau, adversely affecting biodiversity, soil stability, and water retention capacity. Additionally, the reduction in highly suitable areas will significantly undermine the region’s potential for carbon sequestration, which is crucial for China to achieve its carbon neutrality and peak carbon targets (Figure 12).

4. Discussion

This study utilized the longest available time-series remote sensing data for the Qinghai–Tibet Plateau, offering significant advantages for assessing the effects of local ecological conservation efforts on grassland restoration. The findings indicate that restoration strategies on the plateau have primarily targeted the mid-term phase, while the early and late phases have received comparatively less emphasis. During the periods 1990–2000 and 2000–2010, the rate of grassland degradation was lower than the rate of restoration. Additionally, the study identified grassland suitability zones across the entire plateau and projected potential habitable areas under future scenarios, providing new insights to inform regional strategies for mitigating grassland degradation.

4.1. Spatiotemporal Distribution Analysis of Grassland Depletion

The research results reveal that the process of Grassland Depletion from 1982 to 2020 can be categorized into three distinct stages, with 1990 and 2005 identified as critical temporal nodes. During the first stage (1990 to 2000), the recovery rate of grasslands exceeded the degradation rate, likely due to improved ecological conditions and reduced anthropogenic pressures. However, this trend reversed in the subsequent periods: from 2000 to 2010 and 2010 to 2020, the degradation rate surpassed the recovery rate, possibly driven by intensified grazing activities, climate warming, and land-use regime shifts [25,50].
Despite these fluctuations, the overall trend from 1990 to 2020 indicates a gradual recovery of grasslands, as the long-term ecological resilience of these systems began to manifest through natural processes and human intervention. This aligns with past findings that suggest improved soil nitrogen and carbon dynamics play a crucial role in supporting plant growth and ecosystem stabilization during grassland recovery [51]. While short-term degradation periods, such as 2000–2010 and 2010–2020, reflect intensified pressures like overgrazing, climate warming, and land-use changes, the broader temporal perspective suggests that ecological restoration efforts, such as grazing restrictions and afforestation programs, coupled with the intrinsic capacity of the ecosystem to regenerate, have contributed to an overall improvement in grassland conditions.
Interestingly, our study identifies the onset of significant degradation as 2006, which is earlier than the 2010 start time reported by other researchers [52,53]. This difference may be attributed to variations in study regions, data resolution, analysis methods, or the timing of human activities and climatic influences.
Overall, these findings underscore the complex interplay of climatic, ecological, and anthropogenic factors driving Grassland Depletion and recovery across the QTP, while offering a refined temporal understanding of its onset.

4.2. Analysis of the Driving Mechanisms of Grassland Depletion

The analysis based on the Geodetector model indicates that precipitation, population density, grazing intensity, and topographic elevation are significant factors affecting Grassland Depletion on the QTP. Moreover, the interactive effects among these factors have a greater impact on degradation than individual factors alone. Specifically, the interactions between precipitation and population density, grazing intensity, and elevation are the most significant, with q-values of 0.796, 0.767, 0.752, and 0.745, respectively. Given the uncontrollable nature of precipitation, strategies for mitigating and restoring degraded grasslands should focus on establishing suitable grassland protection zones. These zones could be instrumental in reducing the impacts of population mobility and managing grazing intensity. Furthermore, the implementation of rotational grazing systems, such as seasonal grazing, would help alleviate the irreversible degradation caused by excessive and continuous grazing pressure.
The influence of driving factors on Grassland Depletion exhibits significant regional variation across spatial locations, and Grassland Depletion and restoration show a dynamic balance and bidirectional process. Within the QTP, specific ranges of precipitation, population density, grazing intensity, and elevation are most conducive to grassland restoration, identified as 10–70 mm, 0–25 people/km2, 0–4.2 sheep/km2, and 3000–5100 m, respectively. In recent years, China has implemented a series of ecological projects to promote vegetation greening and significantly enhance carbon sequestration capacity; however, the issue of Grassland Depletion remains severe. This implies that Grassland Depletion will exert pressure on achieving carbon neutrality and emission control, particularly in ecologically sensitive areas such as the QTP.

4.3. Evaluation, Future Prediction and Protection of Ecological Suitability Zones

This study employed the Geographical Detector model to identify the primary factors driving Grassland Depletion, combined with the Analytic Hierarchy Process (AHP) for evaluating ecological suitability on the QTP. Grassland areas were classified into four levels—Reluctantly Suitable, Low Suitable, Moderately Suitable, and Highly Suitable—based on the weighting of each influencing factor. The findings reveal that Highly Suitable zones were reduced to 6547 km2 in 2010, significantly lower compared to 2000 and 2020, primarily due to severe Grassland Depletion observed in 2010. Projections under future climate change and increasing human activities indicate that the area of highly suitable zones will continue to decrease, reaching 17,497 km2 by 2030 and potentially shrinking to just 2844 km2 by 2060. This trend poses a severe threat to the “Twin-Star” grassland regions—Baingoin and Zanda—which serve as critical ecological zones and focal points for future conservation. The predicted expansion of “Low Suitable” and “Reluctantly Suitable” zones suggests an ongoing trend of ecological degradation, which, if left unaddressed, could worsen due to feedback loops linked to climate stressors and intensifying anthropogenic pressure. Consequently, without substantial intervention, the plateau’s ecosystem services—including carbon sequestration, biodiversity, and hydrological regulation—are expected to decline, complicating efforts to stabilize China’s carbon balance and achieve sustainable ecological outcomes.
To mitigate these risks, stricter conservation measures are urgently needed, particularly for the Twin-Star regions. Recommended interventions include increased investment in ecological restoration projects, regulation of grazing intensity, and management of population density to stabilize and expand highly suitable areas. Promoting the cultivation of cold- and drought-resistant plant species adapted to high altitudes can also enhance the ecological resilience and carbon sequestration capacity of grasslands. Furthermore, long-term policies must prioritize the Twin-Star regions, with regular monitoring systems to address uncertainties posed by climate change and human activities. Implementing these strategies will be essential for stabilizing the plateau’s grassland ecosystems, supporting China’s carbon neutrality objectives, and preserving one of the world’s most critical ecological regions.

4.4. Policy for Grassland Management

Over the past three decades (1990–2020), research has shown that grassland degradation on the QTP has exhibited significant fluctuations, reaching its lowest level in 1990 (Figure 3). The degradation trend declined between 1996 and 2005, followed by a general recovery from 2006 to 2020; however, the degradation rate consistently exceeded the restoration rate (Figure 4). Geodetector model analysis identified precipitation as the most influential factor affecting grassland degradation (q > 0.6), highlighting its pivotal role in restoration—primarily through strong interactions with population density, grazing intensity, and elevation (q > 0.7). The combined effects of high precipitation, dense population, intense grazing, and high elevation (Figure 8) are especially evident east of 90°E and between 20°N and 30°N, suggesting this region is particularly vulnerable to these interactive pressures. Areas with high suitability for grassland growth are mainly located in the Baingoin and Zanda grasslands, while moderately suitable zones are found in the western and central regions, and highly unsuitable areas are concentrated in the northeast (Figure 11). Based on these findings, ecological conservation on the Qinghai–Tibet Plateau should prioritize human-led protection efforts in areas with high growth suitability, including the establishment of key ecological reserves in the Baingoin and Zanda grasslands to stabilize conditions and support restoration. In the northwestern and northeastern regions, where human disturbance is severe and suitability is low, natural recovery processes alone are insufficient; therefore, stringent conservation measures—such as restricting land exploitation and reducing grazing pressure—are essential to prevent further degradation. Although grasslands in the western and central regions experience milder degradation, they are still located in moderately suitable zones, and timely conservation interventions remain necessary. Expanding fencing and enforcing grazing bans can effectively mitigate degradation and promote the sustainable use of grassland resources.

4.5. Limitations and Future Outlook

This study has certain limitations that warrant further consideration. First, while satellite remote sensing data provide a powerful tool for large-scale grassland monitoring, they may introduce errors due to sensor characteristics, relative angles between the satellite, Earth’s surface, and the sun, as well as atmospheric conditions. Second, the parameters used for the Grassland Depletion Index (GDI) are limited, which may restrict the ability to fully capture the complex dynamics of Grassland Depletion processes within the ecosystem. Although the T-Sen trend analysis was employed as a supplement, key ecological indicators such as soil depth, grassland rhizomes, and the lag effect of grass growth were not included. Third, additional factors like grassland biomass, wind speed, solar radiation, and drought may have significant positive or negative impacts on Grassland Depletion. However, due to the lack of precise, long-term data spanning the past 40 years, these factors were not incorporated into this study. Fourth, while this study explored the ranges of key driving factors such as precipitation, population density, grazing intensity, and elevation, it did not analyze their threshold effects, which could provide further insights into degradation dynamics. Finally, the reliance on large-scale remote sensing and statistical models may oversimplify localized variations in degradation processes and management practices.
Future research should integrate detailed field surveys, socio-economic data, and long-term monitoring to capture fine-scale changes and better understand the interactions between natural and anthropogenic factors. While the identified key drivers, such as precipitation, grazing intensity, and elevation, provide valuable insights, emerging factors—including climate extremes, soil quality changes, and land-use policies—require further investigation to comprehensively assess their roles in Grassland Depletion.
Looking ahead, the incorporation of advanced technologies, such as machine learning, high-resolution satellite imagery, and climate models, will enable more precise assessments of grassland trends and their driving mechanisms. Additionally, collaborative research involving local stakeholders, policymakers, and conservationists will be critical for translating scientific findings into actionable strategies. Such efforts will ensure the long-term resilience and sustainability of the QTP’s grassland ecosystems and provide scientifically grounded recommendations for the establishment of ecological suitability zones.

5. Conclusions

(1)
The results indicate that Grassland Depletion on the QTP from 1982 to 2020 can be divided into three distinct phases. In 1990, degradation peaked with a Grassland Depletion Index (GDI) of 2.53, marking a moderate degradation level. Between 1996 and 2005, grasslands gradually recovered, and the GDI fell below 2.0, shifting to a mild degradation phase. However, from 2006 onwards, degradation intensified again, stabilizing at a GDI of approximately 2.2, representing a return to moderate degradation—a trend persisting to the present. This timeline aligns with prior studies but suggests an earlier onset of intensified degradation (2006 rather than 2010).
(2)
Grassland Depletion on the QTP is influenced by both natural and anthropogenic factors, with precipitation, population density, grazing intensity, and elevation identified as key drivers. These factors exert both individual and interactive effects, with precipitation interacting most significantly with population density, grazing intensity, and elevation (q-values of 0.796, 0.767, and 0.752, respectively). The influence of driving factors shows notable spatial variation, with degradation and restoration exhibiting a dynamic balance. Optimal ranges for recovery were identified as 10–70 mm precipitation, 0–25 people/km2 population density, 0–4.2 sheep/km2 grazing intensity, and 3000–5100 m elevation.
(3)
The grassland ecological suitability analysis reveals that most grasslands on the QTP fall into “Moderately Suitable” and “Low Suitable” categories, with “Highly Suitable” areas steadily shrinking from 41,332 km2 in 1990 to 24,485 km2 in 2020. Projections suggest a further decrease to 17,501 km2 by 2030 and just 2844 km2 by 2060. This contraction of suitable zones indicates escalating ecological degradation pressures, highlighting the urgent need to establish ecological suitability protection areas to prevent further losses.
(4)
The identified “Grassland Ecological Suitability Twin-Star Regions” (Baingoin and Zanda grasslands) serve as key resilient zones on the QTP, crucial for future conservation efforts. Recommended protection strategies include increased investment in ecological restoration, stricter grazing and population density management, and the cultivation of cold- and drought-resistant plant species to enhance ecosystem resilience and carbon sequestration potential. These measures are essential for stabilizing the Plateau’s grassland ecosystems, supporting China’s carbon neutrality objectives, and maintaining global climate stability.
(5)
This study offers a novel perspective on the dynamic evaluation of Grassland Depletion on the QTP. By combining the Geographical Detector and AHP models, it provides a comprehensive quantitative analysis of grassland ecological suitability, contributing valuable insights for future protection and restoration efforts. This research has significant theoretical and practical implications for sustainable grassland management on the QTP.
The findings of this study provide a robust scientific foundation for guiding targeted conservation and restoration strategies on the QTP. Given the region’s critical ecological role as a global carbon sink and biodiversity hotspot, addressing Grassland Depletion has far-reaching implications beyond regional boundaries. The proposed ecological suitability framework can serve as a decision-making tool for policymakers, enabling the prioritization of protection zones and the efficient allocation of resources to regions most at risk.
Furthermore, the integrated analysis of natural and anthropogenic factors offers a replicable methodology for assessing grassland ecosystems in other fragile environments worldwide. By applying similar approaches, future studies can adapt the framework to diverse ecological contexts, supporting global efforts to combat land degradation and achieve sustainable development goals (SDGs). This study reinforces the urgent need for coordinated, science-based management practices to ensure the resilience of alpine grasslands and their invaluable contributions to climate stability, ecological health, and human well-being.

Supplementary Materials

The following supporting information can be downloaded at: https://www.mdpi.com/article/10.3390/rs17152539/s1, Supporting Information S1: Grassland Degradation Workflow & Suitability Zonation; Supporting Information S2: Multi-factor Contribution & Cross-Tab Dataset (1990–2020) [1,47,54,55,56,57,58,59,60,61].

Author Contributions

Conceptualization, Y.C.; methodology, R.Z. (Rao Zhu), R.Z. (Rui Zhang) and X.L.; Data curation, R.Z. (Rao Zhu), R.Z. (Rui Zhang) and X.L.; writing—original draft, Y.C.; writing—review & editing, Y.C. and L.X.; supervision, Y.X. and K.Y. All authors have read and agreed to the published version of the manuscript.

Funding

This research received no external funding.

Data Availability Statement

The original contributions presented in the study are included in the article/Supplementary Materials, further inquiries can be directed to the corresponding author.

Conflicts of Interest

The authors declare no conflicts of interest.

References

  1. Sun, J.; Wang, Y.; Piao, S.; Liu, M.; Han, G.; Li, J.; Liang, E.; Lee, T.M.; Liu, G.; Wilkes, A.; et al. Toward a sustainable grassland ecosystem worldwide. Innovation 2022, 3, 100265. [Google Scholar] [CrossRef] [PubMed]
  2. Bengtsson, J.; Bullock, J.; Egoh, B.; Everson, C.; Everson, T.; O’connor, T.; O’Farrell, P.; Smith, H.; Lindborg, R. Grasslands—More important for ecosystem services than you might think. Ecosphere 2019, 10, e02582. [Google Scholar] [CrossRef]
  3. Dong, S.; Shang, Z.; Gao, J.; Boone, R.B. Enhancing sustainability of grassland ecosystems through ecological restoration and grazing management in an era of climate change on Qinghai-Tibetan Plateau. Agric. Ecosyst. Environ. 2020, 287, 106684. [Google Scholar] [CrossRef]
  4. Bai, Y.; Cotrufo, M.F. Grassland soil carbon sequestration: Current understanding, challenges, and solutions. Science 2022, 377, 603–608. [Google Scholar] [CrossRef] [PubMed]
  5. Wang, Y.; Lv, W.; Xue, K.; Wang, S.; Zhang, L.; Hu, R.; Zeng, H.; Xu, X.; Li, Y.; Jiang, L.; et al. Grassland changes and adaptive management on the Qinghai–Tibetan Plateau. Nat. Rev. Earth Environ. 2022, 3, 668–683. [Google Scholar] [CrossRef]
  6. Oesterheld, M.; Sala, O.E.; McNaughton, S.J. Effect of animal husbandry on herbivore-carrying capacity at a regional scale. Nature 1992, 356, 234–236. [Google Scholar] [CrossRef] [PubMed]
  7. Manzano, P.; Pardo, G.; Itani, M.A.; del Prado, A. Underrated past herbivore densities could lead to misoriented sustainability policies. npj Biodivers. 2023, 2, 2. [Google Scholar] [CrossRef] [PubMed]
  8. Liu, H.; Hou, L.; Kang, N. The economic value of grassland ecosystem services: A global meta-analysis. Grassl. Res. 2022, 1, 63–74. [Google Scholar] [CrossRef]
  9. Bernard-Verdier, M.; Seitz, B.; Buchholz, S.; Kowarik, I.; Lasuncion Mejia, S.; Jeschke, J.M. Grassland allergenicity increases with urbanisation and plant invasions. Ambio 2022, 51, 2261–2277. [Google Scholar] [CrossRef] [PubMed]
  10. Zhao, Y.; Liu, Z.; Wu, J. Grassland ecosystem services: A systematic review of research advances and future directions. Landsc. Ecol. 2020, 35, 793–814. [Google Scholar] [CrossRef]
  11. Lyons, K.G.; Török, P.; Hermann, J.M.; Kiehl, K.; Kirmer, A.; Kollmann, J.; Overbeck, G.E.; Tischew, S.; Allen, E.B.; Bakker, J.D.; et al. Challenges and opportunities for grassland restoration: A global perspective of best practices in the era of climate change. Glob. Ecol. Conserv. 2023, 46, e02612. [Google Scholar] [CrossRef]
  12. Liu, Y.; Zhang, Z.; Tong, L.; Khalifa, M.; Wang, Q.; Gang, C.; Wang, Z.; Li, J.; Sun, Z. Assessing the effects of climate variation and human activities on grassland degradation and restoration across the globe. Ecol. Indic. 2019, 106, 105504. [Google Scholar] [CrossRef]
  13. Breidenbach, A.; Schleuss, P.-M.; Liu, S.; Schneider, D.; Dippold, M.A.; de la Haye, T.; Miehe, G.; Heitkamp, F.; Seeber, E.; Mason-Jones, K. Microbial functional changes mark irreversible course of Tibetan grassland degradation. Nat. Commun. 2022, 13, 2681. [Google Scholar] [CrossRef] [PubMed]
  14. Shang, Z.; Yang, S.; Wang, Y.; Shi, J.; Ding, L.; Long, R. Soil seed bank and its relation with above-ground vegetation along the degraded gradients of alpine meadow. Ecol. Eng. 2016, 90, 268–277. [Google Scholar] [CrossRef]
  15. Liu, Z.; Li, Q.; Chen, D.; Zhai, W.; Zhao, L.; Xu, S.; Zhao, X. Patterns of plant species diversity along an altitudinal gradient and its effect on above-ground biomass in alpine meadows in Qinghai-Tibet Plateau. Biodivers. Sci. 2015, 23, 451. [Google Scholar] [CrossRef]
  16. Kang, S.; Zhang, Q.; Qian, Y.; Ji, Z.; Li, C.; Cong, Z.; Zhang, Y.; Guo, J.; Du, W.; Huang, J. Linking atmospheric pollution to cryospheric change in the Third Pole region: Current progress and future prospects. Natl. Sci. Rev. 2019, 6, 796–809. [Google Scholar] [CrossRef] [PubMed]
  17. Fischer, E.M.; Knutti, R. Anthropogenic contribution to global occurrence of heavy-precipitation and high-temperature extremes. Nat. Clim. Chang. 2015, 5, 560–564. [Google Scholar] [CrossRef]
  18. Dong, S.; Zhang, Y.; Shen, H.; Li, S.; Xu, Y. Grassland Degradation and Restoration. In Grasslands on the Third Pole of the World: Structure, Function, Process, and Resilience of Social-Ecological Systems; Dong, S., Zhang, Y., Shen, H., Li, S., Xu, Y., Eds.; Springer International Publishing: Cham, Switzerland, 2023; pp. 269–310. [Google Scholar]
  19. Xu, M.; Zhang, J.; Li, Z.; Mo, Y. Attribution analysis and multi-scenario prediction of NDVI drivers in the Xilin Gol grassland, China. J. Arid. Land 2022, 14, 941–961. [Google Scholar] [CrossRef]
  20. Pu, Y.; Wei, X.; Liu, J.; Zhang, K.; Li, B.; Wei, Z.; Zhang, M.; He, T.; Wang, Y.; Shao, X. Relationship between environmental evolution and human activities in the northeastern Qinghai-Xizang Plateau throughout the past millennium and its implications for the onset of the Anthropocene. Sci. China Earth Sci. 2024, 67, 3536–3549. [Google Scholar] [CrossRef]
  21. Goldberg, P.; Macphail, R.I.; Carey, C.; Zhuang, Y. Practical and Theoretical Geoarchaeology; John Wiley & Sons: Hoboken, NJ, USA, 2022. [Google Scholar]
  22. Ji, W.; Luo, Y.; Liao, Y.; Wu, W.; Wei, X.; Yang, Y.; He, X.Z.; Shen, Y.; Ma, Q.; Yi, S. UAV Assisted Livestock Distribution Monitoring and Quantification: A Low-Cost and High-Precision Solution. Animals 2023, 13, 3069. [Google Scholar] [CrossRef] [PubMed]
  23. Otto, A.S.; Szymanski, D.M.; Varadarajan, R. Customer satisfaction and firm performance: Insights from over a quarter century of empirical research. J. Acad. Mark. Sci. 2020, 48, 543–564. [Google Scholar] [CrossRef]
  24. Cislaghi, A.; Giupponi, L.; Tamburini, A.; Giorgi, A.; Bischetti, G.B. The effects of mountain grazing abandonment on plant community, forage value and soil properties: Observations and field measurements in an alpine area. Catena 2019, 181, 104086. [Google Scholar] [CrossRef]
  25. Li, L.; Fassnacht, F.E.; Storch, I.; Bürgi, M. Land-use regime shift triggered the recent degradation of alpine pastures in Nyanpo Yutse of the eastern Qinghai-Tibetan Plateau. Landsc. Ecol. 2017, 32, 2187–2203. [Google Scholar] [CrossRef]
  26. Han, Z.; Song, W.; Deng, X.; Xu, X. Grassland ecosystem responses to climate change and human activities within the Three-River Headwaters region of China. Sci. Rep. 2018, 8, 9079. [Google Scholar] [CrossRef] [PubMed]
  27. Senf, C. Seeing the System from Above: The Use and Potential of Remote Sensing for Studying Ecosystem Dynamics. Ecosystems 2022, 25, 1719–1737. [Google Scholar] [CrossRef]
  28. Chen, X.; Yu, L.; Du, Z.; Liu, Z.; Qi, Y.; Liu, T.; Gong, P. Toward sustainable land use in China: A perspective on China’s national land surveys. Land Use Policy 2022, 123, 106428. [Google Scholar] [CrossRef]
  29. Ali, I.; Cawkwell, F.; Dwyer, E.; Barrett, B.; Green, S. Satellite remote sensing of grasslands: From observation to management. J. Plant Ecol. 2016, 9, 649–671. [Google Scholar] [CrossRef]
  30. Wang, Z.; Ma, Y.; Zhang, Y.; Shang, J. Review of remote sensing applications in grassland monitoring. Remote Sens. 2022, 14, 2903. [Google Scholar] [CrossRef]
  31. Shen, X.; Liu, B.; Henderson, M.; Wang, L.; Jiang, M.; Lu, X. Vegetation greening, extended growing seasons, and temperature feedbacks in warming temperate grasslands of China. J. Clim. 2022, 35, 5103–5117. [Google Scholar] [CrossRef]
  32. Barnett, K.L.; Facey, S.L. Grasslands, invertebrates, and precipitation: A review of the effects of climate change. Front. Plant Sci. 2016, 7, 1196. [Google Scholar] [CrossRef] [PubMed]
  33. Andrade, B.O.; Koch, C.; Boldrini, I.I.; Vélez-Martin, E.; Hasenack, H.; Hermann, J.-M.; Kollmann, J.; Pillar, V.D.; Overbeck, G.E. Grassland degradation and restoration: A conceptual framework of stages and thresholds illustrated by southern Brazilian grasslands. Nat. Conserv. 2015, 13, 95–104. [Google Scholar] [CrossRef]
  34. Wang, Y.; Zhang, Y.; Yu, X.; Jia, G.; Liu, Z.; Sun, L.; Zheng, P.; Zhu, X. Grassland soil moisture fluctuation and its relationship with evapotranspiration. Ecol. Indic. 2021, 131, 108196. [Google Scholar] [CrossRef]
  35. Feldman, A.F.; Konings, A.G.; Gentine, P.; Cattry, M.; Wang, L.; Smith, W.K.; Biederman, J.A.; Chatterjee, A.; Joiner, J.; Poulter, B. Large global-scale vegetation sensitivity to daily rainfall variability. Nature 2024, 636, 380–384. [Google Scholar] [CrossRef] [PubMed]
  36. McCabe, A.J.; Arnold, W.A. Multiple linear regression models to predict the formation efficiency of triplet excited states of dissolved organic matter in temperate wetlands. Limnol. Oceanogr. 2018, 63, 1992–2014. [Google Scholar] [CrossRef]
  37. Tao, J.; Zhang, Y.; Dong, J.; Fu, Y.; Zhu, J.; Zhang, G.; Jiang, Y.; Tian, L.; Zhang, X.; Zhang, T. Elevation-dependent relationships between climate change and grassland vegetation variation across the Qinghai-Xizang Plateau. Int. J. Climatol. 2015, 35, 1638–1647. [Google Scholar] [CrossRef]
  38. Wang, Z.; Zhang, Y.; Yang, Y.; Zhou, W.; Gang, C.; Zhang, Y.; Li, J.; An, R.; Wang, K.; Odeh, I. Quantitative assess the driving forces on the grassland degradation in the Qinghai–Tibet Plateau, in China. Ecol. Inform. 2016, 33, 32–44. [Google Scholar] [CrossRef]
  39. Qian, Q.; Wang, J.; Zhang, X.; Wang, S.; Li, Y.; Wang, Q.; Watson, A.E.; Zhao, X. Improving herders’ income through alpine grassland husbandry on Qinghai-Tibetan Plateau. Land Use Policy 2022, 113, 105896. [Google Scholar] [CrossRef]
  40. Song, S.; Xiong, K.; Chi, Y.; Shen, X.; Guo, T.; Lu, N. Research progress and prospect of grassland establishment and ecological animal husbandry in the karst rocky desertification area. Fresenius Environ. Bull 2018, 27, 7017–7030. [Google Scholar]
  41. Cochard, A.; Pithon, J.; Jagaille, M.; Beaujouan, V.; Pain, G.; Daniel, H. Grassland plant species occurring in extensively managed road verges are filtered by urban environments. Plant Ecol. Divers. 2017, 10, 217–229. [Google Scholar] [CrossRef]
  42. Van der Walt, L.; Cilliers, S.; Kellner, K.; Du Toit, M.; Tongway, D. To what extent does urbanisation affect fragmented grassland functioning? J. Environ. Manag. 2015, 151, 517–530. [Google Scholar] [CrossRef] [PubMed]
  43. Yao, T.; Fahu, C.; Peng, C.; Ma, Y.; Xu, B.; Zhu, L.; Fan, Z.; Wang, W.; Likun, A.; Yang, X. From Tibetan Plateau to Third Pole and Pan-Third. Bull. Chin. Acad. Sci. 2017, 32, 924–931. [Google Scholar]
  44. Tian, F.; Nan, Y.; Ni, G.; Yang, L.; Tang, Q.; Grey, D. Is the Tibetan Plateau really a water tower? Hydrol. Process. 2024, 38, e15103. [Google Scholar] [CrossRef]
  45. NGIC. Administrative Boundaries Data at 1:1000 000 Scale Over the Tibetan Plateau (2017); National Tibetan Plateau/Third Pole Environment Data Center: Beijing, China, 2019. [Google Scholar] [CrossRef]
  46. Fahu, C.; Yajun, W.; Lin, D.; Tandong, Y.A.O. The expedition and scientific investigation activities on the Tibetan Plateau before 1949. Acta Geogr. Sin. 2022, 77, 1565–1585. [Google Scholar] [CrossRef]
  47. Liu, Y.; Lu, C. Quantifying Grass Coverage Trends to Identify the Hot Plots of Grassland Degradation in the Tibetan Plateau during 2000–2019. Int. J. Environ. Res. Public Health 2021, 18, 416. [Google Scholar] [CrossRef] [PubMed]
  48. Gao, Q.-Z.; Wan, Y.-F.; Xu, H.-M.; Li, Y.; Jiangcun, W.-Z.; Borjigidai, A. Alpine grassland degradation index and its response to recent climate variability in Northern Tibet, China. Quat. Int. 2010, 226, 143–150. [Google Scholar] [CrossRef]
  49. Wang, J.; Xu, C. Geodetector: Principle and prospective. Acta Geogr. Sin. 2017, 72, 116–134. [Google Scholar] [CrossRef]
  50. Zhang, Y.; Gao, Q.; Dong, S.; Liu, S.; Wang, X.; Su, X.; Li, Y.; Tang, L.; Wu, X.; Zhao, H. Effects of grazing and climate warming on plant diversity, productivity and living state in the alpine rangelands and cultivated grasslands of the Qinghai-Tibetan Plateau. Rangel. J. 2015, 37, 57–65. [Google Scholar] [CrossRef]
  51. Sun, J.; Wang, H. Soil nitrogen and carbon determine the trade-off of the above- and below-ground biomass across alpine grasslands, Tibetan Plateau. Ecol. Indic. 2016, 60, 1070–1076. [Google Scholar] [CrossRef]
  52. Zhou, H.; Zhao, X.; Tang, Y.; Gu, S.; Zhou, L. Alpine grassland degradation and its control in the source region of the Yangtze and Yellow Rivers, China. Grassl. Sci. 2005, 51, 191–203. [Google Scholar] [CrossRef]
  53. Zhou, S.; Williams, A.P.; Berg, A.M.; Cook, B.I.; Zhang, Y.; Hagemann, S.; Lorenz, R.; Seneviratne, S.I.; Gentine, P. Land–atmosphere feedbacks exacerbate concurrent soil drought and atmospheric aridity. Proc. Natl. Acad. Sci. USA 2019, 116, 18848–18853. [Google Scholar] [CrossRef] [PubMed]
  54. Feng, M.; Che, X. Monthly Surface Water Extent Dataset for Tibetan Plateau and Central Asia (2000–2015); National Tibetan Plateau Data Center: Beijing, China, 2019. [Google Scholar]
  55. Feng, M.; Sexton, J.O.; Channan, S.; Townshend, J.R. A global, high-resolution (30-m) inland water body dataset for 2000: First results of a topographic–spectral classification algorithm. Int. J. Digit. Earth 2016, 9, 113–133. [Google Scholar] [CrossRef]
  56. Ji, Z.X.; Pei, T.T.; Chen, Y.; Hou, Q.Q.; Xie, B.P.; Wu, H.W. Spatial-Temporal variation and driving factors of grassland NDVI in the Qinghai-Tibet Plateau from 2001 to 2020. Acta Agrestia Sin. 2022, 30, 1873. [Google Scholar]
  57. Shouzhang, P. 1-km Monthly Precipitation Dataset for China (1901–2021); A Big Earth Data Platform for Three Poles; National Tibetan Plateau Data Center: Beijing, China, 2020. [Google Scholar]
  58. Song, Y.; Ma, M. Variation of AVHRR NDVI and its relationship with climate in Chinese arid and cold regions. J. Remote Sens. 2008, 12, 499–505. [Google Scholar]
  59. Wang, S.; Jia, L.; Cai, L.; Wang, Y.; Zhan, T.; Huang, A.; Fan, D. Assessment of Grassland Degradation on the Tibetan Plateau Based on Multi-Source Data. Remote Sens. 2022, 14, 6011. [Google Scholar] [CrossRef]
  60. Zhou, J.; Niu, J.; Wu, N.; Lu, T. Annual high-resolution grazing intensity maps on the Qinghai-Tibet Plateau from 1990 to 2020. Earth Syst. Sci. Data Discuss. 2023, 2023, 1–21. [Google Scholar] [CrossRef]
  61. Zhou, W.; Wang, T.; Xiao, J.; Wang, K.; Yu, W.; Du, Z.; Huang, L.; Yue, T. Grassland productivity increase was dominated by climate in Qinghai-Tibet Plateau from 1982 to 2020. J. Clean. Prod. 2024, 434, 140144. [Google Scholar] [CrossRef]
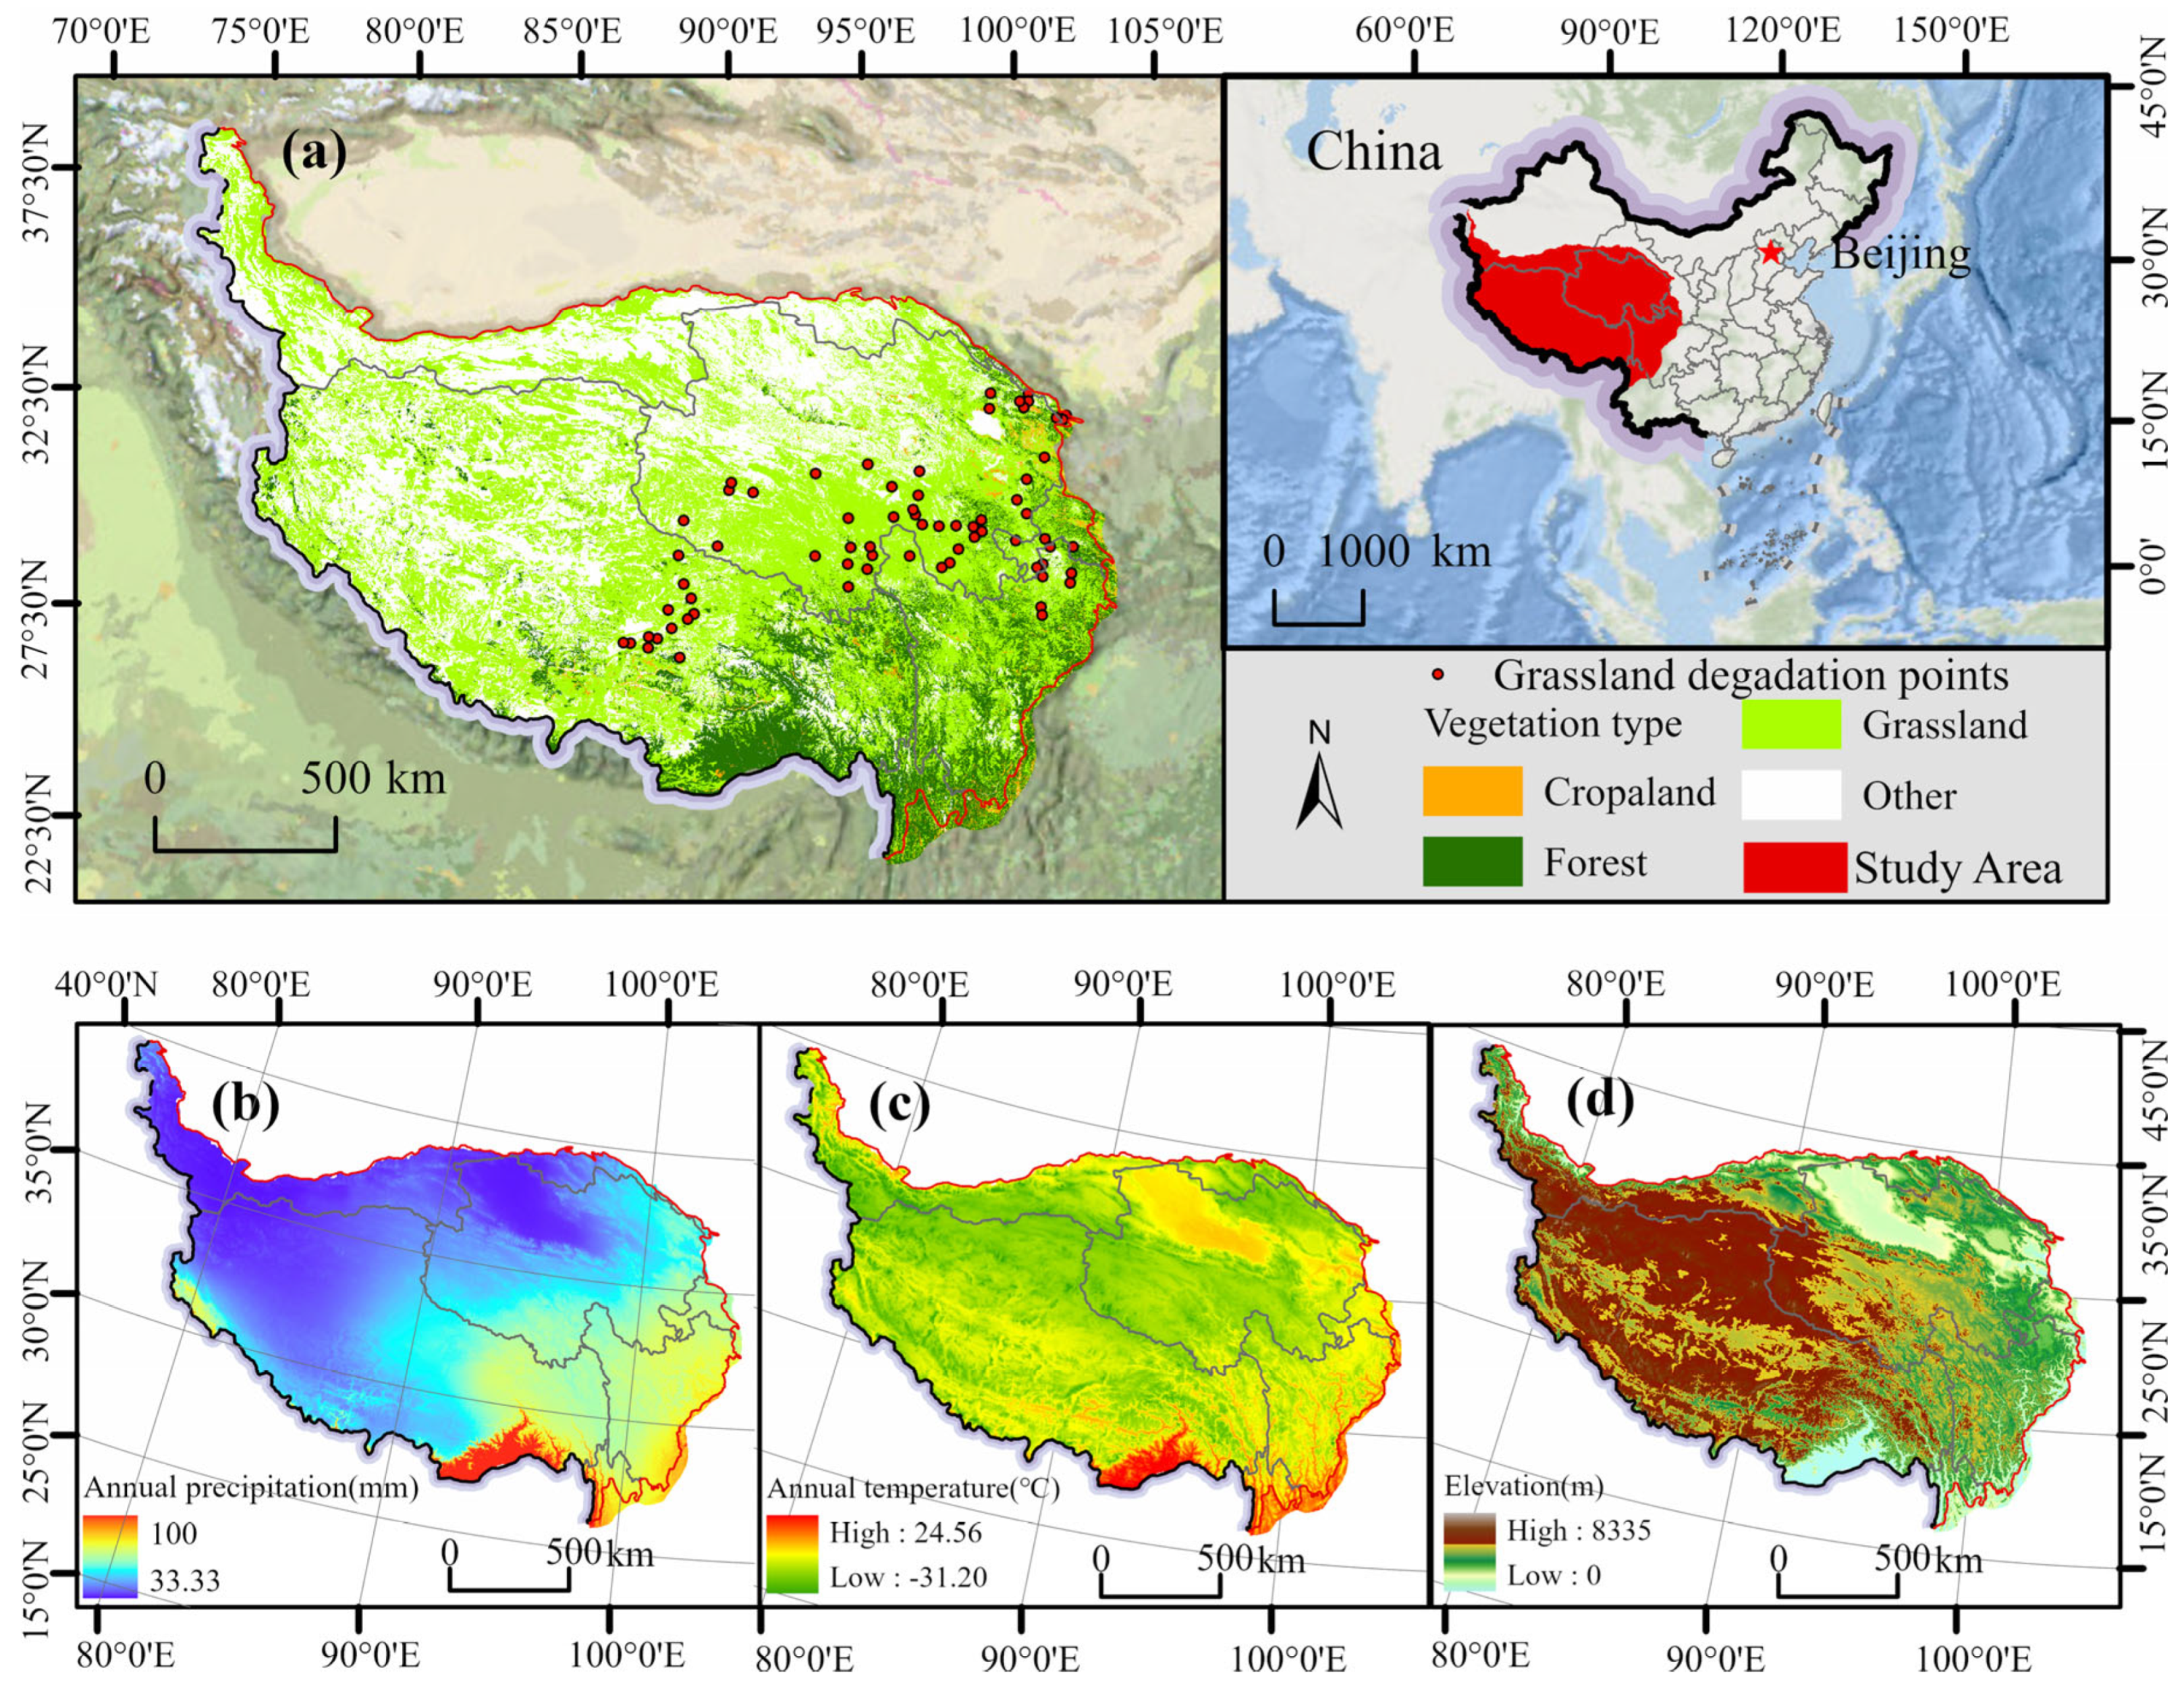
Figure 1. Overview of the research area: (a) Distribution of grasslands on the QTP. (b) Mean annual precipitation on the QTP from 1990 to 2020. (c) Mean annual temperature on the QTP from 1990 to 2020. (d) Mean Elevation on the QTP.
Remotesensing 17 02539 g001
Figure 2. The research framework of this paper.
Remotesensing 17 02539 g002
Figure 3. Upper panel: (a): GDI (Grassland Depletion Index) trends on the QTP (1990–2020). Lower panel: (b,c,e,f): Spatial distribution map of Grassland Degeneration on the QTP (1990, 2000, 2010, 2020), (d): Degradation type area.
Remotesensing 17 02539 g003
Figure 4. Spatiotemporal distribution trend of Grassland Depletion and its area proportion on the QTP: (a) NDVI Trends from 1982 to 2020. (b,c,e,f) Grassland Depletion level distribution on the QTP (1990–2000, 2000–2010, 2010–2020, 1990–2020). (d) Restoration and degradation trends percentage.
Remotesensing 17 02539 g004
Figure 5. Contribution of individual factors to Grassland Depletion on the QTP (1990, 2000, 2010, 2020).
Remotesensing 17 02539 g005
Figure 6. Impact of factor interactions on Grassland Depletion (1990, 2000, 2010, 2020).
Remotesensing 17 02539 g006
Figure 7. Distribution of Grassland Depletion and Restoration Areas on the QTP from 1990 to 2020 across different levels of major influencing factors (a) precipitation, (b) population density, (c) grazing intensity, (d) elevation.
Remotesensing 17 02539 g007
Figure 8. Distribution of Grassland Depletion and Restoration Areas on the QTP under the interaction of key influencing factors, 1990–2020. (a) Interaction of precipitation and population density on grassland depletion and restoration. (b) Interaction of precipitation and grazing intensity on grassland depletion and restoration. (c) Interaction of precipitation and elevation on grassland depletion and restoration. (d) Area distribution under precipitation and population density interaction. (e) Area distribution under precipitation and grazing intensity interaction. (f) Area distribution under precipitation and elevation interaction.
Remotesensing 17 02539 g008
Figure 9. Depletion type transitions (1990–2000, 2000–2010, 2010–2020, 1990–2020).
Remotesensing 17 02539 g009
Figure 10. QTP grassland suitability evaluation factors. (a) Temperature (°C). (b) Precipitation (mm). (c) Elevation (m). (d) Slope (degree). (e) Grazing density (sheep/km2). (f) Soil type. (g) Gross Domestic Product (CNY 10,000). (h) Population density (people/km2).
Remotesensing 17 02539 g010
Figure 11. Spatiotemporal Dynamics of Grassland Suitability on the QTP and Detailed Analysis of Key Regions from 1990 to 2020. (a) 1990 grassland suitability. (b) 2000 grassland suitability. (c) 2010 grassland suitability. (d) 2020 grassland suitability.
Remotesensing 17 02539 g011
Figure 12. QTP grassland suitability evaluation over time. (a) Reluctantly suitable grassland area over time. (b) Low suitable grassland area over time. (c) Moderately suitable grassland area over time. (d) Highly suitable grassland area over time.
Remotesensing 17 02539 g012
Table 1. Data used in the Grassland Depletion research on the QTP.
DataData NameData AbbreviationTime/Time SeriesSourceProcess Mode
Remote sensing vegetation indexGIMMS NDVI/MOD13A3 NDVINDVI1982–2022GIMMS NDVI3g ndvi, https://doi.org/10.3334/ORNLDAAC/2187,
MOD13A2 ndvi,
https://urs.earthdata.nasa.gov (last access: 14 October 2024)
The GIMMS NDVI was reconstructed using ENVI 5.6 using time series harmonic analysis (HANTS), and then the NDVI data were extracted to the QTP for the 30-year vegetation growing season from 1990 to 2020
meteorological dataair temperature (°C)TMP1990–2020National Tibetan Plateau Data CenterThird Pole Environment Data Center (TPDC), https://data.tpdc.ac.cn/ (last access: 14 October 2024)The NC to TIF, format conversion, reprojection and down sampling mask extraction in ArcGIS 10.8
precipitation (mm)PRE1990–2020National Tibetan Plateau Data CenterThird Pole Environment Data Center (TPDC), https://data.tpdc.ac.cn/ (last access: 14 October 2024)Consistent with precipitation data process
Potential evapotranspiration (mm)PET1990–2020National Tibetan Plateau Data CenterThird Pole Environment Data Center (TPDC), https://data.tpdc.ac.cn/ (last access: 14 October 2024)Consistent with precipitation data process
Terrain area dataelevation (m)DEM2020SRTM DEM, https://earthexplorer.usgs.gov/ (last access:20241014)Was extracted from the elevation surface analysis in ArcGIS 10.8
aspect of a slopeASPECT2020SRTM DEM, https://earthexplorer.usgs.gov/ (last access: 14 October 2024)Was based on elevations extracted using slope analysis in ArcGIS 10.8.
SLOPESLOPE2020SRTM DEM, https://earthexplorer.usgs.gov/ (last access: 14 October 2024)Was based on elevations extracted using slope analysis in ArcGIS 10.8
Soil dataSoil typeSOIL2000National Earth System Science Data Center(NESSDC),
http://www.geodata.cn,
(last access: 14 October 2024)
The extraction of mask, conversion of coordinate systems and resampling in ArcGIS 10.8.
human activitiesPopulation density (person/km2)POP1990–2020China Statistical Yearbook and census data, https://www.stats.gov.cn/english/Statisticaldata/yearbook/ (last access: 14 October 2024)The data were based on county statistical yearbooks and local statistics obtained using ordinary kriging interpolation in ArcGIS 10.8.
gross domestic product
(CNY 10,000)
GDP1990–2020China Statistical Yearbook and census data, https://www.stats.gov.cn/english/Statisticaldata/yearbook/ (last access: 14 October 2024)The data were based on the ArcGIS 10.8 field calculator interpolated with actual site data.
grazing intensityGDGI1990–2020Grazing spatialization dataset(GDGI), https://figshare.com/articles/journal_contribution/Annual_high-resolution_grazing_intensity_maps_on_the_Qinghai-Tibet_Plateau_from_1990_to_2020/24211676, (last access: 14 October 2024)The extraction of mask, conversion of coordinate systems and resampling in ArcGIS 10.8.
land-use typeLUCC1980–2020National Earth System Science Data Center(NESSDC),
http://www.geodata.cn,
(last access: 14 October 2024)
Coordinate system conversion, mask extraction, and reclassification in ArcGIS 10.8
distance from the roadRD2019National Earth System Science Data Center(NESSDC),
http://www.geodata.cn,
(last access: 14 October 2024)
Euclidean distance in ArcGIS 10.8, and coordinate system transformation and cropping
Table 2. Degrees of Grassland Depletion.
ScoreDegreeClassification StandardScoreDegreeClassification Standard
1UN-degradedFVC ≥ FVC1982—19854Severely degraded0.3FVC1982—1985 ≤ FVC ≤ 0.6FVC1982—1985
2Lightly degraded0.75FVC1982—1985 ≤ FVC ≤ 0.9FVC1982—19855Grievous severely degradedFVC ≤ 0.3FVC1982—1985
3Moderately degraded0.6FVC1982—1985 ≤ FVC ≤ 0.75FVC1982—1985
FVC: fractional vegetation coverage.
Table 3. Regional Grassland Depletion Index.
Classification StandardDegradation DegreesClassification StandardDegradation Degrees
GDI < 1UN-degraded3 < GDI ≤ 4Severely degraded
1 < GDI ≤ 2Lightly degradedGDI > 4Grievous severely degraded
2 < GDI ≤ 3Moderately degraded
Table 4. Standards for the classification of Grassland Depletion states.
SlopeZ ValueTrend of NDVI
Slope ≥ 0.0005Z value ≥ 1.96significant improvement
Slope ≥ 0.00050 < Z value < 1.96slight improvement
−0.0005 < Slope < 0.00050 ≤ Z value ≤ 1.96stable
Slope < −0.00050 ≤ Z value ≤ 1.96slight degeneration
Slope < −0.0005Z value ≥ 1.96significant degradation
Table 5. The five interaction types of interaction detectors.
Interaction
Type
Interactive
Relationship
Interaction
Type
Interactive
Relationship
q(X1∩X2) < min(q(X1), q(X2))Nonlinear weakeningq(X1∩X2) = q(X1) + q(X2)Dependency
min(q(X1), q(X2) < q(X1∩X2) < max(q(X1), q(X2))Single-factor nonlinear attenuationq(X1∩X2) > q(X1) + q(X2)Nonlinear enhancement
q(X1∩X2) > max(q(X1), q(X2))Two-factor enhancement
Note: X1 and X2 are drivers of grassland deterioration. Symbolically, the interaction between X1 and X2 is indicated by the “∩” symbol.
Table 6. Grassland Suitability classification and interpretation.
Suitability CategorySuit Value (S)Meaning
Reluctantly suitableS < 2Grasslands with certain environmental limitations
Low suitable3 > S ≥ 2Grasslands with low limitations
Moderately suitable5.2 > S ≥ 3Grasslands with moderate limitations overall
Highly suitableS ≥ 5.2Grasslands with no major or only minor limitations
Table 7. Interactions between precipitation, population density, grazing intensity, and elevation.
Precipitation (mm)Population (People/km2)Grazing (Sheep/km2)Elevation (m)
High (>500)Low (<500)High (>4.12)Low (<4.12)High (>4700)Low (<4700)
High (>40)High precipitation,
High population (HP, HPop)
High precipitation, low population (HP, LPop)High precipitation, high grazing intensity (HP, HGraz)High precipitation, low grazing intensity (HP, LGraz)High precipitation, high elevation (HP, HElev)High precipitation, low elevation (HP, LElev)
Low (<40)Low precipitation, high population (LP, HPop)Low precipitation, low population (LP, LPop)Low precipitation, high grazing intensity (LP, HGraz)Low precipitation, low grazing intensity (LP, LGraz)Low precipitation, high elevation (LP, HElev)Low precipitation, low elevation (LP, LElev)
Disclaimer/Publisher’s Note: The statements, opinions and data contained in all publications are solely those of the individual author(s) and contributor(s) and not of MDPI and/or the editor(s). MDPI and/or the editor(s) disclaim responsibility for any injury to people or property resulting from any ideas, methods, instructions or products referred to in the content.