Highlights
What are the main findings?
- Archaeological Earth observation research expanded nearly 1661% from 2000 to 2025, yet 78.9% of publications originate from Global North institutions, despite the Global South hosting the majority of UNESCO World Heritage Sites.
- A small group of countries (Italy, USA, UK) account for almost half of global out-put, while regions such as Sub-Saharan Africa remain critically un-der-represented (<1% of publications versus 9.4% of sites).
What is the implication of the main findings?
- This study demonstrates persistent structural inequalities in access to satellite data, computing infrastructure, and expertise, with implications for cultural her-itage protection and sustainable development.
- Redressing this imbalance requires coordinated capacity building, equitable data access, and inclusive frameworks that integrate Global South perspectives into Earth observation research.
Abstract
This systematic review analyzes 4359 archaeologically relevant publications spanning 25 years to examine global disparities in archaeological remote sensing research between Global North and Global South participation. This study reveals deep inequalities among these regions, with 72.1% of research output originating from Global North-only institutions, despite these regions hosting less than half of UNESCO World Heritage Sites. The temporal analysis demonstrates exponential growth, with 47.2% of all research published in the last five years, indicating rapid technological advancement concentrated in well-resourced institutions. Sub-Saharan Africa produces only 0.6% of research output while hosting 9.4% of World Heritage Sites, highlighting a technology gap in heritage protection. The findings suggest an urgent need for coordinated interventions to address structural inequalities and promote technological fairness in global heritage preservation. The research employed bibliometric analysis of Scopus database records from four complementary search strategies, revealing that just three countries—Italy (20.3%), the United States (16.7%), and the United Kingdom (10.0%)—account for nearly half of all archaeological remote sensing research and applications worldwide. This study documents patterns that have profound implications for cultural heritage preservation and sustainable development in an increasingly digital world where advanced Earth observation technologies have become essential for effective heritage protection and archaeological research.
1. Introduction
The integration of satellite-based Earth observation technologies into archaeological research has fundamentally transformed the discipline over the past quarter of a century, offering new capabilities for site discovery, landscape analysis, and cultural heritage monitoring across vast spatial and temporal scales [1,2,3]. This technological revolution emerged from pioneering work in the 1970s and 1980s using early satellite platforms such as Landsat [4,5] and SPOT [6,7] imagery, evolving into a sophisticated interdisciplinary domain that combines remote sensing technologies, geospatial analysis, artificial intelligence, and archaeological interpretation to advance our understanding of human settlement patterns, landscape modification, and cultural heritage preservation [8,9,10,11,12].
The scientific field has been driven by several factors including the increasing availability and declining costs of high-resolution satellite imagery, advances in computational processing capabilities, the development of sophisticated analytical software packages, and growing recognition within the archaeological community of remote sensing’s potential for addressing fundamental research questions about past human behavior and cultural change [13,14,15]. The democratization of Geographic Information System (GIS) technology and the emergence of cloud-based processing platforms have further accelerated adoption by reducing technical barriers and computational requirements that previously limited access to advanced analytical capabilities [16,17,18].
However, despite the global nature of archaeological heritage and the wide applicability of satellite technologies, significant questions remain about the equitable distribution of these technological capabilities and their benefits across different regions of the world [19,20]. The distinction in archaeological remote sensing research represents more than a simple geographical categorization [21]; it reflects deeper structural inequalities in access to advanced technologies, funding resources, institutional capacity, research infrastructure, and the technological required for independent scientific innovation [19,21,22].
In this study, the term Global South is employed in line with Mahler’s [23] definition, referring not to a strictly geographic designation but to a socio-political construct encompassing regions historically marginalized in global economic, scientific, and technological systems (e.g., much of Africa, Latin America, the Middle East, and parts of Asia). This conceptualization allows us to capture disparities in access to resources, research capacity, and technological infrastructures when comparing the Global South with the more industrialized and research-intensive Global North. The Global North, encompassing primarily developed nations in North America (United States and Canada), Europe (including all European Union member states, United Kingdom, Norway, Switzerland, Iceland, and other Western European nations), and developed Asia-Pacific regions (Japan, South Korea, Australia, and New Zealand), has historically dominated not only the development and deployment of Earth observation satellites but also the creation of analytical frameworks, artificial intelligence models, and institutional knowledge that define the field’s methodological standards and research priorities [24,25]. This is visible across multiple dimensions including the ownership and operation of satellite systems by agencies such as NASA, ESA, JAXA, and commercial providers like DigitalGlobe, Planet Labs, and Maxar Technologies, the development of processing software and analytical algorithms by companies like Google, Microsoft, ESRI, and specialized remote sensing firms, the availability of high-performance computing infrastructure in universities and research institutions with substantial computational resources, access to commercial high-resolution imagery through institutional licenses and research agreements that provide preferential pricing and data access, and the concentration of specialized expertise in academic programs, professional networks, and research centers with decades of accumulated experience [26,27,28].
Conversely, the Global South, representing developing nations primarily in Africa (including all Sub-Saharan African countries such as Kenya, Tanzania, South Africa, Ghana, Nigeria, Senegal, and North African countries like Egypt, Morocco, Tunisia, Algeria), Latin America and the Caribbean (including Brazil, Mexico, Argentina, Peru, Colombia, Chile, and Caribbean island nations), and developing Asia (including major populous nations like China, India, Indonesia, Pakistan, Bangladesh, Thailand, Vietnam, Philippines, and Middle Eastern countries such as Iran, Iraq, Turkey, Syria, Jordan, and Lebanon) often hosts some of the world’s most significant archaeological sites and cultural heritage resources [29,30]. These include numerous UNESCO World Heritage Sites of global importance such as Angkor Wat in Cambodia, Machu Picchu in Peru, the Pyramids of Giza in Egypt, Great Zimbabwe in Zimbabwe, Petra in Jordan, Borobudur in Indonesia, and countless other irreplaceable cultural landscapes and archaeological complexes that represent humanity’s shared heritage. As of 2024, there are 1223 UNESCO World Heritage Sites globally, with 952 cultural, 231 natural, and 40 mixed properties distributed across 168 countries [31]. Yet these regions face substantial and various barriers to accessing and effectively utilizing the advanced Earth observation technologies that have become essential for contemporary archaeological research and heritage protection in the digital age [32,33,34,35].
These barriers are also linked with technological, economic, educational, and institutional dimensions, creating a complex web of interconnected constraints that collectively limit meaningful participation in cutting-edge archaeological research and heritage monitoring activities. The technological barriers are particularly pronounced and include severely limited access to high-speed internet connectivity required for downloading and processing large satellite datasets that can range from gigabytes to terabytes in size, insufficient computational infrastructure for processing high-resolution imagery and running sophisticated analytical algorithms that require substantial processing power and memory resources, a systematic lack of access to commercial satellite imagery due to prohibitive cost constraints and restrictive licensing agreements that favor institutional buyers in developed countries, and the critically limited availability of specialized software packages and analytical tools that require expensive licenses and ongoing technical support [10,15,25,36].
Therefore, economic constraints extend far beyond the direct costs of satellite imagery and software licenses to encompass the broader financial ecosystem required for supporting long-term research programs, including substantial investments in hiring and training technical staff with specialized skills in remote sensing and archaeological interpretation, maintaining and upgrading computational infrastructure to keep pace with rapidly evolving technological requirements, participating in international conferences and collaborative networks that facilitate knowledge exchange and professional development, and sustaining research programs over multi-year periods required for meaningful archaeological investigation and heritage monitoring initiatives [37,38,39,40,41].
Educational and institutional barriers include the limited availability of specialized training programs in archaeological remote sensing, the shortage of faculty with expertise in Earth observation technologies, the lack of established curricula integrating remote sensing with traditional archaeological methods, and insufficient institutional support for developing interdisciplinary research capabilities [42]. These educational gaps are particularly problematic because effective use of Earth observation technologies requires not only technical skills in image processing and analysis but also a deep understanding of archaeological theory, site formation processes, and landscape evolution that can only be developed through comprehensive interdisciplinary training programs.
Moreover, the recent developments of artificial intelligence and machine learning in archaeological remote sensing have introduced new and increasingly complex dimensions to these existing disparities, potentially either serving as a democratizing force that could provide powerful analytical tools to under-resourced institutions, or alternatively functioning to further concentrate advanced capabilities in already well-resourced institutions with the technical expertise and computational infrastructure necessary to develop and deploy these sophisticated systems [43,44,45,46,47]. Machine learning algorithms, particularly deep learning models and convolutional neural networks used for automated feature detection, classification, and pattern recognition in satellite imagery, are fundamentally dependent on the representativeness, quality, and cultural appropriateness of their training datasets, which must encompass diverse archaeological contexts, environmental conditions, and cultural landscapes to function effectively across different geographic and cultural settings [48,49,50].
The development and deployment of AI systems [51] for archaeological applications [52] has been overwhelmingly dominated by institutions with substantial computational resources, advanced technical expertise, and access to high-performance computing infrastructure, primarily located in technologically advanced countries with well-established computer science departments, remote sensing research programs, and collaborative networks linking academic institutions with technology companies and government agencies [53,54]. This concentration reflects the substantial barriers to entry for meaningful AI development and deployment, including stringent requirements for GPU-accelerated computing systems capable of training complex neural networks, access to large-scale, high-quality training datasets that require extensive curation and validation, specialized expertise in machine learning, computer vision, and archaeological interpretation that combines technical skills with domain knowledge, and sustained funding for long-term research and development activities that can extend over multiple years before producing practical applications. The result is a technological landscape where the most powerful analytical tools for archaeological remote sensing are developed by and for research contexts that may not be representative of global archaeological diversity.
This review was designed to systematically identify, analyze, and synthesize the available literature on Earth observation applications in archaeology, with a particular focus on identifying geographical disparities and technological access patterns between these two geographical contexts.
2. Methodology
The methodology incorporated both quantitative bibliometric analysis and qualitative content synthesis to provide a comprehensive assessment of the field’s development, geographic distribution, and technological evolution over the 25-year study period from 2000 to 2025 [55]. The year 2000 was selected as the starting point, as it marks the advent of high-resolution commercial satellite sensors (e.g., IKONOS), which enabled a new era of archaeological and heritage-related Earth observation research [9]. This mixed-methods approach was selected to capture broad patterns in research output and publication trends as well as nuanced insights into technological applications, barriers to access, and collaborative relationships that might not be apparent through purely quantitative analysis [56].
Scopus was selected as the sole source for bibliometric data because it provides the most comprehensive coverage of peer-reviewed journals in the fields of Earth observation, remote sensing, and archaeology, while also offering standardized metadata (including author affiliations, keywords, and DOIs) necessary for reliable comparative analysis [9,57]. The database provides robust search capabilities with advanced Boolean operators, field-specific searching, and sophisticated filtering options that make it particularly suitable for complex interdisciplinary queries spanning multiple academic domains and publication types [58]. In contrast, Web of Science offers narrower journal coverage in the humanities and applied sciences, and Google Scholar—while broader—lacks the metadata quality, transparency, and deduplication mechanisms required for rigorous bibliometric work.
Four complementary search queries were developed to capture different aspects of the research domain, following established systematic review protocols for search strategy development and validation [59,60]. This process was based on the Preferred Reporting Items for Systematic Reviews and Meta-Analyses (PRISMA) methodology review [61], ensuring in this way the transparency, reproducibility, and completeness of the survey. This survey employed a keyword-based approach rather than field-of-research classifications, since the remote sensing literature is fragmented, as noted in previous reviews [3,9] The use of Earth observation technologies in archaeology is evident across multiple disciplines and areas of expertise, reflecting its multidisciplinary nature.
The first query focused on core remote sensing applications in archaeology, combining terms related to satellite and aerial remote sensing technologies with archaeological and cultural heritage applications. The second query specifically targeted artificial intelligence and machine learning applications in archaeological remote sensing, reflecting the growing importance of these technologies in the field. The third query explicitly searched for studies addressing geographic disparities, digital divides, or bias in remote sensing applications. The fourth query captured broader applications in archaeological survey and heritage management contexts (see Table 1).

Table 1.
Search strategy performance and literature coverage.
The search was conducted in August 2025, using the Scopus Advanced Search interface. Query 1, focusing on core remote sensing archaeology applications, retrieved 5124 records, representing the largest subset of the literature. Query 2, targeting AI and machine learning applications, identified 317 records, reflecting the more specialized nature of these technological approaches. Query 3, explicitly addressing geographic and equity issues, yielded only 48 records, suggesting limited scholarly attention to these concerns within the published literature. Query 4, capturing broader archaeological remote sensing applications, identified 85 additional records, bringing the total initial retrieval to 5574 records across all four search strategies.
As the search was limited to the period 2000–2025 for papers published as journal research articles, conference papers, and review papers, further papers from the initial query have been excluded (4573 papers from Query 1; 272 papers from Query 2; 44 papers from Query 3; and 72 papers from Query 4). The remaining papers totaled 4961 records.
Given the overlapping nature of the search queries, systematic deduplication was essential to ensure accurate analysis. The deduplication process followed established protocols using Electronic Identifier (EID) matching as the primary method, as Scopus assigns unique EIDs to each indexed publication regardless of variations in citation format. The identification of 371 duplicate records across the four queries, representing a 7.5% duplication rate, indicated that the four search strategies successfully captured distinct but complementary aspects of archaeological remote sensing research. From the remaining papers, 231 papers were manually excluded as their topic was not aligned with the scope of this study. Screening was performed by combining the “Subject Area” filter in Scopus to remove non-relevant material with a manual review of titles and abstracts conducted by the author. Therefore, the final dataset comprising 4359 archaeologically relevant publications was further screened and processed by the author. The dataset encompasses research spanning from traditional satellite imagery interpretation to cutting-edge artificial intelligence applications, confirming the comprehensive nature of the search strategy in capturing genuine archaeological applications of Earth observation technologies across diverse geographic and temporal contexts.
The above dataset was also compared and discussed against the overall growth of scientific papers in the domains of remote sensing and earth observation. Therefore, a similar approach (query) was followed again in the Scopus engine, using the terminology “satellite remote sensing” or “earth observation”, limiting our findings to the period between 2000 and 2025 and only for papers published as journal research articles, conference papers, or review papers. In total, 173,474 papers were published within this period.
Study locations and author institutional affiliations were classified according to established United Nations geographic groupings supplemented by World Bank income classifications to capture both the geographic and economic dimensions of global inequality. As mentioned earlier, the Global North classification includes North America (United States and Canada), Europe (including European Union member states, the United Kingdom, Norway, Switzerland, and Iceland), and developed Asia-Pacific regions (Japan, South Korea, Australia, and New Zealand). The Global South classification encompasses Africa, Latin America and the Caribbean, and developing Asia (including China, India, Southeast Asia, Central Asia, and the Middle East). Moreover, information related to the UNESCO World Heritage Sites has been retrieved, as shown in Figure 1.
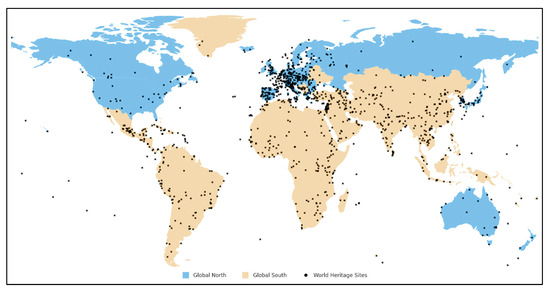
Figure 1.
Global North/South classification per this study.
3. Results
3.1. Temporal Distribution and Research Evolution Patterns
Analysis of publication years within the archaeologically relevant dataset reveals significant temporal trends that demonstrate the explosive growth of archaeological remote sensing research, particularly in the most recent decade. The temporal distribution demonstrates unprecedented acceleration in research output, with over 47% of all archaeological remote sensing research published in just the last five years of the study period. Table 2 compares the temporal distribution and growth of publications in archaeological Earth observation (EO) with those in Earth observation overall between 2000 and 2025 for the top 10 countries. Archaeological EO shows a sharp acceleration, from just 117 publications (2.7%) in 2000–2004 to 2059 (47.2%) in 2020–2025, marking a +3626% growth rate across the period. In contrast, Earth observation overall grew from 13,551 publications (7.8%) to 72,454 (41.8%), corresponding to +1180% growth. Despite its smaller absolute scale, Archaeological EO demonstrates a much stronger relative expansion, especially in the last decade, indicating its increasing importance within the broader EO domain. Figure 2 visualizes the findings as follows: the number of publications related to Earth observation and archaeology (Figure 2a), the percentage of these publications by country (Figure 2b), the total number of Earth observation publications per country (Figure 2c), and their percentage distribution (Figure 2d).
Table 2.
Temporal distribution and growth analysis (2000–2025).
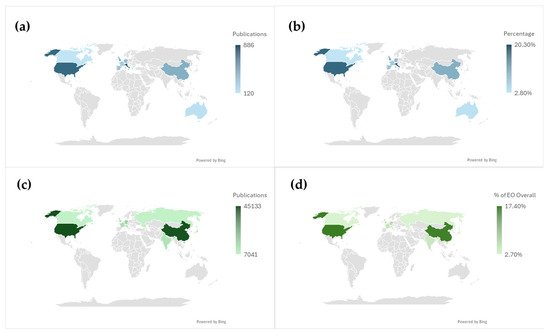
Figure 2.
A map visualizing the temporal distribution and growth analysis (2000–2025). Publications related to Earth observation and archaeology: (a) the number of publications per country, (b) the percentage of publications per country, (c) the total number of Earth observation publications per country, and (d) the percentage distribution of Earth observation publications per country.
The early foundational period from 2000 to 2005 produced only 117 publications (2.7% of the total), representing the initial exploration of satellite imagery applications in archaeological contexts when high-resolution commercial satellites were first becoming available. The foundation-building period from 2005 to 2009 witnessed steady growth to 396 publications (9.1% of the total), reflecting growing acceptance of remote sensing methodologies within the archaeological community (Figure 3). As shown in Figure 3, archaeological-related publications showed modest beginnings in 2000–2004, followed by sharp accelerations: +239% in 2005–2009, +66% in 2010–2014, +72% in 2015–2019, and a further +82% in 2020–2025. Earth observation overall follows a steadier but large-scale expansion, +50%, +38%, +39%, and +86%, in the same periods. Although the absolute volume of Earth observation publications is substantially higher, archaeological EO demonstrates a consistently stronger relative growth, especially in the last two decades. This pattern suggests that archaeological Earth observation is increasingly consolidating its role within the broader EO domain, gaining visibility and momentum at a faster pace relative to the general field.
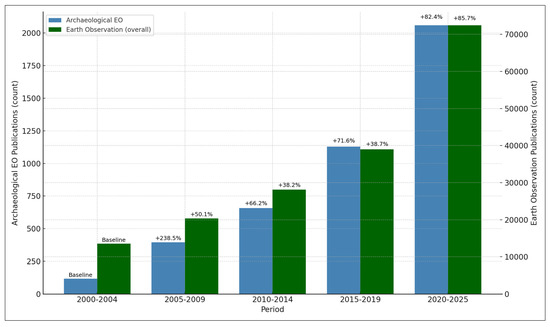
Figure 3.
Temporal distribution of scientific publications (2000–2025).
Indeed, the expansion period from 2010 to 2014 produced 658 publications (15.1% of the total). The rapid expansion period from 2015 to 2019 reached substantial output, with 1129 publications (31.8% of the total), reflecting the establishment of archaeological remote sensing as a solid subdiscipline, driven by the launch of the Copernicus Sentinel missions providing free, high-quality satellite imagery and increased availability of open-access historical satellite archives [16,62].
Most remarkably, the recent acceleration period from 2020 to 2025 produced 2059 publications (47.0% of the total) despite representing only five years, indicating extraordinary growth in research output, with a particular emphasis on computational approaches, machine learning applications, and integration with emerging technologies [44,46].
3.2. Geographic Distribution and Regional Research Patterns
Analysis of author affiliations shows that archaeological remote sensing research is regionally concentrated, with pronounced Global North–Global South gaps reflecting unequal access to technology, infrastructure, and institutional capacity. This geographic pattern provides empirical evidence of concentration and its implications for equity in heritage protection (Table 3).
Table 3.
Top contributing countries and research distribution (counts reflect papers with at least one author from country.).
Based on institutional affiliation analysis of the dataset (n = 4359), Italy is the largest contributor with 886 publications (20.3%), followed by the United States with 726 (16.7%), the United Kingdom with 438 (10.0%), and China with 380 (8.7%). These patterns are consistent with differences in national investment in Earth observation infrastructure and strong university programs [63]. Importantly, Greece (4.3%), though a smaller research system, holds a significant Mediterranean position, demonstrating its disproportionate influence compared to its size. By contrast, in the broader EO landscape, China (17.0%) nearly matches the United States (17.4%), illustrating its rise as a dominant global hub. Europe remains strong through Germany, the UK, France, and Italy, but with smaller shares than in archaeological EO. This comparison highlights how countries like Italy and Greece are over-represented in Archaeological EO, while China’s global weight is more visible in overall EO.
European countries collectively show strong output in archaeological remote sensing. Germany contributes 319 publications (7.3%), Spain 289 (6.6%), France 250 (5.7%), and Greece 187 (4.3%). This distribution aligns with coordinated EU funding, shared ESA–Copernicus infrastructure, and the region’s dense archaeological resource base requiring advanced monitoring [62,64,65,66].
3.3. Regional Analysis and Global North–South Disparities
Using first-listed author affiliation to assign each paper to one region, the Global North accounts for 3438 publications (78.9%) and the Global South for 789 (18.1%), with 132 (3.0%) unassigned (in cases of international organization publications)—an overall ~4.4:1 Global North–Global South ratio. Within the first region, Europe dominates with 2663 (61.1%), followed by North America with 607 (13.9%) and developed Asia-Pacific with 168 (3.9%). On the Global South side, China leads with 339 (7.8%), then the Middle East/North Africa with 204 (4.7%), South Asia with 103 (2.4%), Latin America with 92 (2.1%), Sub-Saharan Africa with 26 (0.6%), and Other East Asia with 25 (0.6%). Table 4 summarizes this information along with the number of UNESCO World Heritage Sites per region.
Table 4.
Regional distribution and global equity analysis.
North America, led by the United States and Canada, accounts for 607 publications (13.9%), reflecting substantial government and institutional investment in satellite technology and archaeological research. Europe is the dominant contributor, with 2663 publications (61.1%), benefiting from coordinated multinational programs and shared ESA–Copernicus infrastructure. Taken together, the Global North produces 3438 publications (78.9%), while the South contributes 789 (18.1%). This imbalance is visible when viewed against heritage distribution: Global South regions host 645 UNESCO World Heritage Sites (51.7%) yet generate under one-fifth of the research output.
Within the South, China contributes 339 publications (7.8%) and hosts 60 World Heritage Sites (4.8%), indicating relatively high research intensity compared with its site share, though most work targets domestic applications. For instance, during the period 2000–2025, 78.9% of the total publications were generated from the North region compared to only 18.1% of the South areas (Figure 3). Other developing regions are markedly under-represented relative to heritage significance: Sub-Saharan Africa hosts 117 World Heritage Sites (9.4%) but accounts for only 26 publications (0.6%); Latin America and the Caribbean host 154 World Heritage Sites (12.3%) but contribute 92 publications (2.1%); and the Middle East/North Africa hosts 151 World Heritage Sites (12.1%) but contributes 204 publications (4.7%). These gaps are especially concerning in areas facing acute protection challenges, where research capacity lags conservation need.
Figure 4 presents a comparative analysis of the distribution of publications between the two regions in both archaeological Earth observation (EO) and Earth observation overall for the period 2000–2025. Within archaeological EO, the Global North produces 3438 publications (81.3%), whereas the Global South contributes 789 publications (18.7%). When contrasted with the broader EO domain, however, a different pattern emerges: the North accounts for 88,387 publications (65.3%), while the South contributes a comparatively larger share of 46,950 publications (34.7%).
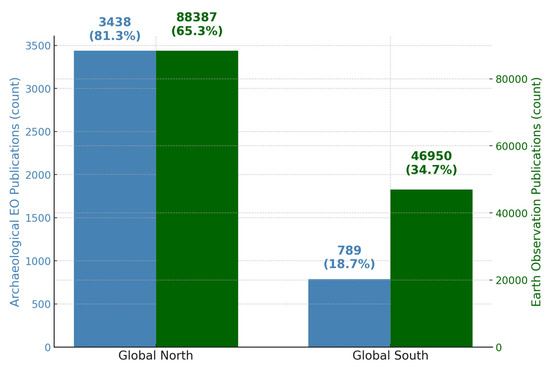
Figure 4.
Global North vs. Global South publications during the period 2000–2025.
This situates archaeological Earth observation within its disciplinary context and reveals that the under-representation of the South is not merely a reflection of global publication asymmetries but is amplified in the archaeological subfield. Whereas the broader EO domain demonstrates a gradual narrowing of the North–South gap, archaeological EO exhibits a more entrenched imbalance. This finding underscores that the issue is not simply the expected predominance of the North in scientific production but a disproportionate exclusion of the Global South from a field directly relevant to its cultural and archaeological heritage.
The Research Intensity Index (RII), defined as the ratio of a region’s share of publications to its share of World Heritage Sites, can be used as a metric as it indicates over- or under-representation in research. We can therefore interpret the RII as follows: Very High (RII ≥ 2.5) signals strong over-representation, with much more research than site share; High (1.5 ≤ RII < 2.5) indicates clear over-representation; Moderate (0.8 ≤ RII < 1.5) reflects research roughly proportional to site share; Low (0.5 ≤ RII < 0.8) denotes under-representation; and Very Low (RII < 0.5) denotes strong under-representation. The findings of the RII metric for the period 2000–2025 per region are depicted in Figure 5. Again, the differences between these areas are obvious (except for China, as discussed below).
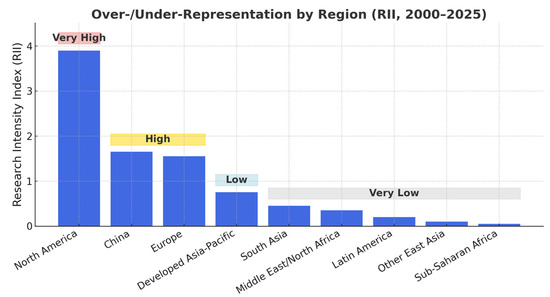
Figure 5.
Research Intensity Index by region.
3.4. Technological and Methodological Evolution Patterns
Furthermore, analysis of research content shows that most studies rely on open multispectral missions—notably Landsat (TM/ETM+/OLI/TIRS, 30 m) and Sentinel-2 MSI (10–20 m)—for diachronic change detection, spectral indices, and cost-effective baselines [62,63,67]. Very-high-resolution (VHR) commercial sensors (e.g., WorldView-2/3, GeoEye-1, Pléiades/Pléiades-Neo, SPOT-6/7, PlanetScope/SkySat, Gaofen) support feature-scale site mapping, looting assessment, and excavation planning; WorldView-3 SWIR is frequently used for material discrimination [68,69]. SAR usage has risen markedly since ~2015, with Sentinel-1 (C-band) for all-weather monitoring, ALOS-1/2 PALSAR (L-band) for vegetation/moisture penetration and ground condition mapping, and TerraSAR-X/COSMO-SkyMed (X-band) for fine-texture change and deformation analysis [70,71,72,73].
Thermal/SWIR data—Landsat TIRS, ASTER VNIR/SWIR/TIR, and WorldView-3 SWIR—support material classification, paleohydrology, and burn scar/soil mark detection [68,74]. Spaceborne hyperspectral has become a promising frontier, with PRISMA and EnMAP enabling pigment/mineral/soil spectral unmixing and subtle landscape process detection [75,76,77]. Topographic products such as SRTM and TanDEM-X DEMs underpin landscape modeling, viewsheds, and change detection [78,79]. Historic CORONA (KH-4) imagery remains invaluable for sub-meter baselines in site discovery and long-term landscape change analysis [80,81]. Across the corpus, satellite scenes appear in >85% of publications and GISs remain ubiquitous (≈60–70%), with growing multi-sensor fusion (optical + SAR + DEM) feeding contemporary machine learning workflows.
4. Discussion
4.1. Advancing Fair Access to Heritage Protection Technologies
The record shows a digital divide in heritage protection, with high-end capabilities clustered in certain regions and limited availability where resources are most at risk. The ≈4.4:1 ratio between Global North and Global South research output (78.9% vs. 18.1%), despite Global South regions hosting 51.7% of UNESCO World Heritage Sites, represents a fundamental failure and gap of current approaches to technological development and dissemination. While this observation is obviously for the entire period of this study (i.e., between 2000 and 2025), as shown in Figure 6, a steady increase in papers from the Global South is reported, which should be primarily linked with increased recording of relevant publications from China (see Section 4.3).
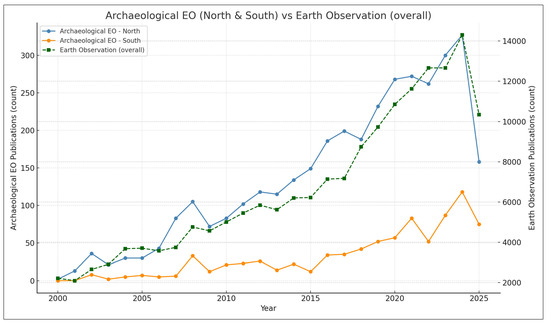
Figure 6.
Publications per year (2000–2025) for Global South against Global North. Earth observation-related publications are also indicated with green (secondary Y-axis).
Sub-Saharan Africa’s representation of only 0.6% of research output while hosting 9.4% of UNESCO World Heritage Sites exemplifies this, indicating massive under-representation with profound implications for heritage protection capacity. The region faces severe threats to archaeological heritage, including rapid urbanization, climate change impacts, armed conflict, and extractive industry development, yet lacks access to remote sensing technologies essential for modern heritage monitoring [82,83].
This capacity gap has consequences that go well beyond academia, implicating the long-term protection and management of cultural heritage. When primary tools for documenting and monitoring archaeological heritage are developed by well-resourced institutions for their contexts, there is a risk that diverse approaches to understanding cultural landscapes will be replaced by standardized frameworks inappropriate for all cultural contexts.
The concentration of artificial intelligence development in North institutions creates additional risks of algorithmic “colonialism”, where automated heritage detection systems encode cultural assumptions inappropriate for diverse global heritage contexts. When AI systems are trained primarily on specific landscapes and well-documented sites, their application to other environments may systematically under-represent important cultural resources.
Funding analysis from the available references indicates diverse support mechanisms including national research councils (such as the National Social Science Fund of China), though many publications lack explicit funding acknowledgments, potentially indicating either unfunded research or different reporting practices across regions and institutions. The presence of both government and private funding sources suggests multiple pathways for supporting archaeological remote sensing research, though the distribution of funding appears uneven across geographic regions.
Figure 7 illustrates the regional distribution of publications in archaeology using Earth observation research from 2000 to 2025, expressed as the share of total output per year. Europe consistently dominates the field, accounting for the largest share throughout the period, although its relative proportion shows fluctuations over time. North America also maintains a significant but smaller share, while Asia demonstrates a steady increase, particularly after 2015, reflecting the region’s growing research capacity and investment in space-based applications. Latin America, the Middle East, Oceania, and Africa remain under-represented, with Africa showing only a marginal contribution despite its extensive cultural heritage and research needs. The “Other” category captures a persistent portion of publications, indicating contributions from international organizations. Overall, the chart highlights enduring regional disparities, with the Global North maintaining dominance but Asia emerging as a notable contributor in recent years.
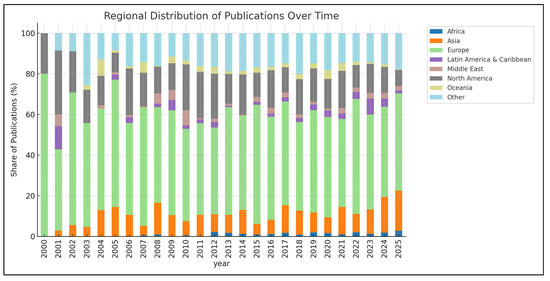
Figure 7.
Publications per year (2000–2025) per region.
4.2. The European Model and the Acceleration Paradox
As mentioned earlier, European institutions account for 61.1% of global archaeological remote sensing output, illustrating how coordinated regional approaches can lift capacity beyond what individual countries might achieve alone. Key drivers include shared technological infrastructure through ESA’s Copernicus program, coordinated EU funding frameworks, and complementary national strengths in archaeological heritage and remote-sensing technology. Italy is the largest single-country contributor at 20.3%, reflecting both its exceptional archaeological heritage and deep integration in European collaboration networks and technology investment.
Countries such as Greece (4.3%) show how strong heritage assets, combined with access to shared infrastructure, can sustain notable research productivity even in smaller economies. Replicating the European model elsewhere will require tailoring to local historical, institutional, and economic contexts; for the Global South, this may mean prioritizing South–South collaboration networks, regional centers of excellence that build capability without dependency, and staged technology transfer programs that progressively develop local capacity [84].
With 47.2% of all papers published in 2020–2025 (2059 of 4359; +82.4% vs. 2015–2019), the field’s acceleration creates a paradox: sophistication expands possibilities while erecting new barriers to participation. It should be mentioned that comparable regional initiatives are also emerging in the Global South. In Latin America, programs such as SERVIR Amazonia [85] promote EO capacity building, while in Africa, the GMES & Africa initiative [86] fosters regional EO services and training. Although smaller in scope and less heritage-focused than Europe’s, these efforts highlight the potential of regional models beyond the European context.
The rapid uptake of AI (see [48,87,88,89]) promises major gains in site discovery and monitoring, yet it depends on substantial computing resources, specialist expertise, and suitable training datasets that many communities lack. This acceleration is especially challenging for Global South institutions still building basic remote sensing capacity as the field shifts toward compute-intensive methods and advanced infrastructure. The growth pattern also raises questions about sustainability and whether the pace of development fosters unrealistic expectations for purely technological solutions to heritage protection.
4.3. The Chinese Case Study
China’s position as the fourth-largest contributor to archaeological remote sensing research—accounting for 8.7% of global output—presents a complex case that challenges simple Global North–South categorizations while raising questions about technological sovereignty and research autonomy in archaeological applications [13,90]. China’s substantial output reflects major state investment in satellite technology and archaeological research infrastructure, demonstrating how national commitment to technological development can rapidly build research capacity in previously under-represented regions.
At the same time, Chinese publishing patterns reveal limitations that distinguish its position from traditional Global North leaders. Much of the work centers on domestic heritage sites and applications rather than international collaboration or methods with broad global applicability. Nearly one-fifth of the relevant records from China are Chinese-language publications (n = 66). This pattern suggests that, despite significant technological capacity, research remains relatively insulated from international networks and may exert limited influence on global methodological development and collaborative frameworks. Nevertheless, this appears to be changing, particularly over the last decade.
The Chinese case illustrates both the potential and limits of nationally focused capacity building in archaeological remote sensing. While substantial public investment can rapidly expand technical capabilities and publication output, weak ties to international collaboration may constrain global impact and the transferability of findings. Technological capacity in this field requires not only access to satellites and computational resources but also integration with international research communities and collaborative infrastructures. For other Global South countries seeking independent capacity, the Chinese experience suggests that sustained international collaboration and knowledge sharing are essential complements to investment, maximizing both global impact and practical application.
Nevertheless, steps forward have been made, mostly driven by China. Figure 8 compares the share of publications between the two geographic areas from 2000 to 2025. The Global North initially dominates the field with nearly 100% of publications in 2000, but its share shows a gradual decline over time, falling to around 60% by 2025. In contrast, the Global South starts from a marginal contribution, but its share steadily increases, particularly after 2010, reaching close to 40% by 2025. This trend highlights a narrowing gap between the two regions, suggesting growing research participation and capacity in the Global South—mainly due to China—though the North continues to hold the majority share. The overall pattern indicates a slow but significant shift toward greater global inclusivity in Earth observation-related archaeological research. Notably, the proportions shown in Figure 8, especially for 2025, align closely with the standard pattern documented in Earth observation research (see Figure 4).
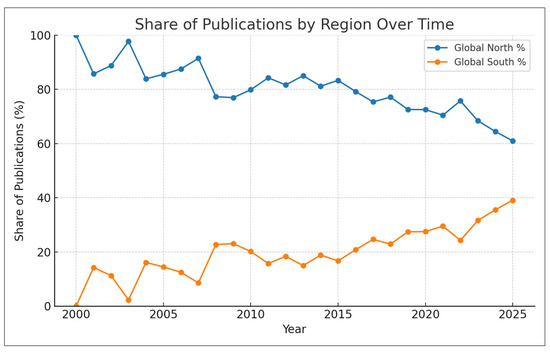
Figure 8.
Share (%) of publications per year (2000–2025) per region.
4.4. Pathways Toward Technological Justice
International funding agencies need to restructure their approaches to prioritize comprehensive capacity building over short-term technology transfer, with explicit requirements for Global South leadership and sustainability. This includes supporting regional collaborative networks enabling peer-to-peer knowledge sharing, investing in computational infrastructure and educational programs building local expertise, and funding culturally appropriate technology development. The “Endangered Archaeology in the Middle East and North Africa” (EAMENA) initiative [91] as well as other similar projects are some examples of this approach.
Moreover, efforts should be made in the domain of AI systems with globally representative training datasets, creating simplified analytical tools and providing essential capabilities without requiring advanced infrastructure, establishing open-source development communities, and enabling meaningful Global South participation.
Educational institutions should recognize technology transfer as legitimate scholarly activity deserving professional recognition equivalent to traditional research. This includes developing appropriate evaluation metrics extending beyond publication counts, creating interdisciplinary curricula integrating technological training with cultural sensitivity, and establishing international partnership programs prioritizing capacity building.
5. Conclusions
This systematic review of 4359 unique publications spanning 25 years documents both extraordinary growth and profound geographic disparities in archaeological remote sensing. Quantitatively, 47.2% of all output appears in 2020–2025, while 78.9% originates from North institutions—even though the Global South hosts 51.7% of UNESCO World Heritage Sites (the Global North hosts 48.3%). At the same time, the overall trend of the scientific field of Earth observation was studied for comparison purposes.
The temporal analysis shows near-exponential growth: output rose by ≈1661% from 2000–2004 to 2020–2025. This acceleration signals that remote sensing has become central to archaeological practice, driven by advances in satellites, computing, and AI. Yet growth is concentrated geographically, reinforcing rather than easing global inequalities.
Just three countries—Italy (20.3%), the United States (16.7%), and the United Kingdom (10.0%)—account for ≈47% of global output, while regions with the greatest protection challenges remain under-represented. Sub-Saharan Africa contributes only 0.6% of research despite hosting 9.4% of WHSs, a stark capacity gap with direct implications for heritage protection. This gap between the two regions is also wider than that observed in the general Earth observation field (Figure 3), although it has narrowed in recent years (Figure 6).
The crisis extends beyond publication counts to cultural survival, equity, and excellence in a digital era where Earth observation technologies are essential for safeguarding heritage [92,93,94,95,96,97,98]. When tools are developed mainly by well-resourced institutions for their own contexts, diverse ways of reading cultural landscapes risk being displaced by standardized frameworks ill suited elsewhere. The concentration of AI development in Global North institutions adds risks of algorithmic “colonialism”: models trained largely on well-documented sites can underperform in other environments. The concentration of artificial intelligence development in Global North institutions, evident in sophisticated applications like the vision transformer research achieving 98.1% settlement recognition accuracy [99], creates additional risks of algorithmic colonialism where automated heritage detection systems encode cultural assumptions and analytical frameworks that may be inappropriate for diverse global heritage contexts.
Europe’s success illustrates what coordinated regional approaches can achieve—shared infrastructure and funding enabling productivity beyond any single country. The lack of analogous frameworks across much of the Global South underscores the need for institutional interventions that tackle structural barriers to cooperation and capacity building.
Acceleration creates both opportunity and risk. Without deliberate action to broaden access to data, computer, and training resources, rising technical sophistication may harden global stratification rather than reduce it. Heritage sites are under threat globally due to the same reasons: climate change, urbanization, and conflict intensify threats to sites worldwide. Concentrated capabilities leave many at-risk places without effective monitoring. The evidence base here supports concrete strategies for a more equitable technological pathway—recognize heritage protection as a global public good, move beyond market-only logics, and invest in coordinated measures that address structural inequalities—so the demonstrable potential of archaeological remote sensing benefits all communities, not just the best resourced.
Of course, we need to acknowledge that the present analysis is bounded by several methodological and conceptual constraints. First, it adopts the Global North–Global South dichotomy as the principal analytical lens. While this binary provides a widely recognized heuristic for examining structural asymmetries, it inevitably obscures other salient dimensions of research capacity, including the possession of national space programs, environmental constraints such as persistent cloud cover in tropical and equatorial regions, the uneven global distribution of cultural heritage resources, and the heterogeneity of national research and heritage management policies. China, in particular, presents a case that challenges the simplicity of the North–South binary. While classified within the Global South, China simultaneously operates as a global leader in space technology and Earth observation research. Its dual position highlights the limitations of rigid categorizations and underscores the need for frameworks that account for both structural inequalities and emerging scientific powers.
Second, the exclusive reliance on Scopus as a bibliometric source introduces potential coverage biases. Although Scopus offers extensive metadata and robust analytical functionality, its indexing practices tend to favor journals from established publishers and high-income regions, and may therefore under-represent scholarly outputs from the Global South, particularly those disseminated through regional or local outlets. These limitations suggest that the disparities documented here should be regarded as conservative estimates, and they highlight the importance of future work that incorporates multiple bibliometric databases and alternative classificatory frameworks.
Funding
This paper was supported by the ENGINEER and CONNECTING project. The CONNECTING project has received funding from the European Regional Development Fund and the Republic of Cyprus through the Research and Innovation Foundation of Cyprus under contract SMALL SCALE INFRASTRUCTURES/1222/0062. The ENGINEER project has received funding from the European Union’s Horizon Europe Framework Programme (HORIZON-WIDERA-2021-ACCESS-03, Twinning Call) under the grant agreement no. 101079377 and the UKRI under project number 10050486.
Data Availability Statement
No new data were created or analyzed in this study. Data sharing is not applicable to this article.
Acknowledgments
The author acknowledges the use of language editing tools (Grammarly (2025)) and AI-based assistants (ChatGPT (version GPT-5) by OpenAI, Claude (version 4.5) by Anthropic) to improve the readability and grammar of the manuscript. The author has reviewed and edited the output and takes full responsibility for the content of this publication.
Conflicts of Interest
The author declares no conflicts of interest. The views and opinions expressed are, however, those of the author only and do not necessarily reflect those of the European Union or the UKRI. Neither the European Union nor the UKRI can be held responsible for them.
References
- Lasaponara, R.; Masini, N. Satellite remote sensing in archaeology: Past, present and future perspectives. J. Archaeol. Sci. 2011, 38, 1995–2002. [Google Scholar] [CrossRef]
- Zingaro, M.; Scicchitano, G.; Capolongo, D. The Innovative growth of space archaeology: A brief overview of concepts and approaches in detection, monitoring, and promotion of the archaeological heritage. Remote Sens. 2023, 15, 3049. [Google Scholar] [CrossRef]
- Tapete, D. Remote sensing and geosciences for archaeology. Geosciences 2018, 8, 41. [Google Scholar] [CrossRef]
- Custer, J.F.; Eveleigh, T.; Klemas, V.; Wells, I. Application of Landsat data and synoptic remote sensing to predictive models for prehistoric archaeological sites: An example from the Delaware coastal plain. Am. Antiq. 1986, 51, 572–588. [Google Scholar] [CrossRef]
- Pope, K.O.; Dahlin, B.H. Ancient Maya wetland agriculture: New insights from ecological and remote sensing research. J. Field Archaeol. 1989, 16, 87–106. [Google Scholar] [CrossRef]
- Sever, T.L. Remote Sensing Applications in Archeological Research: Tracing Prehistoric Human Impact Upon the Environment; University of Colorado at Boulder: Boulder, CO, USA, 1990. [Google Scholar]
- Sever, T.L.; Irwin, D.E. Landscape archaeology: Remote-sensing investigation of the ancient Maya in the Peten rainforest of northern Guatemala. Anc. Mesoam. 2003, 14, 113–122. [Google Scholar] [CrossRef]
- Campana, S.R. Remote sensing in archaeology. In Encyclopedia of Geoarchaeology; Springer International Publishing: Cham, Switzerland, 2023; pp. 1–25. [Google Scholar]
- Agapiou, A.; Lysandrou, V. Remote sensing archaeology: Tracking and mapping evolution in European scientific literature from 1999 to 2015. J. Archaeol. Sci. Rep. 2015, 4, 192–200. [Google Scholar] [CrossRef]
- Opitz, R.; Herrmann, J. Recent trends and long-standing problems in archaeological remote sensing. J. Comput. Appl. Archaeol. 2018, 1, 19–41. [Google Scholar] [CrossRef]
- Evans, D.; Traviglia, A. Uncovering Angkor: Integrated remote sensing applications in the archaeology of early Cambodia. In Satellite Remote Sensing; Springer: Dordrecht, The Netherlands, 2012; pp. 197–230. [Google Scholar]
- Lasaponara, R.; Masini, N. Remote sensing in archaeology: From visual data interpretation to digital data manipulation. In Satellite Remote Sensing; Springer: Dordrecht, The Netherlands, 2012; pp. 3–16. [Google Scholar]
- Luo, L.; Wang, X.; Guo, H.; Lasaponara, R.; Zong, X.; Masini, N.; Wang, G.; Shi, P.; Khatteli, H.; Chen, F.; et al. Airborne and spaceborne remote sensing for archaeological and cultural heritage applications: A review of the century (1907–2017). Remote Sens. Environ. 2019, 232, 111280. [Google Scholar] [CrossRef]
- Stewart, C.; Lasaponara, R.; Schiavon, G. ALOS PALSAR analysis of the archaeological site of Pelusium in the Eastern Nile Delta (Egypt). Archaeol. Prospect. 2016, 23, 109–116. [Google Scholar]
- Agapiou, A. Remote sensing heritage in a petabyte-scale: Satellite data and heritage Earth Engine© applications. Int. J. Digit. Earth 2017, 10, 85–102. [Google Scholar] [CrossRef]
- Gorelick, N.; Hancher, M.; Dixon, M.; Ilyushchenko, S.; Thau, D.; Moore, R. Google Earth Engine: Planetary-scale geospatial analysis for everyone. Remote Sens. Environ. 2017, 202, 18–27. [Google Scholar] [CrossRef]
- Fu, D.; Xiao, H.; Su, F.; Zhou, C.; Dong, J.; Zeng, Y.; Yan, K.; Li, S.; Wu, J.; Wu, W.; et al. Remote sensing cloud computing platform development and Earth science application. Natl. Remote Sens. Bull. 2021, 25, 220–230. [Google Scholar] [CrossRef]
- Luo, L.; Wang, X.; Guo, H.; Jia, X.; Fan, A. Earth observation in archaeology: A brief review. Int. J. Appl. Earth Obs. Geoinform. 2023, 116, 103169. [Google Scholar] [CrossRef]
- Fisher, M.; Fradley, M.; Flohr, P.; Rouhani, B.; Simi, F. Ethical considerations for remote sensing and open data in relation to the endangered archaeology in the Middle East and North Africa project. Archaeol. Prospect. 2021, 28, 279–292. [Google Scholar] [CrossRef]
- Davis, D.S.; Buffa, D.; Rasolondrainy, T.; Creswell, E.; Anyanwu, C.; Ibirogba, A.; Randolph, C.; Ouarghidi, A.; Phelps, L.N.; Lahiniriko, F.; et al. The aerial panopticon and the ethics of archaeological remote sensing in sacred cultural spaces. Archaeol. Prospect. 2021, 28, 305–320. [Google Scholar] [CrossRef]
- Davis, D.S. Geographic disparity in machine intelligence approaches for archaeological remote sensing research. Remote Sens. 2020, 12, 921. [Google Scholar] [CrossRef]
- Matás, G.J.L.; Lim, J.S. Monumental funerary landscapes of Dhar Tagant (south-eastern Mauritania): Towards ethical satellite remote sensing in the West African Sahel. Archaeol. Prospect. 2021, 28, 357–378. [Google Scholar] [CrossRef]
- Mahler, A.G. What/Where is the Global South? In Oxford Bibliographies in Literary and Critical Theory; O’Brien, E., Ed.; Oxford University Press: Oxford, UK, 2017; Available online: https://www.globalsouthstudies.org/what-is-the-global-south/ (accessed on 30 August 2025).
- Joyce, K.E.; Nakalembe, C.L.; Gómez, C.; Suresh, G.; Fickas, K.; Halabisky, M.; Kalamandeen, M.; Crowley, M.A. Discovering Inclusivity in Remote Sensing: Leaving No One Behind. Front. Remote Sens. 2022, 3, 869291. [Google Scholar] [CrossRef]
- Thorpe, D. Dependent or not? From a daily practice of Earth observation research in the Global South to promoting adequate developmental spaces in science and technology studies. Geogr. Helv. 2023, 78, 105–130. [Google Scholar] [CrossRef]
- Woodcock, C.E.; Allen, R.; Anderson, M.; Belward, A.; Bindschadler, R.; Cohen, W.; Gao, F.; Goward, S.N.; Helder, D.; Helmer, E.; et al. Free Access to Landsat Imagery. Science 2008, 320, 1011. [Google Scholar] [CrossRef] [PubMed]
- Karnieli, A.; Berk, A.; Bayarjargal, Y. Remote Sensing and Geospatial Analysis in the Big Data Era: A Survey. Remote. Sens. 2024, 17, 550. [Google Scholar] [CrossRef]
- Wulder, M.A.; Coops, N.C. Satellites: Make Earth observations open access. Nature 2014, 513, 30–31. [Google Scholar] [CrossRef] [PubMed]
- Rouhani, B. From Ruins to Records: Digital Strategies and Dilemmas in Cultural Heritage Protection. In Digital Colonialism and Heritage Documentation; Routledge: Oxfordshire, UK, 2025; pp. 242–257. [Google Scholar]
- Meskell, L. A Future in Ruins: UNESCO, World Heritage, and the Dream of Peace; Oxford University Press: Oxford, UK, 2018. [Google Scholar]
- UNESCO World Heritage Centre. World Heritage List. 2024. Available online: https://whc.unesco.org/en/list/ (accessed on 24 August 2024).
- Casana, J. Emerging approaches to archaeological remote sensing. Adv. Archaeol. Pract. 2021, 9, 510–523. [Google Scholar] [CrossRef]
- Parcak, S. Archaeology from Space: How the Future Shapes Our Past; Henry Holt and Co.: New York, NY, USA, 2019. [Google Scholar]
- Comer, D.C.; Blakely, R.J. Global heritage in a digital age. J. Cult. Herit. 2020, 41, 224–231. [Google Scholar] [CrossRef]
- Davis, D.S.; Douglass, K. Aerial and spaceborne remote sensing in African archaeology: A review of current research and potential future avenues. Spat. Approaches Afr. Archaeol. 2020, 37, 9–24. [Google Scholar] [CrossRef]
- Tapete, D.; Cigna, F. Trends and perspectives of space-borne SAR remote sensing for archaeological landscape monitoring. J. Archaeol. Sci. Rep. 2019, 25, 513–525. [Google Scholar] [CrossRef]
- Forte, M.; Campana, S. Digital Methods and Remote Sensing in Archaeology: Archaeology in the Age of Sensing; Springer: Berlin/Heidelberg, Germany, 2019. [Google Scholar]
- UNESCO. Heritage Emergency Fund: Annual Progress Report 2023; UNESCO: Paris, France, 2023; Available online: https://docs.un.org/en/A/78/217 (accessed on 30 August 2025).
- UNESCO. Priority Africa: World Heritage Capacity-Building Strategy for Africa; UNESCO World Heritage Centre: Paris, Italy, 2023; Available online: https://whc.unesco.org/document/199636 (accessed on 30 August 2025).
- UNESCO. Operational Guidelines for the Implementation of the World Heritage Convention; UNESCO World Heritage Centre: Paris, France, 2022; Available online: https://icomos.es/wp-content/uploads/2024/04/document-57-39.pdf (accessed on 30 August 2025).
- Rouhani, B. Training in Endangered Archaeology: From Digital Documentation to Empowering National Heritage Stakeholders in the Middle East and North Africa. 2018. Available online: https://publ.icomos.org/publicomos/jlbSai?html=Pag&page=Pml/Not&base=technica&ref=6B9D268B4AD3835AB2B87534065A8AEE (accessed on 30 August 2025).
- Menéndez-Marsh, F.; Al-Rawi, M.; Fonte, J.; Dias, R.; Gonçalves, L.J.; Seco, L.G.; Neves, A. Geographic information systems in archaeology: A systematic review. J. Comput. Appl. Archaeol. 2023, 6, 40–50. [Google Scholar] [CrossRef]
- Trier, Ø.D.; Cowley, D.C.; Waldeland, A.U. Using deep neural networks on airborne laser scanning data: Results from a case study of semi-automatic mapping of archaeological topography on Arran, Scotland. Archaeol. Prospect. 2019, 26, 165–175. [Google Scholar] [CrossRef]
- Orengo, H.; Garcia-Molsosa, A. A brave new world for archaeological survey: Automated machine learning-based potsherd detection using high-resolution drone imagery. J. Archaeol. Sci. 2019, 112, 105013. [Google Scholar] [CrossRef]
- Bickler, S.H. Machine learning arrives in archaeology, but when do computers see like an archaeologist? Adv. Archaeol. Pract. 2021, 9, 122–136. [Google Scholar] [CrossRef]
- Davis, D.S. Object-based image analysis: A review of developments and future directions of automated feature detection in landscape archaeology. Archaeol. Prospect. 2019, 26, 155–163. [Google Scholar] [CrossRef]
- Soroush, M.; Mehrtash, A.; Khazraee, E.; Ur, J.A. Deep Learning in Archaeological Remote Sensing: Automated Qanat Detection in the Kurdistan Region of Iraq. Remote Sens. 2020, 12, 500. [Google Scholar] [CrossRef]
- Verschoof-van der Vaart, W.B.; Lambers, K. Automated detection of archaeological objects from remotely sensed data using machine learning: A review of progress and challenges. J. Archaeol. Sci. 2021, 133, 105428. [Google Scholar]
- Argyrou, A.; Agapiou, A. A review of artificial intelligence and remote sensing for archaeological research. Remote Sens. 2022, 14, 6000. [Google Scholar] [CrossRef]
- Kadhim, I.; Abed, F.M. A critical review of remote sensing approaches and deep learning techniques in archaeology. Sensors 2023, 23, 2918. [Google Scholar] [CrossRef]
- LeCun, Y.; Bengio, Y.; Hinton, G. Deep learning. Nature 2015, 521, 436–444. [Google Scholar] [CrossRef]
- Casana, J. Global-scale archaeological prospection using machine learning on satellite imagery. Proc. Natl. Acad. Sci. USA 2020, 117, 8554–8562. [Google Scholar]
- Somrak, M.; Džeroski, S.; Kokalj, Ž. Learning to classify structures in ALS-derived visualizations of ancient Maya settlements with CNN. Remote Sens. 2020, 12, 2215. [Google Scholar] [CrossRef]
- Kokalj, Ž.; Žiberna, A.; Briese, C.; Doneus, M. Machine learning-ready remote sensing data for Maya archaeology. Sci. Data 2023, 10, 24. [Google Scholar] [CrossRef]
- Aria, M.; Cuccurullo, C. bibliometrix: An R-tool for comprehensive science mapping analysis. J. Informetr. 2017, 11, 959–975. [Google Scholar] [CrossRef]
- Van Eck, N.J.; Waltman, L. Visualizing bibliometric networks. In Measuring Scholarly Impact; Springer International Publishing: Cham, Switzerland, 2014; pp. 285–320. [Google Scholar]
- Baas, J.; Schotten, M.; Plume, A.; Côté, G.; Karimi, R. Scopus as a curated, high-quality bibliometric data source for academic research in quantitative science studies. Quant. Sci. Stud. 2020, 1, 377–386. [Google Scholar] [CrossRef]
- Mongeon, P.; Paul-Hus, A. The journal coverage of Web of Science and Scopus: A comparative analysis. Scientometrics 2016, 106, 213–228. [Google Scholar] [CrossRef]
- Bramer, W.M.; Rethlefsen, M.L.; Kleijnen, J.; Franco, O.H. Optimal database combinations for literature searches in systematic reviews: A prospective exploratory study. Syst. Rev. 2017, 6, 1–12. [Google Scholar] [CrossRef]
- Lefebvre, C.; Glanville, J.; Briscoe, S.; Littlewood, A.; Marshall, C.; Metzendorf, M.I.; Noel-Storr, A.; Rader, T.; Shokraneh, F.; Thomas, J.; et al. Searching for and selecting studies. In Cochrane Handbook for Systematic Reviews of Interventions; John Wiley & Sons: Chichester, UK, 2019; pp. 67–107. [Google Scholar]
- Page, M.J.; McKenzie, J.E.; Bossuyt, P.M.; Boutron, I.; Hoffmann, T.C.; Mulrow, C.D.; Shamseer, L.; Tetzlaff, J.M.; Akl, E.A.; Brennan, S.E.; et al. The PRISMA 2020 statement: An updated guideline for reporting systematic reviews. BMJ 2021, 372, n71. [Google Scholar] [CrossRef]
- Drusch, M.; Del Bello, U.; Carlier, S.; Colin, O.; Fernandez, V.; Gascon, F.; Hoersch, B.; Isola, C.; Laberinti, P.; Martimort, P.; et al. Sentinel-2: ESA’s Optical High-Resolution Mission for GMES Operational Services. Remote Sens. Environ. 2012, 120, 25–36. [Google Scholar] [CrossRef]
- Wulder, M.A.; Loveland, T.R.; Roy, D.P.; Crawford, C.J.; Masek, J.G.; Woodcock, C.E.; Allen, R.G.; Anderson, M.C.; Belward, A.S.; Cohen, W.B.; et al. Current status of Landsat program, science, and applications. Remote Sens. Environ. 2019, 225, 127–147. [Google Scholar] [CrossRef]
- Malenovský, Z.; Rott, H.; Cihlar, J.; Schaepman, M.E.; García-Santos, G.; Fernandes, R.; Berger, M. Sentinels for science: Potential of Sentinel-1, -2, and -3 missions for scientific observations of ocean, cryosphere, and land. Remote Sens. Environ. 2012, 120, 91–101. [Google Scholar] [CrossRef]
- Abate, N.; Lasaponara, R. Preventive archaeology based on open remote sensing data and tools: The cases of Sant’Arsenio (SA) and Foggia (FG), Italy. Sustainability 2019, 11, 4145. [Google Scholar] [CrossRef]
- Agapiou, A.; Hegyi, A.; Gogâltan, F.; Stavilă, A.; Sava, V.; Sarris, A.; Floca, C.; Dorogostaisky, L. Exploring the largest known Bronze Age earthworks in Europe through medium resolution multispectral satellite images. Int. J. Appl. Earth Obs. Geoinform. 2023, 118, 103239. [Google Scholar] [CrossRef]
- Roy, D.P.; Wulder, M.A.; Loveland, T.R.; Woodcock, C.E.; Allen, R.G.; Anderson, M.C.; Helder, D.; Irons, J.R.; Johnson, D.M.; Kennedy, R.; et al. Landsat-8: Science and product vision for terrestrial global change research. Remote Sens. Environ. 2014, 145, 154–172. [Google Scholar] [CrossRef]
- DigitalGlobe. WorldView-3 Data Sheet (Instrument & SWIR Specifications). 2014. Available online: https://www.spaceimagingme.com/downloads/sensors/datasheets/DG_WorldView3_DS_2014.pdf (accessed on 30 August 2025).
- Planet Team. Planet Application Program Interface: In Space for Life on Earth; Planet Team: San Francisco, CA, USA, 2017. [Google Scholar]
- Torres, R.; Snoeij, P.; Geudtner, D.; Bibby, D.; Davidson, M.; Attema, E.; Potin, P.; Rommen, B.; Floury, N.; Brown, M.; et al. GMES Sentinel-1 mission. Remote Sens. Environ. 2012, 120, 9–24. [Google Scholar] [CrossRef]
- Werninghaus, R.; Buckreuss, S. The TerraSAR-X mission and system design. IEEE Trans. Geosci. Remote Sens. 2010, 48, 606–614. [Google Scholar] [CrossRef]
- Covello, F.; Battazza, F.; Coletta, A.; Lopinto, E.; Fiorentino, C.; Pietranera, L.; Valentini, G.; Zoffoli, S. The COSMO-SkyMed Mission: A SAR Constellation for Earth Observation. IGARSS/IEEE TGRS (Mission Overview). 2010. Available online: https://hal.science/hal-00615310/document (accessed on 30 August 2025).
- Covello, F.; Battazza, F.; Coletta, A.; Zoffoli, S. COSMO-SkyMed mission status. In Proceedings of the EUSAR 2018; 12th European Conference on Synthetic Aperture Radar, Aachen, Germany, 4–7 June 2018. [Google Scholar]
- Yamaguchi, Y.; Kahle, A.; Tsu, H.; Kawakami, T.; Pniel, M. Overview of Advanced Spaceborne Thermal Emission and Reflection Radiometerinstrument. IEEE Trans. Geosci. Remote Sens. 1998, 36, 1062–1071. [Google Scholar] [CrossRef]
- Guarini, R.; Loizzo, R.; Facchinetti, C.; Longo, F.; Ponticelli, B.; Faraci, M.; Dami, M.; Cosi, M.; Amoruso, L.; De Pasquale, V.; et al. Prisma Hyperspectral Mission Products. In Proceedings of the IGARSS 2018—2018 IEEE International Geoscience and Remote Sensing Symposium, Valencia, Spain, 22–27 July 2018; pp. 179–182. [Google Scholar]
- Shaik, R.U.; Periasamy, S.; Zeng, W. Potential Assessment of PRISMA Hyperspectral Imagery for Remote Sensing Applications. Remote Sens. 2023, 15, 1378. [Google Scholar] [CrossRef]
- Guanter, L.; Kaufmann, H.; Segl, K.; Foerster, S.; Rogass, C.; Chabrillat, S.; Kuester, T.; Hollstein, A.; Rossner, G.; Chlebek, C.; et al. The EnMAP Spaceborne Imaging Spectroscopy Mission for Earth Observation. Remote Sens. 2015, 7, 8830–8857. [Google Scholar] [CrossRef]
- Farr, T.G.; Rosen, P.A.; Caro, E.; Crippen, R.; Duren, R.; Hensley, S.; Kobrick, M.; Paller, M.; Rodriguez, E.; Roth, L.; et al. The Shuttle Radar Topography Mission. Rev. Geophys. 2007, 45, RG2004. [Google Scholar] [CrossRef]
- Krieger, G.; Zink, M.; Bachmann, M.; Bräutigam, B.; Schulze, D.; Martone, M.; Rizzoli, P.; Steinbrecher, U.; Antony, J.W.; De Zan, F.; et al. TanDEM-X: A radar interferometer with two formation-flying satellites. Acta Astronaut. 2013, 89, 83–98. [Google Scholar] [CrossRef]
- Casana, J.; Cothren, J. Stereo analysis, DEM extraction and orthorectification of CORONA satellite imagery: Archaeological applications from the Near East. Antiquity 2008, 82, 732–749. [Google Scholar] [CrossRef]
- Agapiou, A. Land cover mapping from colorized CORONA archived greyscale satellite data and feature extraction classification. Land 2021, 10, 771. [Google Scholar] [CrossRef]
- Chirikure, S. Heritage conservation in Africa: The good, the bad, and the challenges. S. Afr. J. Sci. 2013, 109, 1–3. [Google Scholar] [CrossRef]
- Brooks, N.; Clarke, J.; Ngaruiya, G.W.; Wangui, E.E. African heritage in a changing climate. Azania Archaeol. Res. Afr. 2020, 55, 297–328. [Google Scholar] [CrossRef]
- Sesay, A.; Olusola, O.K.; Omotosho, M. Africa and South–South cooperation: Opportunities and challenges. In The Rise of the Global South: Philosophical, Geopolitical and Economic Trends of the 21st Century; World Scientific Publishing Co. Pte. Ltd.: Singapore, 2013; pp. 95–123. [Google Scholar]
- SERVIR Amazonia. SERVIR Amazonia: Connecting Space to Village. 2023. Available online: https://servir.ciat.cgiar.org/ (accessed on 30 August 2025).
- Asante, K.O.; Macuácua, E.; Mutanga, O. Capacity building in Earth Observation: Experiences from GMES & Africa. Remote. Sens. Appl. Soc. Environ. 2021, 23, 100546. [Google Scholar] [CrossRef]
- Landauer, J.; Klassen, S.; Wijker, A.P.; van der Kroon, J.; Jaszkowski, A.; der Vaart, W.B.V.-V. Beyond the Greater Angkor Region: Automatic Large-Scale Mapping of Angkorian-Period Reservoirs in Satellite Imagery Using Deep Learning. PLoS ONE 2025, 20, e0320452. [Google Scholar] [CrossRef] [PubMed]
- Sobotkova, A.; Kristensen-McLachlan, R.D.; Mallon, O.; Ross, S.A. Validating Predictions of Burial Mounds with Field Data: The Promise and Reality of Machine Learning. J. Doc. 2024, 80, 1167–1189. [Google Scholar] [CrossRef]
- Fylaktos, P.; Petropoulos, G.P.; Lemesios, I. A Deep Learning Method for the Automated Mapping of Archaeological Structures from Geospatial Data: A Case Study of Delos Island. ISPRS Int. J. Geo-Inform. 2025, 14, 220. [Google Scholar] [CrossRef]
- Chen, F.; Lasaponara, R.; Masini, N. An overview of satellite synthetic aperture radar remote sensing in archaeology: From site detection to monitoring. J. Cult. Heritage 2017, 23, 5–11. [Google Scholar] [CrossRef]
- Bewley, R. Endangered archaeology in the Middle East and North Africa (EAMENA): Approach and possible solutions. In Post-Conflict Archaeology and Cultural Heritage; Routledge: New York, NY, USA, 2017; pp. 123–137. [Google Scholar]
- Cuca, B. The contribution of earth observation technologies to monitoring strategies of cultural landscapes and sites. Int. Arch. Photogramm. Remote Sens. Spat. Inf. Sci. 2017, 42, 135–140. [Google Scholar] [CrossRef]
- Xiao, W.; Mills, J.; Guidi, G.; Rodríguez-Gonzálvez, P.; Barsanti, S.G.; González-Aguilera, D. Geoinformatics for the conservation and promotion of cultural heritage in support of the UN Sustainable Development Goals. ISPRS J. Photogramm. Remote Sens. 2018, 142, 389–406. [Google Scholar] [CrossRef]
- Anderson, K.; Ryan, B.; Sonntag, W.; Kavvada, A.; Friedl, L. Earth observation in service of the 2030 Agenda for Sustainable Development. Geo-Spat. Inf. Sci. 2017, 20, 77–96. [Google Scholar] [CrossRef]
- Chen, F.; Zhou, W.; Xu, H.; Parcharidis, I.N.; Lin, H.; Fang, C. Space technology facilitates the preventive monitoring and preservation of the Great Wall of the Ming dynasty: A comparative study of the Qingtongxia and Zhangjiakou sections in China. IEEE J. Sel. Top. Appl. Earth Obs. Remote Sens. 2020, 13, 5719–5729. [Google Scholar] [CrossRef]
- Moise, C.; Lazar, A.-M.; Mihalache, C.E.; Dedulescu, L.A.; Negula, I.F.D.; Badea, A.; Poenaru, V.D.; Moise, R.; Ortan, A.R. Geomatics Technologies in the Framework of Multidisciplinary Project for Integrated Management of Cultural Heritage Sites. Int. Arch. Photogramm. Remote Sens. Spat. Inf. Sci. 2020, 46, 1477–1484. [Google Scholar] [CrossRef]
- Cannelli, S.; de Veld, F.; Gehlot, M.; Nugent, T.K.; Thangavel, K. Earth’s orbits as a UNESCO World Heritage Site. In Proceedings of the 74th International Astronautical Congress, Baku, Azerbaijan, 2–6 October 2023. [Google Scholar]
- Agapiou, A.; Lysandrou, V.; Cuca, B. Copernicus Earth Observation for Cultural Heritage. In Proceedings of the Joint International Event 9th ARQUEOLÓGICA 2.0 & 3rd GEORES, Valencia, Spain, 26–28 April 2021; pp. 259–266. [Google Scholar]
- Zhong, Q.; Luo, J.; Fang, J.; Chen, Y. Two-stage cascaded vision transformer with spatial attention for dense settlement detection in remote sensing imagery. npj Heritage Sci. 2025, 13, 211. [Google Scholar] [CrossRef]


Disclaimer/Publisher’s Note: The statements, opinions and data contained in all publications are solely those of the individual author(s) and contributor(s) and not of MDPI and/or the editor(s). MDPI and/or the editor(s) disclaim responsibility for any injury to people or property resulting from any ideas, methods, instructions or products referred to in the content. |
© 2025 by the author. Licensee MDPI, Basel, Switzerland. This article is an open access article distributed under the terms and conditions of the Creative Commons Attribution (CC BY) license (https://creativecommons.org/licenses/by/4.0/).