Article

An Approach to Refining MODIS LAI Data Using a Fitting Scale Factor Time Series

1
Collaborative Innovation Center on Forecast and Evaluation of Meteorological Disasters, Nanjing University of Information Science & Technology, Nanjing 210044, China
2
State Key Laboratory of Severe Weather, Shenyang Institute of Agricultural and Ecological Meteorology, Chinese Academy of Meteorological Sciences, Beijing 100081, China
3
Institute of Atmospheric Environment, China Meteorological Administration, Shenyang 110016, China
*
Author to whom correspondence should be addressed.
Remote Sens. 2025, 17(2), 293; https://doi.org/10.3390/rs17020293
Submission received: 22 October 2024 / Revised: 29 December 2024 / Accepted: 12 January 2025 / Published: 15 January 2025

Abstract

:
The leaf area index (LAI) serves as a key metric for tracking crop growth and can be integrated into crop models for yield estimation. Although the remote sensing LAI data provide a critical foundation for monitoring crop growth and estimating yields, the existing datasets often exhibit notable errors due to the pixel-level heterogeneity. To improve the applicability and inversion accuracy of MODIS LAI products in the Northeast China (NEC) region, this study upscaled the 500-m resolution MODIS LAI product to a 5-km resolution by initially calculating the mean value. Then, the scale factors were estimated based on the observed LAI data of spring maize. To further refine the accuracy of the remotely sensed LAI, 1-km resolution land use data were resampled to 500-m resolution, and the pixel purity of spring maize was calculated for each 5-km grid cell. The scale factor time series was fitted with and without consideration of pixel purity, and the accuracy of the adjusted LAI using these two methods was compared. Our findings demonstrate that the optimal method for fitting scale factors for spring maize LAI data is piecewise function method which combines Gaussian and quadratic polynomial functions. The time series of scale factors derived from high- and low-purity pixels, differentiated by a 50% purity threshold, resulted in improved performance in adjusting the spring maize LAI compared to traditional remote sensing LAI data. The adjusted LAI performed better in reflecting the growth characteristics of spring maize in the NEC region, with the relative mean square errors between observed and adjusted LAI of spring maize during 2016 and 2020 below 1 m2/m2. This study provides crucial support for monitoring the growth process and estimating the yield of spring maize in the NEC region and also offers valuable scientific references for the optimization and application of remote sensing data.

Graphical Abstract

1. Introduction

The leaf area index (LAI) is an important physiological parameter for quantifying vegetation growth conditions and carrying out research on surface processes; it describes the total surface area of leaves per unit of ground area [1,2,3]. The LAI plays a key role in crop canopy photosynthesis, transpiration, and heat dissipation, as well as in crop growth monitoring and yield prediction [4,5,6]. By integrating remotely sensed data into crop growth models through data assimilation, model parameters that require frequent observations can be updated, enabling crop yield estimations across large areas [7]. In recent years, many studies have demonstrated that assimilating remote sensing LAI products into crop models can effectively reduce uncertainties related to soil conditions, crop types, and crop management practices, thereby enhancing crop growth monitoring and yield prediction accuracy [8,9,10]. The crop LAI can be simulated through crop models, and data assimilation techniques combine remote sensing observation data with crop growth models, providing innovative approaches for improving the spatiotemporal estimation of the crop LAI. By assimilating MODIS reflectance products into coupled models, a continuous time-series LAI of spring maize at the regional scale can be estimated [11]. Furthermore, the LAI, as an assimilation variable, can enhance the accuracy of crop growth models in simulating spring maize yields [12].
Existing LAI products, which vary in spatial and temporal resolutions, are derived from different inversion algorithms. These algorithms are typically designed for global-scale applications, often overlooking their validity at the regional scale [13]. Since the advent of quantitative remote sensing, ensuring the accuracy of remote sensing products has been paramount. Currently, the majority of global LAI remote sensing products are generated based on nonlinear model inversion methods, which can introduce substantial errors during various stages of their application [14]. Previous studies have identified several sources of error in remote sensing LAI products, including inconsistencies in input data, inversion algorithms, land cover types, data resolution, scale effects, etc. [13,15]. A notable issue is that most retrieval algorithms, being designed for global-scale applications across various vegetation types, often fail to account for specific crop types, leading to an underestimation of the crop LAI [16].
The driving data for crop models are typically categorized into coarse, medium, and high resolutions. Medium resolution data are suitable for studies at a moderate scale, such as those simulating detailed information on crop growth and yields at the national or regional levels, including large agricultural regions or provinces [17,18]. For these crop models, LAI data are often utilized to derive regional growth parameters, especially during data assimilation processes. Therefore, acquiring high-quality LAI data from remote sensing is critical for accurate crop growth monitoring and yield modeling [19,20].
There are two primary strategies to enhance the accuracy of MODIS LAI products. One involves combining LAI values from sensors like MODIS, which provide low spatial resolution but high revisit frequency, with relatively accurate LAI values obtained from medium-resolution imagery, such as Landsat TM [21,22]. This approach can be further divided into two techniques. The first approach is to invert the LAI using the vegetation indices from moderate-resolution images and subsequently adjust the MODIS LAI time series accordingly [22]. The second option involves fusing Landsat-8 OLI data with MODIS data based on the Spatial and Temporal Adaptive Reflectance Fusion Model (STARFM) and its enhanced version, ESTARFM [21]. The second strategy employs a correction method, constructing a regression model by combining the field-measured LAI with the corresponding MODIS LAI data for regional calibration [23]. For instance, Ma et al. [24] and Feng et al. [25] adjusted MODIS LAI values to align with field-measured LAI values using a logistic function. This hybrid correction approach not only refines the consistency between satellite-derived LAI and in situ measurements, but also significantly boosts the precision of LAI estimations in localized study areas. This increased precision is particularly critical for yield prediction models, as it enhances the reliability of LAI products.
With the development of remote sensing technology, it has become possible to acquire higher spatial resolution remote sensing data. However, it is essential to acknowledge that the pursuit of higher resolution is not always advantageous for remote sensing research and applications. On the one hand, an increase in resolution is directly correlated with an escalation in data volumes and computational demands [26], which can lead to substantial challenges in data processing and analysis. On the other hand, the resolution of remote sensing data needs to match the lower resolution of driving data for application models, such as crop models. Discrepancies between these resolutions can introduce significant challenges in upscaling conversions. In LAI upscaling studies, the main approaches are point-to-area and area-to-area upscaling conversions [27,28]. For example, Su et al. [27] used the Maximum Entropy (MaxEnt) model to determine the probability distribution of sample data across various regions within the study area. This approach leverages the influence weights derived from ground-based LAI measurements, thereby converting quantitative point data into probabilistic area data. Area-to-area upscaling conversions typically use simple averaging methods, where the average value of high-resolution pixels is calculated to represent the value of a larger pixel within a low-resolution image [29]. These upscaling studies are conducted on a limited spatial scale, such as within individual fields or administrative regions. Although existing methods have achieved certain success at limited spatial scales, relying solely on these techniques still fails to meet practical application needs when considering the impact of surface heterogeneity on LAI estimation. Effectively reducing the overestimation of MODIS LAI values during the early crop growing season and the underestimation during the peak growth period [30], while ensuring that the optimized LAI accurately reflects the crop growth and development process, remains a critical issue to address.
In quantitative remote sensing, spatial scale transformation involves converting data or information from one scale to another. Transforming data from high resolution to low resolution is commonly known as upscaling, while transitioning from low resolution to high resolution is referred to as downscaling. The observed LAI data provide accurate ground truth measurements, serving as a validation standard for remote sensing-derived LAI values. Upscaling, on the other hand, helps improve the representativeness and consistency of remote sensing data over larger spatial scales. By rescaling the data, we can reduce errors in the remote sensing measurements, thereby enhancing the accuracy and applicability of MODIS LAI data. Combining remotely sensed data with accurate ground-based observation offers significant advantages [31,32]. Although the ground-level crop information is generally more accurate than that estimated by remotely sensed data, it is often limited to small areas surrounding specific sites and does not scale effectively to broader coverage. Conversely, remote sensing offers extensive coverage but may lack the detail of ground observations. Thus, the combination of remotely sensed data and ground-based observations can leverage their respective strengths and mitigate their weaknesses. Differences between agricultural plots may result in significant variability within high-resolution data. By upscaling, this complexity can be simplified, allowing for a focus on the primary spatial patterns. Additionally, upscaling enables better capture of the average conditions over large areas, making the results more representative. Our study aims to obtain LAI data at a 5-km resolution to match coarser-resolution meteorological data (e.g., CLDAS data) [33]. Meteorological data, as the driving input for crop models, are primarily used in large-scale studies related to regional climate, agricultural production, and other fields, typically at spatial resolutions of 5 km or larger [30,34]. By coupling remote sensing data with crop models through data assimilation techniques, the simulation scale can be extended from a single location to a regional level, thereby promoting large-scale crop growth modeling and yield prediction. Therefore, upscaling the MODIS LAI data to a 5-km resolution allows for better compatibility with these coarser-resolution meteorological data like CLDAS, facilitating analysis and model applications at large spatial scales. Therefore, the objectives of this study were to (1) introduce a method to upscale MODIS LAI data and refine it with measured LAI values and (2) develop a scale factor that can be used to adjust LAI values specifically for the Northeast region, thereby improving the accuracy of the adjusted LAI. The results of this research could not only improve the applicability and inversion accuracy of the MODIS LAI product in the croplands of northeast China, but also contribute basic data for further scientific research.

2. Materials and Methods

2.1. Study Region

The study area is located in Northeast China (NEC, 39°N–54°N, 135°E–116°E). It encompasses the provinces of Liaoning, Jilin, and Heilongjiang, as well as the four eastern leagues of Inner Mongolia, including Hulun Buir municipality, Tongliao municipality, Chifeng municipality, and Hinggan League (Figure 1a). The region is characterized by a temperate monsoon climate, with rain and heat occurring in the same season, which makes it a significant area for spring maize production in China. NEC contributed approximately 37.7% of the national sowing area and 41.6% of total maize production (The National Bureau of Statistics of China, available at https://www.stats.gov.cn/sj/ndsj/, Last visited on 15 September 2024). The growing season of spring maize in the region generally lasts from mid-May to early October [35,36,37].

2.2. Data Collection and Processing

2.2.1. MODIS MOD15A2H

The MOD15A2H LAI product (available at https://ladsweb.modaps.eosdis.nasa.gov/, accessed on 30 October 2023) is an 8-day synthetic 500-m resolution LAI product with a sinusoidal projection [38]. The inversion algorithm for this product is based on an empirical regression equation that models the relationship between the NDVI (Normalized Difference Vegetation Index) and LAI to serve as an alternative to the primary algorithm, which employs a 3D radiative transfer model to generate look-up tables [39,40]. MOD15A2H LAI products used in this study range in time from April to October, covering the years 2000 to 2020, and include the specific tile numbers h25v03, h25v04, h26v03, h26v04, h27v04, and h27v05. These data were preprocessed with projection conversion, mosaicking, and cropping. The satellite LAI is retrieved by multiplying the MOD15A2H product by a factor of 0.1.

2.2.2. Land Use Type Datasets

The Resource and Environmental Science and Data Centre of the Chinese Academy of Sciences (available at https://www.resdc.cn/, accessed on 29 March 2024) provides land use type datasets at 1-km spatial resolution for China. It includes the years 2000, 2010, and 2020. Between 2000 and 2020, the cropland area in the NEC region changed, primarily driven by human activities [38]. By extracting pixel points that remained unchanged from the drylands in the NEC across the years 2000, 2010, and 2020 [41], we have generated a composite raster map of drylands. This map delineates the drylands as key areas for spring maize cultivation in the NEC region (Figure 1b). The composite pixel raster is resampled to a 500-m resolution to ensure it is consistent with the MODIS product resolution.

2.2.3. Measured LAI Datasets

Measured LAI datasets included the field observation data, joint regional maize experiment data, agrometeorological crop element data focusing on dry matter and leaf area, and additional shared datasets (Table 1). The field observation data, collected between 2011 and 2012, contains 111 entries. We allocated 80% of these entries for model training and reserved the remaining 20% for validating the accuracy of model. The other data, spanning from 2016 to 2020 and comprising 69 entries, were used to evaluate the performance of the refined LAI model. The spatial distribution of the stations with LAI data for model training (2011–2012) and model validation (2016–2020) are shown in Figure 1b.
The LAI of spring maize was observed using the area method, following the operational procedures outlined in the agricultural meteorological observation guidelines. During the six key developmental stages of maize growth, at each of the 10 selected observation sites, three sampling plots were chosen, and 10 randomly selected plants were measured in each plot. During the measurement, the length ( L i j ) and maximum width ( D i j ) of the fully expanded green leaves of each sampled plant were measured. L i j was measured using a ruler along the main vein of each leaf, and D i j was measured at the widest part of the leaf. The unit for both measurements is cm, with one decimal place retained. The value of LAI was calculated according to Equation (1),
L A I = ρ × k × i = 1 m j = 1 n L i j × D i j m / S
where L A I represents the leaf area index, ρ is the plant density, and k is the correction factor, with a value of 0.7. L i j and D i j represent the length and maximum width of the j-th leaf of the i-th maize plant, respectively. m is the number of measured plants, n is the number of leaves per plant, and S is the unit land area, set to 10,000 cm2.

2.2.4. Phenology Observations of Spring Maize

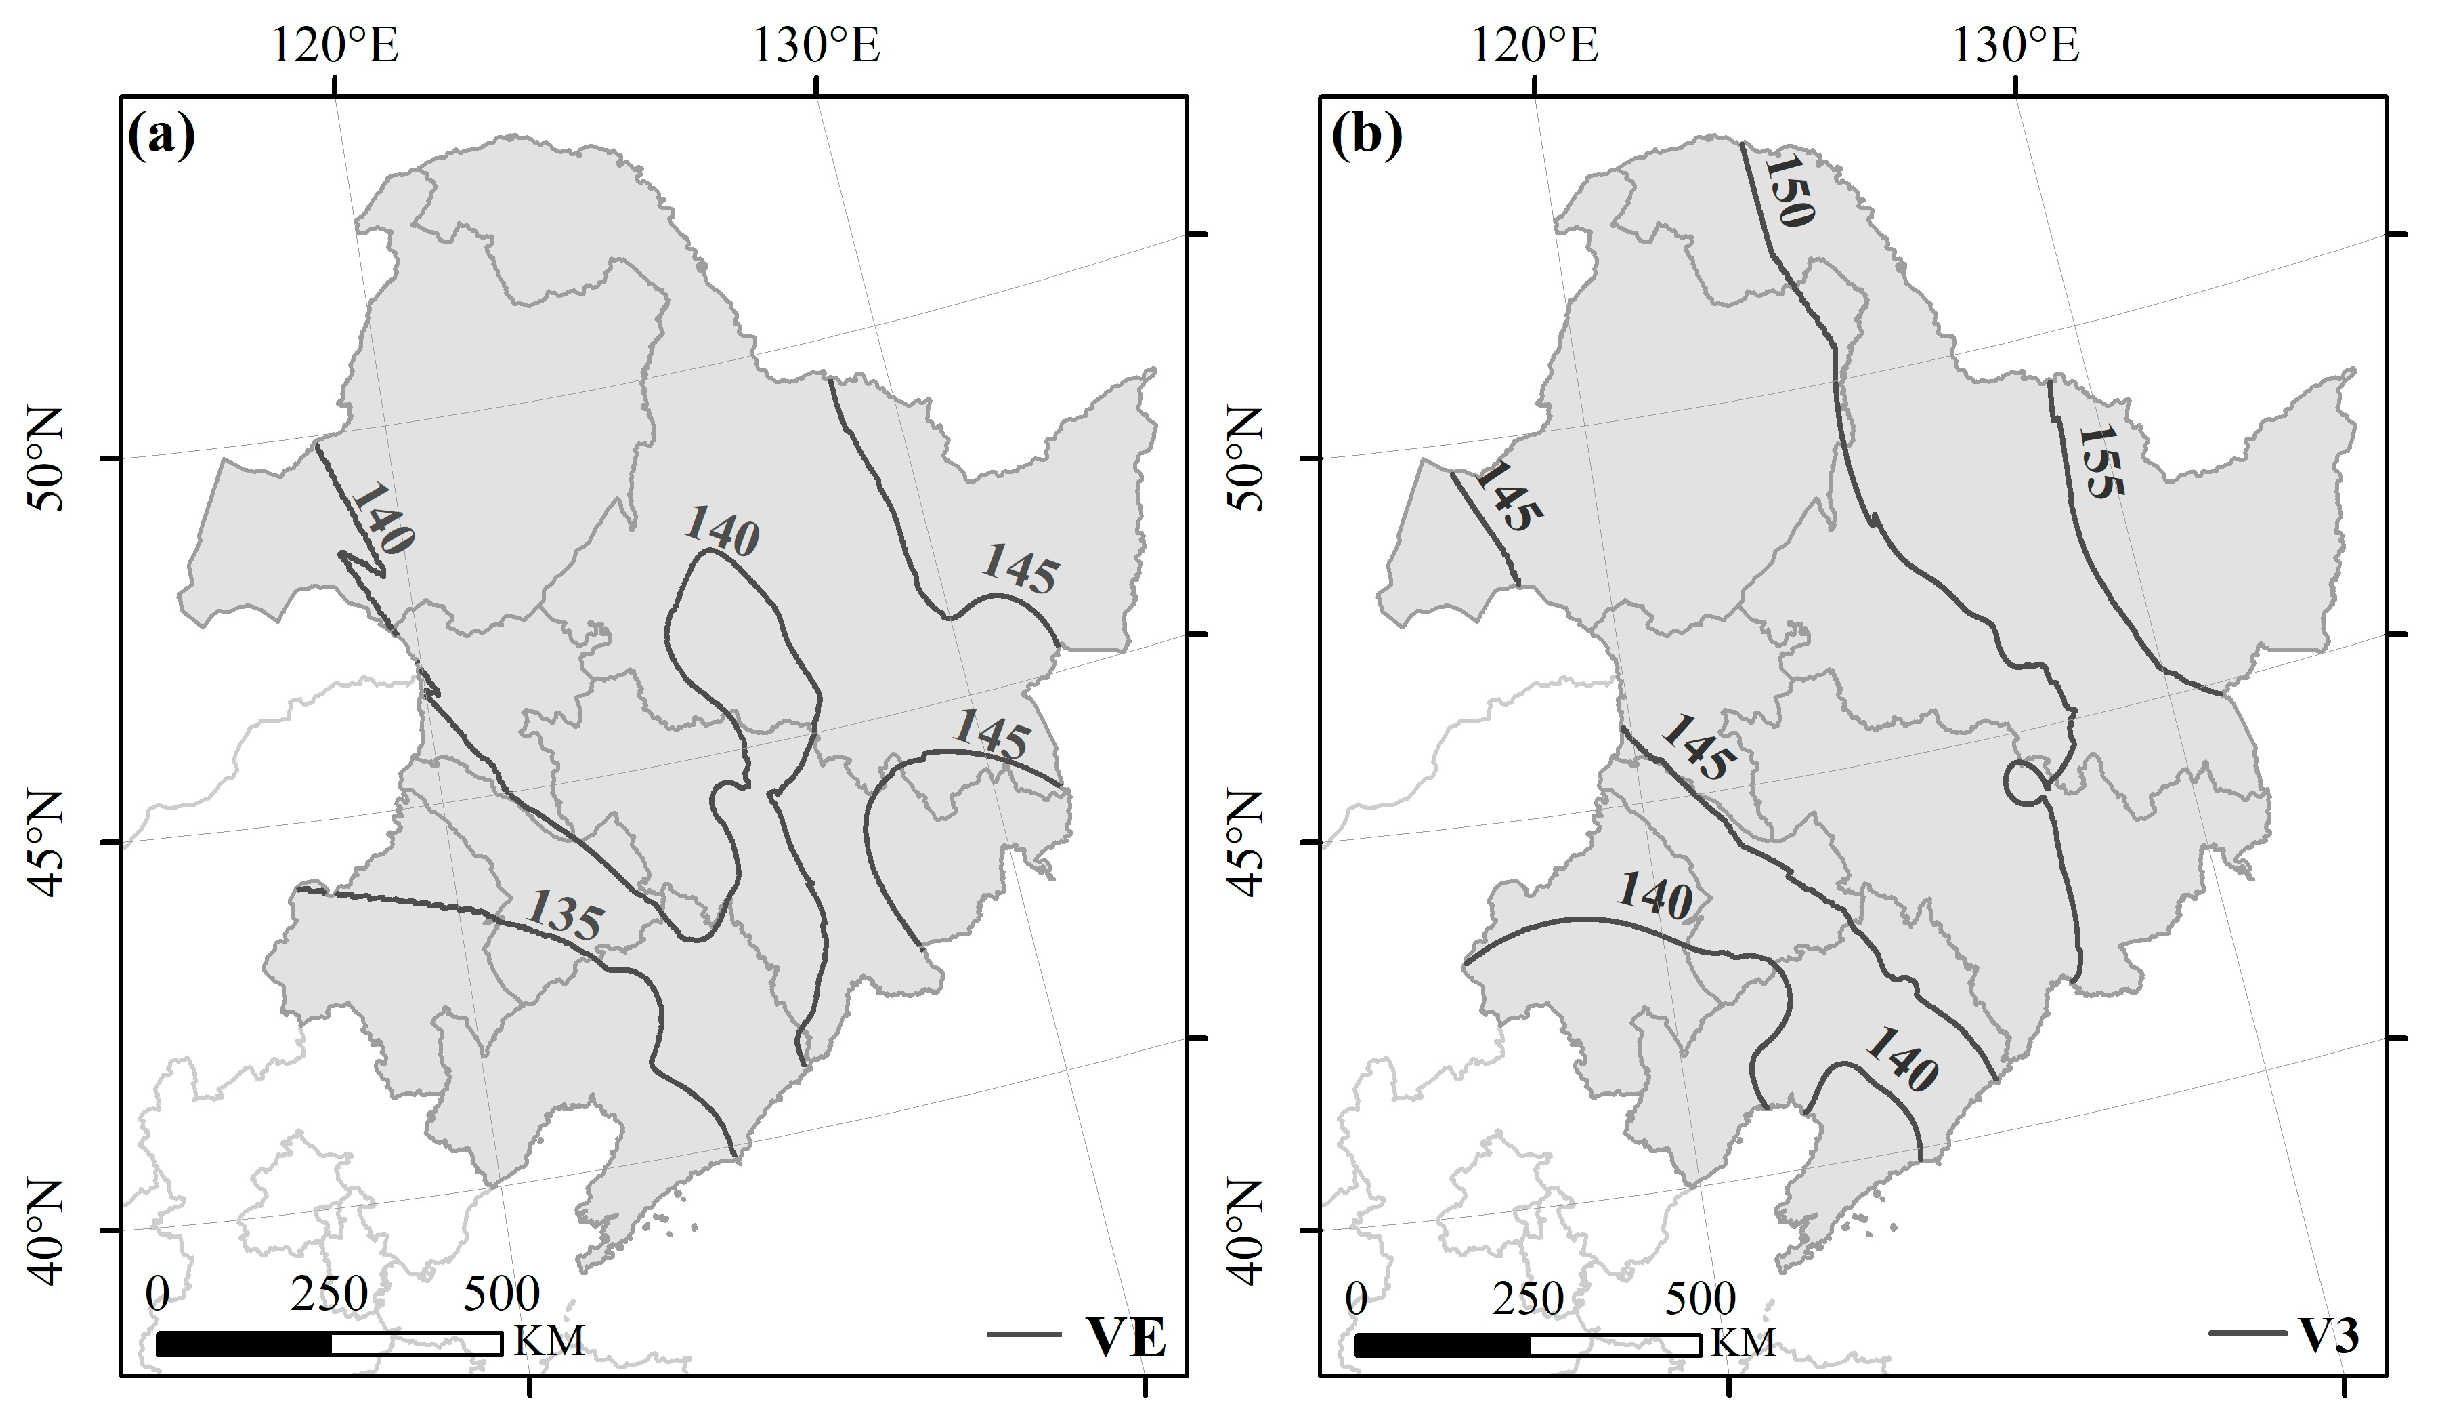
According to the agricultural meteorological observation standards developed by the China Meteorological Administration [42], data concerning the phenology of spring maize, including the emergence (VE) and three-leaf (V3) periods, were collected at agrometeorological stations in NEC (https://data.cma.cn/, accessed on 11 October 2024). Based on the VE and V3 dates of spring maize in 2011 collected from 43 agrometeorological stations across NEC, the spatial distribution of spring maize phenophases across NEC was interpolated using the inverse distance-weighted (IDW) algorithm (Figure 2). The phenophases for specific pixels and counties in this study were extracted based on the geographic coordinates of their central point locations.

2.3. Methodology

The process of upscaling and refining MODIS LAI values in relation to ground-measured LAI values in this study is illustrated in Figure 3. The dataset comprises the MOD15A2H LAI product, land use type data, and measured LAI datasets. The pixel purity of spring maize within the 5-km grid was calculated using a composite raster map derived from the land use type data. Time series of MODIS LAI images were refined using Savitzky–Golay (S–G) upper enveloped filtering to mitigate noise caused by clouds, water vapor, and aerosols. The core process for refining MODIS LAI values involves three key steps in this study: (i) upscaling the LAI to obtain a spatial resolution of 5-km; (ii) calculating the scale factor based on the ground-measured LAI and identifying the optimal scale factor time series through four different fitting methods, including quadratic polynomial fitting, Gaussian function fitting, logistic function fitting, and piecewise function fitting; and (iii) refining the LAI using the optimal scale factor time series.

2.3.1. S–G Upper Enveloped Filter

The Savitzky–Golay (S–G) filter is a weighted moving average algorithm that applies least squares fitting of a given high-order polynomial within a sliding window. It can be used on LAI time series data to mitigate noise [18,43]. The mathematical formulation of the S–G filter can be expressed by Equation (2),
L A I i S G = i = n n C i L A I i N
where L A I i represents the original LAI value, L A I i S G is the fitted value after S–G filtering, C i is the weight of L A I i , and N is the number of convolutions, which numerically equals the width of the filtering window, 2n + 1. n is half the width of the filter window.
However, the traditional S–G filtering algorithm often results in filtered points that are disproportionately closer to the maximum or minimum values of the initial curve. Therefore, we reconstructed the MODIS LAI time series using an upper envelope S–G filter. This method preserves both the original and S–G-filtered LAI time series and generates an upper envelope that encapsulates the variability within the LAI time series, as described in Equation (3):
L A I t U E = L A I t S G         w h e n       L A I t S G   L A I t O r i g i n   L A I t O r i g i n           w h e n       L A I t S G < L A I t O r i g i n
where L A I t O r i g i n is the initial LAI at time node t obtained from MODIS LAI images, L A I t S G is the S–G-filtered MODIS LAI, and L A I t U E is the upper envelope of the two time series.
The standard deviation of the upper envelope and the S–G-filtered LAI time series is used as the criterion for determining when to stop the iteration, as expressed in Equation (4).
S t d = 1 n L A I t O r i g i n L A I t S G 2
The standard deviation ( S t d ) is determined as described above. The LAI time series after S–G filtering is iteratively updated to the initial LAI time series using Equations (3) and (4) until the S t d reaches the threshold. In this study, the threshold was set to 0.08, which is an empirical value. If the threshold exceeds 0.08, the curve filtered by the upper envelope S–G filter (UE-SG) will not be smooth enough. Conversely, if the threshold is less than 0.08, completing the UE-SG filtering process will take more time.

2.3.2. Spring Maize Purity Calculation

After resampling the 1-km land use type data in Section 2.2.2 to 500-m resolution, it is overlaid with the 5-km resolution grid. Purity is defined as the proportion of spring maize pixels within each 5-km grid cell relative to the total number of pixels in that grid cell, as expressed in Equation (5).
P u r i t y = p i x e l m a i z e P i x e l × 100 %
Here, p i x e l m a i z e represents the number of spring maize pixels within a 500-m grid, and P i x e l represents the total number of pixels within a 5-km grid cell.

2.3.3. Upscaling MODIS LAI

The MODIS LAI upscaling method is divided into the following three steps:
(i)
The 500-m resolution LAI data is processed using the S–G upper envelope filtering;
(ii)
The MODIS LAI is masked using spring maize distribution data to exclude non-maize pixels;
(iii)
The average MODIS LAI value within the 5-km grid is calculated from the masked 500-m data and used as the upscaled LAI value.

2.3.4. Scale Factor Fitting

The scale factor is defined as the ratio of the measured LAI to the upscaled MODIS LAI, referred to as the mean LAI. Since the MODIS LAI data used in the study has an 8-day temporal resolution, the mean LAI time series needs to be linearly interpolated to match the dates of the measured LAI for calculating the scale factor.
S c a l e   f a c t o r = M e a s u r e d   L A I M e a n   L A I
In this study, the fitting schemes for scale factors are divided into two categories. The first one involves fitting the scale factors computed from the modeling dataset regardless of pixel purity, which simplifies the initial calculation process. The second technology refines the above approach by segmenting the modeling dataset based on purity, allowing for a more nuanced analysis that accounts for variations in land cover composition.
Our goal is to use a scale factor time series that can correct the overestimation of the MODIS LAI during the early growth season and the underestimation during the peak growth season, while ensuring that the LAI variation accurately reflects the crop’s growth and development. Therefore, the shape of the fitted scale factor time series curve should resemble the trend of the LAI time series. We have selected Gaussian functions, quadratic polynomial functions, and logistic functions. Given that quadratic polynomial fitting may result in negative values, we will set any negative values in the scale factor time series to zero during subsequent fitting processes. It is also important to note that the adjusted LAI, derived by applying the scale factor time series to correct the LAI, should remain non-negative. Therefore, we propose a piecewise fitting method that combines Gaussian and quadratic polynomial functions. In this approach, the Gaussian fitting curve will be used as the first part of the piecewise function, and the quadratic polynomial fitting curve will be used as the second part.
Based on the measured LAI at the modeling sites and the upscaled MODIS LAI (mean LAI), we calculate the scale factor corresponding to the Julian day (DOY) for the measured LAI. For each site in the modeling dataset, we apply Gaussian, quadratic polynomial, and logistic functions to fit the time series, then compute the average of the fitted curves. The piecewise function fitting is determined by selecting the average curve from the Gaussian and quadratic polynomial fits.

Scale Factor Time Series Fitting Without Purity

To construct the scale factor time series without using pixel purity, the measured LAI dataset from 2011 to 2012 was divided strategically. This dataset is partitioned, with 80% of data randomly selected to serve as modeling samples. This subset is utilized to develop various regression equations for calculating the scale factor. The remaining 20% of the measured LAI dataset was utilized as validation samples to assess the optimal fitting method for the scale factor.

Scale Factor Time Series Fitting with Purity

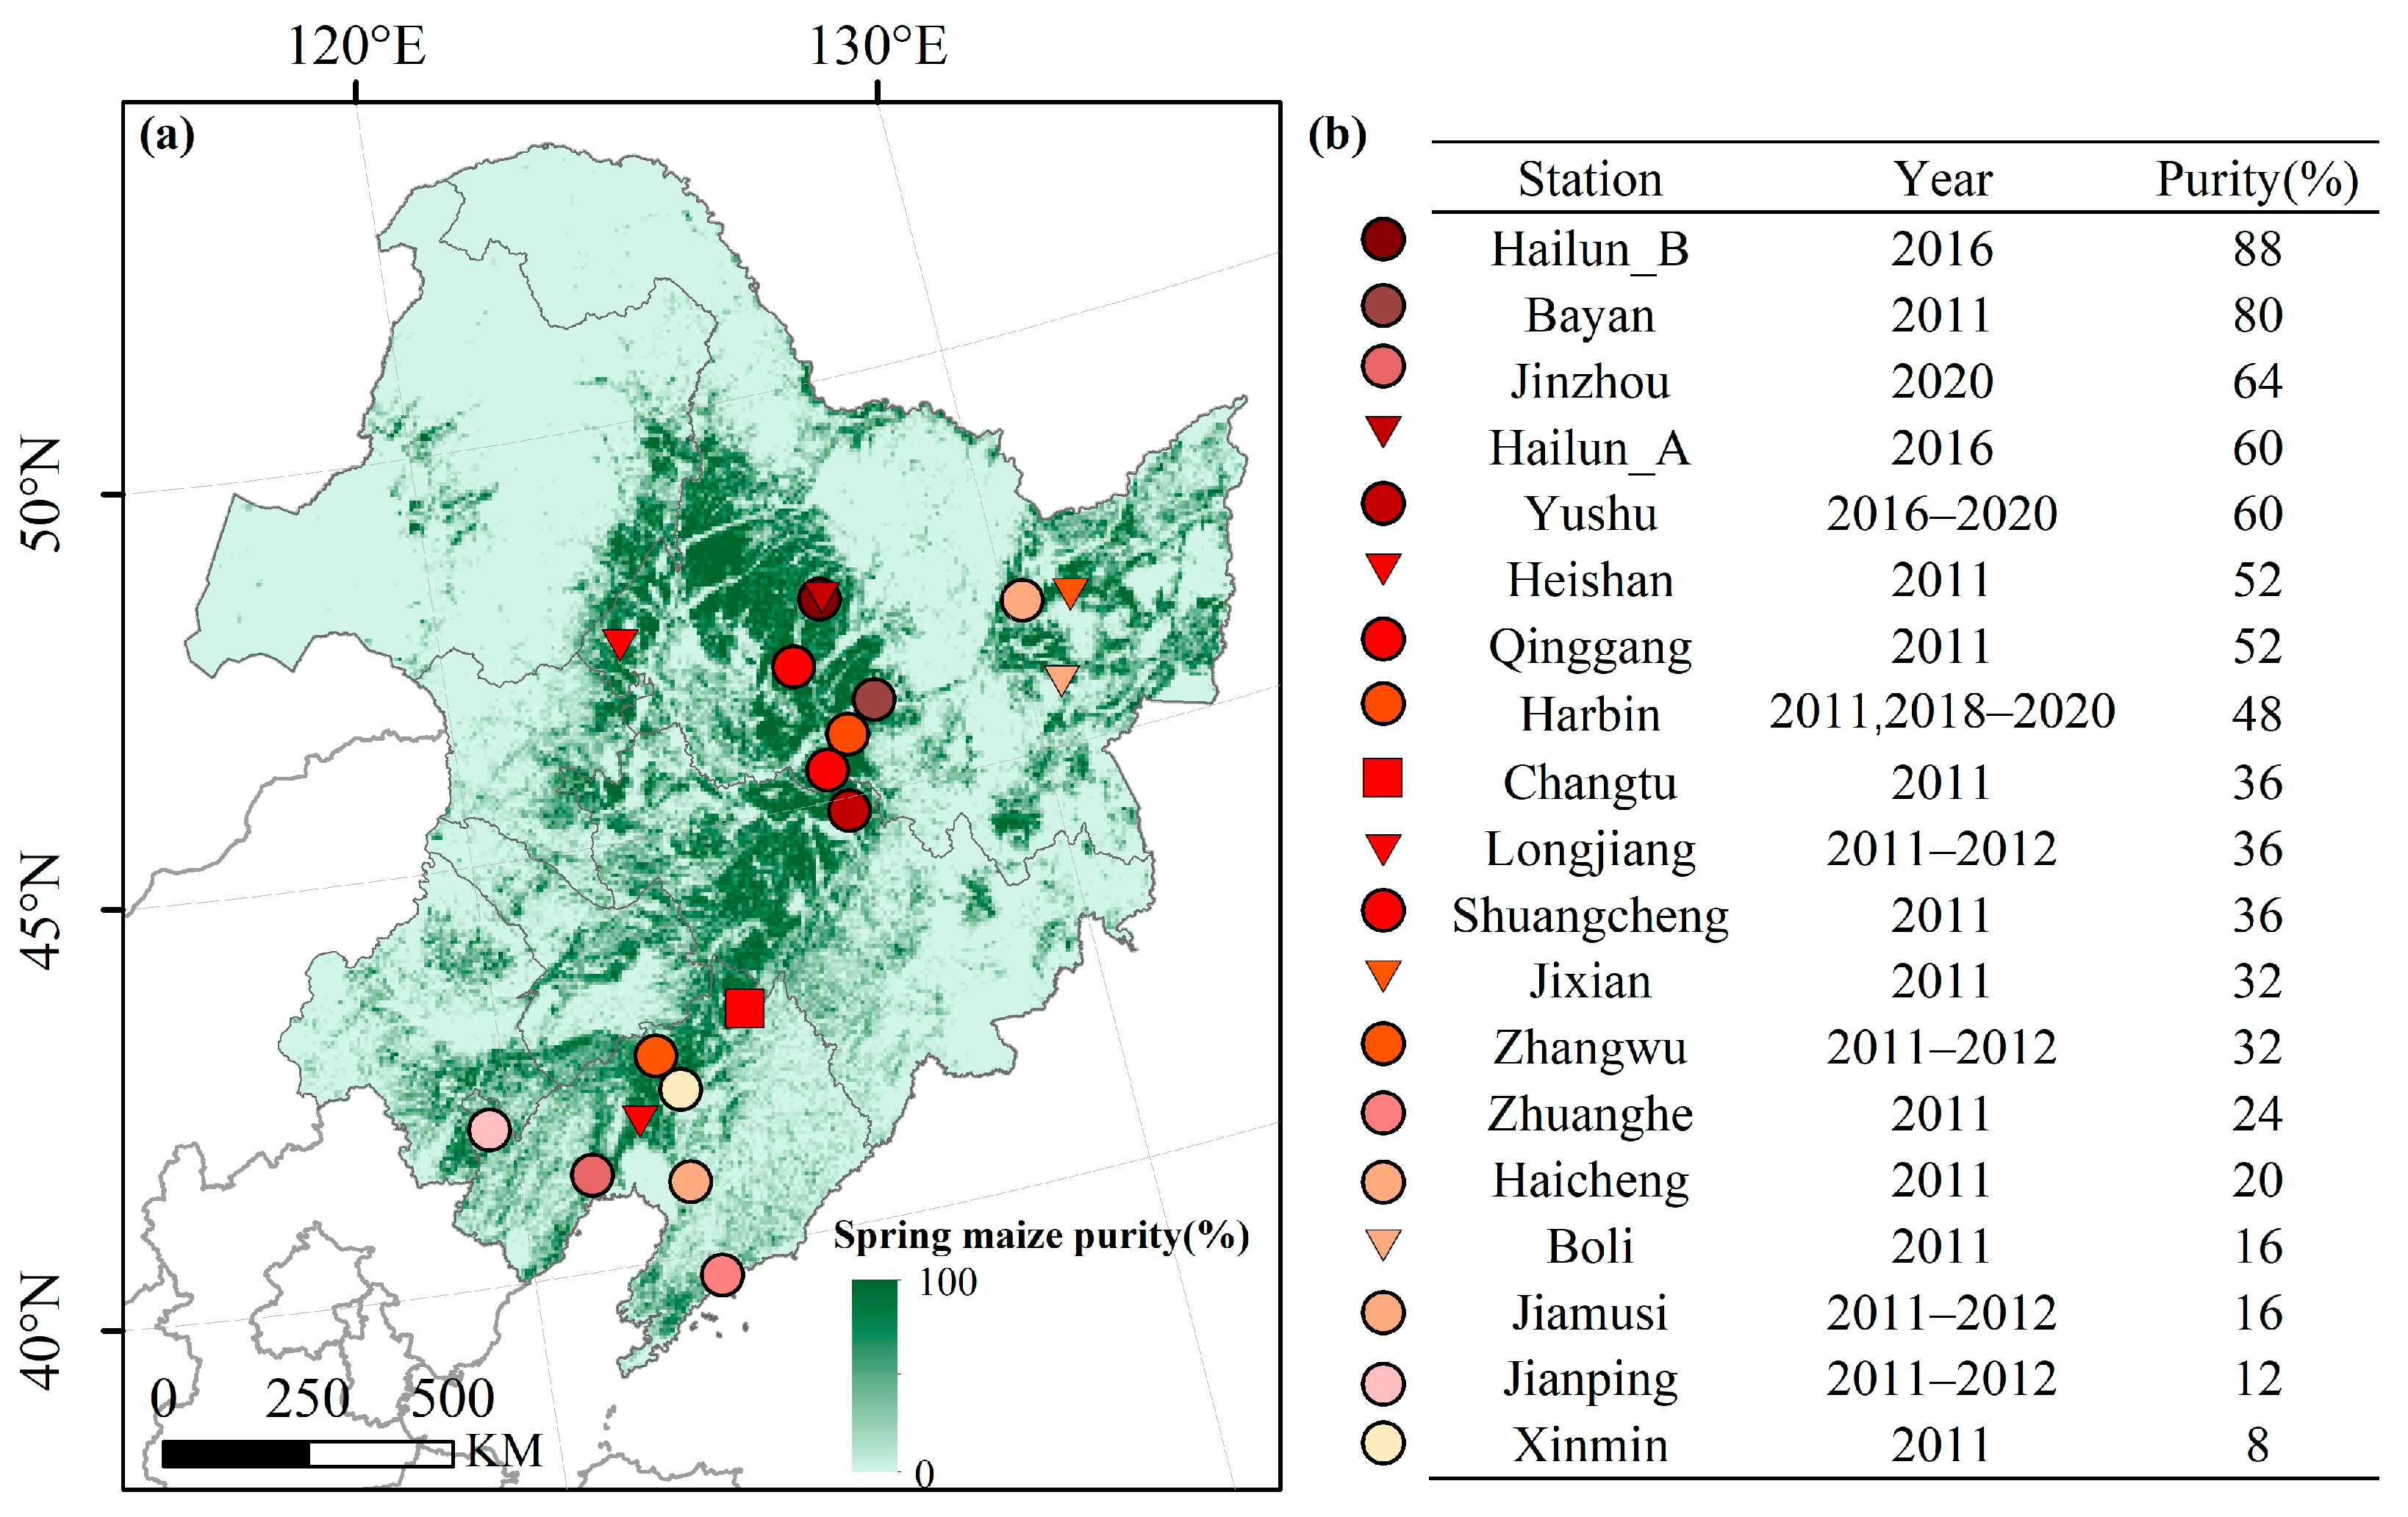
In accordance with the sample division method described in Section “Scale Factor Time Series Fitting Without Purity”, the measured LAI dataset from 2011 to 2012 was randomly divided, with 80% allocated for modeling and the remaining 20% set aside for validation. However, considering that only three sites (Bayan, Heishan, and Qinggang) belong to high-purity sites, in order to ensure that there is one high-purity site for validation among the 20% validation samples (with four sites in total), we randomly selected Bayan as the high-purity validation site, and the remaining three low-purity sites were randomly selected. The modeling samples (with 15 sites in total) included two high-purity sites and thirteen randomly selected low-purity sites. In the 5-km spring maize purity map, pixels with ≤50% purity were classified as low-maize purity pixels, while those with >50% purity were classified as high-maize purity pixels. Separate scale factor fitting was performed for the high- and low-purity pixels based on the modeled samples, resulting in distinct fitted time series for the scale factors corresponding to each purity class. The fitting functions of different scale factor time series are shown in Table 2.

2.3.5. Validation of Adjusted LAI Accuracy

To validate the accuracy of the adjusted LAI, four variables are used. The coefficient of determination ( R 2 ) quantifies the degree to which the model fits the data; the correlation coefficient ( r ) measures the linear relationship between variables; the root mean square error ( R M S E ) assesses the deviation between the adjusted LAI and the measured LAI values; and the mean absolute error ( M A E ) provides an intuitive measure of the difference between adjusted LAI and measured LAI values. R 2 and r values are indicators of model fit, with larger values indicating that the model is better at explaining the variability in the data. On the other hand, smaller values of R M S E , M A E , and similar error metrics suggest that the model has higher accuracy, as they represent lower prediction errors.
In the equations in Table 3, y represents the measured LAI values, y ¯ represents the mean of the measured LAI values, y ^ represents the adjusted LAI values, y ^ ¯ represents the mean of the adjusted LAI values, and n represents the number of measured or adjusted LAI values.

3. Results

3.1. Validation Result of Upscaled LAI

MODIS LAI products (2016–2020) were upscaled using S–G upper-envelope filtering, and the validation results for five stations are illustrated in Figure 4. The overall correlation between the upscaled LAI and the measured LAI is moderate, with a value of 0.86. However, both RMSE and MAE exceed 1 m2/m2, indicating a significant discrepancy between the upscaled and measured LAI (Figure 4l). It is notable that the upscaled MODIS LAI tends to overestimate the measured LAI, particularly at values near 0 and within the range of 4–6 m2/m2. The adjusted results at each station indicated a similar trend (Figure 4a–k). During the early growing season, when LAI values are typically low, using the mean LAI as the upscaled LAI results in an overestimation when compared to the measured LAI. Conversely, during the peak growing season, when LAI values are high, the upscaled LAI does not fit well with the measurements for most stations. Specifically, compared to the measured LAI data for spring maize, the upscaled LAI values in Harbin (Figure 4e,g,i) and Jinzhou (Figure 4j) were underestimated. In contrast, the upscaled LAI values at other sites were generally higher than the observed data in NEC.

3.2. Spring Maize Pixel Purity

Using the method for calculating purity described in Section 2.3.2, a 5-km grid was overlaid on the resampled 500-m land use map to generate a pixel purity map of spring maize. This map was derived based on the percentage of spring maize in each grid cell (Figure 5a). Out of a total of 49,787 pixels, the 7317 grids where the spring maize planting area exceeded 50% accounted for 14.7% of all grid points. The detailed stations with different spring maize pixel purities and observed years are shown in Figure 5b.

3.3. Scale Factor Fitted with Different Methods and Pixel Purities

From 2011 to 2012, 80% of the measured LAI data at 15 stations across NEC was randomly selected as the modeling dataset to calculate the scale factor of the mean LAI without purity at each station. Although all four methods for fitting the scale factors without purity passed the significance test with p < 0.01, the piecewise function fit (the combination of Gaussian and quadratic polynomial functions) performed better (R2 = 0.48) in fitting the scale factor than the quadratic polynomial fit (R2 = 0.47), the Gaussian fit (R2 = 0.38), and the logistic fit (R2 = 0.32, Table 4). When fitting the scale factor curves based on pixel purity, a purity threshold of 50% was used to divide pixels into low-purity (≤50%) and high-purity (>50%) groups. For sites with low-purity pixels, although the R² values for all four fitting methods passed the significance test at p < 0.01, the Gaussian function performed best, with an R2 of 0.53. In contrast, the fitting of scale factors for high-purity sites generally showed better results than for low-purity sites, with all R2 values exceeding 0.8 and passing the significance test at p < 0.01.

3.4. Comparison of Adjusted Result with Measured LAI

3.4.1. Adjust LAI for Fitting Scale Factors Without Purity

Accuracy of the 2011–2012 Reserved Validation Dataset

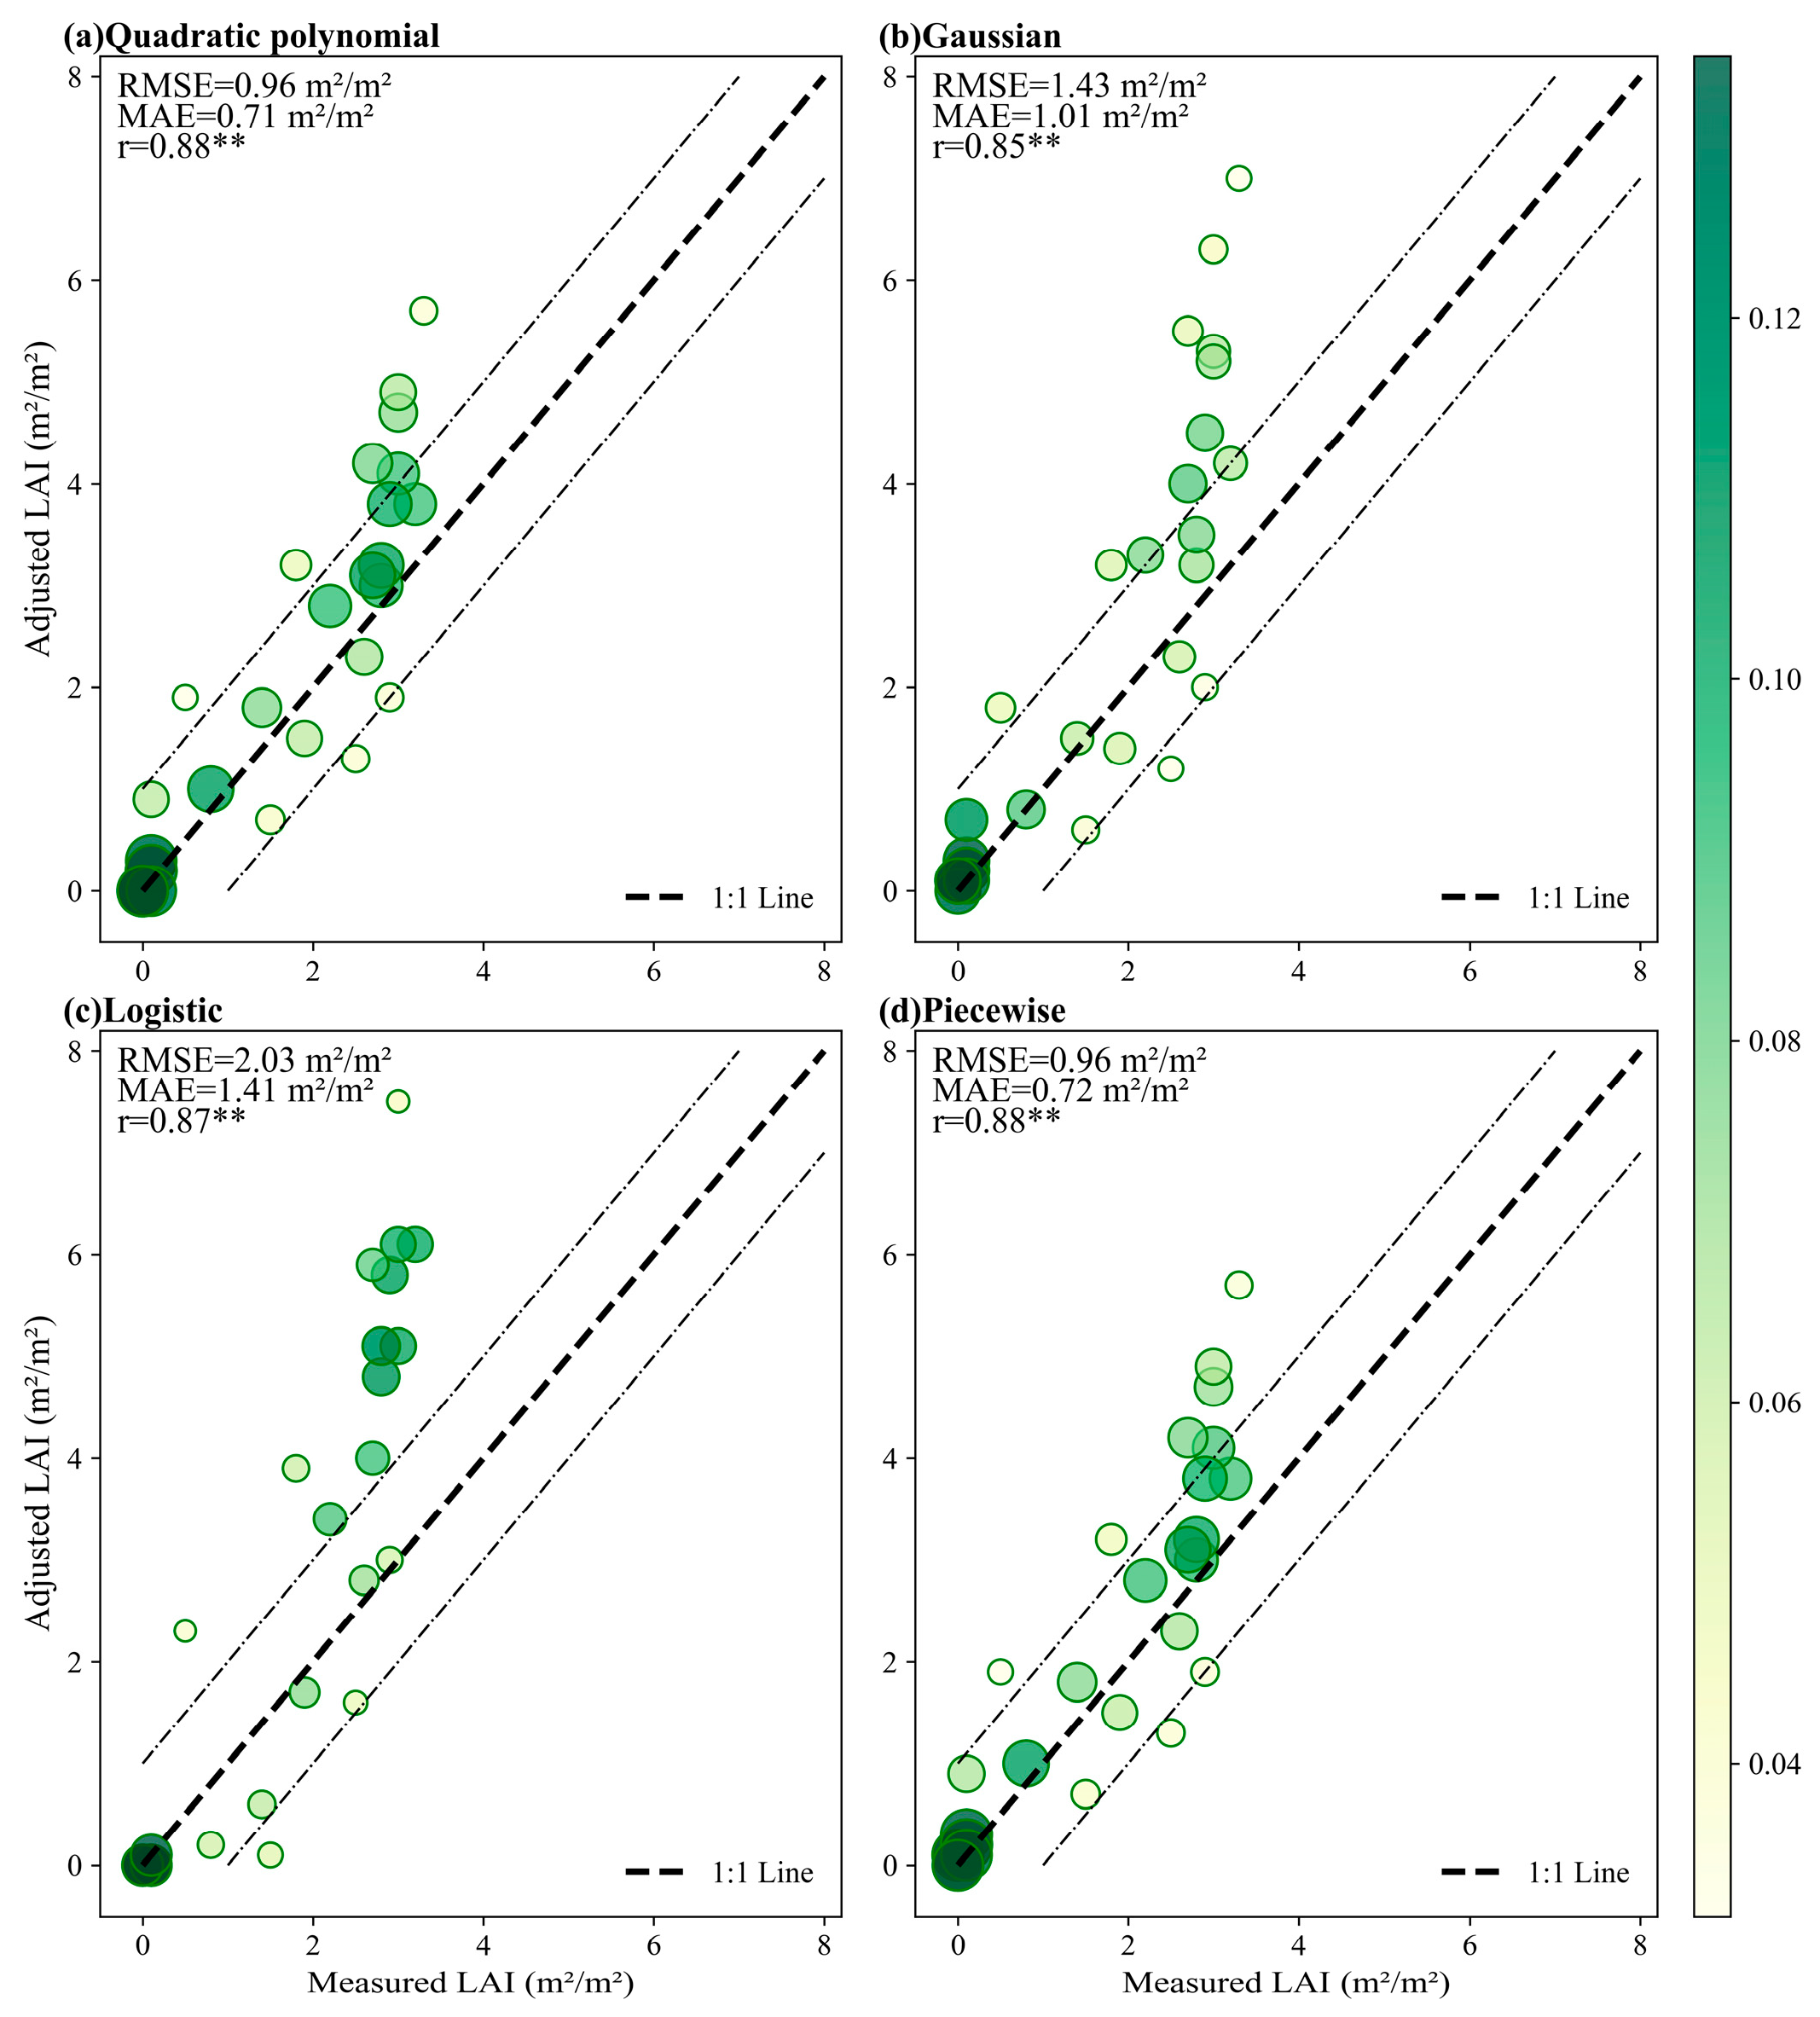
The scale factor time series obtained from four fitting methods were applied to adjust the upscaled LAI in the 20% validation dataset (Figure 6). Comparison of the validation results showed that the adjusted accuracy of the scale factors derived from quadratic polynomial and piecewise function fitting was relatively high, with a correlation coefficient (r) of 0.88. In contrast, the adjusted accuracy of the scale factors derived from Gaussian and logistic function fitting was poor, with both RMSE and MAE exceeding 1 m2/m2. Notably, the overestimation of LAI was particularly evident when the LAI values were between 2 and 4 m2/m2. Overall, the quadratic polynomial and piecewise function fitting methods were selected to revise the remote sensing LAI dataset.
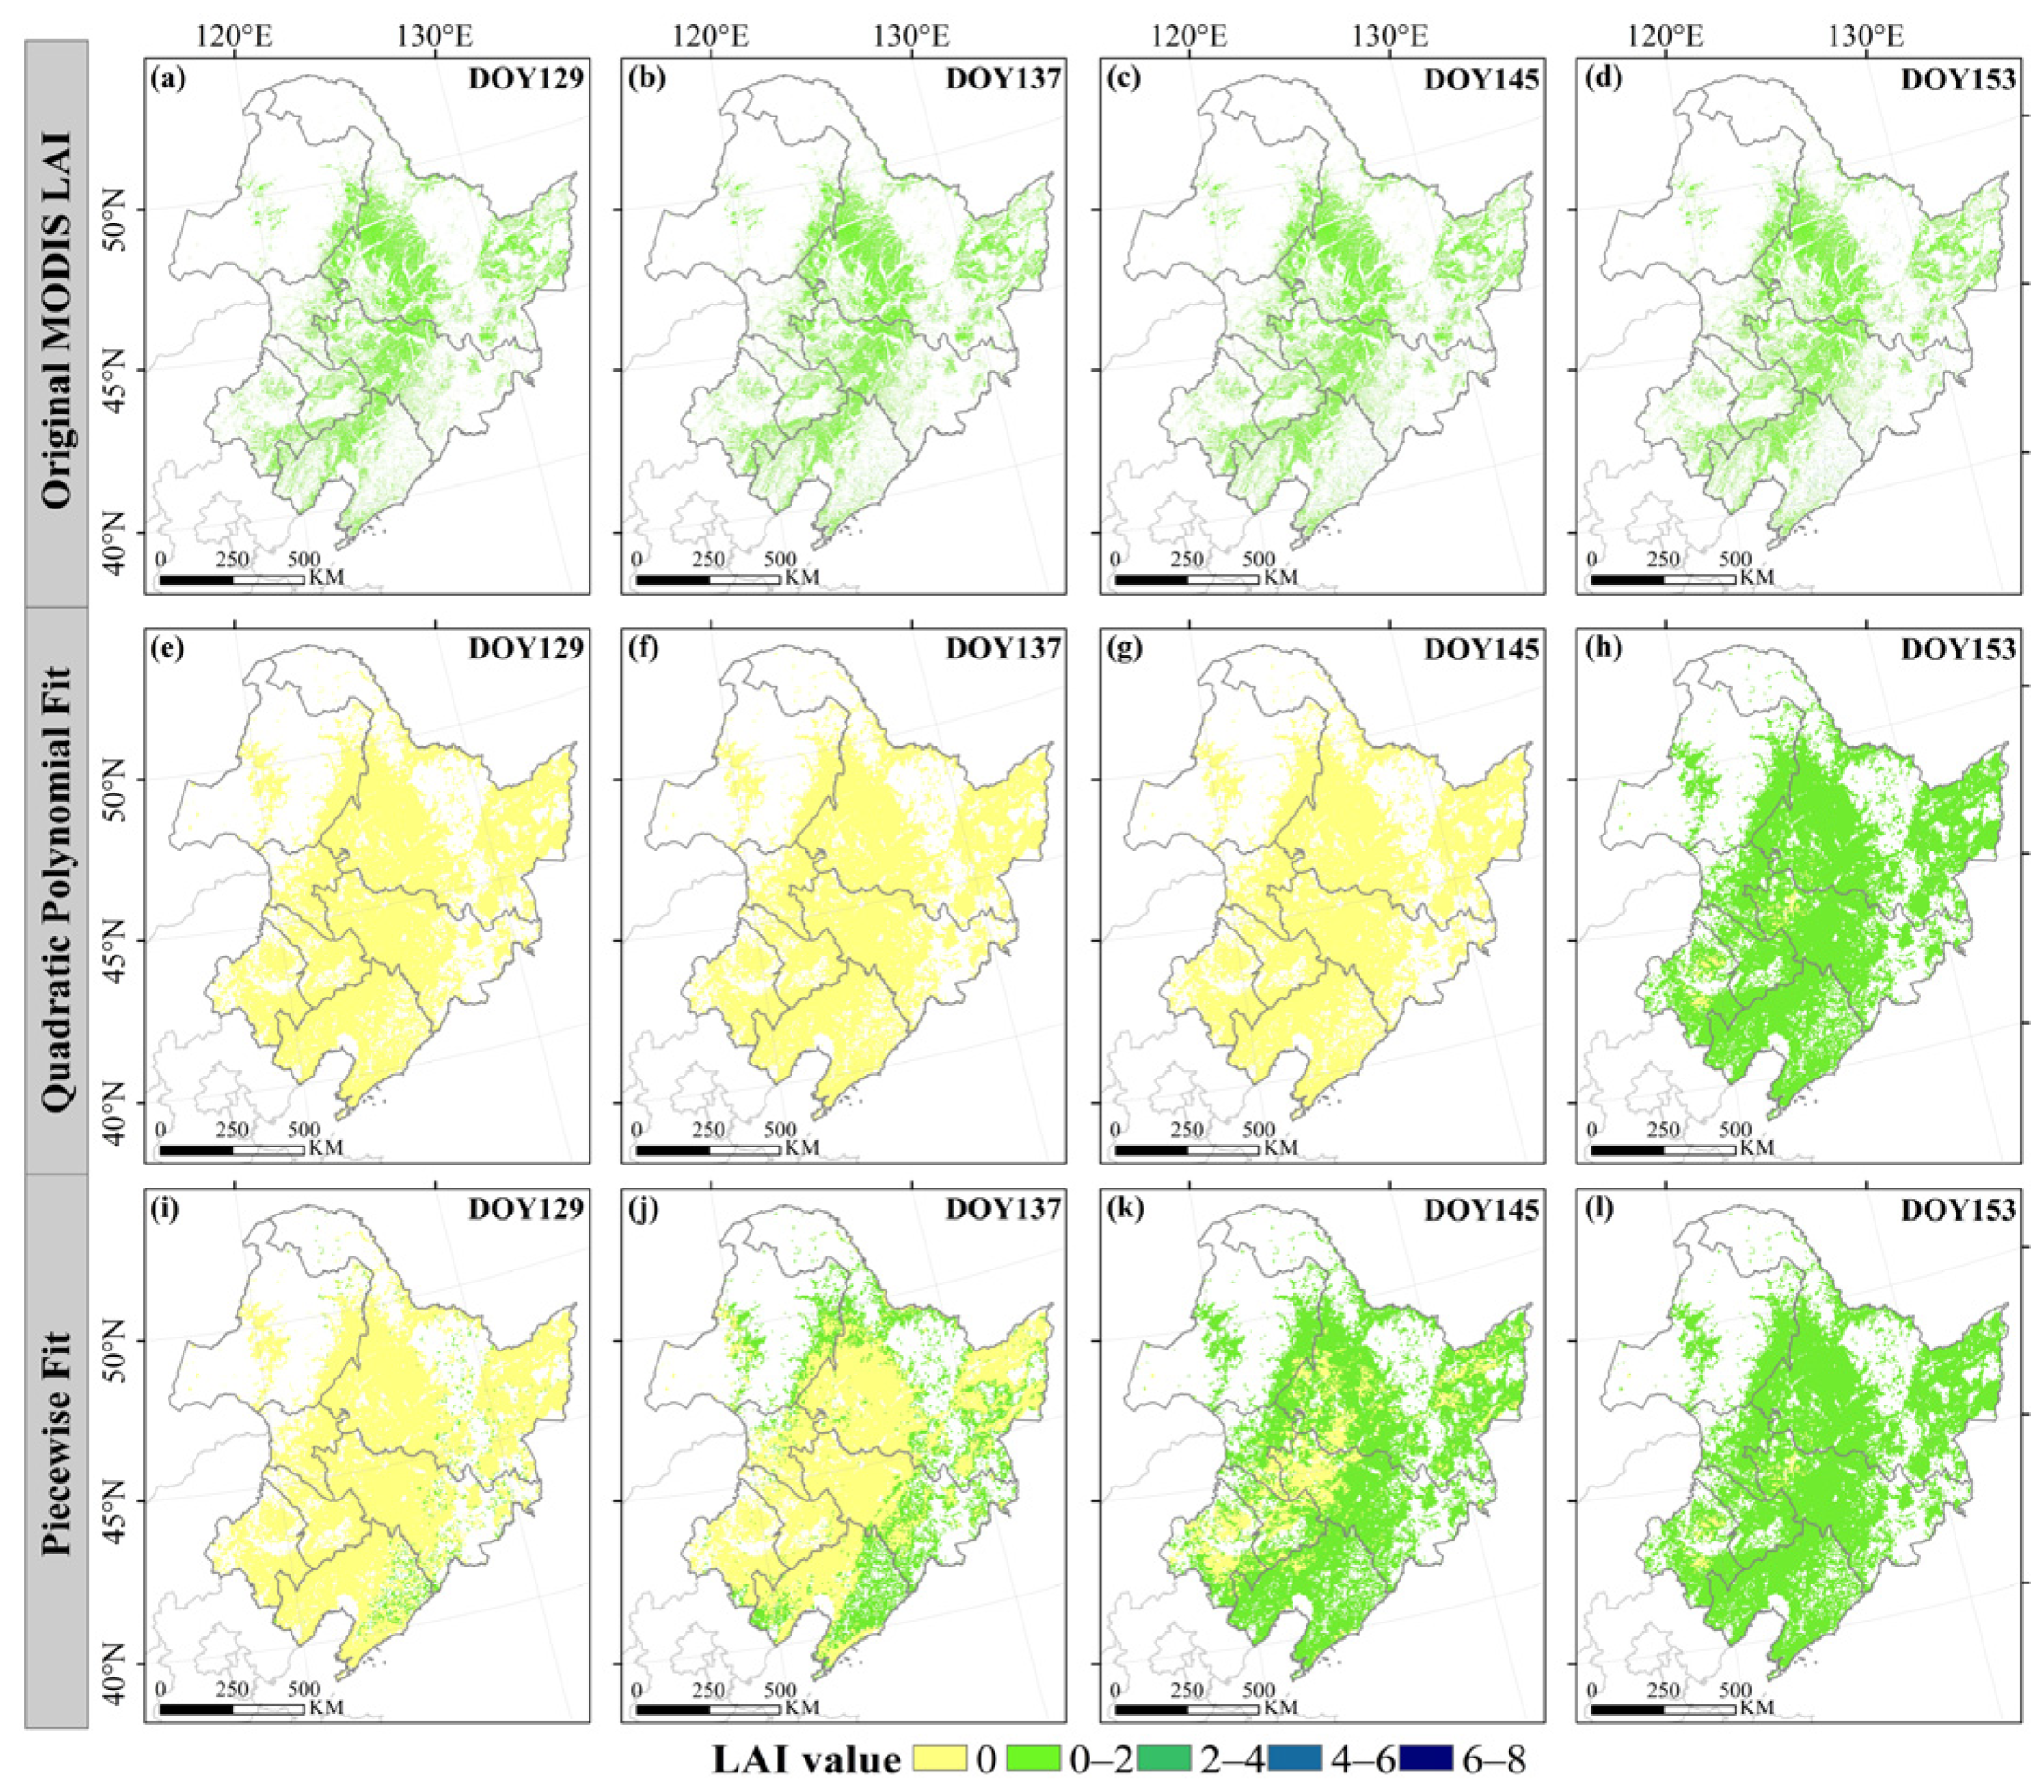
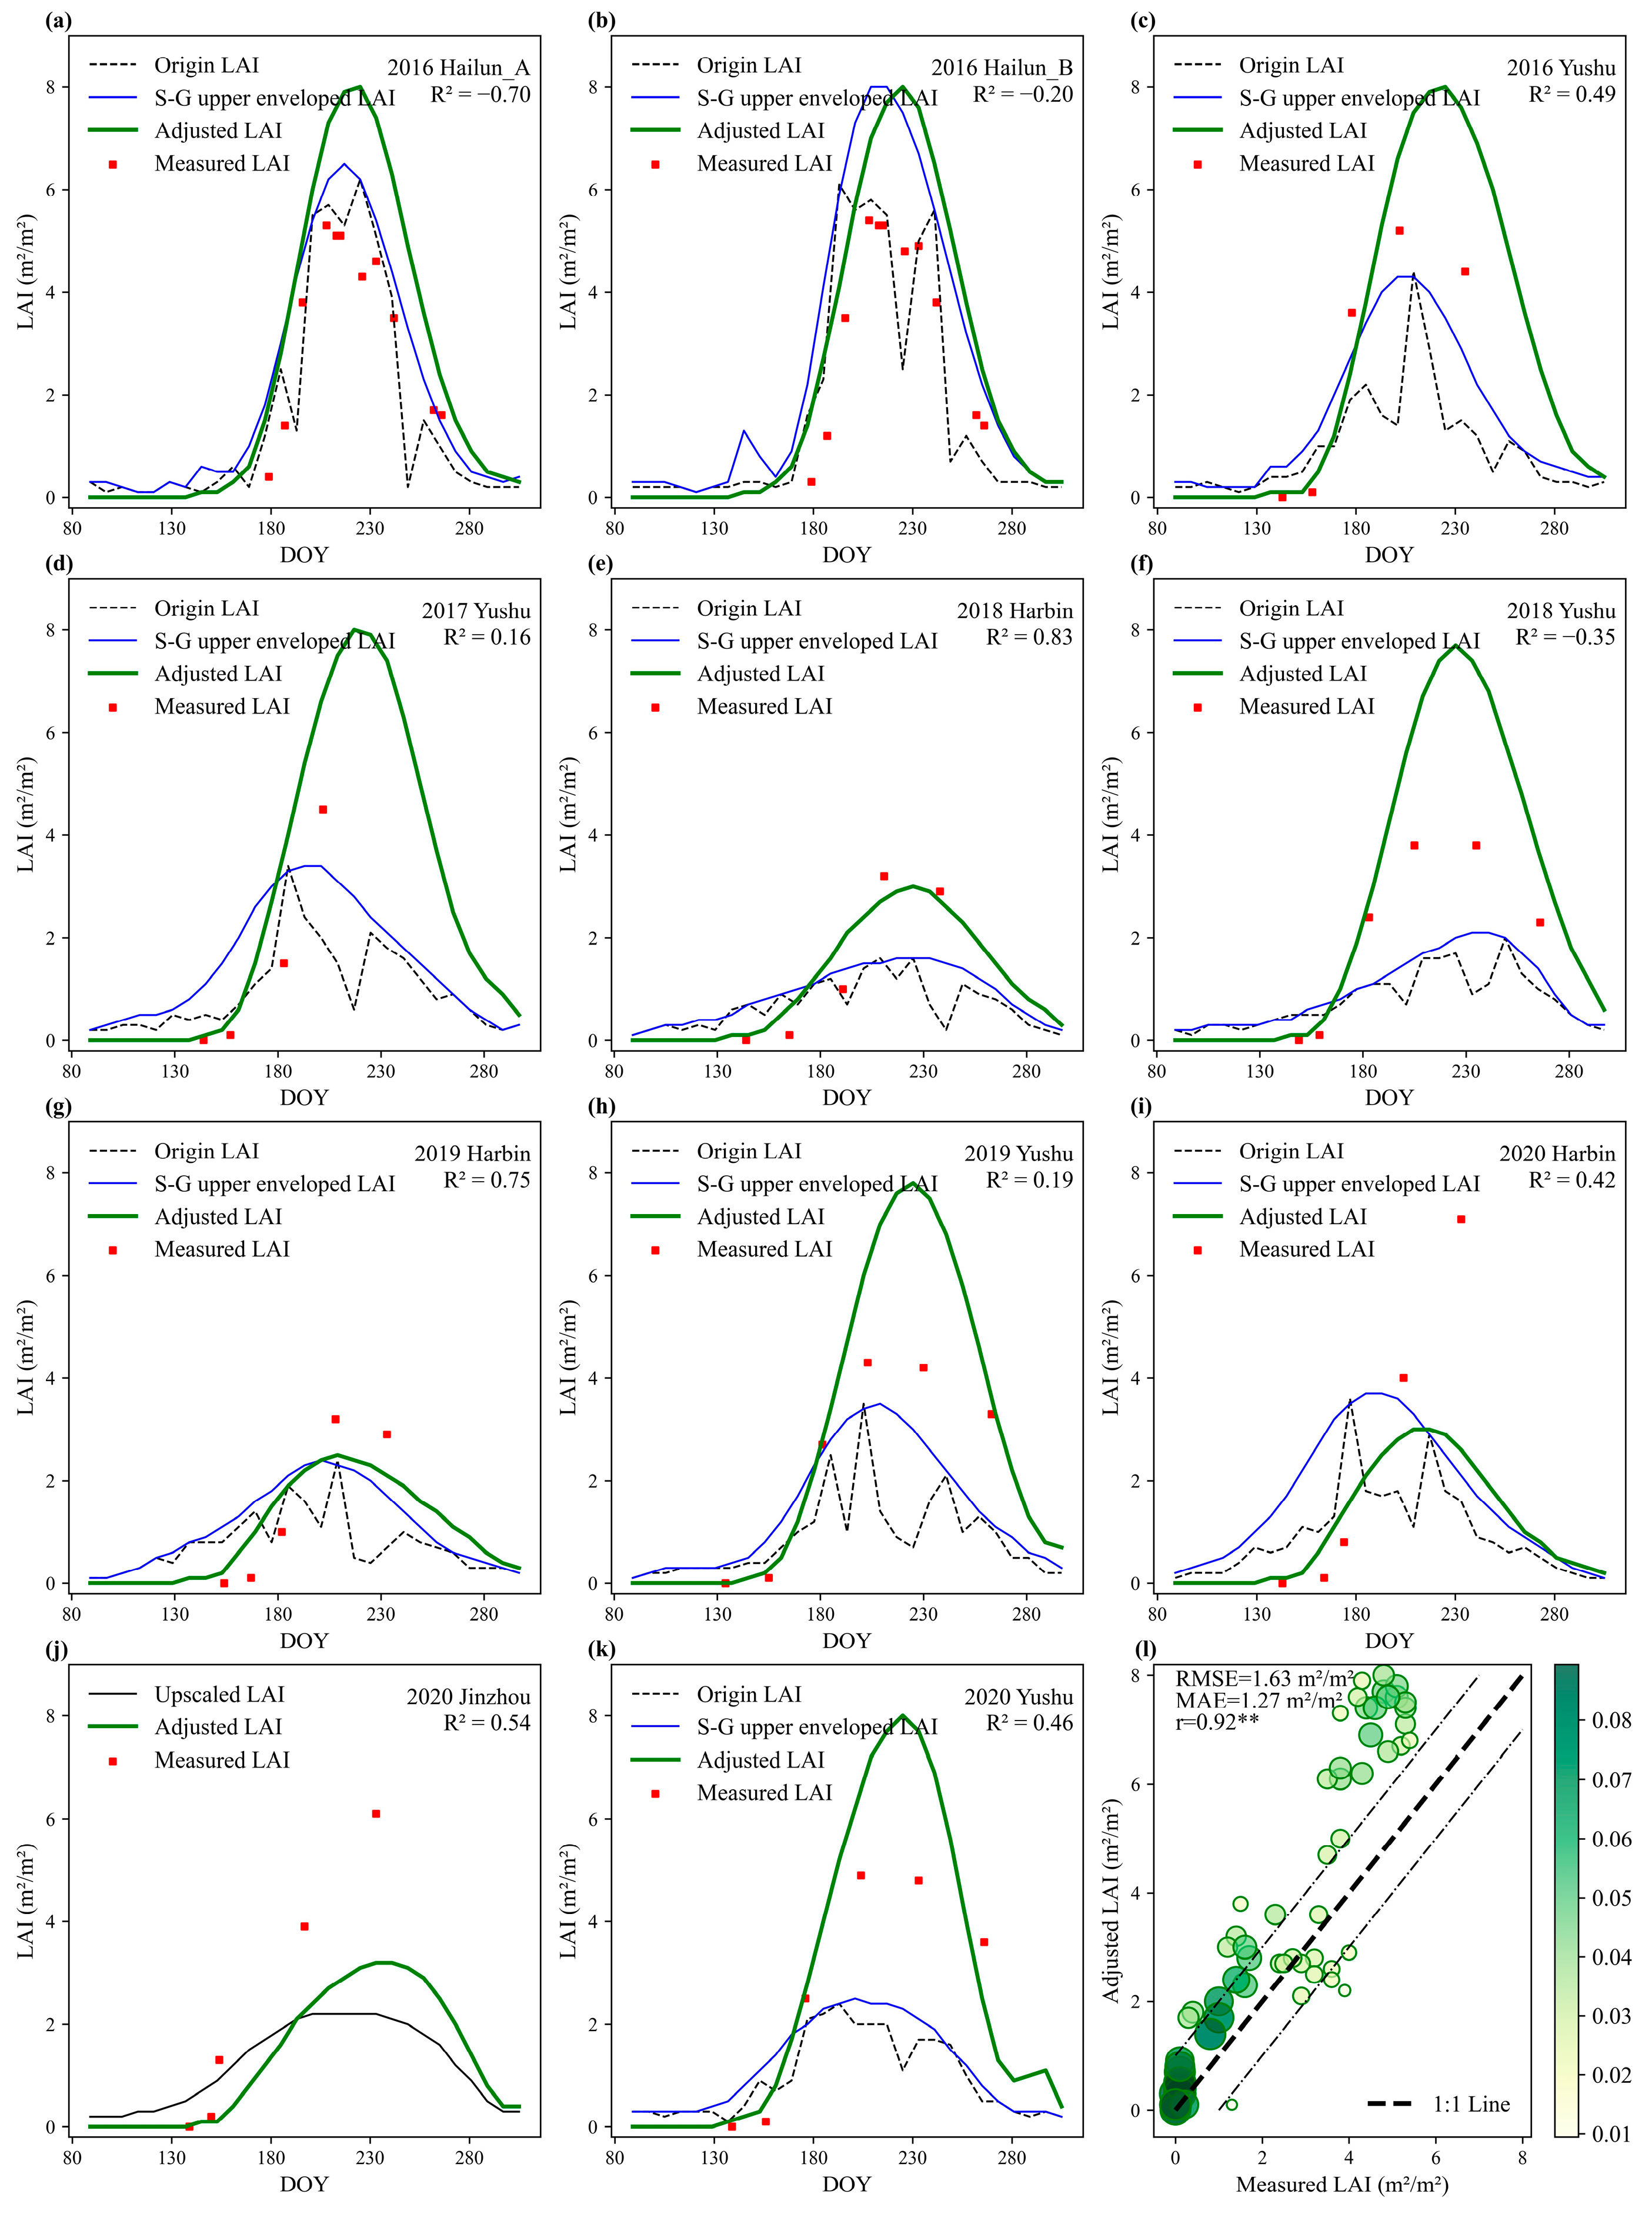
To further compare the effectiveness of quadratic polynomial fitting and piecewise function fitting in adjusting LAI values, we analyzed the original MODIS LAI from 2011 alongside the spatially corrected results obtained using scale factor time series derived from quadratic polynomial fitting and piecewise function fitting. It can be seen from Figure 7a–d that the original MODIS LAI values in the NEC region were all greater than 0 during the period from 9 May (DOY 129) to 2 June (DOY 153), indicating that vegetation growth had already begun in the region with some degree of leaf area coverage. However, the observed seedling emergence dates for spring maize in Figure 2a indicate that maize had not yet emerged by DOY 129. This also highlights the overestimation of MODIS LAI during the early growing season, which is attributed to interference from non-maize vegetation signals captured by the remote sensing satellite. Figure 7e–h presented the spatial distribution of LAI values adjusted by using the quadratic polynomial. On DOY 145, the adjusted LAI of 0 indicated a lack of vegetation greenness, which contradicts the observed seedling emergence dates for spring maize as shown in Figure 2a. By DOY 145, most of the spring maize in NEC had already emerged. On DOY 153, most of the spring maize in NEC, with the exception of eastern Heilongjiang, had reached the V3 (three-leaf) stage (Figure 2b). After adjusting the LAI using scale factors fitted with a piecewise function, the spatial distributions of the adjusted LAI on 9 May (DOY 129) and 17 May (DOY 137) showed that spring maize had commenced in central Heilongjiang, Jilin, and western Liaoning in early May (Figure 7i). By mid-May, the emergence area of spring maize began to expand, with greenness observed in central Hulun Buir, southern Chifeng, central Heilongjiang, eastern Jilin, and eastern Liaoning (Figure 7j). Except for the western parts of Heilongjiang and Jilin, as well as central Chifeng, spring maize had begun growing in all other regions during the recorded emergence period in NEC (Figure 7k,l). Totally, the research reveals that the piecewise function fitting performed better than the quadratic polynomial in adjusting the spring maize LAI values. Additionally, it is noted that the emergence of spring maize in southern NEC occurred earlier than in the northern regions.

Accuracy of the 2016–2020 Validation Dataset

Figure 8l shows that there was a good agreement between the measured LAI at each station and the adjusted LAI using the piecewise function in NEC, with an RMSE of 1.63 m2/m2, MAE of 1.27 m2/m2, and r of 0.92. However, for LAI values between 4 and 6 m2/m2, the adjusted results showed a tendency toward overestimation. This discrepancy is particularly noticeable for sites such as Yushu during the period of 2016–2020 (Figure 8c,d,f,h,k) and Hailun in 2016 (Figure 8a,b), where the LAI adjusted without considering pixel purity significantly overestimated the actual LAI, resulting in relatively low R2 values. Among the other sites, the best adjusted LAI results were observed for Harbin in 2018 (Figure 8e), achieving an R2 of 0.83. However, for Harbin in 2019–2020 (Figure 8g,i) and Jinzhou in 2020 (Figure 8j), the adjusted LAI showed underestimation during the mid-growing season of spring maize.

3.4.2. Adjust LAI for Fitting Scale Factors with Purity

Accuracy of the 2011–2012 Reserved Validation Dataset

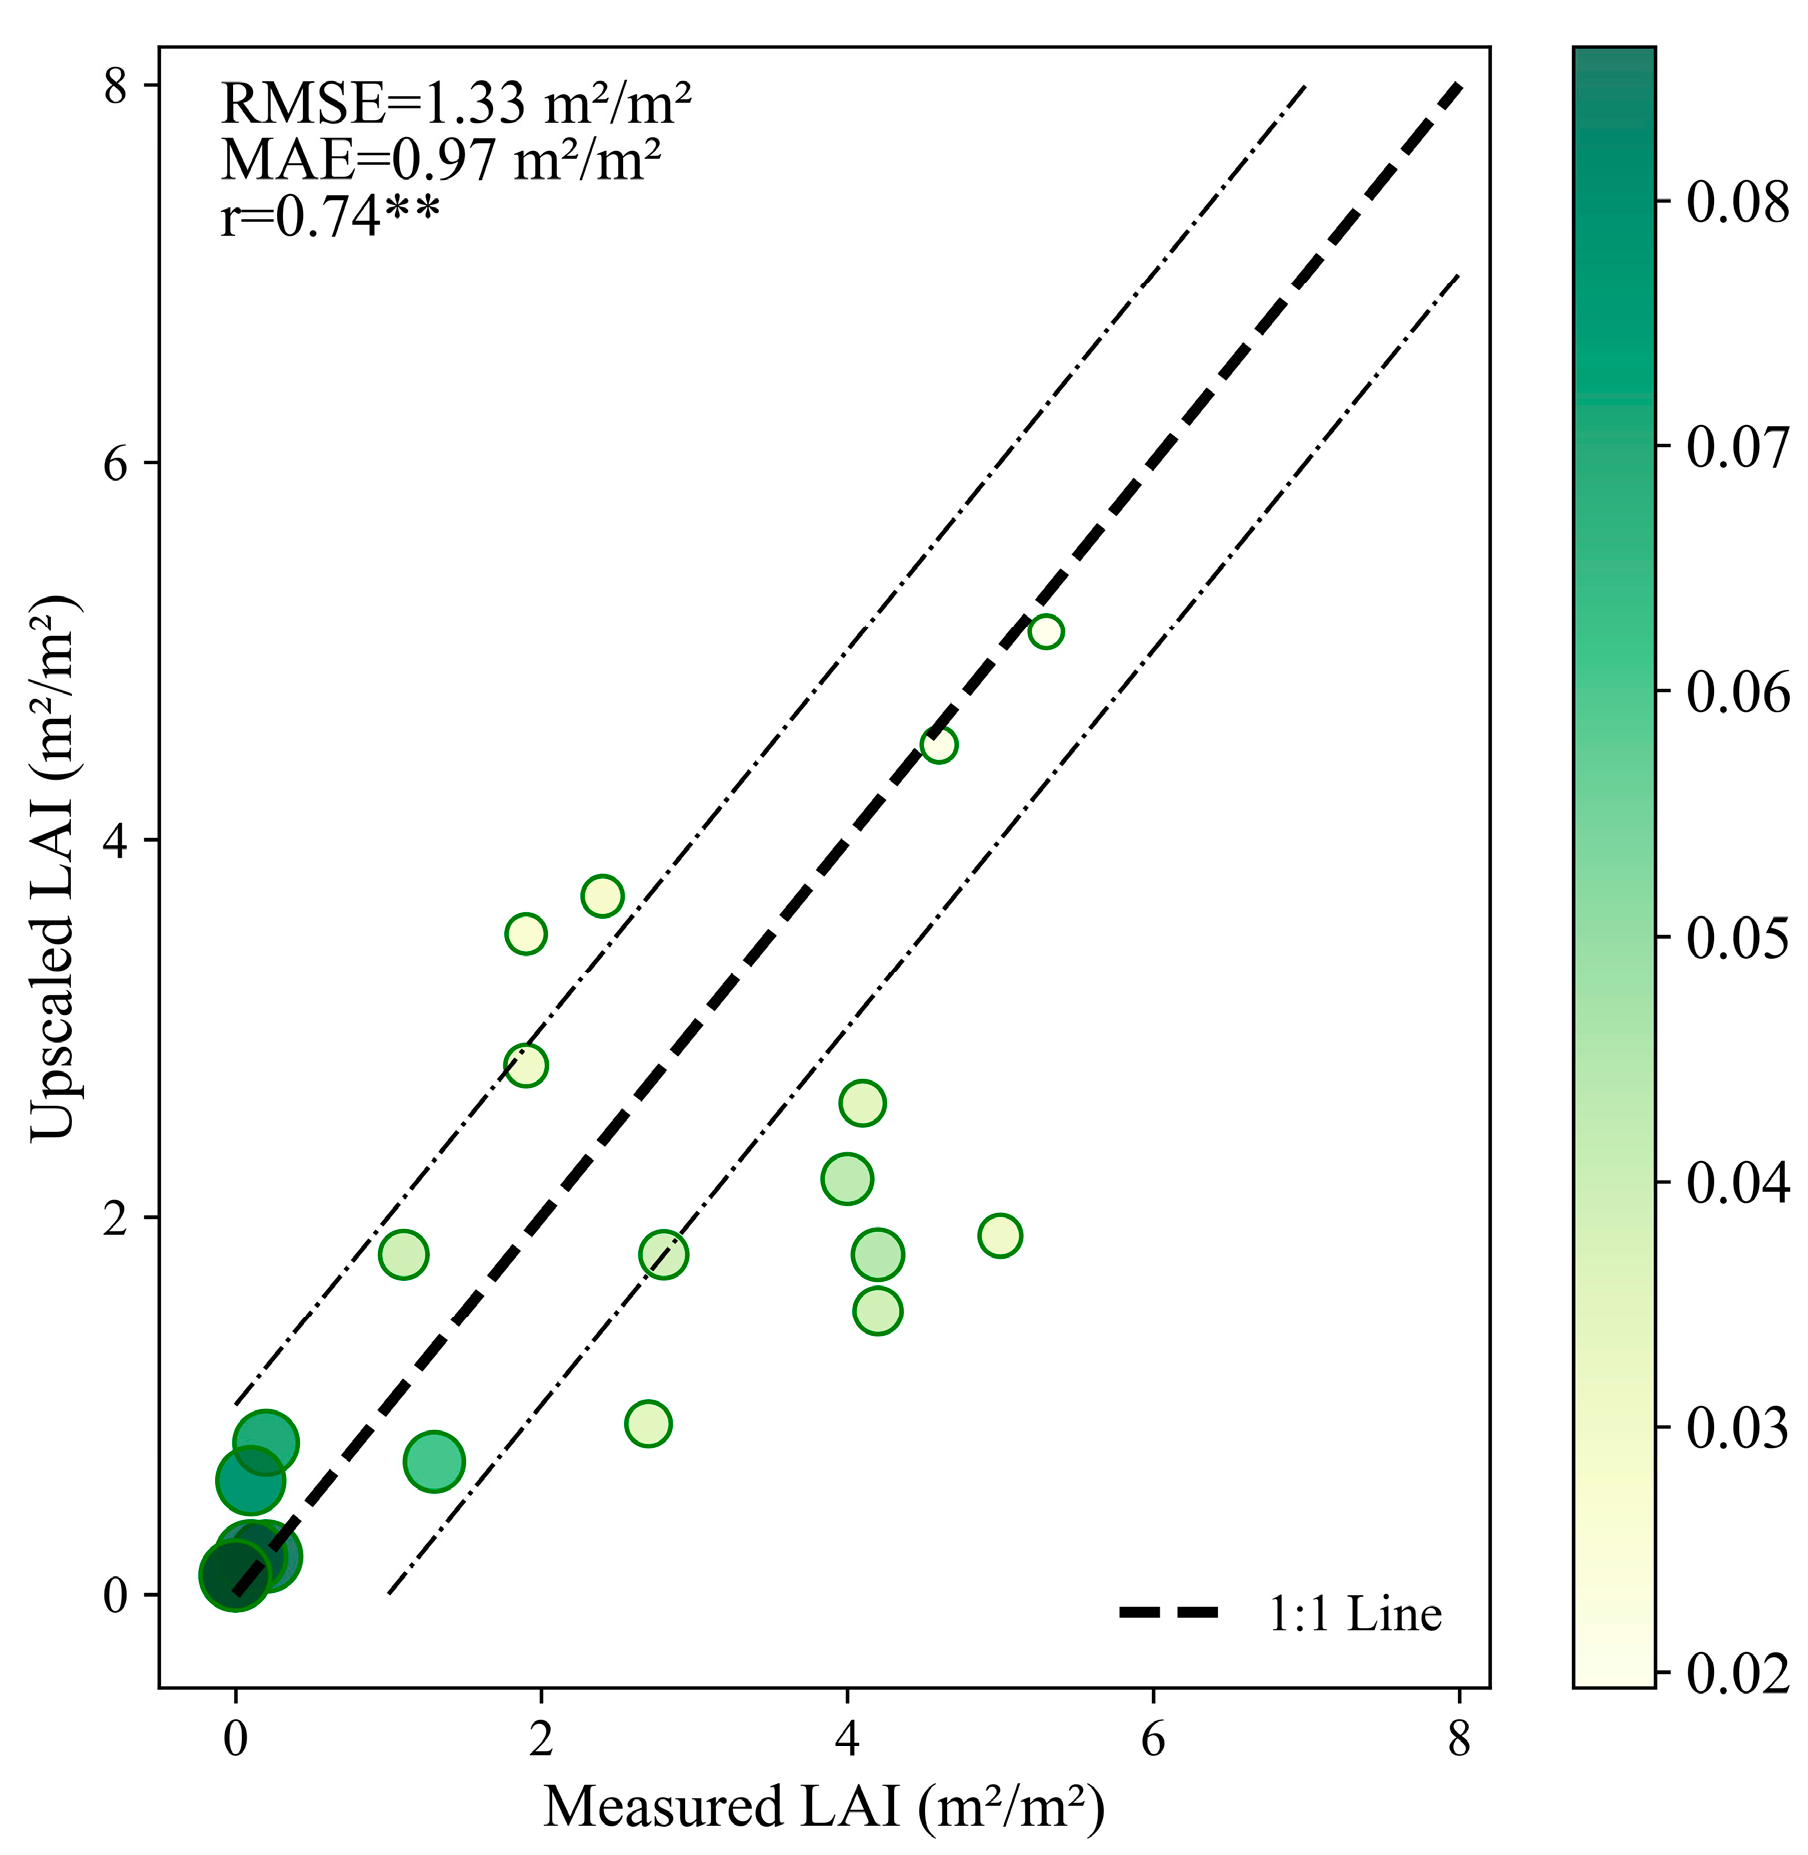
Following the scale factor time series fitting method described in Section 3.4, we fit different scale factor time series based on two distinct categories of spring maize pixel purity: >50% and ≤50%. The accuracy of the scale factors, derived from the modeling dataset, was validated using the validation set that included one high-purity site, Bayan, specifically reserved for this purpose (Figure 9). The validation results indicate that the adjusted LAI using scale factors that take into account the differences in pixel purity performed generally well. The adjusted LAI values exhibited a strong correlation with the measured LAI, as indicated by an r of 0.74. Additionally, the RMSE was 1.33 m2/m2 and the MAE was 0.97 m2/m2.

Accuracy of the 2016–2020 Validation Dataset

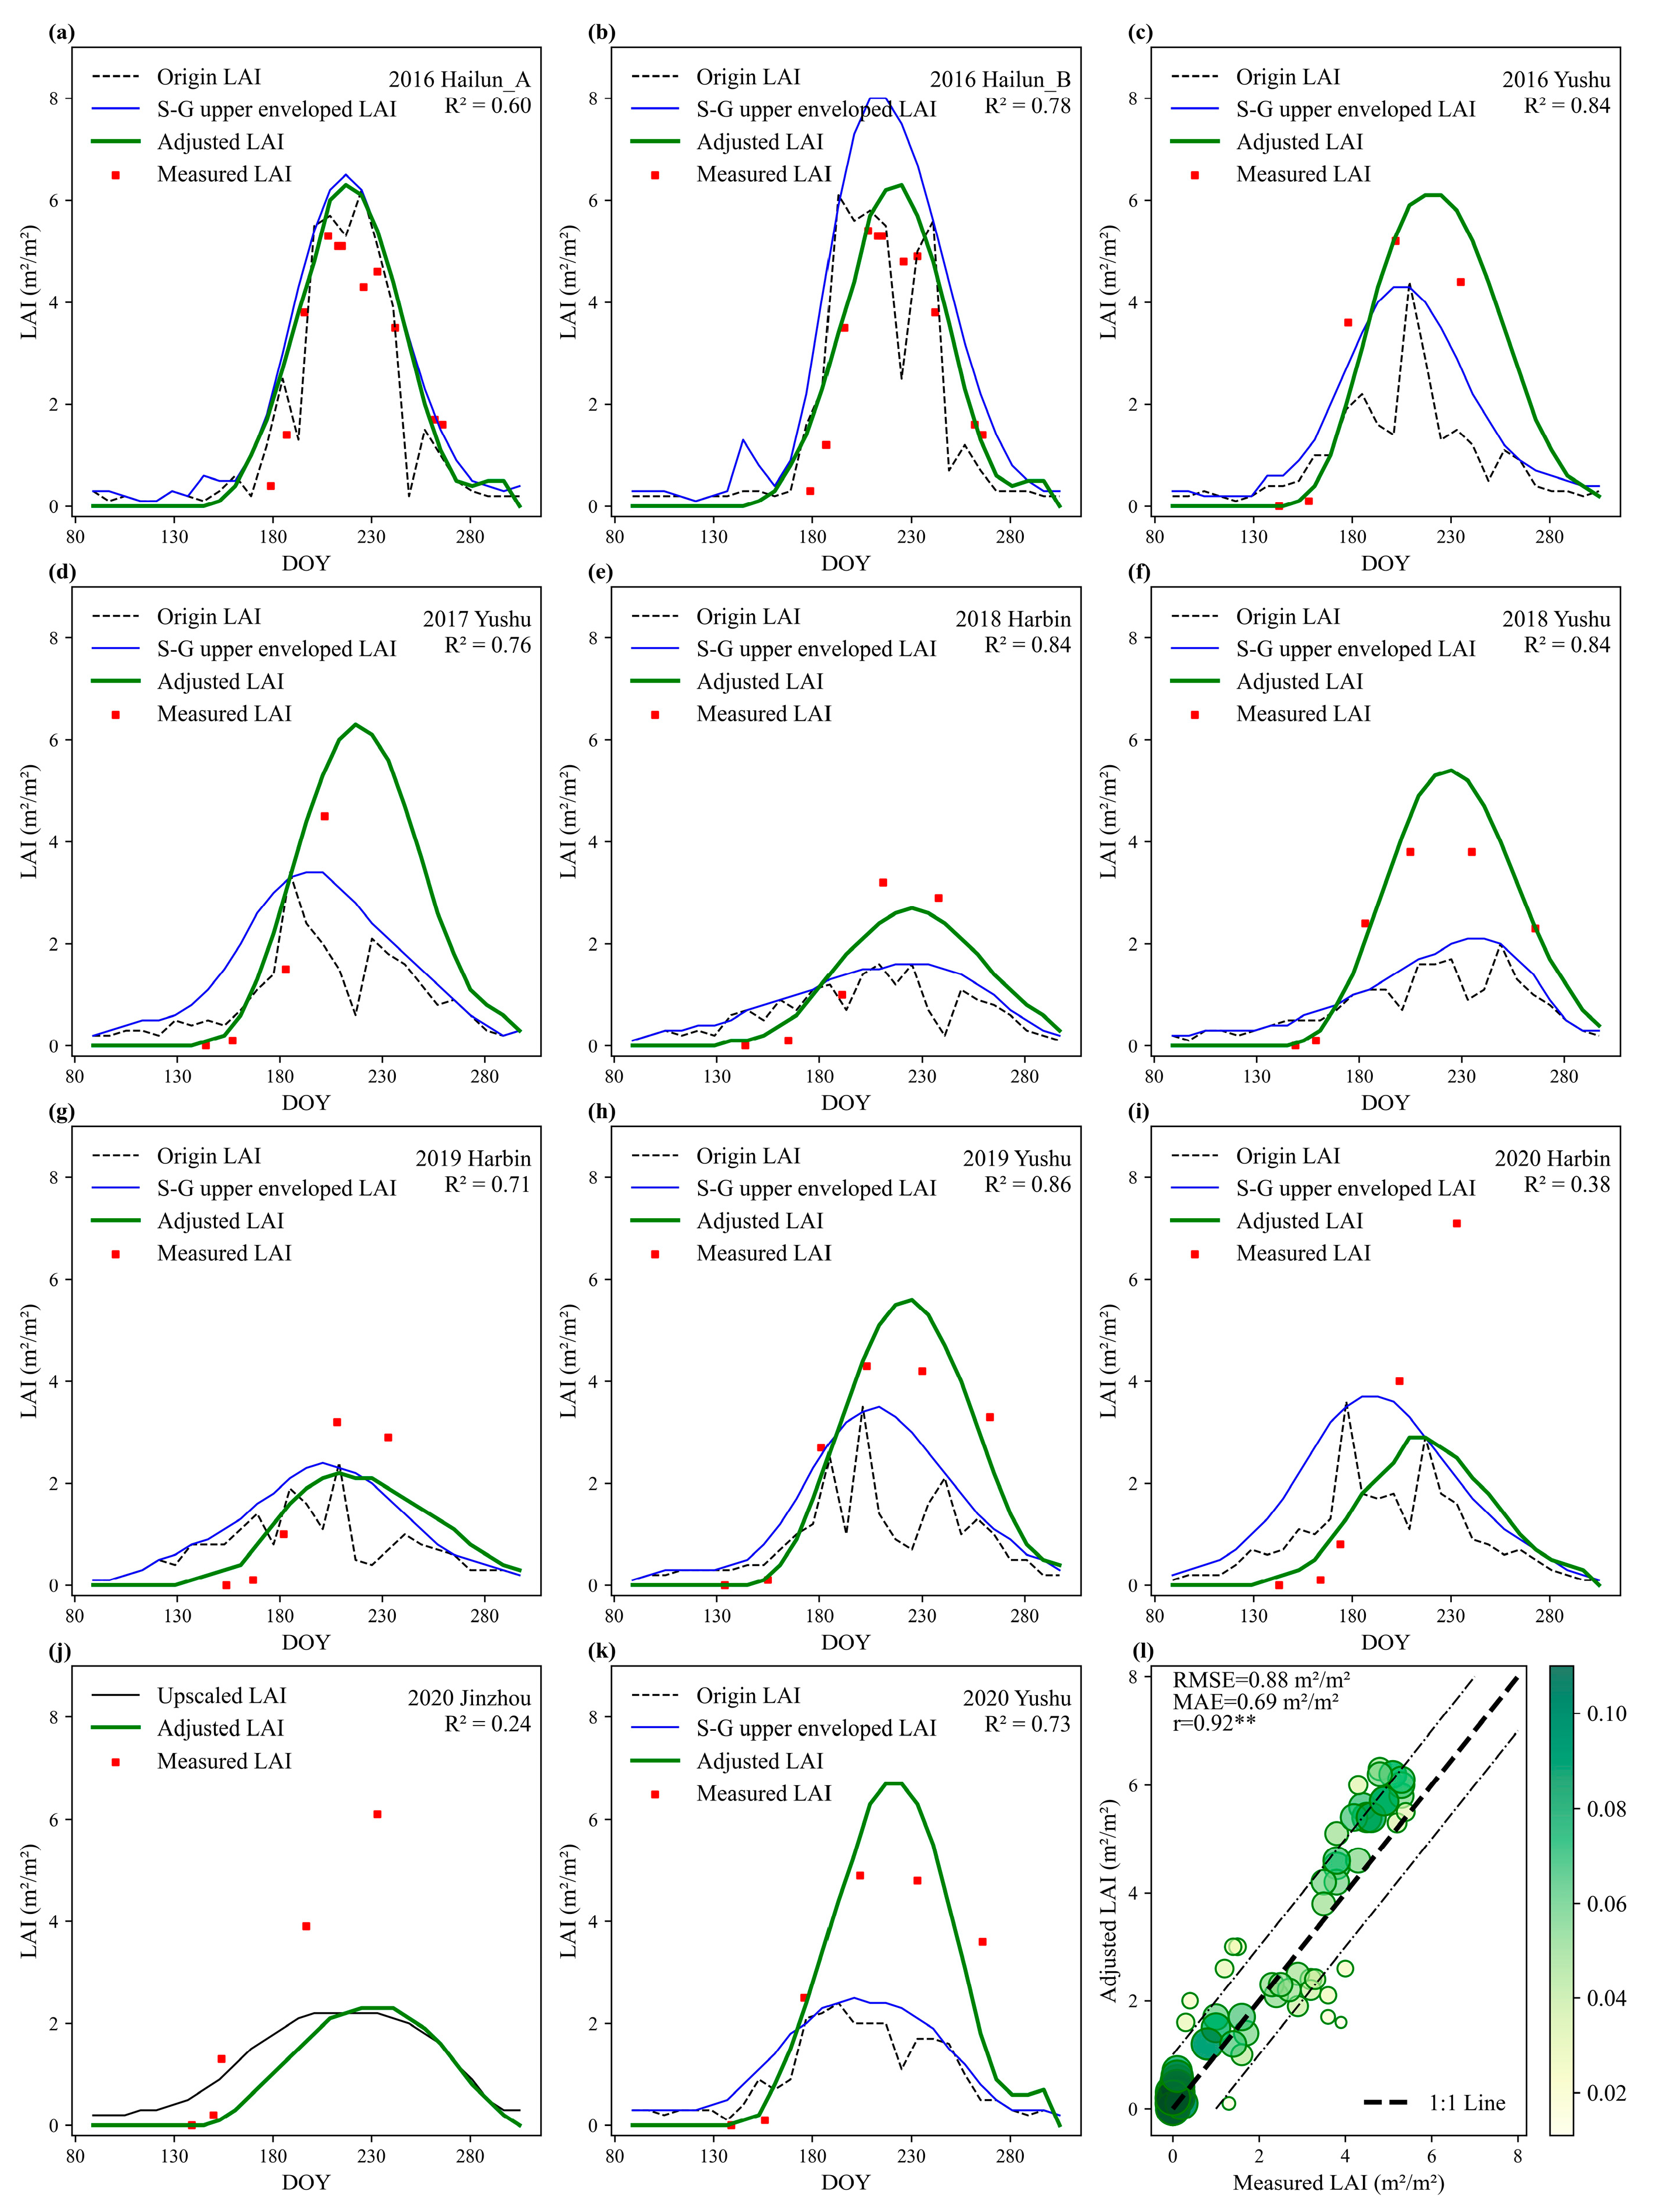
After adjusting the 2016–2020 MODIS LAI using the scale factor time series fitted with purity, the accuracy of the adjusted results is consistently higher than that obtained without considering pixel purity. This improvement is evident, with an RMSE of 0.88 m2/m2, MAE of 0.69 m2/m2, and r of 0.92 (Figure 10l). The use of the pixel purity-differentiated scale factor time series for adjusted LAI has led to a general improvement in adjusted accuracy across various sites (Figure 8). Exceptions to this improvement were observed for Harbin in 2019 and 2020 (Figure 10g,i) and Jinzhou in 2020 (Figure 10j). The adjusted LAI, especially during the mid-growing season, now more closely matches the measured LAI, resulting in a significant reduction in overestimation compared to the LAI adjustments made without using the pixel purity-fitted scale factor time series. For Harbin in 2019 and 2020 and Jinzhou in 2020, although the adjusted LAI was still below the measured LAI during the mid-growing season, the unadjusted LAI was overestimated during the early growing season. Notably, the adjustment brought the LAI values closer to the measurements. The adjusted LAI time series preserves a pattern consistent with the phenological stages of maize growth, with relatively low levels before the V3 stage, followed by a continuous increase after the V3 stage [44]. The adjusted LAI exhibits a consistent seasonal pattern across different years and sites, accurately depicting the seasonality of maize. There is a rapid increase in LAI around DOY 140 to DOY 210, which is followed by a gradual decline around DOY 220 to DOY 300.

3.5. Comparison of Accuracy Results for Adjusted LAI

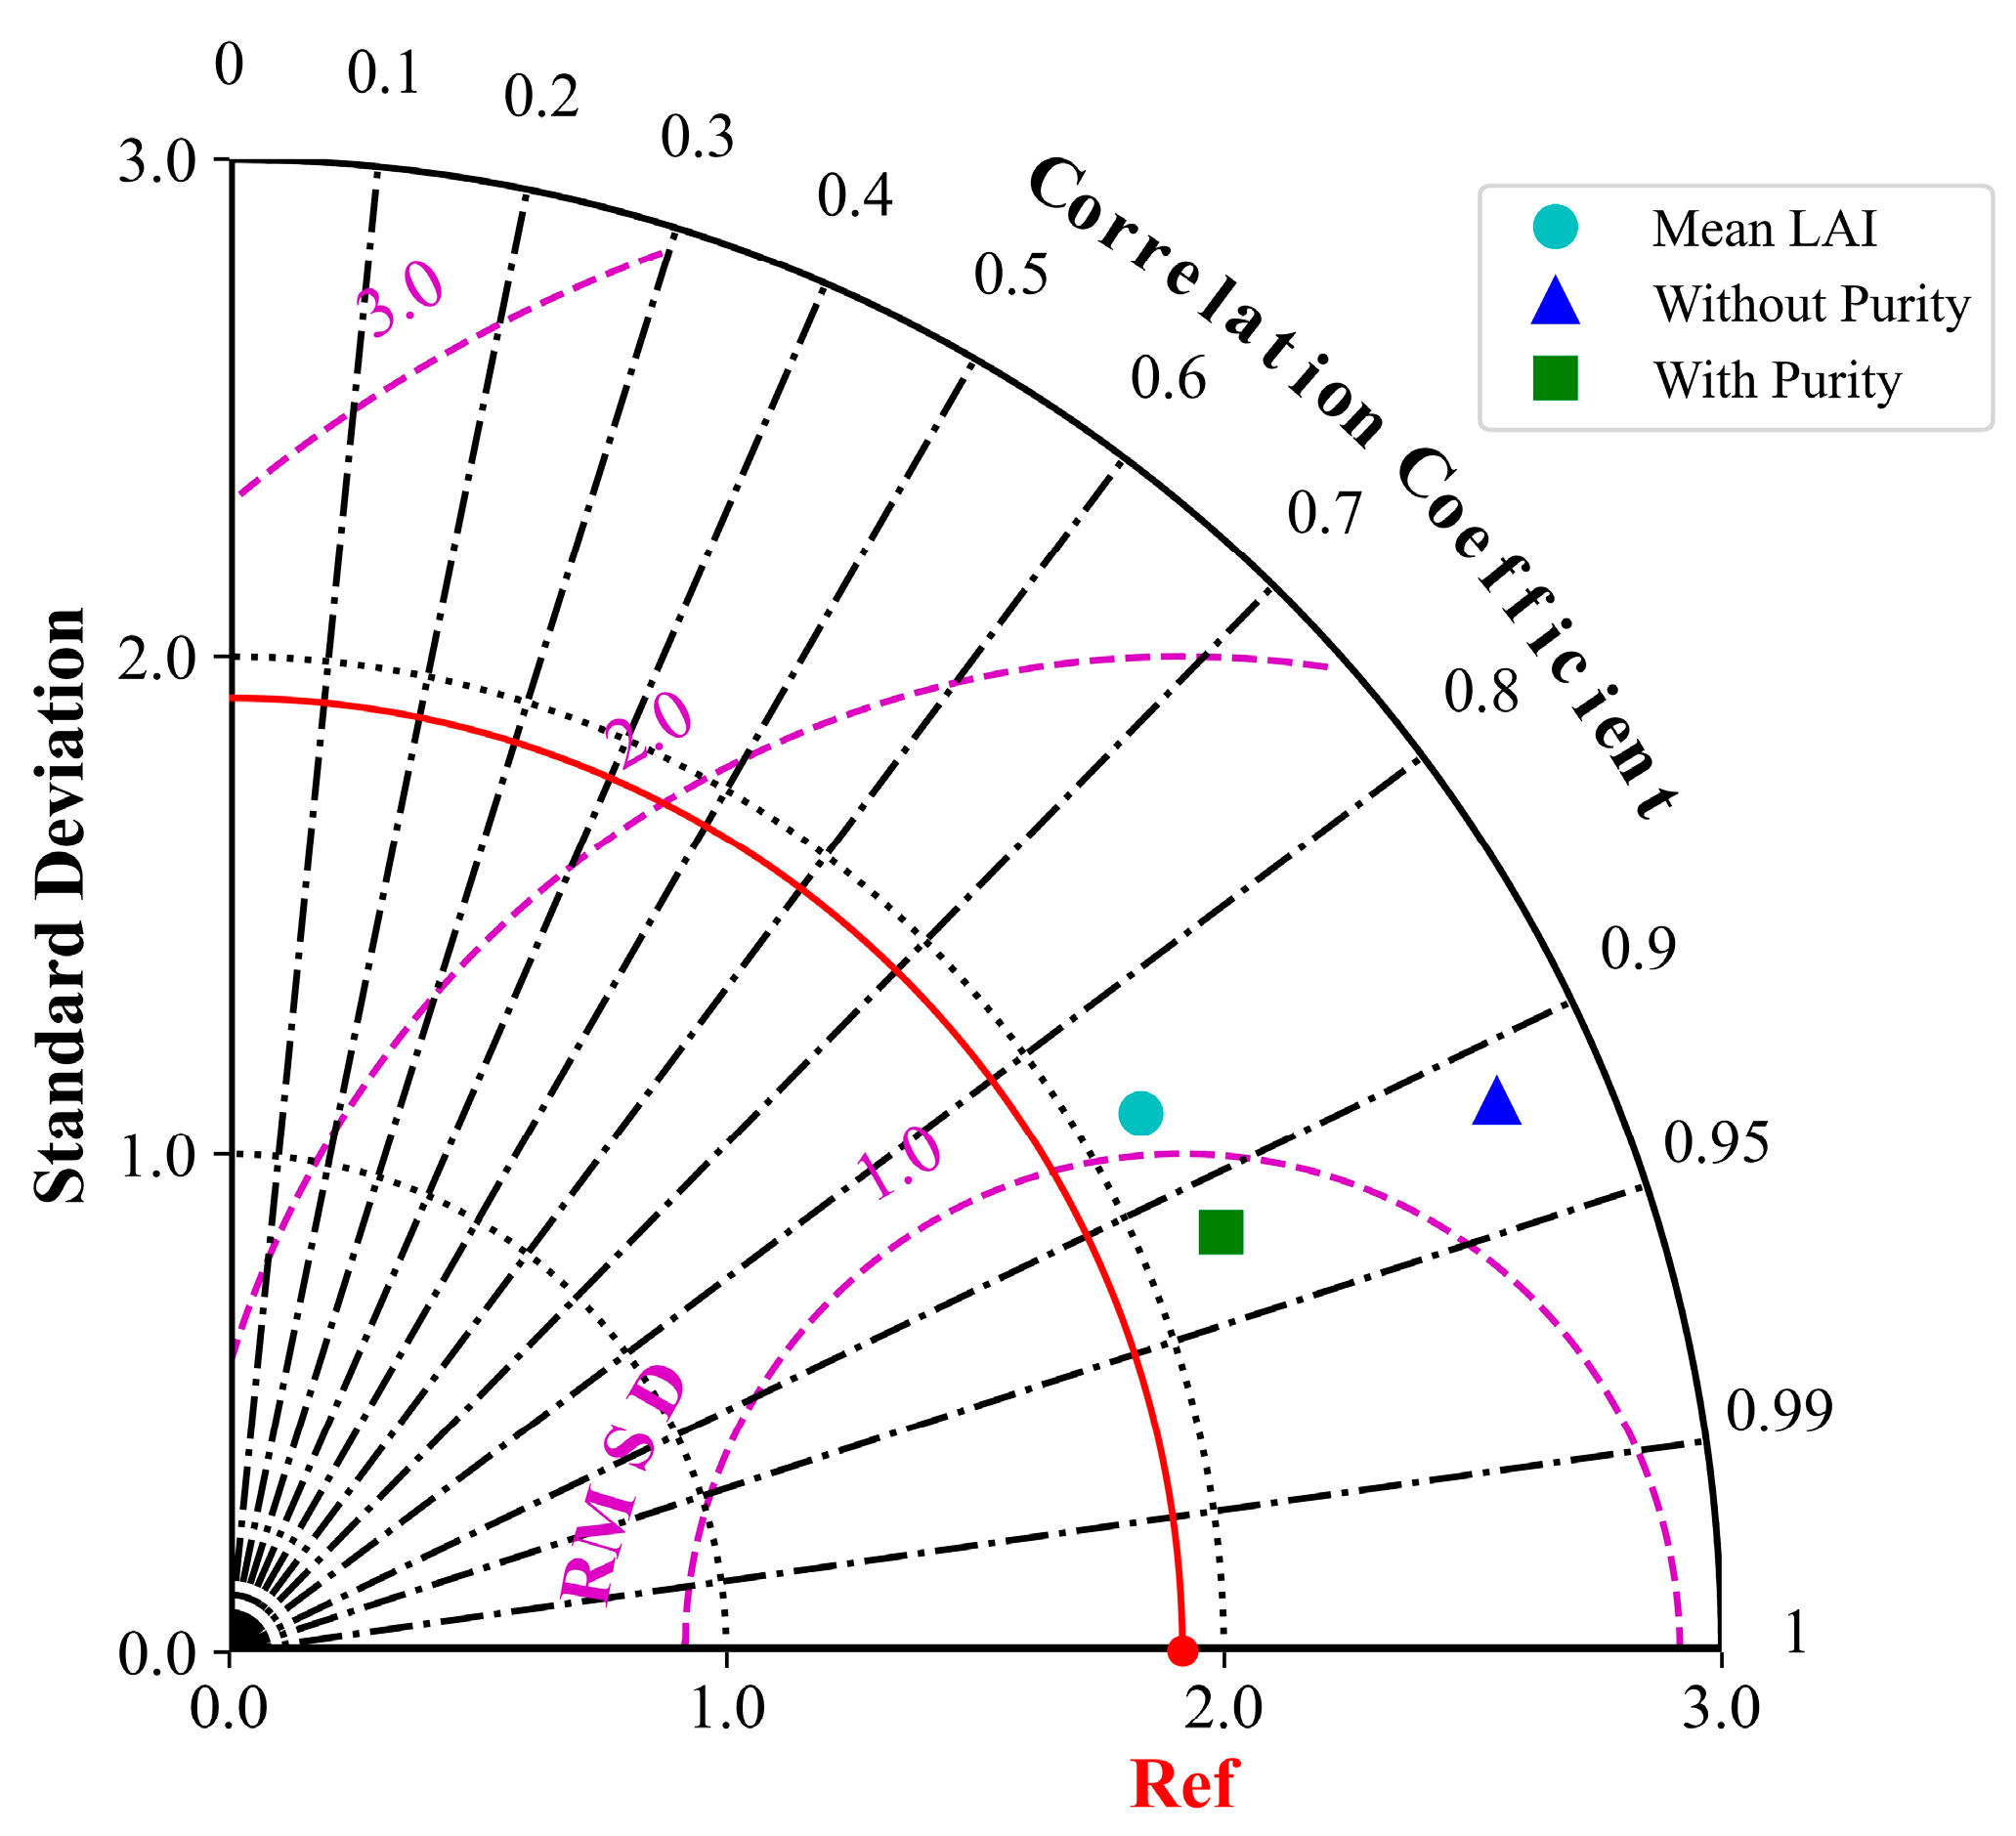
Figure 11 illustrates a comparison of the accuracy of three methods using Taylor diagrams, namely, mean LAI upscaling, LAI adjustment without using pixel purity-fitted scale factors, and LAI adjustment using pixel purity-fitted scale factors. Results showed that the refining method incorporating pixel purity is the closest to the reference point (Ref), signifying higher accuracy. In contrast, the method of mean LAI upscaling and refining without considering purity exhibited lower accuracy compared to the former. This indicated that the LAI adjusted with the pixel purity method most closely aligns with the ground-measured LAI values. This approach could achieve spatially comprehensive and temporally continuous LAI data that were suitable for spring maize in the NEC region.

3.6. Spatially Adjusted Results of the MODIS LAI in the NEC

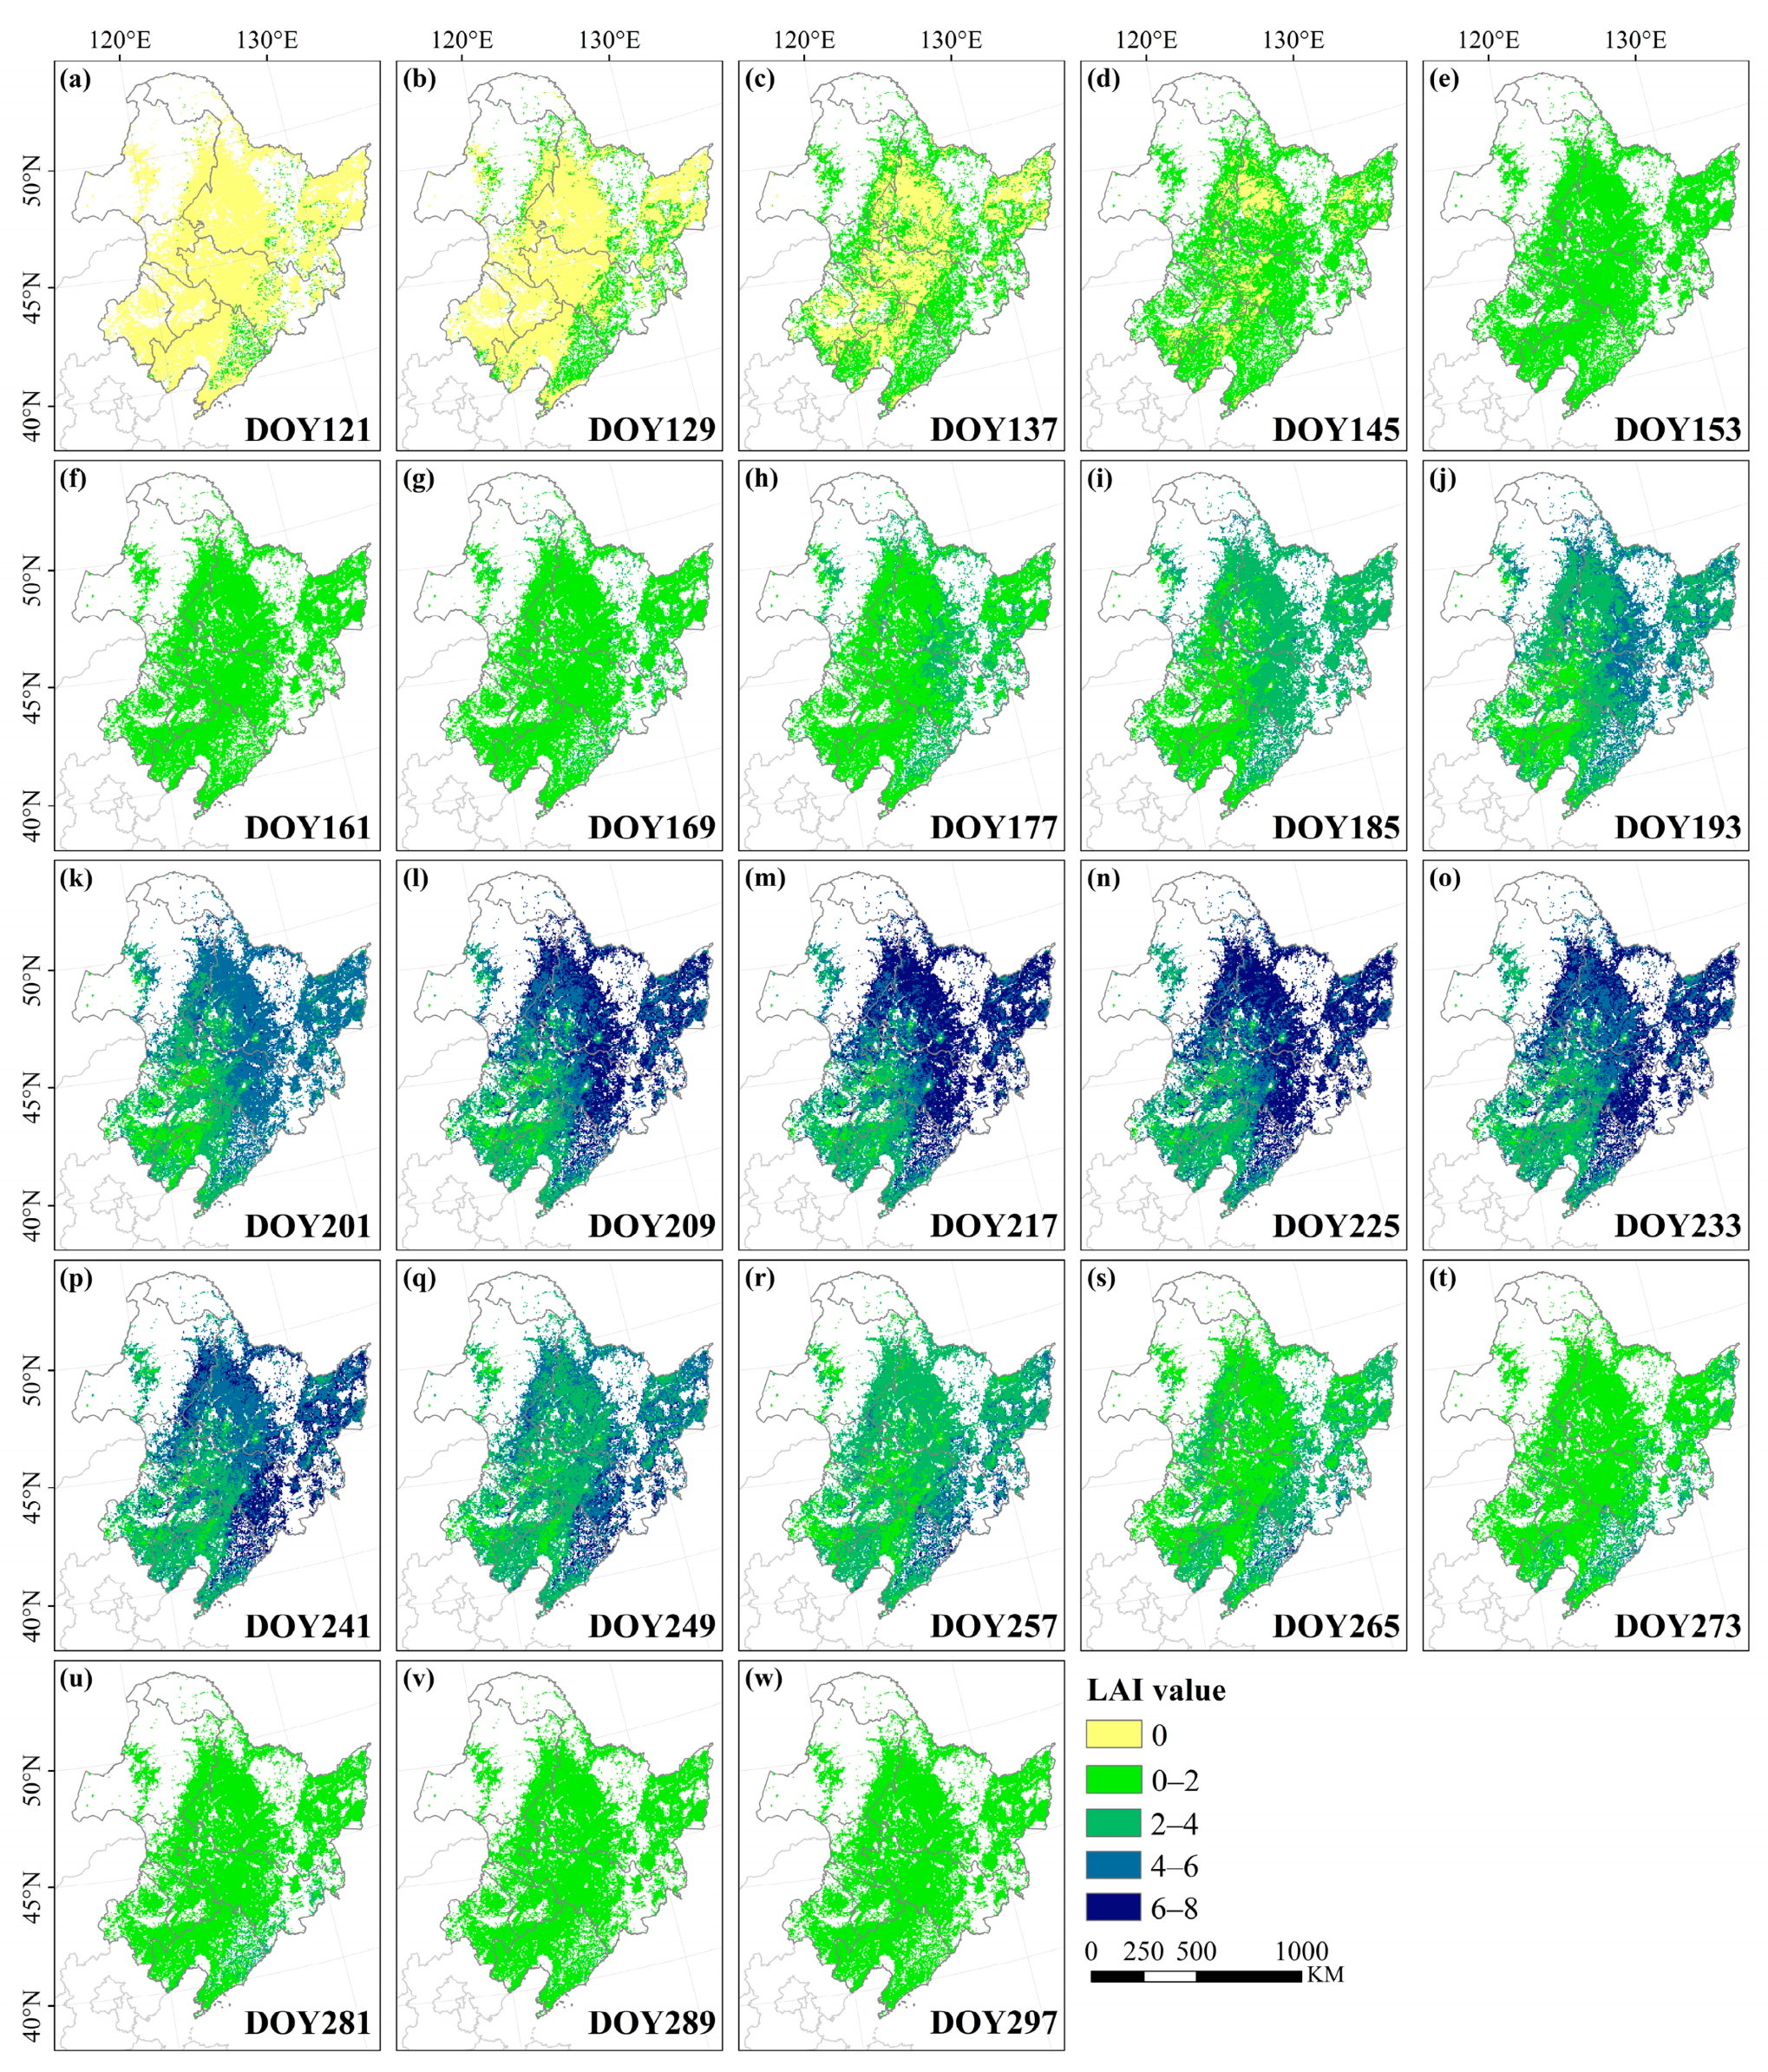
Figure 12 shows the spatial and temporal evolution of the adjusted LAI during the 2020 spring maize growing season. The Figure 12a–w represent the LAI distribution from DOY 121 (30 April) to DOY 297 (23 October). As the growing season progresses, maize vegetation cover gradually increases, leading to a corresponding rise in LAI values. During the early growing season (DOY 121 to DOY 153), the LAI values in most regions are relatively low, predominantly within the 0 to 2 range. This period corresponds to the emergence and early development stages of maize crops. As the season progresses, LAI values gradually increase. By the mid-growing season (DOY 161 to DOY 217), LAI values are greater than 0 across the entire region, with most areas reaching between 2 and 4 m2/m2 or even higher. Subsequently, from DOY 225 to DOY 273, areas with high LAI values begin to decrease. As the late growing season approaches (DOY 281 to DOY 297), the regional LAI values begin to decline, eventually returning to lower levels, with most areas exhibiting LAI values between 0 and 2 m2/m2. This marks the end of the growing season, as vegetation cover decreases and the plants complete their life cycle. Spatially, the LAI values in the Sanjiang Plain region remain relatively uniform throughout the entire growing season, while the southern part of the Eastern Four Leagues, the Songnen Plain, and the Liaohe Plain exhibit significant spatial heterogeneity in LAI values during the mid-growing season.
The LAI can serve as an indicator to assess vegetation health and monitor crop growth conditions. In this case, it is used to validate the growth trends of spring maize in NEC on DOY 193 (mid-July) between 2001 and 2020 (Figure 13). Spatially, the adjusted LAI differences from 2001 to 2020 mainly manifested in the eastern Songnen Plain, where spring maize growth was generally weaker during 2001–2009 compared to 2010–2020.
From a temporal perspective, the adjusted LAI pixel mean values on DOY 193 showed a fluctuating increase over the 20 years. The average LAI value between 2001 and 2003 was relatively low (below 2.5 m2/m2), while these values during 2004–2009 fluctuated, with LAI on DOY 193 mainly ranging between 2–4 m2/m2 in 2005 and 2008. From 2010 to 2020, the mean LAI exceeded 3.0 m2/m2, with 2014 exhibiting the highest mean LAI (3.5 m2/m2). This result aligns with previous findings by Xue et al. [45], who observed that the NEC region experienced a widespread drought disaster between 2001 and 2004, which gradually alleviated after 2005.
In 2002, the adjusted LAI in the central Hulun Buir region exceeded 6 m2/m2, likely attributable to the favorable climatic conditions in Inner Mongolia that year. The central Hulun Buir region was less sensitive to drought compared to other areas in Inner Mongolia, leading to better spring maize growth in that region [46].

4. Discussion

4.1. Feasibility of Adjusting LAI Using Scale Factors Fitted with Purity

This study used LAI data measured in 2011–2012 and upscaled the 500-m resolution MODIS LAI to a 5-km resolution to derive the mean LAI. The concept of pixel purity was introduced to construct scale factors. This methodology involved performing optimal time series fitting for scale factors, both with and without pixel purity. The optimal scale factor time series from the different approaches was then used to adjusted the mean LAI. The refining results clearly show that the LAI accuracy, when adjusted using the scale factors with pixel purity, is higher than that of the adjustments without considering pixel purity (Figure 11). This improvement arises from the ability of pixel purity to accurately represent surface features. Pixel purity indicates the proportion of the target surface cover within a pixel. By incorporating pixel purity as a scale factor, we can more precisely distinguish and adjust the weight of maize pixels. This adjustment helps mitigate the impact of land cover mixing on LAI estimation, thereby enhancing the accuracy of the LAI.
The simple averaging method has exhibited limitations in performance in existing research [47]. It is mainly applicable to relatively homogeneous surfaces or in cases where the sampling points are highly representative of the remote sensing pixels. However, its applicability is constrained due to its inability to capture the nuances of heterogeneous landscapes. In this study, the 5-km mean LAI was used as the basis for upscaling. However, similar to previous findings, the stability and overall quality of the upscaled LAI were found to be deficient. To address these limitations, the study introduced a method that leverages pixel purity differentiation to adjust the upscaled LAI time series. This approach provides a more sophisticated consideration of surface heterogeneity, which is vital for mitigating potential systematic bias when estimating the LAI under varying maize coverage proportions. Compared to the measured LAI, the MODIS LAI overestimated LAI values in low-value regions and underestimated LAI values in high-value regions [30]. Our goal was to construct a scale factor time series that reduces the overestimation of the MODIS LAI in the early growth stages and the underestimation of the MODIS LAI during the peak growth period, while ensuring that the LAI trend correctly reflects the crop growth and development process.
For the fitting of the scale factors, we selected three widely used methods for vegetation index fitting to model the seasonal growth curves of crops: polynomials, Gaussian fitting, and logistic functions [48]. Since quadratic fitting may occasionally result in negative values, which contradicts the concept of scale factors, a piecewise function combining quadratic and Gaussian fitting was introduced. This innovative approach ensures that the scale factors remain within a logical and physically meaningful range, thereby enhancing the accuracy and reliability of the LAI estimations. In this study, a piecewise function combining quadratic and Gaussian fitting was used for scale factor fitting. This innovative approach effectively avoids the issue of negative values that may arise from using a single method and ensures that the scale factors remain within a reasonable range, thereby enhancing the accuracy of LAI optimization.
In the measured LAI dataset for 2016–2020, the measured LAI values at the Jinzhou and Harbin stations during the milk ripening stage in 2020 were notably high, reaching 6.1 and 7.1 m2/m2, respectively. Typically, the LAI of spring maize reaches its peak during the flowering stage and then gradually decreases [49]. By the milk-ripe stage, the LAI of spring maize generally ranges between 3 and 6 m2/m2 [15,50]. Consequently, the measured LAI values at these two stations are likely erroneous. To ensure the reliability of our accuracy analysis, it is necessary to exclude the outlier values (Figure 8l, Figure 10l).
In this study, the unadjusted MODIS LAI exhibits a significant underestimation compared to measured LAI values, as evident from Figure 4, Figure 8 and Figure 10. This conclusion is consistent with previous research findings, which have highlighted a clear discrepancy between the LAI growth curves extracted from MODIS and measured LAI values [51,52]. The underestimation in MODIS LAI products is primarily due to reflectance data. Due to its lower spatial resolution, MODIS often captures mixed pixels in agricultural regions, where the reflectance of different land cover types, especially in the near-infrared (NIR) band, is much lower than that of the maize canopy. This results in a reduced overall reflectance of mixed pixels, leading to an underestimation of MODIS LAI pixel values [53]. To address this issue, we employ crop-type masking to isolate crop-specific signals in remote sensing throughout the growing season. This method reduces noise in the signal caused by other land cover or crop types and minimizes pixel heterogeneity. Therefore, this study uses composite raster masks extracted from the land use types of 2000, 2010, and 2020 to identify spring maize in the northeastern region.
The method of fitting and adjusting MODIS LAI values using the measured LAI and introducing adjustment coefficients has been validated in previous studies. In research focused on monitoring maize yields in southern Heilongjiang, to address the issue of the MODIS LAI being significantly lower than ground-measured data at peak values, an nth root function was used to fit and adjust the multiplier of the LAI increase [54]. Charoenhirunyingyos et al. [55] established a linear regression model to convert between the MODIS LAI and the field-measured LAI, addressing the issue of scale mismatch during the crop model assimilation process. However, these methods may not be directly suitable for adjusting the MODIS LAI relative to the field-measured LAI. In this study, we propose a nonlinear adjustment method for the MODIS LAI, where the LAI is adjusted using scale factor time series based on pixel purity. This method generates more accurate LAI trajectories with broader applicability in NEC agricultural regions. Validation using field measurements shows that the LAI adjusted by scale factors is a promising approach to accurately represent actual crop growth.

4.2. Uncertainties and Limitations

There were several limitations in our study. Firstly, a pixel purity threshold of 50% was used as the boundary between high- and low-purity pixels, which was constrained by the size of the modeling dataset. In this paper, considering that there were only three sites (Heishan, Qiinggang, and Bayan) with high-purity pixels, to ensure one high-purity validation site, Bayan was randomly selected as the high-purity site for validation purposes, while Heishan and Qinggang were utilized to fit the time series of scale factors for high-purity pixels. Despite being limited by the available modeling data, the scale factors derived from the ground-measured LAI for adjustment show good effectiveness and can reflect the growth characteristics of spring maize in the NEC region. Additionally, the time gap between the modeling dataset and the validation dataset still exists, partly due to the limitations of available data. In the future, if more abundant LAI ground measurement data become available, such as data collected annually, it will help further enhance the scientific robustness and rationality of the study. With more data, the accuracy could potentially be further improved.
This study optimizes the LAI using scale factors constructed with purity, and the results show that this method effectively reduces the impact of mixed pixels on the LAI. However, we recognize that the applicability of this approach may be limited by the complexity of regional land cover types. While maize is the primary rainfed crop in the NEC region, incorporating higher-resolution maize distribution data could further improve purity calculations and enhance the accuracy of the upscaled LAI. However, we believe that the composite raster map, compared to annual maize planting areas, might include soybean crops within the pixels, which could influence the mean LAI values during the upscaling process. Given that agricultural land use can undergo significant interannual variations (such as crop rotation and fallow periods) [56], dynamic monitoring of land use types would help reflect the most current land use conditions. This would also capture differences in vegetation dynamics and growth cycles across years, thus reducing uncertainties caused by land use changes.
In future research, if more measured LAI data become available, different pixel purity thresholds could be explored to differentiate between high- and low-purity pixels. This would enable comparative analyses to determine the optimal threshold. Moreover, the fitting results of the scale factor were closely linked to data availability, and incorporating more measured LAI data could significantly improve the accuracy of scale factor fitting, leading to better-adjusted LAI values. With the widespread application of machine learning [57], future research can employ machine learning algorithms to fit scale factor time series, benefiting from expanded datasets.

5. Conclusions

This study demonstrates that, compared to the method of simply upscaling mean LAI data, using a 50% pixel purity threshold and optimizing remote sensing LAI data for spring maize through corresponding scale factors achieves significantly higher accuracy. Additionally, this study confirms that the piecewise function fitting method, which combines quadratic polynomial fitting and Gaussian fitting, is the optimal approach for determining the pixel purity scale factors for spring maize. The adjusted LAI exhibits spatial and temporal consistency with the growth patterns of spring maize in the NEC region, providing a more accurate representation of the crop growth characteristics. This consistency is crucial for applications in monitoring growth, simulating crop models, and estimating yields. The findings of this study establish a robust foundation for future research, enabling exploration into optimization methods that can be applied across a broader range of regions and crop types.

Author Contributions

J.T.: Writing—original draft, Writing—review and editing, Validation, Software, Methodology. P.W.: Writing—review and editing, Funding acquisition, Conceptualization. R.F.: Writing—review and editing, Conceptualization, Data curation. Y.L.: Writing—review and editing, Formal analysis. Q.L.: Writing—review and editing, Software. All authors have read and agreed to the published version of the manuscript.

Funding

This research was funded by the National Key Research and Development Program of China (2022YFD2001003), the National Natural Science Foundation of China (32171916), the Basic Research Fund of CAMS (2023Z014 and 2024Z001), the Science and Technology Development Fund of CAMS (2023KJ025 and 2024KJ010), the Key Innovation Team of Agricultural Meteorology of the China Meteorological Administration (CMA2024ZD02).

Data Availability Statement

The original contributions presented in the study are included in the article, further inquiries can be directed to the corresponding author.

Conflicts of Interest

The authors declare no conflict of interest.

References

  1. Han, D.; Cai, H.; Zhang, L.; Wen, Y. Multi-sensor high spatial resolution leaf area index estimation by combining surface reflectance with vegetation indices for highly heterogeneous regions: A case study of the Chishui River Basin in southwest China. Ecol. Inform. 2024, 80, 102489. [Google Scholar] [CrossRef]
  2. Du, L.; Yang, H.; Song, X.; Wei, N.; Yu, C.; Wang, W.; Zhao, Y. Estimating leaf area index of maize using UAV-based digital imagery and machine learning methods. Sci. Rep. 2022, 12, 15937. [Google Scholar] [CrossRef] [PubMed]
  3. Fang, H.; Wang, Y.; Zhang, Y.; Li, S. Long-Term Variation of Global GEOV2 and MODIS Leaf Area Index (LAI) and Their Uncertainties: An Insight into the Product Stabilities. J. Remote Sens. 2021, 2021, 9842830. [Google Scholar] [CrossRef]
  4. Zare, H.; Viswanathan, M.; Weber, T.K.D.; Ingwersen, J.; Nowak, W.; Gayler, S.; Streck, T. Improving winter wheat yield prediction by accounting for weather and model parameter uncertainty while assimilating LAI and updating weather data within a crop model. Eur. J. Agron. 2024, 156, 127149. [Google Scholar] [CrossRef]
  5. Ma, Y.; Wang, W.; Jin, S.; Li, H.; Liu, B.; Gong, W.; Fan, R.; Li, H. Spatiotemporal variation of LAI in different vegetation types and its response to climate change in China from 2001 to 2020. Ecol. Indic. 2023, 156, 111101. [Google Scholar] [CrossRef]
  6. Tao, F.; Palosuo, T.; Rötter, R.P.; Díaz-Ambrona, C.G.H.; Inés Mínguez, M.; Semenov, M.A.; Kersebaum, K.C.; Cammarano, D.; Specka, X.; Nendel, C.; et al. Why do crop models diverge substantially in climate impact projections? A comprehensive analysis based on eight barley crop models. Agric. For. Meteorol. 2020, 281, 107851. [Google Scholar] [CrossRef]
  7. Sisheber, B.; Marshall, M.; Mengistu, D.; Nelson, A. The influence of temporal resolution on crop yield estimation with Earth Observation data assimilation. Remote Sens. Appl. Soc. Environ. 2024, 36, 101272. [Google Scholar] [CrossRef]
  8. Zhuo, W.; Huang, J.; Xiao, X.; Huang, H.; Bajgain, R.; Wu, X.; Gao, X.; Wang, J.; Li, X.; Wagle, P. Assimilating remote sensing-based VPM GPP into the WOFOST model for improving regional winter wheat yield estimation. Eur. J. Agron. 2022, 139, 126556. [Google Scholar] [CrossRef]
  9. Huang, J.; Gómez-Dans, J.L.; Huang, H.; Ma, H.; Wu, Q.; Lewis, P.E.; Liang, S.; Chen, Z.; Xue, J.-H.; Wu, Y.; et al. Assimilation of remote sensing into crop growth models: Current status and perspectives. Agric. For. Meteorol. 2019, 276–277, 107609. [Google Scholar] [CrossRef]
  10. Huang, J.; Sedano, F.; Huang, Y.; Ma, H.; Li, X.; Liang, S.; Tian, L.; Zhang, X.; Fan, J.; Wu, W. Assimilating a synthetic Kalman filter leaf area index series into the WOFOST model to improve regional winter wheat yield estimation. Agric. For. Meteorol. 2016, 216, 188–202. [Google Scholar] [CrossRef]
  11. Jin, H.; Li, A.; Wang, J.; Bo, Y. Improvement of spatially and temporally continuous crop leaf area index by integration of CERES-Maize model and MODIS data. Eur. J. Agron. 2016, 78, 1–12. [Google Scholar] [CrossRef]
  12. Huang, X.; Zhao, Y.; Guo, T.; Mao, X. Enhancing SWAP simulation accuracy via assimilation of leaf area index and soil moisture under different irrigation, film mulching and maize varieties conditions. Comput. Electron. Agric. 2024, 218, 108625. [Google Scholar] [CrossRef]
  13. Song, B. Validation of Coarse-Resolution LAI Products over Chinese Croplands Using Field Measurements. Ph.D. Thesis, University of Chinese Academy of Sciences, Aerospace Information Research Institute, Chinese Academy of Sciences, Beijing, China, 2022. [Google Scholar] [CrossRef]
  14. Fang, H.L. Scaling effects of the true and effective Leaf Area Index (LAI and LAIe) and Clumping Index (CI). J. Geo-Inf. Sci. 2021, 23, 1155–1168. [Google Scholar] [CrossRef]
  15. Fang, H.; Zhang, Y.; Wei, S.; Li, W.; Ye, Y.; Sun, T.; Liu, W. The Field Measurements and High Resolution Reference LAI Data in Hailun and Honghe, China [Dataset]; Pangaea: Bremen, Germany, 2019. [Google Scholar] [CrossRef]
  16. Duveiller, G.; Baret, F.; Defourny, P. Using Thermal Time and Pixel Purity for Enhancing Biophysical Variable Time Series: An Interproduct Comparison. IEEE Trans. Geosci. Remote Sens. 2013, 51, 2119–2127. [Google Scholar] [CrossRef]
  17. Dong, T.; Liu, J.; Qian, B.; He, L.; Liu, J.; Wang, R.; Jing, Q.; Champagne, C.; McNairn, H.; Powers, J.; et al. Estimating crop biomass using leaf area index derived from Landsat 8 and Sentinel-2 data. ISPRS J. Photogramm. Remote Sens. 2020, 168, 236–250. [Google Scholar] [CrossRef]
  18. Jin, X.; Li, Z.; Yang, G.; Yang, H.; Feng, H.; Xu, X.; Wang, J.; Li, X.; Luo, J. Winter wheat yield estimation based on multi-source medium resolution optical and radar imaging data and the AquaCrop model using the particle swarm optimization algorithm. ISPRS J. Photogramm. Remote Sens. 2017, 126, 24–37. [Google Scholar] [CrossRef]
  19. Fan, X.; Gao, P.; Zhang, M.; Cang, H.; Zhang, L.; Zhang, Z.; Wang, J.; Lv, X.; Zhang, Q.; Ma, L. The fusion of vegetation indices increases the accuracy of cotton leaf area prediction. Front. Plant Sci. 2024, 15, 1357193. [Google Scholar] [CrossRef]
  20. Bandaru, V.; Yaramasu, R.; Jones, C.; César Izaurralde, R.; Reddy, A.; Sedano, F.; Daughtry, C.S.T.; Becker-Reshef, I.; Justice, C. Geo-CropSim: A Geo-spatial crop simulation modeling framework for regional scale crop yield and water use assessment. ISPRS J. Photogramm. Remote Sens. 2022, 183, 34–53. [Google Scholar] [CrossRef]
  21. Dong, T.; Liu, J.; Qian, B.; Zhao, T.; Jing, Q.; Geng, X.; Wang, J.; Huffman, T.; Shang, J. Estimating winter wheat biomass by assimilating leaf area index derived from fusion of Landsat-8 and MODIS data. Int. J. Appl. Earth Obs. Geoinf. 2016, 49, 63–74. [Google Scholar] [CrossRef]
  22. Huang, J.; Tian, L.; Liang, S.; Ma, H.; Becker-Reshef, I.; Huang, Y.; Su, W.; Zhang, X.; Zhu, D.; Wu, W. Improving winter wheat yield estimation by assimilation of the leaf area index from Landsat TM and MODIS data into the WOFOST model. Agric. For. Meteorol. 2015, 204, 106–121. [Google Scholar] [CrossRef]
  23. Bao, S.; Cao, C.; Huang, J.; Ma, H.; Tian, L.; Su, W.; Ni, X. Research on winter wheat yield estimation based on assimilation of leaf area index and evapotranspiration data. J. Geo-Inf. Sci. 2015, 17, 871–882. [Google Scholar] [CrossRef]
  24. Ma, G.; Huang, J.; Wu, W.; Fan, J.; Zou, J.; Wu, S. Assimilation of MODIS-LAI into the WOFOST model for forecasting regional winter wheat yield. Math. Comput. Model. 2013, 58, 634–643. [Google Scholar] [CrossRef]
  25. Feng, R.; Zhang, Y.; Ji, R.; Wu, J.; Yu, W. The correction of spring maize MODIS LAI product based on the logistic model. J. Agric. 2015, 5, 97–102. [Google Scholar] [CrossRef]
  26. Cui, Y.; Liu, S.; Li, X.; Geng, H.; Xie, Y.; He, Y. Estimating Maize Yield in the Black Soil Region of Northeast China Using Land Surface Data Assimilation: Integrating a Crop Model and Remote Sensing. Front. Plant Sci. 2022, 13, 915109. [Google Scholar] [CrossRef]
  27. Su, W.; Wu, D.; Wu, H.; Zhang, M.; Jiang, F.; Zhang, R. Upscaling method for corn canopy LAI using MaxEnt model. Trans. Chin. Soc. Agric. Eng. (Trans. CSAE) 2016, 32, 165–172. [Google Scholar] [CrossRef]
  28. Zhang, W.; Zhong, S.; Hu, S. Spatial scale transferring study on Leaf Area Index derived from remotely sensed data in the Heihe River Basin, China. Acta Ecol. Sin. 2008, 28, 2495–2503. [Google Scholar] [CrossRef]
  29. Tan, B.; Hu, J.; Zhang, P.; Huang, D.; Shabanov, N.; Weiss, M.; Knyazikhin, Y.; Myneni, R.B. Validation of Moderate Resolution Imaging Spectroradiometer leaf area index product in croplands of Alpilles, France. J. Geophys. Res. Atmos. 2005, 110, D01107. [Google Scholar] [CrossRef]
  30. Han, D.; Wang, P.; Ding, Y.; Tang, J.; Li, Y.; Wang, Q.; Ma, Y.; Wu, D. Improving the simulation accuracy of summer maize growth and yield by pixel-based parameterization based on assimilating upscaled MODIS LAI. Sci. Total Environ. 2024, 954, 176649. [Google Scholar] [CrossRef]
  31. Anees, S.A.; Mehmood, K.; Khan, W.R.; Sajjad, M.; Alahmadi, T.A.; Alharbi, S.A.; Luo, M. Integration of machine learning and remote sensing for above ground biomass estimation through Landsat-9 and field data in temperate forests of the Himalayan region. Ecol. Inform. 2024, 82, 102732. [Google Scholar] [CrossRef]
  32. Akumaga, U.; Gao, F.; Anderson, M.; Dulaney, W.P.; Houborg, R.; Russ, A.; Hively, W.D. Integration of Remote Sensing and Field Observations in Evaluating DSSAT Model for Estimating Maize and Soybean Growth and Yield in Maryland, USA. Agronomy 2023, 13, 1540. [Google Scholar] [CrossRef]
  33. Wang, Y.; Leng, P.; Ma, J.; Manfreda, S.; Ma, C.; Song, Q.; Shang, G.-F.; Zhang, X.; Li, Z.-L. Generation of root zone soil moisture from the integration of an all-weather satellite surface soil moisture estimates and an analytical model: A preliminary result in China. J. Hydrol. 2024, 644, 132098. [Google Scholar] [CrossRef]
  34. Han, E.; Ines, A.V.M.; Koo, J. Development of a 10-km resolution global soil profile dataset for crop modeling applications. Environ. Model. Softw. 2019, 119, 70–83. [Google Scholar] [CrossRef]
  35. Wang, Y.; Xu, M.; Xin, M.; Luo, X.; Zhang, T.; Pan, X.; Ji, Y.; Yin, H.; Zhao, Y.; Sui, M. Indicator construction and spatial distribution characteristics of maize spring waterlogging in Northeast China. Trans. Chin. Soc. Agric. Eng. 2022, 38, 101–110. [Google Scholar] [CrossRef]
  36. Zhang, F.; Chen, Y.; Zhang, J.; Guo, E.; Wang, R.; Li, D. Dynamic drought risk assessment for maize based on crop simulation model and multi-source drought indices. J. Clean. Prod. 2019, 233, 100–114. [Google Scholar] [CrossRef]
  37. Chen, C.; Lei, C.; Deng, A.; Qian, C.; Hoogmoed, W.; Zhang, W. Will higher minimum temperatures increase corn production in Northeast China? An analysis of historical data over 1965–2008. Agric. For. Meteorol. 2011, 151, 1580–1588. [Google Scholar] [CrossRef]
  38. Chen, Y.; Jiao, S.; Cheng, Y.; Wei, H.; Sun, L.; Sun, Y. LAI-NOS: An automatic network observation system for leaf area index based on hemispherical photography. Agric. For. Meteorol. 2022, 322, 108999. [Google Scholar] [CrossRef]
  39. Myneni, R.B.; Hoffman, S.; Knyazikhin, Y.; Privette, J.L.; Glassy, J.; Tian, Y.; Wang, Y.; Song, X.; Zhang, Y.; Smith, G.R.; et al. Global products of vegetation leaf area and fraction absorbed PAR from year one of MODIS data. Remote Sens. Environ. 2002, 83, 214–231. [Google Scholar] [CrossRef]
  40. Yan, K.; Park, T.; Yan, G.; Chen, C.; Yang, B.; Liu, Z.; Nemani, R.R.; Knyazikhin, Y.; Myneni, R.B. Evaluation of MODIS LAI/FPAR Product Collection 6. Part 1: Consistency and Improvements. Remote Sens. 2016, 8, 359. [Google Scholar] [CrossRef]
  41. Zhang, Y.; Wang, P.; Chen, Y.; Yang, J.; Wu, D.; Ma, Y.; Huo, Z.; Liu, S. Daily dynamic thresholds of different agricultural drought grades for summer maize based on the Vegetation Water Index. J. Hydrol. 2023, 625, 130070. [Google Scholar] [CrossRef]
  42. China Meteorological Administration. Specification for Agrometeorological Observation (Volume I); China Meteorological Press: Beijing, China, 1993. [Google Scholar]
  43. Zhuo, W.; Huang, J.; Gao, X.; Ma, H.; Huang, H.; Su, W.; Meng, J.; Li, Y.; Chen, H.; Yin, D. Prediction of Winter Wheat Maturity Dates through Assimilating Remotely Sensed Leaf Area Index into Crop Growth Model. Remote Sens. 2020, 12, 2896. [Google Scholar] [CrossRef]
  44. Luo, Y.; Zhang, Z.; Chen, Y.; Li, Z.; Tao, F. ChinaCropPhen1km: A high-resolution crop phenological dataset for three staple crops in China during 2000–2015 based on leaf area index (LAI) products. Earth Syst. Sci. Data 2020, 12, 197–214. [Google Scholar] [CrossRef]
  45. Xue, L.; Kappas, M.; Wyss, D.; Putzenlechner, B. Assessing the Drought Variability in Northeast China over Multiple Temporal and Spatial Scales. Atmosphere 2022, 13, 1506. [Google Scholar] [CrossRef]
  46. Zhang, X.; Pan, X.; Xu, L.; Wei, P.; Yin, Z.; Shao, C. Analysis of spatio-temporal distribution of drought characteristics based on SPEI in Inner Mongolia during 1960–2015. Trans. Chin. Soc. Agric. Eng. (Trans. CSAE) 2017, 33, 190–199. [Google Scholar] [CrossRef]
  47. Hou, Y.; Huang, X.; Zhao, L. Point-to-Surface Upscaling Algorithms for Snow Depth Ground Observations. Remote Sens. 2022, 14, 4840. [Google Scholar] [CrossRef]
  48. Stepanov, A.; Dubrovin, K.; Sorokin, A. Function fitting for modeling seasonal normalized difference vegetation index time series and early forecasting of soybean yield. Crop J. 2022, 10, 1452–1459. [Google Scholar] [CrossRef]
  49. Shi, D.; Huang, Q.; Liu, Z.; Liu, T.; Su, Z.; Guo, S.; Bai, F.; Sun, S.; Lin, X.; Li, T.; et al. Radiation use efficiency and biomass production of maize under optimal growth conditions in Northeast China. Sci. Total Environ. 2022, 836, 155574. [Google Scholar] [CrossRef]
  50. Ma, X.Y.; Zhou, G.S. Method of determining the maximum leaf area index of spring maize and its application. Acta Ecol. Sin. 2013, 33, 2596–2603. [Google Scholar]
  51. Sebastiani, A.; Salvati, R.; Manes, F. Comparing leaf area index estimates in a Mediterranean forest using field measurements, Landsat 8, and Sentinel-2 data. Ecol. Process. 2023, 12, 28. [Google Scholar] [CrossRef]
  52. Yang, Z.; Huang, X.; Qing, Y.; Li, H.; Hong, L.; Lu, W. Estimation of Time-Series Forest Leaf Area Index (LAI) Based on Sentinel-2 and MODIS. Appl. Sci. 2023, 13, 8777. [Google Scholar] [CrossRef]
  53. Fu, L.; Qu, Y.; Wang, J. Bias analysis and validation method of the MODIS LAI product. J. Remote Sens. 2017, 21, 206–217. [Google Scholar] [CrossRef]
  54. Wang, L.; Yao, B.; Liu, J.; Yang, L.; Yang, F. Maize yield monitoring in southern Heilongjiang based on SWAP model assimilative remote sensing data. Trans. Chin. Soc. Agric. Eng. (Trans. CSAE) 2019, 35, 285–295. [Google Scholar] [CrossRef]
  55. Charoenhirunyingyos, S.; Honda, K.; Kamthonkiat, D.; Ines, A.V.M. Soil hydraulic parameters estimated from satellite information through data assimilation. Int. J. Remote Sens. 2011, 32, 8033–8051. [Google Scholar] [CrossRef]
  56. Yang, Z.; Chu, L.; Wang, C.; Pan, Y.; Su, W.; Qin, Y.; Cai, C. What drives the spatial heterogeneity of cropping patterns in the Northeast China: The natural environment, the agricultural economy, or policy? Sci. Total Environ. 2023, 905, 167810. [Google Scholar] [CrossRef] [PubMed]
  57. Su, L.; Wen, T.; Tao, W.; Deng, M.; Yuan, S.; Zeng, S.; Wang, Q. Growth Indexes and Yield Prediction of Summer Maize in China Based on Supervised Machine Learning Method. Agronomy 2023, 13, 132. [Google Scholar] [CrossRef]
Figure 1. Study area in China: (a) spring maize field and (b) location of ground-measured LAI stations in Northeast China (NEC).
Remotesensing 17 00293 g001
Figure 2. Spatial distribution of spring maize phenophases in NEC in 2011: (a) DOY of VE; (b) DOY of V3.
Remotesensing 17 00293 g002
Figure 3. Framework of MODIS LAI upscaling and refining.
Remotesensing 17 00293 g003
Figure 4. Accuracy of the validation dataset using only the mean LAI as the upscaled LAI of spring maize from 2016–2020. The subpanels (ak) depict the changes in the LAI over time for different sites. Specifically, “Origin LAI” refers to the original MODIS LAI, “S–G Upper Enveloped LAI” represents the MODIS LAI derived using the upper envelope Savitzky–Golay filtering method, “Upscaled LAI” refers to the 5-km resolution LAI derived from the MODIS LAI using the averaging method, and “Measured LAI” denotes the field-observed LAI. In panel (l), the black dashed line represents the 1:1 line, indicating perfect agreement between predicted and actual values, while the black dash-dot lines serve as reference boundaries, representing potential deviations from this ideal line. **: p < 0.01.
Remotesensing 17 00293 g004
Figure 5. Spatial distribution of spring maize purity (a) and the stations with different spring maize pixel purities (observed year, purity) in NEC (b).
Remotesensing 17 00293 g005
Figure 6. Accuracy of the adjusted LAI using scale factors fitted via the four methods without purity in the validation dataset. **: p < 0.01.
Remotesensing 17 00293 g006
Figure 7. Spatial distribution of the original MODIS LAI results (ad), adjusted LAI results using a quadratic polynomial (eh), and piecewise function (il)-fitted scale factor in 2011.
Remotesensing 17 00293 g007
Figure 8. Time series of LAI adjusted by the scale factors fitted through the piecewise function without purity at each station from 2016 to 2020 (ak), accuracy of adjusted LAI (l). The subpanels (ak) depict the changes in LAI over time for different sites. Specifically, “Origin LAI” refers to the original MODIS LAI, “S–G Upper Enveloped LAI” represents the MODIS LAI derived using the upper envelope Savitzky–Golay filtering method, “Upscaled LAI” refers to the 5-km resolution LAI derived from the MODIS LAI using the averaging method, “Adjusted LAI” refers to the LAI refined using the scale factor time series, and “Measured LAI” denotes the field-observed LAI. In panel (l), the black dashed line represents the 1:1 line, indicating perfect agreement between predicted and actual values, while the black dash-dot lines serve as reference boundaries, representing potential deviations from this ideal line. **: p < 0.01.
Remotesensing 17 00293 g008
Figure 9. Adjusted accuracy of the validation samples from 2011 to 2012. **: p < 0.01.
Remotesensing 17 00293 g009
Figure 10. Time series of LAI adjusted by the scale factors fitted through the piecewise function with purity at each station from 2016 to 2020 (ak), accuracy of adjusted LAI (l). The subpanels (ak) depict the changes in LAI over time for different sites. Specifically, “Origin LAI” refers to the original MODIS LAI, “S–G Upper Enveloped LAI” represents the MODIS LAI derived using the upper envelope Savitzky–Golay filtering method, “Upscaled LAI” refers to the 5-km resolution LAI derived from MODIS LAI values using the averaging method, “Adjusted LAI” refers to the LAI refined using the scale factor time series, and “Measured LAI” denotes the field-observed LAI. In panel (l), the black dashed line represents the 1:1 line, indicating perfect agreement between predicted and actual values, while the black dash-dot lines serve as reference boundaries, representing potential deviations from this ideal line. **: p < 0.01.
Remotesensing 17 00293 g010
Figure 11. Taylor diagrams for validating the adjusted LAI, using different data refining methods, against ground-measured LAI data from 2016 to 2020. The reference point represents the location of the measured LAI dataset. The closer the colored points are to the reference point, the higher the accuracy of the model predictions.
Remotesensing 17 00293 g011
Figure 12. Spatial evolution of the adjusted LAI during the developmental period of spring maize in NEC in 2020.
Remotesensing 17 00293 g012
Figure 13. Adjusted LAI on DOY 193 (at) of spring maize in NEC from 2001 to 2020, as well as the proportion of pixels with different LAI values and mean pixel values for each year (u).
Remotesensing 17 00293 g013
Table 1. The time range, purpose, and quantity of measured LAI data from different sources.
Data SourcesTime ScalePurposeNumber of Observed LAI SitesNumber of Observed LAI Samples
Field observation2011–2012Modeling 15111
Joint regional maize experiment2018–2020Validation228
Agrometeorological crop elements: dry matter and leaf area real-time data2016, 2017, 2020319
Fang et al., 2019 [15]2016222
Table 2. Scale factor time series fitting method.
Fitting FunctionFunction Form
Quadratic polynomial y 1 = a · x 2 + b · x + c
Gaussian y 2 = a · e x b 2 2 · c 2
Logistic y 3 = a 1 + e b x c
Piecewise y 4 = y 2           x < x 0 y 1           x x 0           y 1 x 0 = y 2 x 0
Table 3. Variables used to validate the accuracy of LAI-adjusted results.
Variables for Accuracy VerificationFormula
Coefficient of determination R 2 = 1 i = 1 n y i y ^ i 2 i = 1 n y i y ¯ 2
Correlation Coefficient r = i = 1 n y i y ¯ y ^ i y ^ ¯ i = 1 n y i y ¯ 2 i = 1 n y ^ i y ^ ¯ 2
Root Mean Square Error R M S E = 1 n i = 1 n y i y ^ i 2
Mean Absolute Error M A E = i = 1 n y i y ^ i n
Table 4. Coefficient of determination ( R 2 ) of scale factor time series fitted using four fitting methods in 2011–2012. **: p < 0.01.
Station PurityQuadratic PolynomialGaussianLogisticPiecewise
Without purity0.47 **0.38 **0.32 **0.48 **
Low purity0.45 **0.53 **0.06 **0.45 **
High purity0.87 **0.87 **0.89 **0.88 **
Disclaimer/Publisher’s Note: The statements, opinions and data contained in all publications are solely those of the individual author(s) and contributor(s) and not of MDPI and/or the editor(s). MDPI and/or the editor(s) disclaim responsibility for any injury to people or property resulting from any ideas, methods, instructions or products referred to in the content.