Article

Tiltmeter Data Revealing Transient Magma Viscosity Changes During Eruptions

by
David Gomez-Ortiz
1,2,*,
Jose Arnoso
3,5,
Silvia Martín-Velázquez
1,2,
Tomás Martín-Crespo
1,2,
Fuensanta González Montesinos
4,5,
Emilio Vélez
3,5 and
Maite Benavent
4,5
1
Departamento de Biología y Geología, Física y Química Inorgánica, Escuela Superior de Ciencias Experimentales y Tecnología, Universidad Rey Juan Carlos, C/Tulipán s/n, Móstoles, 28933 Madrid, Spain
2
Research Group ‘Geofísica y Geoquímica Ambiental’, Universidad Rey Juan Carlos, Móstoles, 28933 Madrid, Spain
3
Instituto de Geociencias (IGEO), Consejo Superior de Investigaciones Científicas-Universidad Complutense de Madrid, C/Doctor Severo Ochoa, 7, 28040 Madrid, Spain
4
Facultad de Ciencias Matemáticas, Universidad Complutense de Madrid, Plaza de Ciencias 3, 28040 Madrid, Spain
5
Research Group ‘Geodesia’, Universidad Complutense de Madrid, 28040 Madrid, Spain
*
Author to whom correspondence should be addressed.
Remote Sens. 2025, 17(2), 317; https://doi.org/10.3390/rs17020317
Submission received: 26 September 2024 / Revised: 9 January 2025 / Accepted: 13 January 2025 / Published: 17 January 2025

Abstract

:
Volcanic processes related to episodes of inflation, dike propagation, effusive activity, etc., can be detected by continuous surface tilt measurements. The interpretation of these measurements helps comprehend medium-to-short-term precursors of volcanic eruptions or establishes early warning alerts. Additionally, studying the transport and evolution of magmas from the Moho to the crust is key to understanding the eruptive process, but to date, they have not been traced from surface tilts. In this work, we witnessed two relevant and unique dynamic eruptive processes, as revealed by tilt signals, both in the 2021 La Palma eruption and in the 2011–2012 El Hierro eruption (Canary Islands). On the one hand, magma injection from the reservoir at depth is controlled by a pressure gradient. On the other hand, changes in magma viscosity, resulting from pressure variations, have been revealed from cyclic tilt signals. In the case of these signals, matching with a physical model helped us decipher them and establish the duration of this magmatic process, which varied depending on the size and rheological properties of the respective magma plumbing systems.

Graphical Abstract

1. Introduction

Active volcanic areas are typically monitored using geophysical and geodetic techniques to detect periods of unrest in volcanic systems. Geodetic techniques measure surface deformation caused by magma accumulation and ascent [1]. Tiltmeters can provide insights into subsurface mass variations that may not result in measurable surface deformation, offering valuable information about the dynamics and evolution of shallow magmatic plumbing systems in active volcanoes [2]. The analysis of tiltmeter data together with other geodetic and geophysical techniques has proven effective in detecting and monitoring volcanic unrest periods, allowing for the study of inflation and deflation processes in active volcanoes [3,4].
In some eruptive processes, cyclic or oscillatory signals have been observed in geodetic data and have been attributed to various causes, such as magma flux, degassing, heat flux, or the response of fluid-filled conduits [5,6,7]. For example, during the 1996–1997 eruption of the Soufriere Hills volcano, [8] recorded cyclic tilt variations correlated with seismicity explosions whereas [9] successfully modeled the tilt variations as changes in the magma supply rate considering the magma as a high-viscosity Newtonian fluid. During the 2004–2008 eruption of Mount St. Helens, [10] described thousands of cyclic tilt events within the crater. Likewise, [11] recorded cyclic tilt motions during the Vulcanian eruptions of the Shinmoe-dake volcano in 2011. The work of [12] also described step-like tilt changes at intervals of dozens of hours during the 2000 Miyakejima volcano eruption, interpreted as the cyclic expansion of a subsurface sill-like magma plumbing system. More attempts to model periodic variations in the magma discharge rate and ground deformation observed during lava dome eruptions can be found in the works of [13,14] among others. To explain cyclic signals observed in tiltmeter records, some geophysical studies conducted at various volcanoes worldwide have proposed a physical model involving two connected magma bodies without the need for time-dependent magma flux [6,15,16,17].
The objective of our work is to delve deeper into these tiltmeter data studies by investigating several volcanic processes, such as episodes of inflation, dike propagation, etc., and modeling the transport and evolution of magmas from the Moho to the crust using surface tilts observed in the Canary Islands archipelago (Spain). In fact, during two recent volcanic eruptions in the islands of La Palma (2021) and El Hierro (2011–2012), asymmetric cyclic signals were observed in tiltmeter records at specific stations, suggesting local processes related to magma flux variations observed during those eruptions. These observed cyclic signals correlated well with reported changes in magma viscosity [18,19,20,21].
In this paper, we investigate two distinct eruptive processes using surface tilt data recorded in the islands of La Palma (2021) and El Hierro (2011–2012). Our analysis suggests two distinct tilt signals in each eruptive process, which stand for long-period and short-period cyclic signals, with the last ranging from minutes to hours. Then, we parameterize a physical model that explains oscillatory pressure variations in magma chambers to discuss the mechanism producing the observed high-frequency cyclic tilt signals. We also study surface displacements from available GNSS data during the two volcanic eruptions to assess subsurface mass variations in accordance with the modelled physical process. As a result, we can better understand volcano dynamics and its implications for assessing the potential hazards of erupting volcanoes in populated regions.

2. Materials and Methods

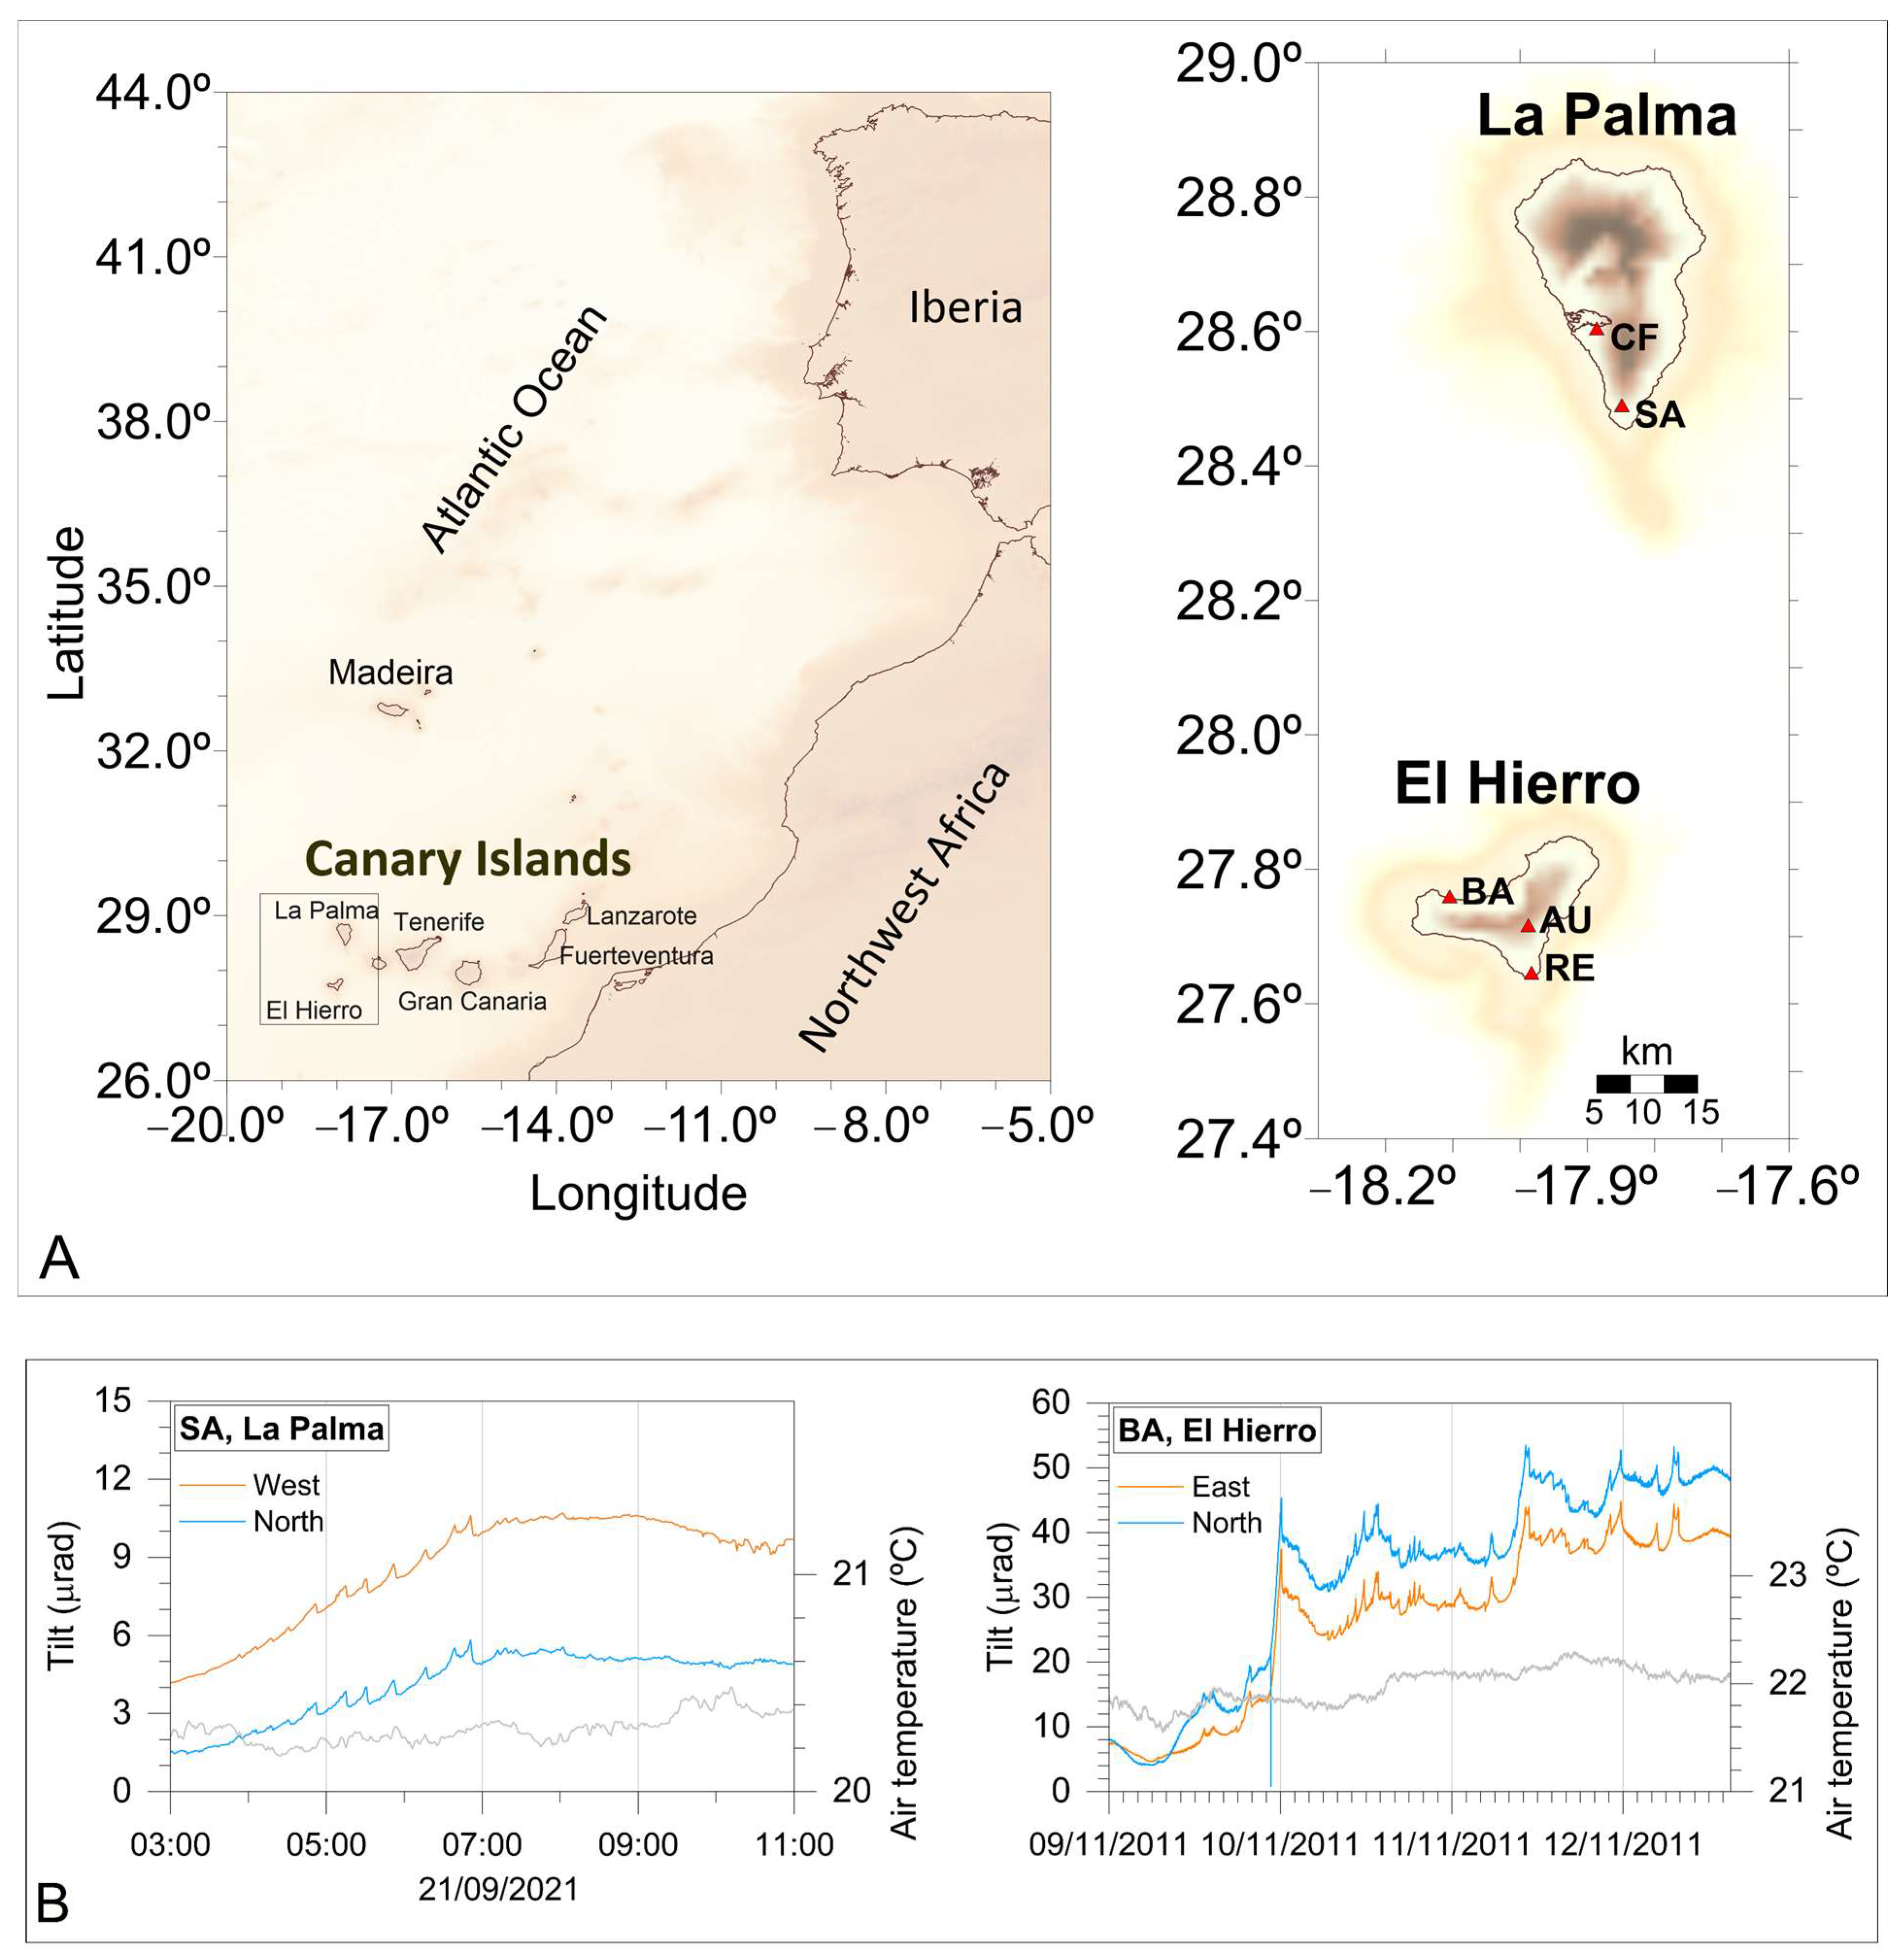
2.1. La Palma (2021) and El Hierro (2011–2012) Eruptions

The 2021 La Palma eruption lasted 85 days, from 19 September to 13 December, and it occurred at the Cumbre Vieja rift (Supplementary Figure S1A). Lava emerged from six major craters and several minor vents constituting a typical fissure eruption trending N310°E [22]. A main volcanic cone was formed, reaching a maximum height of 200 m compared to the pre-existing topography. The maximum distance between the eruptive centers was about 1 km, and not all the vents were active simultaneously. Instead, their activity alternated in accordance with temporal variations in the eruptive process. The final estimated volume of erupted lava was approximately 177 × 106 m3, covering an area of 12 km2 [23]. However, the total volume of erupted material as estimated by the same authors exceeded 217 × 106 m3. A pre-eruptive seismic swarm began on 11 September 2021, followed by a rapid upward migration of hypocenters from 10–12 km to 2–3 km and eventually to the surface. Prior to the eruption onset, a ground uplift of approximately 30 cm was detected using InSAR data in the vicinity of the eruptive center [24]. A detailed model of the magma plumbing system based on the analysis of gravity data (Supplementary Figure S1B) revealed the presence of several interconnected sills and dikes [25]. This model included a deep (~12 km) large sill-like body located at the Moho, serving as the magma reservoir, as well as three minor sills positioned at depths of 6 km, 2 km, and 1 km below the surface, which acted as shallow magma storage zones that were considered in our present modeling from tiltmeter data. Moreover, the analysis of the surface deformation linked to the magma plumbing system provided values of the Young’s modulus for the crustal segment where the shallow magma chambers formed [25]. Continuous volcanotectonic activity since the eruption onset located at depths of 35 km and 12 km suggested a sustained magma supply from below. This supply began to decline around 25 November, as reported by [26], and was subsequently followed by a decrease in lava emission rates [27,28], seismicity, and SO2 emissions, well after the cyclic tiltmeter signal was observed. Table 1 presents the different parameters obtained from earlier studies that were used to constrain the physical model described in Section 2. Here, the Young’s modulus has been transformed into the bulk modulus using a Poisson’s ratio value of 0.25. Romero et al. [21] estimated the crystallization times of two plagioclase crystal populations ranging from ~1 h to 65 h, which correspond to a pressure-driven crystallization associated with a magma velocity ascent of 0.17 to 0.43 m·s−1.
The 2011 El Hierro eruption began on 10 October 2011 and ended on 5 March 2012, lasting 146 days. It occurred offshore, approximately 5 km south of the La Restinga town, which is situated to the southern tip of El Hierro (Supplementary Figure S1A). The primary vent of the eruption was located at a depth of 900 m below sea level. Prior to the eruption, there was a period of seismic unrest lasting three months, during which more than 11,000 earthquakes were recorded [29]. The seismic activity during the first two months of this unrest period was detected offshore, at a depth of 10–15 km, to the north of the island. The authors of [29] suggested that this fact marked the primary intrusion of magma, leading to the formation of a magma reservoir at the Moho boundary (~14 km depth). Following this period, the seismic activity shifted laterally 20 km towards the south while maintaining the same depth, accompanied by a surface uplift up to 4 cm. Eventually, the eruption commenced shortly after a magnitude 4.3 mbLg earthquake. Ten days after the eruption onset, seismic activity resumed to the north of the island at a depth of 20–25 km, gradually migrating upward to 10–15 km. This has been interpreted as the decompression of the magma plumbing system due to the withdrawal of magma at depth [18,29]. The total estimated volume of erupted magma was approximately 330 × 106 m3, with an average eruption rate of around 26 m3·s−1 [30]. Additionally, [18] proposed the existence of a deeper reservoir to the north of the island at a depth of 20–25 km, connected via a vertical conduit to a shallower reservoir located at the Moho boundary (~14 km depth). During the three-month unrest period, magma would have accumulated in the shallower magma storage, undergoing differentiation through fractional crystallization [18,19], followed by less evolved magmas at the onset of the eruption. These authors proposed a first episode of basanite fractionation occurring in a shallow reservoir (12–15 km), with a time scale of the order of a few months, typical of a temperature-driven crystallization process. Then, a second episode, corresponding to the recharge of more primitive magmas, would have occurred, corresponding to magma transferred directly to the surface with minimum residence or no differentiation in the shallow reservoir. Thus, this second eruptive process corresponds to a rapid magma ascent that usually occurs on a very short time scale, typical of a decompression-driven crystallization process. Similarly to the La Palma eruption, in El Hierro, persistent volcanotectonic activity at depths of 20–25 km during the syn-eruptive phase [18,19] suggests a continuous magma supply from the deeper parts of the magma plumbing system during the period when the cyclic tiltmeter signal was recorded. A simplified diagram of the magma plumbing system can be observed in Supplementary Figure S1C. Analysis of petrological data from rock samples collected at the sea surface during the eruption provided information on magma density, viscosity, and abrupt changes in magma compositions and crystal content [19]. The mechanistic model also provided the Young’s modulus value of the crust [18]. This information is listed in Table 1 and was used to constrain the various parameters involved in the physical model presented in this paper.
Table 1. Description of the parameters utilized in the physical model, along with their respective values (or range of values), as reported by various authors in previous works. Empty cells in the table indicate model parameters for which no published information is available.
DescriptionSymbolValues
Model Variables La Palma (2021)El Hierro (2011)
Horizontally averaged vertical velocityw0.17–0.49 m·s−1 [21]-
Crystal concentration per volumeβ0.4 [16]
Critical crystal concentration per volume β ¯ 0.7 [16]
Geometrical parameters
Vertical distance between both chambersL5 km [25]7 km [19]
Radius of the feeding conduita~48 m [25]-
Magma properties
Viscosityμ2.3 × 10⁴–14.7·104 Pa·s [21]0.1 × 10²–3.16 × 10² Pa·s [18,19]
Densityρ2650–2700 kg·m−3 [21,25]2650–2800 kg·m−3 [19,31]
Crystal growth rateχ10–12 m·s−1 [17]
Number density of crystalsnch1.8 × 1014 m−3–7 × 10¹⁴ m−3 [21,32]
Storage zone properties
Volume of the top storage zoneVt~3.75 × 10⁷ m3 [25]~2 × 10⁸ m3 [19]
Volume of the bottom storage zoneVb~3 × 10⁷ m3 [25]-
Feeding volumetric fluxQ~27 m3·s−1
(this work)
~26 m3·s−1 [30]
Young’s modulusE1–10 GPa [25]30 GPa [19]

2.2. Geodetic Data

To monitor the surface deformation and mass changes that occurred during the eruptive processes, several tiltmeters were installed on these islands. The datasets analyzed here, which account for the cyclic signal, correspond to the tiltmeters installed in the BA (El Hierro) and SA (La Palma) sites (Figure 1A and Supplementary Information S1.1) and comprise two respective orthogonal tilt series, each with its specific geographic orientation (Figure 1B). Figure 1B shows tilts dominated by short-term variations (from hours to days) with low amplitudes for both tiltmeter components at BA and SA sites. In both cases, short-term variations appear superimposed on a longer-period signal. Therefore, it is appropriate to extract the cyclic signals from the time series to use them later as inputs for the physical model.

2.3. Analysis of the Time Series of Tiltmeter Data

Geodetic data capture not only inflation and deflation episodes but also seasonal changes unrelated to magmatic causes, such as atmospheric and hydrological variations [33]. Therefore, it is important to distinguish between transient nonperiodic and temporal variations with different origins.
Multichannel singular spectrum analysis (M-SSA) is a data-adaptive, nonparametric method that allows the analysis of spatially and temporally correlated time-series data (e.g., [34,35,36]). M-SSA extracts different modes of temporal and spatial variability in the form of empirical basis functions. This method extracts various types of trends and cyclic signals mixed with noise from time series without requiring any prior assumptions about amplitude or slope.
In fact, M-SSA has been successfully applied to the analysis of paleoclimatic time series (e.g., [37,38]), global surface air temperature time series (e.g., [39]), and GNSS time series (e.g., [40,41]). More recently, M-SSA has been used to analyze GNSS time series recorded at different volcanoes to obtain information about the dynamics of the eruptive process [6,17,42]. Although its application to the analysis of tiltmeter data in volcanic areas has yet to be explored, we explain, in the following sections, how this method provides interesting results in the case of deformation studies from tilt signals.
We used M-SSA to extract the signal related only to the oscillatory process and to distinguish it from other signals of different origins. This analysis allowed us to discriminate high-frequency cyclic signals from transient longer-period signals as related to inflation/deflation of the shallow magma chamber. Furthermore, using the Monte Carlo M-SSA (MC-MSSA) method, we will be able to distinguish ‘real signals’ from those associated with noise.

2.3.1. Multichannel Singular Spectrum Analysis (M-SSA)

The fundamentals of the M-SSA method have been extensively described in previous works (e.g., [17,34,37,38]), and only a brief description is provided here. We used the SSA-MTM Toolkit [34,43] for the data analysis.
M-SSA can be applied to a set of L time series with N evenly sampled data points, where Ts represents the sampling period and (N − 1) × Ts represents the duration of the time series. The time series dataset Xi(k) is given as follows:
X i k ,   i = 1,2 , ,   L ; k = 1,2 , ,   N
If L equals 1, there is only a single time series, and it corresponds to the single-channel SSA analysis method.
The first step is to decompose the set of L time series into modes of spatiotemporal variability that correspond to nonlinear trends, cyclic signals, or noise. These modes are derived from the eigenvectors of the covariance matrix:
C = 1 N M + 1 X t X
Here, M represents the length of the window in which the original time series are embedded, and X is the “trajectory matrix” that connects M-SSA analysis to dynamical systems theory [34]. Xt denotes the transpose of the matrix X. The maximum period of the extractable modes is M × Ts. The value of M must be carefully chosen to allow for the extraction of desired seasonal signals while maintaining statistical confidence. It depends on the characteristics of the analyzed time series and the desired signal period.
The decomposition of the covariance matrix C is given as follows:
Λ = E t C E
This yields the L × M real eigenvalues that are the diagonal elements of Λ and the eigenvectors (also known as empirical orthogonal functions, EOFs), which appear as the columns of E.
The projection of the time series and their lagged copies contained in the trajectory matrix X onto the eigenvectors yields the principal components (PCs), which form the columns of the matrix A:
A = X E
The PCs are time series that represent the temporal behavior of the extracted modes and can be seen as a sparse representation of the time-dependent patterns shared across a set of time series [17]. These components can be used to identify modes related to a geophysical origin, such as magmatic sources; modes not related to geophysical processes, such as seasonal variations; or even modes related to signal noise. Once the PCs of interest have been determined—in our case, those related to a magmatic process—the relevant part of the time series can be reconstructed from the original time series by convolving the corresponding PCs with the EOFs. Thus, we obtain the reconstructed components (RCs), which provide a proper visualization of the time series after filtering out nonmagmatic components and the lower variance noise. It should be noted that the sum of all RCs results in the original time series without loss of information.

2.3.2. Monte Carlo M-SSA (MC-MSSA)

The MC-MSSA method [44] can be used to discern whether previously determined RCs correspond to true signals or whether some of them are related to noise. The fundamental methodology underlying the MC-MSSA is to employ random sampling to estimate the behavior of a system over time.
As described in [6], MC-MSSA first constructs sets of “surrogate data” [45] and then several distinct null hypotheses can be formulated. The partial variances in the dataset being analyzed are compared with the corresponding variances resulting from a particular null hypothesis. This null hypothesis represents an ensemble of surrogate data with the same length N and the same number of channels L as the data to be analyzed. By using a large ensemble of surrogate data, confidence intervals for the eigenvalues can be estimated. If the eigenvalues of the data lie inside or below these confidence intervals, it can be concluded that the associated eigenvalues are not significant with respect to the null hypothesis, indicating that they are not associated with a true signal but with noise.

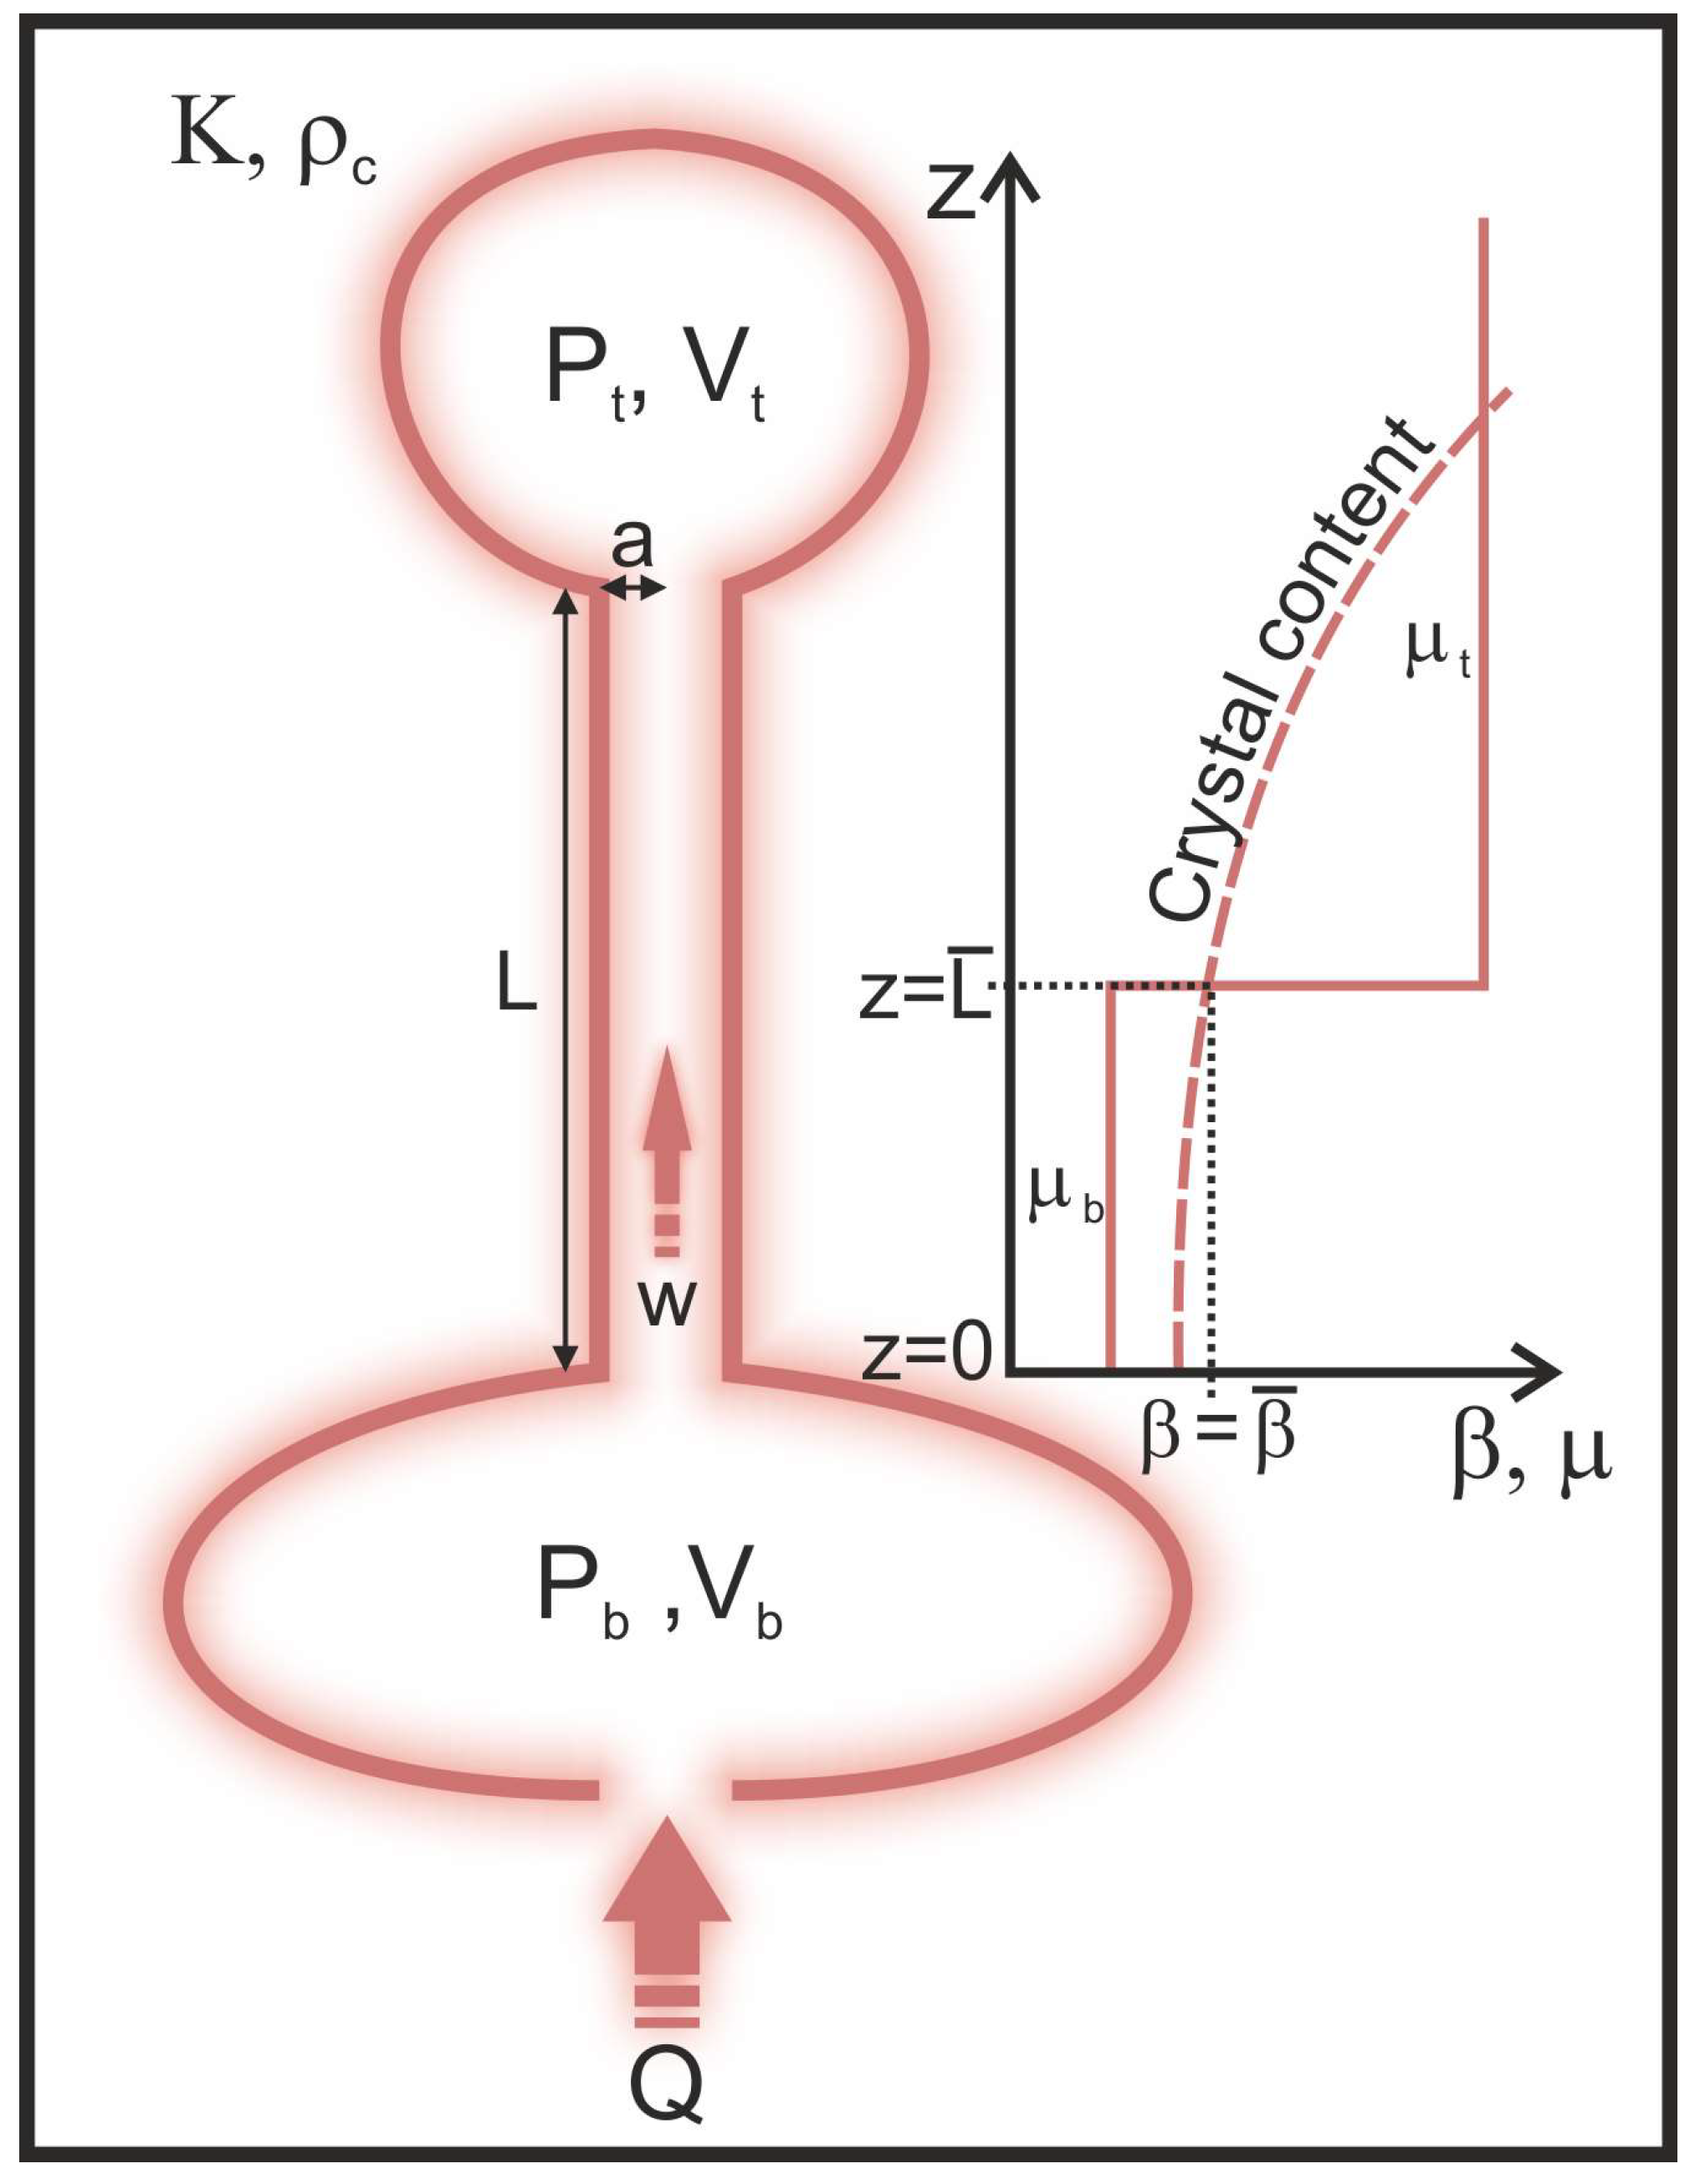
2.4. Description of the Physical Model

As explained by [14], numerous models of flow-induced pressure oscillations in volcanoes are present in the literature (e.g., [9,15,16,46,47,48,49,50,51]). All of these models reproduce volcanic oscillations, attributing them to flow-induced oscillation models that involve coupling between elastic capacitance and variable flow resistance. The discrepancies arise from the proposed mechanisms of variable flow resistance: viscosity dependence on temperature distribution in the conduit [15]; changes in conduit radius due to the deformation of surrounding rocks, which depends on overpressure [46,48,51]; and velocity-dependent volatile and/or crystal contents, which control magma viscosity [16,47], among others. Nevertheless, all of them may be described by the same mathematical model using dimensionless parameters within ranges that encompass possible variations in natural volcanic systems.
Certain models are suitable for reproducing the pressure oscillations induced by repetitive explosive eruptions (e.g., [14]) while others can better replicate cyclic pressure changes associated with nonexplosive dome-building models, which do not include flow pattern transitions (e.g., [13,16,46,47,51]). Moreover, the number of parameters implied in the models varies, consequently requiring different amounts of geological information for each case.
Considering the above comments, the model selected in this study represents a compromise between the model best suited to the characteristics of the studied eruptions (i.e., monogenetic volcanoes fed by primitive magmas governed by low-viscosity laminar flow along a vertical pipe and low-explosivity eruptions) and a reduced number of variables (i.e., geological/geophysical data) needed for the modeling. Consequently, the model proposed by [6,17], built upon the previous approaches from [15,16], provides a straightforward explanation of the circumstances under which those volcanoes can exhibit oscillatory pressure variations inside magma chambers that can eventually result in cyclic tiltmeter signals similar to those observed.
For the sake of simplicity, only the fundamentals of the model are presented here while more detailed descriptions can be found in [6,15,16]. The main parameters governing the model, along with a schematic representation, are displayed in Figure 2.
The model comprises two magma chambers of different volumes (Vb and Vt), situated at distinct depths and interconnected by a vertical conduit of length L and radius a. The lower chamber receives a constant magma flux Q from below. Magma is transported from the deeper chamber to the shallower chamber by means of pressure variations (Pb and Pt). The magma ascends through the conduit from one chamber to the other with a horizontally averaged vertical velocity w. During ascent, the magma viscosity changes due to decompression-induced crystallization. Thus, the viscosity increases from an initial value µb to a higher value µt following a step function, with a sharp increase when the crystal concentration per unit volume β reaches a critical threshold value β ¯ . The depth at which the conduit reaches the critical crystal concentration per unit volume is denoted as L ¯ . It is important to note that [6] and references therein explain that while decompression-induced crystallization is a likely cause of increased viscosity, it is not the sole process, and several ones can occur at the same time. Different authors have stated that several mechanisms, such as temperature changes and/or fluid exsolution, can lead to this phenomenon. For instance, [16], in a similar model, suggested that gas exsolution causes degassing-induced crystallization, while [15] found that cooling of rising magma could result in periodic behavior in lava dome eruptions. As a result, both decompression and cooling can induce crystallization, leading to a change in viscosity and causing cyclic behavior as reproduced in the model.
The increase in viscosity along the conduit reduces the effectiveness of the hydraulic connection between the chambers, resulting in a decrease in the vertical magma velocity w. As the lower magma chamber is continuously fed from below, the reduction in magma velocity leads to an increase in pressure within the upper chamber. The elastic deformation associated with the changes in the chamber volumes depends on the bulk modulus of the surrounding rocks, denoted as K. The pressure increase continues until a certain threshold value is reached. Subsequently, the velocity abruptly increases, and the initial pressure gradient between the two chambers is restored. If this process is repeated several times, the pressure in the upper chamber experiences repetitive pulses, describing a cyclic signal.
The temporal variations in Pb, Pt, and w are described by the following system of equations [17]:
d P b d t = Q w K π a 2 V b d P t d t = w K π a 2 V t d w d t = 1 L ρ P t P b + ρ g L 8 w μ b μ t L ¯ a 2 L 8 w μ b a 2 f o r   w w ¯ ,   a n d 1 L ρ P t P b + ρ g L 8 w μ b a 2 f o r   w > w ¯
Here, g is the acceleration of gravity (m·s−2), t is time (s), and w ¯ represents the threshold value of magma velocity w (m·s−1) that causes the viscosity of magma (µ in Pa·s) to transition from µb to µt when the threshold of crystal content β ¯ is reached. L ¯ (m) depends on the decompression rate, which, in turn, relies on the vertical magma velocity w. If w > w ¯ , the decompression rate is too high for significant crystallization to occur, resulting in no change in magma viscosity.
To simplify the solution of the differential equations, we can express them in a nondimensional form and use ΔP = PtPb. Then, the system of equations becomes as follows:
d P d t = V Q + 1 + V w d w d t = γ g w w P
Here,
g w = μ 1 w μ     f o r   w 1   a n d 1     f o r   w > 1 .
In the above equations, the dimensionless variables are denoted by a prime, and the asterisk denotes the four dimensionless parameters that control the behavior of the system:
μ = μ t μ b , V = V t V b , γ = 8 μ b 2 ρ L V b K π a 6 ,   and Q = Q w ¯ π a 2
The scales used to transform the system into the nondimensional case are as follows:
w = w ¯ w ,   where   w ¯ = 36 π n c h 1 3 β ¯ 2 3 χ L β t = t ¯ t ,   where   t ¯ = 8 ρ μ b L V t K π a 4 P = p ¯ P = p ¯ P t P b ,   where   p ¯ = L ρ 8 μ t w ¯ a 2 Q = Q ¯ Q ,   where   Q ¯ = π w ¯ a 2
Here, χ represents the crystal growth rate (m·s−1), Δβ is the difference between the crystal concentration at the bottom of the conduit and the critical crystal concentration β ¯ , and nch is the number density of crystals (m−3).
It is worth noting that the described physical model exhibits oscillatory behavior and experiences a stability loss of the equilibrium state only under certain conditions [6,17]:
µ   >   2 ,   and   V + 1 V > Q > 1 2   V + 1 µ V µ 1
These inequalities imply that pressure oscillations occur only when the magma viscosity significantly increases during ascent and when the magma flux entering the plumbing system remains within a certain range of values. If the magma flux drops or exceeds the boundaries described in Equation (10), the oscillatory behavior cannot be sustained.

3. Results of the Analysis of the Time-Series Tiltmeter Data

3.1. La Palma Data

The tiltmeter dataset observed during 21 September 2021 at the SA site in La Palma (Figure 1) comprises a time series of two orthogonal components (L = 2) with a 1 min sampling time (Ts) with N-S and E-W orientations. The selected time interval for the analysis spans seven hours (Figure 1B) and comprises N = 421 records. Although the transient cyclic signals are only present between 04:30 and 08:00 UTC, we selected the seven-hour time interval to ensure that the beginning and ending signals were almost stationary.
A visual examination of the data reveals a long-term signal with a progressive increase, exhibiting amplitudes of about 3.5 and 6 µrad for the N and W components, respectively. Also, there is a cyclic signal of approximately 1 µrad, and a 20 min period, for both N and W components. During the examined period, no noticeable thermal effects were observed on the tiltmeter performance, as evidenced by the air temperature records at the station (Figure 1).

3.1.1. Choice of Window Length

We tested various window lengths (M) and compared their corresponding singular spectra. Our findings revealed minimal variations in the amplitude of the singular spectrum, which had a negligible effect on the analysis results. Figure 3A displays the singular spectrum of the tiltmeter signal obtained with M = 30, which achieved a satisfactory balance between the statistical significance of the extracted modes and the maximum period of the desired cyclic signals. The plot shows values for the 40 eigenvalues obtained, with the first one accounting for the majority of the signal’s variance, with a value of 37.43 (representing 98.9% of the total variance). This outcome was expected, as a visual inspection of the signal revealed a dominant component with an amplitude of up to six times greater than that of the cyclic signal. Eigenvalues 2 to 10 exhibit a linear decrease, with variance contributions ranging from 0.5% to less than 0.01%. Eigenvalues 11 to 40 also demonstrate a linear decrease but with a lower slope, and their contribution to the total signal variance is minimal (<0.01%). Therefore, these eigenvalues likely correspond to signal noise.

3.1.2. Statistical Significance of the Extracted Modes and Signal Reconstruction

Independently of the first, the contribution of the remaining eigenvalues was very small, so they could have been associated with noise rather than a real cyclic signal. To determine whether they corresponded to a real signal or not, we conducted a significance test of eigenvalues 2 to 20 because eigenvalue 1 was clearly associated with a signal as it accounted for a substantial fraction of the total variance of the data series. We applied the MC-MSSA method to determine the statistical significance of the different eigenvalues obtained. We obtained a total of 1000 surrogate data with the same length (N), time series (L), and sampling time (Ts) as the original data. Figure 3B displays the results of the MC-MSSA test for the first 20 eigenvalues. Only eigenvalues 1 to 5 clearly exceeded the 95% confidence interval associated with noise, indicating that they corresponded to a true signal. Eigenvalues greater than 5 fell within or below the confidence intervals and can therefore be attributed to noise.
Figure 4 displays the first five principal components (PCs) corresponding to the tiltmeter signal. PC1 does not exhibit any cyclic behavior whereas PCs 2 to 5 represent cyclic signals with a period ranging from approximately 10 to 20 min. PC1 shows an almost linear increase in the signal until 6:43 UTC, followed by a stabilization. Figure 5 compares the original signal with the reconstructed one using the first five leading PCs. As previously indicated by the analysis of the eigenvalues, PC1 contains most of the signal content, except for the cyclic component that is the one we are interested in. Therefore, we reconstructed the signal using a combination of PCs 2 to 5, which corresponded to the input cyclic signal in the physical model.

3.2. El Hierro Data

Similar to La Palma, we analyzed the tiltmeter time series gathered at the El Hierro BA site during the 2011 eruption (Figure 1). We used the data logged at 1 min sampling intervals for the two orthogonal components N-S and E-W (Figure 1B). In this case, the analysis spanned 87 h, from 9 November 2011 at 00:00 UTC to 12 November at 15:00 UTC.
The time series was selected to start before the first well-defined cyclic pulse (9 November at 13:00 UTC) and extend beyond the last one (12 November at 12:40 UTC) when the signal was almost stationary. A preliminary visual inspection of the data reveals a long-term signal with amplitude increases of approximately 40 and 30 µrad for the N and E components, respectively. Additionally, there is a short-period cyclic signal (~4–5 h peak-to-peak period) with low amplitude, ranging from 1 to 5 µrad for both components.
While diurnal temperature fluctuations may impact ground tilts to some extent, our analysis did not reveal any noticeable correlation between these cyclic tilt events and the air temperature variations recorded at the station during the specified period (Figure 1).

3.2.1. Choice of Window Length

Given the duration of the cycles, we selected a window length of M = 100 in order to compute the singular spectrum of the tiltmeter signal. This selection represented a good compromise between the statistical significance of the extracted modes and the maximum period of the oscillations we wanted to extract. Figure 6A displays the values for the first 20 eigenvalues. The first eigenvalue accounts for 98% of the total variance in the signal with a value of 2131. It corresponds to the dominant signal described above, which exhibits an amplitude approximately 6–8 times greater than the cyclic signal. There is a roughly linear decrease in the variance content from eigenvalues two to six, with eigenvalues two, three, and four having greater contributions to the overall variance (1%, 0.5%, and 0.25%, respectively), whereas eigenvalues seven to nine contribute less than 0.1% each. The remaining eigenvalues (10 to 20) exhibit a roughly linear decrease. Their contribution to the total variance of the signal is very low (<0.01%), so they are tentatively attributed to signal noise.

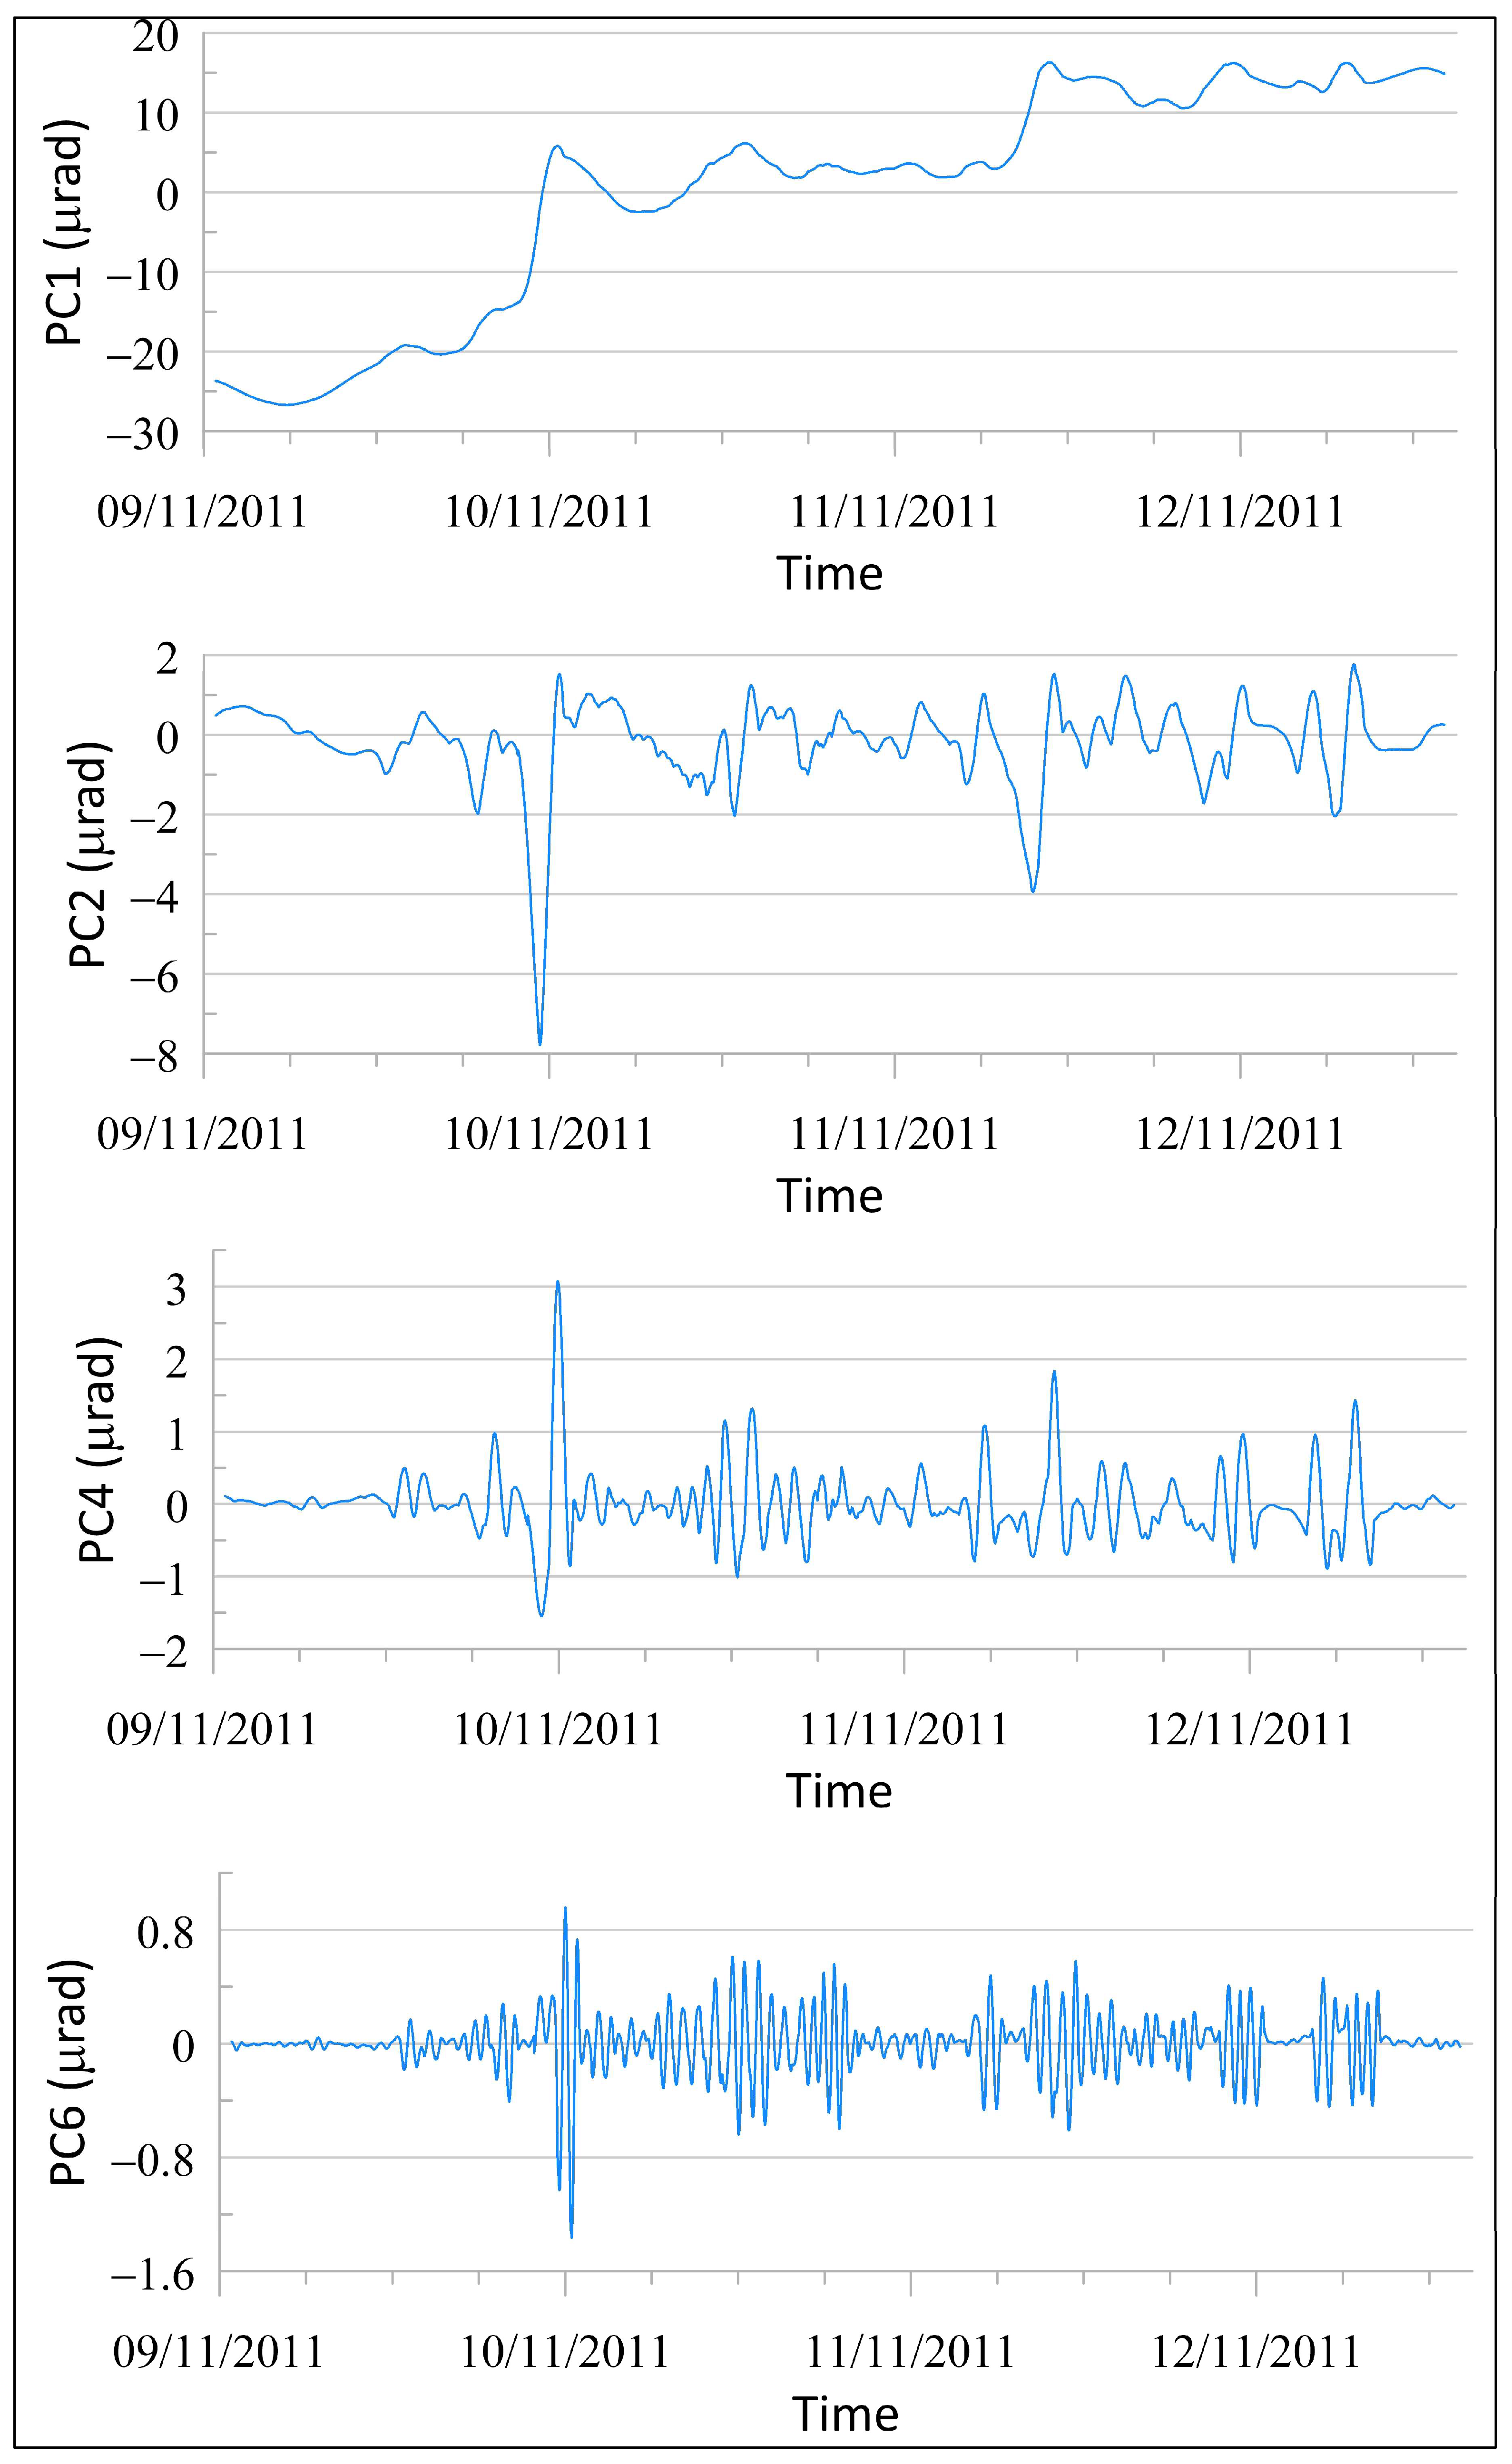
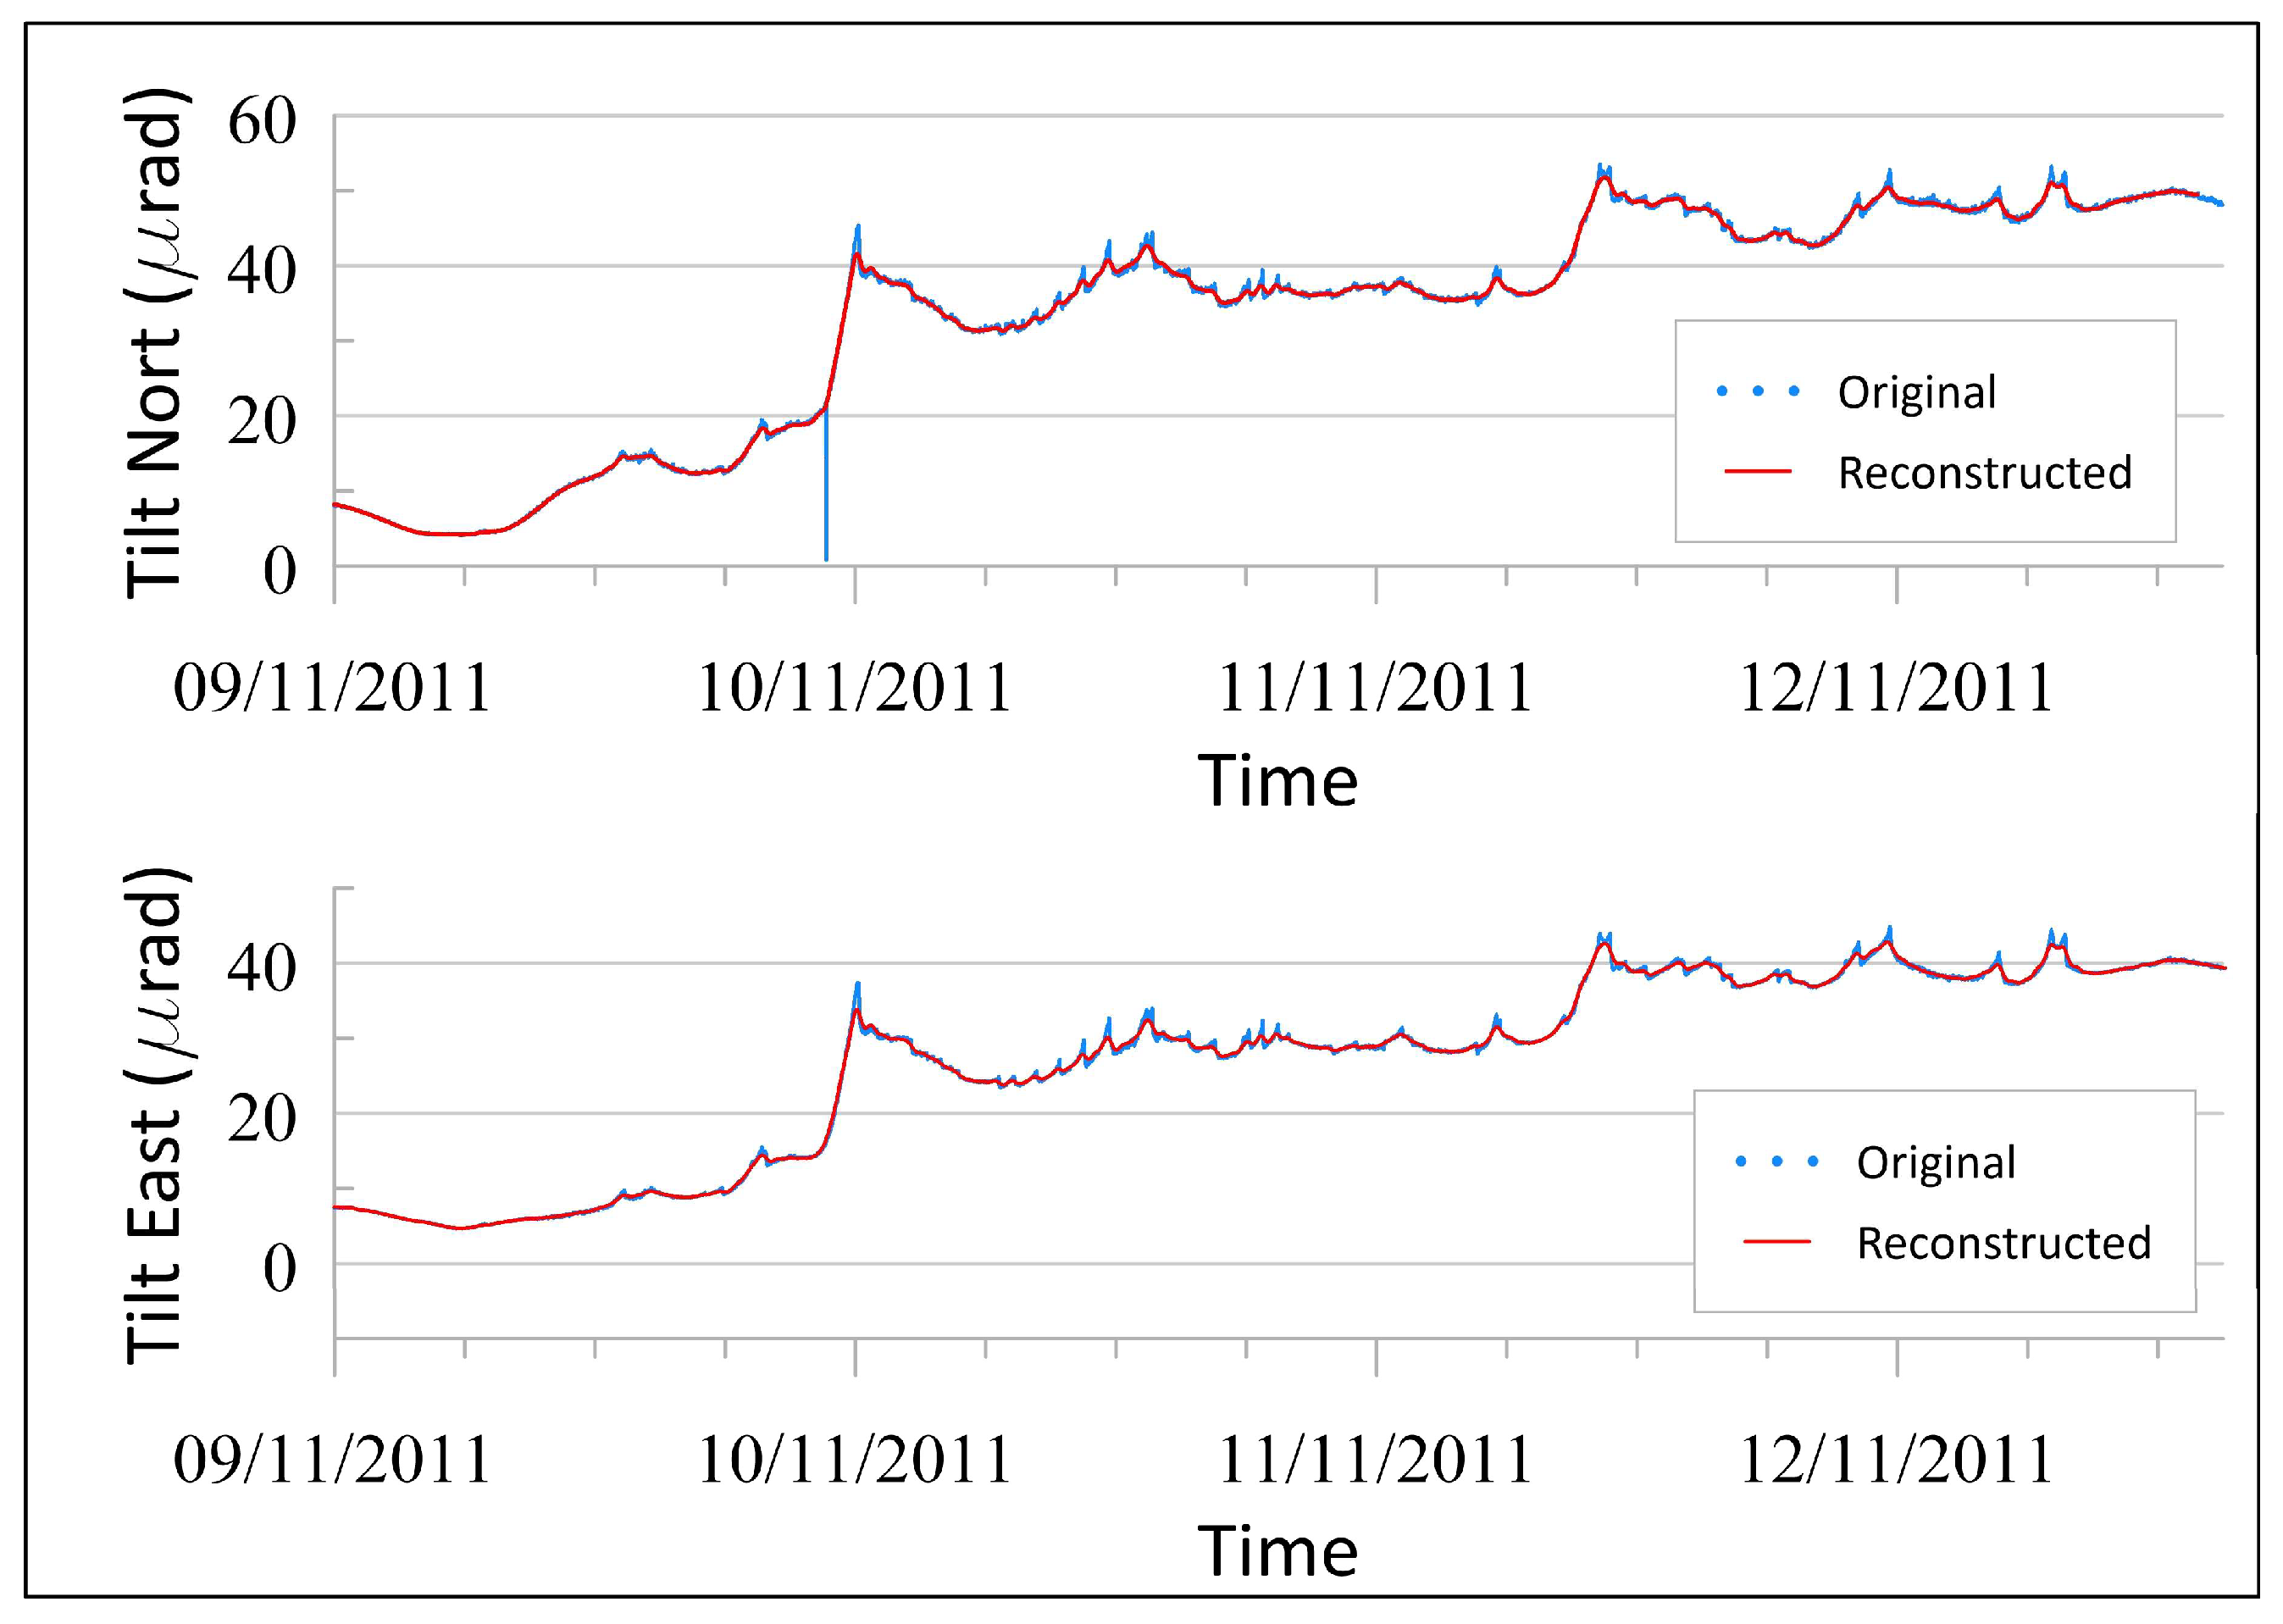
3.2.2. Statistical Significance of the Extracted Modes and Signal Reconstruction

Figure 6B shows the results of the MC-MSSA test applied to the 20 eigenvalues, which were generated from a set of 1000 surrogate data with the same length (N), time series (L), and sampling time (Ts) as the original data. Among these eigenvalues, only numbers 1, 2, 4, and 6 surpassed the 95% confidence interval associated with the noise, thus indicating their association with a true signal. The eigenvalues 3, 5, and 7–20 fell either within or below the confidence intervals, which suggests that they were associated with noise.
Figure 7 displays the relevant PCs obtained from the MC-MSSA significance test, namely PCs 1, 2, 4, and 6. PC1 exhibits a staircase-like pattern characterized by a consistent increase in signal, featuring two prominent steps occurring on 10 November at 00:00 UTC (approximately 20 µrad) and 11 November at 10:00 UTC (approximately 10 µrad). These steps bound two plateaus with minor steps in between, but they do not display any distinct oscillatory behavior. Conversely, PCs 2, 4, and 6 clearly represent cyclic signals with varying amplitudes, ranging from about 10 (PC2) to 0.5 (PC6) µrad.
Figure 8 shows a comparison between the original signal (both N and E components) and the reconstructed signal, which only utilizes four significant PCs (1, 2, 4, and 6). Excluding the spike in the N component on 9 November at 22:39, the reconstructed signal shows very few differences with the original one. As in La Palma, this result confirms the capability of the M-SSA method to extract the transient cyclic signals present in the tiltmeter series and to represent them using only a few PCs.
Since our interest lies in the cyclic components of the tiltmeter time series, we reconstructed the signal using a combination of PCs 2, 4, and 6, which will be used as input for the physical model.
With regard to the amplitude range, the maximum peak-to-peak amplitude is approximately 11 µrad, with a mean value of 4 µrad. This amplitude is considerably larger than that observed in the time series from La Palma. The highest amplitude cycle was recorded on 10 November at 00:00 UTC, with subsequent cycles of moderate to low amplitudes. In general, the characteristics of the time-series signal indicate a more intricate behavior of the physical system in comparison to the case of La Palma.
The results of the M-SSA method revealed, in both cases, that the first eigenvalue was the dominant component and had an amplitude several times greater than that of the cyclic signal. It is worth noting that the analysis of PCs revealed that the original signal, which had cyclic and asymmetric behavior, resulted from the superposition of a linear trend (PC1) and a symmetric sinusoidal periodic oscillation (PC2–5 and PC2–4–6 for La Palma and El Hierro, respectively), the latter being the one that introduced the cyclic behavior. The asymmetry of the original signal arose from the interaction between these two components. The cyclic component introduced a periodic oscillation, which itself rose and fell symmetrically. However, when overlapping with the linear component, its shape was modified. During the ascending phase of the oscillation, the linear trend prolonged the signal increase as both components were summed. During the descending phase, the cyclic signal decayed by a smaller magnitude as the linear trend tended to attenuate the fall.
The linear trend (PC1) resulted from the response to the progressive inflation of a sill-like source while the periodic behavior represented short-period variations superimposed on that progressive inflation. In this paper, we try to identify the cause of these short-period cyclic signals, so we will focus on their modeling.

4. Application of the Physical Model to the Cyclic Tilt Signal

We reconstructed only the high-frequency cyclic signals to be used as input in the proposed physical model that relates such oscillatory behavior to viscosity variations associated with changes in the vertical velocity of magma (Figure 9). As previously explained, the model is governed by four dimensionless variables, i.e., µ, V, γ, and Q, constrained by the range of values listed in Table 1 obtained from the available geological and geophysical information. The subsequent implementation of the physical model generated a comprehensive set of potential model solutions for the cyclic signals. At each site, La Palma and El Hierro, the resulting solution for each combination of the four variables was compared to the observed cyclic signal.
The estimation of the four dimensionless variables governing the respective physical model can be challenging due to the numerous parameters required, not all of which are readily available or estimated with sufficient accuracy, depending on the nature of the eruption (e.g., subaerial or submarine). Thus, obtaining reliable estimates of the most likely range for each of the four dimensionless parameters controlling the behavior of the system is crucial. This process entails the following:
  • To constrain the range of realistic values for the four dimensionless parameters using available geological and geophysical information: For the cases of La Palma and El Hierro eruptions, Table 1 lists all available information, and more details are given in Section 2.1. For instance, the range of magma viscosity values for La Palma eruptions, based on published data, is 2.3 × 10⁴–14.7 × 10⁴ Pa·s, while for El Hierro, it is 0.1 × 10²–3.16 × 10² Pa·s. Similarly, magma density values reported in the literature range from 2650 to 2700 kg·m−3 for La Palma and from 2650 to 2800 kg·m−3 for El Hierro.
  • To generate a complete set of potential model solutions for the cyclic signals using the model described in Section 2.4: For the case of La Palma, the ranges of values are µ = 4–6.5, V = 1–1.5, γ = 0.15–0.25, and Q = 2–2.5. For the case of El Hierro, the ranges of values are µ = 28–38, V = 0.5–1, γ = 0.0018–0.0033, and Q = 1–2. Subsequently, a step value is established for each range of values. The finer the step value is, the greater the accuracy of the solution will be, albeit at the cost of exponentially increasing the computational time. Thus, we obtained up to 160,000 different solutions of the physical model by using 20 different values for each range of the four variables.
  • To identify the solution that best replicates the period of the oscillations, regardless of the amplitude values, by comparing the obtained solution with the observed cyclic signal for each possible combination of the four parameters: To assess the tilt variation period against that of the velocity (and pressure) pulses, we devised a cost function to calculate the normalized cross-correlation value between the observed and modelled cyclic signals. Then, we selected the combination of the four dimensionless parameters exhibiting the highest cross-correlation value as the optimal solution that characterizes the cyclic behavior of the system.
  • Several graphs displaying the results of the cost function help identify the best solution. As it is not feasible to display the values of the normalized cross-correlation for all four variables simultaneously, two different graphs show the results for each eruption. The first graph displays the results of the cost function for the range of possible values of µ and γ corresponding to the best pair of values V and Q. The second one displays the results of the cost function for the range of possible values of V and Q corresponding to the best pair of values µ and γ.
Figure 10 shows the returned values of the cost function for both La Palma (A and B) and El Hierro (C and D). The maximum value of the normalized cross-correlation enables the determination of the best-fit solution for each case. The four dimensionless variables of the model that best fit the observed cyclic tilt signal are µ = 5.4, V = 1.22, γ = 0.18, and Q = 2.13 for La Palma and µ = 29.3, V = 0.84, γ = 0.002, and Q = 1.1 for El Hierro. Then, in the study, we solved the system of differential equations (Equations (6) and (7)) and obtained the temporal pressure and velocity variations caused by the physical model.
For the case of La Palma eruptions, the model predicts up to 11 pressure variations that induce oscillatory behavior, with amplitudes that progressively decrease over time (Supplementary Figure S2.1). This is primarily attributed to the estimated similar volumes of both the upper and lower magma storage zones, with the upper zone slightly larger (V = 1.22). When the volume of the lower magma storage zone surpasses that of the upper one (V < 1), the oscillations do not decrease with time but remain constant.
We assessed the accuracy of the predicted model by comparing the velocity pulses with the actual records of the tiltmeter signal, represented by the reconstructed time series using RCs two to five. Therefore, it was necessary to convert the dimensionless time into actual time. This conversion was achieved by calculating the values of the previously defined time scale (Equation (9)).
Figure 11A compares the cyclic tilt signal obtained from M-SSA analysis with the results of the physical model, converted to actual time using the time scale-value in the case of La Palma. There was a substantial correspondence between most of the model-predicted oscillations and the actual oscillations (highlighted by blue rectangles). We carried out a quantitative estimation of the alignment of the pulses and the correlation between the modelled and recorded cyclic signal using the computation of the waveform product and the coherence function [52]. Details about the methodology and the results obtained have been included in Supplementary Information S2. From the ratios of the positive and negative areas of the waveform product, we determined a mathematically significative alignment of the pulses (ratios R1 and R2 between the positive and negative areas of the waveform product were 2.477 and 0.404, respectively). Furthermore, the results obtained through the coherence function, which is analogous to the normalized cross-correlation function, showed a positive correlation for a period of 21 min. However, the sixth positive pulse did not correlate well because the actual signal recorded a double-peak pulse between 06:30 and 07:00 UTC whereas the predicted signal showed two distinct pulses (6th and 7th). Apparently, the physical model under-represented a local effect with two overlapping pulses (6th and 7th). This limitation can be attributed to the simplicity of the model, which assumes constant pulse variations in pressure and velocity throughout the entire considered time span, using consistent values for the viscosity ratio and other variables. After 07:00 UTC, there was a good correspondence between the occurrence of peaks in the next four observed and modelled pulses (8th to 11th), along with a decrease in signal amplitude. The last two pulses (at 9:00 and 9:30 UTC) did not correlate with equivalent velocity pulses in the modelled signal as their amplitudes decreased almost to zero. In summary, the simple physical model generally supports the idea that the transient cyclic signal observed in the tiltmeter record can be attributed to a fivefold increase in viscosity during the eruption.
For the case of El Hierro, we used the cyclic signal extracted from the tiltmeter time series at site BA (Figure 9B) to model the pressure variations associated with the viscosity changes during the 2011 eruption in El Hierro. Compared to the La Palma eruption, the amount of geological information available to constrain the dimensionless variables that governed the physical model (see Table 1) was lower due to the submarine nature of the eruption. Consequently, the volume of the bottom chamber and the radius of the feeder dyke connecting the two chambers were not well constrained. Nonetheless, information regarding the depth of the two magma storage zones, the density and viscosity of the erupted magma, and the Bulk modulus of the rock and the feeding volumetric flux (Q = 26 m3·s−1) was available. The authors of [19] provided a minimum value of 0.2 km3 for the volume of the upper chamber, and the same authors calculated the anelastic seismic strain associated with the upper and bottom magma reservoirs, resulting in a ratio of ~1.25. This calculation led us to assume that the volume of the bottom chamber must be larger than that of the upper one. The same relationship was used here to estimate the volume of the bottom chamber (~0.25 km3) and, consequently, a likely range of values of V = 0.5–1.
With the available data, the values that best fit the solution for the four dimensionless variables were µ = 29.3, V = 0.84, γ = 0.002, and Q = 1.1. By solving the system of differential equations (Equations (6) and (7)) with the obtained values, the physical model predicted temporal pressure and velocity variations as shown in Supplementary Figure S2.2. The quantitative comparison of the alignment of the pulses and the correlation between both signals, as described previously (and in Supplementary Information S2), revealed, again, a significative alignment of the pulses and a positive correlation for a period of 5.3 h (R1 = 4.11, R2 = 0.24).
The model predicted up to 16 pulses of pressure variation with similar amplitude (Supplementary Figure S2.2). By using the time scale (Equation (9)), the predicted velocity and pressure pulses could be compared with the observed tilt cycles (Figure 11B).
The physical model predicted pulses at intervals of approximately 5.3 h, slightly longer than the average peak-to-peak period of approximately 5 h from the reconstructed signal. Of the fifteen positive pulses recorded by the tiltmeter, eleven showed a positive correlation with the predicted pulses (highlighted by blue rectangles) while four did not (highlighted by red rectangles). The observed pulses sometimes resembled double-peak pulses (e.g., 10th and 12th pulses) instead of single pulses. Additionally, an anomalous 3 h period was observed for pulse 11, likely caused by a discrete change in the viscosity ratio. This change resulted in the 11th pulse (and consequently, the 12th and 13th pulses) being out of phase. Local effects, such as ground deformation and seismic activity, have the potential to cause variations in the physical model’s parameters, resulting in irregularities in the periods between successive pulses.
The main discrepancy occurred from 0:00 to 12:00 UTC on 10 November, where no pulses were observed while the model predicted two. Given that oscillatory pulses occur only when viscosity and the flow rate remain within a specific range of values (Equation (10)), it is reasonable to assume that during the 12 h period in the first half of 10 November, a variation in either viscosity or flow rate inhibited the occurrence of pressure pulses. Since the ~5 h average peak-to-peak period observed for the pulses—primarily controlled by the viscosity ratio [17]—remained consistent across the two periods analyzed, it is likely that the 12 h gap without pulses was not caused by a decrease in viscosity but rather by a variation in the magma flow rate, suggesting two distinct periods of oscillatory behavior (Figure 11B). Despite the simplicity of the physical model compared to the real system, this model enabled a 29-fold increase in viscosity, reproducing the cyclic signal observed in the tiltmeter records.

5. Cyclic Signals and Subsurface Mass Variation

For the case of the 2021 La Palma eruption, Figure 12A shows the location of site SA (where tiltmeter and GNSS data are collected), the epicenters of the earthquakes recorded between 20 and 21 September 2021 [53], and the positions of three sills situated at different depths (ranging from 7 to 1 km) corresponding to the magmatic plumbing system as per [25]. The tiltmeter data recorded during the 2021 eruption exhibit an increase in both N and W components (Figure 1B), suggesting that the source of the signal must be situated towards the northwest, pointing to the sills located northwards.
The sill situated beneath the eruptive center was too distant (more than 14 km) to produce a detectable signal at the tiltmeter. The cyclic signal most likely arose from the shallow sill 5 km northwest of the SA site at a depth of 1 km. Although volcanic and tectonic activity during the analyzed period was primarily concentrated in the northernmost shallow sill beneath the eruptive center (Figure 12), the southern shallow sill, located 1 km deep, became active in the days leading up to the eruption as reported by [25]. Based on gravity and petrological data [25,54], we propose that this sill was still active on 20–21 September 2021, experiencing an aseismic magma influx from the 6 km deep reservoir connected through a 5 km long conduit (as indicated in Table 1) and causing the tiltmeter signal recorded at the SA site.
In addition, Figure 12B displays the three components (north, east, and up) obtained from the precise point positioning (PPP) processing of the recorded GNSS data [55] at site SA (data from station LP01 have been provided by the National Geographic Institute, IGN, of the Spanish Ministry of Transport and Sustainable Mobility). The GNSS data clearly exhibit a ground displacement towards the south and east during the week preceding the eruption (11–19 September). However, the vertical component does not display a distinct trend, showing several highs and lows ranging from 10 to +40 mm, throughout August and September. Nevertheless, for the period from 20 to 22 September, the GNSS signal remains stable for both the north and east components. For instance, on 21 September, the north and east components increase by 3 mm, which is a small net displacement towards the NE, and the vertical component decreases about 10 mm. These observations suggest minimal ground deformation associated with the cyclic variations recorded in the tiltmeter on 21 September dealing with the mass variations caused by the modelled physical process. Specifically, the transient oscillatory mass variations detected by the tiltmeter are attributed to a fivefold increase in magma viscosity during the influx into the shallow sill situated beneath the eruptive center. This increase in viscosity along the conduit reduces the hydraulic conductivity between the two magma reservoirs, leading to mass accumulation and pressure build-up. Once a certain threshold is reached, the velocity of the magma flow connecting the two reservoirs abruptly increases to mitigate the pressure gradient and transfer mass from the deep to the shallow reservoir, eventually achieving a state of equal pressure equilibrium.
Regarding the 2011 El Hierro eruption, there is some important differences. Firstly, the duration of the cyclic tilts recorded at site BA lasted for nearly three days, which was much longer than for the case of La Palma (it lasted just 4 h). Secondly, it should be noted that at the time of the eruption, the nearest GNSS station available for data capture (HI03, data provided by IGN) was located approximately 2 km east of the tiltmeter site. Figure 13A displays the locations of both stations, as well as the epicenters of the volcanotectonic earthquakes recorded from 7 to 14 November (data source: IGN, https://www.ign.es/web/ign/portal/vlc-serie-hierro, accessed on 1 September 2024), just a few days before and after the occurrence of the oscillatory signal (9 to 12 November). Figure 13B shows the variation in the local north, east, and up coordinates for the station HI03 after PPP processing.
The tiltmeter data at BA collected during the 2011 eruption show an increase in both the north and east components (Figure 1B), indicating a source of the signal located where the seismic activity was occurring at that moment. Although the eruptive center was situated to the south of El Hierro, the hypocenters related to the volcanotectonic activity were limited to the north of the island at depths ranging from 9.5 to 26 km (e.g., see [56]). This suggests a recharge of the magmatic plumbing system from the upper mantle towards a reservoir located at the Moho boundary as proposed by previous studies (e.g., [18,57]). In addition, a strong earthquake (4.6 mbLg) occurred on 11 November at 00:20:16 UTC, confirming the pressurization of the system being recharged from the upper mantle. This recharge of the system implies a mass variation that could have been the cause of the observed tilt towards the NE. When comparing it with the GNSS displacement observed at the station HI03 (Figure 13B), the variations in the three components are small (ranging from −2 mm to +2 mm for both the north and east components, and from −10 mm to 0 mm for the vertical component, for the period from 9 to 13 November 2011). The GNSS displacements exhibited low amplitude and produced a net ground displacement towards the NW.
Considering the results from the physical model derived for El Hierro, the cyclic signal recorded from 9 to 12 November is compatible with the approximately 30 times increase in viscosity that occurred during the ascent of magma from a deep reservoir located at about a 21 km depth into the upper mantle and then towards a shallower reservoir located at the Moho boundary (about 14 km depth) through a vertical conduit of approximately 7 km in length (Table 1). This finding is in good agreement with previous studies on the geometry of the magma plumbing system [18,29]. Based on the earthquake locations, the deep and shallow reservoirs were located 5 km NE of the location of the geodetic stations, and the mass variations associated with the pressure pulses derived from the mass transfer from the reservoirs would be responsible for the cyclic behavior observed during the three-day period under consideration.

6. Geological Interpretation of the Cyclic Tilts

Our analysis revealed that both eruptive processes exhibited a nonperiodic signal component (PC1) that contained most of the signal’s variance. The geometry of PC1 resembles the inflation pattern caused by magma influx from a deeper source, driven by a pressure gradient between a storage reservoir and the underlying medium. Another common feature in the eruptive processes of La Palma and El Hierro was the occurrence of oscillations in the initial eruptive episode, involving differentiated magma transitions to more primitive magmas from the upper mantle. The differentiated magmas erupted at lower temperatures and higher viscosities compared to the more primitive magmas (see Supplementary Information S3).
The following geological model elucidates the dynamics of the La Palma and El Hierro eruptions, thereby explaining the observed cyclic signal recorded in the tiltmeters. Prior to the eruption, magma accumulates and differentiates, leading to increased viscosity and decreased temperature over a long period. When the eruption begins, fresher and more primitive melts replace the evolved magmas from deeper within the plumbing system. This influx of hotter magma cools as it ascends the conduit, increasing crystal concentration and viscosity due to heat loss. A decrease in temperature triggers a transition from fluid magma to crystal-rich behavior. Experimental studies suggest that a 50 °C decrease in temperature can trigger the transition from fluid magma to crystal-rich magma behavior [18,58]. When magma viscosity reaches a critical threshold, the hydraulic connection between magma chambers weakens, causing a pressure gradient and increased mass within the conduit. This results in a sudden acceleration of magma flow, reducing the pressure gradient until equilibrium is reached. This cyclic process repeats within a specific range of viscosities and magma flow rates. As newly injected magma reheats the conduit, the crystal concentration decreases, reducing the viscosity and strengthening the hydraulic connection between magma chambers. This gradual reduction in pressure pulses eventually ceases its oscillatory behavior. The duration of this process, ranging from a few hours in the La Palma eruption to several days in the El Hierro eruption, varies depending on the size and rheological properties of the magma plumbing system. We simulated temporal variations in magma and conduit wall rock temperature, along with corresponding magma viscosity changes (see Supplementary Information S4), to quantitatively validate the proposed model against the observed cyclic tilt signals. The model (Figure S4.1) predicts a sudden decrease in magma body temperature upon interaction with the colder conduit wall, leading to a rapid increase in magma viscosity. As magma ascends through the conduit at a constant temperature, the conduit wall reheats, reaching the initial magma temperature. Considering the exponential temperature dependence of silicate magmas (e.g., [59]), magma viscosity increased by 4.8 to 6.5 times for La Palma and 23 to 45 times for El Hierro (Figure S4.2), which was consistent with µ values of 5.4 and 29.3, respectively. Moreover, the period during which the viscosity of the magma remained above the critical value of µ > 2 ranged from 3.4 to 4.4 h for La Palma and 2.4 to 2.8 days for El Hierro. These durations agreed well with the observed cyclic behavior recorded in La Palma (3.7 h) and El Hierro (2.9 days).
It is important to note that variations in volatiles have also been proposed as a mechanism for causing magma viscosity variations. However, while in acidic magmas the exsolution of CO2 and water occurs at greater depths, typically between 1 and 4 km, in basaltic magmas, exsolution and bubble formation occur at much shallower depths, usually within the uppermost few hundred meters (e.g., [60] and references therein).
In the case of the basaltic eruptions at both La Palma and El Hierro, the origin of the cyclic tilt signals has been attributed to interconnected sills located at depths greater than 6 km (La Palma) and 14 km (El Hierro). Therefore, it is unlikely that volatile exsolution at these depths could have been responsible for the viscosity variations leading to the observed cyclic signals.
Experimental studies (e.g., [61]) and references therein) indicate that the time required for solid phases to nucleate in a magmatic system, increasing crystal content and viscosity, can range from minutes to days. These findings align closely with the time scales of viscosity variations estimated in this study. We conclude that both experimental data and observed viscosity variations (Supplementary Information S3) support the modeled time scales of viscosity changes, which range from hours to days.
The proposed model allows the detection of increases in magma viscosity, which can be identified as cyclic tilt signals during active eruptions. With a suitable network of accurate tiltmeters and knowledge of the magma plumbing system’s characteristics, it is feasible to achieve the near-real-time detection of viscosity variations. Increased viscosity is associated with more explosive eruptions, posing a greater risk, especially for volcanoes near populated areas. Monitoring and modeling these cyclic tilt signals are valuable tools for detecting viscosity variations that could increase the potential hazards of erupting volcanoes in populated regions.

7. Conclusions

The objective of this study was to analyze tiltmeter time series from the La Palma (2021) and El Hierro (2011) eruptions in the Canary Islands. The analysis revealed short-period, low-amplitude cyclic signals related to magma flux variations. Using Multichannel Singular Spectrum Analysis (M-SSA) and Monte Carlo M-SSA, we identified distinct signals, namely a long-period component (PC1) and a cyclic signal with an approximate 20 min period for La Palma (PCs 2 to 5) and a 5 h period for El Hierro (PCs 2, 4, and 6).
After isolating and reconstructing the cyclic signals in the cases of La Palma and El Hierro, respectively, we applied a physical model of two interconnected magma chambers, simulating magma flow from a deeper to a shallower chamber with viscosity increases due to heat loss. Each model accurately reproduced the recorded cyclic tilts, suggesting that viscosity changes during the eruptions ranged from a fivefold increase at La Palma to a thirtyfold increase at El Hierro. However, some discrepancies, likely due to small-scale viscosity variations, highlight the limitations of the model in each case.
Our results demonstrate the complex dynamics of the magmatic feeding system during two distinct eruptive processes: La Palma (2021) and El Hierro (2011). Our analysis showed that the tiltmeter cyclic signals were consistent with the proposed geological model, wherein magma ascends from deeper reservoirs within the plumbing system and undergoes cyclic viscosity changes. This process repeats within a specific range of viscosities and magma flow rates, ending when new, hotter magma is injected into the conduits, reducing the viscosity and halting the cyclic behavior. Continuous ground tilt measurements prove to constitute an effective and valuable technique for modeling changes in magmatic processes at depth, offering critical insights into the dynamics of volcanic plumbing systems.
The findings of this study were potentially limited by the fact that they were based on the analysis of a single tiltmeter for each eruptive event at La Palma and El Hierro. This limitation arose from the small number of tiltmeters deployed during these eruptions and their distance from the source, resulting in changes in magma viscosity being recorded by only one instrument per event. Additionally, no anomalous effects were identified in the available GNSS measurements that could have provided further constraints for the physical model used.
This work demonstrates the value of integrating tiltmeter data analysis with physical modeling to understand magma dynamics during eruptions. The proposed methodology for modeling magma viscosity changes through tiltmeter records offers potential to facilitate real-time (or quasi real-time) monitoring and improved volcanic hazard management.

Supplementary Materials

The following supporting information can be downloaded at: https://www.mdpi.com/article/10.3390/rs17020317/s1. Figure S1. Map of the study area, showing the locations of recent eruptions and the profiles of the magma plumbing system models for both the La Palma and El Hierro eruptions; Figure S2. Time variations in velocity and pressure associated with the oscillatory behavior of the model for both the La Palma (Figure S2.1) and El Hierro (Figure S2.2) eruptions; Figure S3. Results of the waveform product calculation and coherence function for observed (s1) and modeled (s2) cyclic signals from both the La Palma and El Hierro eruptions; Figure S4. Temporal evolution of magma and wall rock conduit temperatures, as well as magma viscosity, for both the La Palma and El Hierro eruptions [62,63,64,65,66,67,68,69].

Author Contributions

Conceptualization, D.G.-O. and J.A.; methodology, D.G.-O. and J.A.; software, D.G.-O.; validation, D.G.-O. and J.A.; formal analysis, D.G.-O., J.A. and M.B.; investigation, D.G.-O. and J.A.; data curation, J.A.; writing—original draft, D.G.-O., J.A., S.M.-V., T.M.-C., F.G.M., E.V. and M.B.; visualization, D.G.-O., J.A., S.M.-V. and M.B.; supervision, J.A. and F.G.M.; project administration, J.A. and F.G.M.; funding acquisition, J.A. and F.G.M. All authors have read and agreed to the published version of the manuscript.

Funding

This research was supported by the project PID2019-104726GB-I00, funded by the Spanish Research Agency; the Complutense University of Madrid (grants Financiación Grupos 2021 and UCM 2022-GRFN14/22); and the Spanish Ministry of Science and Innovation (RD 1078/2021, funding for research activities of the CSIC-PIE project CSIC-LAPALMA-07).

Data Availability Statement

The authors declare that most of the data supporting the findings of this study are available within the paper and its Supplementary Information files. Tiltmeter data used in this study are provided as supplementary data for peer-review purposes via the following link: https://zenodo.org/records/11289075 (accessed on 1 September 2024). Upon acceptance, this dataset will be available from the Zenodo repository.

Acknowledgments

The financial support mentioned in the Funding part is gratefully acknowledged. The authors wish to thank Damian Walver for his help with the computation and meaning of the parameters of the physical model. We sincerely thank the editor and the three anonymous reviewers for their valuable suggestions and comments, which have significantly improved the manuscript.

Conflicts of Interest

The authors declare no conflicts of interest.

References

  1. Sparks, R.S.J.; Biggs, J.; Neuberg, J.W. Monitoring Volcanoes. Science 2012, 335, 1310–1311. [Google Scholar] [CrossRef] [PubMed]
  2. Gambino, S.; Falzone, G.; Ferro, A.; Laudani, G. Volcanic processes detected by tiltmeters: A review of experience on Sicilian volcanoes. J. Volcanol. Geotherm. Res. 2014, 271, 43–54. [Google Scholar] [CrossRef]
  3. Aloisi, M.; Bonaccorso, A.; Gambino, S.; Mattia, M.; Puglisi, G. Etna 2002 eruption imaged from continuous tilt and GPS data. Geophys. Res. Lett. 2003, 30. [Google Scholar] [CrossRef]
  4. Bruno, V.; Aloisi, M.; Gambino, S.; Mattia, M.; Ferlito, C.; Rossi, M. The Most Intense Deflation of the Last Two Decades at Mt. Etna: The 2019–2021 Evolution of Ground Deformation and Modeled Pressure Sources. Geophys. Res. Lett. 2022, 49, e2021GL095195. [Google Scholar] [CrossRef]
  5. Peltier, A.; Famin, V.; Bachèlery, P.; Cayol, V.; Fukushima, Y.; Staudacher, T. Cyclic magma storages and transfers at Piton de La Fournaise volcano (La Réunion hotspot) inferred from deformation and geochemical data. Earth Planet. Sci. Lett. 2008, 270, 180–188. [Google Scholar] [CrossRef]
  6. Walwer, D.; Ghil, M.; Calais, E. Oscillatory nature of the Okmok volcano’s deformation. Earth Planet. Sci. Lett. 2019, 506, 76–86. [Google Scholar] [CrossRef]
  7. Xue, X.; Freymueller, J.; Lu, Z. Modeling the Posteruptive Deformation at Okmok Based on the GPS and InSAR Time Series: Changes in the Shallow Magma Storage System. J. Geophys. Res. Solid Earth 2020, 125, e2019JB017801. [Google Scholar] [CrossRef]
  8. Voight, B.; Hoblitt, R.P.; Clarke, A.B.; Lockhart, A.B.; Miller, A.D.; Lynch, L.; McMahon, J. Remarkable cyclic ground deformation monitored in real-time on Montserrat, and its use in eruption forecasting. Geophys. Res. Lett. 1998, 25, 3405–3408. [Google Scholar] [CrossRef]
  9. de’ Michieli Vitturi, M.; Clarke, A.B.; Neri, A.; Voight, B. Extrusion cycles during dome-building eruptions. Earth Planet. Sci. Lett. 2013, 371–372, 37–48. [Google Scholar] [CrossRef]
  10. Anderson, K.; Lisowski, M.; Segall, P. Cyclic ground tilt associated with the 2004–2008 eruption of Mount St. Helens. J. Geophys. Res. 2010, 115. [Google Scholar] [CrossRef]
  11. Takeo, M.; Maehara, Y.; Ichihara, M.; Ohminato, T.; Kamata, R.; Oikawa, J. Ground deformation cycles in a magma-effusive stage, and sub-Plinian and Vulcanian eruptions at Kirishima volcanoes, Japan. J. Geophys. Res. Solid Earth 2013, 118, 4758–4773. [Google Scholar] [CrossRef]
  12. Fujita, E.; Ukawa, M.; Yamamoto, E. Subsurface cyclic magma sill expansions in the 2000 Miyakejima volcano eruption: Possibility of two-phase flow oscillation. J. Geophys. Res. 2004, 109. [Google Scholar] [CrossRef]
  13. Nakanishi, M.; Koyaguchi, T. A stability analysis of a conduit flow model for lava dome eruptions. J. Volcanol. Geotherm. Res. 2008, 178, 46–57. [Google Scholar] [CrossRef]
  14. Kanno, Y.; Ichihara, M. Sawtooth wave-like pressure changes in a syrup eruption experiment: Implications for periodic and nonperiodic volcanic oscillations. Bull. Volcanol. 2018, 80, 65. [Google Scholar] [CrossRef]
  15. Whitehead, J.A.; Helfrich, K.R. Instability of flow with temperature-dependent viscosity: A model of magma dynamics. J. Geophys. Res. 1991, 96, 4145–4155. [Google Scholar] [CrossRef]
  16. Barmin, A.; Melnik, O.; Sparks, R.S.J. Periodic behavior in lava dome eruptions. Earth Planet. Sci. Lett. 2002, 199, 173–184. [Google Scholar] [CrossRef]
  17. Walwer, D.; Ghil, M.; Calais, E. A Data-Based Minimal Model of Episodic Inflation Events at Volcanoes. Front. Earth Sci. 2022, 10, 759475. [Google Scholar] [CrossRef]
  18. Martí, J.; Castro, A.; Rodriguez, C.; Costa, F.; Carrasquilla, S.; Pedreira, R.; Bolos, X. Correlation of Magma Evolution and Geophysical Monitoring during the 2011–2012 El Hierro (Canary Islands) Submarine Eruption. J. Petrol. 2013, 54, 1349–1373. [Google Scholar] [CrossRef]
  19. Martí, J.; Pinel, V.; López, C.; Geyer, A.; Abella, R.; Tárraga, M.; Blanco, M.J.; Castro, A.; Rodríguez, C. Causes and mechanisms of the 2011–2012 El Hierro (Canary Islands) submarine eruption. J. Geophys. Res. Solid Earth 2013, 118, 823–839. [Google Scholar] [CrossRef]
  20. Castro, J.M.; Feisel, Y. Eruption of ultralow-viscosity basanite magma at Cumbre Vieja, La Palma, Canary Islands. Nat. Commun. 2022, 13, 3174. [Google Scholar] [CrossRef] [PubMed]
  21. Romero, J.E.; Burton, M.; Cáceres, F.; Taddeucci, J.; Civico, R.; Ricci, T.; Pankhurst, M.J.; Hernández, P.A.; Bonadonna, C.; Llewellin, E.W.; et al. The initial phase of the 2021 Cumbre Vieja ridge eruption (Canary Islands): Products and dynamics controlling edifice growth and collapse. J. Volcanol. Geotherm. Res. 2022, 431, 107642. [Google Scholar] [CrossRef]
  22. Mapa de Evolución de la Lava Entre el 24-11-2021 y el 14-12-2021. Available online: http://info.igme.es/eventos/Erupcion-volcanica-la-palma/visores-mapas (accessed on 29 May 2024).
  23. Civico, R.; Ricci, T.; Scarlato, P.; Taddeucci, J.; Andronico, D.; Del Bello, E.; D’Auria, L.; Hernández, P.A.; Pérez, N.M. High-resolution Digital Surface Model of the 2021 eruption deposit of Cumbre Vieja volcano, La Palma, Spain. Sci. Data 2022, 9, 435. [Google Scholar] [CrossRef]
  24. De Luca, C.; Valerio, E.; Giudicepietro, F.; Macedonio, G.; Casu, F.; Lanari, R. Pre- and Co-Eruptive Analysis of the September 2021 Eruption at Cumbre Vieja Volcano (La Palma, Canary Islands) Through DInSAR Measurements and Analytical Modeling. Geophys. Res. Lett. 2022, 49, e2021GL097293. [Google Scholar] [CrossRef]
  25. Montesinos, F.G.; Sainz-Maza, S.; Gomez-Ortiz, D.; Arnoso, J.; Blanco-Montenegro, I.; Benavent, M.; Vélez, E.; Sánchez, N.; Martín-Crespo, T. Insights into the Magmatic Feeding System of the 2021 Eruption at Cumbre Vieja (La Palma, Canary Islands) Inferred from Gravity Data Modeling. Remote Sens. 2023, 15, 1936. [Google Scholar] [CrossRef]
  26. Ubide, T.; Márquez, A.; Ancochea, E.; Huertas, M.J.; Herrera, R.; Coello-Bravo, J.; Sanz-Mangas, D.; Mulder, J.; MacDonald, A.; Galindo, I. Discrete magma injections drive the 2021 La Palma eruption. Sci. Adv. 2023, 9, eadg4813. [Google Scholar] [CrossRef] [PubMed]
  27. Bonadonna, C.; Pistolesi, M.; Biass, S.; Voloschina, M.; Romero, J.; Coppola, D.; Folch, A.; D’Auria, L.; Martin-Lorenzo, A.; Dominguez, L.; et al. Physical Characterization of Long-Lasting Hybrid. Eruptions: The 2021 Tajogaite Eruption of Cumbre Vieja (La Palma, Canary Islands). J. Geophys. Res. Solid Earth 2022, 127, e2022JB025302. [Google Scholar] [CrossRef]
  28. Plank, S.; Shevchenko, A.V.; d’Angelo, P.; Gstaiger, V.; González, P.J.; Cesca, S.; Martinis, S.; Walter, T.R. Combining thermal, tri-stereo optical and bi-static InSAR satellite imagery for lava volume estimates: The 2021 Cumbre Vieja eruption, La Palma. Sci. Rep. 2023, 13, 2057. [Google Scholar] [CrossRef]
  29. López, C.; Blanco, M.J.; Abella, R.; Brenes, B.; Cabrera Rodríguez, V.M.; Casas, B.; Domínguez Cerdeña, I.; Felpeto, A.; de Villalta, M.F.; del Fresno, C.; et al. Monitoring the volcanic unrest of El Hierro (Canary Islands) before the onset of the 2011–2012 submarine eruption. Geophys. Res. Lett. 2012, 39. [Google Scholar] [CrossRef]
  30. Rivera, J.; Lastras, G.; Canals, M.; Acosta, J.; Arrese, B.; Hermida, N.; Micallef, A.; Tello, O.; Amblas, D. Construction of an oceanic island: Insights from the El Hierro (Canary Islands) 2011–2012 submarine volcanic eruption. Geology 2013, 41, 355–358. [Google Scholar] [CrossRef]
  31. Becerril, L.; Galindo, I.; Gudmundsson, A.; Morales, J.M. Depth of origin of magma in eruptions. Sci. Rep. 2013, 3, 2762. [Google Scholar] [CrossRef] [PubMed]
  32. Cashman, K.V.; Blundy, J. Degassing and crystallization of ascending andesite and dacite. Philos. Trans. R. Soc. Lond. Ser. A Math. Phys. Eng. Sci. 2000, 358, 1487–1513. [Google Scholar] [CrossRef]
  33. Biggs, J.; Pritchard, M.E. Global Volcano Monitoring: What Does It Mean When Volcanoes Deform? Elements 2017, 13, 17–22. [Google Scholar] [CrossRef]
  34. Ghil, M.; Allen, M.R.; Dettinger, M.D.; Ide, K.; Kondrashov, D.; Mann, M.E.; Robertson, A.W.; Saunders, A.; Tian, Y.; Varadi, F.; et al. Advanced spectral methods for climatic time series. Rev. Geophys. 2002, 40, 3–41. [Google Scholar] [CrossRef]
  35. Groth, A.; Ghil, M. Monte Carlo Singular Spectrum Analysis (SSA) Revisited: Detecting Oscillator Clusters in Multivariate Datasets. J. Clim. 2015, 28, 7873–7893. [Google Scholar] [CrossRef]
  36. Alessio, S.M. Singular Spectrum Analysis (SSA). In Digital Signal Processing and Spectral Analysis for Scientists: Concepts and Applications; Alessio, S.M., Ed.; Springer International Publishing: Cham, Switzerland, 2016; pp. 537–571. [Google Scholar]
  37. Vautard, R.; Ghil, M. Singular spectrum analysis in nonlinear dynamics, with applications to paleoclimatic time series. Phys. D 1989, 35, 395–424. [Google Scholar] [CrossRef]
  38. Vautard, R.; Yiou, P.; Ghil, M. Singular-spectrum analysis: A toolkit for short, noisy chaotic signals. Phys. D 1992, 58, 95–126. [Google Scholar] [CrossRef]
  39. Ghil, M.; Vautard, R. Interdecadal oscillations and the warming trend in global temperature time series. Nature 1991, 350, 324–327. [Google Scholar] [CrossRef]
  40. Chen, Q.; van Dam, T.; Sneeuw, N.; Collilieux, X.; Weigelt, M.; Rebischung, P. Singular spectrum analysis for modeling seasonal signals from GPS time series. J. Geodyn. 2013, 72, 25–35. [Google Scholar] [CrossRef]
  41. Wang, X.; Cheng, Y.; Wu, S.; Zhang, K. An enhanced singular spectrum analysis method for constructing nonsecular model of GPS site movement. J. Geophys. Res. Solid Earth 2016, 121, 2193–2211. [Google Scholar] [CrossRef]
  42. Walwer, D.; Calais, E.; Ghil, M. Data-adaptive detection of transient deformation in geodetic networks. J. Geophys. Res. Solid Earth 2016, 121, 2129–2152. [Google Scholar] [CrossRef]
  43. Dettinger, M.D.; Ghil, M.; Strong, C.M.; Weibel, W.; Yiou, P. Software expedites singular-spectrum analysis of noisy time series. Eos Trans. Am. Geophys. Union 1995, 76, 12–21. [Google Scholar] [CrossRef]
  44. Allen, M.R.; Smith, L.A. Investigating the origins and significance of low-frequency modes of climate variability. Geophys. Res. Lett. 1994, 21, 883–886. [Google Scholar] [CrossRef]
  45. Theiler, J.; Eubank, S.; Longtin, A.; Galdrikian, B.; Doyne Farmer, J. Testing for nonlinearity in time series: The method of surrogate data. Phys. D 1992, 58, 77–94. [Google Scholar] [CrossRef]
  46. Ida, Y. Cyclic fluid effusion accompanied by pressure change: Implication for volcanic eruptions and tremor. Geophys. Res. Lett. 1996, 23, 1457–1460. [Google Scholar] [CrossRef]
  47. Wylie, J.; Voight, B.; Whitehead, J. Instability of Magma Flow from Volatile-Dependent Viscosity. Science 1999, 285, 1883–1885. [Google Scholar] [CrossRef]
  48. Maeda, I. Nonlinear visco-elastic volcanic model and its application to the recent eruption of Mt. Unzen. J. Volcanol. Geotherm. Res. 2000, 95, 35–47. [Google Scholar] [CrossRef]
  49. Melnik, O.; Sparks, R.S.J. Controls on conduit magma flow dynamics during lava dome building eruptions. J. Geophys. Res. 2005, 110. [Google Scholar] [CrossRef]
  50. Kozono, T.; Koyaguchi, T. Effects of gas escape and crystallization on the complexity of conduit flow dynamics during lava dome eruptions. J. Geophys. Res. 2012, 117. [Google Scholar] [CrossRef]
  51. Chen, C.; Huang, H.; Hautmann, S.; Sacks, I.S.; Linde, A.T.; Taira, T. Resonance oscillations of the Soufrière Hills Volcano (Montserrat, W.I.) magmatic system induced by forced magma flow from the reservoir into the upper plumbing dike. J. Volcanol. Geotherm. Res. 2018, 350, 7–17. [Google Scholar] [CrossRef]
  52. Galiana-Merino, J.J.; Pla, C.; Fernandez-Cortes, A.; Cuezva, S.; Ortiz, J.; Benavente, D. EnvironmentalWaveletTool: Continuous and discrete wavelet analysis and filtering for environmental time series. Comput. Phys. Commun. 2014, 185, 2758–2770. [Google Scholar] [CrossRef]
  53. del Fresno, C.; Cesca, S.; Klügel, A.; Domínguez Cerdeña, I.; Díaz-Suárez, E.A.; Dahm, T.; García-Cañada, L.; Meletlidis, S.; Milkereit, C.; Valenzuela-Malebrán, C.; et al. Magmatic plumbing and dynamic evolution of the 2021 La Palma eruption. Nat. Commun. 2023, 14, 358. [Google Scholar] [CrossRef] [PubMed]
  54. González-García, D.; Boulesteix, T.; Klügel, A.; Holtz, F. Bubble-enhanced basanite–tephrite mixing in the early stages of the Cumbre Vieja 2021 eruption, La Palma, Canary Islands. Sci. Rep. 2023, 13, 14839. [Google Scholar] [CrossRef] [PubMed]
  55. Zumberge, J.F.; Heflin, M.B.; Jefferson, D.C.; Watkins, M.M.; Webb, F.H. Precise point positioning for the efficient and robust analysis of GPS data from large networks. J. Geophys. Res. 1997, 102, 5005–5017. [Google Scholar] [CrossRef]
  56. Domínguez Cerdeña, I.; García-Cañada, L.; Benito-Saz, M.A.; del Fresno, C.; Lamolda, H.; Pereda de Pablo, J.; Sánchez Sanz, C. On the relation between ground surface deformation and seismicity during the 2012–2014 successive magmatic intrusions at El Hierro Island. Tectonophysics 2018, 744, 422–437. [Google Scholar] [CrossRef]
  57. Carracedo, J.C.; Troll, V.R.; Zaczek, K.; Rodríguez-González, A.; Soler, V.; Deegan, F.M. The 2011–2012 submarine eruption off El Hierro, Canary Islands: New lessons in oceanic island growth and volcanic crisis management. Earth-Sci. Rev. 2015, 150, 168–200. [Google Scholar] [CrossRef]
  58. Giordano, D.; Russell, J.K.; Dingwell, D.B. Viscosity of magmatic liquids: A model. Earth Planet. Sci. Lett. 2008, 271, 123–134. [Google Scholar] [CrossRef]
  59. Pearson, J.R.A. Variable-viscosity flows in channels with high heat generation. J. Fluid Mech. 1977, 83, 191–206. [Google Scholar] [CrossRef]
  60. Gudmundsson, A. Volcanotectonics: Understanding the Structure, Deformation and Dynamics of Volcanoes; Cambridge University Press: Cambridge, UK, 2020. [Google Scholar]
  61. Vetere, F.; Petrelli, M.; Perugini, D.; Haselbach, S.; Morgavi, D.; Pisello, A.; Iezzi, G.; Holtz, F. Rheological evolution of eruptible Basaltic-Andesite Magmas under dynamic conditions: The importance of plagioclase growth rates. J. Volcanol. Geotherm. Res. 2021, 420, 107411. [Google Scholar] [CrossRef]
  62. Arnoso, J.; Riccardi, U.; Tammaro, U.; Benavent, M.; Montesinos, F.G.; Vélez, E. 2D Strain Rate and Ground Deformation Modelling from Continuous and Survey Mode GNSS Data in El Hierro, Canary Islands; Editorial de la Universitat Politècnica de València: Valencia, Spain, 2022. [Google Scholar]
  63. Sainz-Maza Aparicio, S.; Arnoso Sampedro, J.; Gonzalez Montesinos, F.; Martí Molist, J. Volcanic signatures in time gravity variations during the volcanic unrest on El Hierro (Canary Islands). J. Geophys. Res. Solid Earth 2014, 119, 5033–5051. [Google Scholar] [CrossRef]
  64. Cerdeña, I.D.; del Fresno, C.; Moreno, A.G. Seismicity Patterns Prior to the 2011 El Hierro Eruption. Bull. Seismol. Soc. Am. 2013, 104, 567–575. [Google Scholar] [CrossRef]
  65. Carracedo, J.C.; Troll, V.R.; Day, J.M.D.; Geiger, H.; Aulinas, M.; Soler, V.; Deegan, F.M.; Perez-Torrado, F.; Gisbert, G.; Gazel, E.; et al. The 2021 eruption of the Cumbre Vieja volcanic ridge on La Palma, Canary Islands. Geol. Today 2022, 38, 94–107. [Google Scholar] [CrossRef]
  66. Pankhurst, M.J.; Scarrow, J.H.; Barbee, O.A.; Hickey, J.; Coldwell, B.C.; Rollinson, G.K.; Rodríguez-Losada, J.A.; Martín Lorenzo, A.; Rodríguez, F.; Hernández, W.; et al. Rapid response petrology for the opening eruptive phase of the 2021 Cumbre Vieja eruption, La Palma, Canary Islands. Volcanica 2022, 5, 1. [Google Scholar] [CrossRef]
  67. Carrigan, C.R. A heat pipe model for vertical, magma-filled conduits. J. Volcanol. Geotherm. Res. 1983, 16, 279–298. [Google Scholar] [CrossRef]
  68. Bohrson, W.A.; Spera, F.J.; Ghiorso, M.S.; Brown, G.A.; Creamer, J.B.; Mayfield, A. Thermodynamic Model for Energy-Constrained Open-System Evolution of Crustal Magma Bodies Undergoing Simultaneous Recharge, Assimilation and Crystallization: The Magma Chamber Simulator. J. Petrology 2014, 55, 1685–1717. [Google Scholar] [CrossRef]
  69. Costa, A.; Melnik, O.; Vedeneeva, E. Thermal effects during magma ascent in conduits. J. Geophys Res. 2007, 112. [Google Scholar] [CrossRef]
Figure 1. Tiltmeter time series recorded during the La Palma (2021) and El Hierro (2011) eruptions. (A) The map on the left shows the geographical position of the Canary Islands archipelago while the digital elevation models of La Palma and El Hierro (right) illustrate the location of the SA and BA tiltmeter sites (marked in red triangles). (B) Tilt variations recorded in the two orthogonal directions and the air temperature (grey line) at sites SA and BA in La Palma and El Hierro, respectively. Tilt variations at SA for 21 September, 03:00 to 10:00 UTC, which was 2 days after the eruption onset. Tilt variations at BA for 9 November, 00:00 UTC, to 12 November, 15:00 UTC, which was one month after the eruption onset.
Remotesensing 17 00317 g001
Figure 2. Schematic representation of the physical model represented by two magma chambers connected by a vertical conduit fed from below at a constant magma flux Q. Parameters governing the physical model: Pt, pressure at the top chamber; Vt, volume of the top chamber; Pb, pressure at the bottom chamber; Vb, volume of the bottom chamber; L, vertical distance between both chambers; w, horizontally averaged vertical magma velocity; a, radius of the conduit; K, bulk modulus of the country rocks; ρc, density of the country rock; β, crystal concentration per volume; β ¯ , critical crystal concentration per volume reached at a length L ¯ ; µb, magma viscosity at the bottom chamber and µt, magma viscosity at the top chamber (modified from [17]).
Remotesensing 17 00317 g002
Figure 3. Results for the tiltmeter time series at site SA (La Palma). (A) Singular spectrum for 40 eigenvalues using a window length of M = 30. (B) MC-MSSA significance test applied using surrogate data containing noise and showing the first 20 eigenvalues. The upper and lower ticks of the error bars indicate the 95% and 5% quantities, respectively, based on an ensemble of 1000 surrogate datasets.
Remotesensing 17 00317 g003
Figure 4. The first five PCs obtained from the analysis of the tiltmeter signal at site SA (La Palma).
Remotesensing 17 00317 g004
Figure 5. The original tiltmeter signal (upper pane: N component; lower pane: W component) and the one reconstructed using the first five leading principal components (PCs).
Remotesensing 17 00317 g005
Figure 6. Results for the tiltmeter time series at site BA (El Hierro). (A) Singular spectrum for 20 eigenvalues using a window length of M = 100. (B) MC-MSSA significance test applied using surrogate data containing noise and showing the first 20 eigenvalues. The upper and lower ticks of the error bars indicate the 95% and 5% quantiles, respectively, based on an ensemble of 1000 surrogate datasets.
Remotesensing 17 00317 g006
Figure 7. PCs 1, 2, 4, and 6 obtained from the analysis of the tiltmeter signal at site BA (El Hierro).
Remotesensing 17 00317 g007
Figure 8. The original tiltmeter signal (upper pane: N component, lower pane: E component) and the reconstructed one using only PCs 1, 2, 4, and 6 at site BA (El Hierro).
Remotesensing 17 00317 g008
Figure 9. Reconstructed tiltmeter cyclic signals. (A) Reconstructed time series using PCs 2 to 5 corresponding to the analysis of the cyclic signal recorded at site SA (La Palma). (B) Reconstructed time series using RCs two, four and six corresponding to the cyclic signal recorded at site BA (El Hierro).
Remotesensing 17 00317 g009
Figure 10. Returned values of the cost function used to determine the four dimensionless variables of the model that most accurately replicate the observed cyclic tilt signal in La Palma (A,B) and El Hierro (C,D).
Remotesensing 17 00317 g010
Figure 11. (A) Comparison between the actual cyclic pulses recorded at site SA in La Palma (upper pane) and the pulses modelled by the physical model (lower pane). The blue areas represent real velocity pulses that exhibit a positive correlation (R1 = 2.477, R2 = 0.404) with the modelled ones for periods of 21 min while the red areas indicate pulses that the model fails to reproduce accurately. Velocity w’ is dimensionless. (B) Same comparison but for site BA in El Hierro. The blue areas represent the actual velocity pulses, which exhibit a positive correlation (R1 = 4.11, R2 = 0.24) with the modelled ones for periods of 5.3 h, while the red areas indicate pulses that are not adequately reproduced by the model.
Remotesensing 17 00317 g011
Figure 12. (A) Relief map of La Palma displaying the main eruptive center, lava flows (depicted as a dark brown area), the epicenters of the earthquakes recorded during 20 to 21 September 2021, and the locations and depths of the sills (black polygons) and dikes (black lines) that form the upper part of the magma plumbing system (as per [25]). The white square represents the location of the tiltmeter and GNSS at site SA. (B) Variations in the local coordinates (north, east, and up components) at site SA (station LP01 of Spanish IGN) from August to September 2021. The highlighted red area indicates the period of time from 20 to 22 September 2021.
Remotesensing 17 00317 g012
Figure 13. (A) Relief map of El Hierro showing the location of the eruptive center and the epicenters of the earthquakes that occurred from 7 to 14 November 2011. The white square indicates the location of the tiltmeter at site BA and the blue triangle the GNSS station HI03. The red star points out the eruption location. The ellipses correspond to approximate locations of the two magma reservoirs (black for the deep reservoir, red for the shallow one) that constitute the magma plumbing system at the north of the island (see Table 1). (B) Variation of the local coordinates (north, east, and up components) recorded from August to November 2011 at site HI03 (the station HI03 is owned by Spanish IGN). The red area highlights the time period from 9 to 13 November. The yellow line points out the earthquake of magnitude 4.6 mbLg recorded on 11 November at 00:20:16 UTC.
Remotesensing 17 00317 g013aRemotesensing 17 00317 g013b
Disclaimer/Publisher’s Note: The statements, opinions and data contained in all publications are solely those of the individual author(s) and contributor(s) and not of MDPI and/or the editor(s). MDPI and/or the editor(s) disclaim responsibility for any injury to people or property resulting from any ideas, methods, instructions or products referred to in the content.

