Article

Modulation of Typical Three-Dimensional Targets on the Echo Waveform Using Analytical Formula

1
Advanced Laser Technology Laboratory of Anhui Province, National University of Defense Technology, Hefei 230037, China
2
Anhui Province Key Laboratory of Electronic Restriction, National University of Defense Technology, Hefei 230037, China
3
Nanhu Laser Laboratory, National University of Defense Technology, Hefei 230037, China
*
Author to whom correspondence should be addressed.
Remote Sens. 2025, 17(20), 3419; https://doi.org/10.3390/rs17203419
Submission received: 1 August 2025 / Revised: 19 September 2025 / Accepted: 9 October 2025 / Published: 13 October 2025

Abstract

Highlights

What are the main findings?
  • Derive the formula of waveform modulated by three typical three-dimensional targets without constraint of position and attitude.
  • Reveal the modulation of shape, size, position, and attitude of three-dimensional targets on waveform through qualitative and mathematical analysis.
What is the implication of the main finding?
  • The derived analytical expression for the three-dimensional target laser pulse echo waveform simplifies the simulation process and facilitates the inversion of target’s features, such as size and attitude.
  • The investigated typical three-dimensional targets exhibit close resemblance to satellite main bodies, European architectural roofs, and canopies. Investigation into their modulation mechanisms on laser echo waveforms thereby promotes the application of full-waveform LiDAR across multiple remote sensing domains, including mapping, building identification, deep-space exploration, and space debris removal.

Abstract

Despite the wide applications of full-waveform light detection and ranging (FW-LiDAR) on target detection and recognizing, topographical mapping, and ecological management, etc., the mapping between the echo waveform and the properties of the targets, even for typical three-dimensional (3D) targets, has not been established. The mechanics of the modulation of targets on the echo waveform is thus ambiguous, constraining the retrieval of target properties in FW-LiDAR. This paper derived the formula of echo waveform modulated by typical 3D targets, namely, a rectangular prism, a regular hexagonal prism, and a cone. The modulation of shape, size, position, and attitude of 3D targets on the echo waveform has been investigated extensively. The results showed that, for prisms, variations in the echo waveforms under various factors essentially arise from changes in the inclination angles of their reflective surfaces and their positions relative to the laser spot. For cones, their echo waveforms can be approximated and analyzed using isosceles triangular micro-facets. The work in this paper is helpful in probing the modulation of 3D targets on echo waveform, as well as extracting the properties of 3D targets in FW-LiDAR domains, which are significant in areas ranging from topographical mapping to space debris monitoring.

1. Introduction

Full-waveform light detection and ranging (FW-LiDAR) emits a laser pulse to illuminate the target and records the temporal distribution of reflected energy [1,2,3]. The time delay of pulses reflected by two scatters with a distance of 15 cm along the pulse propagation direction holds at 1 ns, independent of detecting distance. As a result, FW-LiDAR probes three-dimensional (3D) structures of targets with a distance of hundreds of kilometers and a resolution of centimeters under only one observation, rather than multi-view observation, which is necessary for optical camera and (inverse or interferometric) synthetic aperture radar for stereo imaging. FW-LiDAR technique has been widely used in various domains ranging from target recognition [4,5,6,7,8], topographical mapping [9,10,11,12,13], cultural heritage and archeology [14,15,16,17], global climate and ecological monitoring [18,19,20,21,22].
In FW-LiDAR detection, it is critical to establish the relationship between the properties of the target and the features of modulated echo waveform. Two computing models, microfacet model and radiative transfer model, have been developed to describe the effect of the target on waveform. The microfacet model divides the target into a series of microfacets, calculates the micro-pulse reflected by every illuminated microfacet using the LiDAR equation, and forms the modulated waveform using the micro-pulses with corresponding time delay. Using the microfacet model, Li et al. [4] simulated the echo waveforms modulated by squares and cones, revealing the effect of reflectivity, rotation angle, and pulse width on the modulated echo waveform. Hao et al. [5] exhibited how the rotation angle and atmospheric turbulence affect the echo waveform modulated by rectangular, conical, non-spherical, and spherical targets. Steinvall et al. [23,24,25] simulated and measured the echo waveforms modulated by the actual targets such as small boats and UAVs, and employed decision trees to complete target discrimination, promoting the development of non-imaging system target recognition.
The microfacet method considers only single scattering behavior and ignores behaviors of multiple scattering, absorption, and refraction, which cannot be neglected for objects such as forests. In this situation, the radiative transfer equation is used to describe the absorption, scattering, and thermal emission. Using radiative transfer theory and three-dimensional modeling, Ma et al. [26] constructed a physical approach to describe the interaction between a laser pulse and trees. The tree canopy is divided into a series of sub-layers, with the thickness compatible with the minimum resolution of FW-LiDAR system. The laser echo modulated by every sub-layer is calculated using radiative transfer model to form the echo waveform reflected by the canopy. Simulating the photon transfer process using Monte Carlo method, Gastellu-Etchegorry et al. [27,28] proposed the Discrete Anisotropic Radiative Transfer (DART) method, which discretizes the target scene into a large number of grids, endows the grid with parameters to mimic land surfaces, atmospheric transmission environments, and target materials, and probes transmission process of photons in the grid. Over the past several decades, numerous approaches and methods have been developed to track the photons in the atmosphere and forest and simulate the laser echo waveform modulated by forest [29,30,31], vegetation [32,33], and grassland [34].
The computing model is accurate in modeling the detection scene and describing the interaction between the laser pulse and target. However, on one hand, the simulation process is complex and labor-expensive. It is thus difficult to establish the comprehensive database of modulated waveform and reveal the modulation of target properties on the feature of waveform in detail. Previous work [4] investigated echo waveforms modulated by a square target, where the target and laser spot centers coincided, and the rotation angle was fixed at 60°. The study presented simulations for seven scenarios: four with a fixed pulse width (300 ps) and varying target lengths (30, 100, 200, 300 mm), and three with a fixed target length (30 mm) and varying pulse widths (100, 50, 30 ps). A symmetric investigation of the modulation of target properties on waveform is lacking, limiting the guidance of simulation on experimental research. For example, it has been observed that, with increasing square length, the waveform changes from Gaussian to Non-Gaussian [4,8]. Specifically, the waveform top becomes flat. Actually, the flat top expands and the waveform returns to Gaussian with further increasing square length, and this change trend (the critical size that flat top appears and vanishes, the flat top width, etc.) depends on shape, size, position, and rotation angle of targets. However, such phenomenon has not been involved for waveform simulation using computing model.
And on the other hand, it is beyond the current computing model to obtain a concise and quantitative relationship between the properties of target and the features of modulated echo waveform. Specifically, in the microfacet method, the echo waveform of a target is obtained by superposing the sub-echoes from individual microfacets. However, given the known echo waveform of the target, it is challenging to decompose it back into the contributions from each micro-facet and subsequently combine these features to reconstruct the target’s geometric characteristics. This is analogous to the addition of real numbers, such as 1 and 2, which yields 3; yet, knowing the result is 3 makes it difficult to determine which specific real numbers constituted the sum. The inversion process for radiative transfer models is even more complex, as reconstructing the laser echo transmission and multiple scattering processes based on the target’s echo waveform remains highly challenging.
Consequently, a variety of data processing methods for FW-LiDAR technique, for example, Gaussian and Non-Gaussian waveform decomposition, deconvolution, waveform metrics, and model inversion, have been developed to extract physical and biochemical properties of the detecting scene. Recently, Zhou et al. [35] demonstrated the robustness of several signal processing techniques. Their research showed that Gaussian, Adaptive Gaussian, and Weibull waveform decomposition methods, alongside the Richardson–Lucy and Gold deconvolution algorithms, perform reliably across diverse terrains. These include flat regions with sparse vegetation, dense rainforests, low flat areas with buildings, and ice sheets. Furthermore, the study classified the applicable topographic conditions for different waveform processing methods.
The mathematical method, which describes the structural and optical properties of target as well as the resulting echo waveform using mathematical formula, bridges properties of target and features of waveform with a concise form. Steinvall [36] proposed that the echo waveform formula is the convolution of temporal distribution of the incident pulse and the impulse function response of target, derived the impulse function response of a cone, a sphere, a paraboloid, and a cylinder, and presented the example of an arbitrary pulse response. Johnson [37] deduced formula of waveform modulated by an extended tilt surface and investigated the effect of tilt angle on waveform. Xu et al. [7] established the formula of waveform modulated by a plane, a cone, and a cylinder, and revealed the influence of surface optical properties, detecting distance, and size of targets on the modulated waveform.
Recently, Hu et al. [8] derived the formula of echo waveform modulated by four typical two-dimensional (2D) planar targets, namely, a rectangle, a square, a circle, and an equivalent triangle. Using the formula, they studied the modulation of shape, size, position, and rotation angle of targets on the waveform in detail. With increasing target size, the Gaussian and Non-Gaussian change in waveform was observed, and the dependence of this change trend on target shape, size, position, and rotation angle was clearly revealed. Furthermore, from the specific dependence of waveform peak intensity on target position, the shape discrimination method for 2D target with vertical illumination was proposed. Subsequently, Hu et al. [38] demonstrated the extraction of lateral structural properties of target by inverting the formula, and systematically investigated the effect of number of unknown lateral structural parameters, noise, movement direction, shape, and size of targets on estimated lateral size. The experimental results show that, when only the size is unknown, the extracted lateral size error for all four non-extended 2D shapes is less than 3.47% or smaller than 0.17 cm.
Previous works proved the advantage of formula in detailly probing the mechanics of target properties on waveform and precisely retrieving target properties. However, the studies by Hu et al. [8,38,39,40] focused solely on two-dimensional shapes, deriving only the echo waveform formulations for 2D scenarios and analyzing their modulation mechanisms, without extending into the domain of 3D targets. Xu’s [7] work only considered two 3D targets, cone and cylinder. In addition, the axis of cone and cylinder coincides with and is perpendicular to, respectively, the propagation direction of laser pulse. While the size of laser spot for space-borne FW-LiDAR is generally tens of meters, it is a great challenge to align the center of a complex 3D target with the laser spot center, and control the target at a specific attitude. As a result, it is unclear how the shape, size, position, and attitude of 3D target affect the modulated echo waveform, which is the topic of this paper. By deriving echo waveform formulations for typical 3D targets free from attitude and position constraints, this study enhances the applicability of target feature inversion, thereby overcoming the stringent requirement of precise alignment between the target center and the laser spot center. The novelty and significance of this paper rely on the following:
(I)
Derive the formula of waveform modulated by three typical 3D targets, namely, a rectangular prism, a regular hexagonal prism, and a cone, without constraint of position and attitude. Such formula has not been reported before.
(II)
Reveal the modulation of shape, size, position, and attitude of 3D targets on waveform; the effect of target size has not been investigated before.
(III)
Build the experimental platform to measure the echo waveform modulated by 3D target and examine the validity of derived formula of the echo waveform.
(IV)
3D shapes chosen in this paper are typical structural model of targets such as main body of satellite, roof of European building, canopy, and space debris.
This paper is organized as follows: Section 2 establishes a coordinate system and performs mathematical modeling of 3D targets, whereby the formulas for their modulated echo waveforms are derived. Section 3 simulates the echo waveforms of 3D targets and conducts experimental validation of the derived formula of the echo waveform. Finally, Section 4 analyzes and discusses the influence of various factors (including shape, size, attitude, and position) on the echo waveform.

2. Formula Derivation

Steinvall [36] proposed that formula of modulated echo waveform l ( t ) is convolution of the spatial distribution of incident pulse p ( t ) and the impulse response of target h ( t )
l t = p ( t ) h ( t )
where denotes the convolution operation, and h ( t ) is function of temporal distribution of incident pulse g ( x , y ) and surface optical and structural properties of targets ρ [15].
l t = ρ ( β ) g ( x , y ) δ t 2 z x , y / c
where β   is incident angle, ρ   denotes optical properties, δ   is Dirac function, and z ( x , y ) is distance between the points in the target and the laser emitter and receiver system.
This study focuses on investigating the mechanisms of waveform modulation. Accordingly, the laser transmission process is simplified, and the effects of atmospheric turbulence and attenuation are neglected. Moreover, typical full-waveform lidar systems, such as the Global Ecosystem Dynamics Investigation (GEDI) radar [41], emit laser pulses with spatiotemporal characteristics that follow a Gaussian distribution. In line with these operational systems and taking into account the equipment available in our laboratory, the laser source is assumed to be an ideal Gaussian beam in this paper.
Generally, the spatial and temporal distributions of incident pulse both follow Gaussian function
p t = exp t 2 τ 2 g x , y = 2 P t π ω 2 exp 2 x 2 + y 2 ω 2
where τ   is pulse width that characterizes the decay of incident energy, P t   is total pulse energy, and ω   represents the laser spot radius at point z ( x , y )
ω = ω 0 1 + λ z π ω 0 2 2
where λ   and ω 0   are the waist radius and wavelength, respectively,
ω 0 = 2 λ π φ
where φ   is divergence angle. Finally, the formula of modulated waveform is [8].
l t = 2 P t π ω 2 ρ ( β ) e x p 2 x 2 + y 2 ω 2 e x p t 2 z x , y / c 2 τ 2 d x d y
Equation (6) shows that the formula of modulated waveform is determined by the distribution of the distance between laser emitter and receiver system and targets, z ( x , y ) , that is, the structure of target. To accurately describe target structure, a Cartesian coordinate should be established. In brief, as shown in Figure 1, the pulse propagates along   z -axis from positive to negative, x O y   plane is determined by   z -axis and target center, and the origin O   is the crossover between   z -axis and x O y   plane. For rectangular prism and regular hexagonal prism,   x -axis is parallel to one side, and   y -axis is determined by right-hand ruler.
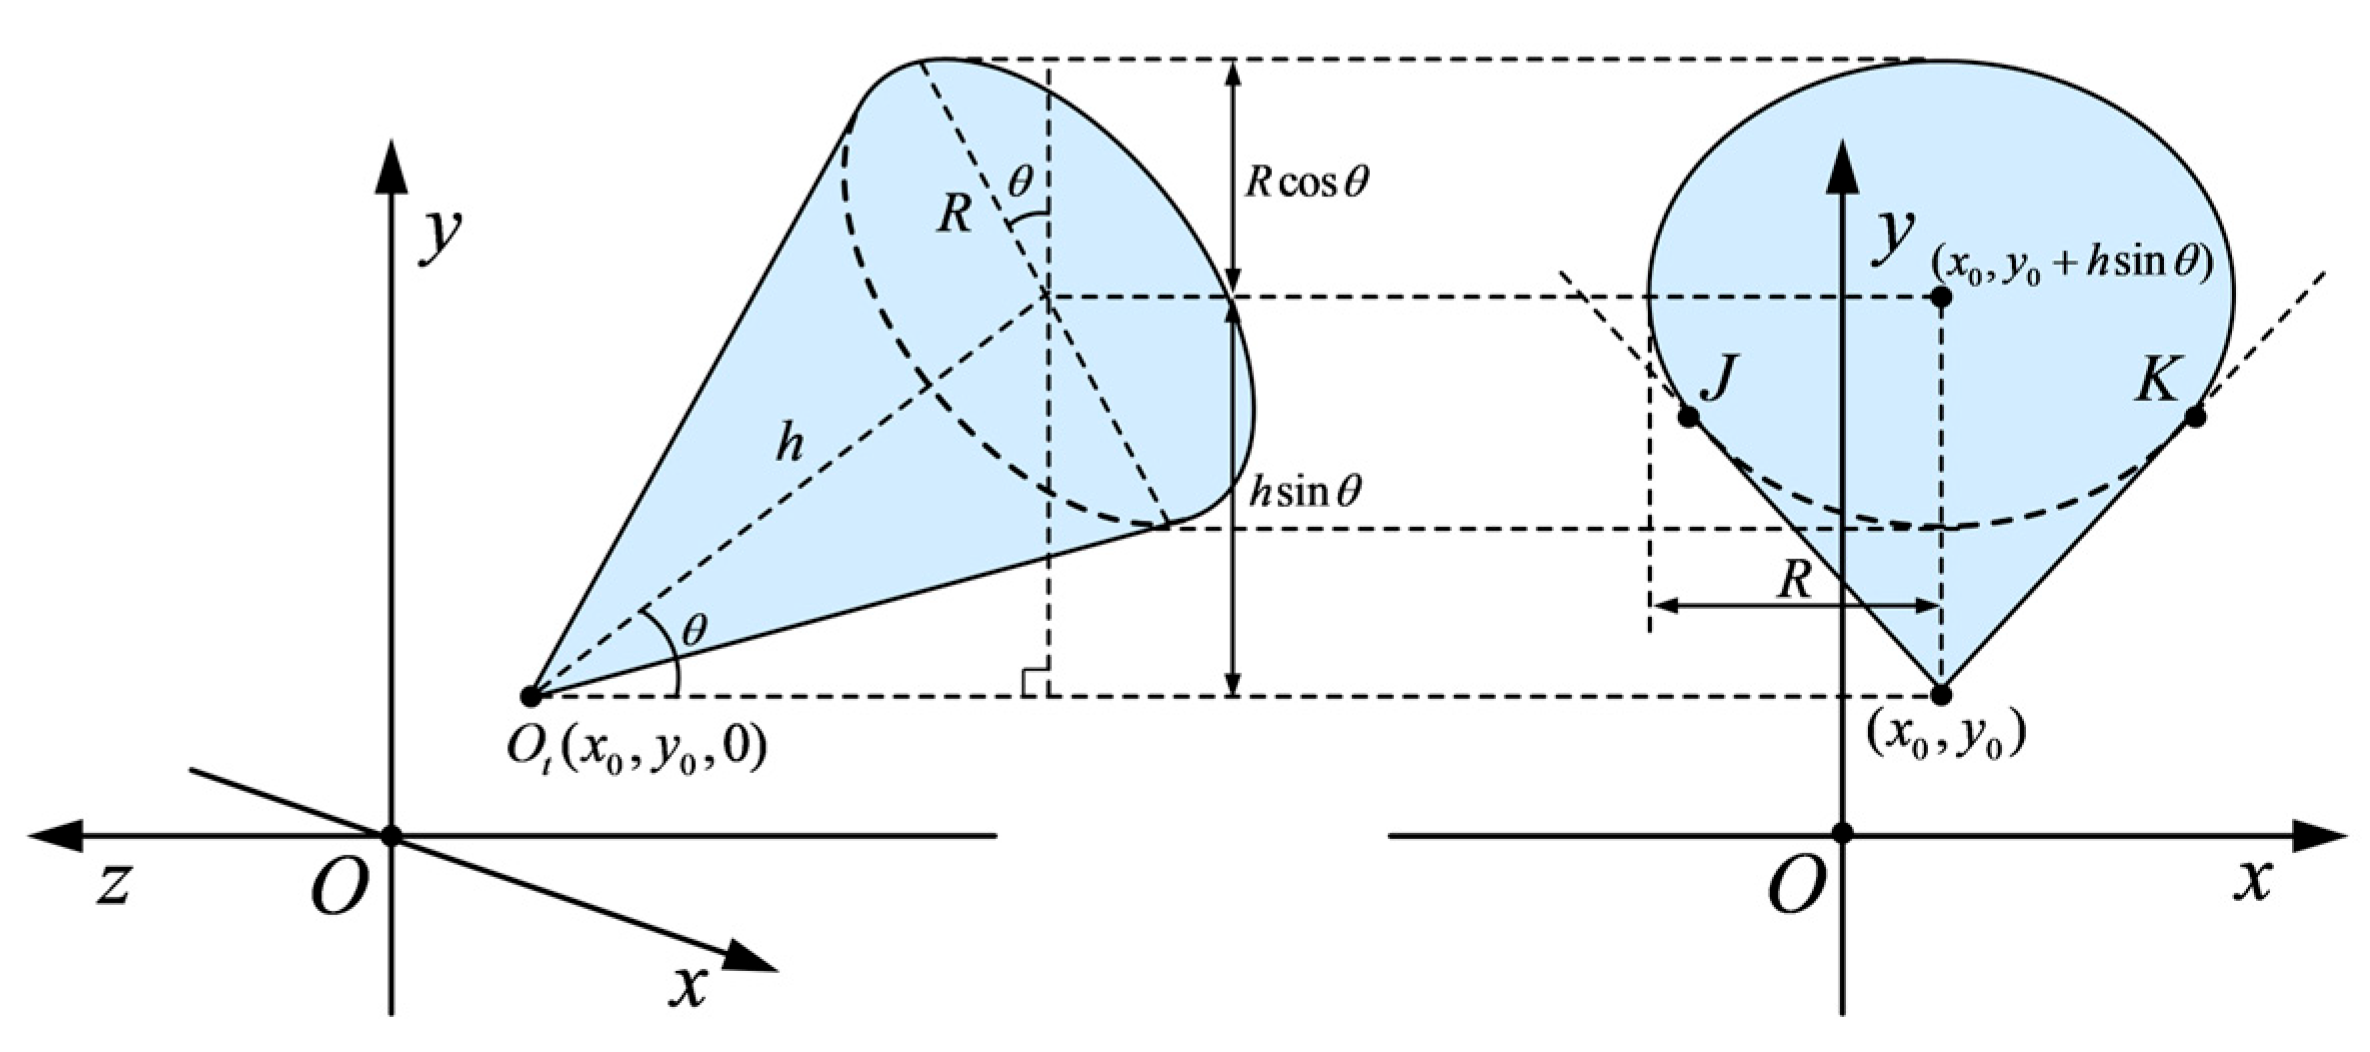
The laser system is coaxial, i.e., with the coordinates of laser detection system ( 0 ,   0 , z 0 ) . As stated in the Introduction, it is difficult to fix the target center at the laser spot center, i.e., the origin of the coordinate shown in Figure 1; the coordinates of target’s rotation center are ( x 0 , y 0 , 0 )   rather than ( 0 ,   0 ,   0 ) . To consider the effect of target rotation on waveform formula, the rotation center is fixed, and target rotates anti-clockwise in y O z   plane, as shown in Figure 2.
The rotation angle of target is denoted as θ . Due to geometric symmetry constraints, the permissible rotation range is confined to 0 ~ 45 °   for rectangular prisms and 0 ~ 30 °   for hexagonal prisms. In remote sensing applications, conical targets (e.g., spires, canopies, lighthouses, and castle turrets) typically maintain an incidence angle below 90 °   relative to the laser beam. Accordingly, the rotation angle for cone is bounded within 0 ~ 90 ° . The analytical formulas for modulated echo waveforms of each target are presented below, and the derivation processes of analytical formulas are detailed in Supplementary Materials.
  • Rectangular prism:
θ = 0 :
l t = ρ β P t τ 4 e x p t 2 z 0 a / 2 / c 2 τ 2 e r f 2 ω x 0 + b 2 e r f 2 ω x 0 b 2 e r f 2 ω y 0 + a 2 e r f 2 ω y 0 a 2
0 < θ π / 4 :
l t = ρ β P t τ 4 1 τ 0 A 2 + τ 2 e x p t t 0 A 2 τ 0 A 2 + τ 2 m A n A + 1 τ 0 B 2 + τ 2 e x p t t 0 B 2 τ 0 B 2 + τ 2 m B n B
where
m = erf 2 ω x + b 2 erf 2 ω x b 2 n = erf ξ y + a cos α 2 + ζ erf ξ y a cos α 2 + ζ t 0 = 2 z 0 z y tan α / c τ 0 = 2 ω tan α / c ξ = 1 τ 2 + 1 τ 0 2 2 tan α c ζ = t t 0 τ 0 2 + τ 2 τ 0 τ
Subscripts A   and B   in Equation (8) denote the side rectangles with center points A   and B , and parameters in Equation (10) are center coordinates and rotation angle (the angle between the normal line of surface and the propagation direction of incident pulse) of side rectangle, respectively. The center point coordinates and rotation angle of two side surfaces are
x A = x B = x 0 y A = y 0 a sin θ / 2 z A = a cos θ / 2 y B = y 0 + a cos θ / 2 z B = a sin θ / 2 α A = θ α B = π / 2 θ
where ( x A , y A ,   z A )   and ( x B ,   y B , z B )   represent the coordinates of center points A   and B , respectively, while α A   and α B   denote the angles between the normals of surface A and surface B, relative to the incident laser beam direction.
  • Regular Hexagonal Prism:
0 θ < π / 6 :
l t = ρ β P t τ 4 1 τ 0 A 2 + τ 2 exp t t 0 A 2 τ 0 A 2 + τ 2 m A n A + 1 τ 0 B 2 + τ 2 exp t t 0 B 2 τ 0 B 2 + τ 2 m B n B + 1 τ 0 C 2 + τ 2 exp t t 0 C 2 τ 0 C 2 + τ 2 m C n C
where subscripts A , B , and C   denote the side surfaces with center points A , B , and C , respectively, and the definitions of m , n , t 0 , τ 0 , ξ   and ζ   related parameters in those definitions are exactly as those shown in Equation (9). The center point coordinates and rotation angle of three side surfaces are
x A = x B = x C = x 0 y A = y 0 + 3 a sin α A / 2 z A = 3 a cos α A / 2 y B = y 0 + 3 a sin α B / 2 z B = 3 a cos α B / 2 y C = y 0 + 3 a sin α C / 2 z C = 3 a cos α C / 2 α A = π / 3 θ α B = θ α C = π / 3 θ
where ( x A , y A ,   z A ) , ( x B ,   y B , z B )   and ( x C ,   y C , z C )   represent the coordinates of center points A , B   and C , respectively, while α A , α B   and α C   denote the angles between the normals of surface A, surface B and surface C, relative to the incident laser beam direction.
θ = π / 6 :
l t = ρ β P t τ 4 1 τ 0 B 2 + τ 2 e x p t t 0 B 2 τ 0 B 2 + τ 2 m B n B + 1 τ 0 C 2 + τ 2 e x p t t 0 C 2 τ 0 C 2 + τ 2 m C n C
The parameters and their definitions in Equation (13) remain consistent with those in Equations (9) and (12).
  • Cone:
0 θ < α :
l t = ρ β p + h sin θ + y 0 p + h sin θ + y 0 R + x 0 R + x 0 g x , y e x p 1 τ 2 t 2 c z 0 ι + Δ ζ d x d y
θ = α :
l t = ρ β ε + y 0 2 h sin α + y 0 γ + x 0 γ + x 0 g x , y e x p 1 τ 2 t 2 c z 0 ϖ d x d y
α < θ π / 2 :
l t = ρ β p + h sin θ + y 0 p + h sin θ + y 0 R + x 0 R + x 0 g x , y e x p 1 τ 2 t 2 c z 0 ι + Δ ζ d x d y + q + y 0 p + h sin θ + y 0 x 0 u + x 0 g x , y e x p 1 τ 2 t 2 c z 0 ι + Δ ζ d x d y + q + y 0 p + h sin θ + y 0 u + x 0 x 0 g x , y e x p 1 τ 2 t 2 c z 0 ι + Δ ζ d x d y
where
p = R 2 x x 0 2 cos θ q = x x 0 s i n 2 θ t a n 2 α c o s 2 θ u = h t a n 2 α sin θ s i n 2 θ t a n 2 α c o s 2 θ γ = R 2 y y 0 h sin α cos α 2 ζ = s i n 2 θ c o s 2 θ t a n 2 α ι = y y 0 t a n 2 α + 1 sin θ cos θ Δ = y y 0 2 t a n 2 α x x 0 2 ζ ϖ = c o s 2 α s i n 2 α t a n 2 α y y 0 2 tan α x x 0 2 2 tan α y y 0
and ε   denotes an infinitesimally small positive quantity.

3. Simulation Process and Experimental Validation

3.1. Simulation Modeling

After successfully deriving the formula of waveform modulated by three 3D targets, next step is to systematically and comprehensively expose the modulation of target properties on waveform. Table 1 shows the parameters during simulation. In brief, the detecting distance and properties of incident pulse remain invariable, while the properties (size, position, and rotation angle) of three 3D targets change regularly in a large range. Differing from 2D regular shapes, 3D targets require more than one parameter to describe the structural information; it is less important and difficult to set all targets with the same surface area or volume. As a result, properties of different targets vary independently. And to reduce the number of parameters, the bidirectional reflectance distribution function ρ ( β )   is simplified to the hemispherical reflectance ρ .

3.2. Experimental Validation and Comparison

This study experimentally validates the similarity and consistency between measured echo waveforms and simulated waveforms under identical parameters. The experimental system was configured with the following specifications: laser wavelength of 1064 nm, pulse width (full width at half maximum) of 93 ps, and beam radius of 0.135 m. The APD detector and oscilloscope exhibited bandwidths of 10 GHz and 4.25 GHz, respectively, while the high-speed data acquisition system operated at a sampling rate of 50 GSPS. The target comprised a 6 cm-edge rectangular prism positioned at 200 m from the laser transmitter. Figure 3 illustrates the experimental configuration, which has been comprehensively characterized in prior literature and is not redescribed herein [42].
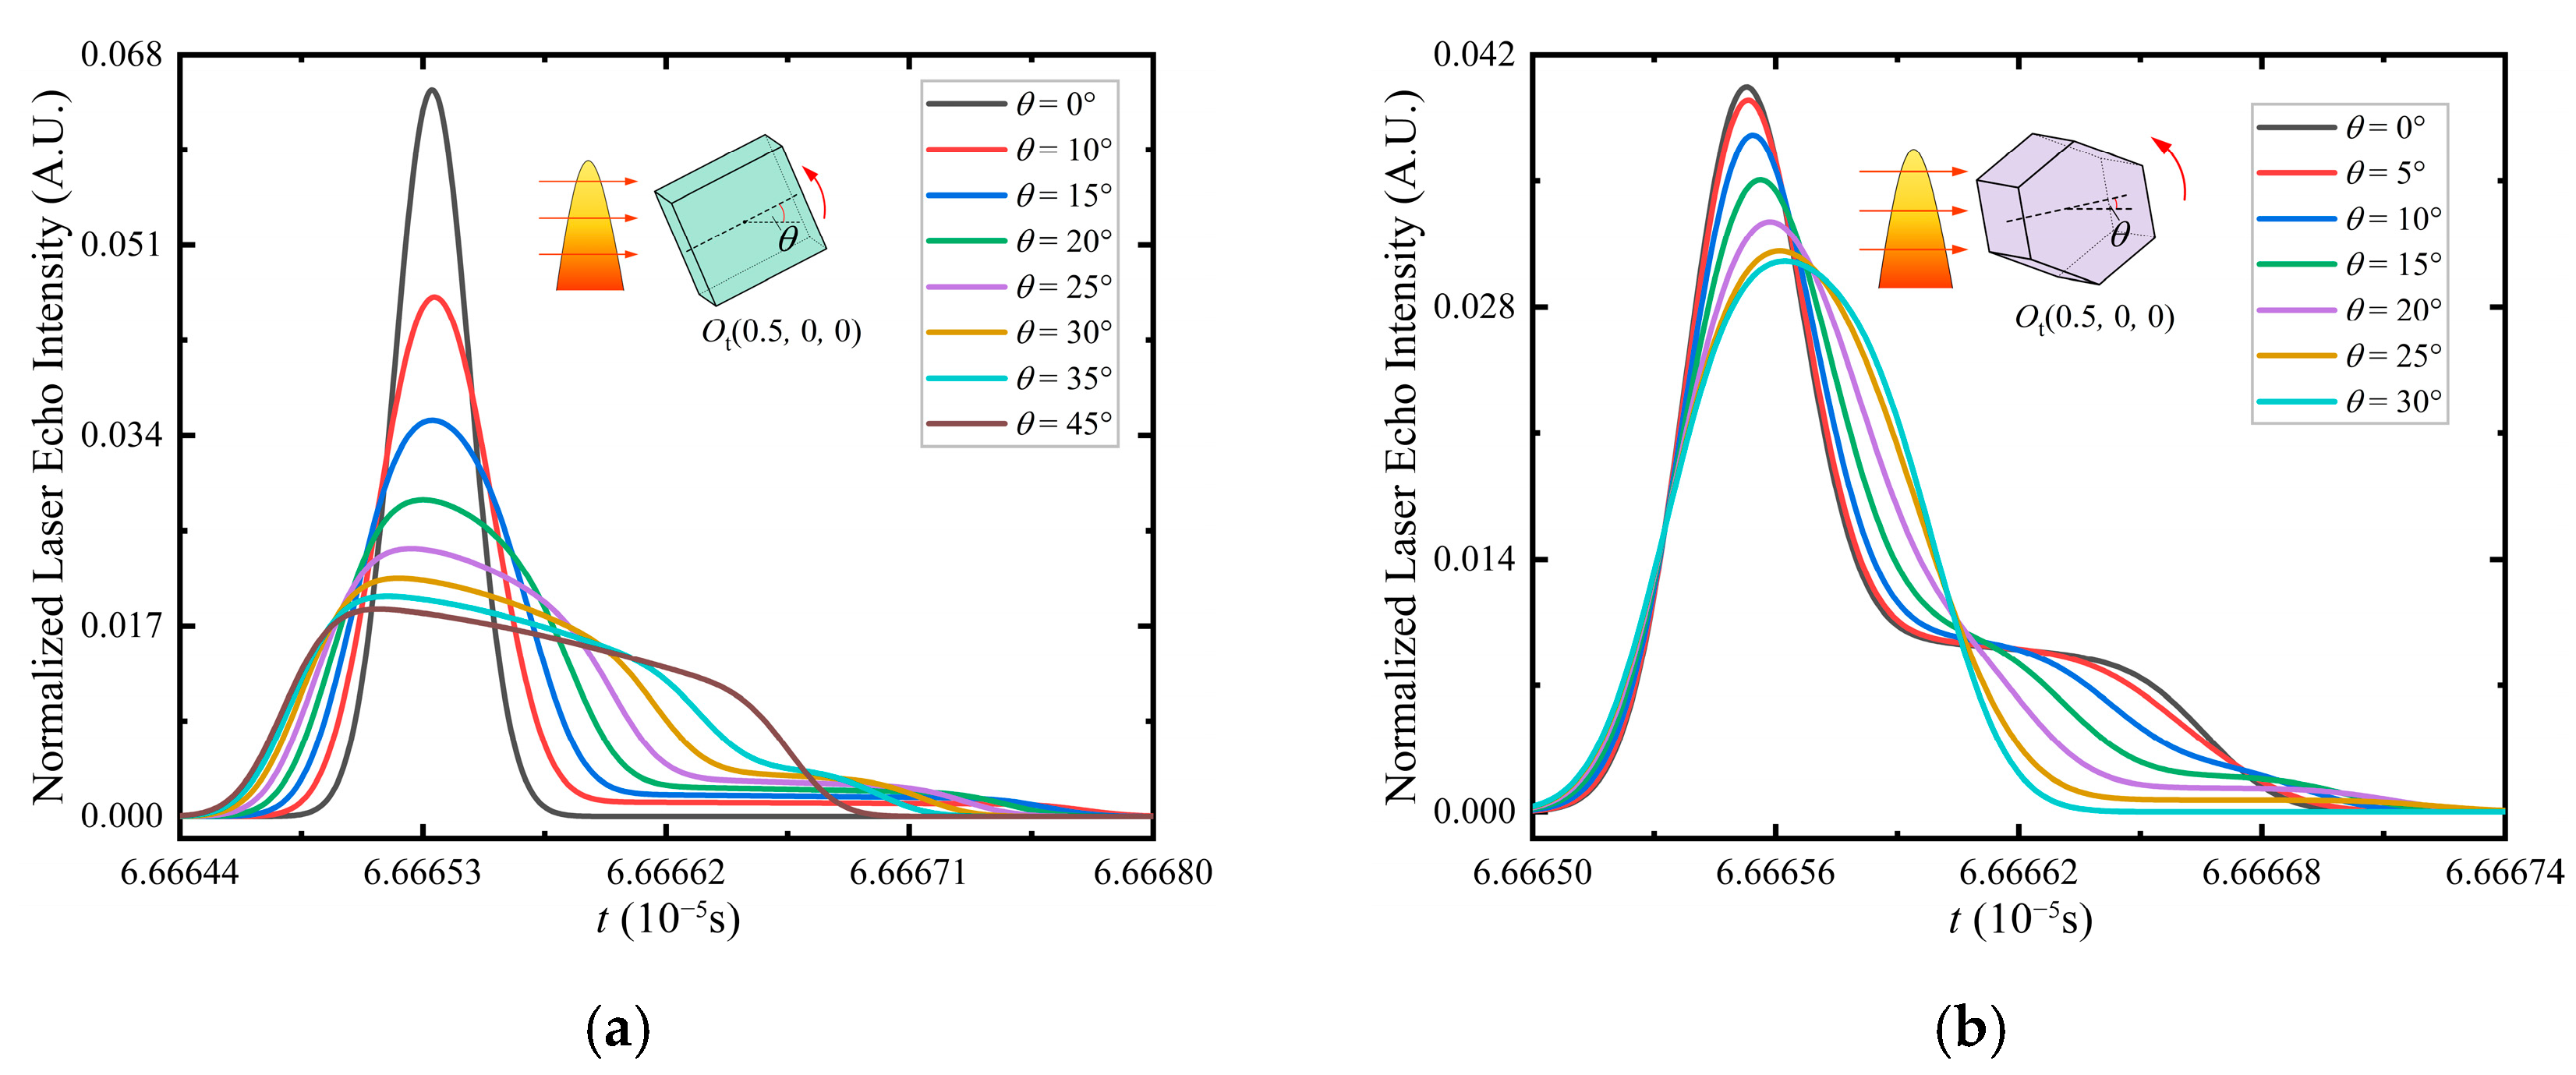
Figure 4a,b show the simulated and experimental waveforms, respectively. By comparing and observing the two, it can be seen that the variations in the simulated and experimental waveforms with the rotation angle are generally consistent, which validates the effectiveness of the analytical formula for the laser echo pulse modulation echo waveform proposed in this paper.
The root mean square error (RMSE) is a standard metric for quantifying waveform similarity, where a higher value indicates a greater degree of waveform discrepancy [43,44]. Figure 4c shows the RMSE between the simulated and experimental waveforms under different rotation angles. It can be observed that the RMSE exhibits a fluctuating trend as the rotation angle increases. The RMSE between the echo waveforms is minimized when θ   ranges from 15 °   to 20 ° , with a mean value of only 0.023, indicating the highest similarity between the simulated and experimental waveforms. When θ   exceeds 20 ° , the RMSE increases, yielding a mean value of 0.094.
Due to higher-order nonlinear effects in the electronic detection system [45], voltage oscillations after the pulse are introduced, which interfere with the emergence of a long tail in the echo waveform and broadening at the peak. This is an important reason for the deviation between the experimental and simulated waveforms on the right side at θ = 10 °   and 45 ° . For θ = 25 °   to 40 ° , there is a temporal deviation of approximately 10 ps in the peak arrival time between the simulated and experimental waveforms. A slight misalignment between the target center and the rotation axis contributes to this effect, as the resulting eccentricity error causes more significant timing discrepancies in this specific angular region. Calculations indicate that a time error of about 10 ps corresponds to a distance error of approximately 0.75 mm in the reflective surface. Such minor inaccuracies are difficult to avoid in experimental settings.
By comparing Figure 4a,b, it can be observed that the higher-order nonlinear effects of the full-waveform lidar system have a significant impact on the waveform. Inspired by adaptive algorithms [46], the “fingerprint” of higher-order nonlinear characteristics of the system can be extracted, and a waveform with multiple parameters can be used instead of an ideal Gaussian shape as the simulated transmitted pulse. This approach will enhance the similarity of waveform simulation and reduce the difficulty of target feature inversion. Owing to the favorable optimality properties of convex functions [47,48], an objective function can be formulated using the RMSE metric to model the emission pulse parameters, and an attempt is made to transform it into a convex optimization problem. This convex optimization problem is then solved via efficient algorithms such as greedy search [49,50] or iterative descent methods [51] to determine the optimal emission pulse parameters. This represents a promising research direction, and we intend to pursue further investigations in this area.
Further, in the experiments, the waveforms were acquired using an oscilloscope, whereas the actual satellite-borne system employs a data acquisition card. The bandwidth and sampling rate of the oscilloscope used in experimental validation are generally unattainable with common data acquisition cards in the integrated satellite system. Meanwhile, the pulse width of 0.2 ns corresponds to a range resolution of 3 cm, which facilitates subsequent analysis and comparison of the simulation results. Accordingly, the simulated laser pulse width was defined as τ =   0.2 ns.
Moreover, it must be emphasized that simplifying the target as a Lambertian surface in this study represents a highly idealized assumption. This approach inherently neglects the directionality and specular reflection. When observed from a long distance, the canopy, due to the random orientation of its leaves, may exhibit collective reflection behavior that approximates Lambertian reflection. Similarly, many structures with rough concrete surfaces or targets coated with matte paint can also be reasonably approximated as Lambertian surfaces. However, this model fails to accurately simulate targets with anisotropic reflective properties, such as the metallic surfaces of certain satellites or the glass curtain walls of buildings. Furthermore, it is incapable of capturing the specular reflections exhibited by surfaces like those of the AJISAI satellite.
Given its computational simplicity and ease of implementation, the Lambertian model was adopted in this work for preliminary, proof-of-concept simulation studies. For future applications requiring fine target classification and identification, as well as feature inversion, more sophisticated bidirectional reflectance distribution function (BRDF) models will be employed to achieve a more realistic description of the target’s optical properties, thereby minimizing the discrepancy between simulated waveforms and actual target’s echo waveforms.

4. Results and Analysis

This paper investigates the modulation mechanisms of rectangular prism, hexagonal prism, and conical targets on echo waveforms under three distinct conditions: non-rotated, rotated, and positioned away from the origin O . The influences of target size, attitude, and position on variations in the echo waveform are analyzed, specifically as follows.

4.1. Non-Rotated

In this section, the rotation angle θ   of target is 0 , and the position of the target is ( 0,0 , 0 ) .

4.1.1. Prisms

  • Rectangular Prisms
In non-rotated condition, with the size increasing, from a non-extended target to an extended target, the echo waveform of rectangular prism remains Gaussian shape, and the normalized peak intensity gradually increases to approach 1, as shown in Figure 5a. Since the illuminated surface is a plane perpendicular to the incident laser, its modulation effect will not change the shape of echo waveform.
  • Regular hexagonal prism.
As can be seen from Figure 5b, the echo waveform of regular hexagonal prism consists of a peak on the left and a long tail on the right. The illuminated surface of the regular hexagonal prism is composed of one vertical rectangle (surface B) and two symmetric sloped rectangles (surface A and C), where the angle between each sloped rectangle and the x O y   plane is 60°. The echo waveform of regular hexagonal prism is the superposition of backscattered echo waveforms from three rectangles. The vertical rectangle is not only located at the center of laser spot, but also the backscattered laser energy from it returns simultaneously, thereby forming the peak. On two sloped rectangles, the laser energy reflected by the parts farther from the center of laser spot is weaker. Moreover, these parts are also positioned farther from the receiver, leading to longer propagation delays of their backscattered laser energy, thus forming the tail with gradually decreasing echo intensity.
With increasing a , the middle vertical rectangle will gradually occupy laser spot, leading to a continuous rise in the echo intensity of the peak. Meanwhile, the two sloped rectangles will be farther from the laser spot, resulting in weakened echo energy. Additionally, the projection of sloped rectangles onto   z -axis, which is 3 a / 2 , become longer, causing their echo energy to return to the receiver over an extended temporal window; thus, the tail of the echo waveform becomes slenderer.

4.1.2. Cone

Influence of half-cone angle   α   on echo waveform.
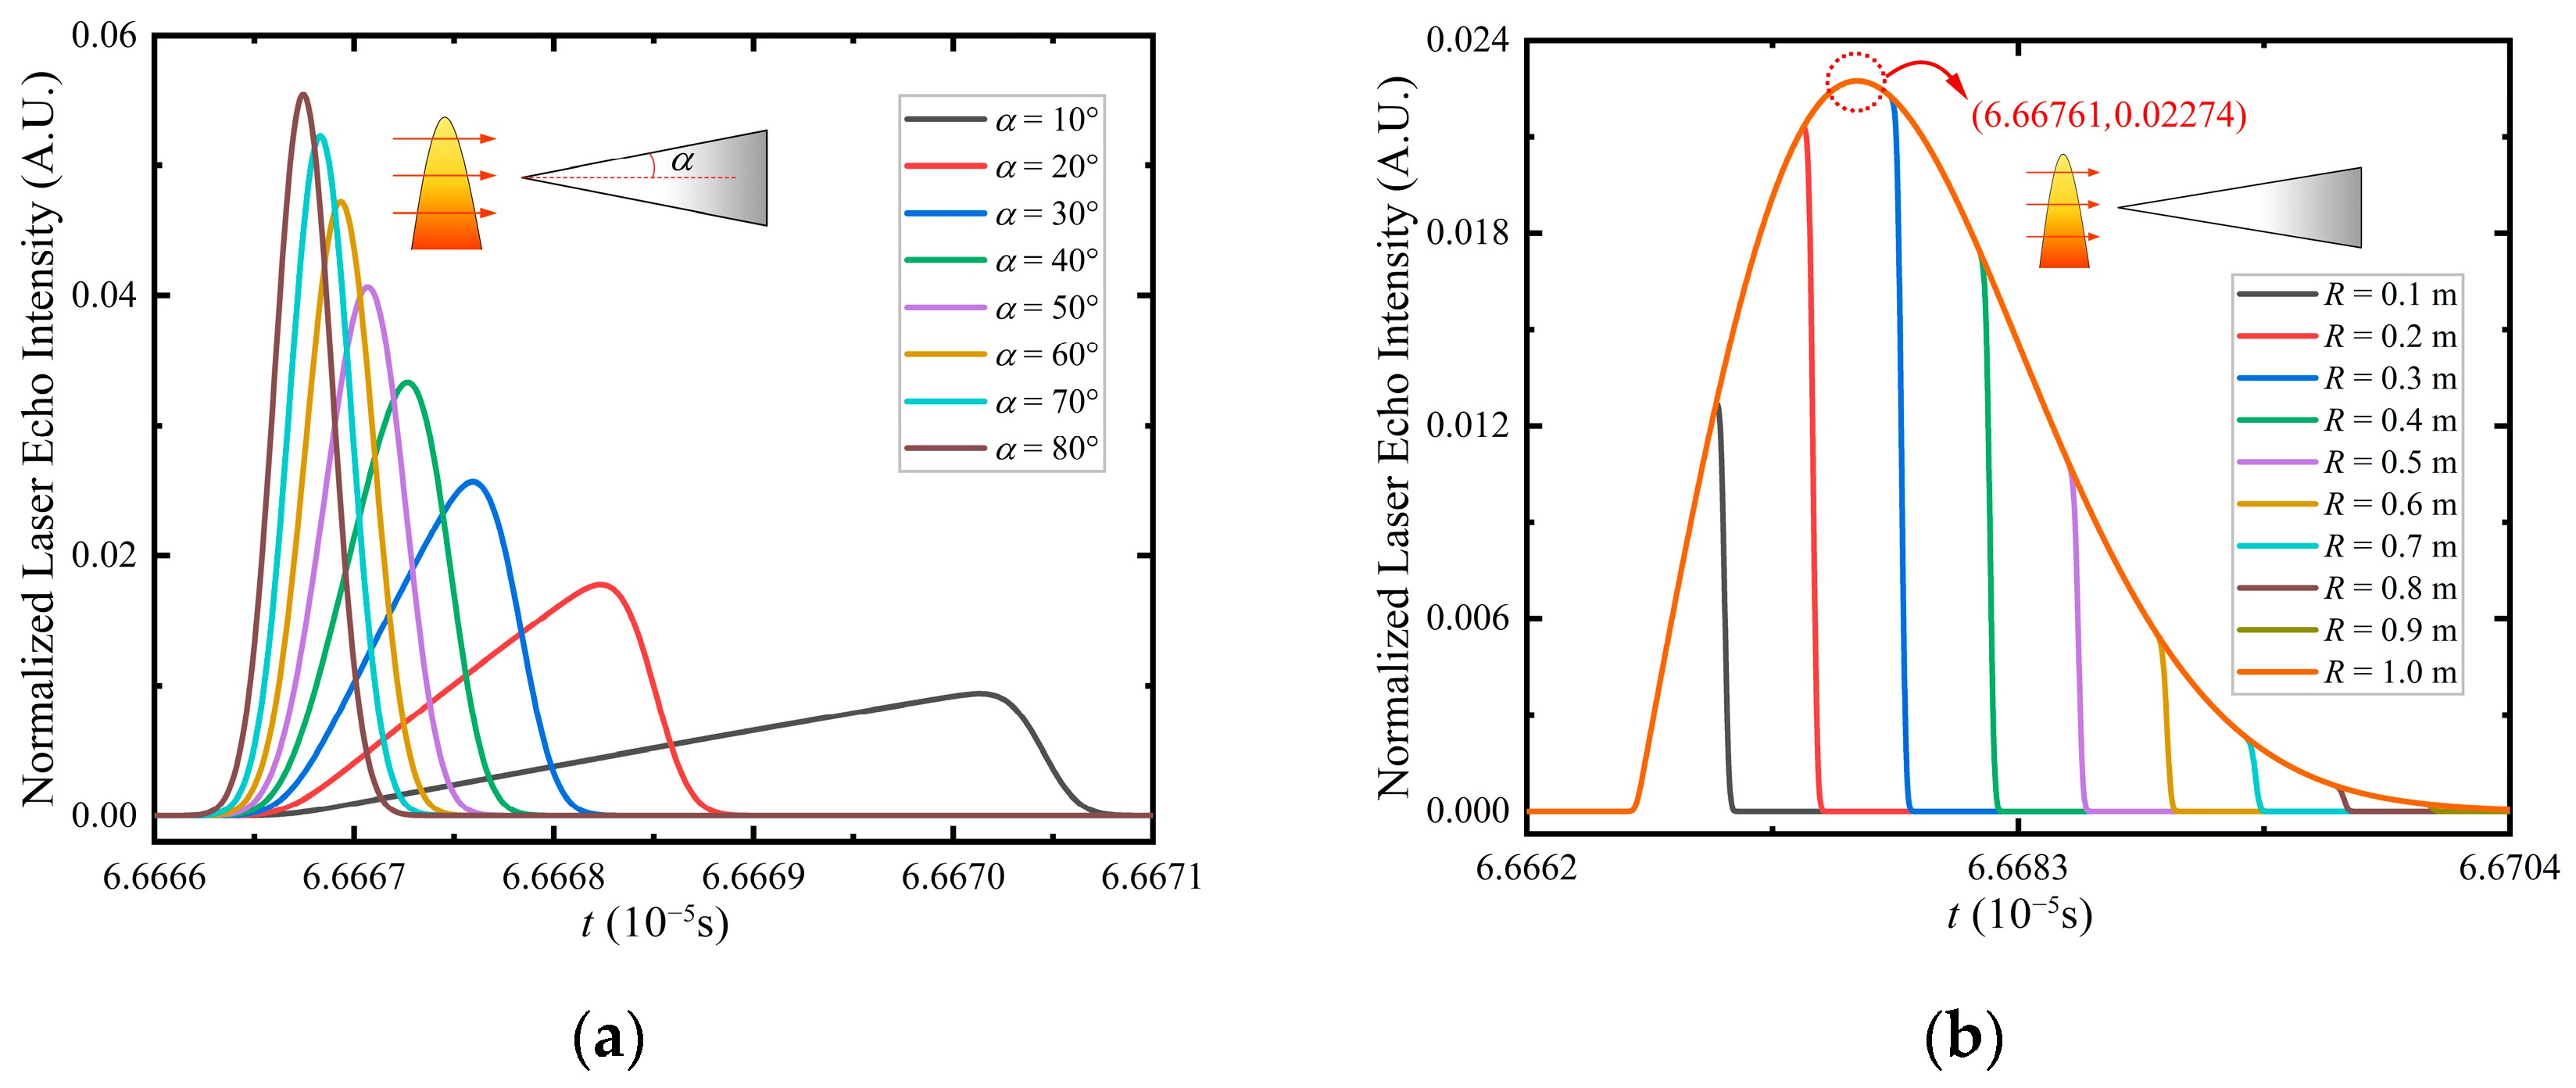
Figure 6a shows the echo waveforms of cone with different half-cone angles when the bottom radius R = 0.1   m . As half-cone angle increases, the peak intensity of echo waveform rises continuously, while the width of echo pulse decreases.
Since the target is simplified as a Lambert reflector, it uniformly reflects the incident laser pulse energy in all directions within the hemispherical space. Moreover, only the backscattered echoes from target that propagate parallel to the   z -axis can reach receiver. Therefore, the echo energy depends on the projected area of the target onto x O y   plane and the energy distribution g x , y   of the incident laser pulse. For cones with different half-cone angles but the same base radius, their projected areas on the x O y   plane and g x , y   are identical, resulting in equal laser echo energy. As the half-cone angle increases, the axial length of the cone becomes shorter, causing the backscattered laser energy returning to the receiver within a shorter temporal window. Consequently, the pulse width of the echo waveform declines, while the peak intensity rises. Furthermore, when the semi-apex angle is sufficiently large, the cone approximates a vertical planar target; consequently, its echo waveform assumes a Gaussian shape.
  • Influence of bottom radius R   on echo waveform.
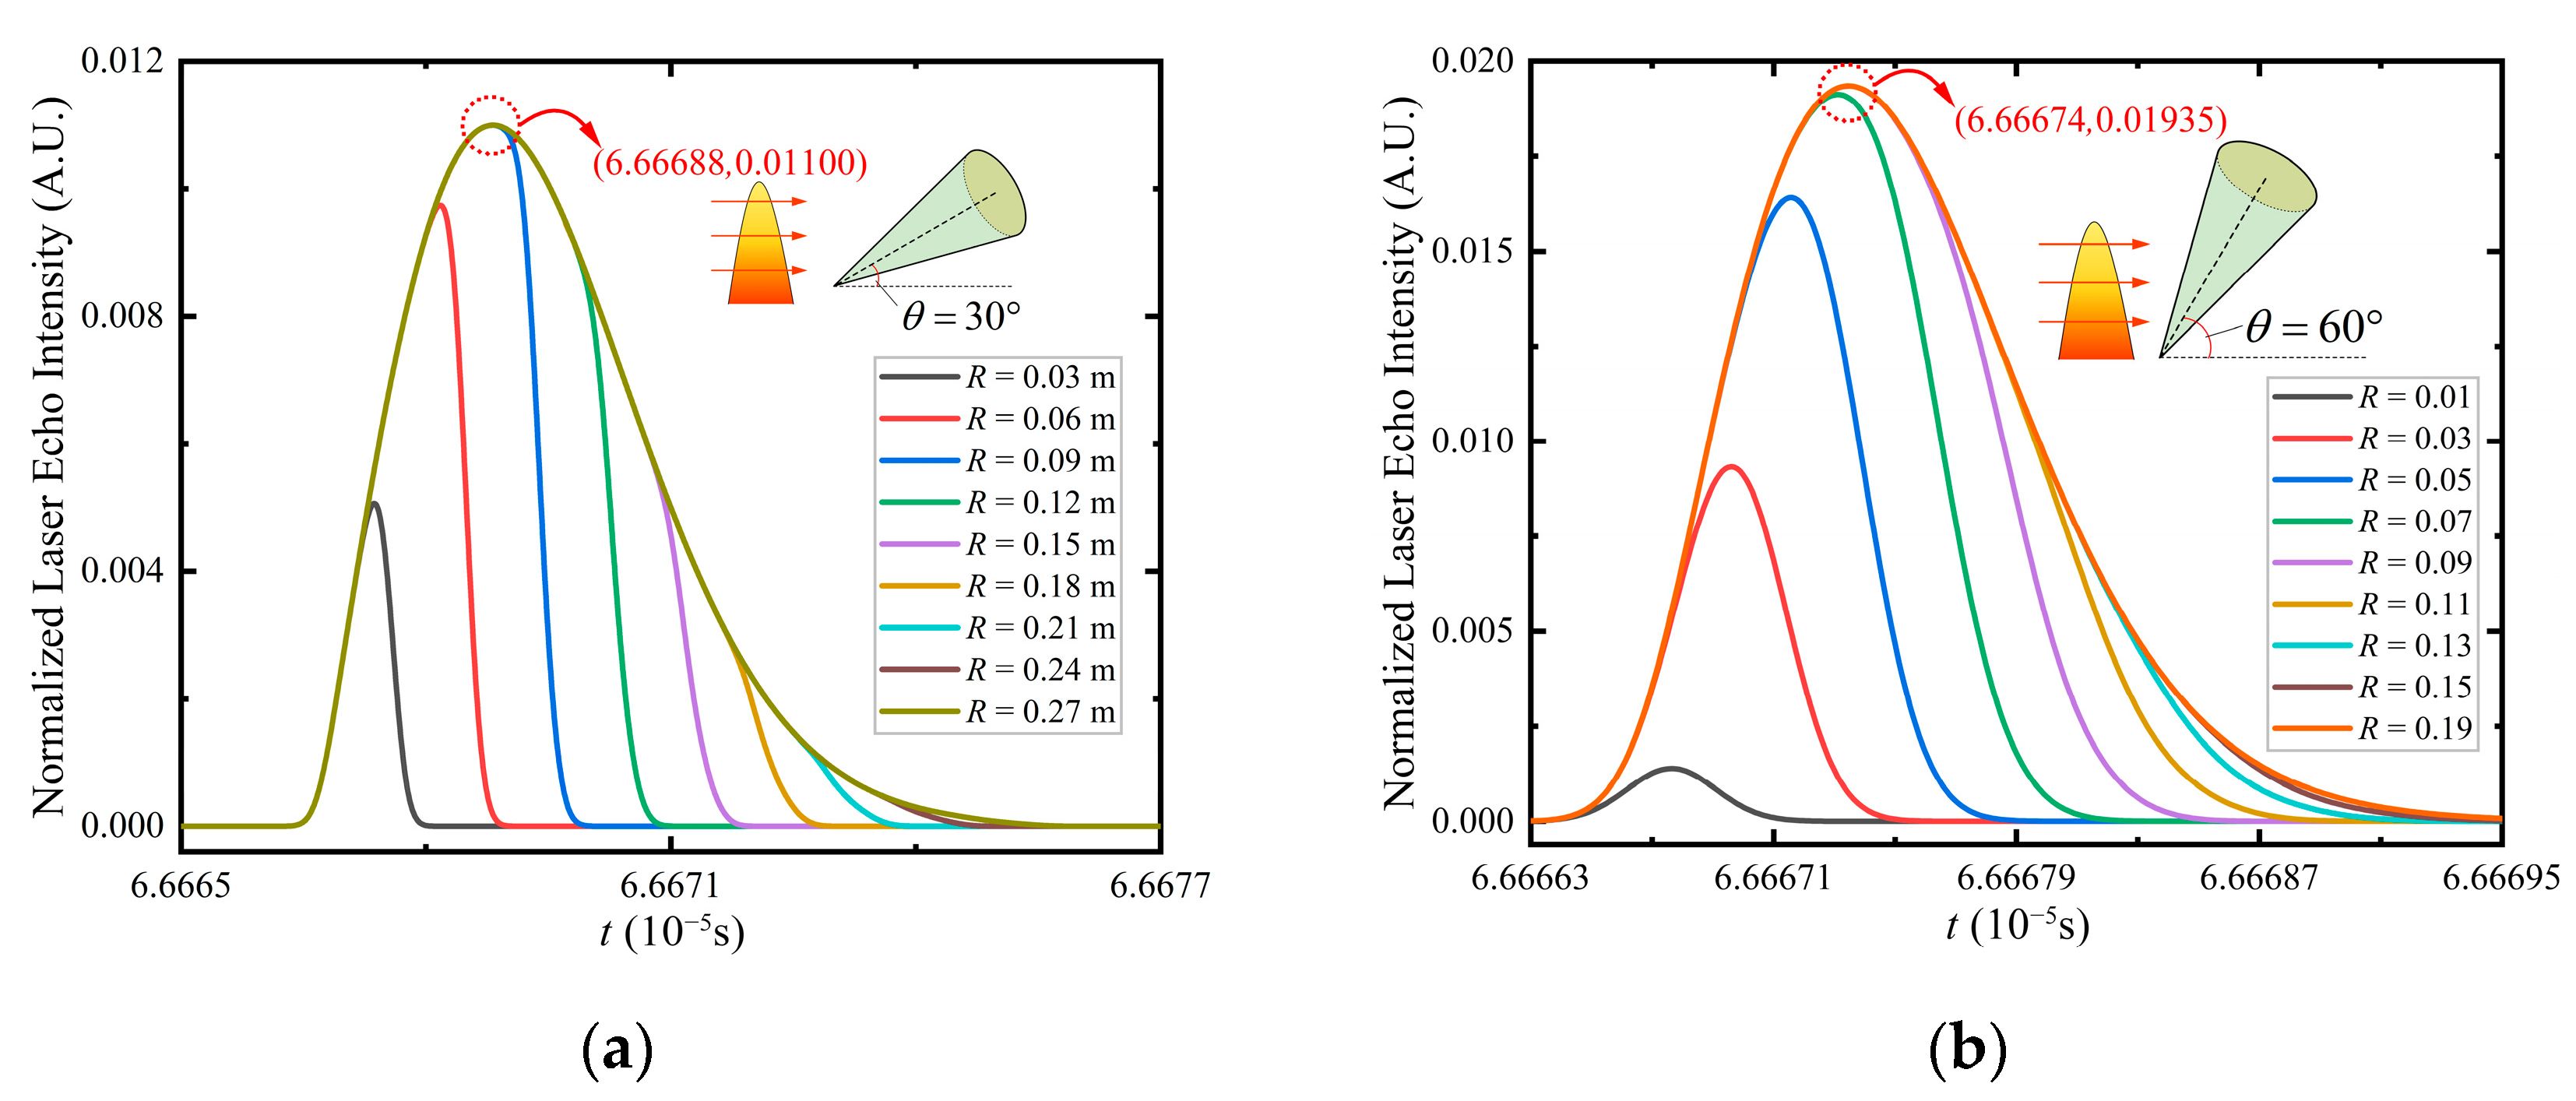
Figure 6b illustrates bottom radius R   dependence of the normalized laser echo intensity modulated by cone with the half-cone angle α = 10 ° . When R   ranges from 0.1   to 0.2   m , cone’s echo waveform exhibits a gradual rise on the left side and a rapid fall on the right side, accompanied by a continuous increase in both peak intensity and pulse width. For R   values between 0.3   and 0.8   m , the peak intensity remains constant, and a distinct inflection point emerges on the right side of the echo waveform curve. When R 1.0   m , the echo waveform progressively transitions into a heavy-tailed characteristic. Furthermore, for a fixed half-cone angle, the echo waveform profile of a cone with a smaller R   is enveloped by that of a cone with a larger   R .
From a qualitative analysis perspective, an increase in the cone’s bottom radius R   augments the backscattering area and elevates the echo energy. However, it concurrently causes the edge of the bottom to move farther from the center of the laser spot, subjecting it to the diminishing energy distribution of the incident laser pulse. When the growth rate of the backscattering area exceeds the attenuation effect from the energy distribution, cone’s echo intensity increases. Conversely, it decreases when the attenuation effect dominates. The peak in the echo waveform occurs when these two opposing effects are balanced. This dynamic interplay governs the characteristic variation pattern of echo waveforms depicted in Figure 6b.
Furthermore, a cone with a larger bottom radius   R   can be conceptually decomposed into the combination of a smaller cone and a circular truncated cone. Therefore, the differences observed in the modulated echo waveforms for cones of varying radii fundamentally stem from the modulation characteristics inherent to the circular truncated cone component. This geometric property provides a coherent explanation for the phenomenon where the echo waveform profile of a smaller cone is enveloped by that of a larger one. Consequently, it offers a significant foundation for delving deeper into the underlying modulation mechanism of cone.
To facilitate the understanding of the modulation mechanism of cone, this paper analyzes it from the perspective of facet approximation. The lateral surface of the cone can be regarded as composed of an infinite number of tilted isosceles triangles. Each of these triangles has its vertex located at the origin O , possesses an infinitesimally small base length, and a height equal to the length of the cone’s generatrix h / cos α . Each such isosceles triangle can be considered a microfacet. As shown in Figure A1a, assume that the height (the generatrix of the cone) of one such isosceles triangle makes an angle θ 1   with the   z -axis, its base length is d 1 , and the distance from the midpoint of its base edge to the   z -axis is h . The distance h   can be expressed as
h = R sin θ 1 s in α = h sin θ 1 cos α
Under non-rotated condition, it follows that θ 1 = α   and h = R   in Equation (18).
The backscattering component on this triangle at the distance   r 1   from the z -axis can be treated as a rectangular strip. Its projected area S 1   onto x O y -plane is
S 1 = r 1 h d 1 h
where h is an infinitesimal element of h , representing the height of the rectangular strip’s projection. The energy distribution of laser spot at a distance r 1   from the z -axis, denoted as g r 1 , can be expressed as
g r 1 = 2 P t π ω 2 e x p 2 r 1 2 ω 2
The backscattering intensity l ( r 1 )   from a single microfacet, returning to the receiver at time 2 z 0 + r 1 / tan θ 1 / c , can be approximately expressed as
l r 1 = ρ 0 g r 1 S 1 t = 2 ρ P t π ω 2 e x p 2 r 1 2 ω 2 r 1 h d 1 h c tan θ 1 2 h
where t   denotes the temporal window during which the backscattered laser energy from the rectangular strip returns to the receiver.
t = 2 h c tan θ 1
Differentiating Equation (21) yields:
l r 1 = ρ P t d 1 c tan θ 1 π ω 2 h e x p 2 r 1 2 ω 2 1 4 r 1 2 ω 2
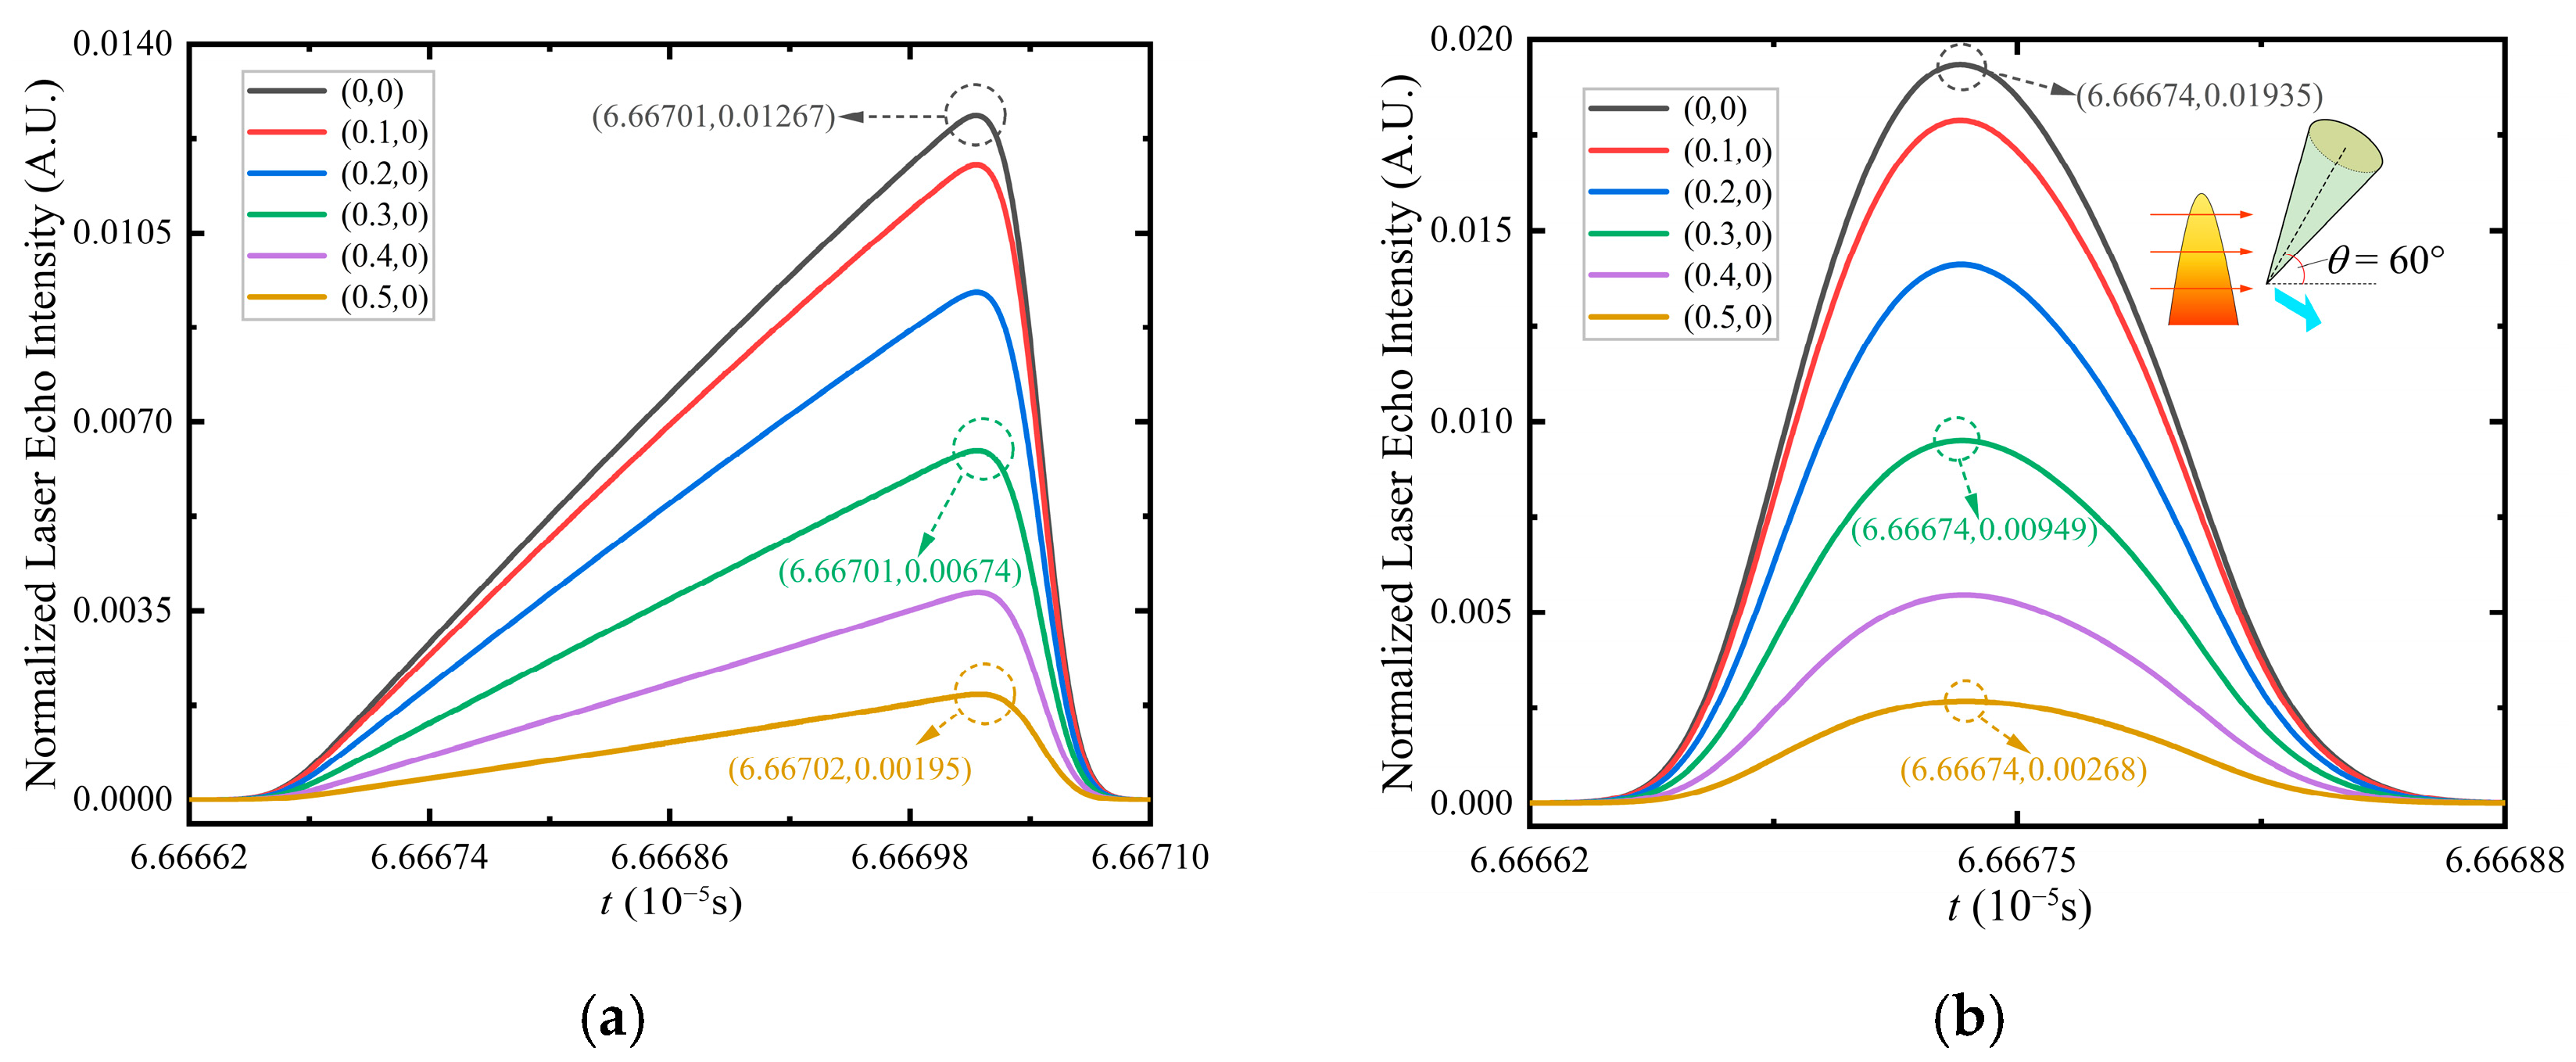
Equation (23) reveals that l r 1   monotonically increases within the range 0   to ω / 2 , and monotonically decreases beyond ω / 2 . Regarding the non-rotated cone,   r 1  can also represent the continuously increasing radius of bottom for a fixed α . Consequently, when the cone’s bottom radius R   does not exceed ω / 2 , the modulated echo waveform retains a profile characterized by a slow-rising left side and a rapidly decaying right side. However, once R   exceeds ω / 2 , the echo waveform progressively transitions into a heavy-tailed shape.
Corresponding to the monotonicity of the conical echo waveform in the time domain, the following holds: (1) When the bottom radius of the cone is sufficiently large, cone’s echo waveform monotonically increases from 2 z 0 / c   to 2 z 0 + ω / 2 tan α / c , reaches its peak echo intensity at 2 z 0 + ω / 2 tan α / c , and subsequently monotonically decreases from 2 z 0 + ω / 2 tan α / c to 2 z 0 + R / tan α / c   ( 2 z 0 + h / c ). (2) When the bottom radius of the cone is relatively small, i.e., R < ω / 2 , cone’s echo waveform maintains a monotonic increase throughout the range from 2 z 0 / c   to   2 z 0 + R / tan α / c . Furthermore, since the laser emits pulsed laser radiation, the modulated echo waveform of the target monotonically increases exclusively within the time range from 2 z 0 / c τ   to 2 z 0 / c and monotonically decreases exclusively within the range from 2 z 0 + R / tan α / c to 2 z 0 + R / tan α / c + τ . However, this behavior is attributed to the inherent temporal characteristics of the incident pulse itself, rather than to the target’s modulation effect. Due to the significantly attenuated echo intensity resulting from the modulation of the laser pulse near the cone’s vertex, the echo waveform within the range from 2 z 0 / c τ   to   2 z 0 / c   is scarcely observable. Therefore, the rise time on the left side of the echo waveform can be approximated as either ω / c tan α   or 2 R / c tan α .
Calculations reveal that the temporal positions of peak intensity for cones with half-cone angles of 10 ° , 20 ° , 40 ° , 60 ° , and 80 °   are 6.66761 × 10 5 s , 6.66712 × 10 5 s , 6.66687 × 10 5 s , 6.66676 × 10 5 s , and 6.66670 × 10 5 s , respectively. These values corroborate the temporal positions of peak intensity observed in Figure 6b and Figure A2, thereby validating the mathematical methodology employed in this paper for analyzing cone’s echo waveforms.
Furthermore, in Figure 6b, the portion of the echo waveform exceeding the time interval of 2 z 0 + R / tan α / c   received by the detector exhibits a steep descent. Based on the convolution operation in Equation (1), it can be inferred that the width of this segment is determined by the characteristics of the transmitted pulse itself, rather than by broadening caused by the axial length of the cone. Due to the small half-cone angle and long axial length of the cone, the broadening of the echo pulse width resulting from the axial dimension is significantly greater than the pulse width of the transmitted laser (0.2 ns). As a result, this segment visually appears as a sharp decline.

4.2. Rotated

For three targets above, this study has performed simulations and investigations on the echo waveforms of the rectangular prism, regular hexagonal prism, and cone over rotation angle ranges of 0 °   to 45 ° , 0 °   to 30 ° , and 0 °   to 90 ° , respectively. The center of rotation for all targets was fixed at ( 0 ,   0 ,   0 ) .

4.2.1. Prisms

  • Rectangular prism.
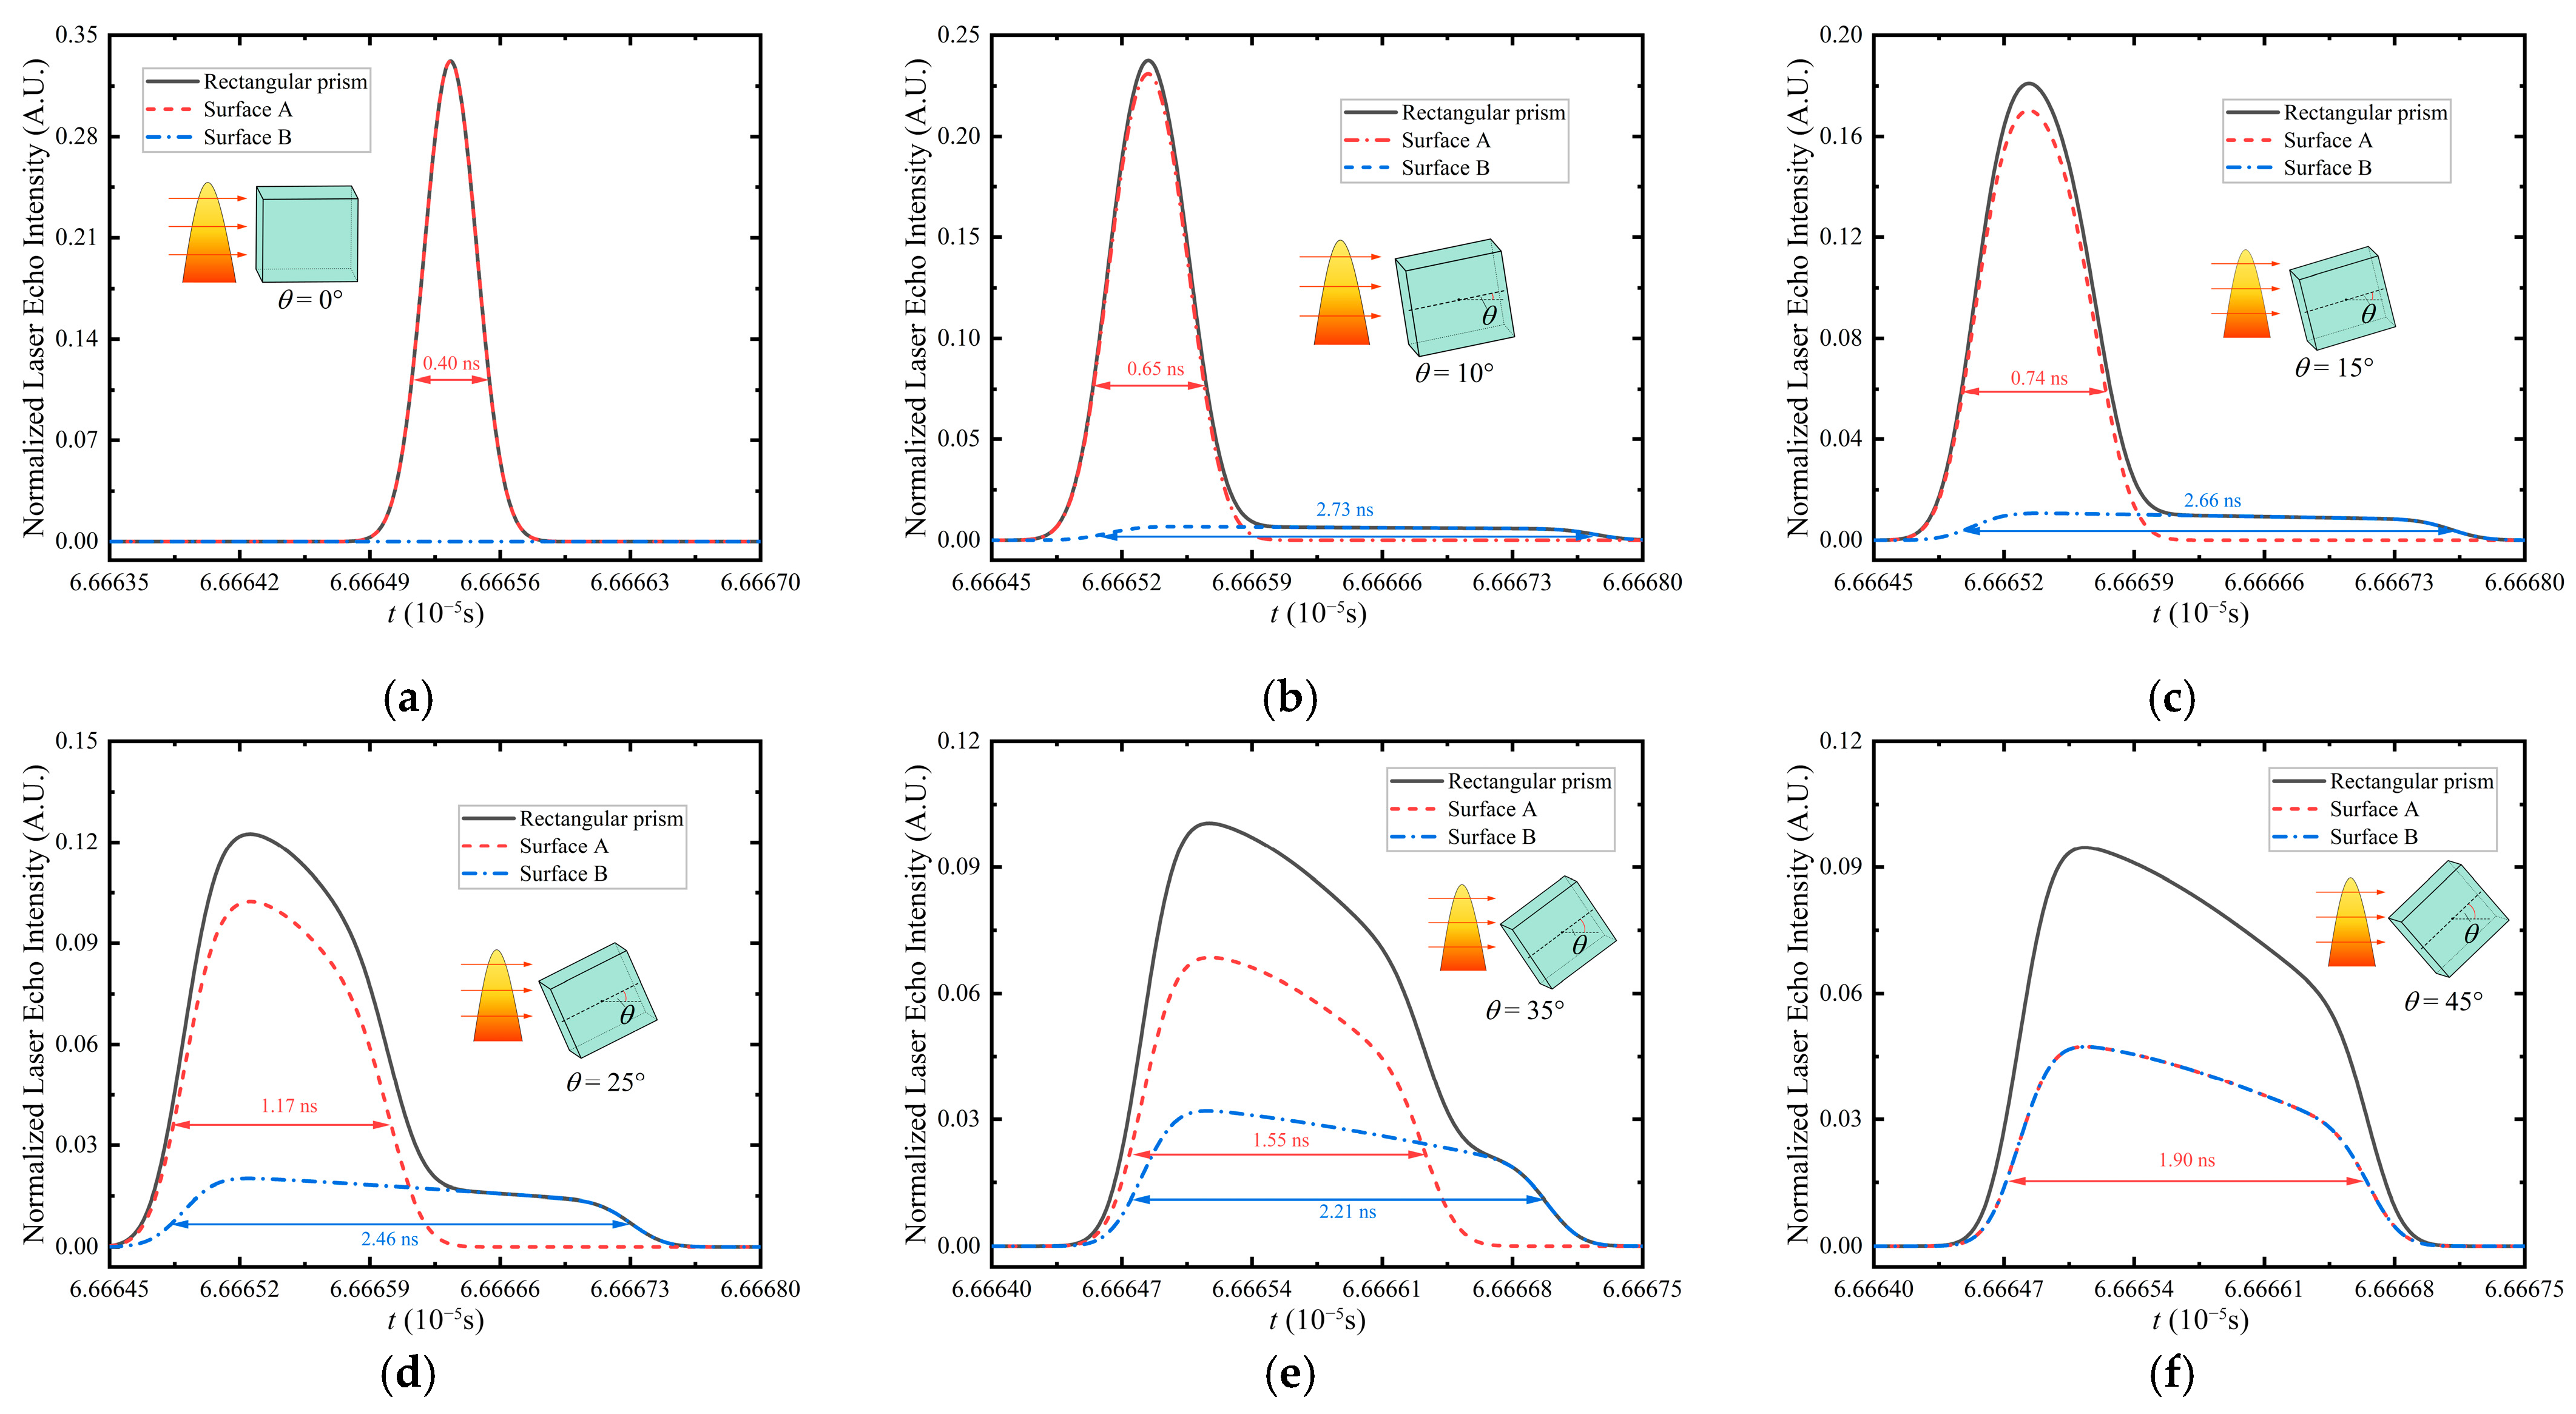
Figure 7a presents the echo waveforms of the rectangular prism across various rotation angles. At θ = 0 ° , only surface A (perpendicular to the incident direction of laser) is illuminated. Since modulation by a surface at normal incidence does not alter the incident laser pulse waveform, the resulting echo waveform exhibits a Gaussian shape. Within the range of 0 ° < θ 45 ° , the echo waveform develops a long-tailed characteristic. As the rotation angle increases, the peak echo intensity diminishes, while the pulse width undergoes compression due to the shortening of this long tail. During this phase, both surface A and B are illuminated concurrently. Consequently, the rectangular prism’s echo waveform constitutes the superposition of the echoes from these two surfaces. Variations in the relative displacement of them with respect to the laser spot, combined with changes in their inclination angles, constitute the primary factors governing the alterations in the rectangular prism’s echo waveform.
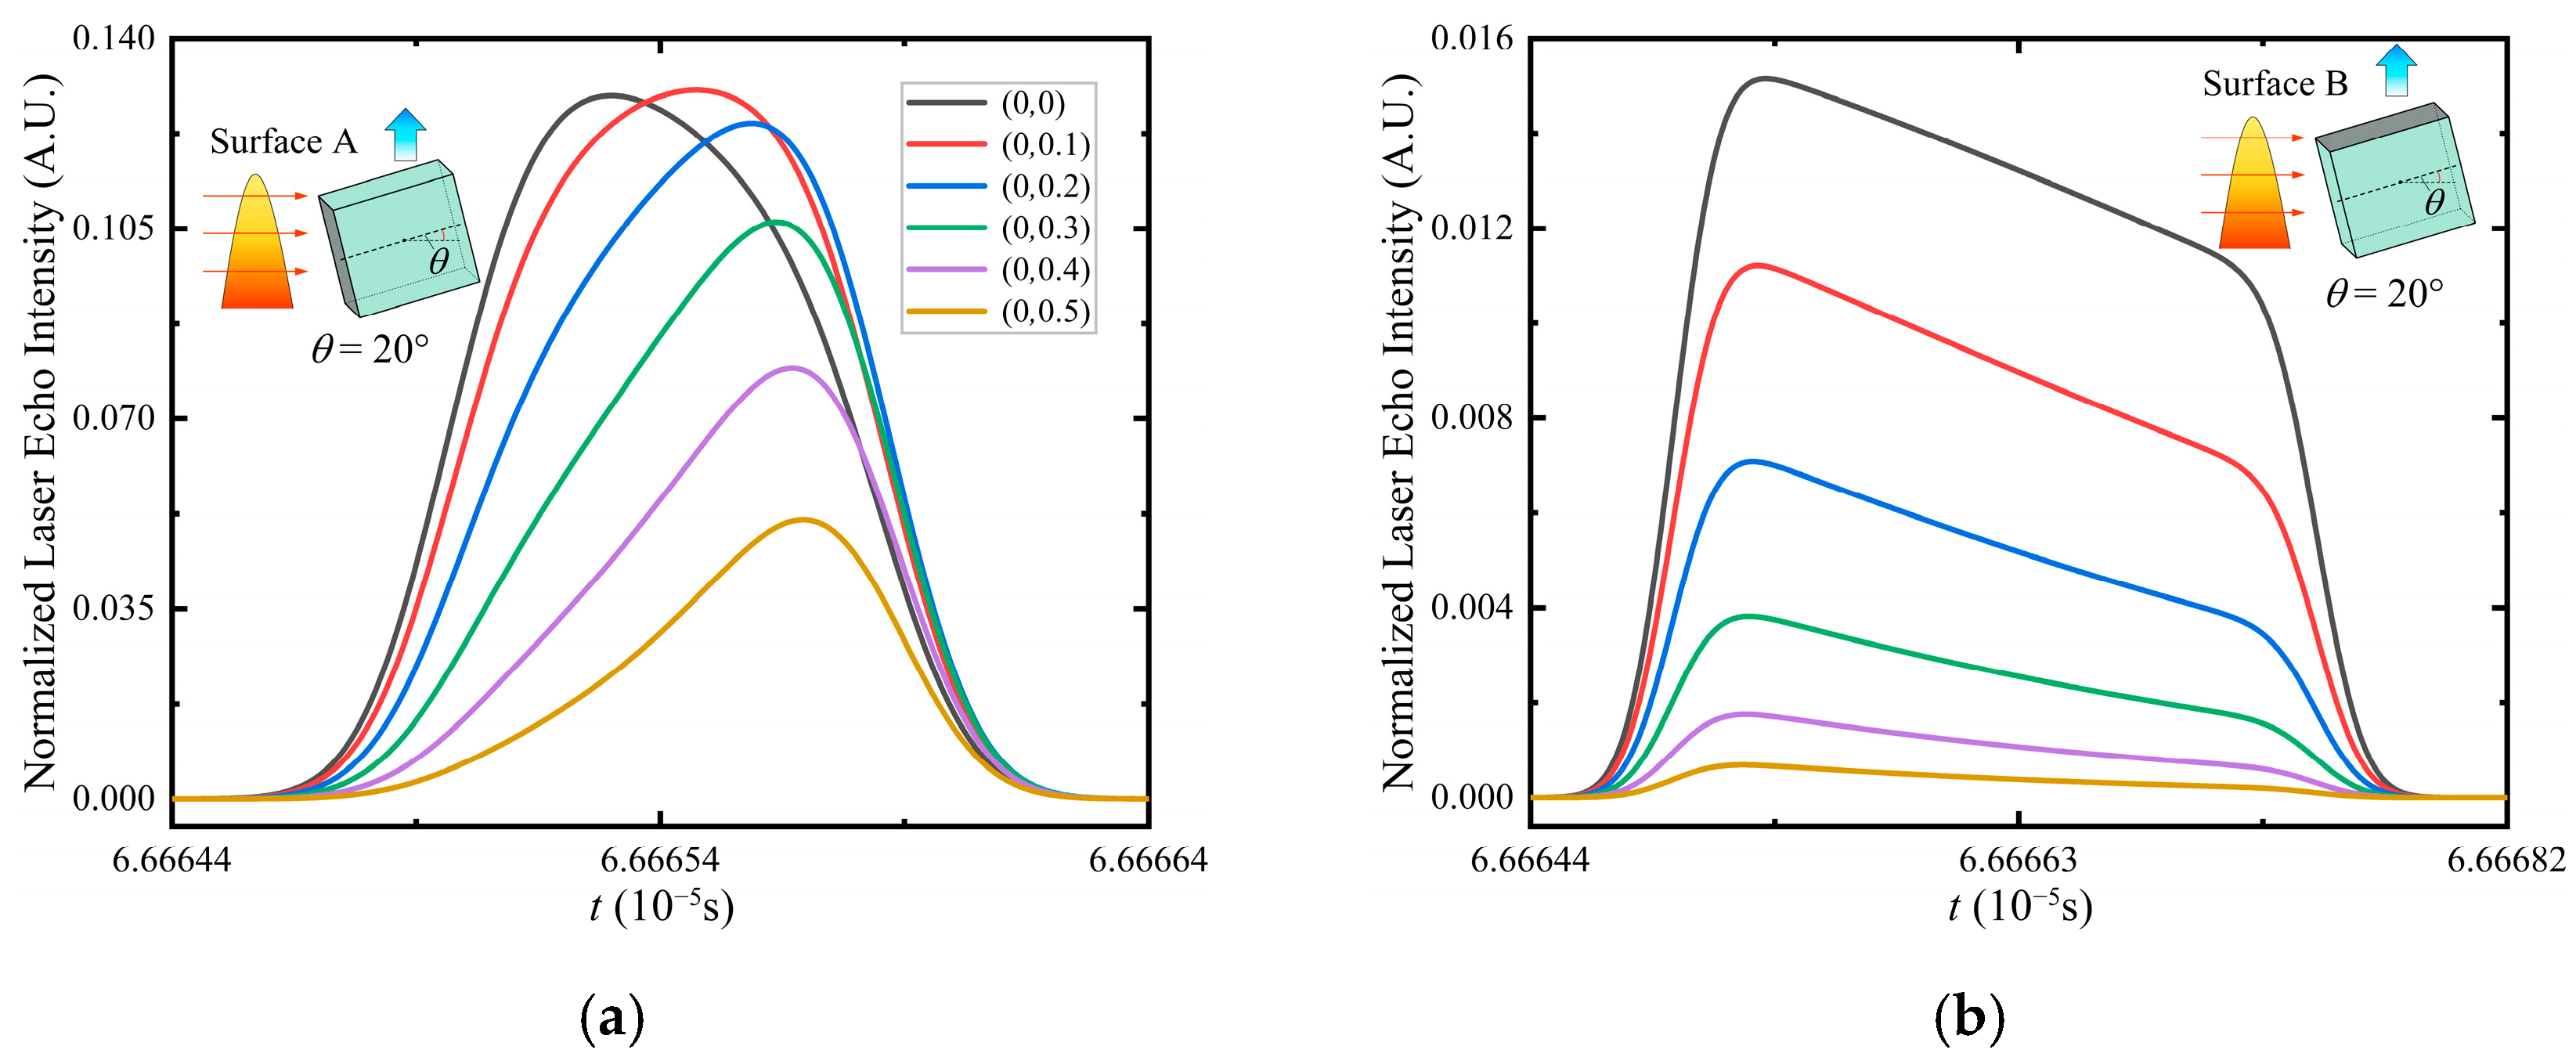
The inclination angles of surface A and B relative to the x O y   plane are θ   and 90 ° θ   respectively. Their center positions are ( 0 , a cos θ / 2 , a sin θ / 2 )   and ( 0 , a sin θ / 2 , a cos θ / 2 )   respectively. As the rotation angle increases, surface A exhibits a larger inclination angle while its center moves away from the laser spot center. Concurrently, its projected extent along the   z -axis lengthens, causing the echo to return to the receiver over an extended temporal window. Consequently, echo width broadening occurs alongside the reduction in peak intensity, as detailed in Figure 8a–f. During the rotation angle increase from   0 °   to   45 ° , the echo pulse width from Surface A gradually increased from 0.40 ns to 1.90 ns. Conversely, surface B experiences a decreasing inclination angle, with its center translating toward the laser spot center. Its echo waveform manifests inverse trends compared to surface A—specifically, temporal compression and rising peak intensity—as demonstrated in Figure 8b–f. Similarly, as the rotation angle of Surface B increased from 5° to 45°, its echo pulse width decreased from 2.73 ns to 1.90 ns.
Waveform evolution analysis in Figure 8 reveals that the peak in rectangular prism’s echo waveform (Figure 7a) originates primarily from surface A’s modulation. The intensity of peak diminishes with increasing rotation angle. Simultaneously, the long-tailed feature responsible for waveform broadening is predominantly governed by surface B modulation. The progressive transformation of surface B’s echo compresses the pulse width of the composite rectangular prism waveform throughout the 0 ° < θ 45 ° range.
At θ = 45 ° , both surfaces achieve symmetric positioning relative to the laser spot center. Backscattered energy from their distal regions experiences extended time delays when returning to the receiver, thereby imparting a distinct heavy-tailed characteristic to the rectangular prism’s echo waveform.
  • Regular hexagonal prism.
The echo waveforms of regular hexagonal prism across various rotation angles are presented in Figure 7b. Compared to rectangular prism, regular hexagonal prism possesses an additional reflective surface, resulting in significantly more complex evolution of its echo waveforms.
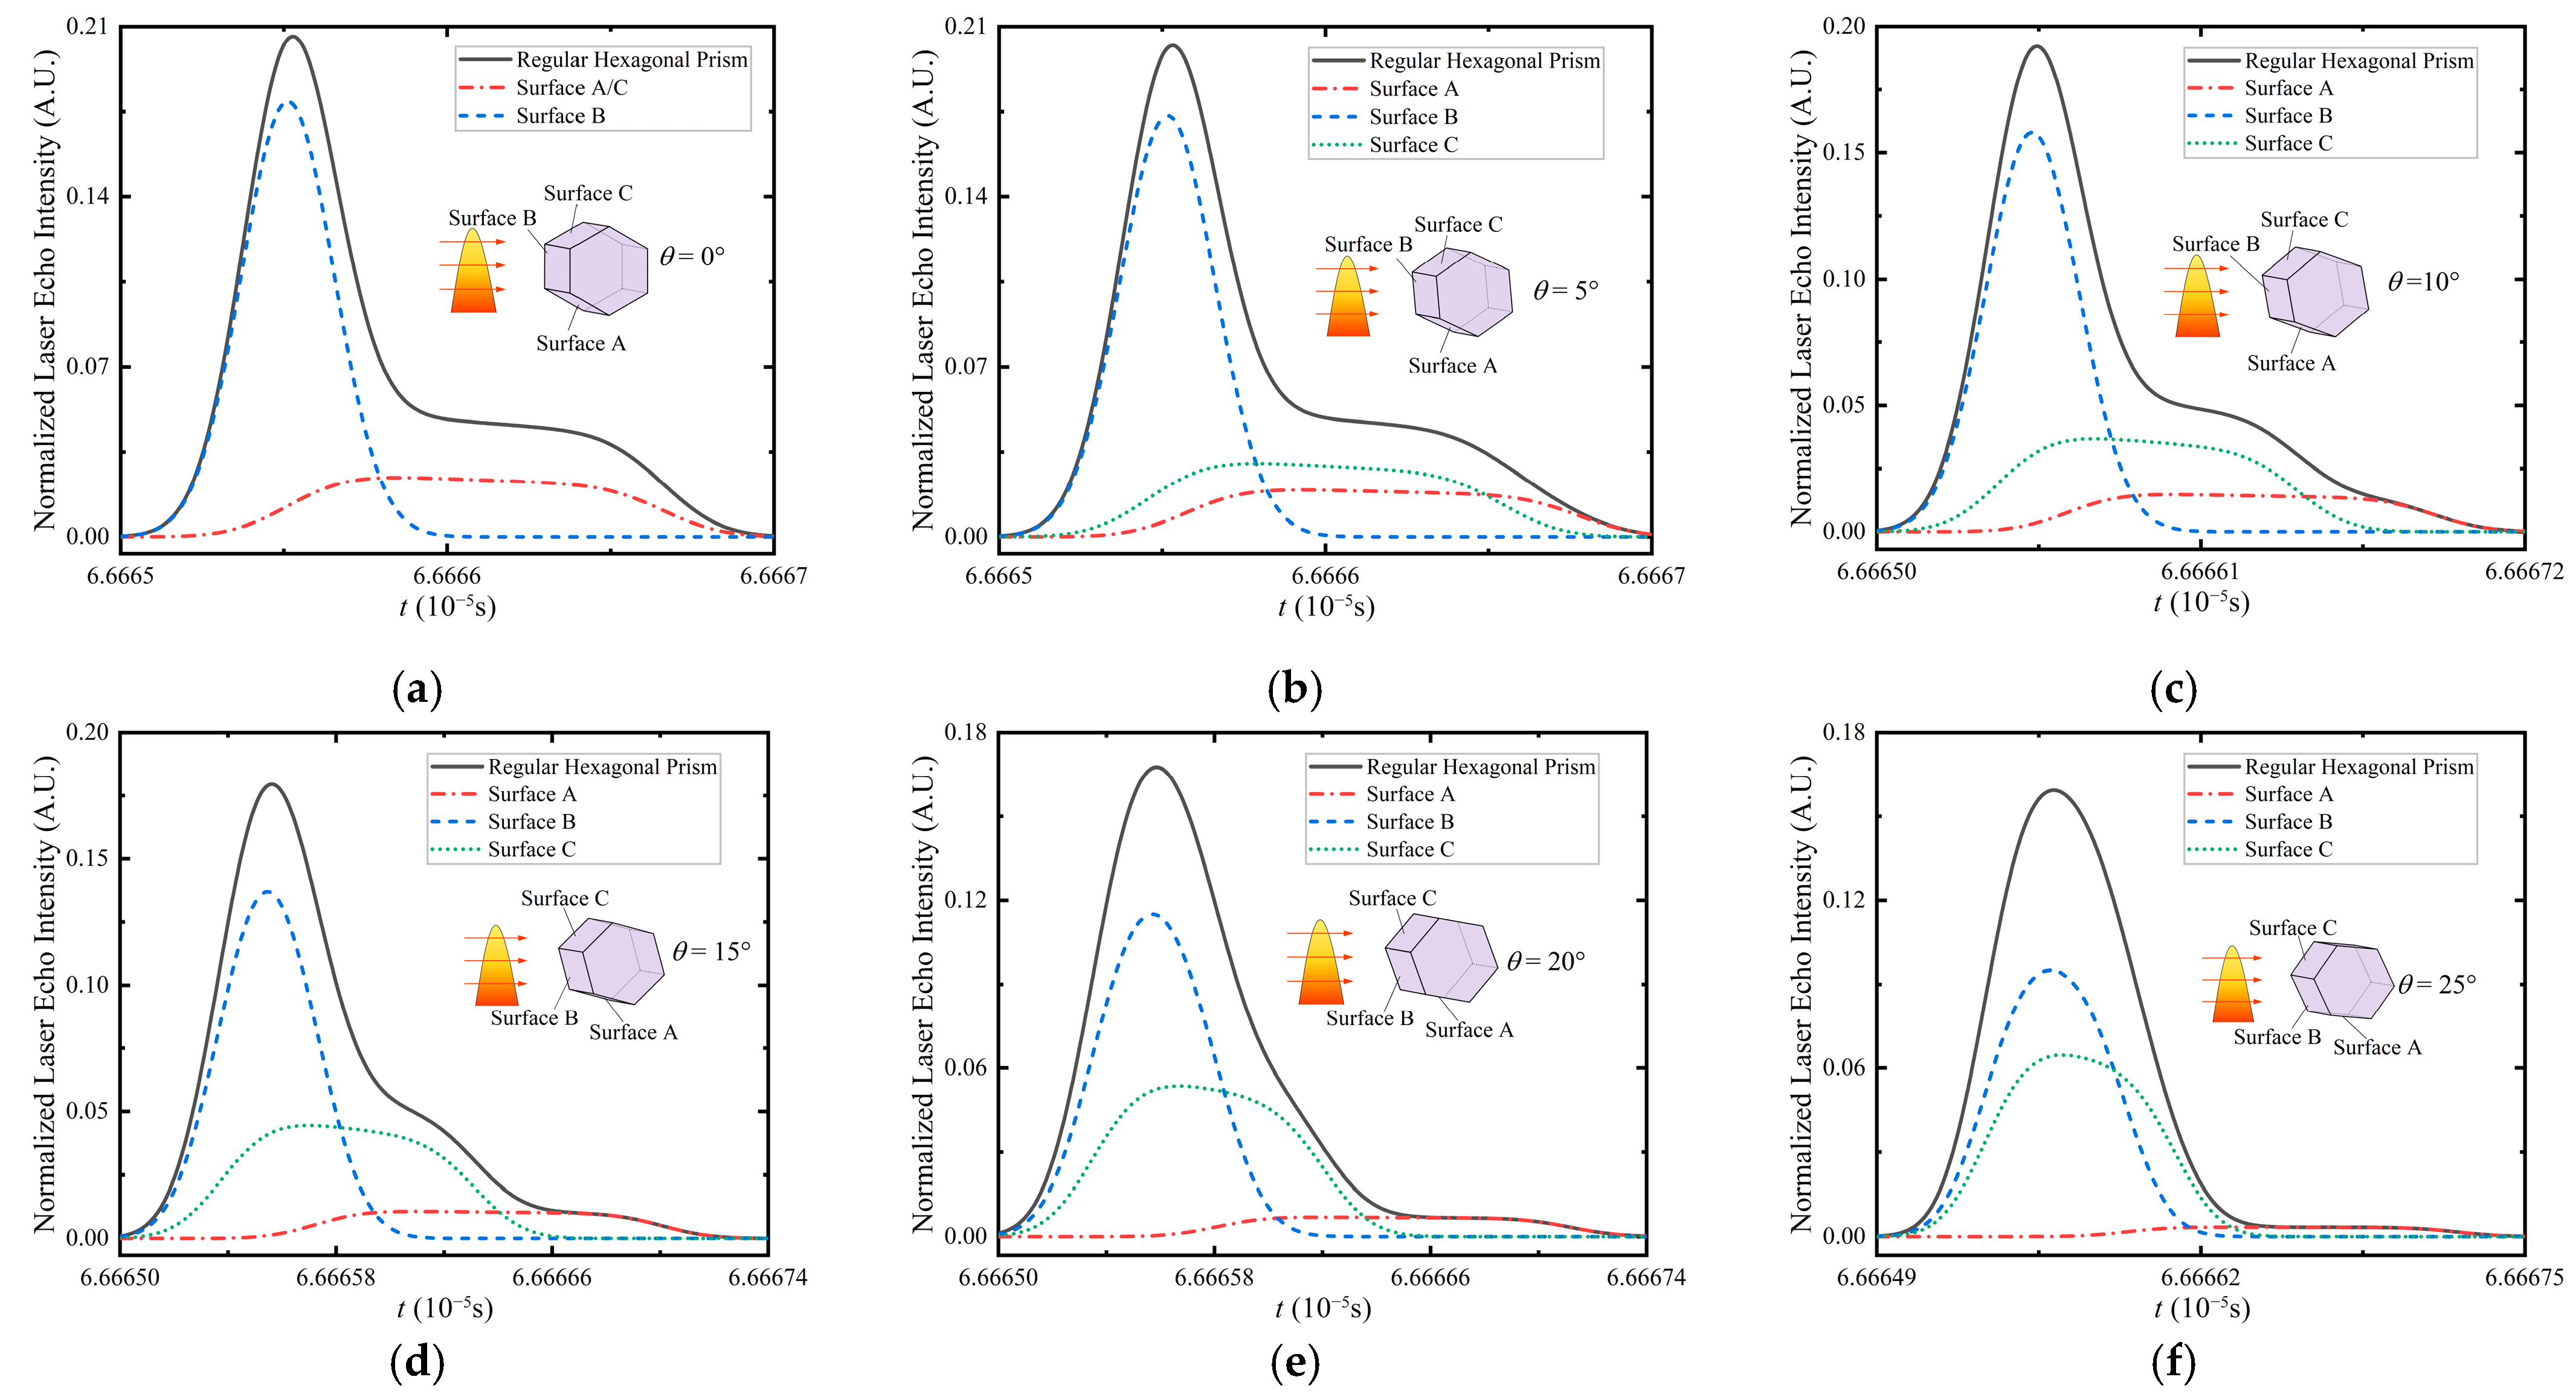
The center positions of surface A, B, and C are ( 0 , 3 d s i n ( 60 ° + θ ) / 2 , 3 d c o s ( 60 ° + θ ) / 2 ) , ( 0 , 3 d s i n θ / 2 , 3 d c o s θ / 2 ) , and ( 0 , 3 d s i n ( 60 ° θ ) / 2 , 3 d c o s ( 60 ° θ ) / 2 ) , respectively. Their inclination angles relative to the x O y -plane are 60 ° + θ , θ , and 60 ° θ , respectively. At θ = 0 ° , surface B is perpendicular to the laser incident direction, yielding a Gaussian shape echo waveform. Surface A and C form symmetric sloped rectangles, both generating identical heavy-tailed echo waveforms. The peak of regular hexagonal prism’s echo waveform primarily results from surface B’s modulation, while surface A and C produce a stepped descent following the peak (Figure 9a).
As rotation angle increases, surface A moves away from the laser spot center with increasing inclination angle and greater distance from the receiver. Consequently, its echo waveform undergoes temporal broadening, rightward shifting, and intensity reduction. Conversely, surface C exhibits opposite behavior, causing gradual separation of their respective echo waveforms. Surface B experiences similar modulation effects to surface A, manifesting as decreased intensity and increased pulse width. Within θ = 10 ° ~ 20 ° , the three distinct undulations in regular hexagonal prism’s echo waveform correspond to modulations from surface A, B, and C (Figure 9c–e). At θ = 25 ° , surface B and C approach symmetry about the laser spot center, generating similar echo waveforms; thus, the fluctuation in the right side of target’s echo waveform is reduced. Simultaneously, surface A reaches an   85 °   inclination angle with significant distance from the spot center, producing an elongated right-side feature.
When θ = 30 ° , surface A becomes occluded and receives no illumination. Complete symmetry between surface B and C results in a heavy-tailed echo waveform. The formation mechanism of this heavy-tailed characteristic parallels that observed in the rectangular prism at   45 °   rotation, as previously detailed.
Figure 7a,b and Figure A3a,b demonstrate that the modulated echo waveform of the prism with a greater number of reflecting surfaces is smoother. This results from the reduced differences in both inclination angle and positional offset between adjacent surfaces, which leads to a higher degree of similarity among their individual sub-echoes. Consequently, superposition of these sub-echoes yields a smoother composite echo waveform for prism.
Simultaneously, multiple reflective surfaces of the prism are distributed from the center to the periphery of the spot. Their inclination angles relative to the incident laser beam progressively decrease while their distances to the receiver progressively increase. The intensities of their respective sub-echoes diminish progressively, and the time delays of these sub-echoes increase sequentially. The superposition of these sub-echoes thus causes the modulated echo waveform of the prism to approximate a heavy-tailed shape. Furthermore, when the number of reflective surfaces on the prism approaches infinity, the structure effectively converges to a cylinder. The echo waveform of such a cylinder exhibits the heavy-tailed profile shown in Figure A3c. Therefore, each reflective surface of the prism can be regarded as a facet element of a cylinder. This prism-based analysis elucidates the mechanism by which cylinders modulate laser echo waveforms.
Furthermore, variations in modulated echo waveforms with prism dimensions across multiple rotation angles are detailed in the Supplementary Materials.

4.2.2. Cone

  • Influence of rotation angle on the variation in modulated echo waveform.
The corresponding echo waveforms across rotation angles are shown in Figure 7c. Visual inspection reveals significant angular variations in both pulse width and left-side intensity characteristics.
The pulse width of the cone’s echo correlates with the   z -axis projected length of the illuminated surface segment, since the incident laser pulse propagates along the   z   direction. For 0 ° θ α   ( 10 ° ), this projected length h 1   equals h cos α θ / cos α . Although pulse width should theoretically decrease with increasing θ , the illuminated region extending beyond distance   h   from the vertex point exhibits near-parallel incidence angles. Consequently, its backscattered energy returns over an extended temporal window with negligible detectable intensity. This explains why the pulse width at θ = 10 ° remains narrower than at θ = 0 ° in Figure 6a. For α < θ 90 ° α , the projected length h 1   reduces to h c o s θ 1 + t a n 2 α . Progressive pulse width compression occurs as θ   increases due to diminishing projection length. Within 90 ° α θ 90 ° , h 1   becomes h s i n α + θ 90 ° / c o s α + h c o s θ 1 + t a n 2 α . At   θ = 80 ° , this yields h c o s 80 ° 1 + t a n 2 α 0.1015   m , while at θ = 90 ° it approximates h t a n α = R = 0.1   m . Hence, nearly identical pulse widths are observed at these two angles.
The left-side intensity exhibits correlation with the incidence angle along the upper generatrix—the primary illumination region. As θ   increases from 0 °   to 80 ° , this incidence angle varies from 10 °   to 90 ° , concentrating the backscattered energy within shorter temporal intervals. This results in monotonically rising left-side intensity across the angular range.
  • Influence of target size under rotated condition.
Under rotational conditions, the illuminated portion of the conical lateral surface is depicted in Figure A4. The solid arc between points   J   and K   represents the bottom edge of the cone. Any straight line connecting the apex   O t   to an arbitrary point on this arc constitutes a generatrix of the cone. Although, in contrast to the non-rotated case, the angle   θ 1   between the   z -axis and the isosceles triangular micro-facet corresponding to each generatrix within the illuminated surface is no longer uniform, the conclusions derived from Equations (18)–(23) remain valid for individual micro-facet.
When 0 ° θ 90 ° α   and the cone dimensions are sufficiently small such that h < ω / 2   for all illuminated micro-facets, the backscattered intensity of each facet element increases monotonically within [ 2 z 0 / c ,   2 z 0 + R cos θ 1 / s in α / c ] . The cone’s echo intensity—being the superposition of these micro-facets’ contributions—retains monotonic growth over [ 2 z 0 / c ,   2 z 0 + R cos α + θ / s in α / c ]   (monotonic increase interval of the backscattered intensity for the micro-facet corresponding to the uppermost generatrix), peaks then decays within [ 2 z 0 + R cos α + θ / s in α / c ,   2 z 0 + h cos θ 1 + t a n 2 α / tan θ / c ]   (timestamps when backscattered energy from points   J   or   K   returns to the receiver, it can be derived via Equations (S16), (S39), and (S40) in Supplementary Materials).
For a cone with   α = 10 ° , at   θ = 30 °   and 60 ° , the echo waveform exhibits extended rise time due to 2 R cos α + θ / c s in α   exceeding 2 h cos θ 1 + t a n 2 α / tan θ R cos α + θ / s in α / c , manifesting as a gradual-rise and rapid-decay waveform. When h > ω / 2   holds for most illuminated micro-facets, cone’s echo intensity decays as R   (or h , the relationship between R   and h   is given by Equation (18)) increases, ultimately evolving into a heavy-tailed waveform—consistent with the pattern shown in Figure 10. Additionally, the z -axis projection length of the illuminated region is h c o s θ 1 + t a n 2 α . At R = 0.01   m   and θ = 60 ° , this length ( 0.0292   m ) falls below the incident pulse resolution limit, yielding a Gaussian-shaped waveform.
For computational efficiency, the peak’s temporal position is approximated as the return time of the backscattered pulse from the intersection of the upper generatrix and the plane y = ω / 2 , i.e., 2 z 0 + ω / 2 tan α + θ / c . For rotation angles of 30 ° and 60 ° , the calculated temporal positions of peak intensity were 6.66687 × 10 5 s   and 6.66673 × 10 5 s , respectively. These positions differed from the actual waveform’s temporal positions of peak intensity by only 0.1   n s , which is half the incident laser pulse width. This result validates the effectiveness of the approximate method proposed in this paper. Conversely, when θ > 90 ° α , backscattered energy from distal portions of micro-facets returns earlier, inverting the waveform evolution pattern (Figure A5a).
Due to the weak incident laser energy density outside twice the spot’s radius ( 2 ω ), newly added portions of the illuminated surface as the cone size increases will no longer alter the echo waveform once the cone extends beyond 2 ω . When θ = 0 °   or α < θ 90 ° , the distance r y   from the upper edge of the cone’s bottom surface to the spot center is given by R cos θ + sin θ / tan α . It can be approximately considered that the echo waveform stabilizes when r y > 2 ω . As shown in Figure 6b, Figure 10 and Figure A5a, for θ = 0 ° , 30 ° , 60 ° , and 90 ° , the echo waveforms stabilize beyond R = 1   m , 0.27   m , 0.19   m , and   0.17   m , respectively. At these points, the r y   values are 1   m , 0.994   m , 1.028   m , and 0.964   m , closely matching 2 ω   ( 1   m ). Beyond these thresholds, the echo waveforms for θ = 0 ° , 30 ° , and 60 °   maintain a heavy-tailed shape, while the waveform for θ = 90 °   exhibits an inverse heavy-tailed shape. Furthermore, for 0 ° < θ < α , when r y > 2 ω , the lower bottom surface edge of the cone remains within 2 ω   as the size increases. Consequently, a larger size is required before newly added portions of the irradiated surface cease to contribute to waveform changes. For instance, when θ = α , a significantly larger size is needed for the echo to transition to a heavy-tailed shape, as detailed in Figure A5b.

4.3. Position

4.3.1. Prisms

  • Dependence of echo waveform on target’s   x -coordinate.
Figure A6 displays the echo waveforms across various rotation angles for rectangular prism and regular hexagonal prism positioned at ( 0.5 ,   0 ,   0 ) . Comparative analysis of Figure A6 with Figure 7a,b reveals that altering the target’s   x -coordinate induces solely isotropic attenuation in echo intensity while preserving the original waveform morphology. Critically, this positional variation does not affect waveform modulation characteristics observed during target rotation.
When the prism is positioned at x 0 ,   0 ,   0 , the aggregate backscattered energy from all points on the reflection surface at y = y   is denoted as E x 0 , y . It follows from the energy distribution of the incident laser that
E x 0 , y = 2 ρ 0 P t π ω 2 e x p 2 y 2 ω 2 x 0 b / 2 x 0 + b / 2 e x p 2 x 2 ω 2 d x = ρ 0 P t π ω π 2 e x p 2 y 2 ω 2 e r f 2 ω x 0 + b / 2 e r f 2 ω x 0 b / 2
Similarly, when the prism is positioned at the coordinate origin O , the total energy incident upon points at y = y   is   E 0 , y . The ratio k   of E 0 , y   to E x 0 , y   is defined as
k = E 0 , y E x 0 , y = 2 e r f 2 b 2 ω e r f 2 ω x 0 + b 2 e r f 2 ω x 0 b 2
Given that b   and x 0   are known,   k   is therefore a constant. Since the reflective surface of the prism is rectangular and parallel to the   x -axis, its projection onto the y O z   plane is a line segment. Consequently, all points sharing an identical   y -coordinate on this surface will correspond to the same z -coordinate. This geometric property implies that the backscattered laser energy from such points will return to the receiver at precisely the same time instant. As established by the preceding derivation, after the prism undergoes a displacement x 0   along the   x -axis, the ratio of the backscattered energy received at any given time relative to its value at O   remains constant and equal to k . Therefore, the echo waveform originating from the prism located at x 0 ,   0 ,   0   differs from the echo waveform at the O   exclusively by undergoing a uniform scaling (attenuation) by the factor k .
  • Dependence of echo waveform on target’s   y -coordinate.
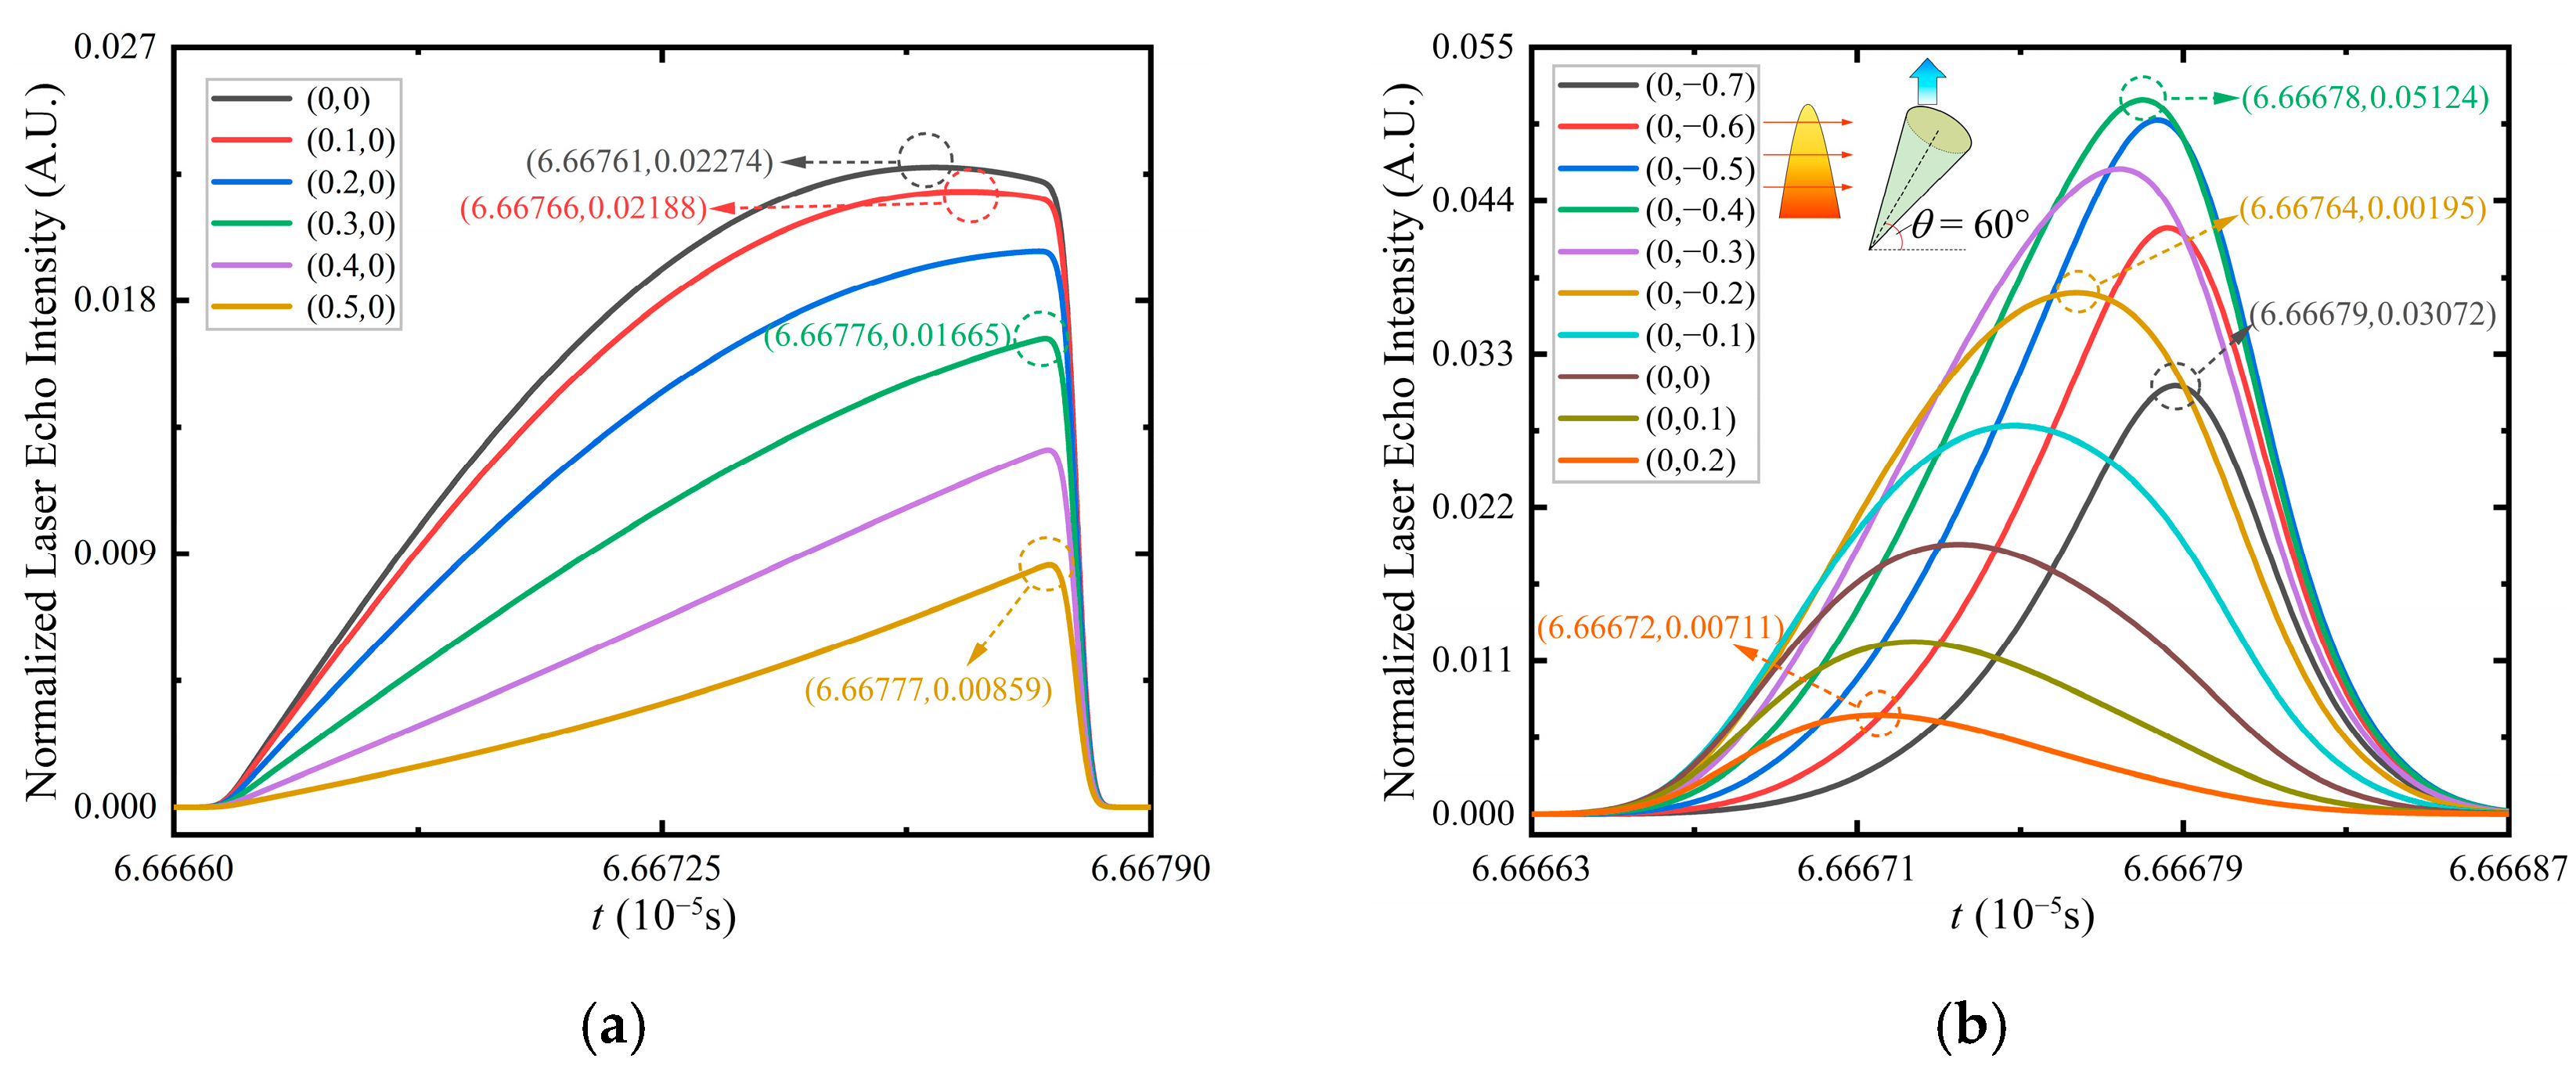
Based on the preceding analysis of the echo waveform from prism, it is evident that, as the target moves from point   O   to the periphery of laser spot, the portions of surface A farther from the receiver become progressively closer to the spot center. Consequently, the temporal positions of peak intensity from both surface A and rectangular prism exhibit a rightward shift (as seen in Figure 11a and Figure A7a). Conversely, surface B consistently maintains the region closest to the receiver as the part nearest to the laser spot. Therefore, the waveform associated with surface B, corresponding to the tail section of the rectangular prism’s composite echo, appeared to manifest only linear scaling changes in echo intensity (Figure 11a and Figure A7b). For regular hexagonal prism, the waveform variations and underlying mechanisms of surfaces A and B (Figure A8a,b) mirror those of the rectangular prism’s surface A (Figure A7a). This leads to a rightward shift in the temporal position of peak intensity and a rising tail in the hexagonal prism’s echo waveform (Figure 11b). Meanwhile, the waveform behavior of surface C (Figure A8c) aligns with the rectangular prism’s surface B (Figure A7b), manifesting as a decrease in echo intensity within the mid-section of the hexagonal prism’s waveform. After moving a certain distance, surface C becomes the reflection surface farthest from the spot, causing its echo intensity to diminish below observable levels. Consequently, the hexagonal prism’s echo waveform ultimately reflects modulation primarily from surfaces A and B.
Regarding prisms in general, when moving along the   y -axis, reflective surfaces whose normal vectors form an angle less than   90 °   with the direction of motion will exhibit waveform variation characteristics analogous to surface A of rectangular prism. Conversely, surfaces whose normal vectors form an angle more than   90 °   with the direction of motion will exhibit waveform variation characteristics analogous to surface B of a rectangular prism. The underlying cause stems from alterations in the spot’s energy distribution across the reflection surfaces, which modify the echo energy contributions from surface portions at varying distances from the receiver. This observation aligns with the variation patterns of tilted rectangles established in our prior work, thereby validating the accuracy of our prism analysis and simulations. Furthermore, since the projected length of the prisms along the z -axis remains constant, the width of the echo waveforms shows no change.

4.3.2. Cone

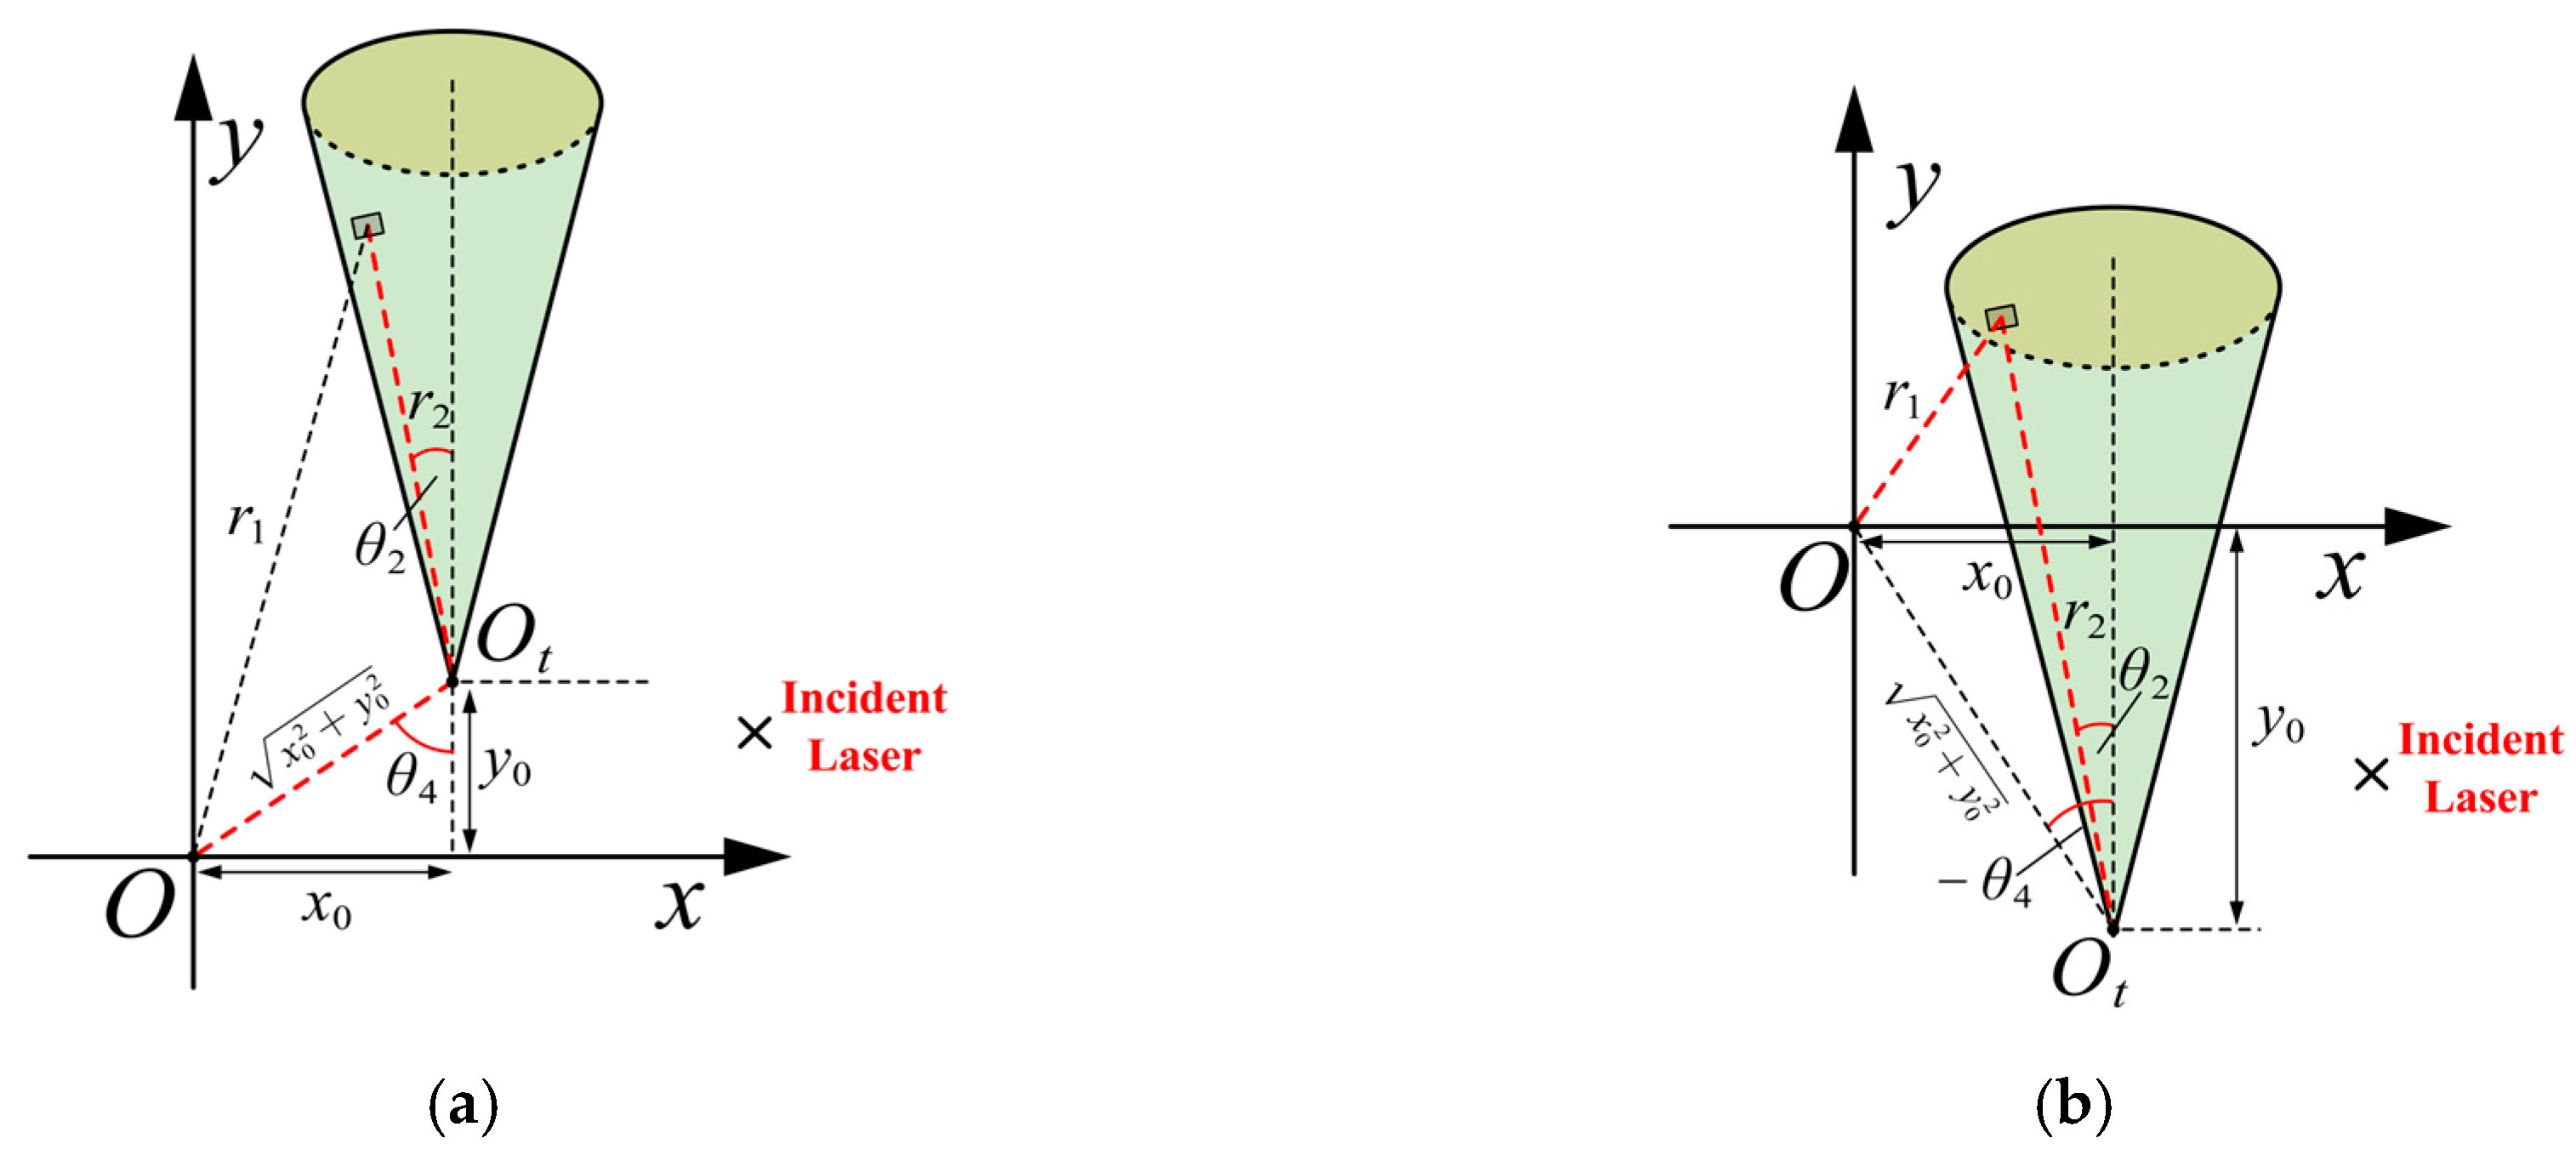
Similar to the scenario where the cone is positioned at O , when the cone’s location changes, the variation in its echo waveform can likewise be analyzed from the perspective of micro-facets. Given that the echo waveforms produced when the cone is located at x 0 ,   y 0 ,   0   and x 0 ,   y 0 ,   0   exhibit identical relative positioning with respect to the laser spot, we henceforth consider only the case where x 0 > 0 . As illustrated in Figure A1c, assuming the rotational center of the cone is located at O t x 0 ,   y 0 ,   0 , let the angle between the generatrix of the illuminated conical section and line l   be denoted θ 1 . Line l   can be represented as
l :   x = x 0 y = y 0
As shown in Figure A9, the angle between the projection of this generatrix onto the x O y   plane and the plane defined by x = x 0   is θ 2 .   θ 4   is the angle between the line segment O O t ¯   and the plane x = x 0 . The backscattering segment on the micro-facet corresponding to this generatrix, located at a distance r 2   from line l , can similarly be approximated as a rectangle. The derivation of the subsequent backscattered intensity and its variation for the rectangular micro-facet is provided in the Supplementary Materials.
  • Dependence of echo waveform on target’s x -coordinate.
After cone undergoes the displacement x 0 along x -axis, the value of r 2   at which the backscattered intensity from a single micro-facet attains its peak is determined by
r 2 = x 0 sin θ 2 + ω 2 + x 0 2 s i n 2 θ 2 2
The temporal location of peak intensity for micro-facet, t m a x , corresponding to Equation (27), is determined by
t m a x = x 0 sin θ 2 + ω 2 + x 0 2 s i n 2 θ 2 tan θ 1 + 2 z 0 c
As indicated by Equation (28), the temporal location of peak intensity for each micro-facet progressively shifts rightward with increasing x 0 . Since the modulated echo waveform of cone results from the superposition of sub-echo waveforms from all illuminated micro-facets, the peak of the cone’s modulated echo waveform will consequently exhibit a rightward shift as x 0 increases, as depicted in Figure 12a.
Under specific conditions, the cone’s echo waveform exhibits only a reduction in intensity as x 0   increases. In the non-rotated case, while x 0   increases from 0   to 0.5   m , calculations show that the r 2   corresponding to the peak backscattered intensity of the micro-facets ranges from 0.25   to 0.60   m . For smaller cones, the distance from each micro-facet to line   l   will not exceed   0.25   m   ( ω / 2 ). Consequently, the backscattered intensity from each facet element increases monotonically within the temporal interval t [ 2 z / c , 2 ( z 0 + h ) / c ] . Given that all micro-facets generate identical sub-echo waveforms, the superposition process preserves the temporal position of cone’s peak intensity, as illustrated in Figure A10a. Under large rotation angles, the minimal variation in   sin θ 2   renders peak temporal shifts imperceptible. For instance, at θ = 60 ° , the range of r 2   corresponding to peak intensities across different x 0   displacements is 0.25   to 0.3   m . This exhibits a relatively small deviation from the r 2 = 0.25   m solution at the origin O , thereby confirming the invariant position of cone’s peak intensity, as detailed in Figure A10b.
  • Dependence of echo waveform on target’s y -coordinate.
When cone undergoes the translation of distance y 0   along y -axis, the value of r 2   at which the backscattered intensity of a single micro-facet achieves its peak is given by
r 2 = y 0 cos θ 2 + ω 2 + y 0 2 c o s 2 θ 2 2
The temporal location of peak intensity for micro-facet, t m a x , corresponding to Equation (29), is determined by
t m a x = y 0 cos θ 2 + ω 2 + y 0 2 c o s 2 θ 2 tan θ 1 + 2 z 0 c
As derived from Equation (30), the temporal position of peak intensity for each facet element progressively shifts earlier with increasing y 0 . Consequently, the modulated conical echo waveform exhibits leftward peak shifting as y 0 increases, as demonstrated in Figure 12b.
Furthermore, under non-rotated conditions, translational displacements along the x - and y -axes produce equivalent relative spot displacement on the conical target. This geometric equivalence renders separate analysis unnecessary for the y -axis translation case.

5. Discussion

As described in this paper, we analyzed the modulation mechanisms by which factors such as target shape, size, attitude, and position influence the echo waveform. The aim was to identify and summarize characteristic variations in the waveform in order to invert the geometric parameters of the target in subsequent work by combining the echo waveform formulation. Subsequently, by examining the variations in echo waveform characteristics across different targets, we selected features that are useful for target discrimination and characteristic parameter inversion.

5.1. Target Discrimination

Target discrimination serves as the foundation for target inversion. In the context of remote detection, the target may occupy only a single pixel or a few pixels of an optical sensor, which poses a significant challenge to long-range target discrimination. Utilizing the variation patterns of the target’s laser echo waveform to infer its shape offers a feasible approach to address this difficulty [38]. Grounded in the analytical framework of this paper, the following discussion addresses two predominant operational scenarios, namely, the translational and rotational motion of targets. A comparative analysis of the echo features among representative targets is subsequently presented.
When a target rotates within the detector’s field of view, a comparison of Figure 7a–c reveals differences in the relative variation range of peak intensity and the number of fluctuations on the right side of the waveform between a rectangular prism and a regular hexagonal prism of similar size at different angles. In contrast, the cone exhibits significant shifts in the temporal position of peak intensity alongside changes in waveform width. Furthermore, experimental waveforms from Section 3.2 indicate that the higher-order nonlinear response of the detection system can attenuate features on the right side of the target waveform. Therefore, the relative variation range of peak intensity and the temporal position of peak intensity serve as critical features for discriminating among these three types of typical targets. Additionally, if the target undergoes continuous rotation, target discrimination can also be achieved by comparing the periodicity of variations in the echo waveform.
For the target in translational motion, we consider a simple scenario where a non-rotated target passes through the center of the detector’s field of view. The echo waveform of the rectangular prism maintains a Gaussian shape. In contrast, the echo from a regular hexagonal prism exhibits significant broadening, and a secondary peak with varying intensity may appear on the right side of the waveform as the target’s y-coordinate changes. Meanwhile, the cone shows no change in echo pulse width but demonstrates a noticeable shift in the temporal position of the peak intensity. According to previous studies [8], at positions symmetric with respect to the detector center, the echo waveforms of two-dimensional targets exhibit left-right symmetry, whereas the waveforms of the aforementioned three-dimensional targets coincide under symmetric conditions.

5.2. Inversion of Target Characteristic Parameters

Building upon target discrimination, echo waveform parameters—such as peak intensity and its temporal position—are selected to construct a coupled system of equations based on the corresponding echo waveform models of the targets. By decoupling this system, the geometric parameters of the target can be retrieved. This approach provides a method for estimating the geometric attributes of a target. In the case of two-dimensional targets, decoupling can be achieved using a limited number of echo parameters acquired from multiple positions. In contrast, the reflective surfaces of three-dimensional targets introduce greater complexity, necessitating the integration of variation patterns in echo characteristics to achieve reliable estimation of their geometric parameters.
Taking the translational motion of a non-rotated cone as an example, once the target size exceeds half the beam radius ( ω / 2 ), both its peak intensity and the temporal position of the peak intensity remain unchanged. Through decoupling, it is possible to accurately estimate the half-cone angle α   of the cone, whereas effectively estimating its base radius   R   remains challenging. Due to potential distortion on the right side of the actual echo waveform, calculating the time width of the rising edge on the left side (denoted as ω / c tan α ) from the measured waveform may provide a feasible method for estimating the base radius   R .
Through the preliminary discussion above and the preceding analysis, it can be observed that features such as peak intensity, the temporal position of the peak intensity, and the left or right skewing of the echo peak are relatively important for both target discrimination and feature parameter inversion. Furthermore, the analysis of echo waveforms in this study remains primarily descriptive and has not yet involved the construction of mathematical relationships or functional models between specific waveform characteristics and target features, which represents a limitation of this work. In future studies, we will address this limitation to achieve inversion of 3D target characteristics.

6. Conclusions

This paper focuses on 3D targets, deriving mathematical formulas of the laser pulse echo waveform modulated by three typical targets: a rectangular prism, a regular hexagonal prism, and a cone. Based on these formulas, we simulated the echo waveforms and investigated their dependence on the size, orientation of target, and target position relative to the laser beam. This work lays a theoretical foundation for the inversion of 3D targets’ feature parameters in subsequent studies. These targets are similar in shape to the roofs of buildings in European regions, and space debris such as defunct satellites and space debris are also largely composed of them. An in-depth investigation into their modulation mechanisms on laser pulse echoes is of critical importance. This will facilitate the application of FW-LiDAR across multiple domains, ranging from terrain mapping and building identification to deep-space exploration and space debris removal, while concurrently holding significant implications for enhancing the performance and accuracy of relevant technologies. Although the analytical formulas still contain integration operations, the simulation process of the echo waveform has been greatly simplified. Moreover, integration does not hinder the inversion of the analytical formulas to obtain target’s multi-dimensional characteristic parameters.
The formula of the echo waveform modulated by other three-dimensional targets and their modulation on the echo waveform can be derived and studied, respectively, following the procedure illustrated in this paper. Establishing a comprehensive simulated echo database and distinguishing target shapes/retrieving target characteristics based on echo waveform features constitute our forthcoming work. Through the analysis of the modulation mechanisms of typical three-dimensional targets, it has been observed that certain key characteristic patterns play an essential role in target feature inversion. For instance, the echo waveform variations at different positions during the conical motion can be utilized to invert its base radius, while the waveform changes in a prism at various rotation angles can help determine the number of its reflective surfaces. Furthermore, based on the derived analytical expressions of the echo waveform, it is possible to establish coupling relationships between echo indicators—such as peak intensity, pulse width, and peak position—and target characteristics including size, location, and orientation. Subsequently, nonlinear fitting and other decoupling algorithms can be designed to achieve target feature inversion from laser echo waveforms. The derived analytical formulas for echo waveforms in this study, along with the identified variation patterns of echo waveforms with respect to target characteristics, will serve as the theoretical foundation for this endeavor.

Supplementary Materials

The following supporting information can be downloaded at https://www.mdpi.com/article/10.3390/rs17203419/s1.

Author Contributions

Conceptualization, Y.W., Y.H. and Y.X.; methodology, Y.W. and J.F.; software, J.F.; validation, X.Z. and F.H.; formal analysis, Y.W. and J.F.; writing—original draft preparation, Y.W.; writing—review and editing, J.F., X.Z., S.X. and Y.H. All authors have read and agreed to the published version of the manuscript.

Funding

This research was funded by the Cornerstone Foundation Program of National University of Defense Technology (JS25-08), Research Plan Project of the National University of Defense Technology (Grant No. 24-ZZCX-JDZ-43, 22-ZZCX-07, and ZK23-45) and Hunan Provincial Innovation Foundation for postgraduate (XJJC2024049).

Data Availability Statement

This article did not create or use any datasets.

Acknowledgments

The authors have reviewed and edited the output and take full responsibility for the content of this publication.

Conflicts of Interest

The authors declare no conflicts of interest.

Appendix A

Figure A1. Schematic diagram of micro-facet on the cone: (a) Non-rotated. (b) Rotation about   x -axis Regular hexagonal prism. (c) Position offset from origin O . Red isosceles triangle denotes micro-facet, and black shaded region represents rectangular strip.
Remotesensing 17 03419 g0a1
Figure A2. Bottom radius dependence of echo waveform modulated by cone: (a) α = 20 ° ; (b) α = 40 ° ; (c) α = 60 ° ; (d) α = 80 ° . α   is the semi-cone angle of cones, and R   is the radius of the bottom of cones.
Remotesensing 17 03419 g0a2
Figure A3. Modulated echo waveforms of prisms and cylinder at various angles: (a) The number of surfaces is 8. (b) The number of surfaces is 12. (c) Cylinder.
Remotesensing 17 03419 g0a3
Figure A4. The sketch of the rotated cone. O t   is the vertex of the cone, R   is the radius of its base, and θ   is the rotated angle. Points J   and K   denote the intersections of the cone’s outermost generatrices with the base plane on the irradiated surface.
Remotesensing 17 03419 g0a4
Figure A5. Bottom radius dependence of the echo waveform modulated by cone with α =   10°: (a) θ =   10°; (b) θ =   90°. α   is the semi-cone angle of cones, and R   is the radius of the bottom of cones.
Remotesensing 17 03419 g0a5
Figure A6. Echo waveforms across various rotation angles modulated by (a) rectangular prism and (b) regular hexagonal prism at 0.5 ,   0 ,   0 . a   is the edge length of the prisms’ base, and b   is the height of prisms. For rectangular prism, b = a , a = 0.4   m , while, for the regular hexagonal prism, b = 2 a , a = 0.2   m .
Remotesensing 17 03419 g0a6
Figure A7. Dependence of the modulated echo waveform on   y -coordinate of rectangular prism’s position: (a) Surface A. (b) Surface B. a   is the edge length of the rectangular prism’s base, and b   is the height of the rectangular prism. The rectangular prism has a = 0.4   m and b = a .
Remotesensing 17 03419 g0a7
Figure A8. Dependence of the modulated echo waveform on   y -coordinate of regular hexagonal prism’s position: (a) Surface A. (b) Surface B. (c) Surface C. a   is the edge length of the regular hexagonal prism’s base, and b   is the height of the regular hexagonal prism. The regular hexagonal prism has a = 0.2   m and b = 2 a . The blue arrow indicates the direction of movement of the regular hexagonal prism.
Remotesensing 17 03419 g0a8
Figure A9. Schematic diagram of conical projections on the   x O y -plane under varying positions (viewing direction along the   z -axis): (a) y 0 < 0 ; (b) y 0 0 . The schematic representation of laser incidence direction “ × ” adopts the convention of magnetic field lines.
Remotesensing 17 03419 g0a9
Figure A10. Dependence of the cone’s modulated echo waveform on position: (a) Non-rotated cone with R = 0.1   m   translates along the x -axis. (b) Cone with R = 0.1   m   rotated at θ = 60 °   translates along the x -axis. Cones above both have α = 10 ° .   α   is the semi-cone angle of cones, and R   is the radius of the bottom of cones.
Remotesensing 17 03419 g0a10

References

  1. Blair, J.B.; Hofton, M.A. Modeling laser altimeter return waveforms over complex vegetation using high-resolution elevation data. Geophys. Res. Lett. 1999, 26, 2509–2512. [Google Scholar] [CrossRef]
  2. Guo, Y.L.; Hu, Y.H.; Fang, J.J.; Xu, S.L.; Zhang, X.Y. Research status and development trend of LiDAR super resolution imaging technology. J. Radars 2025, 3, 2095–2283X. [Google Scholar]
  3. Zhang, X.Y.; Shan, L.Q.; Fang, J.J.; Guo, R.; Xu, S.L.; Wang, Y.C.; Guo, Y.L.; Yang, X.; Han, F.; Hu, Y.H. Super-resolution Imaging Using Reflective Tomography LiDAR over 10 km. Adv. Imaging 2025, 2, 051002. [Google Scholar] [CrossRef]
  4. Li, Y.H.; Wu, Z.S. Target recognition using subnanosecond pulse laser range profiles. Opt. Express 2010, 18, 16788–16796. [Google Scholar] [CrossRef] [PubMed]
  5. Hao, Q.; Cheng, Y.; Cao, J.; Zhang, F.H.; Zhang, X.M.; Yu, H.Y. Analytical and numerical approaches to study echo laser pulse profile affected by target and atmospheric turbulence. Opt. Express 2016, 24, 25026–25042. [Google Scholar] [CrossRef]
  6. Steinvall, O. A review of laser range profiling for target recognition. Encycl. Mod. Opt. 2018, 4, 474–495. [Google Scholar]
  7. Xu, X.B.; Zhang, H.; Luo, M.Z.; Tan, Z.Y.; Zhang, M.; Yang, H.; Li, Z.H. Research on target echo characteristics and ranging accuracy for laser radar. Infrared Phys. Technol. 2019, 96, 330–339. [Google Scholar] [CrossRef]
  8. Hu, Y.H.; Hou, A.H.; Ma, Q.L.; Zhao, N.X.; Xu, S.L.; Fang, J.J. Analytical formula to investigate the modulation of sloped targets using LiDAR waveform. IEEE Trans. Geosci. Remote Sens. 2022, 60, 5700512. [Google Scholar] [CrossRef]
  9. Wagner, W.; Ullrich, A.; Ducic, V.; Melzer, T.; Studnicka, N. Gaussian decomposition and calibration of a novel small-footprint full-waveform digitizing airborne laser scanner. ISPRS J. Photogramm. Remote Sens. 2006, 60, 100–112. [Google Scholar] [CrossRef]
  10. Mallet, C.; Bretar, F. Full-Waveform Topographic Lidar: State-of-the-Art. ISPRS J. Photogramm. Remote Sens. 2009, 64, 1–16. [Google Scholar] [CrossRef]
  11. Park, S.; Jung, H.; Lee, S.; Kim, E. Mapping Forest Vertical Structure in Sogwang-ri Forest from Full-Waveform Lidar Point Clouds Using Deep Neural Network. Remote Sens. 2021, 13, 3736. [Google Scholar] [CrossRef]
  12. Zhao, G.P.; Arturo, S.; Kati, L.; Sun, C.L.; Fei, L.K. Hyperspectral and Full-Waveform LiDAR Improve Mapping of Tropical Dry Forest’s Successional Stages. Remote Sens. 2021, 13, 3830. [Google Scholar] [CrossRef]
  13. Nicolas, D.; Dennis, L.M. Bridging the Gap: Comprehensive Boreal Forest Complexity Mapping through LVIS Full-Waveform LiDAR, Single-Year and Time Series Landsat Imagery. Remote Sens. 2023, 15, 5274. [Google Scholar]
  14. Canuto, M.A.; Estrada-Belli, F.; Garrison, T.G. Ancient lowland Maya complexity as revealed by airborne laser scanning of northern Guatemala. Science 2018, 361, 6409. [Google Scholar] [CrossRef] [PubMed]
  15. Luo, L.; Wang, X.Y.; Guo, H.D. Airborne and spaceborne remote sensing for archaeological and cultural heritage applications: A review of the century (1907–2017). Remote Sens. Environ. 2019, 232, 111280. [Google Scholar] [CrossRef]
  16. Inomata, T.; Triadan, D.; López, V.A.V. Monumental architecture at aguada Fénix and the rise of Maya civilization. Nature 2020, 582, 7813. [Google Scholar] [CrossRef]
  17. Bachagha, N.; Wang, X.Y.; Luo, L.; Li, L.; Khatteli, H.; Lasaponara, R. Remote sensing and GIS techniques for reconstructing the military fort system on the Roman boundary (Tunisian section) and identifying archaeological sites. Remote Sens. Environ. 2020, 236, 111418. [Google Scholar] [CrossRef]
  18. Hovi, A.; Korpela, I. Real and simulated waveform-recording LiDAR data in juvenile boreal forest vegetation. Remote Sens. Environ. 2014, 140, 665–678. [Google Scholar] [CrossRef]
  19. András, Z.; Anke, S.; Adam, K.; Deák, B.; Werner, M.; Ágnes, V.; Balázs, S.; Norbert, P. Categorizing Grassland Vegetation with Full-Waveform Airborne Laser Scanning: A Feasibility Study for Detecting Natura 2000 Habitat Types. Remote Sens. 2014, 6, 8056–8087. [Google Scholar]
  20. Dargie, G.C.; Lewis, S.L.; Lawson, I.T.; Mitchard, E.T.A.; Page, S.E.; Bocko, Y.E.; Ifo, S.A. Age, extent and carbon storage of the central Congo Basin peatland complex. Nature 2017, 542, 86–90. [Google Scholar] [CrossRef]
  21. Pablo, C.; Luis, A.R. A Full-Waveform Airborne Laser Scanning Metric Extraction Tool for Forest Structure Modelling. Do Scan Angle and Radio-metric Correction Matter. Remote Sens. 2020, 12, 292. [Google Scholar]
  22. Sumnall, M.J.; Hill, R.A.; Hinsley, S.A. Towards Forest Condition Assessment: Evaluating Small-Footprint Full-Waveform Airborne Laser Scanning Data for Deriving Forest Structural and Compositional Metrics. Remote Sens. 2022, 14, 5081. [Google Scholar] [CrossRef]
  23. Steinvall, O.; Chevalier, T.; Grönwall, C. Simulation and modeling of laser range profiling and imaging of small surface vessels. Opt. Eng. 2014, 53, 013109. [Google Scholar] [CrossRef]
  24. Steinvall, O.; Tulldahl, M. Laser range profiling for small target recognition. Opt. Eng. 2017, 56, 031206. [Google Scholar] [CrossRef]
  25. Steinvall, O.; Tulldahl, M.; Berglund, F.; Allard, L. Laser profiling for airborne target classification. In Proceedings of the SPIE, 23nd Laser Radar Technology and Applications, Orlando, FL, USA, 7–12 May 2018; Volume 10636, p. 1063602. [Google Scholar]
  26. Ma, H.; Song, J.L.; Wang, J.D. Forest canopy LAI and vertical FAVD profile inversion from airborne full-waveform LiDAR data based on a radiative transfer model. Remote Sens. 2015, 7, 1897–1914. [Google Scholar] [CrossRef]
  27. Gastellu-Etchegorry, J.; Yin, T.G.; Lauret, N. Discrete anisotropic radiative transfer (DART 5) for modeling airborne and satellite spectroradiometer and LIDAR acquisitions of natural and urban landscapes. Remote Sens. 2015, 7, 1667–1701. [Google Scholar] [CrossRef]
  28. Gastellu-Etchegorry, J.; Yin, T.G.; Lauret, N.; Grau, E.; Rubio, J.; Cook, B.D.; Morton, D.C.; Sun, G.Q. Simulation of satellite, airborne and terrestrial LiDAR with DART (I): Waveform simulation with quasi-Monte Carlo ray tracing. Remote Sens. Environ. 2016, 184, 418–435. [Google Scholar] [CrossRef]
  29. Disney, M.I.; Kalogirou, V.; Lewis, P.; Prieto-Blanco, A.; Hancock, S.; Pfeifer, M. Simulating the impact of discrete-return lidar system and survey characteristics over young conifer and broadleaf forests. Remote Sens. Environ. 2010, 115, 2798–2809. [Google Scholar] [CrossRef]
  30. Pang, Y.; Lefsky, M.; Sun, G.; Ranson, J. Impact of footprint diameter and off-nadir pointing on the precision of canopy height estimates from spaceborne lidar. Remote Sens. Environ. 2011, 115, 2798–2809. [Google Scholar] [CrossRef]
  31. Calders, K.; Lewis, P.; Disney, M.; Verbesselt, J.; Herold, M. Investigating assumptions of crown archetypes for modelling LiDAR returns. Remote Sens. Environ. 2013, 134, 39–49. [Google Scholar] [CrossRef]
  32. Ristorcelli, T.; Hamoir, D.; Briottet, X. Simulating space lidar waveforms from smaller-footprint airborne laser scanner data for vegetation observation. IEEE Geosci. Remote Sens. Lett. 2014, 11, 534–538. [Google Scholar] [CrossRef]
  33. North, P.R.J.; Rosette, J.A.B.; Suárez, J.C.; Los, S.O. A Monte Carlo radiative transfer model of satellite waveform LiDAR. Int. J. Remote Sens. 2010, 31, 1343–1358. [Google Scholar] [CrossRef]
  34. Wu, J.Y.; Van Aardt, J.A.N.; Gregory, P.A. Comparison of signal deconvolution algorithms based on small-footprint LiDAR waveform simulation. IEEE Trans. Geosci. Remote Sens. 2011, 49, 6. [Google Scholar] [CrossRef]
  35. Zhou, G.Q.; Long, S.H.; Xu, J.S.; Zhou, S.; Song, B.; Deng, R.H.; Wang, C. Comparison analysis of five waveform decomposition algorithms for the airborne LiDAR echo signal. IEEE Trans. Geosci. Remote Sens. 2021, 14, 7869–7880. [Google Scholar] [CrossRef]
  36. Steinvall, O. Effects of target shape and reflection on laser radar cross sections. Appl. Opt. 2000, 39, 4381–4391. [Google Scholar] [CrossRef]
  37. Johnson, S.E. Effect of target surface orientation on the range precision of laser detection and ranging systems. J. Appl. Remote Sens. 2009, 3, 033564. [Google Scholar] [CrossRef]
  38. Hu, Y.H.; Hou, A.H.; Zhang, X.Y.; Han, F.; Zhao, N.X.; Xu, S.L.; Ma, Q.L.; Gu, Y.L.; Dong, X.; Fang, J.J. Assessment of lateral structural details of targets using principles of full-waveform light detection and ranging. IEEE Trans. Geosci. Remote Sens. 2023, 61, 5704116. [Google Scholar] [CrossRef]
  39. Hu, Y.H.; Zhang, X.Y.; Hou, A.H.; Xu, S.L.; Gu, Y.L.; Lu, H.B.; Ma, Q.L.; Zhao, N.X.; Fang, J.J. Laser echo waveform modulation modelling from lateral structure using a mathematical formula. Int. J. Remote Sens. 2023, 44, 2382–2399. [Google Scholar] [CrossRef]
  40. Wang, Y.X.; Fang, J.J.; Xu, S.L.; Zhang, X.Y.; Ma, S.J.; Guo, Y.L.; Shan, L.Q.; Hu, Y.H. Intelligent shape discrimination and multi-dimensional feature parameter inversion of target based on laser echo waveform. Chin. J. Lasers 2025, 53, 2. [Google Scholar]
  41. Stysley, P.R.; Coyle, D.B.; Clarke, G.B.; Frese, E.; Blalock, G.; Morey, P.; Kay, R.B.; Poulios, D.; Hersh, M. Laser production for NASA’s Global Ecosystem Dynamics Investigation (GEDI) lidar. In Proceedings of the SPIE, 21nd Laser Radar Technology and Applications, Baltimore, MD, USA, 17–21 April 2016; Volume 9832, p. 983207. [Google Scholar]
  42. Zhang, X.Y.; Hu, Y.H.; Shen, S.Y.; Fang, J.J.; Wang, Y.C.; Liu, Y.F.; Han, F. Kilometer-level laser reflective tomography experiment and debris barycenter estimation. Acta Phys. Sin. 2022, 71, 114205. [Google Scholar] [CrossRef]
  43. Bai, J.; Niu, Z.; Huang, Y.R.; Bi, K.Y.; Fu, Y.W.; Gao, S.; Wu, M.Q.; Wang, L. Full-waveform hyperspectral LiDAR data decomposition via ranking central locations of natural target echoes (Rclonte) at different wavelengths. Remote Sens. Environ. 2024, 310, 114227. [Google Scholar] [CrossRef]
  44. Zhang, F.X.; Wang, X.; Wang, L.G.; Mo, F.; Zhao, L.P.; Yang, X.M.; Lv, X.; Xie, J.F. A Satellite Full-Waveform Laser Decomposition Method for Forested Areas Based on Hidden Peak Detection and Adaptive Genetic Optimization. Remote Sens. 2025, 17, 701. [Google Scholar] [CrossRef]
  45. Keller, U. Ultrafast Lasers: A Comprehensive Introduction to Fundamental Principles with Practical Applications; Springer: Cham, Switzerland, 2021; pp. 555–556. [Google Scholar]
  46. Zhu, J.H.; Yin, T.H.; Guo, W.; Zhang, B.B.; Zhou, Z.M. An underwater target azimuth trajectory enhancement approach in BTR. Appl. Acoust. 2025, 230, 110373. [Google Scholar] [CrossRef]
  47. Xu, Z.; Fan, C.Y.; Huang, X.T. MIMO radar waveform design for multipath exploitation. IEEE Trans. Signal Process. 2021, 69, 5359. [Google Scholar] [CrossRef]
  48. Xu, Z.; Tang, B.; Ai, W.H.; Xie, Z.; Zhu, J.H. Radar transceiver design for extended targets based on optimal linear detector. IEEE Trans. Aerosp. Electron. Syst. 2025, 61, 6070–6082. [Google Scholar] [CrossRef]
  49. Zhang, H.W.; Liu, W.J.; Zhang, Q.; Fei, T.Y. A robust joint frequency spectrum and power allocation strategy in a coexisting radar and communication system. Chin. J. Aeronaut. 2024, 37, 393–409. [Google Scholar] [CrossRef]
  50. Zhang, H.W.; Liu, W.J.; Zhang, Q.; Zhang, L.; Liu, B.B.; Xu, H.X. Joint power, bandwidth, and subchannel allocation in a UAV-assisted DFRC network. IEEE Internet Things J. 2025, 12, 11633. [Google Scholar] [CrossRef]
  51. Zhang, H.W.; Liu, W.J.; Zhang, Q.; Liu, B.B. Joint customer assignment, power allocation, and subchannel allocation in a UAV-based joint radar and communication network. IEEE Internet Things J. 2024, 11, 29643. [Google Scholar] [CrossRef]
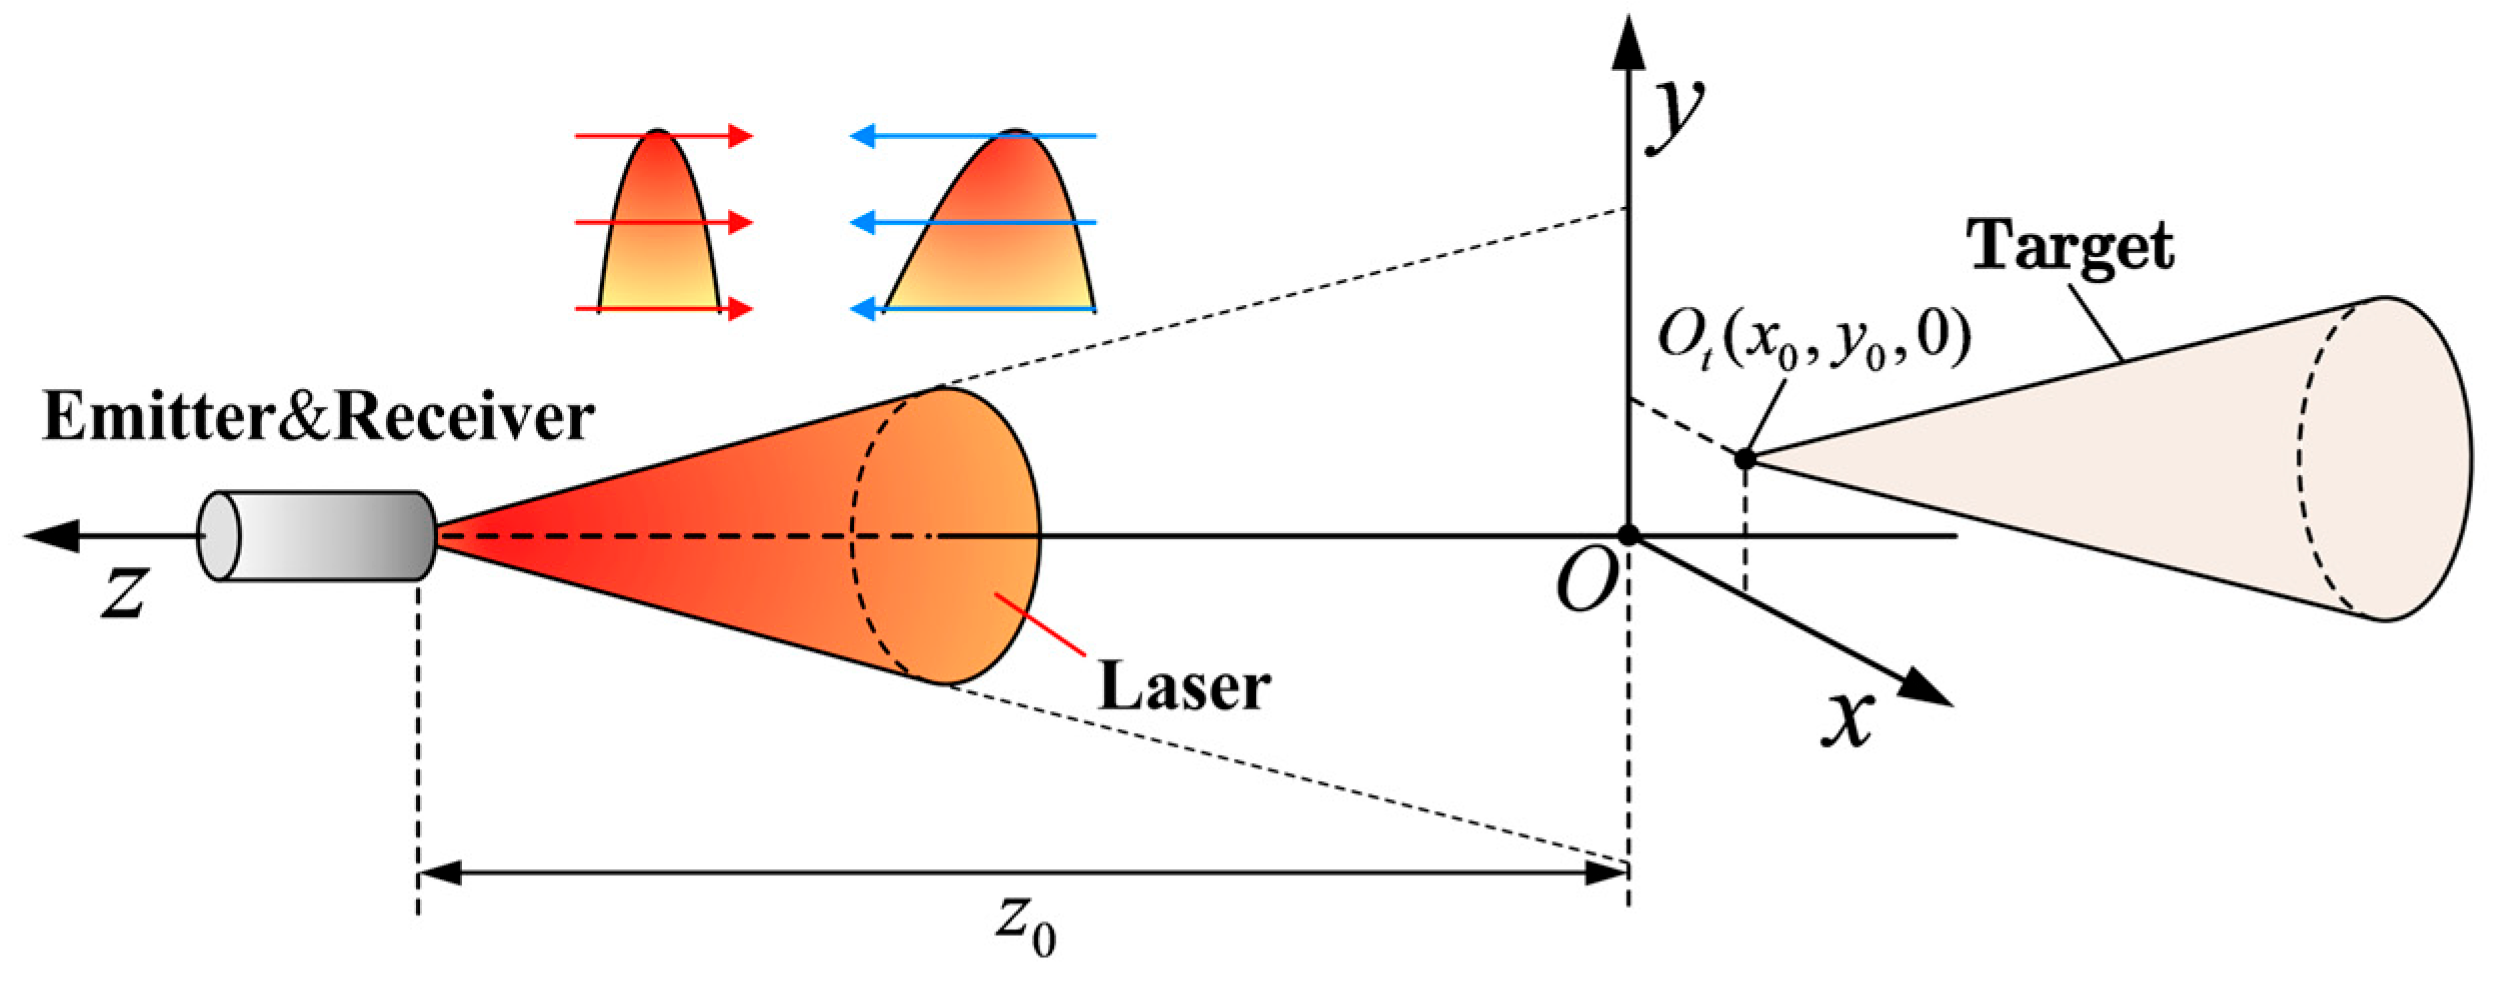
Figure 1. Sketch for establishing a Cartesian coordination system. The laser pulse beam propagates along   z -axis from positive to negative, and x O y   plane is determined by z -axis and rotation center of target. With no rotation condition, for cone, the axis is parallel to the pulse propagation direction, and the directions of x -axis and y -axis are random, while, for rectangular prism and hexagonal prism,   x -axis is parallel to the axis of them. The red and blue lines represent the incident and echo pulses, respectively. O t x 0 , y 0 , 0   is the rotation center of various targets.
Remotesensing 17 03419 g001
Figure 2. Rotation sketch: (a) Rectangular prism. (b) Regular hexagonal prism. (c) Cone. In this figure, the centers of rotation for various targets are depicted at ( 0 ,   0 ,   0 )   solely for illustrative clarity. This study concurrently investigates scenarios where the center of rotation resides at ( x 0 ,   y 0 ,   0 ) . a   is base edge length of the prism, b   is lateral edge length of the prism, α   is semi-vertex angle of the cone, and R   is bottom radius of the cone.
Remotesensing 17 03419 g002
Figure 3. The sketch of the self-build full-waveform LiDAR platform.
Remotesensing 17 03419 g003
Figure 4. Comparison of simulated and experimental waveforms: (a) simulated waveform, (b) experimental waveform, and (c) RMSE between them. θ   represents the rotated angle and red arrow indicates the rotation direction of the target.
Remotesensing 17 03419 g004
Figure 5. Echo waveforms of targets with various sizes under non-rotated condition: (a) Rectangular prism. (b) Regular hexagonal prism. a   is the edge length of the prisms’ base, and b   is the height of prisms. For rectangular prism, b = a , while, for the regular hexagonal prism, b = 2 a .
Remotesensing 17 03419 g005
Figure 6. Various factor dependence of echo waveform modulated by cone. (a) Half-cone angle α (with R = 0.1   m ); (b) Bottom radius R   (with α = 10 ° ). α   is the semi-cone angle of cones, and R   is the radius of the bottom of cones.
Remotesensing 17 03419 g006
Figure 7. Echo waveforms across various rotation angles modulated by (a) rectangular prism, (b) regular hexagonal prism and (c) cone. a   is the edge length of the prisms’ base, b   is the height of prisms, and R   is the bottom radius of the cone. For rectangular prism, b = a , a = 0.4   m , while, for the regular hexagonal prism, b = 2 a , a = 0.2   m . For cone, R = 0.1   m , α = 10 ° .
Remotesensing 17 03419 g007
Figure 8. Modulated echo waveforms of rectangular prism at various angles: (a) θ = 0 ° ; (b) θ = 10 ° ; (c) θ = 15 ° ; (d) θ = 25 ° ; (e) θ = 35 ° ; (f) θ = 45 ° . a   is the edge length of the rectangular prism’s base, and b   is the height of the rectangular prism. The rectangular prism has a = 0.4   m and b = a .
Remotesensing 17 03419 g008
Figure 9. Modulated echo waveforms of regular hexagonal prism at various angles: (a) θ = 0 ° ; (b) θ = 5 ° ; (c) θ = 10 ° ; (d) θ = 15 ° ; (e) θ = 20 ° ; (f) θ = 25 ° . a   is the edge length of the regular hexagonal prism’s base, and   b   is the height of the regular hexagonal prism. The regular hexagonal prism has a = 0.2   m and b = 2 a .
Remotesensing 17 03419 g009
Figure 10. Bottom radius dependence of the echo waveform modulated by cone with α = 10 ° : (a) θ = 30 ° ; (b) θ = 60 ° .   α   is the semi-cone angle of cones, and R   is the radius of the bottom of cones.
Remotesensing 17 03419 g010
Figure 11. Dependence of the prism’s modulated echo waveform on position: (a) Rectangular prism rotated at θ = 20 °   translates along the y -axis. (b) Regular hexagonal prism rotated at θ = 10 °   translates along the   y -axis. a   is the edge length of the prisms’ base, and b   is the height of prisms. For rectangular prism, b = a , a = 0.4   m , while, for the regular hexagonal prism, b = 2 a , a = 0.4   m .
Remotesensing 17 03419 g011
Figure 12. Dependence of the cone’s modulated echo waveform on position: (a) Non-rotated cone with R = 0.3   m   translates along the x -axis. (b) Cone with R = 0.1   m   rotated at θ = 60 °   translates along the y -axis.   α   is the semi-cone angle of cones, and R   is the radius of the bottom of cones. Cones above both have α = 10 ° .
Remotesensing 17 03419 g012
Table 1. Simulation parameters.
ParameterValue
Hemispherical reflectance,   ρ 1
Total power,   P t 1 (A. U.)
Range between the laser emitter and target,   z 0 10 km
Laser divergence angle,   φ 0.1 mrad
Laser wavelength,   λ 1064 nm
Width,   τ 0.2 ns
Disclaimer/Publisher’s Note: The statements, opinions and data contained in all publications are solely those of the individual author(s) and contributor(s) and not of MDPI and/or the editor(s). MDPI and/or the editor(s) disclaim responsibility for any injury to people or property resulting from any ideas, methods, instructions or products referred to in the content.