Highlights
What are the main findings?
- Eight years of high-quality spectral measurements in Lindenberg (Germany) show that global solar radiation is partitioned into ~5% UVA, ~43% PAR, and ~26% NIR, expressed as energy fractions relative to Rs, with strong correlations (R2 > 0.90) between each component and Rs.
- Clear seasonal cycles and long-term decreasing trends were identified in all spectral fractions, particularly for UVA/Rs (−15%), largely modulated by cloud cover and atmospheric conditions.
What are the implications of the main findings?
- The spectral fractions of UVA, PAR, and NIR can be reliably estimated from global radiation (Rs) when direct spectral observations are unavailable.
- These results provide valuable inputs for climate and vegetation modeling, solar energy forecasting, and human exposure assessments, especially in underrepresented rural environments.
Abstract
Observational studies in several regions and our dataset indicate changes in global solar radiation (RS); here, we analyze how atmospheric conditions modulate its spectral composition. This study investigates the effects of atmospheric conditions on the spectral composition of global solar radiation (RS) across different wavelength ranges: ultraviolet A (UVA), photosynthetically active radiation (PAR), and near-infrared radiation (NIR), using the ratios UVA/RS, PAR/RS, and NIR/RS. A high-quality spectral irradiance dataset (300–1025 nm) covering eight years of observations from a representative rural site in Central Europe (Meteorological Observatory Lindenberg, Tauche, in North-East Germany) was used. The average values obtained for the ratios were 0.049 ± 0.010 for UVA/RS, 0.433 ± 0.044 for PAR/RS, and 0.259 ± 0.030 for NIR/RS. Thus, the UVA range contributed approximately 5% to global radiation, PAR 43%, and NIR 26%. Strong correlations were found between each spectral component and RS, with determination coefficients exceeding 0.90 in all cases, particularly for PAR. This suggests that, in the absence of direct spectral measurements, these components can be reliably estimated from RS. A seasonal pattern was also identified, with maximum values in warmer months and minimum values in colder ones, most notably for PAR/RS. In contrast, NIR/RS exhibited an inverse pattern, likely influenced by atmospheric water vapor. A long-term decreasing trend in these ratios was also identified, being most pronounced in the UVA/RS ratio. Additionally, atmospheric conditions significantly affected the spectral distribution of RS, with UVA and PAR proportions increasing under specific conditions, while NIR remained more stable. Under overcast conditions, the ratios for shorter wavelengths (UVA and PAR) increased, indicating higher scattering effects, while NIR was less affected.
1. Introduction
Solar radiation is the primary driver of biological and climatic processes on Earth, and its spectral composition has crucial implications for both human health and ecosystem functioning. Ultraviolet-A (UVA, 315–400 nm) radiation, in particular, has been highlighted by the IPCC [1] for its potential adverse effects, including eye damage [2] and increased skin cancer risk [3]. While the impacts of UVA on human health are well documented, its role in plant physiology remains ambiguous. Some studies suggest that UVA enhances growth and metabolic activity [4,5], whereas others identify it as a stressor that induces morphological or biochemical changes [6,7].
Over recent decades, concerns regarding stratospheric ozone depletion and its consequences on surface-level UV radiation have intensified, particularly in the context of increasing anthropogenic emissions [8,9]. However, it is important to note that ozone primarily affects the UV-B range, while the present study focuses on UV-A radiation. Photosynthetically active radiation (PAR, 400–700 nm), the portion of solar radiation that drives photosynthesis, is another key spectral range for plant productivity and ecological processes [10]. Although PAR typically accounts for 44–69% of global solar radiation [11], it is rarely measured directly, prompting the development of empirical models to estimate PAR from readily available variables such as global radiation (Rs), humidity, or clearness index [12,13,14].
It should be emphasized from the outset that while the majority of surface solar irradiance lies between approximately 315 and 1100 nm, broadband global radiation (Rs) measured by pyranometers spans a much wider spectral range, from about 300 to 3500 nm in the case of the CM21 instrument. In this study, the NIR fraction is limited to the 700–1025 nm range due to the spectral coverage of the PSR instrument. As a result, shorter UVB wavelengths (<315 nm) and the longer near-infrared portion (>1025 nm) are not represented. Consequently, the fractions UVA/Rs, PAR/Rs, and NIR/Rs do not add up to unity; the residual fraction associated with the unmeasured range is quantified and discussed explicitly in Section 3.1.
Recent studies have highlighted that the spectral fractions of solar radiation are not constant but vary depending on local atmospheric conditions and site characteristics. For instance, a study in Burgos (Spain) reported UV/Rs ratios ranging between 2.9% and 7%, with cloudiness identified as the dominant driver of variability [15]. Comparable studies in Brazil found UVA/Rs ratios of 2–3% and PAR/Rs values around 0.46 [16], whereas in Mediterranean sites such as Greece reported UVA/Rs fractions close to 4–5% with PAR/ Rs [10,17]. Additional investigations in Mediterranean and subtropical regions further highlight the role of aerosol, water vapor, and sky conditions in modulating both PAR and UV [18]. These findings are summarized in Table 1, which compares reported UVA, PAR, and NIR fractions across different climatic regions.

Table 1.
Published UVA, PAR, and NIR fractions of global solar radiation (Rs) in different regions and climatic conditions.
In contrast, near-infrared radiation (NIR) remains less explored in ecological research, despite its relevance for energy balance and its sensitivity to atmospheric water vapor [19]. In this study, NIR refers specifically to the 700–1025 nm range, as measured by the PSR spectroradiometer, which captures the shorter portion of the typical NIR spectrum. This definition excludes the longer portion of the near-infrared spectrum (>1025 nm), which represents a non-negligible component of Rs. This limitation is explicitly addressed in future sections. While this spectral limitation must be acknowledged, NIR nevertheless plays a critical role in remote sensing and radiative transfer, and its ecological and physiological impacts are still not well understood [20].
One of the main challenges in ensuring data comparability lies in the differences in measurement methods and the instruments used for data collection. Instruments such as spectroradiometers, like the high-precision PSR (Precision Solar Spectroradiometer) used in this study, and pyranometers are commonly employed to measure different components of solar radiation [21,22]. While spectroradiometers measure the spectral irradiance across a broad wavelength range, including UVA, PAR, and NIR, pyranometers quantify global solar radiation over a wider but non-spectral-specific range. However, differences in calibration protocols may introduce potential discrepancies: for example, spectroradiometers such as the PSR are calibrated at Physikalisch-Meteorologisches Observatorium Davos/World Radiation Center (PMOD/WRC) against absolute spectral standards with stray-light corrections, whereas pyranometers like CM21 are calibrated against reference pyranometers following ISO 9847:1992 [23]. In addition, differences in the resolution and sensitivity of these instruments can also affect data comparability, particularly when comparing measurements from different time periods or stations [24]. Data collected from these instruments undergo extensive quality control, including the elimination of incomplete datasets and the exclusion of measurements with solar zenith angles above 80° to ensure accuracy [13]. Despite these efforts, uncertainties remain due to factors such as variability in atmospheric conditions, weather changes, and the inherent limitations of the measurement devices. As a result, stringent data screening, application of necessary corrections, and the systematic exclusion of outliers are essential steps to ensure the consistency and reliability of the dataset and to avoid biasing the final results [17].
This study presents a comprehensive evaluation of multi-year variability and seasonal patterns of UVA, PAR, and NIR components relative to global solar radiation, using high-resolution measurements collected between 2016 and 2023 at a rural site in Lindenberg (Tauche) in the North-East of Germany. Unlike previous studies that typically examine individual spectral bands, our approach simultaneously analyses all three components, assessing their seasonal, interannual, and atmospheric variability. Strong correlations between each component and Rs are explored to develop reliable estimations of spectral fractions in the absence of direct measurements.
Despite technological advances, the scarcity of high-resolution radiation data in rural areas continues to limit our understanding of spatial and temporal radiation dynamics [25,26]. The lack of continuous, high-quality observations in these areas limits the applicability of existing models and constrains ecological assessments. By leveraging a unique long-term dataset from a well-instrumented rural site, this study aims to fill that gap and contribute to a more robust understanding of solar radiation composition in underrepresented environments.
Specifically, we examine the ratios of UVA/Rs, PAR/Rs, and NIR/Rs, their dependence on atmospheric conditions, and their temporal evolution. The findings provide valuable insights for climate and vegetation modeling, human exposure studies, and sustainable land management under changing radiative regimes.
2. Materials and Methods
2.1. Study Area and Instrumentation
This study was conducted using data from the Meteorological Observatory Lindenberg—Richard Aßmann Observatory (MOL-RAO), located in Lindenberg (Tauche) in northeastern Germany (52.209°N, 14.118°E; 121 m a.s.l.). Operated by the DWD (Deutscher Wetterdienst: German Meteorological Service), MOL-RAO has been a cornerstone of atmospheric research since 1905. It functions as a national climate reference site and the central coordination hub of the GCOS (Global Climate Observing System) Upper-Air Reference Network (GRUAN), contributing to global programs World Meteorological Organization (WMO) and the World Climate Research Programme (WCRP).
Lindenberg (Tauche) lies in a mid-latitude temperate zone influenced by both maritime and continental air masses. The regional climate is classified as temperate oceanic (Cfb) according to the Köppen–Geiger classification [27], characterized by cold winters (often below 0 °C), mild to warm summers (15–25 °C), and precipitation evenly distributed throughout the year, with no distinct dry season. Annual precipitation ranges from 600 to 800 mm, with a reference value of 715 mm reported by the WMO Measurement Lead Centre at MOL-RAO [28].
This open grassland platform (150 × 250 m), equipped with two radiation and meteorological measurement towers (one 10 m and one 99 m tall), supports observations of radiation budget components, soil and meteorological variables, turbulent fluxes, and boundary layer parameters, thus enhancing the observatory’s measurement capabilities.
The key instruments used in this study include a high-resolution Precision Solar Radiometer (PSR#006) and a broadband pyranometer (Kipp & Zonen CM21, Delft, The Netherlands). The PSR#006, developed by (PMOD/WRC), measures solar spectral irradiance across 300–1025 nm with a resolution between 1.5 and 6 nm and a step size of ~0.7 nm. The instrument was calibrated twice at PMOD/WRC in 2014 and 2015, with intercalibration differences below 1% in most channels. The initial calibration took place in 2014, followed by further calibration and the setup of the global entrance in 2015, which expanded the instrument’s capabilities beyond direct sun observation. Additional calibrations were performed in 2017, October 2019, and September 2021 to maintain measurement accuracy and consistency. Stray light corrections were applied, and absolute time series of direct and global irradiance are available across 1024 spectral channels. Updated calibration factors implemented since 2019 address long-term uncertainties [21].
Global solar radiation was measured using a Kipp & Zonen CM21 pyranometer, which operates in the 300–3500 nm range and is classified as a secondary standard (ISO 9060: 2018 [29]). The instrument is regularly calibrated at Meteorological Observatory Lindenberg (MOL-RAO) of Deutscher Wetterdienst (DWD) in Lindenberg (Tauche), Germany, which is a WMO-Measurement Lead Centre, the WMO Regional Radiation Center and the German National Radiation Center for WMO, following ISO 9847 (WMO, 2024). Broadband irradiance from the CM21 pyranometer was acquired at 1- and 6 min intervals, depending on the operational setup of the observatory. For this study, all pyranometer and spectral measurements were consistently aggregated into hourly averages to facilitate comparison across variables.
2.2. Data and Methodology
This study is based on spectral and broadband radiation measurements collected at the Meteorological Observatory Lindenberg (MOL-RAO). The dataset analyzed spans an eight-year period, from 2016 to 2023, and includes continuous, high-resolution observations of solar radiation. Spectral measurements were acquired at 1 min intervals, and broadband global radiation (Rs) data were recorded every 1 and 6 min. For consistency, all variables were aggregated into hourly averages by computing the arithmetic mean of the available 1 min records within each hour. Hours with no valid measurements for any of the variables were excluded. This procedure ensured comparability across spectral and broadband datasets.
To investigate the spectral composition of solar radiation, we focused on three components: UVA (315–400 nm), PAR (400–700 nm), and NIR (700–1025 nm). These were derived from the integrated spectral irradiance data. Unlike many empirical approaches that treat each component independently, our dataset allows for the simultaneous characterization of all three within the same observational framework, thereby reducing uncertainty and improving the estimation of spectral ratios, especially for NIR, a component that remains understudied in radiation partitioning [16].
A limitation of this study arises from the spectral range of the PSR instrument. The NIR component was only available for 700–1025 nm, whereas the broadband pyranometer integrates up to 3500 nm. Therefore, a residual fraction of global irradiance, primarily corresponding to the longer near-infrared range (1025–3000 nm), is not captured by the spectral measurements. This explains why the sum of UVA, PAR and NIR fractions is systematically lower than unity. In addition, UVB radiation (<315 nm) was not measured. Although its energetic contribution is minor (typically <2% of GHI), its exclusion should be acknowledged. This limitation is explicitly considered in the analysis and further in Section 4.
PAR fluxes were converted from energy units into photon flux density using the standard factor of 4.57 μmol J−1, as recommended in classical works [30] and widely applied in solar radiation studies [18]. However, the exact factor depends on the spectral distribution of incoming radiation, which can vary with atmospheric conditions (e.g., solar elevation, aerosol loading, water vapor). For this reason, small deviations from the canonical 4.57 μmol J−1 value are expected. A direct calculation from the measured spectra would reduce this bias, but the fixed factor was adopted here to maintain comparability with previous studies. The associated uncertainty is on the order of 2–3% and does not affect the main conclusions of this work.
Global radiation (Rs) was measured directly using a Kipp & Zonen CM21 pyranometer, which operates in the 300–3500 nm range. Since Rs is directly measured by the pyranometer, it was not necessary to derive it from the individual spectral components. Equation (1) describes Rs as the sum of its direct and diffuse components:
where Rs is the global radiation, Rd is the diffuse radiation (DHI: Diffuse Horizontal Irradiance), Ri is the direct radiation (DNI: Direct Normal Irradiance), and θz is the solar zenith angle. All three radiation components are irradiances expressed in W/m2.
Rs = Rd + Ri·cos(θz)
A quality control protocol was applied to retain only complete hourly records for UVA, PAR, NIR, and Rs. Observations affected by solar zenith angles greater than 80° were discarded due to known cosine response issues. From these hourly values, daily averages were first computed. These daily values were then used to calculate monthly and seasonal means—where seasons were defined as winter (January–March), spring (April–June), summer (July–September), and autumn (October–December), followed by the derivation of annual averages. Implausible values, such as PAR/Rs ratios outside the range of 1.3–2.8 mol MJ−1, were excluded from the analyses. This threshold is consistent with the physically expected range of PAR/Rs, which typically varies between 1.7 and 2.3 mol MJ−1 under clear-sky conditions [30,31] but can occasionally extend toward the lower or upper bounds due to atmospheric variability (e.g., cloudiness, aerosols).
To evaluate the variables of interest and their ratios with global solar radiation (Rs) under different sky conditions, the clearness index (kt) was used. This widely applied parameter is defined as the ratio between global solar radiation and extraterrestrial global radiation (Rso), both measured on a horizontal surface (both considered as Global Horizontal Irradiances—GHI). Rso is calculated using the following equation:
where Isc is the solar extraterrestrial constant, with a value of 1361.1 W/m2 [32], defined as the DNI received at the mean Earth-Sun distance in perpendicular incidence to the Sun’s direction. This value reflects the currently accepted estimate based on recent spaceborne measurements [33], which revised earlier commonly used values of ~1367 W/m2. dr = 1 + 0.033·cos(2π/365·J) is the correction factor for the elliptical orbit eccentricity of the Earth around the Sun, where J is the Julian day of the year, and θz is the solar zenith angle, which measures the angle formed by the direction of the Sun and the zenith, a value provided by the meteorological station. Alternative, more precise formulations (e.g., Spencer, 1971 [34]) exist, but the simplified approach applied here provides adequate accuracy for the scope of the work.
Rso = Isc·dr·cosθz
The clearness index (kt) is a widely used indicator of atmospheric transmittance, defined as the ratio between global radiation at the surface (Rs) and the corresponding extraterrestrial radiation (Rso). The theoretical limits of kt range from 0 to 1. A value of kt = 0 corresponds to nighttime conditions, when no solar radiation reaches the surface. Conversely, kt = 1 represents the case of unattenuated extraterrestrial radiation at the top of the atmosphere. At the surface, however, kt values remain strictly below 1 even under clear-sky conditions, due to molecular scattering and gaseous absorption. In practice, daytime kt values typically fall between ~0.2 and 0.8, and may occasionally exceed 1 under cloud enhancement conditions. To classify sky conditions in this study, the following intervals were adopted [12,17]: (i) overcast (kt ≤ 0.3); (ii) intermediate or partly cloudy (0.3 < kt < 0.7); and (iii) clear (kt ≥ 0.7). These thresholds have been widely applied in previous studies and provide robust comparability across different sites and datasets. This classification scheme provides a robust framework for evaluating the temporal behavior of UVA, PAR, and NIR components and their respective ratios to global solar radiation (Rs) at the Lindenberg site.
2.3. Statistical Analysis and Quality Control
Hourly data series were subjected to a strict quality control procedure prior to the analysis. Only complete hourly records including all four variables (UVA, PAR, NIR and Rs) were retained. Observations affected by large solar zenith angles (θz > 80°) were excluded due to the known cosine response limitations of pyranometers and the enhanced spectral distortions at very high air mass. Implausible values were filtered using physical thresholds, such as PAR/Rs ratios outside the range of 1.3–2.8 mol MJ−1. Outliers beyond these limits were systematically removed.
For statistical analysis, simple linear regression was applied to quantify long-term trends in UVA/ Rs, PAR/Rs, and NIR/Rs. Regression slopes and coefficients of determination (R2) were reported, and significance was assessed using confidence intervals at the 95% level. Given the large sample sizes (N > 1000 for most subsets), no formal normality tests were applied; instead, Gaussianity was assumed under the Central Limit Theorem. Descriptive statistics (means, medians, standard deviations, percentiles) are provided in the Supplementary Tables. To ensure completeness, the residual fraction (fresidual) was also computed, which increases proportionally as UVA, PAR, and NIR decrease.
3. Results
3.1. Energy Closure and Spectra-Broadband Agreement
The agreement between spectrally integrated irradiance (300–1025 nm) and broadband global horizontal irradiance (Rs) was evaluated for the entire period 2016–2023. Table 2 summarizes the yearly number of paired observations (n), the coefficient of determination (R2), mean bias, RMSE, and the residual fraction statistics. R2 values ranged between 0.72 and 0.86, with negative biases of −61 to −96 W/m2, consistent with the truncation of the spectrum at 1025 nm. The residual fraction averaged 0.20–0.28, confirming that the longer near-infrared range (>1025 nm) accounts for a substantial share of the surface energy balance.
Table 2.
Yearly agreement metrics between spectrally integrated irradiance (300–1025 nm) and broadband (Rs). N_pairs = number of paired hourly records; bias and RMSE are expressed in W·m−2.
The residual fraction was defined as the portion of broadband irradiance not captured by the spectrally integrated range (300–1025 nm). It is expressed as:
where UVA, PAR, and NIR are spectrally integrated components and Rs is the broadband global horizontal irradiance.
Figure 1 illustrates the interannual evolution of agreement metrics. Panel A highlights the consistently high R2 values, together with systematic negative biases and RMSE values within 84–119 W·m−2. Panel B shows the residual fraction (fresidual), which varied between 0.20 and 0.28, with higher values after 2018, consistent with the unmeasured spectral range beyond 1025 nm.
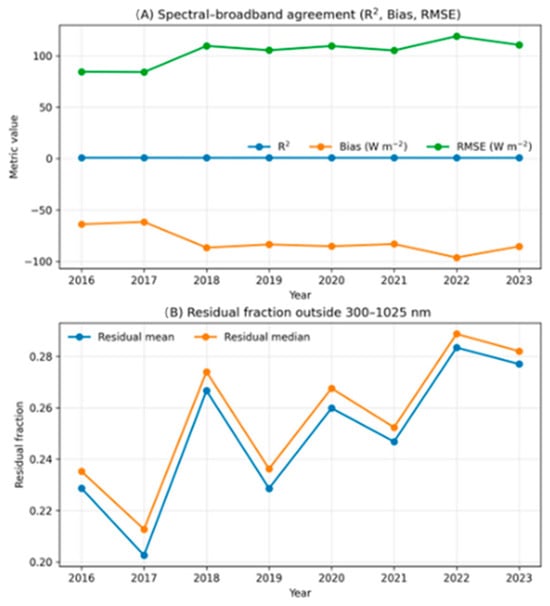
Figure 1.
Yearly agreement metrics between spectrally integrated irradiance (300–1025 nm) and broadband GHI (Rs): (A) R2, bias, and RMSE; (B) residual fraction (mean and median).
3.2. Study of the Spectral Ratios: Annual and Monthly Analysis
First, we analyze the annual fractions of each spectral component to identify long-term trends, intra-annual variability, and potential links to atmospheric changes or climate shifts. Figure 2 shows annual means and standard deviations of spectral ratios for UVA, PAR, and NIR components for each year of the 2016–2023 period. All the descriptive statistics for the ratios (UVA/Rs, PAR/Rs and NIR/Rs), including the arithmetic mean (Mean), standard deviation (SD), median (Md), minimum and maximum values (Min, Max), and the 25th and 75th percentiles (P25 and P75, respectively), are presented in Table S1 in the Supplementary Material.
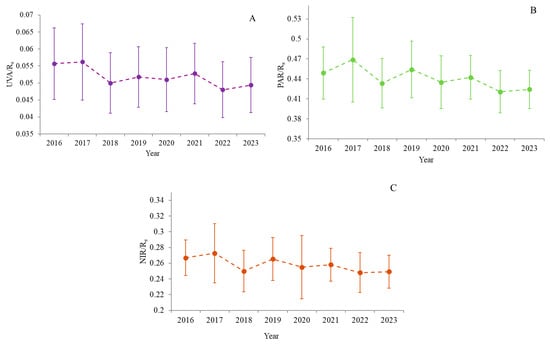
Figure 2.
Annual means and standard deviations of spectral ratios for UVA/Rs (A), PAR/Rs (B), and NIR/Rs (C) components.
The three spectral fractions exhibited a similar seasonal pattern. This similarity was confirmed quantitatively, as the fractions showed consistent correlations with each other and with the clearness index (kt) which acts as a proxy for atmospheric transmittance. This reinforces the interpretation that cloud cover and sky conditions modulate the spectral distribution of Rs in a coherent way across spectral bands.
In addition to the general trends, a progressive increase in global radiation (Rs) was observed during this period, which may be attributed to a decrease in cloud coverage over Lindenberg. Since cloud scattering predominantly affects shorter wavelengths, particularly through forward scattering in the UVA and visible ranges, the relative fractions of UVA/Rs and PAR/Rs increase under cloudy conditions [30,35], reflecting the stronger attenuation of broadband Rs compared to its shorter wavelength components. Conversely, under clear skies the absolute irradiances of UVA and PAR are maximized due to direct transmission, even though their relative fractions decrease [10]. In contrast, the NIR fraction decreases because near-infrared radiation is more strongly absorbed by atmospheric water vapor, especially during humid conditions, and is less influenced by scattering processes [19,36]. This combination of wavelength-dependent scattering and absorption explains the observed decline in NIR/Rs despite the overall increase in global radiation, consistent with previous studies [10,30,35]. However, this explanation remains hypothetical, as our dataset does not include direct measurements of scattering or absorption, and further dedicated observations and modeling would be required to confirm these mechanisms.
The analysis of all ratios revealed a Gaussian distribution. The median UVA/Rs ratio for the entire period was 0.051, showing a 15% decline over the study period, from 0.055 in 2016 to 0.048 in 2022 (Table S1). For the PAR/Rs ratio, with a median value of 0.436, a 10% decrease occurred over the years, from 0.436 for the median value in 2017 to 0.419 in 2022. The NIR/Rs ratio showed a median value of 0.256 with a 10% decline from 0.271 during 2017 to 0.247 in 2022. The highest median value was found in 2022 and the lowest in 2017 for both the PAR/Rs and NIR/Rs ratios, while for UVA/Rs, the lowest occurred in 2016. Thus, the changes between years are more evident for the UVA/Rs ratio. When compared with other regions, the UVA/Rs values observed in our study are higher than those reported in Brazil (4.2%) and Greece (3.4%). In contrast, our PAR/Rs values are lower than the 49.1% recorded in Botucatu, Brazil, for 2001–2004 [16], and slightly lower than the 43.8% found in a high-altitude Mediterranean forest in Greece during 2014–2019 [10]. Interestingly, our UVA/Rs values are similar to those reported in Corvallis, USA (5.5%) [37], where the highest variability was observed in July. Compared to these studies, our results show greater interannual variation.
To identify intra-annual variability and potential seasonal trends, both Figure 3 and Table S2 in the Supplementary Material show the monthly values for all years for the different spectral ratios. For the UVA/Rs ratio (Figure 3A), maximum values are generally observed during the coldest months, particularly in January and December, with the highest value recorded in January 2016 (0.056). This pattern may be explained by the typically higher cloud coverage during winter months in Lindenberg, which increases atmospheric scattering and enhances the relative contribution of shorter wavelengths such as UVA but the differences between seasons are not very pronounced. Conversely, spring months (April, May, June) tend to be more cloud-free, which could explain the relative decrease in this ratio during those periods. However, this interpretation should be considered with caution, as it is not supported by explicit cloud cover statistics in this study. Additionally, summer months (July, August, September) maintain elevated values similar to those in winter, whereas autumn (October, November) generally shows reduced UVA/Rs ratios.
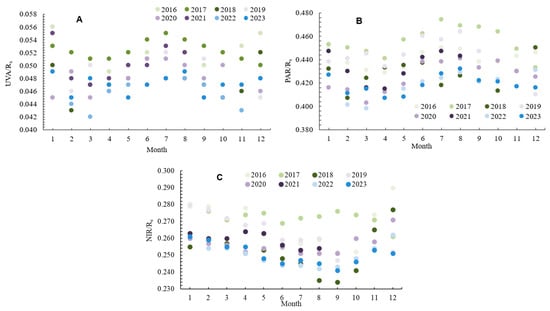
Figure 3.
Monthly evolution of the spectral ratios for UVA/Rs (A), PAR/Rs (B), and NIR/Rs (C) for each year of the 2016–2023 period.
A similar seasonal trend is observed for the PAR/Rs ratio (Figure 3B), which is characterized by higher values in spring and summer, peaking in July 2017 (0.474). This reflects both the increased availability of photosynthetically active radiation during these seasons and the higher mean solar altitude, which reduces air mass and favors PAR transmission. The ratio decreases moderately during autumn and winter months. Conversely, the NIR/Rs ratio (Figure 3C) demonstrates an inverse seasonal behavior: the lowest values are consistently recorded during summer, with the minimum value occurring in September 2018 (0.234), within the autumn months. The highest NIR/Rs values are observed in the colder months, particularly in December and January. These seasonal variations likely reflect changes in atmospheric water vapor and cloud properties, which differentially affect near-infrared radiation transmission. However, 2017 represents an exception to this general pattern, as elevated NIR/Rs values were recorded during spring and summer (e.g., 0.275 in May, 0.273 in August, and 0.276 in September), contrasting with the seasonal minima observed in other years.
Beyond clouds and water vapor, aerosols and their optical properties also play a critical role in modulating the spectral fractions of global radiation. Absorbing aerosols, such as black carbon, exerts a stronger influence in the near-infrared (NIR) by selectively absorbing radiation in this spectral region, whereas scattering aerosols predominantly affect the shorter UVA and PAR bands [38]. In addition, several atmospheric gases exhibit distinct absorption bands within the NIR range, most notably water vapor, which further reduces NIR/Rs under humid conditions [39]. These processes highlight that the observed seasonal behavior of UVA/Rs, PAR/Rs, and NIR/Rs results from the combined and spectrally dependent effects of multiple atmospheric constituents, not only cloud cover. However, our dataset does not include direct aerosol or gas concentration measurements, and therefore the attribution of these mechanisms remains qualitative. Future studies combining spectral irradiance observations with aerosol optical depth and water vapor measurements would be essential to better constrain these cause–effect relationships.
The PAR/Rs ratio shows relatively low variability across months, with certain months showing notable differences in values between years. Similarly, Proutsos et al. [10] reported a small seasonal variability, which is somewhat unexpected, as most studies indicate that the ratio is season-dependent, typically showing higher values in summer and lower in winter for both the UVA/Rs and PAR/Rs ratios. The low variability observed by Proutsos et al. [10] is consistent with findings by Pashiardis et al. [18] and may be attributed to the cooler and wetter conditions characteristic of high-altitude locations. In our study, a similar pattern is observed, suggesting that local factors such as altitude and climate might play a significant role.
Correlations between UVA, PAR, and NIR with Rs were analyzed for the entire period, as well as separately by months and seasons. Statistical characteristics and linear regression results (for both Y = a X + b and y = a X) are shown in Table S3 in the Supplementary Material, as forcing the intercept to zero may introduce bias [10]. Strong correlations were found between Rs and both UVA and PAR (R2 > 0.96), with the strongest values for UVA/Rs occurring in summer, particularly in July and August. While January shows relatively high UVA/Rs ratio values, the correlation coefficients and slopes during this month are lower compared to the summer months. Similarly, the PAR/Rs ratio showed maximum values in summer, especially in August. In contrast, the NIR/Rs ratio displayed a different seasonal behavior: the highest slope values were recorded in the coldest months (January and December), while the lowest appeared in summer. The overall correlation for NIR/Rs was very high (R2 = 0.98), suggesting a strong and consistent relationship. This inverse seasonal pattern for NIR is likely linked to higher atmospheric water vapor content during colder months, which affects near-infrared transmission. These seasonal shifts underscore the importance of considering atmospheric conditions when analyzing spectral irradiance components.
In addition to the analyzed spectra bands, a residual fraction of global irradiance was identified, corresponding to the wavelengths not covered by the PSR instrument (1025–3000 nm and UVB < 315 nm). As a result, the sum of the UVA, PAR, and NIR fractions does not reach unity. This residual component represents a substantial portion of the solar spectrum, mainly into longer near-infrared region, and its absence should be taken into account when interpreting the energy partition and comparing results with studies using broadband instruments.
3.3. Analysis of the UVA/Rs, PAR/Rs, and NIR/Rs Ratios Under Different Sky Conditions: Monthly and Seasonal Variability
To assess the potential influence of atmospheric conditions on the spectral-to-global radiation ratios (UVA/Rs, PAR/Rs, and NIR/Rs), this section analyses their behavior under different sky conditions, classified using the clearness index (kt). Sky conditions are categorized as overcast (kt ≤ 0.3), intermediate (0.3 < kt < 0.7), and clear (kt ≥ 0.7). In the dataset, intermediate skies are the most common (52%), followed by overcast skies (33%) and clear skies (15%). The following section describes the seasonal patterns observed in each spectral ratio across these sky conditions, as shown in Table S4 in the Supplementary Material.
For the UVA/Rs ratio, values under overcast skies, there is no significant seasonal variability, with values remaining close to 6%. However, for intermediate and clear sky conditions, a clear seasonal pattern is observed. The UVA/Rs ratio under intermediate skies reaches maximum values in summer (5.0 ± 0.7%), with a peak in July (5.1%), and minimum values in autumn 4.5 ± 0.7%), representing a decrease of 10%. The UVA/Rs ratio under clear skies exhibits a more pronounced seasonal variability, with maximum values in summer (4.8 ± 0.4%), particularly in June, July, and August (4.9%), and the lowest values in autumn (4.1 ± 0.3%), resulting in a 15% decrease.
For the PAR/Rs ratio, shows a seasonal pattern under all sky conditions with maximum values in hot seasons and minimum in cold seasons. The PAR/Rs ratio under overcast skies reaches its maximum in summer (47.2 ± 6.2%), with a peak in July (47.8 ± 6.0%), and lower values in autumn (45.7 ± 5.0%), indicating a 3% decrease, but the minimum in May (45.3 ± 4.1%). The PAR/Rs ratio under intermediate skies reaches its maximum in summer (43.9 ± 4.1%), peaking in July (44.3 ± 4.0%), and minimum values in winter (42.0 ± 3.3%), corresponding to a 4% reduction, with the lowest value in March (41.7 ± 3.2%). The PAR/Rs ratio under clear skies also follows this pattern, with maximum values in summer (43.5 ± 2.5%), especially in June (43.9 ± 2.3%), and minimum values in winter (40.8 ± 2.0%), with the minimum value in January (40.6 ± 1.4%), which means a decrease of 6%.
Regarding the NIR/Rs ratio, the seasonal pattern is opposite to that of UVA/Rs and PAR/Rs. The NIR/Rs ratio under overcast skies reaches its maximum in spring (27.2 ± 3.1%), with a peak in May (27.5 ± 2.7%), and the lowest in autumn (26.1 ± 5.1%), with the lowest value being in October (25.7 ± 3.2%), implying a 4% decrease. The NIR/Rs ratio under intermediate skies reaches its maximum in winter (26.5 ± 3.4%), with January showing the highest monthly value (27.3 ± 4.9%), and minimum values in summer (25.0 ± 2.6%), with the minimum value being in September (24.7 ± 2.5%), representing a 6% decrease. The NIR/Rs ratio under clear skies reaches its maximum in winter (25.5 ± 1.3%), peaking in December (27.7%), and the minimum in summer (24.3 ± 1.5%), with lowest values being in August and September (24.2%), showing a 5% reduction.
Figure 4, Figure 5, and Figure 6 illustrate the diurnal evolution of the UVA/Rs, PAR/Rs, and NIR/Rs ratios, respectively, classified by season and sky condition. These graphs highlight the pronounced influence of atmospheric clearness on the spectral ratios, with overcast skies consistently showing the highest ratio values throughout the day and clear skies the lowest.
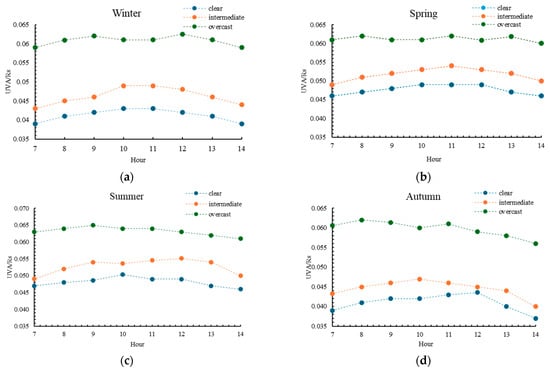
Figure 4.
Diurnal variation in the UVA/Rs ratio under different sky conditions: (a) winter; (b) spring; (c) summer; (d) autumn. Each point represents the mean hourly value for the 2016–2023 period.
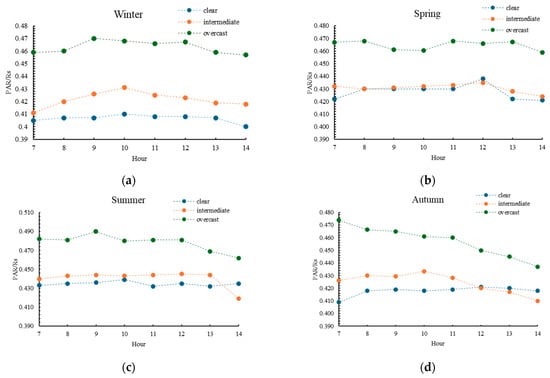
Figure 5.
Diurnal variation in the PAR/Rs ratio under different sky conditions: (a) winter; (b) spring; (c) summer; (d) autumn. Each point represents the mean hourly value for the 2016–2023 period.
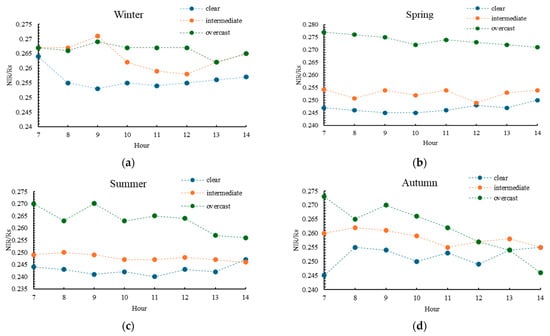
Figure 6.
Diurnal variation in the NIR/Rs ratio under different sky conditions: (a) winter; (b) spring; (c) summer; (d) autumn. Each point represents the mean hourly value for the 2016–2023 period.
While Figure 4, Figure 5 and Figure 6 depict the diurnal cycle of UVA/Rs, PAR/Rs, and NIR/Rs under different seasons and sky conditions, these variations are largely governed by changes in solar altitude and therefore by air mass. Thus, the observed temporal evolution implicitly reflects the influence of atmospheric path length. A direct representation of ratios versus air mass would indeed provide complementary insight, but such an analysis was beyond the scope of this work and will be addressed in future studies.
These figures correspond to Table S5 in the Supplementary Material, which present the average hourly values for each ratio by season and sky type. Table S5 presents the average UVA/Rs ratio by season, hour, and sky condition. Across all seasons, the UVA/Rs ratio remains relatively stable during the morning and early afternoon hours (7:00–14:00), with values under overcast skies averaging around 6%, showing minimal hourly variation. Clear skies exhibit the lowest UVA/Rs ratios, averaging near 4.0% to 4.9%, depending on the season. For example, in summer under clear skies, the ratio peaks at 0.050 around 10:00 and slightly decreases to 0.046 by 14:00. Intermediate skies display intermediate values between these extremes, with a modest peak around midday.
PAR/Rs ratio follows a similar daily pattern, with overcast skies maintaining the highest values (up to 0.49 in summer mornings) and clear skies the lowest (around 0.40–0.44 depending on season and hour). The diurnal variation is relatively small but consistent, showing slight declines after solar noon in all conditions. Notably, the difference between sky conditions is more pronounced in winter and autumn, aligning with seasonal water vapor variations.
For the NIR/Rs ratio, diurnal variability is subtle but shows distinct patterns by season and sky condition. In winter under clear skies, values start around 0.264 at 7:00, decrease slightly to 0.253 at 9:00, then gradually increase to 0.257 by 14:00, displaying a slight U-shaped trend. Under overcast skies in autumn, the ratio peaks early at 0.273 at 7:00 and steadily declines throughout the day to 0.246 at 14:00, showing a clear decreasing trend. In spring and summer, overcast conditions maintain relatively stable values near 0.27 and 0.26, respectively, with a slight decrease toward the early afternoon. Intermediate skies exhibit intermediate values and patterns similar to clear skies, with morning maxima followed by slight decreases during midday and early afternoon. These patterns reflect the influence of atmospheric water vapor and cloud cover on NIR absorption and scattering.
Overall, the daily evolution confirms that cloud cover increases the relative contribution of UVA radiation to global radiation, consistent with previous seasonal analyses. For example, the average UVA/Rs ratio under overcast skies is about 22% higher than under clear skies across all seasons and hours, emphasizing that clouds attenuate global radiation more strongly than UVA. Similar patterns, even though less pronounced, are seen in PAR/Rs and NIR/Rs ratios, with reductions under clearer skies of approximately 7%.
Furthermore, diurnal variations correspond to modest increases in cloudiness during afternoons, as shown in Figure 4 and Figure 5, where UVA/Rs and PAR/Rs ratios slightly increase While this pattern may suggest an influence of thin cirrus clouds producing enhanced scattering, no direct cloud observations are available in our dataset to confirm this mechanism. In summary, the diurnal analysis corroborates that spectral-to-global radiation ratios are strongly modulated by both time of day and atmospheric conditions. Overcast skies consistently elevate the relative spectral ratios throughout the day, while clear skies reduce them, reflecting the complex interplay between clouds, water vapor, and solar radiation components.
3.4. Study of the Relationship Between the Ratios (UVA/Rs, PAR/Rs, NIR/Rs) and the Clearness Index (kt)
This section examines the relationship between the radiation ratios (UVA/Rs, PAR/Rs, and NIR/Rs) and the clearness index (kt). The analysis reveals a decreasing non-linear relationships (Figure 7): as kt decreases (indicating overcast conditions), the ratios for UVA, PAR, and NIR relative to global radiation (Rs) increase. Specifically, under heavily overcast skies, the UVA/Rs ratio reaches 6.5–7%, while for clear skies, it drops to 4.5%, showing a 30% reduction. For PAR, the ratio ranges from 48 to 50% under overcast conditions, dropping to 4.2% in clear skies, while NIR shows a similar trend, though less pronounced, and even shows a slight increase for kt values near 0.7.
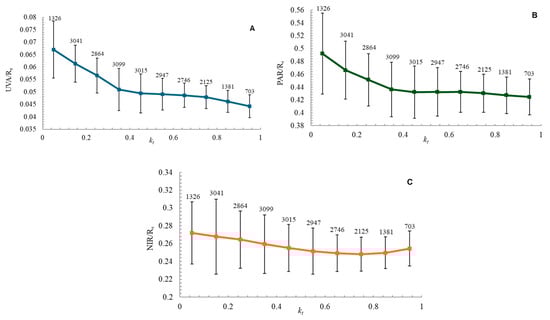
Figure 7.
Variation in the spectral ratios with increasing clearness index (kt), where the numbers above the points indicate the number of data samples (n) included in each kt interval: (A) UVA/Rs ratio; (B) PAR/Rs ratio; (C) NIR/Rs ratio.
The strongest dependence on the clearness index is observed for UVA/Rs, and the weakest for NIR/Rs. Additionally, as kt increases, the standard deviation decreases, indicating that the UVA/Rs ratio becomes more consistent under clearer skies. These findings highlight the influence of cloud cover and sky conditions on radiation ratios, with overcast skies increasing radiation relative to global radiation, and clearer skies reducing these ratios, particularly for UVA and PAR.
4. Discussion
This study quantified the relative contribution of UVA (315–400 nm), PAR (400–700 nm), and NIR (700–1025 nm) to global solar radiation (Rs: Global Horizontal irradiance) at a rural site in Lindenberg (Tauche), in the North-East of Germany, over the period 2016–2023. Furthermore, it assessed the influence of sky conditions, characterized by the clearness index (kt), on these spectral ratios. The long-term dataset enabled a detailed analysis of seasonal, monthly, and interannual variations in radiation components and their behavior under diverse atmospheric conditions.
4.1. Seasonal and Interannual Variability of Spectral Ratios
For the entire period analyzed, the contribution of the different spectral ranges to solar radiation was 5%, 44% and 26%, for UVA, PAR and NIR, respectively. A comparison with other geographical locations revealed that the UVA/Rs ratio in Lindenberg was higher than those reported for Brazil [16] and Greece [10] but similar to that observed in Corvallis, USA. The PAR/Rs ratio was lower than values reported for the USA, Brazil, and Greece but higher than those in Spain [15] and Cyprus [18]. During the 8-year study period, linear regression analysis indicated decreasing trends in all three spectral ratios: UVA/Rs (~15%), PAR/Rs (~10%), and NIR/Rs (~9%). These percentages correspond to the relative change between the first and last year of the record (2016–2023). While the decline is consistent across the dataset, it should be noted that the limited length of the time series (eight years) does not allow for a robust detection of long-term climate trends, and thus these results should be interpreted with caution. These trends were assessed using linear regression (see Section 2.3) and are summarized in Supplementary Tables.
Thus, the UVA/Rs showed the strongest decreasing trend (−15%) over the study period. At the same time, substantial interannual variability was evident, with year-to-year fluctuations particularly pronounced in extreme months such as July and January. These results may indicate long-term changes in the atmospheric composition above Lindenberg, such as variations in cloud cover, aerosol concentrations, or subtle shifts in atmospheric absorption properties. Aerosols are also known to influence UVA and PAR fractions, but no direct aerosol observations were available in this study; therefore, their role can only be considered speculative and requires further dedicated investigation. The greatest monthly variability was observed in extreme months like July and January, suggesting a higher sensitivity of spectral ratios to the specific atmospheric conditions prevalent during these periods.
Consistently, the decrease in UVA/Rs, PAR/Rs, and NIR/Rs implies a proportional increase in the residual fraction (fresidual), as already quantified in Section 3.1. This residual corresponds mainly to the unmeasured portion of the near-infrared spectrum (>1025 nm) and should be considered when interpreting the evolution of the energy balance.
Our findings reveal a distinct seasonal cycle for all spectral bands, for UVA/Rs and PAR/Rs the seasonal patterns are similar, with high values in warm seasons and low values in cold seasons. Conversely, NIR/Rs exhibits an inverse seasonal pattern, with the highest values recorded in winter and the lowest in summer. This behavior could be attributed to the increased absorption of NIR by atmospheric water vapor, which is typically more abundant during warmer months [19,36]. These results for UVA/Rs and PAR/Rs are consistent with previous studies [31], which report maximum values during summer and minimum values in winter, a pattern generally driven by solar geometry, day length, and prevailing atmospheric conditions. Additional studies in other regions also support this seasonal behavior. In Japan, Akitsu et al. [40] reported that the PAR/Rs ratio remained relatively stable across seasons, with maximum values in summer and minimum in winter. In Central China, Wang et al. [41] observed a pronounced seasonal dependence of PAR/Rs, with higher values during summer linked to stronger solar elevation angles and lower atmospheric attenuation. Similarly, in Estonia, Mottus et al. [42] found stable PAR-to-Rs ratios under cloud-free conditions, highlighting the role of solar geometry as a dominant control. These findings reinforce that, although the magnitude of seasonal variability differs across climatic zones, the underlying drivers -solar elevation, atmospheric water vapor, and aerosol loading- exert consistent influences on spectral partitioning worldwide.
The seasonal behavior of the spectral fractions can be attributed to well-known atmospheric drivers. The increase in UVA/Rs and PAR/Rs during the summer is linked to the combined effect of lower air mass and longer day length [40] together with enhanced scattering by clouds and aerosol that preferentially affects shorter wavelengths [10,17,31,35]. Conversely, the NIR/Rs ratio exhibits a maximum in winter, which may be linked to the lower absolute water vapor content and reduced atmospheric absorption during colder months, as colder air holds less moisture than warmer air [19,36]. Aerosol also contribute to the interannual and seasonal variability, particularly affecting the UVA and PAR ranges [10,17]. Although ozone primarily influences the UVB range, its minor absorption in the UVA may also modulate the seasonal cycle under specific conditions [9]. It should be noted that direct aerosol observations were not available for this study; therefore, their influence on the spectral fractions is discussed qualitatively and based on previous literature. Future research integrating aerosol optical depth and composition will be essential to better quantify their role.
Furthermore, to clouds, aerosols and trace gases play a relevant role in modulating the spectral distribution of solar radiation. Absorbing aerosols (e.g., black carbon) can depress NIR fractions through enhanced absorption, whereas predominantly scattering aerosols (e.g., sulfates) increase the diffuse component and tend to enhance the relative contribution of UVA and PAR [43]. Gaseous absorption is also important: ozone strongly affects the UV, while water-vapor bands dominate in the near-infrared [38,44]. These combined effects likely contribute to the observed variability; however, disentangling their relative contributions would require targeted measurements (aerosol optical depth/type, single-scattering albedo, column water vapor) and radiative-transfer modeling beyond the scope of this dataset.
This contrasts with the results obtained by Proutsos et al. [10] in different environmental contexts, highlighting the site-specific nature of spectral radiation patterns. The annual variability was highest for Rs (123%), followed by NIR (118%), PAR (111%), and UVA (90%), underscoring the dynamic nature of these components and their differential modulation by atmospheric factors throughout the year.
4.2. Relationship Between Global Radiation and Spectral Components
A strong correlation (R2 > 0.90) was found between Rs and each of the individual spectral components across the study period. This robust relationship persisted across different seasons and months, indicating the potential for reliably estimating UVA, PAR, and NIR from global radiation measurements when direct spectral data are unavailable. While PAR/Rs and NIR/Rs maintained consistently high correlations, the UVA/Rs ratio showed minor deviations in January, July, and December, suggesting a slightly more complex interplay with atmospheric conditions during these specific times. These findings align with observations from studies such as Jacovides et al. [31] and Proutsos et al. [10], reinforcing the utility of Rs as a proxy for spectral irradiance.
4.3. Influence of Sky Conditions (Clearness Index)
Sky conditions, as characterized by the clearness index (kt), significantly influenced the behavior of the spectral ratios [10]. An inverse exponential relationship was observed: as kt decreased, indicating cloudier skies, the relative contribution of UVA, PAR, and NIR to global radiation increased. This effect was most pronounced for the UVA/Rs ratio, which showed a 30% reduction from overcast to clear skies, followed by a 16% reduction for PAR/Rs and only a 6% reduction for NIR/Rs. The spectral ratios were more stable under overcast skies, while clear skies were associated with more pronounced seasonal variability. These differences underscore the wavelength-dependent attenuation of solar radiation by clouds, which tend to scatter longer wavelengths (like NIR) more effectively than shorter wavelengths (like UVA) [22].
Specifically, all three ratios reached their maximum values under overcast sky conditions. The UVA/Rs ratio showed clear seasonal maxima in summer and minima in winter, with these contrasts being more pronounced under clear skies. The PAR/Rs ratio displayed a similar inverse relationship with kt, with the highest values observed under cloudy summer conditions and the lowest under clear winter skies. The NIR/Rs ratio exhibited a distinct pattern, with maximum in winter under clear and intermediate skies and a marked decrease in summer, particularly under cloudy conditions. On a daily scale, the UVA/Rs ratio peaked around solar noon [10], while the NIR/Rs ratio showed less consistent patterns, typically decreasing throughout the day in summer and autumn.
Overall, sky conditions, particularly cloud cover, modulate both the intensity and the spectral composition of surface irradiance, consistent with previous findings [22,41,42].
Some methodological limitations should be noted. The spectral coverage of the PSR is limited to 300–1025 nm, excluding UVB (<315 nm) and the longer NIR (>1025 nm), which explains the presence of a residual fraction in the energy closure analysis. In addition, the PAR fraction expressed in photon units is not dimensionless, since it represents the ratio between photon flux density (μmol m−2 s−1) and irradiance (W/m2). The use of a fixed conversion factor (4.57 μmol J−1) introduces a small uncertainty (~2–3%), which does not affect the main conclusions of his work but should be considered in applications requiring high spectral accuracy.
It should also be emphasized that the attribution of the observed seasonal and diurnal patterns to specific atmospheric drivers (e.g., cloud scattering, water vapor absorption) remains partly speculative in this study, since no direct measurements of cloud microphysics, aerosol optical properties, or column water vapor were available. Radiative transfer processes involving aerosols, clouds, and water vapor are highly spectrally dependent and complex, and their precise role in shaping UVA, PAR, and NIR fractions require further investigation. Therefore, while the results presented here provide indicative patterns, future work should explicitly incorporate ancillary measurements and radiative transfer modeling to better disentangle these effects, particularly in the near-infrared where absorption processes are significant.
Recent studies underline the central role of clouds in shaping surface solar irradiance fractions. Cloud optical depth, droplet size distribution, and phase (liquid vs. ice) strongly modulate the balance between scattering and absorption processes, thereby affecting the relative contributions of UVA, PAR, and NIR [44]. However, current atmospheric reanalyses and numerical models face substantial challenges in accurately representing cloud spatiotemporal characteristics and microphysics, which limits their reliability in reproducing spectral irradiance patterns [45]. This reinforces the idea that, while clouds are one of the dominant drivers of spectral variability, their effects are difficult to capture in large-scale models, and long-term high-quality measurements such as those presented here are crucial to disentangle these processes.
Moreover, to cloud effects, aerosols and trace gases are critical modulators of spectral irradiance. Absorbing aerosols such as black carbon reduce the fraction of NIR through enhanced absorption, whereas scattering aerosols (e.g., sulfates) increase the diffuse component and tend to enhance the relative contributions of UVA and PAR [43]. Water vapor absorption bands dominate in the near-infrared, strongly modulating seasonal variability in NIR/Rs [39], while ozone primarily affects the UV range. These processes act simultaneously with cloud scattering, making the attribution of spectral fraction variability inherently complex. As highlighted in the IPCC AR5 assessment [44], the combined radiative effects of aerosols, clouds, and gases remain one of the largest uncertainties in atmospheric radiation studies. Our results therefore need to be interpreted within this broader context, and future work should integrate dedicated aerosol and gas observations to better disentangle their relative roles.
While this study is based exclusively on high-quality ground-based spectral measurements, future work should explore comparisons with satellite-derived surface solar radiation products. Recent efforts such as Shi et al. [46] provide near-global monitoring of surface solar radiation, which could offer a valuable benchmark to assess the representativeness of ground-based fractions and to generalize findings to other regions. However, such a comparison was beyond the scope of the present work and remains a relevant direction for future analyses.
5. Conclusions
This study provides a comprehensive assessment of the spectral characteristics of global solar radiation at a rural site in Central Europe, focusing on the UVA, PAR, and NIR components relative to total radiation (Rs) over an eight-year period. Our findings highlight several key insights:
Strong linear relationships (R2 > 0.90) were found between Rs and all spectral components, particularly for PAR. This supports the reliable estimation of UVA, PAR, and NIR from Rs in the absence of direct spectral measurements, especially under stable sky conditions.
Seasonal variability was evident across all bands. UVA/Rs and PAR/Rs ratios peaked during warmer months and dropped in colder seasons, while NIR/Rs showed the opposite trend, with maximum values in winter. These patterns reflect the combined influence of solar geometry, cloud cover, and water vapor absorption, particularly relevant for NIR attenuation.
Sky conditions, characterized through the clearness index (kt), significantly modulate the spectral ratios. Under overcast skies, the relative contribution of UVA and PAR increases due to the preferential scattering of shortwave radiation, whereas NIR remains more stable. Clear skies exhibit greater seasonal amplitude, especially for UVA.
Long-term trends indicate a consistent decrease in all three ratios over the study period, most notably for UVA/Rs (15%). These trends may reflect gradual changes in cloudiness, aerosol burden, or water vapor content, underscoring the importance of continuous high-quality spectral monitoring.
Daily and monthly variability also revealed distinct behaviors, particularly for UVA/Rs, which showed midday maxima and stronger sensitivity to atmospheric conditions. NIR/Rs presented less consistent daily patterns, likely due to its dependence on water vapor dynamics.
Overall, this study reinforces the importance of considering both spectral and temporal variability in solar radiation assessments. The results have direct implications for solar energy forecasting, radiative transfer modeling, ecological monitoring, and public health exposure assessments. Future research should explore the integration of spectral ratios into predictive tools and models, particularly in underrepresented environments like rural or high-latitude areas.
Supplementary Materials
The following supporting information can be downloaded at: https://www.mdpi.com/article/10.3390/rs17203439/s1: Table S1. Annual statistical values for spectral ratios (UVA/Rs, PAR/Rs, and NIR/Rs) throughout the analyzed period (2016–2023). Table S2. Monthly evolution during the period 2016–2023 for the spectral ratios (UVA/Rs, PAR/Rs, and NIR/Rs) with the average value and monthly variability coefficient (CV, %). Table S3. Monthly, seasonal, and annual averages of UVA/Rs, PAR/Rs, and NIR/Rs ratios, including their standard deviation (SD), number of hourly values (N), and the slope (a), intercept (b), and coefficient of determination (R2) of the linear fits for the equations Component = a·Rs + b and Component = a·Rs. Table S4. Monthly, seasonal, and annual averages of UVA/Rs, PAR/Rs, and NIR/Rs ratios with their standard deviation (SD) and the number of hourly values (N) for different sky conditions. Table S5. Seasonal and diurnal variations of UVA/Rs, PAR/Rs, and NIR/Rs ratios under different sky conditions (clear, intermediate, and overcast).
Author Contributions
Conceptualization, F.N.-G., L.D. and I.F.M.; Methodology, F.N.-G., L.D. and I.F.M.; Validation, L.D.; Formal analysis, L.M.-C.; Investigation, L.M.-C. and L.D.; Data curation, L.M.-C.; Writing—original draft, L.M.-C.; Writing—review & editing, L.M.-C., F.N.-G., L.D. and I.F.M.; Visualization, L.M.-C.; Supervision, F.N.-G., L.D. and I.F.M.; Project administration, L.D. All authors have read and agreed to the published version of the manuscript.
Funding
This research was funded by the Spanish national projects PID2021-128008OB-I00 and CNS2023-145435, and partially by the AEROMOST project (ProExcel_00204) from the Junta de Andalucía. Francisco Navas-Guzmán received funding from the Ramón y Cajal program (ref. RYC2019-027519-I) of the Spanish Ministry of Science and Innovation. The APC was fully waived by the journal Remote Sensing (MDPI).
Data Availability Statement
The data presented in this study are available on request from the corresponding author. The data are not publicly available due to institutional restrictions and data management policies of the Deutscher Wetterdienst (DWD).
Acknowledgments
The authors would like to thank the Deutscher Wetterdienst (DWD) for providing the radiation data from the Lindenberg Meteorological Observatory (MOL-RAO) and the staff involved in maintaining the long-term measurements.
Conflicts of Interest
The authors declare no conflict of interest.
List of Acronyms
The following acronyms are used in this manuscript.
| Acronym | Definition | Notes |
| Δλ | Spectral resolution of the PSR | Between 1.5 and 6 nm |
| Cfb | Köppen–Geiger temperate oceanic climate classification | Climate type at the study site |
| DWD | Deutscher Wetterdienst | German Meteorological Service |
| GCOS | Global Climate Observing System | — |
| GHI | Global Horizontal Irradiance | Equivalent to Rs |
| GRUAN | GCOS Reference Upper-Air Network | — |
| IPCC | Intergovernmental Panel on Climate Change | — |
| ISO | International Organization for Standardization | — |
| kt | Clearness index | Dimensionless; indicator of sky condition |
| λ | Wavelength | General spectral variable |
| MOL-RAO | Meteorologisches Observatorium Lindenberg—Richard Assmann Observatory | Study site |
| NIR | Near-Infrared Radiation (700–1025 nm) | Spectral band |
| NIR/Rs | Ratio of NIR to global radiation | Dimensionless |
| PAR | Photosynthetically Active Radiation (400–700 nm) | Spectral band |
| PAR/Rs | Ratio of PAR to global radiation | Dimensionless |
| PMOD/WRC | Physikalisch-Meteorologisches Observatorium Davos/World Radiation Center | — |
| PSR | Precision Solar Radiometer | Spectroradiometric instrument |
| Cfb | Köppen–Geiger temperate oceanic climate classification | Climate type at the study site |
| MOL-RAO | Meteorologisches Observatorium Lindenberg—Richard Assmann Observatory | Study site |
| R2 | Coefficient of determination | Used in regression analysis |
| Rs | Global solar radiation (Global Horizontal Irradiance) | Measured on a horizontal plane |
| UVA | Ultraviolet A radiation (315–400 nm) | Spectral band |
| UVA/ Rs | Ratio of UVA to global radiation | Dimensionless |
| WCRP | World Climate Research Programme | — |
| WMO | World Meteorological Organization | — |
| z | Solar zenith angle | Data filtered for z ≤ 80° |
References
- Intergovernmental Panel on Climate Change (IPCC). Climate Change 2021: The Physical Science Basis; Contribution of Working Group I to the Sixth Assessment Report of the Intergovernmental Panel on Climate Change; Cambridge University Press: Cambridge, UK, 2021; Available online: https://www.ipcc.ch/report/ar6/wg1/ (accessed on 18 March 2025).
- Echevarría-Lucas, L.; Senciales-González, J.M.; Rodrigo-Comino, J. Analysing the evidence of the effects of climate change, air pollutants, and occupational factors in the appearance of cataracts. Environments 2024, 11, 87. [Google Scholar] [CrossRef]
- Burattini, C.; Borra, M.; Vespasiano, F.; Bisegna, F. UV Solar Energy and Erythemal Exposure: Mathematical Models to Assess the Dose on Vertical and Inclined Planes in Different Sky Conditions. Energies 2024, 17, 5718. [Google Scholar] [CrossRef]
- Maffei, M.; Canova, D.; Bertea, C.M.; Scannerini, S. UV-A effects on photomorphogenesis and essential-oil composition in Mentha piperita. J. Photochem. Photobiol. B 1999, 52, 105–110. [Google Scholar] [CrossRef]
- Kang, S.; Zhang, Y.; Zhang, Y.; Zou, J.; Yang, Q.; Li, T. Ultraviolet-a radiation stimulates growth of indoor cultivated tomato (Solanum lycopersicum) seedlings. HortScience 2018, 53, 1429–1433. [Google Scholar] [CrossRef]
- Zhang, Y.; Kaiser, E.; Zhang, Y.; Zou, J.; Bian, Z.; Yang, Q.; Li, T. UVA radiation promotes tomato growth through morphological adaptation leading to increased light interception. Environ. Exp. Bot. 2020, 176, 104073. [Google Scholar] [CrossRef]
- Zhang, Y.; Xu, J.; Li, R.; Ge, Y.; Li, Y.; Li, R. Plants’ response to abiotic stress: Mechanisms and strategies. Int. J. Mol. Sci. 2023, 24, 10915. [Google Scholar] [CrossRef]
- Gopikrishnan, G.S.; Kuttippurath, J. Global tropical and extra-tropical tropospheric ozone trends and radiative forcing deduced from satellite and ozonesonde measurements for the period 2005–2020. Environ. Pollut. 2024, 361, 124869. [Google Scholar] [CrossRef] [PubMed]
- Singh, S.; Lodhi, N.K.; Mishra, A.K.; Jose, S.; Kumar, S.N.; Kotnala, R.K. Assessment of satellite-retrieved surface UVA and UVB radiation by comparison with ground-measurements and trends over Mega-city Delhi. Atmos. Environ. 2018, 188, 60–70. [Google Scholar] [CrossRef]
- Proutsos, N.; Alexandris, S.; Liakatas, A.; Nastos, P.; Tsiros, I.X. PAR and UVA composition of global solar radiation at a high altitude Mediterranean forest site. Atmos. Res. 2022, 269, 106039. [Google Scholar] [CrossRef]
- Howell, T.A.; Meek, D.W.; Hatfield, J.L. Relationship of photosynthetically active radiation to shortwave radiation in the San Joaquin Valley. Agric. Meteorol. 1983, 28, 157–175. [Google Scholar] [CrossRef]
- Yu, X.; Wu, Z.; Jiang, W.; Guo, X. Predicting daily photosynthetically active radiation from global solar radiation in the Contiguous United States. Energy Convers. Manag. 2015, 89, 71–82. [Google Scholar] [CrossRef]
- Foyo-Moreno, I.; Alados-Arboledas, L. A new conventional regression model to estimate hourly photosynthetic photon flux density under all sky conditions. Int. J. Climatol. 2017, 37, 890–898. [Google Scholar] [CrossRef]
- Ferrera-Cobos, F.; Vindel, J.M.; Valenzuela, R.X.; González, J.A. Models for estimating daily photosynthetically active radiation in oceanic and mediterranean climates and their improvement by site adaptation techniques. Adv. Space Res. 2020, 65, 1894–1909. [Google Scholar] [CrossRef]
- García-Rodríguez, J.A.; García, I.; García-Rodríguez, A.; Díez-Mediavilla, M.; Alonso-Tristán, C. Solar Ultraviolet Irradiance Characterization under All Sky Conditions in Burgos, Spain. Appl. Sci. 2022, 12, 10407. [Google Scholar] [CrossRef]
- Escobedo, J.F.; Gomes, E.N.; Oliveira, A.P.; Soares, J. Ratios of UV, PAR and NIR components to global solar radiation measured at Botucatu site in Brazil. Renew. Energy 2011, 36, 169–178. [Google Scholar] [CrossRef]
- Proutsos, N.; Liakatas, A.; Alexandris, S. Ratio of photosynthetically active to total incoming radiation above a Mediterranean deciduous oak forest. Theor. Appl. Climatol. 2019, 137, 2927–2939. [Google Scholar] [CrossRef]
- Pashiardis, S.; Kalogirou, S.A.; Pelengaris, A. Statistical analysis for the characterization of solar energy utilization and inter-comparison of solar radiation at two sites in Cyprus. Appl. Energy 2017, 190, 1138–1158. [Google Scholar] [CrossRef]
- Barolet, D.; Christiaens, F.; Hamblin, M.R. Infrared and skin: Friend or foe. J. Photochem. Photobiol. B 2016, 158, 224–227. [Google Scholar] [CrossRef]
- Kalopesa, E.; Tziolas, N.; Tsakiridis, N.L.; Safanelli, J.L.; Hengl, T.; Sanderman, J. Large-Scale Soil Organic Carbon Estimation via a Multisource Data Fusion Approach. Remote Sens. 2025, 17, 771. [Google Scholar] [CrossRef]
- Gröbner, J.; Kouremeti, N. The Precision Solar Spectroradiometer (PSR) for direct solar irradiance measurements. Sol. Energy 2019, 185, 199–210. [Google Scholar] [CrossRef]
- Alados, I.; Foyo-Moreno, I.; Alados Arboledas, L. Photosynthetically active radiation: Measurements and modelling. Agric. For. Meteorol. 1996, 78, 121–131. [Google Scholar] [CrossRef]
- ISO 9847:1992; Solar Energy—Calibration of Field Pyranometers by Comparison to a Reference Pyranometer. International Organization for Standardization: Geneva, Switzerland, 1992.
- Alkhatib, H.; Norton, B.; O’Sullivan, D.T.J.; Lemarchand, P. Calibration of solar pyranometers for accurate solar irradiance measurements: A data set from the pre- and post-calibration process. Data Brief 2025, 48, 111402. [Google Scholar] [CrossRef]
- Urraca, R.; Huld, T.; Gracia-Amillo, A.; Martinez-de-Pison, F.J.; Kaspar, F.; Sanz-Garcia, A. Evaluation of global horizontal irradiance estimates from satellite-based models and reanalyses over Spain. Renew. Energy 2018, 123, 70–83. [Google Scholar] [CrossRef]
- Polo, J.; Wilbert, S.; Ruiz-Arias, J.A.; Meyer, R.; Gueymard, C.; Suri, M.; Geuder, N. Preliminary survey on site-adaptation techniques for satellite-derived and reanalysis solar radiation datasets. Sol. Energy 2016, 132, 25–37. [Google Scholar] [CrossRef]
- Beck, H.E.; Zimmermann, N.E.; McVicar, T.R.; Vergopolan, N.; Berg, A.; Wood, E.F. Present and future Köppen-Geiger climate classification maps at 1-km resolution. Sci. Data 2018, 5, 180214. [Google Scholar] [CrossRef]
- WMO. WMO Measurement Lead Centre at MOL RAO. WMO 2024. Available online: https://community.wmo.int/en/activity-areas/imop/measurement-lead-centres/measurement-lead-centre-lindenberg-germany (accessed on 30 July 2025).
- ISO 9060:2018; Solar Energy—Specification and Classification of Instruments for Measuring Hemispherical Solar and Direct Solar Radiation. International Organization for Standardization: Geneva, Switzerland, 2018.
- McCree, K.J. Test of current definitions of photosynthetically active radiation against leaf photosynthesis data. Agric. Meteorol. 1972, 10, 443–453. [Google Scholar] [CrossRef]
- Jacovides, C.; Tymvios, F.; Asimakopoulos, D.; Theofilou, K.; Pashiardes, S. Global photosynthetically active radiation and its relationship with global solar radiation in the Eastern Mediterranean basin. Theor. Appl. Climatol. 2003, 74, 227–233. [Google Scholar] [CrossRef]
- Gueymard, C.A. An atmospheric transmittance model for the clear sky beam, diffuse and global photosynthetically active radiation. Agric. For. Meteorol. 1989, 45, 215–229. [Google Scholar] [CrossRef]
- Kopp, G.; Lean, J.L. A new, lower value of total solar irradiance: Evidence and climate significance. Geophys. Res. Lett. 2011, 38, L01706. [Google Scholar] [CrossRef]
- Spencer, J.W. Fourier Series Representation of the Position of the Sun. Search 1971, 2, 172. [Google Scholar]
- Foyo-Moreno, I.; Alados, I.; Olmo, F.J.; Alados-Arboledas, L. The influence of cloudiness on UV global irradiance (295–385 nm). Agric. For. Meteorol. 2003, 120, 101–111. [Google Scholar] [CrossRef]
- Navas-Guzmán, F.; Fernández-Gálvez, J.; Granados-Muñoz, M.J.; Guerrero-Rascado, J.L.; Bravo-Aranda, J.A.; Alados-Arboledas, L. Tropospheric water vapour and relative humidity profiles from lidar and microwave radiometry. Atmos. Meas. Tech. 2014, 7, 1201–1211. [Google Scholar] [CrossRef]
- Nagaraja Rao, C.R. Photosynthetically active components of global solar radiation: Measurements and model computations. Arch. Meteorol. Geophys. Bioclimatol. Ser. B 1984, 34, 353–364. [Google Scholar] [CrossRef]
- Seinfeld, J.H.; Pandis, S.N. Atmospheric Chemistry and Physics: From Air Pollution to Climate Change, 3rd ed.; Wiley: Hoboken, NJ, USA, 2016; ISBN 9781118947401. [Google Scholar]
- Gueymard, C.A. The sun’s total and spectral irradiance for solar energy applications and solar radiation models. Sol. Energy 2016, 169, 55–85. [Google Scholar] [CrossRef]
- Akitsu, T.; Kume, A.; Hirose, Y.; Ijima, O.; Nasahara, K.N. On the stability of radiometric ratios of photosynthetically active radiation to global solar radiation in Tsukuba, Japan. Agric. For. Meteorol. 2015, 209, 59–68. [Google Scholar] [CrossRef]
- Wang, L.; Gong, W.; Ma, Y.; Hu, B.; Zhang, M. Photosynthetically active radiation and its relationship with global solar radiation in Central China. Int. J. Biometeorol. 2014, 58, 1265–1277. [Google Scholar] [CrossRef] [PubMed]
- Mottus, M.; Ross, J.; Sulev, M. Experimental study of ratio of PAR to direct integral solar radiation under cloudless conditions. Agric. For. Meteorol. 2001, 109, 161–170. [Google Scholar] [CrossRef]
- Moosmüller, H.; Chakrabarty, R.K.; Arnott, W.P. Aerosol Light Absorption and Its Measurement: A Review. J. Quant. Spectrosc. Radiat. Transf. 2009, 110, 844–878. [Google Scholar] [CrossRef]
- Boucher, O.; Randall, D.; Artaxo, P.; Bretherton, C.; Feingold, G.; Forster, P.; Kerminen, V.M.; Kondo, Y.; Liao, H.; Lohmann, U.; et al. Clouds and Aerosols. In Climate Change 2013: The Physical Science Basis; Stocker, T.F., Qin, D., Plattner, G.-K., Tignor, M., Allen, S.K., Boschung, J., Eds.; Cambridge University Press: Cambridge, UK; New York, NY, USA, 2013. [Google Scholar]
- Yao, J.; Huang, J.; Luo, Y.; Chen, X.; Wang, Y.; Fu, Q. Can atmospheric reanalyses (CRA and ERA5) represent cloud spatiotemporal characteristics? Atmos. Res. 2020, 238, 105091. [Google Scholar] [CrossRef]
- Shi, C.; Letu, H.; Nakajima, T.Y.; Nakajima, T.; Wei, L.; Xu, R.; Lu, F.; Riedi, J.; Ichii, K.; Zeng, J.; et al. Near-global monitoring of surface solar radiation. Innovation 2025, 6, 100876. [Google Scholar] [CrossRef] [PubMed]


Disclaimer/Publisher’s Note: The statements, opinions and data contained in all publications are solely those of the individual author(s) and contributor(s) and not of MDPI and/or the editor(s). MDPI and/or the editor(s) disclaim responsibility for any injury to people or property resulting from any ideas, methods, instructions or products referred to in the content. |
© 2025 by the authors. Licensee MDPI, Basel, Switzerland. This article is an open access article distributed under the terms and conditions of the Creative Commons Attribution (CC BY) license (https://creativecommons.org/licenses/by/4.0/).