Article

Evaluating Macroalgal Hyperspectral Reflectance Separability in Support of Kelp Mapping

School of the Environment, The University of Queensland, Brisbane, QLD 4072, Australia
*
Author to whom correspondence should be addressed.
Remote Sens. 2025, 17(20), 3491; https://doi.org/10.3390/rs17203491
Submission received: 5 September 2025 / Revised: 28 September 2025 / Accepted: 6 October 2025 / Published: 21 October 2025

Abstract

Highlights

What are the main findings?
  • Kelps and macroalgae show moderate to good spectral separability using only their hyperspectral reflectance profiles.
  • Specimens from different regions differed enough in their spectral reflectance to allow them to be accurately labelled by region.
What is the implication of the main finding?
  • Kelp and the other macroalgae examined here are suitable candidates for genus-level mapping using high-spatial-resolution, hyperspectral Earth Observation imagery.
  • Of the methods examined here, random forest classification is best suited for large-extent kelp mapping as it can handle intra-genus variability caused by geography, environmental conditions, and/or seasonality.

Abstract

Satellite-based Earth Observation (EO) has been proposed as an efficient, replicable, and scale-able method for monitoring kelp forests. Although kelps (Laminariales) have been mapped with multispectral EO, no evaluation of kelps’ separability across genera, and from other macroalgae, has been conducted with image-applicable methods. Since kelps and other macroalgae commonly cooccur, characterising their spectral separability is vital to defining appropriate use-cases, methods, and limitations of mapping them with EO. This work investigates the spectral reflectance separability of three kelps and twelve other macroalgae from three distinct regions of Australia and New Zealand. Separability was evaluated using hierarchical clustering, spectral angle, random forest classification, and linear discrimination classification algorithms. Random forest was most effective (average F1 score = 0.70) at classifying all macroalgae by genus, while the linear discriminant analysis was most effective at differentiating among kelp genera labelled by sampling region (average F1 score = 0.93). The observed intra-class geographic variability indicates that macroalgal spectral reflectance is regionally specific, thereby limiting reference spectrum transferability and large-spatial-extent classification accuracy. Of the four classification methods evaluated, the random forest was best suited to mapping large spatial extents (e.g., >100 s km2). Using aggregated target classes is recommended if relying solely on spectral reflectance information. This work suggests hyperspectral EO could be a useful tool in monitoring ecologically and economically valuable kelp forests with moderate to high confidence.

1. Introduction

The Australian Bureau of Statistics released its second edition of the National Oceans Account in 2024 as a resource for policy makers, ecosystem managers, and researchers to better understand the country’s “Blue Carbon” ecosystems. Despite interest in including them in the inventory, kelp forests were omitted for lack of data [1]. While commonly used to describe a wide variety of brown macroalgae, the term “kelp” is here used to refer exclusively to true kelps, i.e., members of the order Laminariales. The interest in kelp forests as potential “Blue Carbon” ecosystems is not limited to Australia: including kelp forests in carbon budgeting has been suggested for Canada, Japan, and Europe [2,3,4]. With recent work estimating global kelp forests provide an annual average of $500B in ecosystem services like fishery support and nitrogen removal [5], many other organizations (in Australia and abroad) are similarly interested in inventorying, monitoring, and managing kelp. Kelp presence and extent are however highly variable due to their very rapid growth rates and acute environmental sensitivities [6]. Considering that they are also often found in inaccessible locations (i.e., coastal waters with high wave energy), surveying and monitoring kelp forests in situ are difficult.
Earth Observation (EO) from airborne or satellite systems has been suggested as an alternative to in situ kelp monitoring. Whereas in situ monitoring requires personnel in or on the water with highly specialised equipment and rigorous training, EO by drone, aircraft, or satellite can be completed with reduced safety risks and financial burden (where appropriate imagery exists) [7,8]. Once workflows are established and validated, image analysis can occur as often as, and for whichever location, the imagery source allows thus facilitating large-spatial-extent or long-timeseries analyses.
An important aspect of establishing any such airborne or satellite image-based workflow is determining a target’s (or set of targets’) “spectral separability”: the degree to which spectral reflectance measurements can identify and differentiate the target from other materials. If a target is not spectrally separable from other targets or classes in the image, a map relying solely on spectral reflectance data and analysis should be limited to identifying an aggregated class of those inseparable materials. Understanding the spectral separability of kelps and macroalgae (or any other mapping target) is essential to properly designing and interpreting maps based on EO imagery.
The value of examining spectral separability is highlighted when examining some existing kelp maps. In producing a world-first global kelp cover map, Mora-Soto et al. [9] labelled all identified pixels as a combined Macrocystis pyrifera and Ulva spp. class. While their methods were developed using Macrocystis-specific data, their index calculated the difference between a NIR band and a red band and was therefore largely insensitive to differences in vegetation pigmentation, leading to the inability to distinguish between brown and green algae. Presenting the kelp index output as species-specific because the training data were monospecific may have also systematically mis-identified other kelps and macroalgae. Understanding macroalgal reflectance separability given the available spectral information could have guided the research design phase and contributed to interpreting the results more precisely. While the significant computational and data storage requirements of global scale mapping do favour simpler methods like indices and thresholding, the two shortcomings identified above highlight the need for further investigation into kelps’ (and any co-occurring macroalgae’s) spectral separability for future mapping applications.
There is a small body of existing research examining the spectral separability of macroalgae. Olmedo-Masat et al. [10] collected hyperspectral reflectance data of 28 algal species in Patagonia. Using class-averaged reflectance spectra and unsupervised hierarchical clustering analysis (HCA), they found seven highly separable species clusters (reported phylum-level clustering with 98–100% certainty, sub-phylum clade certainty > 80%) [10]. Douay et al. reproduced their analytic workflow on 16 macroalgae sampled from the North Atlantic but analysed individual measurements to maintain intra-class variability [11]. They similarly found four highly separable species clusters of the three phyla (reported certainty of 96–100%). The unsupervised nature of the HCA means that clusters change between images with differing footprints and thereby differing material compositions. This was illustrated by the poor HCA performance in handling new data: only one of seven added spectra was correctly clustered. In the case of targeted kelp mapping, which is primarily a detection problem, the use of a priori information in supervised classification can thereby produce more useful, reliable, and consistent results [12]. Lastly, as HCA performs one-to-one comparisons between all reflectance spectra, the computational demand of hierarchical clustering increases exponentially with data volume, making it infeasible for use on large datasets like regional-scale imagery.
While this existing literature suggests that macroalgal phyla are spectrally separable [10,11], translating their results to airborne or satellite images at local (1–10 km) to regional or national (>1000 km) scales is infeasible due to their limited inclusion of intra-class variability and the impracticability of pixel-wise image classification through a hierarchical cluster analysis. Although Olmedo-Masat et al. [10] did sample at three sites, clustering only the median spectra eliminated intra-specific variability. Conversely, Douay et al. [11] analysed individual reflectance spectra to maintain phenotypic variability but collected specimens from only one location, precluding the examination of geographic variability. Further, they found reduced separability amongst macroalgae when analysing data across seasons, suggesting seasonal reflectance variability through temporal changes in pigment compositions [11,13]. For accurate EO mapping to occur, these sources of intra-class variability within an image (or image composite) must all be present in the training data.
Others have examined macroalgal spectral reflectance separability at higher taxonomic levels. McIlwaine et al. [14] statistically analysed the separability of seven macroalgal species (including three kelps) measured with a field spectrometer in the North Atlantic using an ANOVA per wavelength measured and ANOSIM tests to verify similarity between classes. They found that the reflectance of kelp, fucoids and other macroalgae were statistically different (global R = 0.549, p < 0.001). All but one pairwise comparison likewise demonstrated statistically different reflectance (p < 0.001). However, visual assessment of the collected reflectance spectra through a multivariate analysis showed no discernible separation amongst the kelp species or the fucoids [14]. In another examination of macroalgal spectral reflectance separability, Chao Rodriguez et al. [15] collected hyperspectral measurements of 36 algal species but classified them only to their colours (red, green or brown). Kotta et al. [16] similarly used hyperspectral measurements to primarily examine colour-level distinctions but focused on identifying bands in which groups could best be separated. Studies of reflectance separability, such as those discussed above, remain reliant on conventional classifiers or statistical methods; deep learning algorithms are therefore out of the scope of this paper despite their acknowledged increasing popularity in mapping.
Assessing kelp and macroalgal reflectance separability across large areas and many species has previously been hindered by a dearth of openly accessible data. This paper therefore addresses that challenge by producing and publishing a novel dataset of hyperspectral reflectance profiles of many types of kelp and macroalgae. Using that dataset, the reflectance separability amongst kelps and other macroalgae is evaluated in the context of supporting future large-spatial-extent (>1000 km2) kelp mapping. Reflectance measurements were collected from multiple locations in southern Australia and New Zealand to expressly include geographic variability in the analysis as extensive mapping would necessarily cover diverse ecosystems (in terms of exposure, slope, etc.) and large distances. The classification methods applied (hierarchical clustering, spectral angle, random forest, and linear discriminant) were selected to allow comparisons of this work to the existing literature and to ensure the results are relevant to image interpretation and analysis. This novel understanding of kelp and macroalgal reflectance will provide guidance for the creation and interpretation of future maps.

2. Data and Methods

2.1. Methods Overview

For this study, in situ spectral profiles from kelp and co-occurring macroalgae were acquired to form the input of the spectral separability assessment. All data then underwent the analytic workflow presented in Figure 1 and described in detail in the following sections. In summary, the reflectance spectra were cleaned and pre-processed then analysed with four classification methods: Hierarchical Clustering, Spectral Angle, Random Forest, and Linear Discriminant Analysis. Hierarchical clustering is included here to align with past work on macroalgal separability, but it is of limited use in image analysis as its computational demand increases exponentially with increasing samples. By contrast, the three other classifiers implemented in this work are easily applied to image analysis and are here collectively referred to as “image-applicable classifiers”. The image-applicable classifiers were evaluated by their F1 scores to account for unequal sample sizes. The classifications were repeated with a reduced dataset of only kelp samples to examine the effect of intra-class variability. Table 1 presents a high-level overview of each classifier and their data requirements.
Generative AI was used to assist in reformatting and annotating the functional code after the authors completed it and to interpret error messages during code development; Generative AI was not used to create new code. All spectral data collected for this analysis is available (see Data Availability Statement).

2.2. Field Data Collection Sites

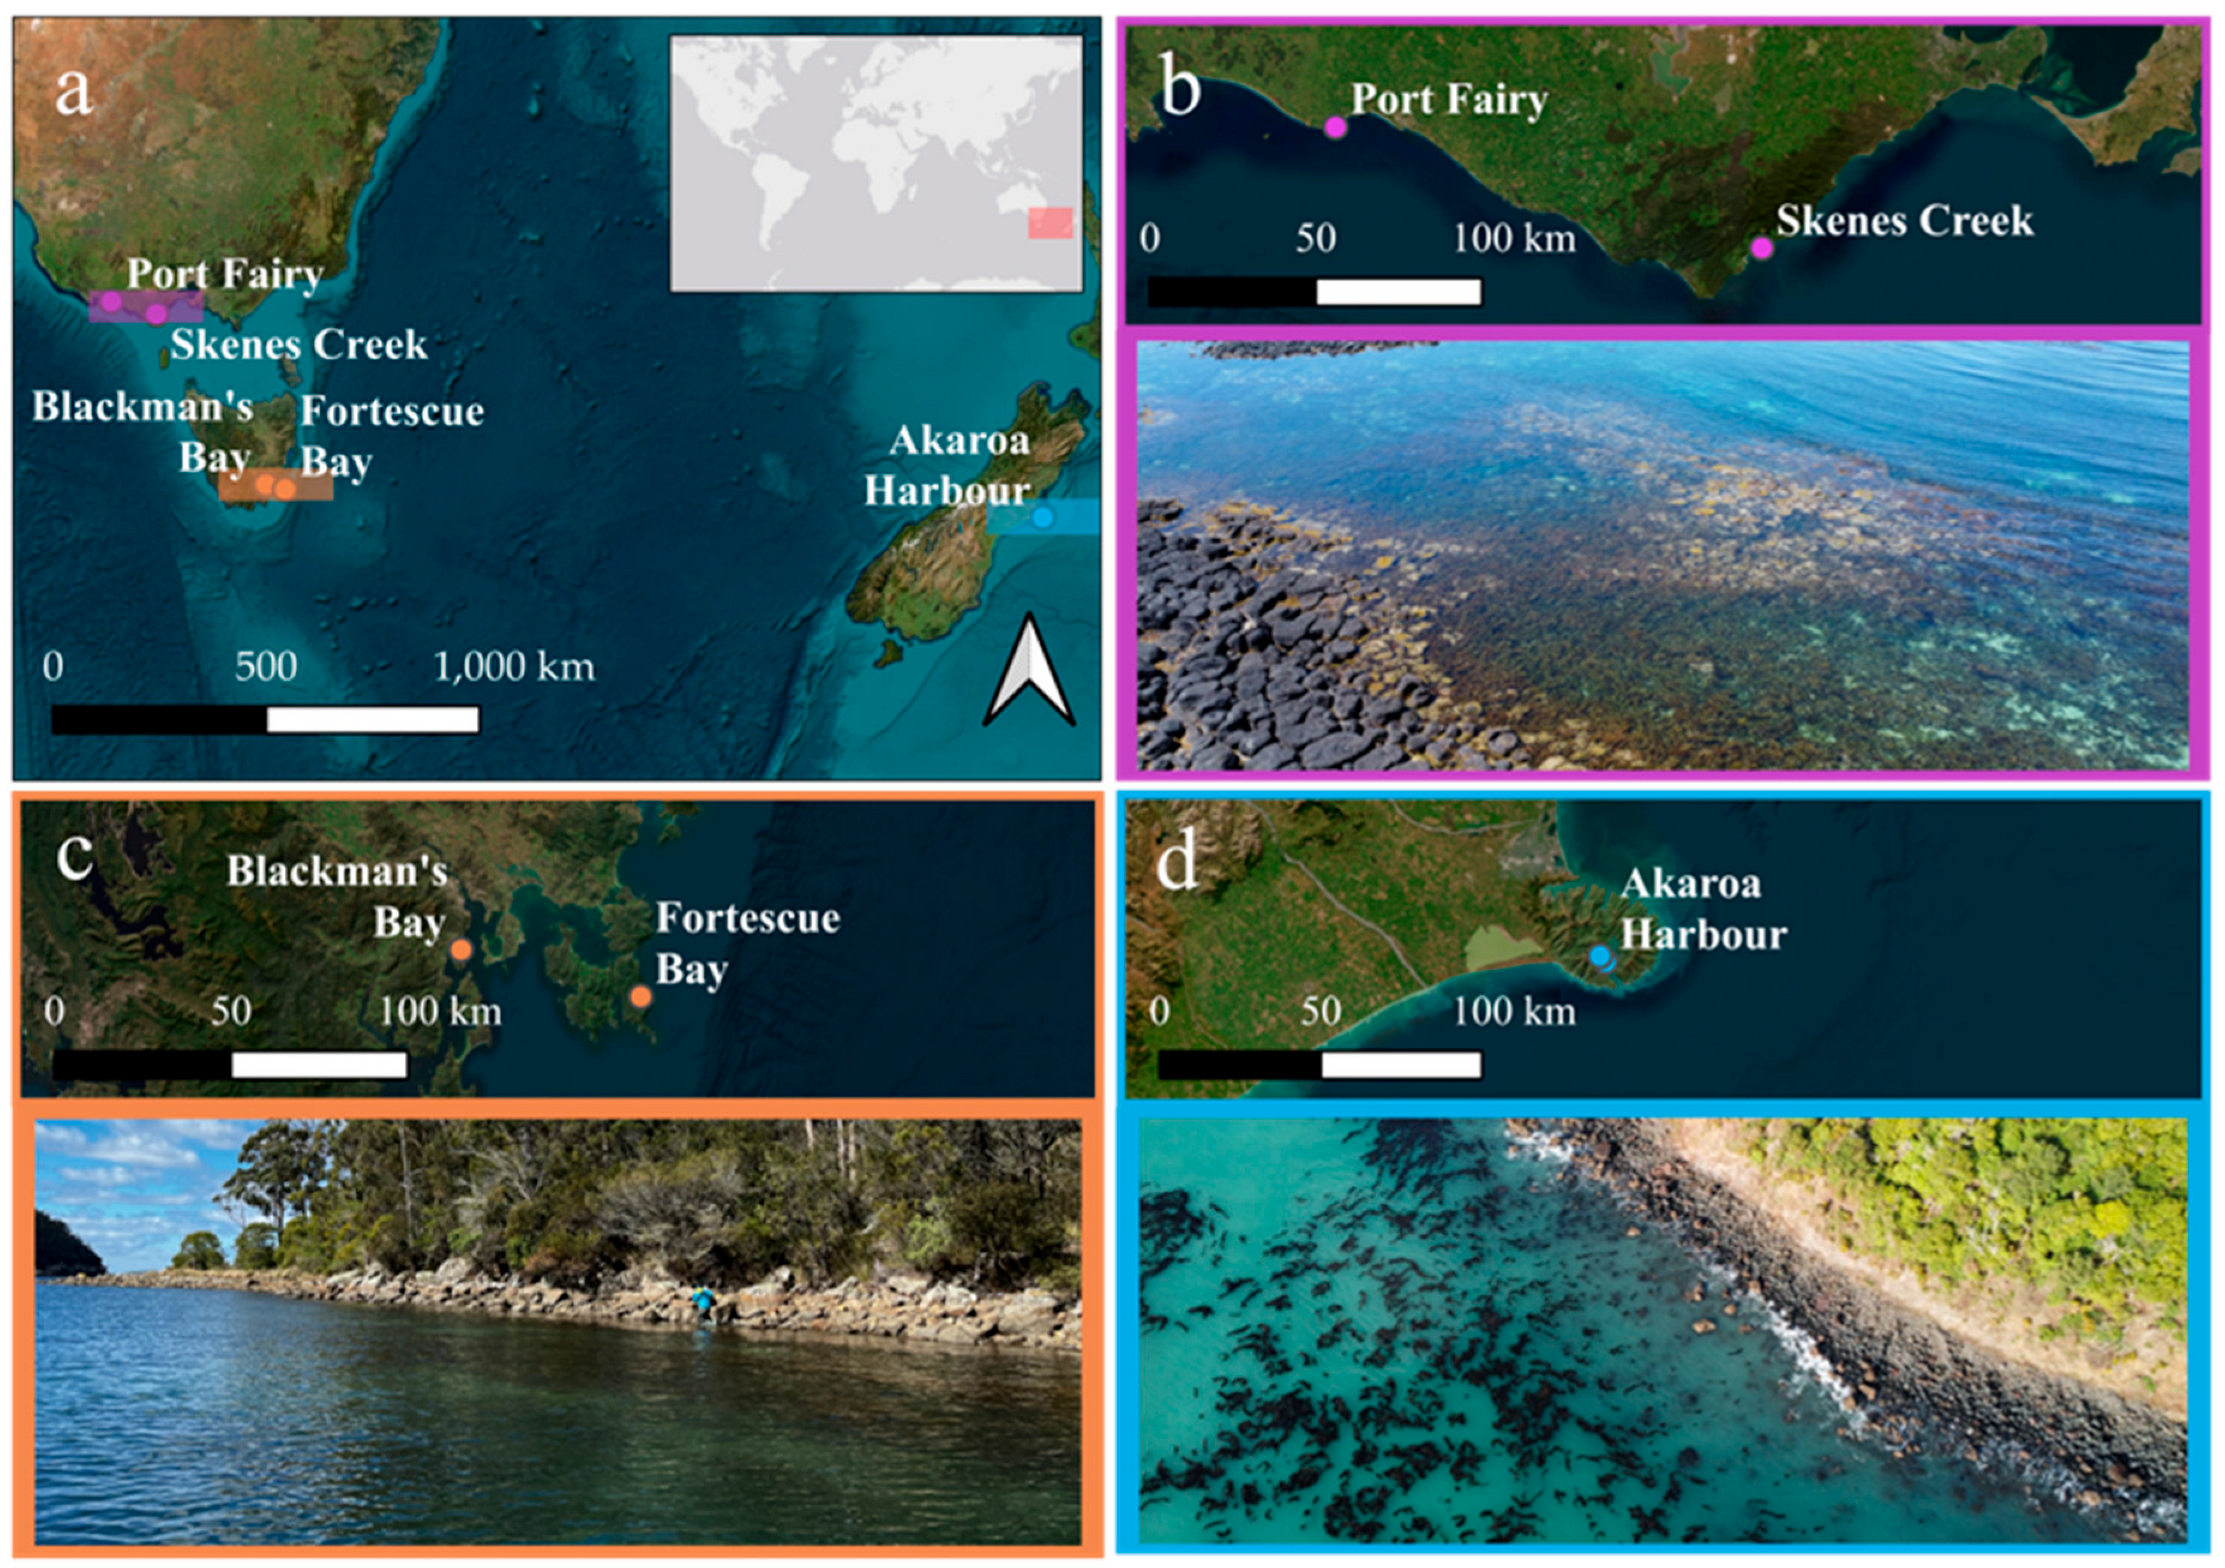
Reflectance spectra were collected during three field campaigns. The three regions, depicted in Figure 2, were chosen for ease of access, ecosystem variability, and geographic spread. The first included two sampling sites on the Sea Country of the Eastern Maar people along the southern coast of Victoria, Australia. Port Fairy is located within the Otway bioregion while Skenes Creek is in the Central Victoria bioregion [17]; both are southernly facing, fully exposed rocky shores with shallow slopes. Reflectance spectra were collected in situ from floating wrack found in Port Fairy and a mixture of attached intertidal and freshly beach-cast materials found at Skenes Creek on 21 and 22 February 2024, respectively. The second campaign was to Akaroa Harbour, New Zealand. The sea-floor gradient of the harbour is highly variable, with >70° slopes near the harbour inlet and tidal flats at the innermost sections [18]. Due to its narrow inlet, the inner harbour is somewhat sheltered from the large waves and storm surge of the Southern Ocean. Beach-cast kelp was measured in situ on 8 July 2024, and kelp harvested by local farmers was measured ex situ on 9 and 11 July 2024. During the third campaign, floating, freshly beach-cast, and attached intertidal material was measured at Blackman’s Bay beach and Fortescue Bay in southeastern lutruwita/Tasmania, Sea Country of the Palawa people, on 13, 15, and 20 September 2024. Both sites are in the Bruny bioregion [17] with Blackman’s Bay having moderate exposure to ocean waves at the mouth of the Derwent River while the Fortescue site is very sheltered from waves and swell. Collaboration with two local kelp harvesters in Akaroa Harbour allowed the removal of kelp samples from their farms. No material was harvested or removed in the other two regions. Floating material and fresh beach-cast were included as healthy detached macroalgae can be equally as photosynthetically active and healthy as attached specimens [19].

2.3. Spectral Reflectance Collection

As sample collection permissions varied across jurisdictions, two collection methods were used: in situ and ex situ. Both were conducted outdoors within two hours of solar noon using an ASD HandHeld 2 spectrometer (Malvern Panalytical, Malvern, Worcestershire, UK) and an attached 1 m, 1000 μm fibre optic cable with an 8° field of view (FOV) tip. The instrument collects relative reflectance (R) data in 751 bands from 325 to 1075 nm at a 1.5 nm sampling interval. Fifteen classes of macroalgae were sampled: twelve genera of phaeophytes (three of which are kelp), one chlorophyte genus (Ulva), and two growth forms of rhodophytes (frondose and filamentous) as identification to the genus level was uncertain. All samples of brown and green macroalgae were identified to the genus level using [20]. The red algae could not be confidently identified so were labelled by growth type (filamentous or frondose). Example images of the macroalgae sampled here are available in Supplementary Materials SM 1.

2.3.1. Outdoor In Situ

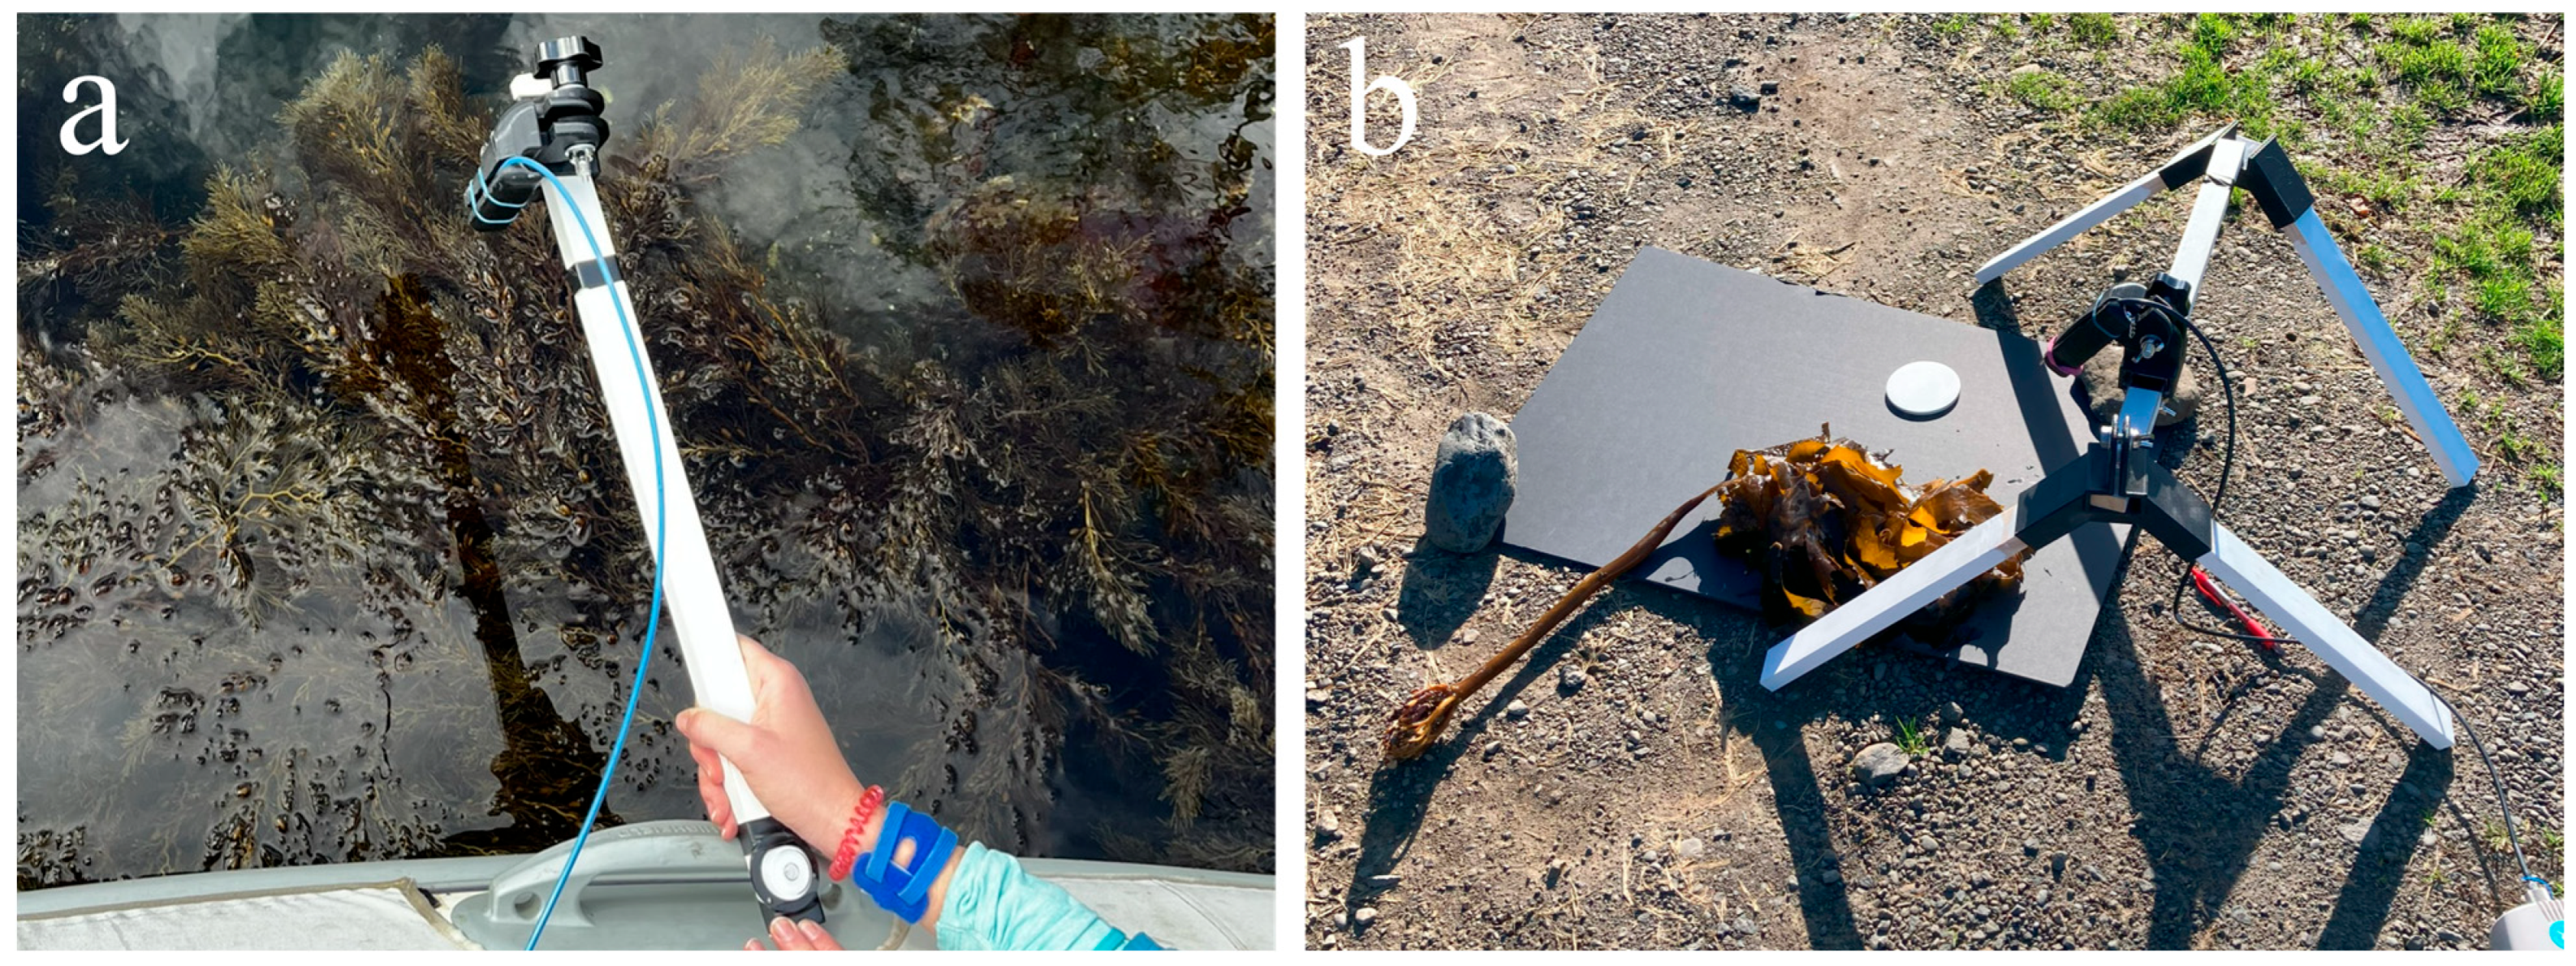
In situ measurements were taken with the fibre optic cable secured in a custom mount at the end of a white rod to separate the operator and target, as shown in Figure 3a. Targets were identified for measurement if there was at least 10 cm in diameter of homogenous material. Measurements were collected at nadir, 20 cm from the target resulting in a measurement footprint diameter of 2.8 cm. The instrument was re-optimized and calibrated using a white Spectralon panel when illumination conditions changed or every 15 min, whichever was more frequent. Reflectance spectra were collected with an integrating time of 68 ms and averaged over 10 measurements. As these measurements were often collected between breaking waves in the intertidal zone, it was impossible to collect multiple measurements of the same specimen without possible duplication. Each identified specimen was therefore only measured once, but multiple individuals of each type were measured when found.

2.3.2. Outdoor Ex Situ

Outdoor ex situ measurements were possible in Akaroa for specimens collected by farmers on their own farms. As depicted in Figure 3b, a custom mount pointed the fibre optic cable at the targets and reference panel laying on a homogeneous, matte, black background verified to have consistent, low reflectance across all wavelengths; a laser pointer facilitated aiming. The fixed 57° viewing angle from a height of 31 cm with an 8° FOV produced an ovate footprint with long and short axis lengths of 9.6 cm and 4.3 cm, respectively [21]. After optimization and calibration using the Spectralon panel, a white reference and five target measurements were taken. Samples were made to cover the entire FOV and rearranged between each measurement, an attempt was made to minimize self-shading.

2.4. Spectral Reflectance Analysis Workflow

2.4.1. Pre-Processing of Field Reflectance Data

All data were converted from digital numbers to reflectance and resampled to a 1 nm band interval using ViewSpec Pro v6.2 [22]. As all specimens were wet at the time of measurement, and intertidal specimens could not always be arranged for measurement, glint and water contamination was sometimes unavoidable. All reflectance spectra were therefore manually filtered to remove those with suspected glint or water spectral contamination. Glint was identified by the presence of elevated reflectance in the 350–450 nm range, while water contamination was identified as a steep depression in reflectance beyond 700 nm. Bands from 753 nm to 769 nm were masked due to sensor malfunction.
Two wavelength ranges of interest were identified: one from 400 nm to 700 nm (matching past works, hereafter referred to as VIS-only) and the other from 460 nm to 925 nm (the region of lowest signal noise in this specific dataset, hereafter referred to as VIS-NIR). The reflectance data were therefore subset to each of these wavelength ranges for investigation. All reflectance spectra in both subset datasets were scaled to zero mean and unit variance using StandardScaler from the Scikit learn python library [23].

2.4.2. Hierarchical Clustering Analysis (HCA)

A Hierarchical Clustering Analysis (HCA) was conducted following the works of Olmedo-Masat et al. [10] and Douay et al. [11]. Multiscale bootstrapping of the clustering was performed using a reimplementation of the pvclust function originally developed in R [24,25] using Ward’s dissimilarity agglomeration and Euclidean distance as the metric. The cluster formation probability was evaluated by the Approximately Unbiased (AU) p-value, calculated by the pvclust function, as it is meant to be robust considering differing numbers of clusters [26]. AU p-values range from 0 to 100, with higher values indicating more consistent cluster formation across bootstraps.
Three HCAs were performed for each of the two wavelength ranges. The first clustered the class means of the 15 genera of macroalgae, like the analysis conducted by Olmedo et al. [10]. The second analysed only kelp genera, but subdivided the groups by sampling site (e.g., Ecklonia was represented as two classes, one from Victoria and one from New Zealand) to check for differences in kelp reflectance across geographic locations. The third classified all reflectance spectra by genus (thus including intra-class geographic variability), mirroring the Douay et al. analysis with a larger dataset.

2.4.3. Spectral Angle Classification (SAM)

The spectral angle mapper [27] technique was adapted in Python 3.12 for application to point measurements instead of images, and hereafter referred to as the Spectral Angle Method (SAM). The spectral angle mapper calculates the cosine between each spectrum and each class mean plotted in n-dimensions (where n is the number of wavelengths) [27]. In this adaptation, each spectrum was removed from its own class before that class’s average was computed, and the angles between the sample spectrum and all class averages were computed. Samples were assigned to the class resulting in the minimum angle. This leave-one-out validation logic was chosen over a conventional division of a training and testing sets as some classes contained relatively few samples and averages would thereby be highly susceptible to stochasticity.

2.4.4. Random Forest Classification (RF)

A random forest (RF) classifier was implemented using the scikit learn module in Python 3.12 [23] as an example of an image-applicable method that does not rely on reference spectra or class averages. Before classification, the reflectance spectra were decomposed into principal components, and the first seven most explanatory variables were selected. At least seven components were required to produce an average classifier accuracy within 5% of the estimated maximum accuracy across all possible n values. Further details on the choice of n are presented in the Supplementary Materials. The reflectance spectra were split into 70% training and 30% testing data stratified by class to ensure representation of all classes in both datasets.
The RF hyperparameters were fine-tuned using a grid search with three stratified K-folds evaluated with the Gini Index and the macro F1 score as the metric. This grid search produced a maximum classification accuracy of 69.6% and identified the following optimal hyperparameter values: max tree depth = 25, tree count = 95, minimum samples to split node = 2, and max leaf count = 50. The RF was run 10,000 times with training and testing data re-split before each run to mitigate stochastic effects arising from dataset division. Matrices of the mean confusion errors across all runs and the standard deviation of those errors were made. Although the grid search was conducted on the dataset of all target classes, the same values were used to classify the reduced dataset of kelp labelled by genus and site.

2.4.5. Linear Discriminant Analysis (LDA)

The Linear Discriminant Analysis (LDA) available through scikit learn [23] was applied to the pre-processed reflectance spectra (no PCA or other dimension reduction applied). Thirty percent of spectra were split into a testing dataset (stratified by class) and the LDA components were calculated on the remainder of the reflectance data. This classification was re-run 10,000 times to account for the stochastic effects of sample distribution between the training and testing sets. The overall performance of the LDA was evaluated as described above for the RF.

3. Results

3.1. Reflectance Profiles

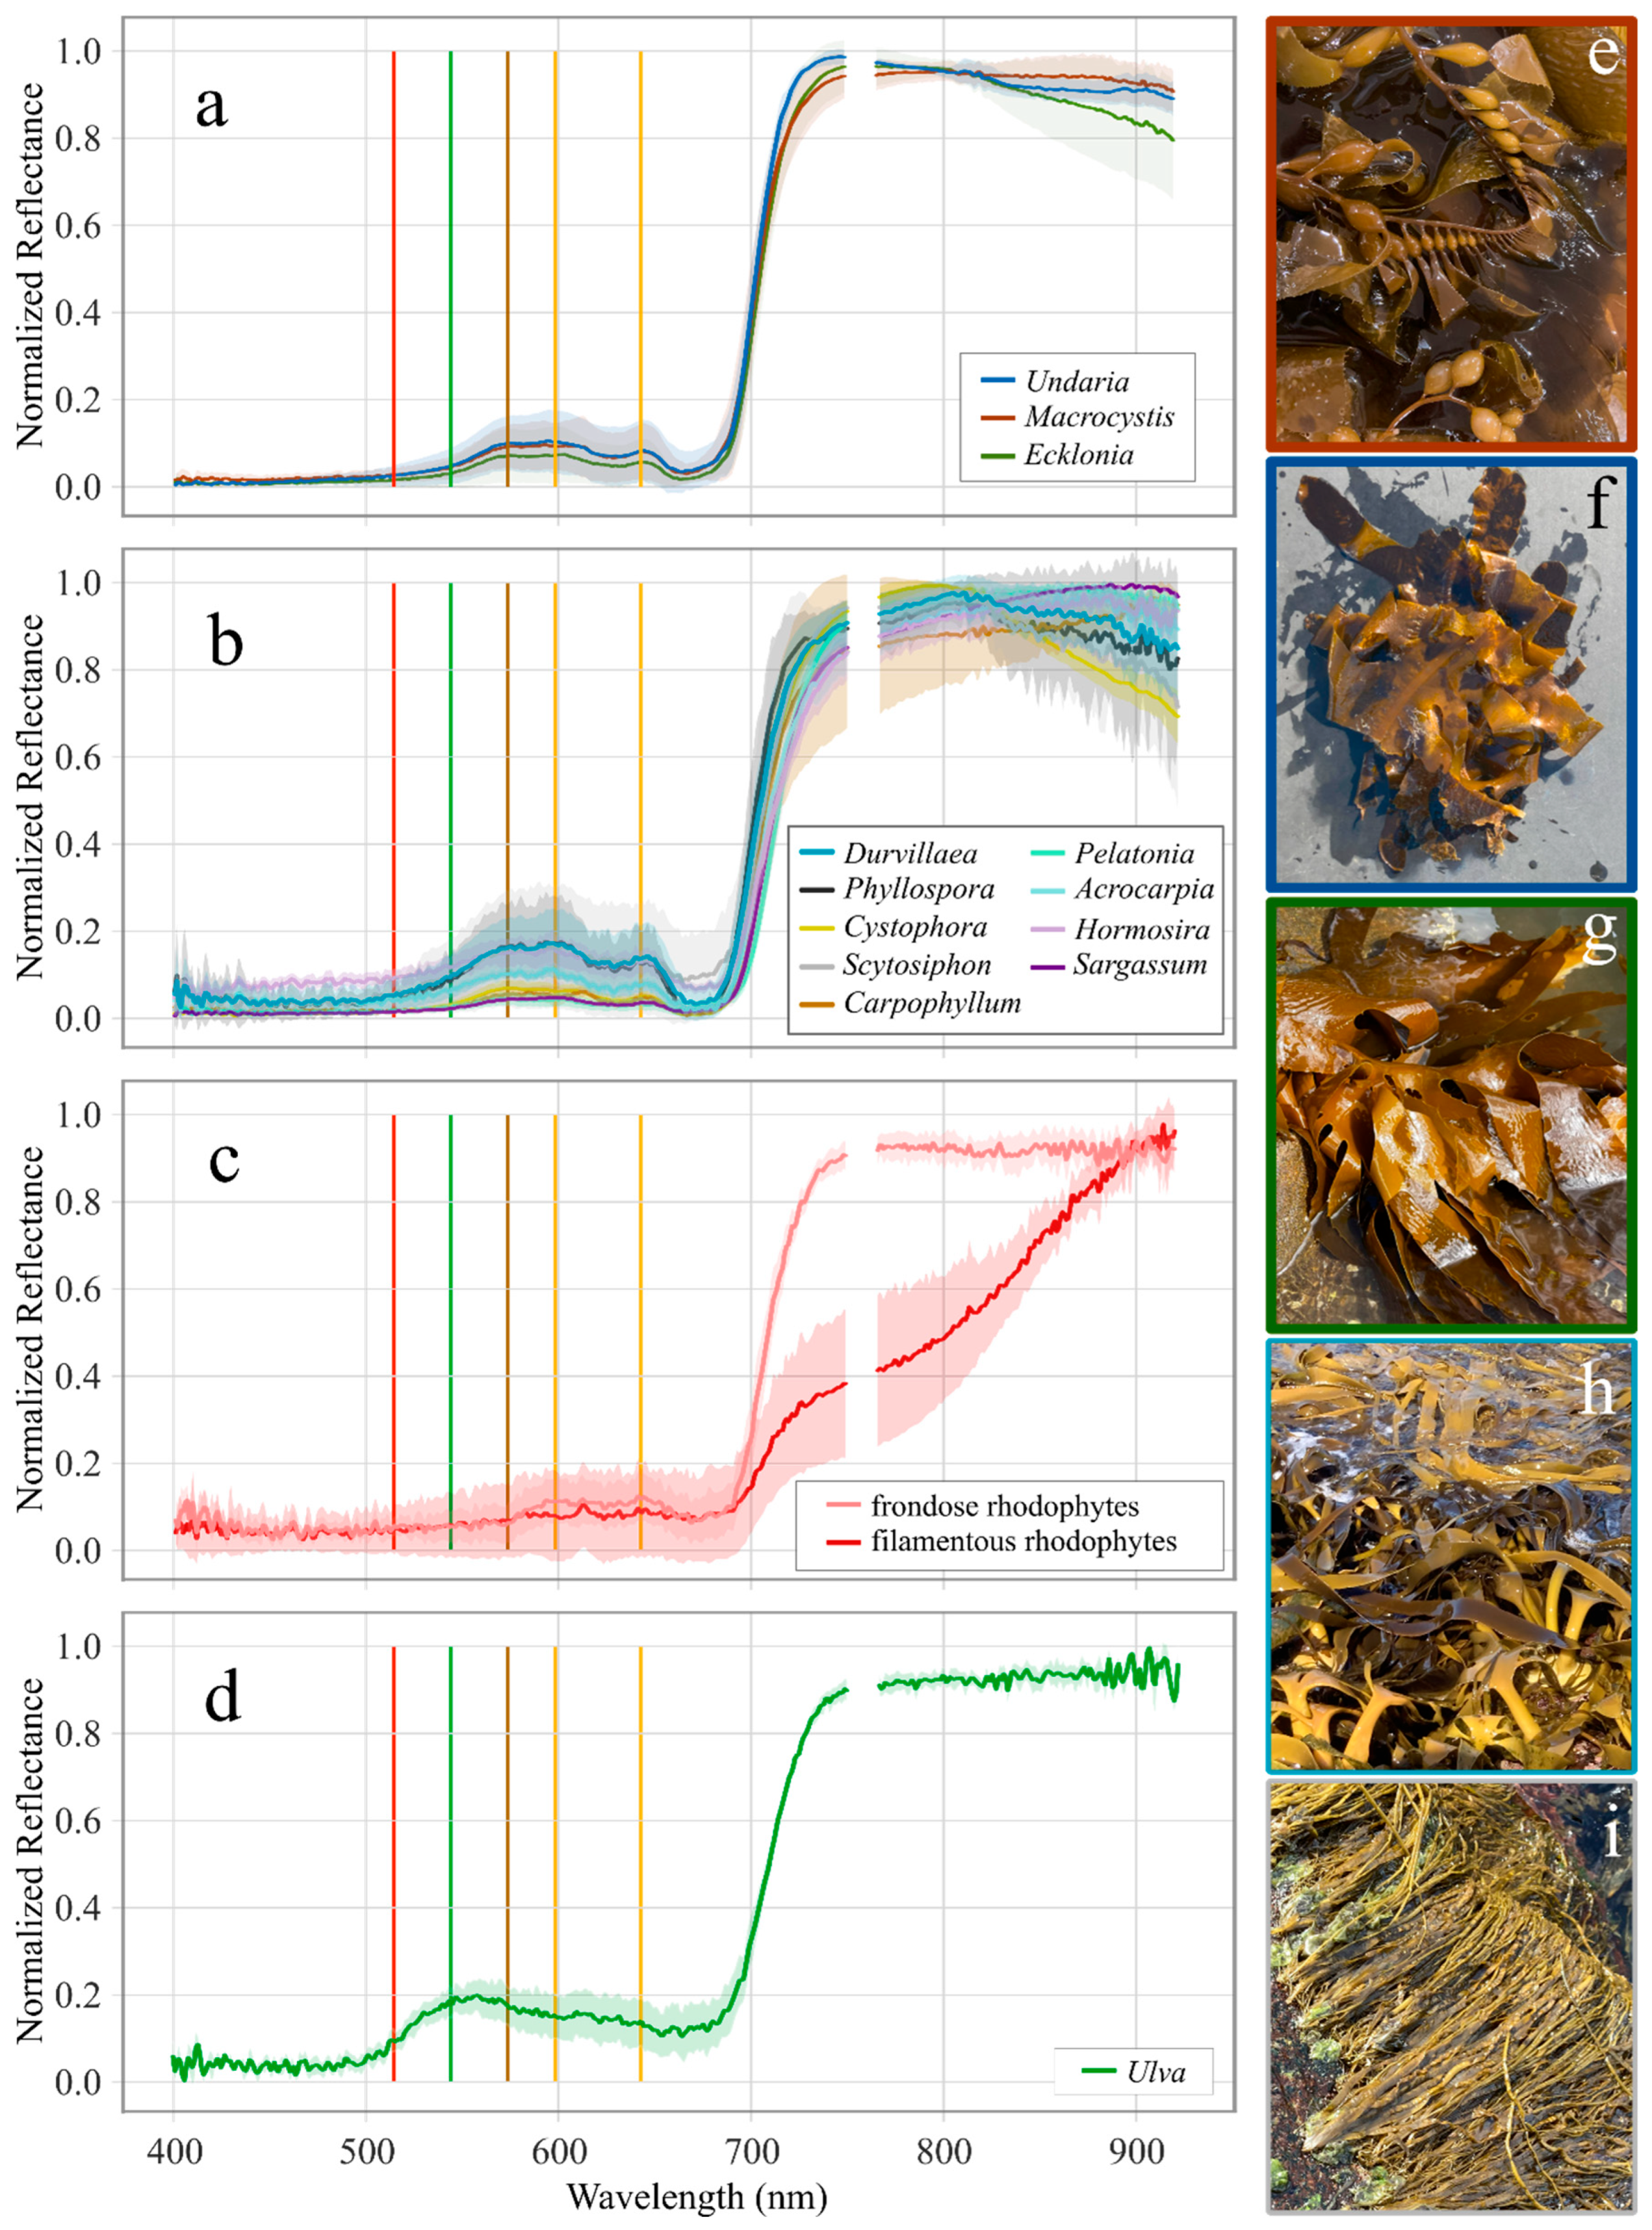
Figure 4 presents the mean normalized profiles of all sampled genera and field photos of five example phaeophytes; photographs of other genera are available in the Supplementary Materials.
All phaeophytes sampled (Figure 4a,b) demonstrate local reflectance maxima around 570 nm, 600 nm, and 645 nm resulting from the absorption Chlorophyll-a and Chlorophyll-c [15]. They also showed high absorption below 550 nm, presumably due to the presence of fucoxanthins that strongly absorb radiation below 540 nm, and a strong red edge around 700 nm. Some measurements did present a sudden decrease in reflectance at 725 nm (see the shaded region for Scytosiphon in Figure 4b, for example), potentially due to a small amount of water on the specimens’ surfaces.
The rhodophytes are most visibly different amongst the phyla, particularly through the very short red-edge and reduced NIR reflectance of the filamentous growth type (Figure 4c). Both growth types present reflectance features at 600 nm and 645 nm also recorded by Olmedo-Masat et al. [10] and Douay et al. [11], with the filamentous rhodophytes presenting an additional pronounced reflectance peak at 615 nm. The filamentous rhodophytes also show high variability in reflectance magnitude across the spectral range examined.
The chlorophytes were represented by a single genus, Ulva, found in Tasmania. Its reflectance profile, presented in Figure 4d, closely follows that of other green vegetation, with a major reflectance peak at 550 nm and a minor one near 600 nm, corresponding to Chlorophyll-b reflectance widely reported elsewhere [10,11,28].

3.2. Hierarchical Clustering Analyses

3.2.1. Macroalgal Class Means

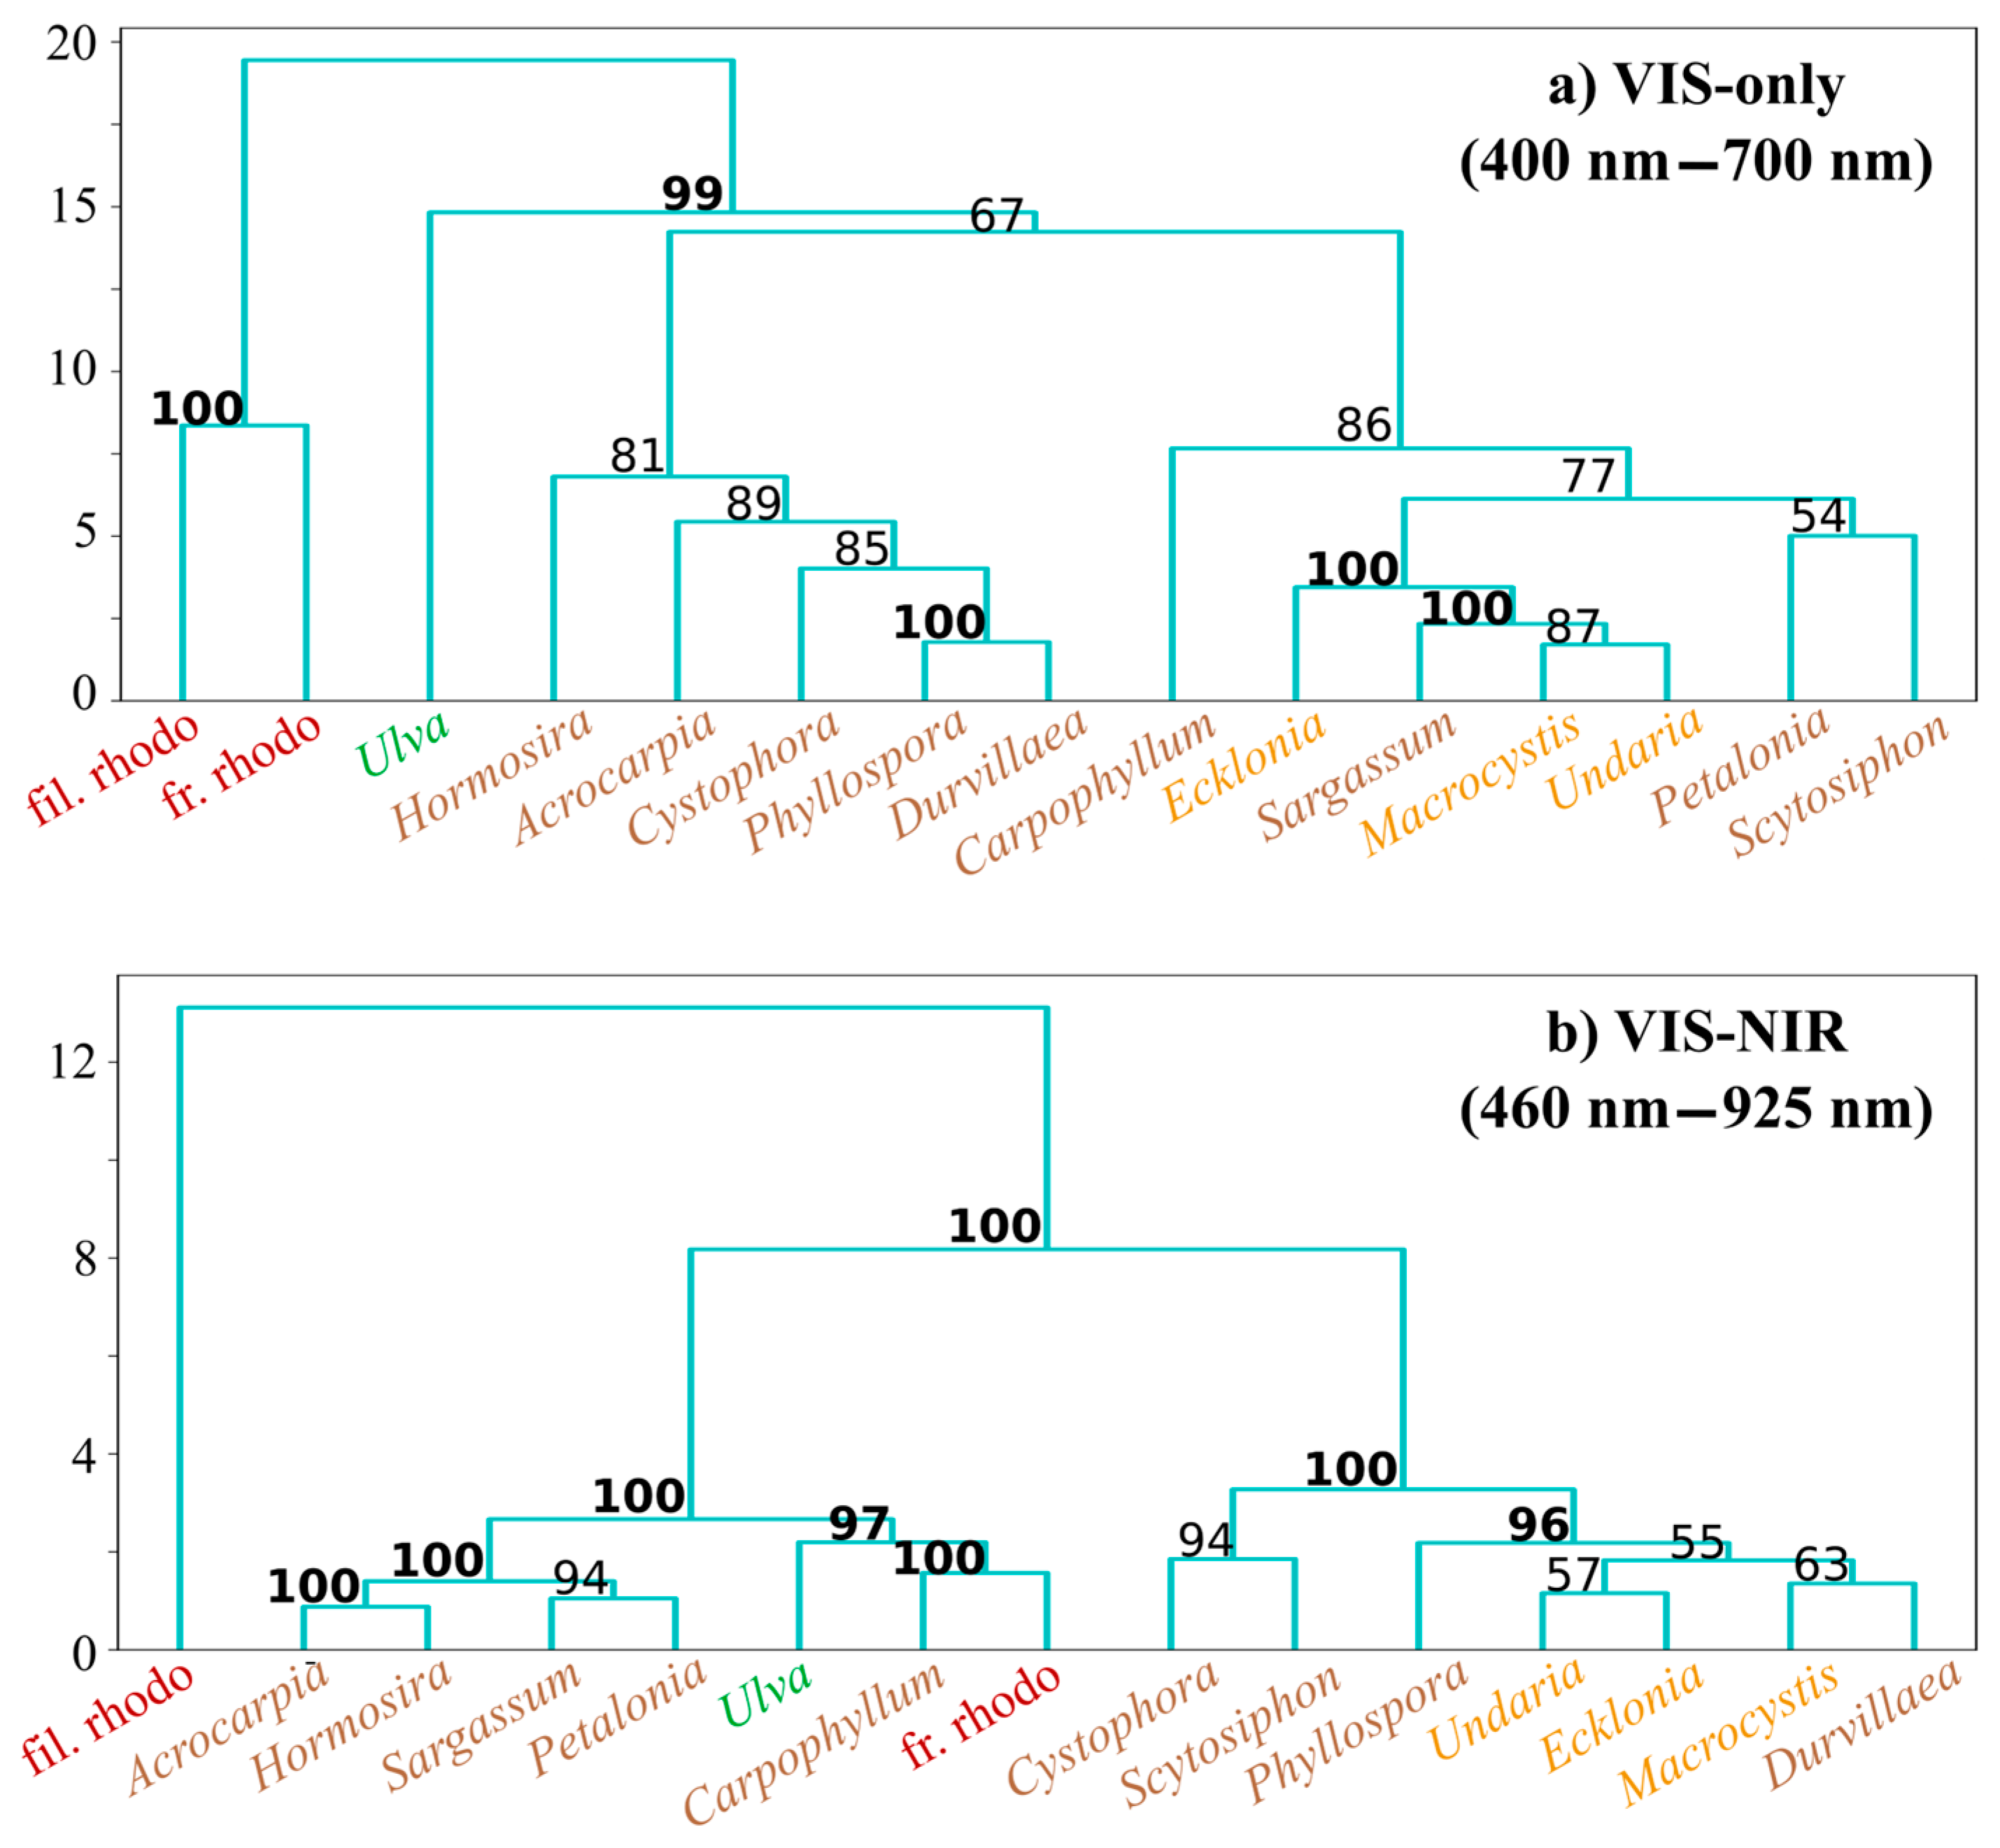
The results of clustering reflectance spectra by HCA depended on the wavelength range of the input data. As shown in Figure 5, the two spectral ranges produced substantially different dendrograms in both structure and certainty. The VIS-NIR data produced more certain clusters than the VIS-only reflectance spectra, with all VIS-NIR clusters being over 90% certain except for those distinguishing amongst the three Laminariales and Durvillaea (AU p-values of 55–63, Figure 5b). Considering cluster compositions, the VIS-only dendrogram in Figure 5a is the more intuitive of the two: the three highest level branches of the dendrogram separate the macroalgae by colour (red, green, brown). Contrastingly, the VIS-NIR first separates the filamentous rhodophytes, then progressively clusters the remaining frondose macroalgae with the colour groups being confidently separated from each other in lower branches (AU p-values of 97–100). As this work evaluates spectral separability by genus, rather than by phylum (colour), the VIS-NIR region producing more confident clustering across all levels will be used in subsequent analysis.

3.2.2. Macroalgae by Genus

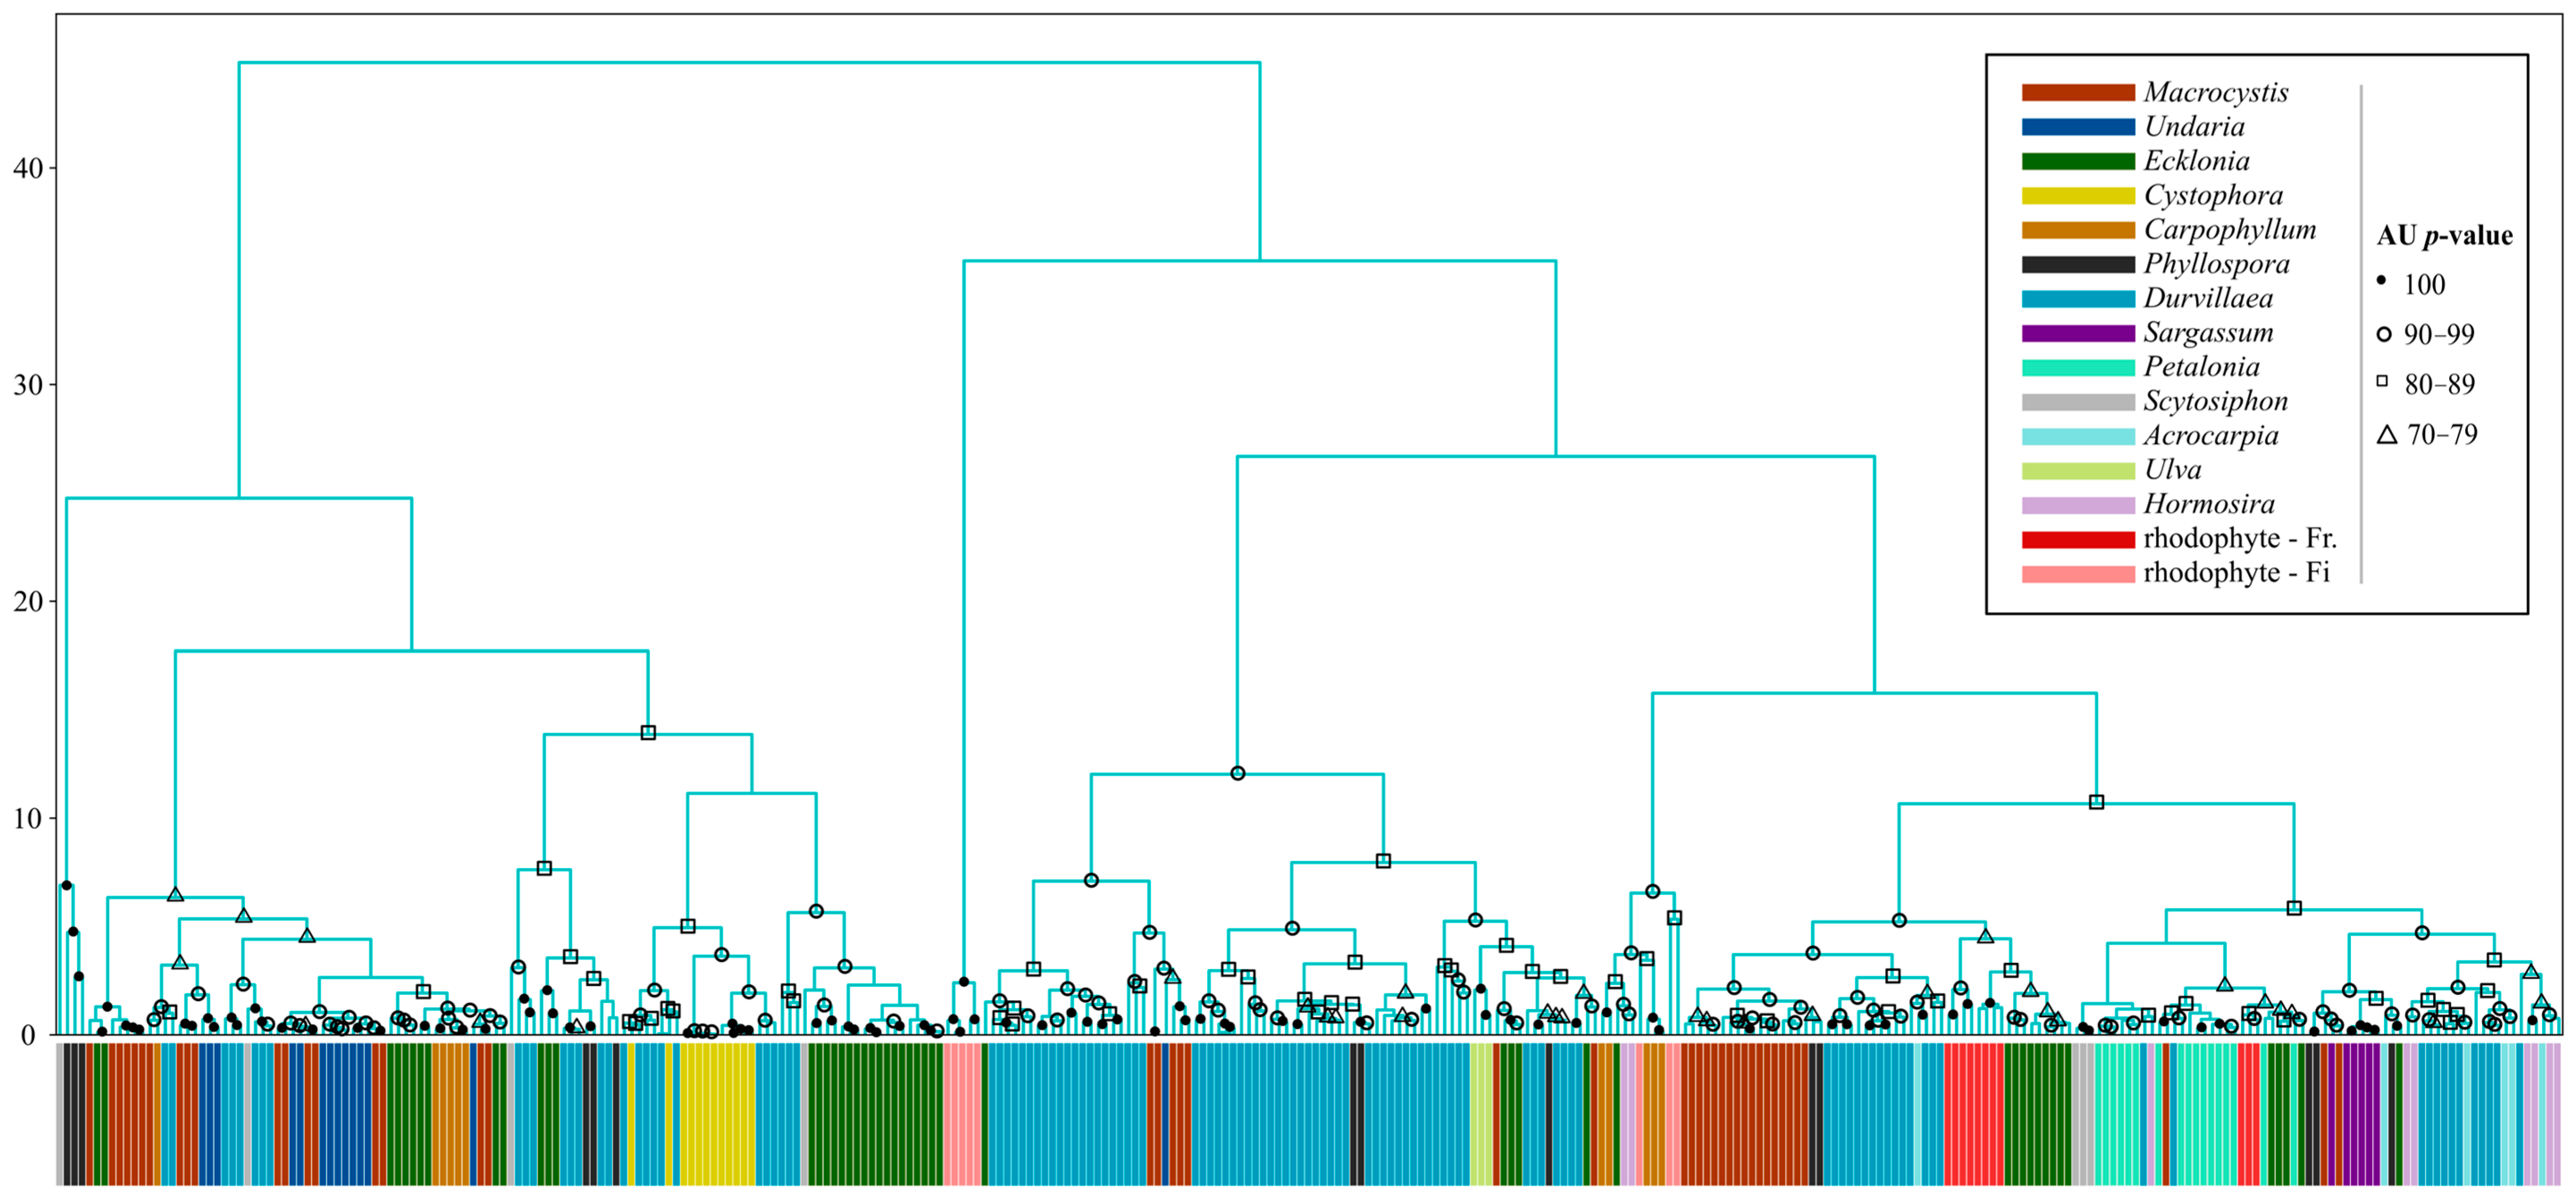
The dendrogram of all individual reflectance spectra labelled by genus is presented in Figure 6. Although many of the low-level clusters were very certain (AU p-values of 100), the highest levels of clustering were quite uncertain (AU-p values below 70). Of all genera, only Ulva was completely clustered into a pure branch; having only been sampled in Tasmania, the Ulva class does not however contain any geographic variability.

3.2.3. Kelp by Genus and Site

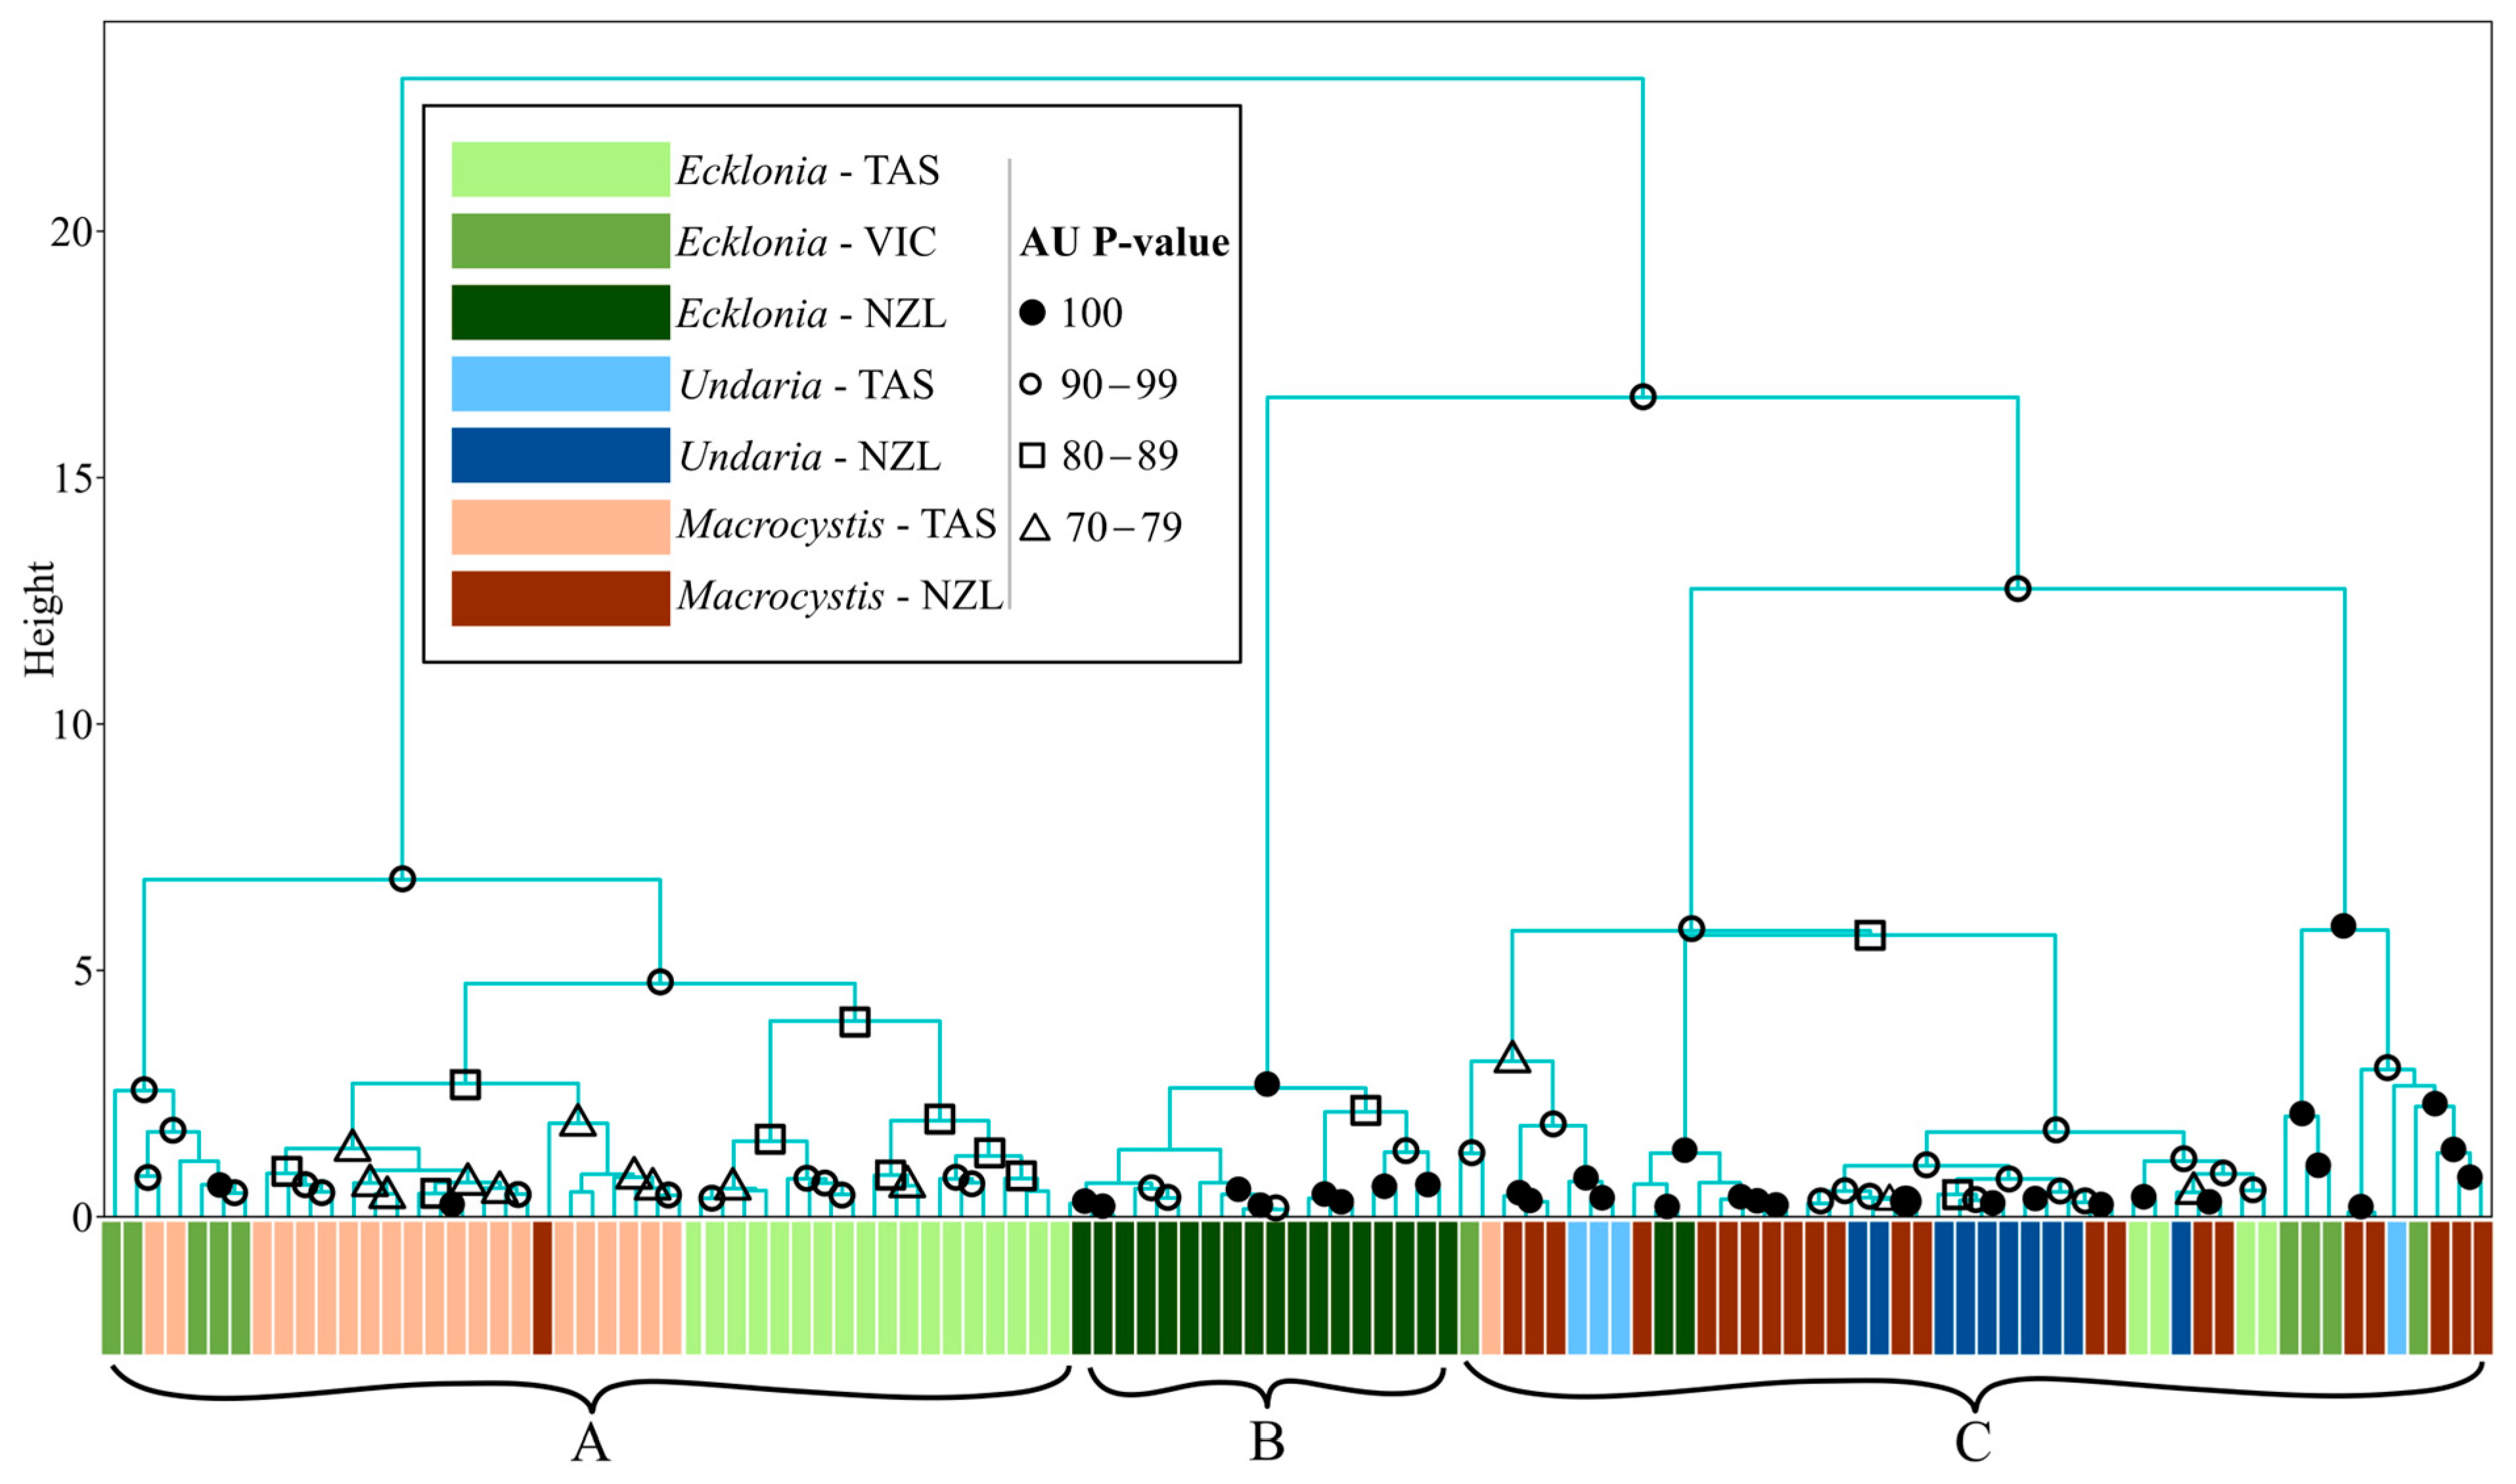
Figure 7 presents the best dendrogram of clustering the individual kelp profiles by genus and site. Notably, Tasmanian Ecklonia and Macrocystis were almost perfectly grouped in adjacent branches (see cluster “A”). Ecklonia from New Zealand is also very well gathered into its own mono-generic branch (cluster “B” in Figure 7). Cluster “C” in Figure 7 is however very mixed, including samples from all three genera and sites. The three labelled clusters above were quite confident, with each having an AU p-value above 90. Many of the one-to-one comparisons (lowest, closest to the x-axis) produced AU p-values of 100, indicating that they were always grouped together, but the higher-level groupings representing broader spectral patterns were less certain.

3.3. Spectral Angle, Random Forest, and Linear Discriminant—Image-Applicable Classifications

The following section presents the results of the SAM, RF, and LDA classifiers, grouped together as the image-applicable methods, and presented under headings related to the primary classes to be discriminated. These provide a better indication of maximum potential classification accuracy amongst macroalgal classes that could be expected in mapping activities.

3.3.1. Macroalgae by Genus

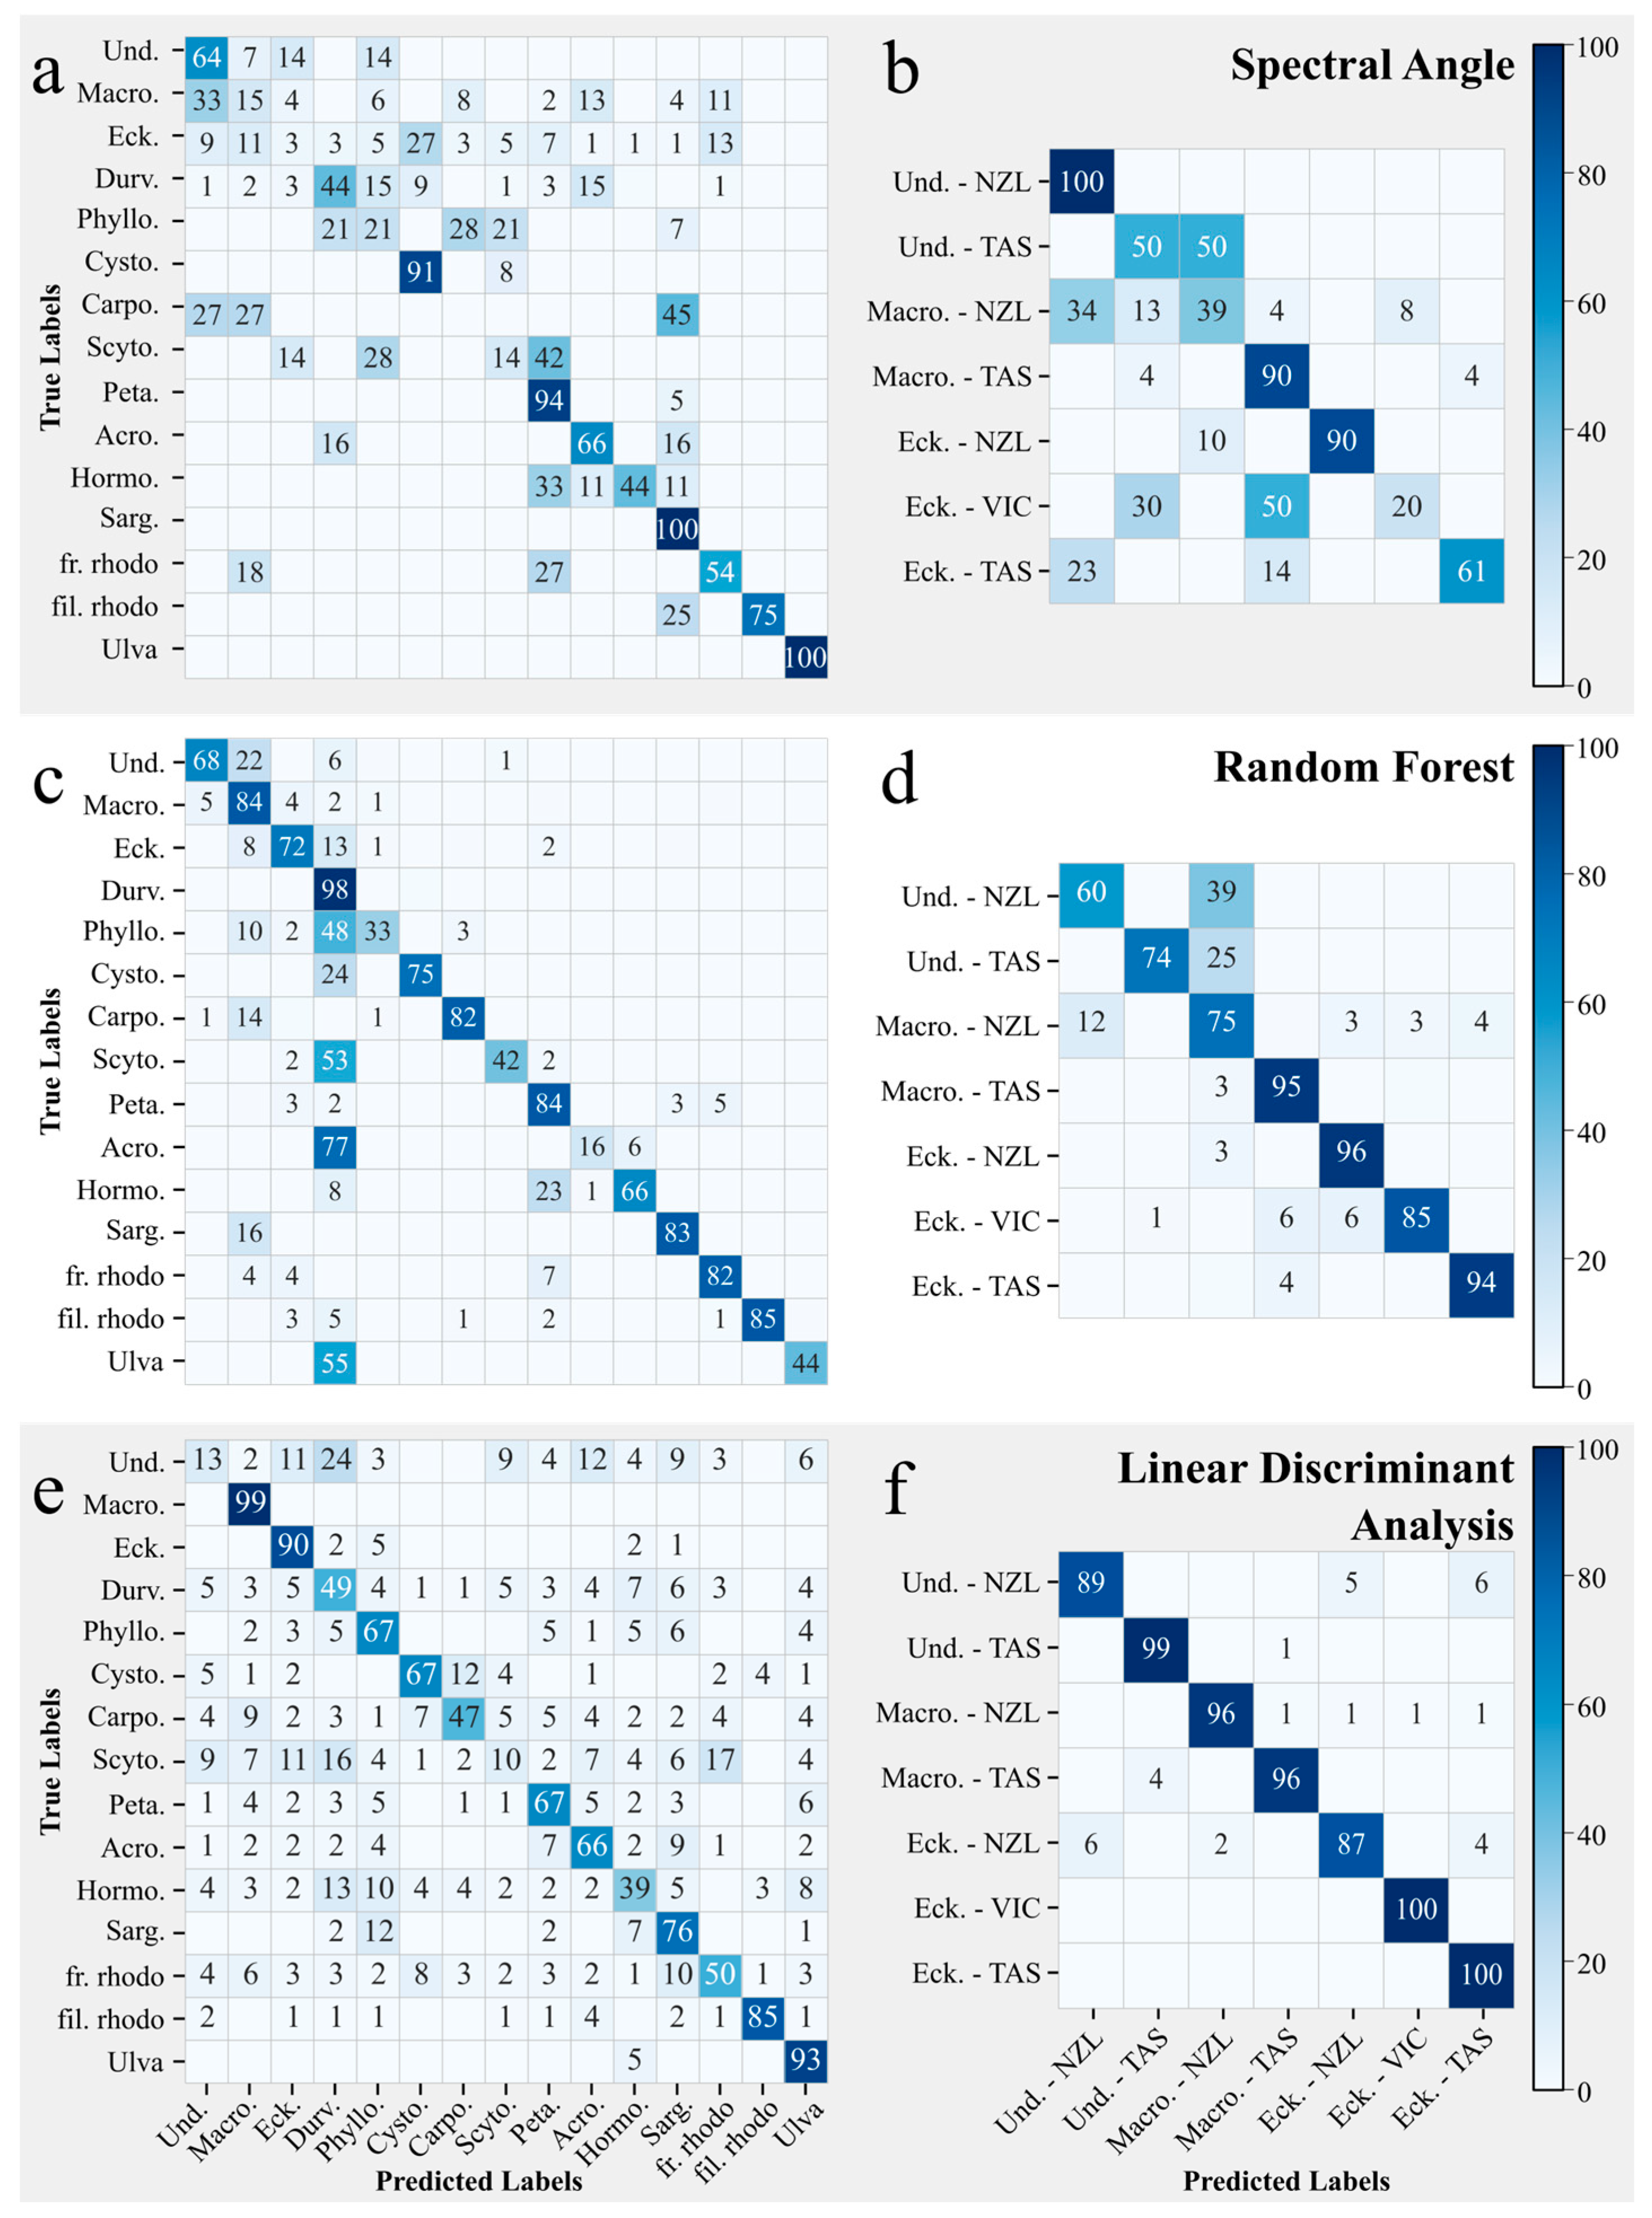
The SAM classified all reflectance spectra to the genus level with low to moderate accuracy (F1 score = 40% for 15 classes). As depicted in Figure 8a, most misclassifications occurred for samples of Macrocystis, Ecklonia, and Durvillaea. Notably, these three genera were the most sampled of all represented genera.
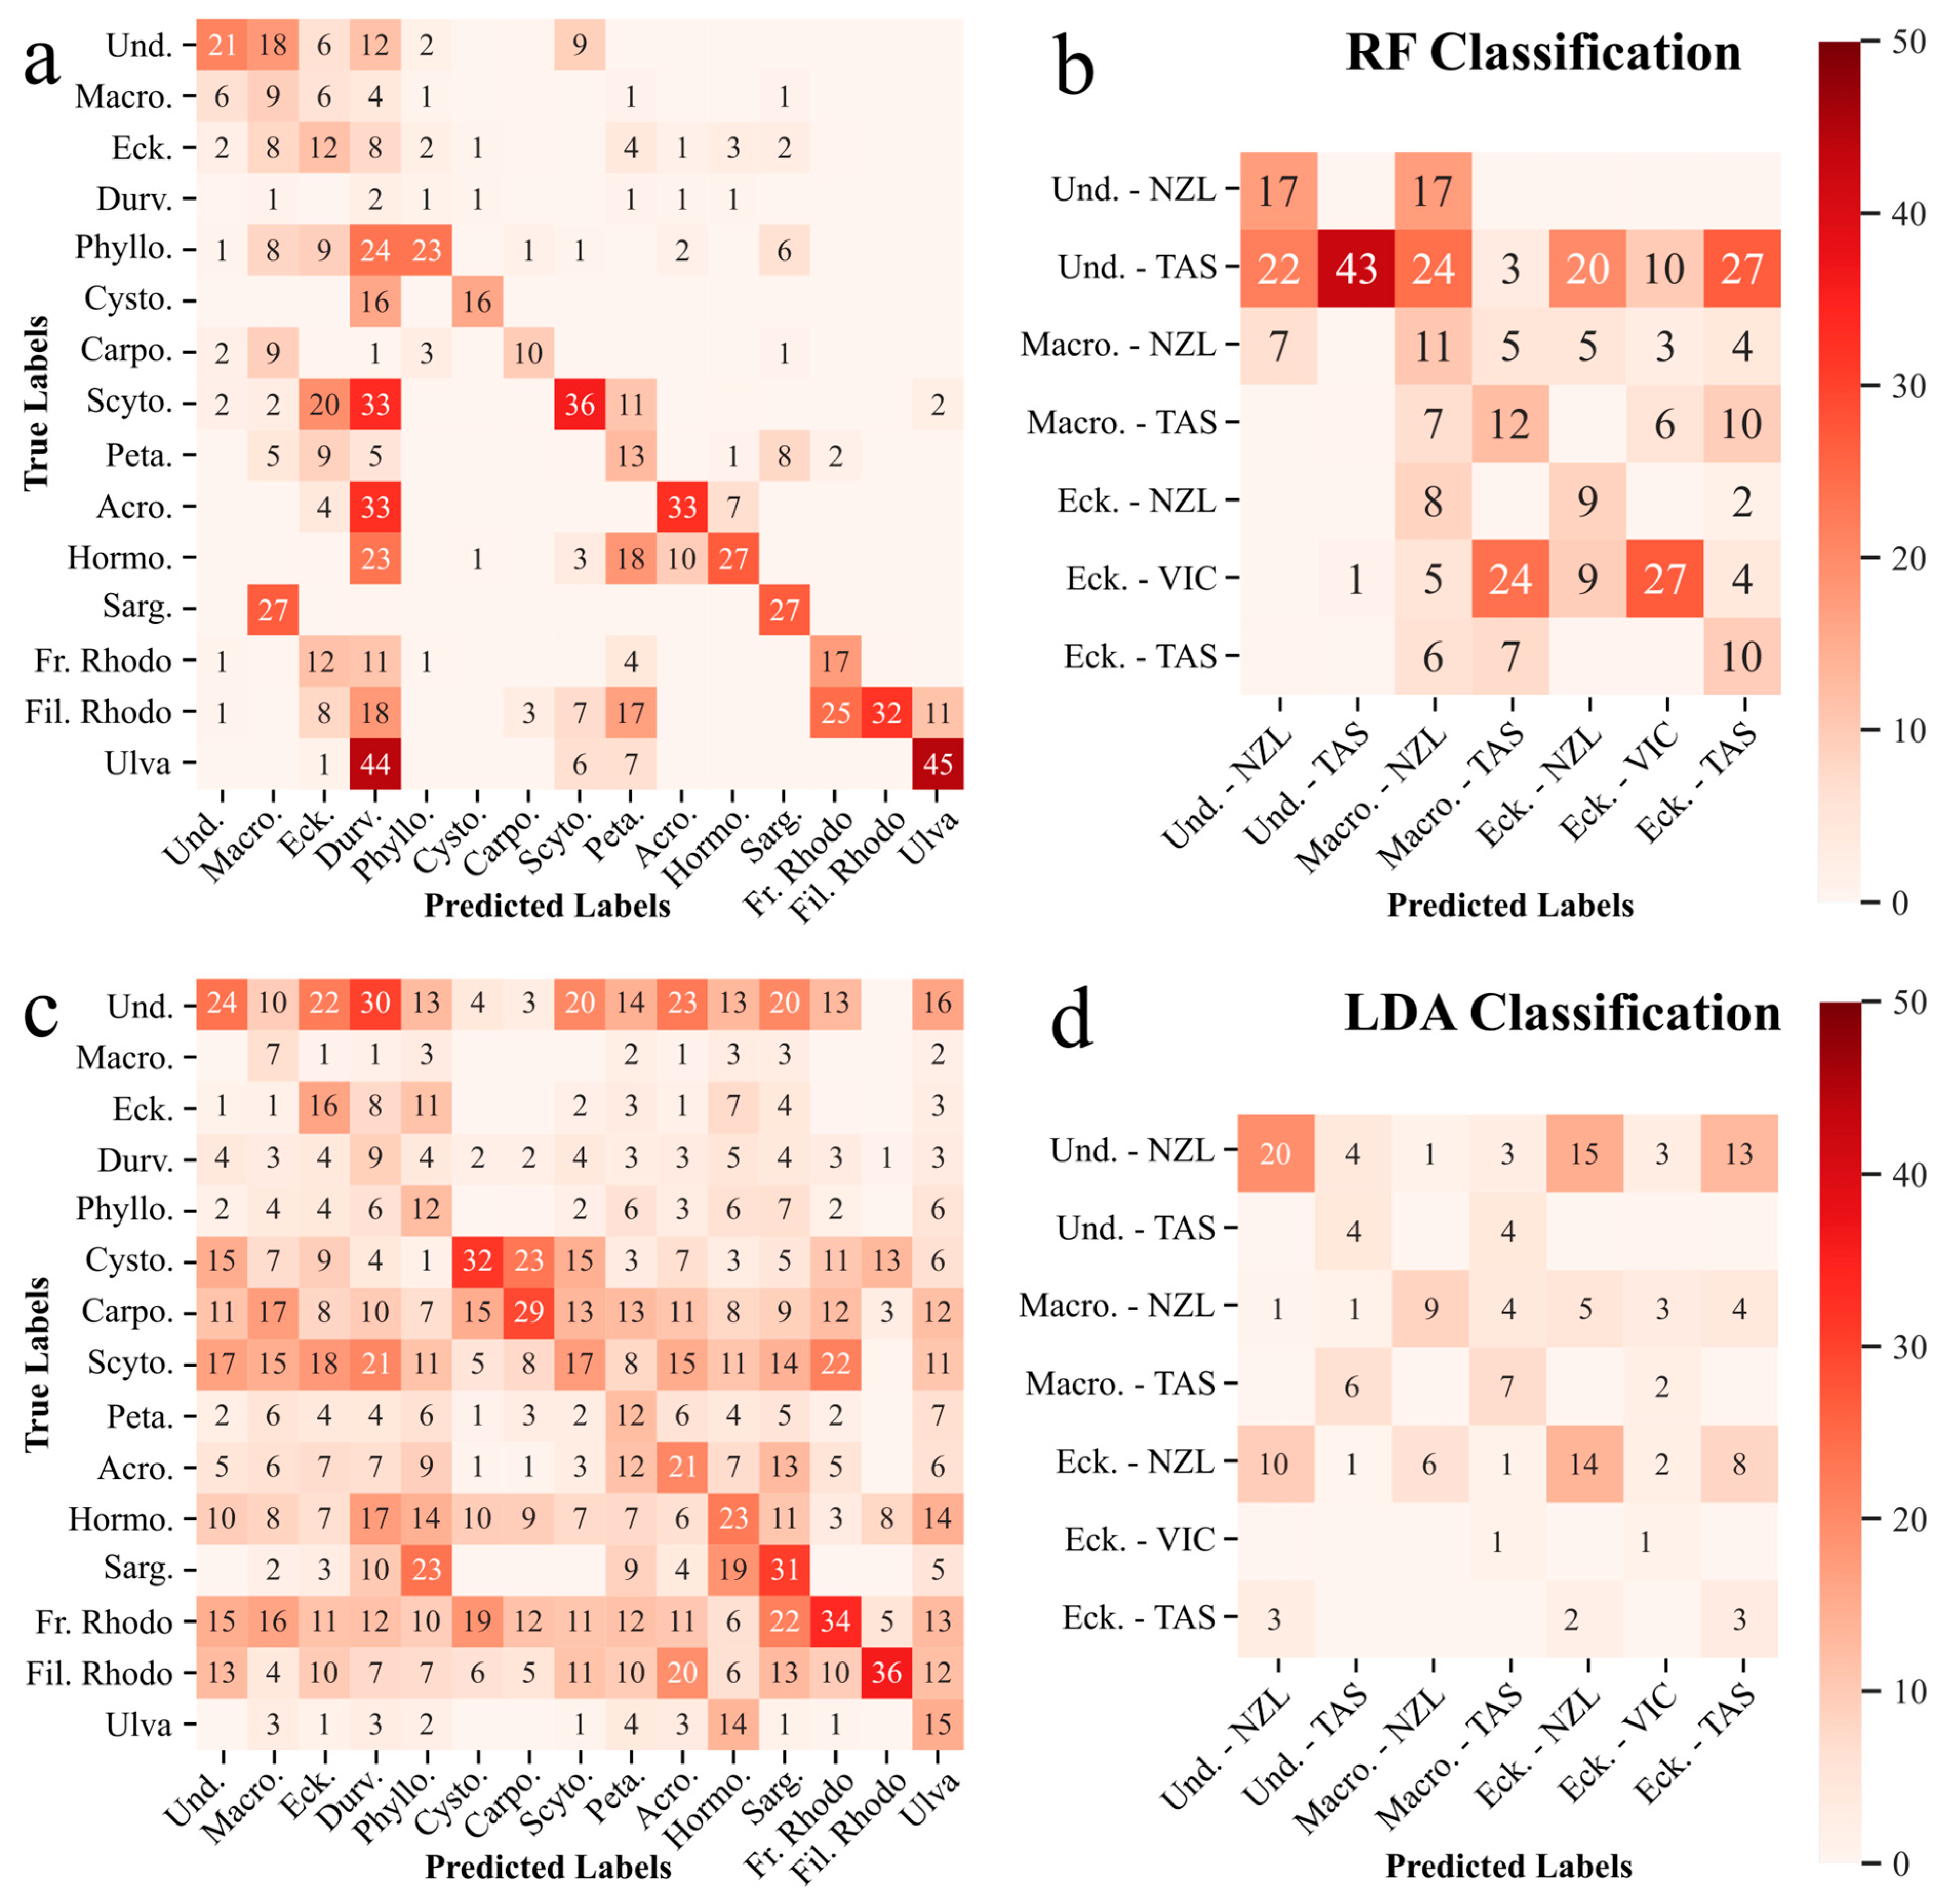
The RF performed well, achieving a mean F1 score of 70% for the 15-class problem, illustrated by the very clear predominance of values on the diagonal of the RF confusion matrix in Figure 8c. Notably, erroneously labelling samples as Durvillaea accounted for most of the classification errors. Figure 9a presents the standard deviation of the confusion error across the 10,000 classifications as an illustration of the RF’s sensitivity to sample division. Ulva, Acrocarpia, Scytosiphon, and filamentous rhodophytes each show a standard deviation of percent of samples correctly identified above 30.
Like the SAM, the LDA classified the reflectance spectra by genus only moderately accurately (average F1 score of 52% for 15 classes), as shown in Figure 8e. Unlike the SAM and RF, however, there is no discernible pattern to the confusion errors. Spectra from eleven of the fifteen genera were at some point mislabelled as belonging to ten or more different classes. The classification results also varied substantially across runs, as shown by the widespread standard deviations above 10% in Figure 9c. The performance of the LDA on a particular class appears independent of class size: Macrocystis and Durvillaea, the two largest classes, differ in LDA performance by 50%, while Ulva and frondose rhodophytes, both small classes, differ by 43%.
The LDA was the most effective method of classifying Macrocystis with an average F1 score of 99% compared to the 84% and 15% achieved by the RF and SAM, respectively. The results were similar for Ecklonia, with the LDA achieving an average F1 score of 90% compared to the RF’s 72% and the SAM score of 3%. The method ranking was however inverted in classifying Undaria, with SAM and RF achieving F1 scores of 64% and 68%, respectively, and the LDA achieving only 13%. As shown in Figure 8, misclassifications amongst these three kelp genera were common results of both the SAM and RF methods but not so for the LDA.

3.3.2. Kelp by Genus and Site

The SAM method was moderately accurate (F1 score = 59% for 7 classes) at separating kelp by genus and site, as shown in Figure 8b. Macrocystis from Tasmania, Undaria from New Zealand, and Ecklonia from New Zealand were very accurately classified (100%, 90%, and 90%, respectively). Errors were not obviously systematic by either genus or sampling site.
The RF was highly successful at classifying kelp by genus and location, with an average F1 score of 0.82. Shown in Figure 8d, the highest confusion rate was between Undaria and Macrocystis from New Zealand; this reflects the high mixing seen in branch C of Figure 7 above. The high standard deviations of classification results in Figure 9b show that despite the high F1 score, overfitting may have occurred.
Figure 8f shows that the LDA classified the kelps by genus and site with excellent accuracy, achieving an average F1 score of 93% for the seven-class problem. Notably, there were no errors of omission of commission in classifying the measurements of Ecklonia from Victoria and Tasmania. These classification results were also much less sensitive to stochasticity than when classifying to the genus level, as shown in Figure 9d.

4. Discussion

4.1. Reflectance Profiles

The reflectance profiles of the genera sampled in this work generally agree with previously identified features of macrophytes, identified in Figure 4 by the coloured vertical lines on each plot [10,11,15,16,29,30]. This is unsurprising as phaeophytes’ have little variability in photosynthetic pigment composition globally [20]. It is instead expected that the relative prominence of these features could vary by location and season as the macroalgae adapt to different light environments, water types and hydrological conditions [19,31]. This appears to be the case for the kelp profiles depicted in Figure 4a, with all kelps showing the same locations of local reflectance maxima, but the magnitude of the features being more pronounced in Undaria and Macrocystis compared to those seen in Ecklonia.
The frondose rhodophytes have clear reflectance features at 600 nm and 645 nm, indicative of the presence of phycobilins common to red algae [15]. Neither rhodophyte class however displays the reflectance feature at 515 nm reported in past work (e.g., [10,11,15,16]. As the features at 600 nm and 645 nm are shared with the kelps and other phaeophytes, the absence of increased reflectance around 570 nm is the primary distinguishing feature of frondose rhodophytes from phaeophytes. The availability of a suitably located and narrow spectral band(s) in that region is therefore paramount to phylum-level separability. The pronounced reflectance maximum of the filamentous rhodophyte at 615 nm is unexpected given that phycocyanin, a pigment characteristic to red algae, absorbs across the 608–628 nm range [15]; further investigation would be required to confirm the cause of this feature.
Collecting spectral reflectance measurements in field situations, either in or ex situ, presents challenges. Variations in target orientation, condition (e.g., dry vs. wet surfaces) and illumination are difficult to control in field conditions. Conditions in fieldwork permits and remote sampling locations limit the removal of features for lab-based spectroscopy. As such, spectral reflectance measured in the field may contain variability caused by the inconsistency of collection conditions themselves. Observations by airborne and satellite EO sensors are, however, subject to those same inconsistent conditions. Evaluating the separability of reflectance profiles collected under variable conditions thus provides a realistic assessment of classification performance representative of actual EO scenarios.

4.2. Hierarchical Clustering Analyses

As pigments dominate the spectral contribution to reflectance in the VIS-only spectral region, the high-level clustering of VIS-only data in Figure 5a logically follows taxon designations largely characterised by colour [28] and the high confidence of these colour-based divisions agrees with the high separability of macroalgae by colour reported in Chao Rodríguez et al. [15], Kotta et al. [16], and Olmedo-Masat et al. [10]. Interpreting the VIS-NIR dendrogram by likewise considering the reflectance and absorption mechanisms affecting that spectral region helps clarify the VIS-NIR dendrogram structure presented in Figure 5b. The highest level-cluster isolates filamentous rhodophytes from all other genera that have a frondose growth type. This effect of morphology on spectral reflectance can be clearly seen in the filamentous rhodophyte’s diminished red-edge and low NIR reflectance compared to all other genera (Figure 4c). The VIS-NIR clustering is therefore not only considering pigmentation but also morphology, explaining the higher clustering certainty across all levels.
Considering the VIS-NIR spectral range aligns with the stated objective of evaluating separability in the context of mapping kelp using EO imagery. While this spectral range differs from past analyses of macroalgal reflectance [10,11,16], it mirrors existing kelp mapping work that largely relies on NIR bands in EO images to detect floating canopy material [9,29,32,33]. It is thus reasonable to here include NIR information in assessing spectral reflectance separability. Even in a case where floating biomass was entirely absent, Timmer et al. [30] demonstrated that the inclusion of bands beyond 700 nm helped detected kelp biomass submerged up to a depth of 50 cm. Finally, the wavelengths from 460 nm to 925 nm cover eight Sentinel-2 bands (B2–B8a) and four Landsat 9 bands (B2–B5, though B2 does detect some radiation below 460 nm). By comparison, the VIS-only range, while avoiding wavelengths heavily affected by water absorbance beyond 700 nm, covers only five Sentinel bands (B1–B5, with only 5 nm of the 15 nm B5 bandwidth included) and four Landsat bands (B1–B4). The VIS-NIR spectral range is therefore more representative of the information contained in public EO imagery.
Admittedly, the majority of macroalgal species are subtidal and not canopy-forming, meaning they remain fully submerged. For these species, water’s near-total absorption of radiation above 700 nm limits the utility of NIR for mapping purposes. As a result, the visible region (400–700 nm), is often the only portion of the spectrum usable for benthic mapping. The inclusion of NIR information in this analysis therefore presents a theoretical maximum separability of the targets under ideal conditions (NIR available, no pixel mixing, no water column contributions, no atmospheric effects). Although these conditions may not be replicated in EO imagery, this analysis remains relevant by defining an upper bound of macroalgal separability and providing guidance on research design considerations.
The least certain splits of the VIS-NIR dendrogram were those separating genera of Laminariales and Durvillaea (a fucoid, despite being colloquially referred to as bull kelp in Australia) from one another (AU p-values of 55–63, Figure 5b). This agrees with the finding by McIlwaine et al. [14] that, when plotted in a multivariate analysis, reflectance spectra from two Laminariales species did show some separation but had substantial overlap. Remarkably, the branch containing these three genera was very certain, with higher level clusters achieving AU p-values of 96–100. This suggests that an aggregated Laminariales + Durvillaea class would be quite distinct from other macroalgae. Indeed, each of the three other classifiers show some level of confusion amongst these four classes, though the degree of confusion is inconsistent across the methods and classes.
It is therefore unlikely that Laminariales could be confidently differentiated at the genus level in satellite imagery, even hyperspectral imagery, without contextual editing or substantial reference data including intra-specific variability. These results therefore support using aggregated target classes when relying solely on spectral information for target identification, such as the general “kelp” label applied in the KelpWatch monitoring tool [34] and in the Google Earth Engine based mapping procedure presented by Nijland et al. [35]. They also thereby undermine the validity of mono-specific kelp mapping based solely on reflectance data (i.e., no measures of texture, no contextual editing) even if hyperspectral imagery is available.
The labelled clusters A, B, and C presented in Figure 7 suggest differences in reflectance by both kelp genus and site. Considering that cluster A is dominated by a single site (Tasmania), but the other two sites are not clearly grouped into their own branches, the cause of the spectral difference could be attributable to either systematic sampling error at that one site or to adaptation across genera to environmental conditions (e.g., thicker blades in a more wave exposed environment, increased photosynthetic pigmentation in low-light areas, increased relative chlorophyll concentration under ideal growing conditions [19,36,37]). While this intra-genus variability is hereafter referred to as “geographic” due to the spectra being identified by sampling site, this is not intended to imply that site coordinates are the primary or only driver of differences in reflectance. Rather, additional factors such as seasonality (e.g., sunlight hours, water temperature) and geomorphology (e.g., slope, exposure) surely contribute to the observed intra-genus spectral reflectance variability [37,38,39] but were not directly measured and analysed here. As the presence of intra-class variability, rather than the exact cause of that variability, is relevant to image analysis, disentangling the contribution of each of these environmental conditions on recorded reflectance is outside the scope of this work. Further study is thus recommended to confirm the existence of intra-genus variability in macroalgal spectral reflectance and to determine its cause(s). Finally, branch C is highly mixed amongst genera and sites, indicating overlapping geographic and inter-class variability in the data.

4.3. Spectral Angle, Random Forest, and Linear Discriminant–Image-Applicable Classifications

The highly accurate RF and LDA classification of kelp genera by sampling site is a strong indication of real geographic variability in spectral reflectance, which is supported by existing work showing pigment concentrations varying with environmental variables like temperature, light, and nutrients [13,36,40]. Although Palacios et al. [41] found no difference in pigment concentration among blades collected across a gradient of light penetration in the Beagle Channel, the pigment concentrations were calculated per unit weight. The observed 7 to 15% differences in blade thickness between the two most turbid sites and the third, least turbid site, imply that photosynthetic pigmentation per unit blade area (the metric that would most affect spectral reflectance and absorbance) would also differ. The accompanying absorbance spectra do not however specify from which site(s) they were collected and cannot therefore be examined for geographic variability. Similarly, while Kotta et al. [16] sampled macroalgae from sites across 100s of kilometres in the Baltic Sea, and the reflectance spectra do show visible intra-specific variability, the provenance of each sample is not provided and geographic variability cannot therefore be explicitly evaluated.
The contrasting LDA performance between classifying all samples by genera (52% accurate) and classifying kelp by genus and site (93% accurate) is striking but can be explained by the presence of geographic variability in spectral reflectance. Samples from the same region (both within and between classes) cluster together in feature space, violating the LDA’s assumption of normality if the classes aggregate across sampling sites. This explains why the LDA was so much better at classifying the kelps by genus and site compared to the macroalgae by genus alone. Logically, the assumption of normality would be similarly problematic in classifying pixels in EO images (or composites of images) wherein variable environmental conditions produce multiple phenotypes for a single macroalgal class.
The intra-class geographic variability in reflectance has implications for kelp mapping using EO imagery across gradient of environmental variables as would occur over large (>100 km) spatial extents. Many existing works have used Macrocystis reference spectra collected in southern California, USA, to detect and map kelp using multispectral satellite imagery in other locations like Baja California, Tierra del Fuego, and the Falkland Islands [42,43,44]. As multispectral data is not spectrally detailed enough to capture subtle geographic variability in kelp reflectances, transposing reference data to new locations has not been an issue. However, new hyperspectral sensors may capture geographic variability, thus requiring reference data specific to a given area or set of environmental conditions.
Though not directly comparable, the three classification methods do show agreement in the ability to separate between different genera of macroalgae with at least moderate success. The implications of each method however differ. The effect of signal noise in individual reflectance spectra is mitigated using the SAM as classes are averaged to produce a reference spectrum. Comparing this to the HCA, which conducts one-to-one comparisons, a noisy measurement is more likely to be closer in n-dimensional space to the average than to another noisy measurement. This would imply the superiority of using a SAM for spectral classification on noisy data. However, if the class average is heavily affected by outliers, or if there is real and high intra-class variability, the calculated class mean may not be representative of all members regardless of noise. In this case, one-to-one comparisons, like those in an HCA, may be better able to accurately identify similarities between samples.
The RF classifier outperformed the SAM and HCA. Extracting principal components from the reflectance spectra before classification reduced signal noise while maintaining intra-class variability. Furthermore, as the decision space of an RF is not constrained by assumptions of normality or contiguity, multiple sections of that decision space can be assigned to one class. This allows intra-class variability to be captured, as is required when there is geographic variability within a genus. However, under the assumption of equal intra-class variability, unequal class sizes can result in more of the decision space being labelled as the larger class. This likely caused the preponderance of errors where the RF labelled other macroalgae as Durvillaea (see Figure 9) despite Durvillaea not displaying any more variability than the other classes, as shown in Figure 4b.
The disparate performance of the four methods highlights a core difficulty in assessing spectral separability: there is no single measure of difference in profile shape. Separability is therefore usually discussed according to classification accuracy, as more distinct reflectance features are more successfully identified. This however ignores the implications and assumptions of each classifier and how those interact with a given dataset, on top of the specific variations within the dataset itself. As EO imagery, particularly hyperspectral imagery, becomes more widely available, it is foreseeable that evaluating material’s separability will likewise become more common as new mapping applications are evaluated and explored. Therefore, a standard workflow for evaluating spectral separability could be useful for facilitating future research design.

5. Conclusions and Future Work

This work shows that macroalgae, including Laminariales, contain sufficient differences in reflectance to allow genus-level identification with moderate to good certainty using high-quality data (i.e., hyperspectral, properly collected and calibrated, no spectral mixing). It supports using Earth Observation imagery to map kelps or other macroalgae, across moderate (~10–100 s km) to large spatial extents (~100–1000 s kms), and suggests that large-extent mapping projects may be improved by including geographically diverse reference data. Even at local scales (e.g., individual harbours, <10 km), accuracy may be reduced if using allopatric reference data.
This study demonstrates the presence of intra-class reflectance variability and the effect of that variability on classification results, an important factor in designing mapping projects. Finally, the comparisons of the performance and implications of different classification algorithms’ applications to kelp and macroalgae provide guidance for selecting suitable algorithms in the extensive range of options available.
While these results can serve as an indication of the maximum possible accuracy with which these kelps and macroalgae could be mapped under idealized conditions in the areas studied, it is highly unlikely that these conditions could ever be achieved in real airborne or satellite imagery. Even for hyperspectral images, confounding factors like atmospheric contributions and pixel mixing are unavoidable. Therefore, while the above results indicate that distinguishing amongst macroalgae and kelp genera is theoretically possible, evaluating the practicality of doing so given current Earth Observation technologies requires further study.

Supplementary Materials

The following supporting information can be downloaded at: https://www.mdpi.com/article/10.3390/rs17203491/s1, SM 1: Presentation of the classes discussed in this work (Figure S1: Examples of each class of macroalgae included in this analysis) and SM 2: Determination of number of PCA components to keep (Figure S2: Comparison of methods for determining the number of PCA components to keep and Table S1: The ideal number of PCA components identified by four different methods).

Author Contributions

Conceptualization, G.S.L.R., S.R.P., J.N.S. and C.R.; methodology, G.S.L.R. and J.N.S.; software, G.S.L.R.; validation, G.S.L.R. and J.N.S.; formal analysis, G.S.L.R.; investigation, G.S.L.R. and J.N.S.; resources, S.R.P. and J.N.S.; data curation, G.S.L.R.; writing—original draft preparation, G.S.L.R.; writing—review and editing, G.S.L.R., J.N.S., C.R. and S.R.P.; visualization, G.S.L.R.; supervision, S.R.P. and C.R.; funding acquisition, G.S.L.R., J.N.S., C.R. and S.R.P. All authors have read and agreed to the published version of the manuscript.

Funding

This research was funded by SmartSat CRC grant number P3-30S and grant number P6-05, and by the Fonds de recherche du Québec—Nature et technologies (FRQNT) grant number 320872. Cette recherche est subventionnée par le Fonds de recherche du Québec—Nature et technologies, bourse 320872.

Data Availability Statement

All code produced for this analysis is available at https://github.com/uqgrowan/Spectral-Separability-Analysis (accessed on 16 October 2025). The original data presented in the study are openly available in the University of Queensland data repository UQRDM at https://doi.org/10.48610/c5f745e.

Acknowledgments

The authors would like to acknowledge the Traditional Owners/Custodians of the land and sea Country where this research took place. They extend their thanks to two anonymous reviewers whose comments and feedback improved the quality of this manuscript. They also thank Kelp Blue (specifically Madeleine Tresselt) and NZ Kelp (specifically Roger Beattie) for their collaboration in collecting data in Akaroa Harbour, and Marine Solutions Tasmania PTY LTD for the loan of equipment for use in data collection in Tasmania. Additional thanks to Nolan Werre for the design and production of the custom fiber optic mounting equipment used in this work. During the preparation of this manuscript/study, the authors used Anthropic’s Claude (version 3.5 Sonnet) Generative AI tool to assist in reformatting and annotating the functional code after the authors completed it and to interpret error messages during code development; Generative AI was not used to create new code. No Generative AI was used in writing or reviewing the manuscript. The authors have reviewed and edited the output and take full responsibility for the content of this publication.

Conflicts of Interest

The authors declare no conflicts of interest. The funders had no role in the design of the study; in the collection, analyses, or interpretation of data; in the writing of the manuscript; or in the decision to publish the results.

Abbreviations

The following abbreviations are used in this manuscript:
EOEarth Observation
HCAHierarchical clustering analysis
ANOVAAnalysis of variance
ANOSIMAnalysis of similarity
VISVisible
NIRNear infra-red
AIArtificial Intelligence
AUSAustralia
NZLNew Zealand
AUApproximately unbiased
SAMSpectral angle method
RFRandom forest
LDALinear discriminant analysis
PCAPrinciple component analysis
VICVictoria
TASTasmania

References

  1. National Ocean Account, Experimental Estimates. Available online: https://www.abs.gov.au/statistics/environment/environmental-accounts/national-ocean-account-experimental-estimates/nov-2022 (accessed on 27 March 2025).
  2. McHenry, J.; Okamoto, D.K.; Filbee-Dexter, K.; Krumhansl, K.A.; MacGregor, K.A.; Hessing-Lewis, M.; Timmer, B.; Archambault, P.; Attridge, C.M.; Cottier, D.; et al. A Blueprint for National Assessments of the Blue Carbon Capacity of Kelp Forests Applied to Canada’s Coastline. NPJ Ocean Sustain. 2025, 4, 30. [Google Scholar] [CrossRef]
  3. Franco, J.N.; Sainz Meyer, H.; Babe, Ó.; Martins, M.; Reis, B.; Sanchez-Gallego, Á.; Lemos, M.F.L.; Dolbeth, M.; Sousa-Pinto, I.; Arenas, F. Potential Blue Carbon in the Fringe of Southern European Kelp Forests. Sci. Rep. 2025, 15, 29573. [Google Scholar] [CrossRef]
  4. Kuwae, T.; Yoshida, G.; Hori, M.; Watanabe, K.; Tanaya, T.; Okada, T.; Umezawa, Y.; Sasaki, J. Nationwide estimate of the annual uptake of atmospheric carbon dioxide by shallow coastal ecosystems in Japan. J. JSCE 2023, 11, 23-00139. [Google Scholar] [CrossRef]
  5. Eger, A.M.; Marzinelli, E.M.; Beas-Luna, R.; Blain, C.O.; Blamey, L.K.; Byrnes, J.E.K.; Carnell, P.E.; Choi, C.G.; Hessing-Lewis, M.; Kim, K.Y.; et al. The Value of Ecosystem Services in Global Marine Kelp Forests. Nat. Commun. 2023, 14, 1894. [Google Scholar] [CrossRef]
  6. Dayton, P.K. Ecology of Kelp Communities. Annu. Rev. Ecol. Syst. 1985, 16, 215–245. [Google Scholar] [CrossRef]
  7. Cavanaugh, K.C.; Bell, T.; Costa, M.; Eddy, N.E.; Gendall, L.; Gleason, M.G.; Hessing-Lewis, M.; Martone, R.; McPherson, M.; Pontier, O.; et al. A Review of the Opportunities and Challenges for Using Remote Sensing for Management of Surface-Canopy Forming Kelps. Front. Mar. Sci. 2021, 8, 753531. [Google Scholar] [CrossRef]
  8. Schroeder, S.B.; Dupont, C.; Boyer, L.; Juanes, F.; Costa, M. Passive Remote Sensing Technology for Mapping Bull Kelp (Nereocystis luetkeana): A Review of Techniques and Regional Case Study. Glob. Ecol. Conserv. 2019, 19, e00683. [Google Scholar] [CrossRef]
  9. Mora-Soto, A.; Palacios, M.; Macaya, E.; Gómez, I.; Huovinen, P.; Pérez-Matus, A.; Young, M.; Golding, N.; Toro, M.; Yaqub, M.; et al. A High-Resolution Global Map of Giant Kelp (Macrocystis Pyrifera) Forests and Intertidal Green Algae (Ulvophyceae) with Sentinel-2 Imagery. Remote Sens. 2020, 12, 694. [Google Scholar] [CrossRef]
  10. Olmedo-Masat, O.M.; Raffo, M.P.; Rodríguez-Pérez, D.; Arijón, M.; Sánchez-Carnero, N. How Far Can We Classify Macroalgae Remotely? An Example Using a New Spectral Library of Species from the South West Atlantic (Argentine Patagonia). Remote Sens. 2020, 12, 3870. [Google Scholar] [CrossRef]
  11. Douay, F.; Verpoorter, C.; Duong, G.; Spilmont, N.; Gevaert, F. New Hyperspectral Procedure to Discriminate Intertidal Macroalgae. Remote Sens. 2022, 14, 346. [Google Scholar] [CrossRef]
  12. Rowan, G.S.L.; Kalacska, M. A Review of Remote Sensing of Submerged Aquatic Vegetation for Non-Specialists. Remote Sens. 2021, 13, 623. [Google Scholar] [CrossRef]
  13. Smart, J.N.; Schmid, M.; Paine, E.R.; Britton, D.; Revill, A.; Hurd, C.L. Seasonal Ammonium Uptake Kinetics of Four Brown Macroalgae: Implications for Use in Integrated Multi-Trophic Aquaculture. J. Appl. Phycol. 2022, 34, 1693–1708. [Google Scholar] [CrossRef]
  14. McIlwaine, B.; Casado, M.R.; Leinster, P. Using 1st Derivative Reflectance Signatures within a Remote Sensing Framework to Identify Macroalgae in Marine Environments. Remote Sens. 2019, 11, 704. [Google Scholar] [CrossRef]
  15. Chao Rodríguez, Y.; Domínguez Gómez, J.A.; Sánchez-Carnero, N.; Rodríguez-Pérez, D. A Comparison of Spectral Macroalgae Taxa Separability Methods Using an Extensive Spectral Library. Algal Res. 2017, 26, 463–473. [Google Scholar] [CrossRef]
  16. Kotta, J.; Remm, K.; Vahtmäe, E.; Kutser, T.; Orav-Kotta, H. In-Air Spectral Signatures of the Baltic Sea Macrophytes and Their Statistical Separability. J. Appl. Remote Sens. 2014, 8, 083634. [Google Scholar] [CrossRef]
  17. Integrated Marine and Coastal Regionalisation of Australia (IMCRA) v4.0 Mesoscale Bioregions. Available online: https://fed.dcceew.gov.au/datasets/erin::integrated-marine-and-coastal-regionalisation-of-australia-imcra-v4-0-meso-scale-bioregions/explore (accessed on 12 July 2025).
  18. Environment Canterbury; New Zealand Department of Conservation; Te Rūnanga o Ōnuku; Te Rūnanga o Wairewa; Te Rūnanga o Rāpaki; University of Otago Iongairo. Available online: https://storymaps.arcgis.com/collections/4c59cf39bcee4875b117cfe02f4f0a47 (accessed on 30 June 2025).
  19. North, W.J. The Biology of Giant Kelp Beds (Macrocystis) in California; Beihefte zur Nova Hedwigia; Verlag Von J. Cramer: Stuttgart, Germany, 1971; Volume 32, ISBN 3768254321. [Google Scholar]
  20. Braune, W.; Guiry, M. Seaweeds: A Colour Guide to Common Benthic Green, Brown and Red Algae of the World’s Oceans; Koeltz Scientific Books: Königstein, Germany, 2011; ISBN 978-3-906166-90-2. [Google Scholar]
  21. Jupp, D.; Daniel, P. Notes on the Use of Radiometers for Spectral Reflectances; CSIRO: Acton, Australia, 1993; p. 4. [Google Scholar]
  22. ASD, Inc. ViewSpec Pro User Manual; Analytical Spectral Devices, Inc.: Boulder, CO, USA, 2008; p. 28. [Google Scholar]
  23. Pedregosa, F.; Varoquaux, G.; Gramfort, A.; Michel, V.; Thirion, B.; Grisel, O.; Blondel, M.; Prettenhofer, P.; Weiss, R.; Dubourg, V.; et al. Scikit-Learn: Machine Learning in Python. J. Mach. Learn. Res. 2011, 12, 2825–2830. [Google Scholar]
  24. Suzuki, R.; Shimodaira, H. Pvclust: An R Package for Assessing the Uncertainty in Hierarchical Clustering. Bioinformatics 2006, 22, 1540–1542. [Google Scholar] [CrossRef]
  25. Turanjanin, A. Stability of Hierarchical Clustering. 2020. Available online: https://repozitorij.uni-lj.si/IzpisGradiva.php?lang=eng&id=121038 (accessed on 24 March 2025).
  26. Shimodaira, H. An Approximately Unbiased Test of Phylogenetic Tree Selection. Syst. Biol. 2002, 51, 492–508. [Google Scholar] [CrossRef]
  27. Kruse, F.A.; Lefkoff, A.B.; Boardman, J.W.; Heidebrecht, K.B.; Shapiro, A.T.; Barloon, P.J.; Goetz, A.F.H. The Spectral Image Processing System (SIPS)—Interactive Visualization and Analysis of Imaging Spectrometer Data. Remote Sens. Environ. 1993, 44, 145–163. [Google Scholar] [CrossRef]
  28. Knipling, E.B. Physical and Physiological Basis for the Reflectance of Visible and Near-Infrared Radiation from Vegetation. Remote Sens. Environ. 1970, 1, 155–159. [Google Scholar] [CrossRef]
  29. Hu, C.; Feng, L.; Hardy, R.F.; Hochberg, E.J. Spectral and Spatial Requirements of Remote Measurements of Pelagic Sargassum Macroalgae. Remote Sens. Environ. 2015, 167, 229–246. [Google Scholar] [CrossRef]
  30. Timmer, B.; Reshitnyk, L.Y.; Hessing-Lewis, M.; Juanes, F.; Costa, M. Comparing the Use of Red-Edge and Near-Infrared Wavelength Ranges for Detecting Submerged Kelp Canopy. Remote Sens. 2022, 14, 2241. [Google Scholar] [CrossRef]
  31. Colombo-Pallotta, M.F.; García-Mendoza, E.; Ladah, L.B. Photosynthetic Performance, Light Absorption, and Pigment Composition of Macrocystis Pyrifera (Laminariales, Phaeophyceae) Blades from Different Depths1. J. Phycol. 2006, 42, 1225–1234. [Google Scholar] [CrossRef]
  32. Bell, T.W.; Cavanaugh, K.C.; Siegel, D.A. Remote Monitoring of Giant Kelp Biomass and Physiological Condition: An Evaluation of the Potential for the Hyperspectral Infrared Imager (HyspIRI) Mission. Remote Sens. Environ. 2015, 167, 218–228. [Google Scholar] [CrossRef]
  33. Cavanaugh, K.; Siegel, D.; Reed, D.; Dennison, P. Environmental Controls of Giant-Kelp Biomass in the Santa Barbara Channel, California. Mar. Ecol. Prog. Ser. 2011, 429, 1–17. [Google Scholar] [CrossRef]
  34. Bell, T.W.; Cavanaugh, K.C.; Saccomanno, V.R.; Cavanaugh, K.C.; Houskeeper, H.F.; Eddy, N.; Schuetzenmeister, F.; Rindlaub, N.; Gleason, M. Kelpwatch: A New Visualization and Analysis Tool to Explore Kelp Canopy Dynamics Reveals Variable Response to and Recovery from Marine Heatwaves. PLoS ONE 2023, 18, e0271477. [Google Scholar] [CrossRef]
  35. Nijland, W.; Reshitnyk, L.; Rubidge, E. Satellite Remote Sensing of Canopy-Forming Kelp on a Complex Coastline: A Novel Procedure Using the Landsat Image Archive. Remote Sens. Environ. 2019, 220, 41–50. [Google Scholar] [CrossRef]
  36. Mabin, C.J.T.; Johnson, C.R.; Wright, J.T. Physiological Response to Temperature, Light, and Nitrates in the Giant Kelp Macrocystis Pyrifera from Tasmania, Australia. Mar. Ecol. Prog. Ser. 2019, 614, 1–19. [Google Scholar] [CrossRef]
  37. Hurd, C.L.; Harrison, P.J.; Bischof, K.; Lobban, C.S. Seaweed Ecology and Physiology, 2nd ed.; Cambridge University Press: Cambridge, UK, 2014; ISBN 978-0-521-14595-4. [Google Scholar]
  38. Hurd, C.L.; Pilditch, C.A. Flow-Induced Morphological Variations Affect Diffusion Boundary-Layer Thickness of Macrocystis Pyrifera (Heterokontophyta, Laminariales). J. Phycol. 2011, 47, 341–351. [Google Scholar] [CrossRef] [PubMed]
  39. Selvaraj, S.; Case, B.S.; White, W.L. Effects of Location and Season on Seaweed Spectral Signatures. Front. Ecol. Evol. 2021, 9, 581852. [Google Scholar] [CrossRef]
  40. Schmid, M.; Guihéneuf, F.; Stengel, D.B. Ecological and Commercial Implications of Temporal and Spatial Variability in the Composition of Pigments and Fatty Acids in Five Irish Macroalgae. Mar. Biol. 2017, 164, 158. [Google Scholar] [CrossRef]
  41. Palacios, M.; Osman, D.; Ramírez, J.; Huovinen, P.; Gómez, I. Photobiology of the Giant Kelp Macrocystis Pyrifera in the Land-Terminating Glacier Fjord Yendegaia (Tierra Del Fuego): A Look into the Future? Sci. Total Environ. 2021, 751, 141810. [Google Scholar] [CrossRef] [PubMed]
  42. Arafeh-Dalmau, N.; Montaño-Moctezuma, G.; Martínez, J.A.; Beas-Luna, R.; Schoeman, D.S.; Torres-Moye, G. Extreme Marine Heatwaves Alter Kelp Forest Community Near Its Equatorward Distribution Limit. Front. Mar. Sci. 2019, 6, 499. [Google Scholar] [CrossRef]
  43. Friedlander, A.M.; Ballesteros, E.; Bell, T.W.; Caselle, J.E.; Campagna, C.; Goodell, W.; Hüne, M.; Muñoz, A.; Salinas-de-León, P.; Sala, E.; et al. Kelp Forests at the End of the Earth: 45 Years Later. PLoS ONE 2020, 15, e0229259. [Google Scholar] [CrossRef] [PubMed]
  44. Houskeeper, H.F.; Rosenthal, I.S.; Cavanaugh, K.C.; Pawlak, C.; Trouille, L.; Byrnes, J.E.K.; Bell, T.W.; Cavanaugh, K.C. Automated Satellite Remote Sensing of Giant Kelp at the Falkland Islands (Islas Malvinas). PLoS ONE 2022, 17, e0257933. [Google Scholar] [CrossRef]
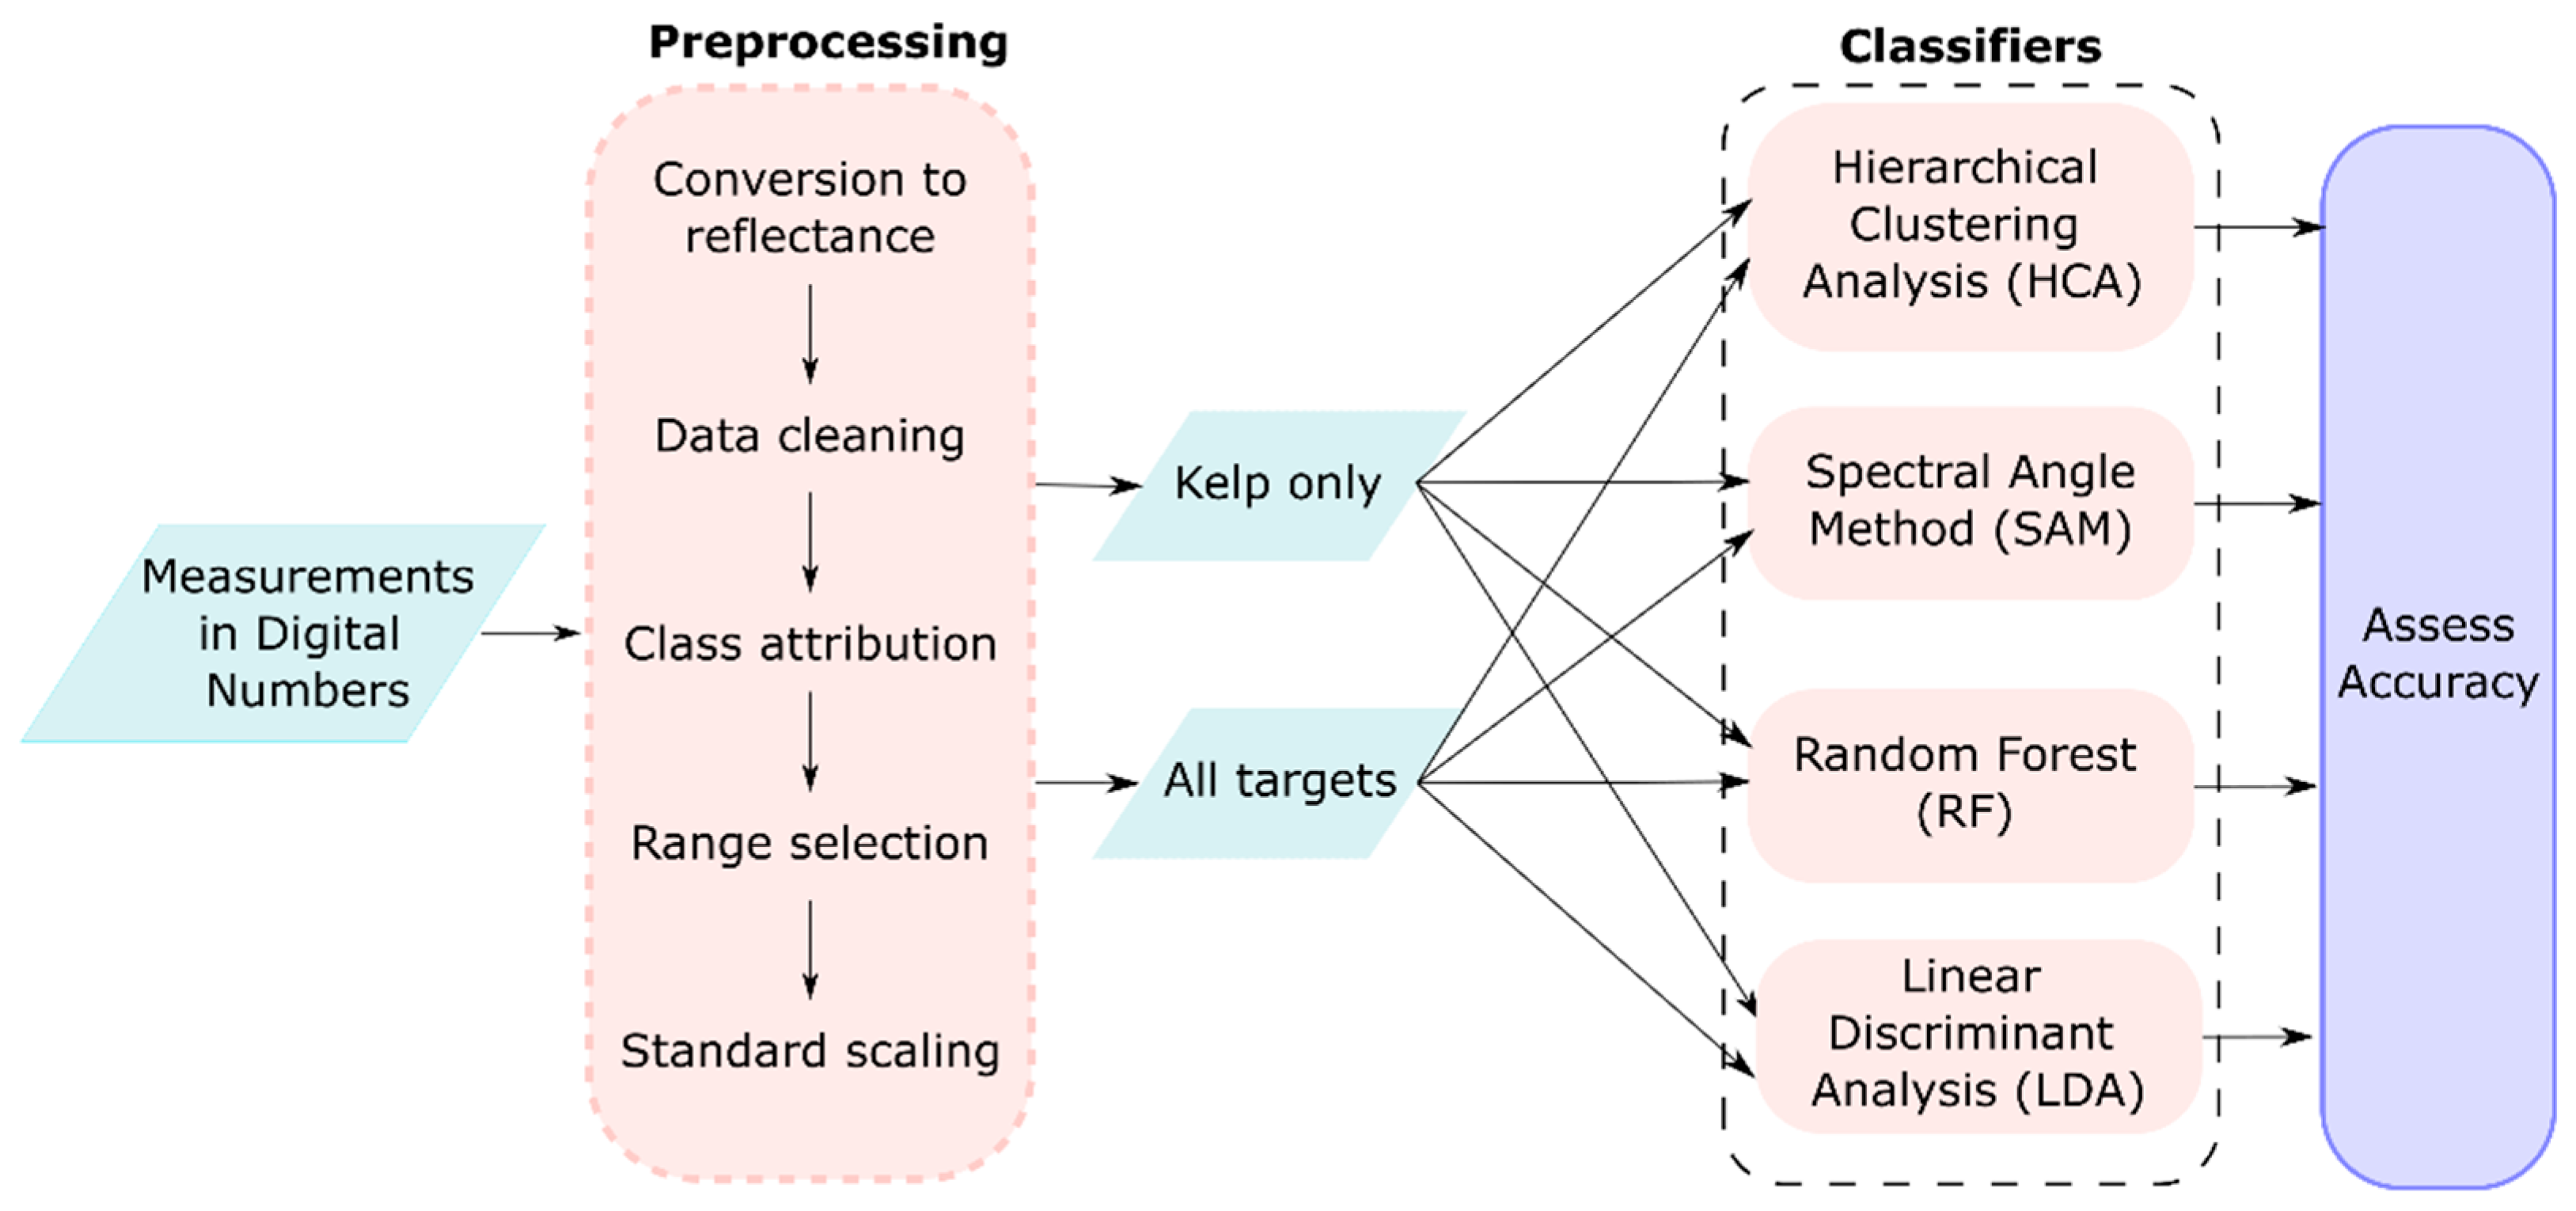
Figure 1. Overview of the data collection, processing, analysis and interpretation activities in the project.
Remotesensing 17 03491 g001
Figure 2. The three study regions visited in this work. (a) Overview of sampling regions’ locations (b) Port Fairy (pictured) and Skenes Creek sites in Victoria, AUS; (c) Blackman’s and Fortescue (pictured) Bays in Tasmania, AUS; (d) kelp harvesting location Akaroa Harbour, NZL. Photos are included alongside each inset as an example of shoreline conditions at time of sampling.
Remotesensing 17 03491 g002
Figure 3. Spectral reflectance data collection methods. (a) Outdoor in situ collection set-up, depicted being operated off a dinghy over floating Cystophora; (b) outdoor ex situ collection of an Ecklonia spectrum showing the full collection equipment.
Remotesensing 17 03491 g003
Figure 4. Standardized mean spectral reflectance profiles of each macroalgal class, with shaded regions representing one standard deviation. Vertical lines overlaid on each plot correspond to the location of reflectance features identified in the literature and coloured by phylum displaying that feature (orange being both red and brown algae): 515 nm (red), 545 nm (green), 570 nm (brown), 600 nm (orange), and 645 nm (orange). (a) kelp (Laminariales); (b) other phaeophytes; (c) rhodophytes; (d) Ulva (chlorophyte). Photos on right depict the three genera of kelp included in this work—(e) Macrocystis; (f) Undaria; (g) Ecklonia—and the two common phaeophytes (h) Durvillaea; and (i) Scytosiphon.
Remotesensing 17 03491 g004
Figure 5. Best resultant dendrograms of the hierarchical clustering analyses run on each of the two spectral regions. (a) VIS-only dataset; (b) VIS-NIR dataset. Dendrogram splits are labelled by the AU p-value of that split. Class labels are coloured by target (kelp—yellow, other phaeophytes—brown, chlorophyte—green, rhodophytes—red) and kelp labels are in bold for clarity.
Remotesensing 17 03491 g005
Figure 6. Hierarchical clustering analysis dendrogram of all macroalgal reflectance spectra labelled by genus. Cluster certainties by AU p-value are represented symbolically, with all values below 70 omitted for visual clarity.
Remotesensing 17 03491 g006
Figure 7. Hierarchical clustering analysis dendrogram of kelp genera labelled by sampling site, for reflectance spectra from 460 nm to 925 nm. Splits without symbolic labels were assigned AU p-values below 70. Clusters A, B, and C are annotated to facilitate references in the main text. Sites are abbreviated as: NZL = New Zealand, VIC = Victoria, TAS = Tasmania.
Remotesensing 17 03491 g007
Figure 8. Confusion matrices for the three image-applicable classifiers applied to the full spectral dataset and to the kelp subset labelled by genus and sampling region. (a) SAM—full dataset; (b) SAM—kelp subset; (c) RF—full dataset; (d) RF—kelp subset; (e) LDA—full dataset; and (f) LDA—kelp subset. Annotations show macro F1 scores in percent, rounded to the nearest integer. Genera are abbreviated as follows: Und = Undaria, Macro = Macrocystis, Eck = Ecklonia, Durv = Durvillaea, Phyllo = Phyllospora, Cysto = Cystophora, Carpo = Carpophyllum, Scyto = Scytosiphon, Peta = Petalonia, Acro = Acrocarpia, Hormo = Hormosira, Sarg = Sargassum, fr. rhodo = frondose rhodophytes, fil. rhodo = filamentous rhodophytes.
Remotesensing 17 03491 g008
Figure 9. Matrices of the confusion error standard deviation across 10,000 runs of the RF and LDA classifiers for both the full dataset and the kelp subset labelled by genus and sampling region. All values in percent, rounded to the nearest integer. (a) RF—full dataset; (b) RF—kelp subset; (c) LDA—full dataset; (d) LDA—kelp subset. Genera are abbreviated as in Figure 8.
Remotesensing 17 03491 g009
Table 1. Overview of the classifiers tested and compared in this work.
ClassifierDescriptionInput DataClassifier Data
Division
Evaluation
Metric
Hierarchical
Clustering
Analysis
(HCA)
A sample is compared to every other sample on a one-to-one basis. The two most similar are clustered, with that cluster becoming a point of comparison instead of the two component samples. These comparisons are iteratively performed until one cluster contains all samples.Reflectance
spectra
One-to-one
comparisons
Approximately Unbiased (AU) p-Value
Spectral
Angle
Method
(SAM)
Class labels are assigned by minimizing the angle between the vector representing a sample in n-dimensional space (where n is the number of spectral bands) and the vector of a class’s average or reference spectrum.Reflectance
spectra
Leave-one-outF1 score
Random
Forest
(RF)
A series of binary decisions are made based on the spectral features to assign a sample to a class, forming a decision tree. The random forest aggregates the results of many decision treesPrincipal
Component
transformed
spectra
70% training
30% testing
F1 score
Linear
Discriminant
Analysis
(LDA)
Labelled data is projected into multidimensional space. A new set of orthogonal axes are defined to maximize the separation between classes on the fewest possible axes.Reflectance
spectra
70% training
30% testing
F1 score
Disclaimer/Publisher’s Note: The statements, opinions and data contained in all publications are solely those of the individual author(s) and contributor(s) and not of MDPI and/or the editor(s). MDPI and/or the editor(s) disclaim responsibility for any injury to people or property resulting from any ideas, methods, instructions or products referred to in the content.