Article

Impacts of Climate Variations and Human Activities on the Net Primary Productivity of Different Grassland Types in the Three-River Headwaters Region

1
State Key Laboratory of Plateau Ecology and Agriculture, Qinghai University, Xining 810016, China
2
Sanjiangyuan Grassland Ecosystem National Observation and Research Station, Qinghai University, Xining 810016, China
3
Academy of Animal Science and Veterinary Medicine, Qinghai University, Xining 810016, China
4
College of Natural Resources and Environment, Northwest A&F University, Xianyang 712100, China
*
Author to whom correspondence should be addressed.
Remote Sens. 2025, 17(3), 471; https://doi.org/10.3390/rs17030471
Submission received: 15 December 2024 / Revised: 20 January 2025 / Accepted: 27 January 2025 / Published: 29 January 2025
(This article belongs to the Special Issue Remote Sensing of Mountain and Plateau Vegetation)

Abstract

:
Climate variations and human activities, as two major driving forces, have profound impacts on alpine ecosystems. The Three-River Headwaters Region (TRHR) is located in the alpine region and is the source of three major rivers flowing to eastern China and Southeast Asia. Grassland is the dominant vegetation type in the TRHR and is fragile and sensitive to climate variations and human activities due to the alpine environment. Different types of grassland may have varying coping mechanisms with disturbances due to their unique environments and physiological functions. However, there is limited quantitative research on the response of different grassland types to climate variations and human activities in the TRHR. Therefore, the Carnegie–Ames–Stanford approach (CASA) was selected to simulate the net primary productivity (NPP) affected by climate (NPPC) and the actual NPP (NPPA) of steppes and meadows in the TRHR from 2001 to 2022, and the NPP affected by human activities (NPPH) was calculated by subtracting the NPPA from the NPPC. Results showed that the NPPA increased by 0.53 gC/m2/a during the study period, with the NPPA of steppes and meadows increasing by 0.55 gC/m2/a and 0.51 gC/m2/a, respectively. The regions dominated by climate variations, human activities, and the combined impact of the two accounted for 22.01%, 29.42%, and 48.57% of the NPPA changes. In terms of climate change, the impact of temperature and soil moisture on the NPP is equally important. It is worth noting that the alpine meadows (67.60%) contributed more to the increases in the NPPA than the steppes (32.40%). In addition, climate variations and human activities contributed more to the increased total NPPA of the meadows (20.54 GgC and 36.41 GgC) than that of the steppes (14.35 GgC and 10.20 GgC). The results clarify the quantitative evaluation system for the impact of human activities and climate change on different types of grasslands in the TRHR, providing guidance for the protection and management of these grasslands.

1. Introduction

Changes in vegetation are mainly influenced by climate variations and human activities [1,2], and quantitatively assessing the impacts of the two forces on ecosystems is a challenge and a popular subject in academic research [3,4]. In general, precipitation is the primary limiting factor for vegetation growth in arid and semi-arid regions [5]. Conversely, temperature is more critical for vegetation in colder regions [6]. To date, human activities interfere with natural ecosystems to an unprecedented extent with the population growth [1,7,8]. The random, indirect, and microscopic character of human activity makes it difficult to recognize spatially.
The Three-River Headwaters Region (TRHR) is renowned for being the birthplace of China’s Yangtze, Yellow, and Lancang Rivers, making it known as the “Chinese Water Tower”. Grasslands are the dominant vegetation type in the region, which is one of the highest concentrations of biodiversity worldwide [9]. Alpine meadows and steppes are the main grassland types in the TRHR, which are more fragile and vulnerable to external disturbances [10,11,12]. Unfortunately, the intensified human activities and significant changes in the global climate have resulted in unprecedented impacts on the grasslands of the TRHR in recent decades [13,14]. Different types of grassland, such as meadows and steppes, have distinct community structures that are shaped by their unique habitats and strategies for coping with climate variations and human activities [15,16]. Examples include differences between alpine meadows and steppes in terms of species composition, vegetation productivity, plant height, and resistance to disturbance [15,17].
The net primary productivity (NPP) of vegetation is significantly driven by climate factors such as solar radiation, precipitation, and temperature. The NPP, as a composite indicator, can effectively reflect the impacts of climate change on vegetation [18,19]. Currently, the NPP models are valued as a tool for estimating the NPP based on factors like climate. For example, the Carnegie–Ames–Stanford approach (CASA) is a process-based remote sensing model that is driven by global datasets of climate, radiation, soil, and vegetation indices [20], whereas the Miami model calculates the potential NPP of vegetation based on precipitation or temperature [21]. The quantitative calculation of the actual NPP and potential NPP using different models is considered a crucial step in distinguishing the impact of climate change and human activities [4,22,23]. There are also many NPP-related methods that can quantitatively distinguish the impact of climate change and human activities on vegetation, for example the scenario simulation [3] and residual analysis [24] method. As a result, NPP models are widely used to quantify the impact of climate variations on vegetation on global or regional scale [21,25,26]. However, few studies have focused on the response of different grassland types to human activities and climate change in the TRHR, which hinders our knowledge of the evolutionary strategies of the local alpine meadow and steppe under drastic environmental changes and possible future evolutions.
Considering the limitations of current studies, such as the latest changes in the NPP of different types of grasslands in the TRHR and their responses to climate change and human activities, this study aims to (1) model the spatiotemporal distribution of the NPP in the TRHR from 2001 to 2022 and (2) quantify the contribution of climate variations and human activities to the changes in different grassland types, as well as its spatial and temporal variations. Results from this study are expected to provide a scientific basis for the sustainable development of the TRHR and to support governmental decision-making to mitigate the adverse effects of climate change on regional ecological security.

2. Materials and Methods
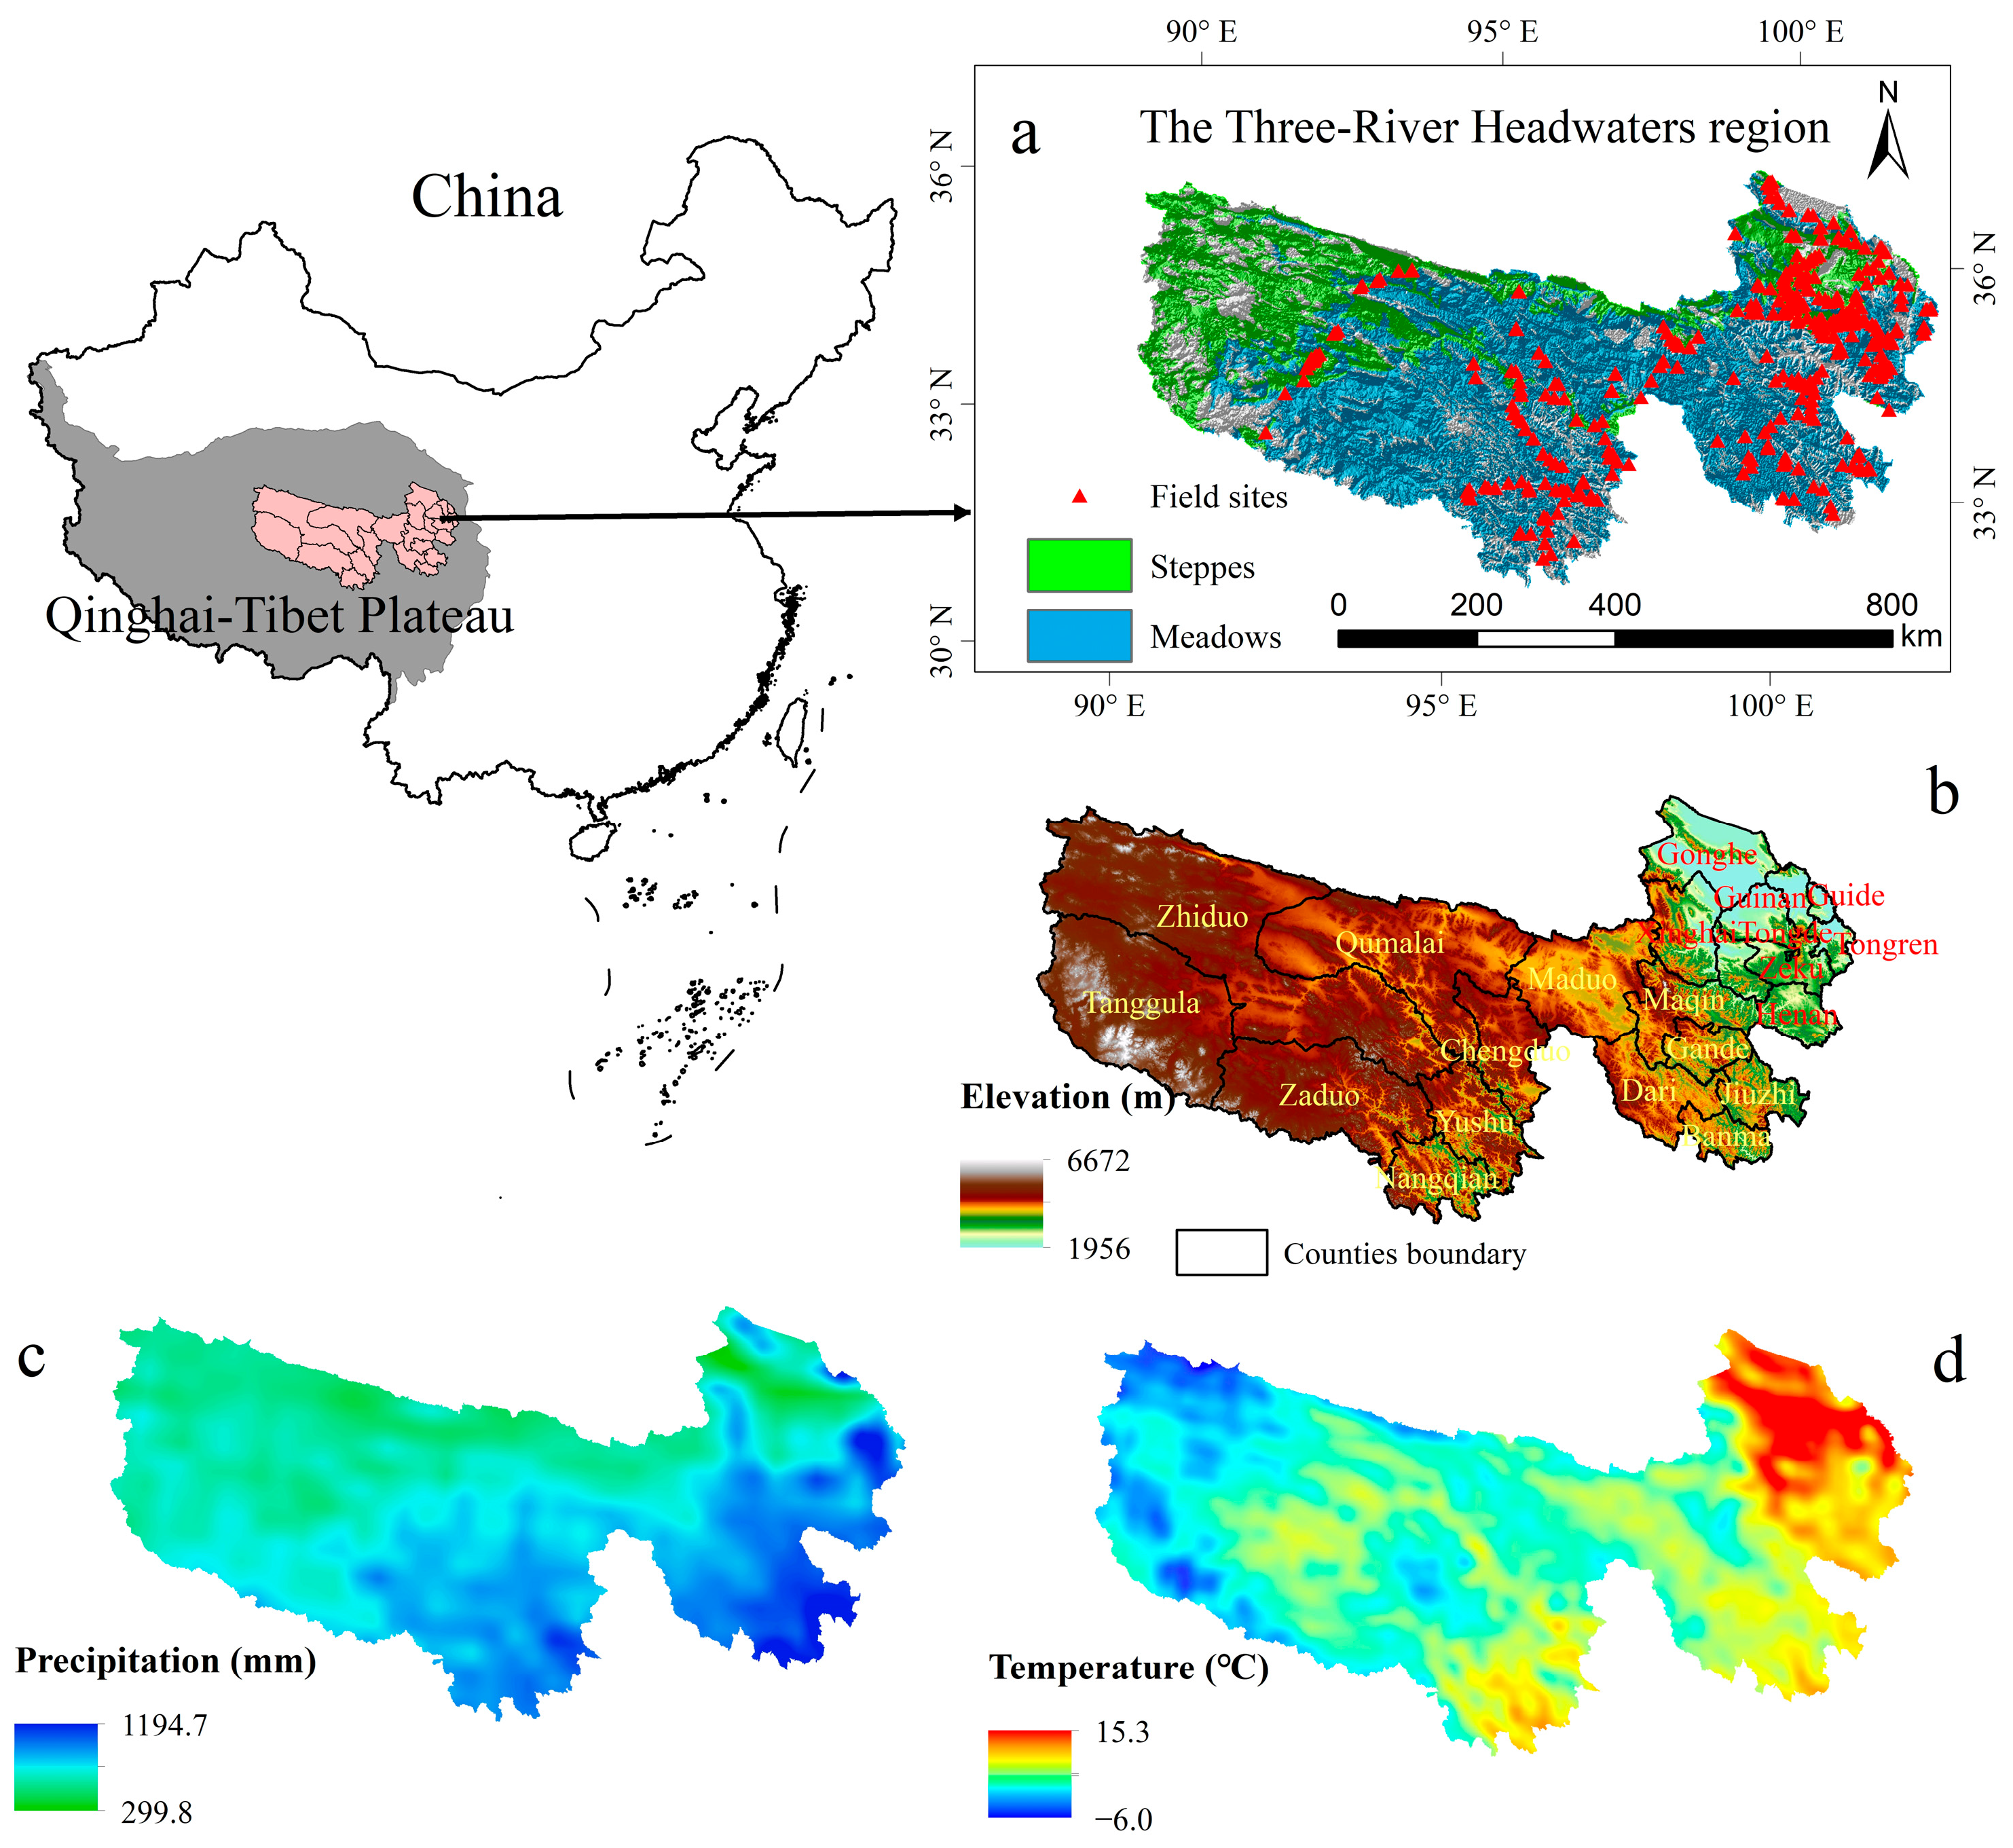
2.1. Study Area

The Three-Rivers Headwaters Region (TRHR) is situated in the central and eastern portion of the Qinghai–Tibet Plateau, China, covering nearly 396,000 km2 (Figure 1). Grassland accounts for 74.44% of the TRHR, with meadows and steppes being the primary vegetation types, comprising 51.48% and 22.96% of the region, respectively (Figure 1a). Specifically, the meadows are dominated by Kobresia humilis and Kobresia pygmaea, characterized by their low stature and extremely low seed germination rates, while the steppes are mainly inhabited by Stipa purpurea and Elymus dahuricus, distinguished by their taller individual height and high seed germination rates. The elevation of the TRHR ranges from 1956 m to 6672 m, and the region comprises 22 administrative units, including 21 counties and 1 township (Figure 1b). Over the last two decades, the average annual precipitation in the TRHR has been between 300 mm and 1195 mm (Figure 1c). Additionally, the average temperature from May to September ranges from −6.0 °C to 15.3 °C (Figure 1d).

2.2. Datasets and Preprocessing

2.2.1. LAI Data

The leaf area index (LAI) data were derived from the Moderate Resolution Imaging Spectroradiometer (MODIS) product of MOD15A2H.061 at a spatiotemporal resolution of 500 m and 8 days. We then used the maximum composition method [27] to convert the 8-day LAI data to monthly data for NPP modeling. The LAI data can be obtained from National Aeronautics and Space Administration of the United States (https://ladsweb.modaps.eosdis.nasa.gov/ (accessed on 1 July 2024)).

2.2.2. Grassland Types Data
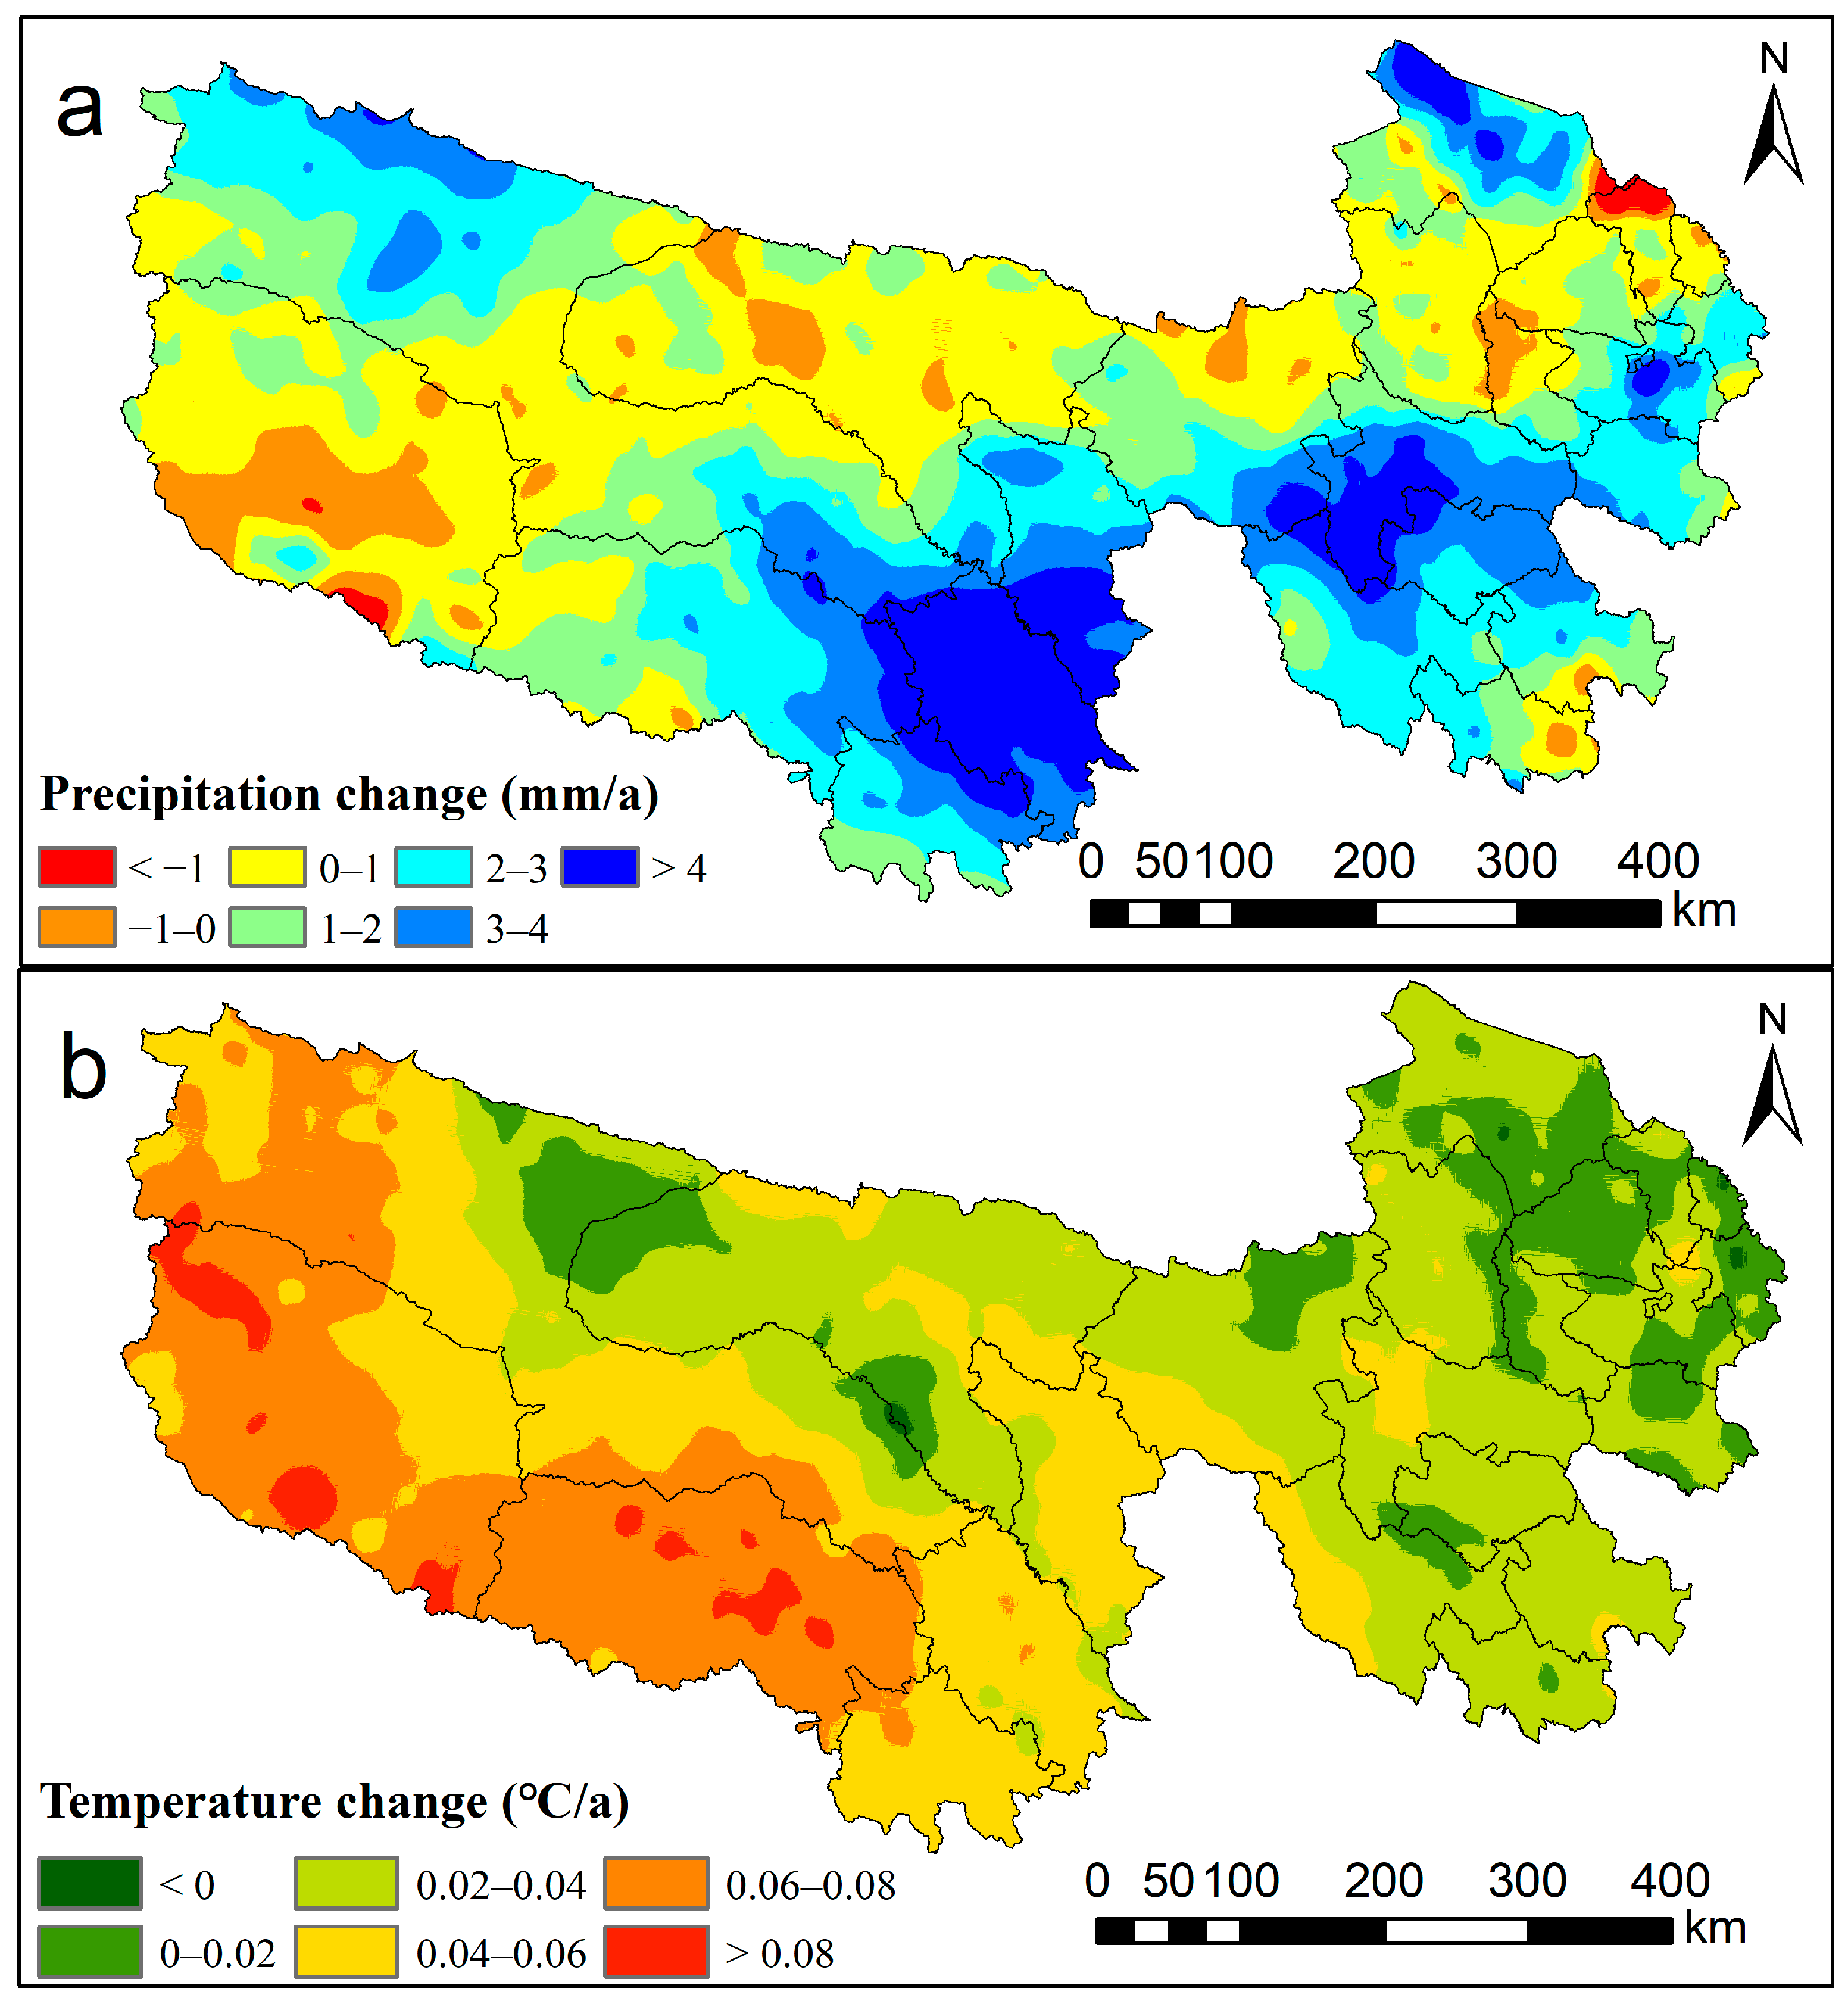
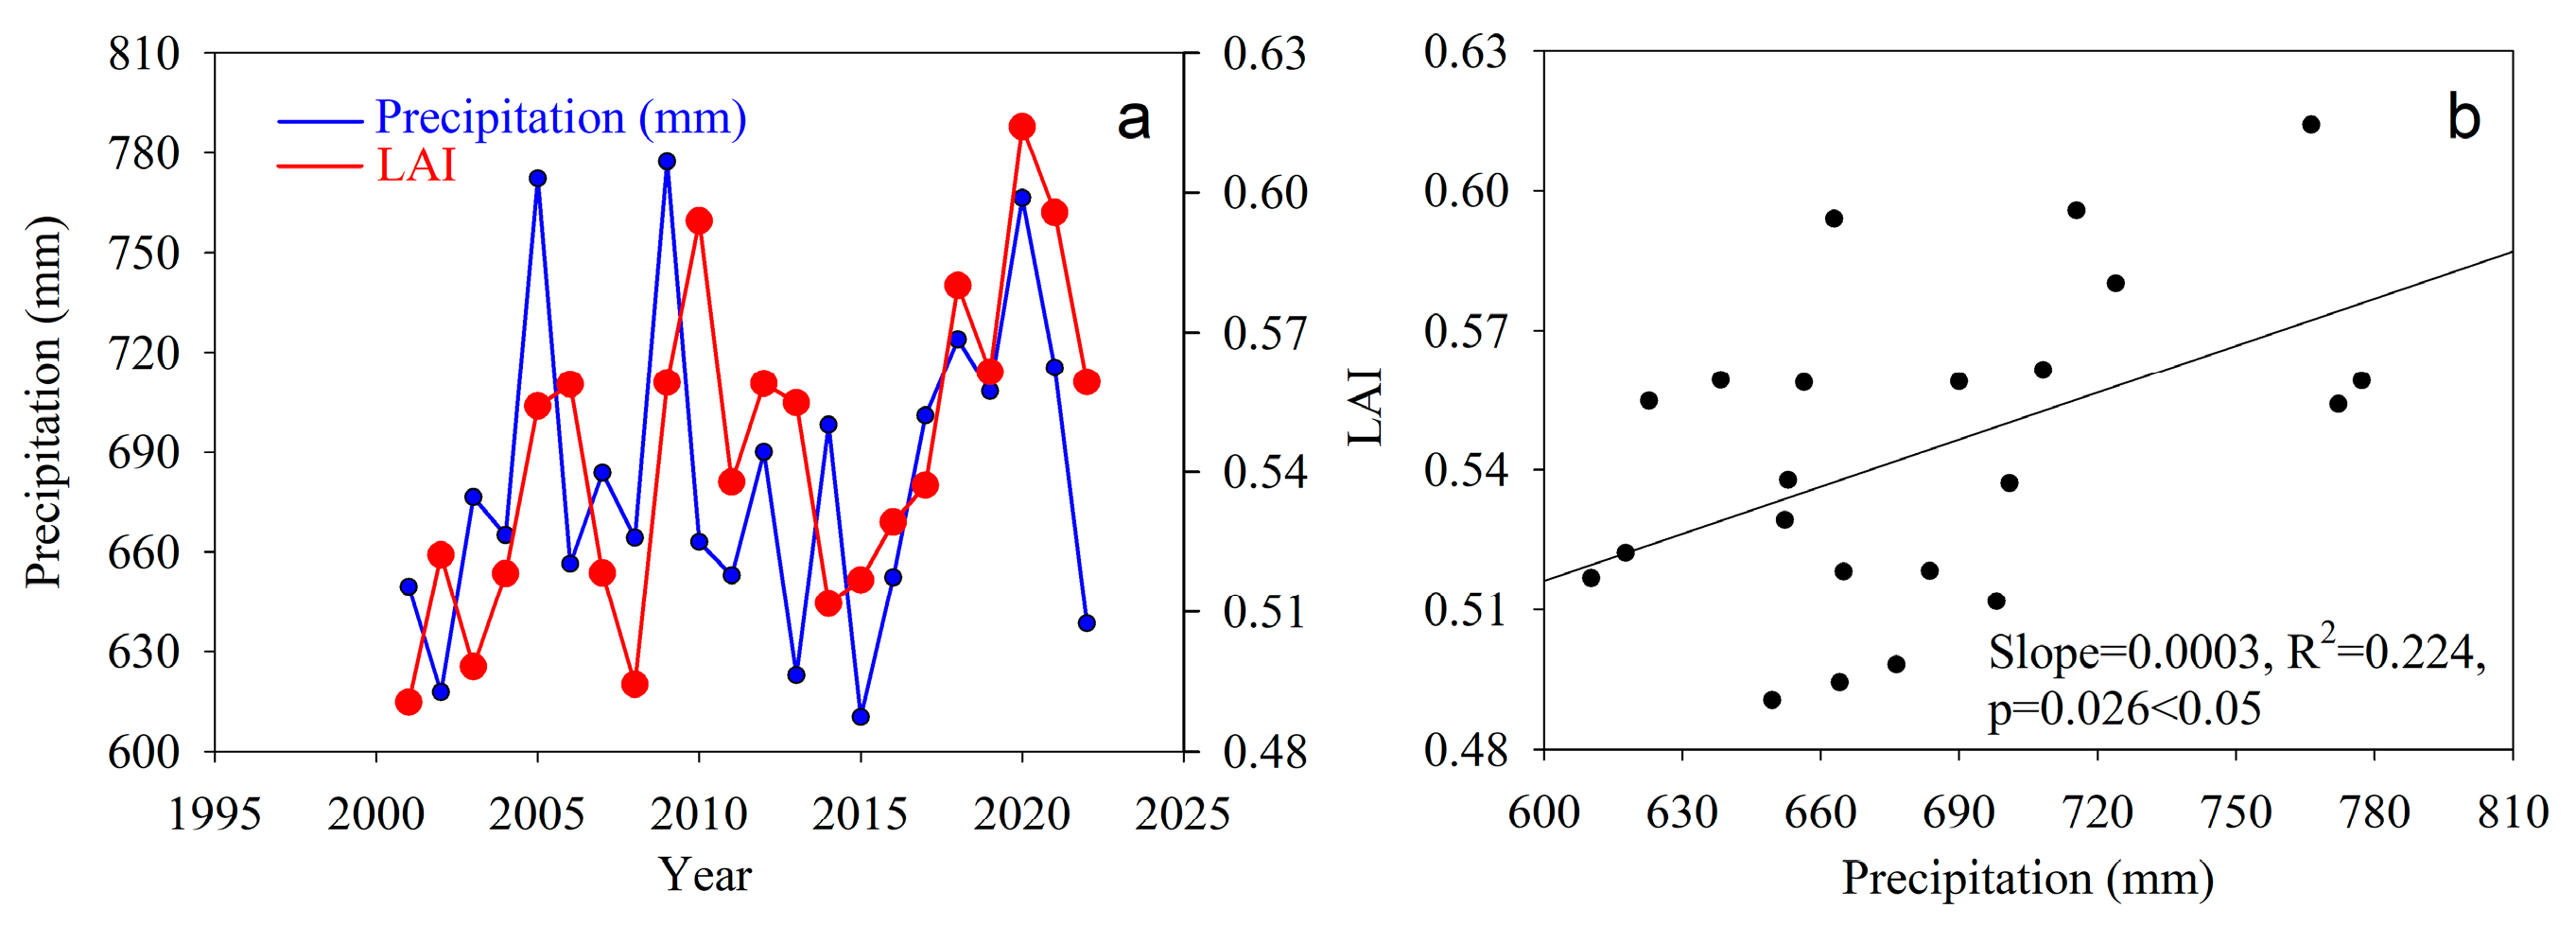
The steppes and meadows distribution data were extracted from The Vegetation of China and Its Geographic Pattern [28]. The vegetation type includes needleleaf forests, needleleaf and broadleaf mixed forests, broadleaf forests, shrubs, alpine steppes, alpine meadows, and marshes in the TRHR. We extracted alpine steppes and alpine meadows for study because the two grassland types cover more than 80% of the TRHR. The extracted data were then rasterized with a resolution of 500 m to match the MODIS LAI data (Figure 1a).

2.2.3. Climate Data

The monthly climate data included soil moisture, temperature, and solar shortwave radiation with a spatial resolution of 0.1° × 0.1°, which were obtained from the European Space Agency ERA5-LAND (https://cds.climate.copernicus.eu (1 July 2024)). These data are used for NPP modeling. We adjusted the spatial resolution to 500 m using the convolutional interpolation operation.

2.2.4. Field Survey Data

We selected 85 sample sites for grassland aboveground biomass (AGB) collection in the TRHR (Figure 1a) from 2021 to 2022. The AGB dataset includes 30 steppes and 55 meadows. These sample plots were chosen from natural grassland areas without the interference of human activities. Each sample covered an area of 1 m × 1 m, within which the AGB in the sample plots was harvested. We placed the collected AGB in an oven and set the temperature to 70 °C to dry them until they reached a constant weight, which was converted to a carbon content use of a factor of 0.45, and the product was used to represent the observation of the NPP over a year. This article also obtained 334 aboveground biomass data points from the literature and datasets spanning from 2001 to 2022, including 125 steppe points and 209 meadow points, sourced from studies, such as Sun [29], Xia [30], Yang [31], and the dataset of measured aboveground plant biomass and remote sensing net primary productivity in desert sites on the Tibet Plateau (2000–2020) [32].

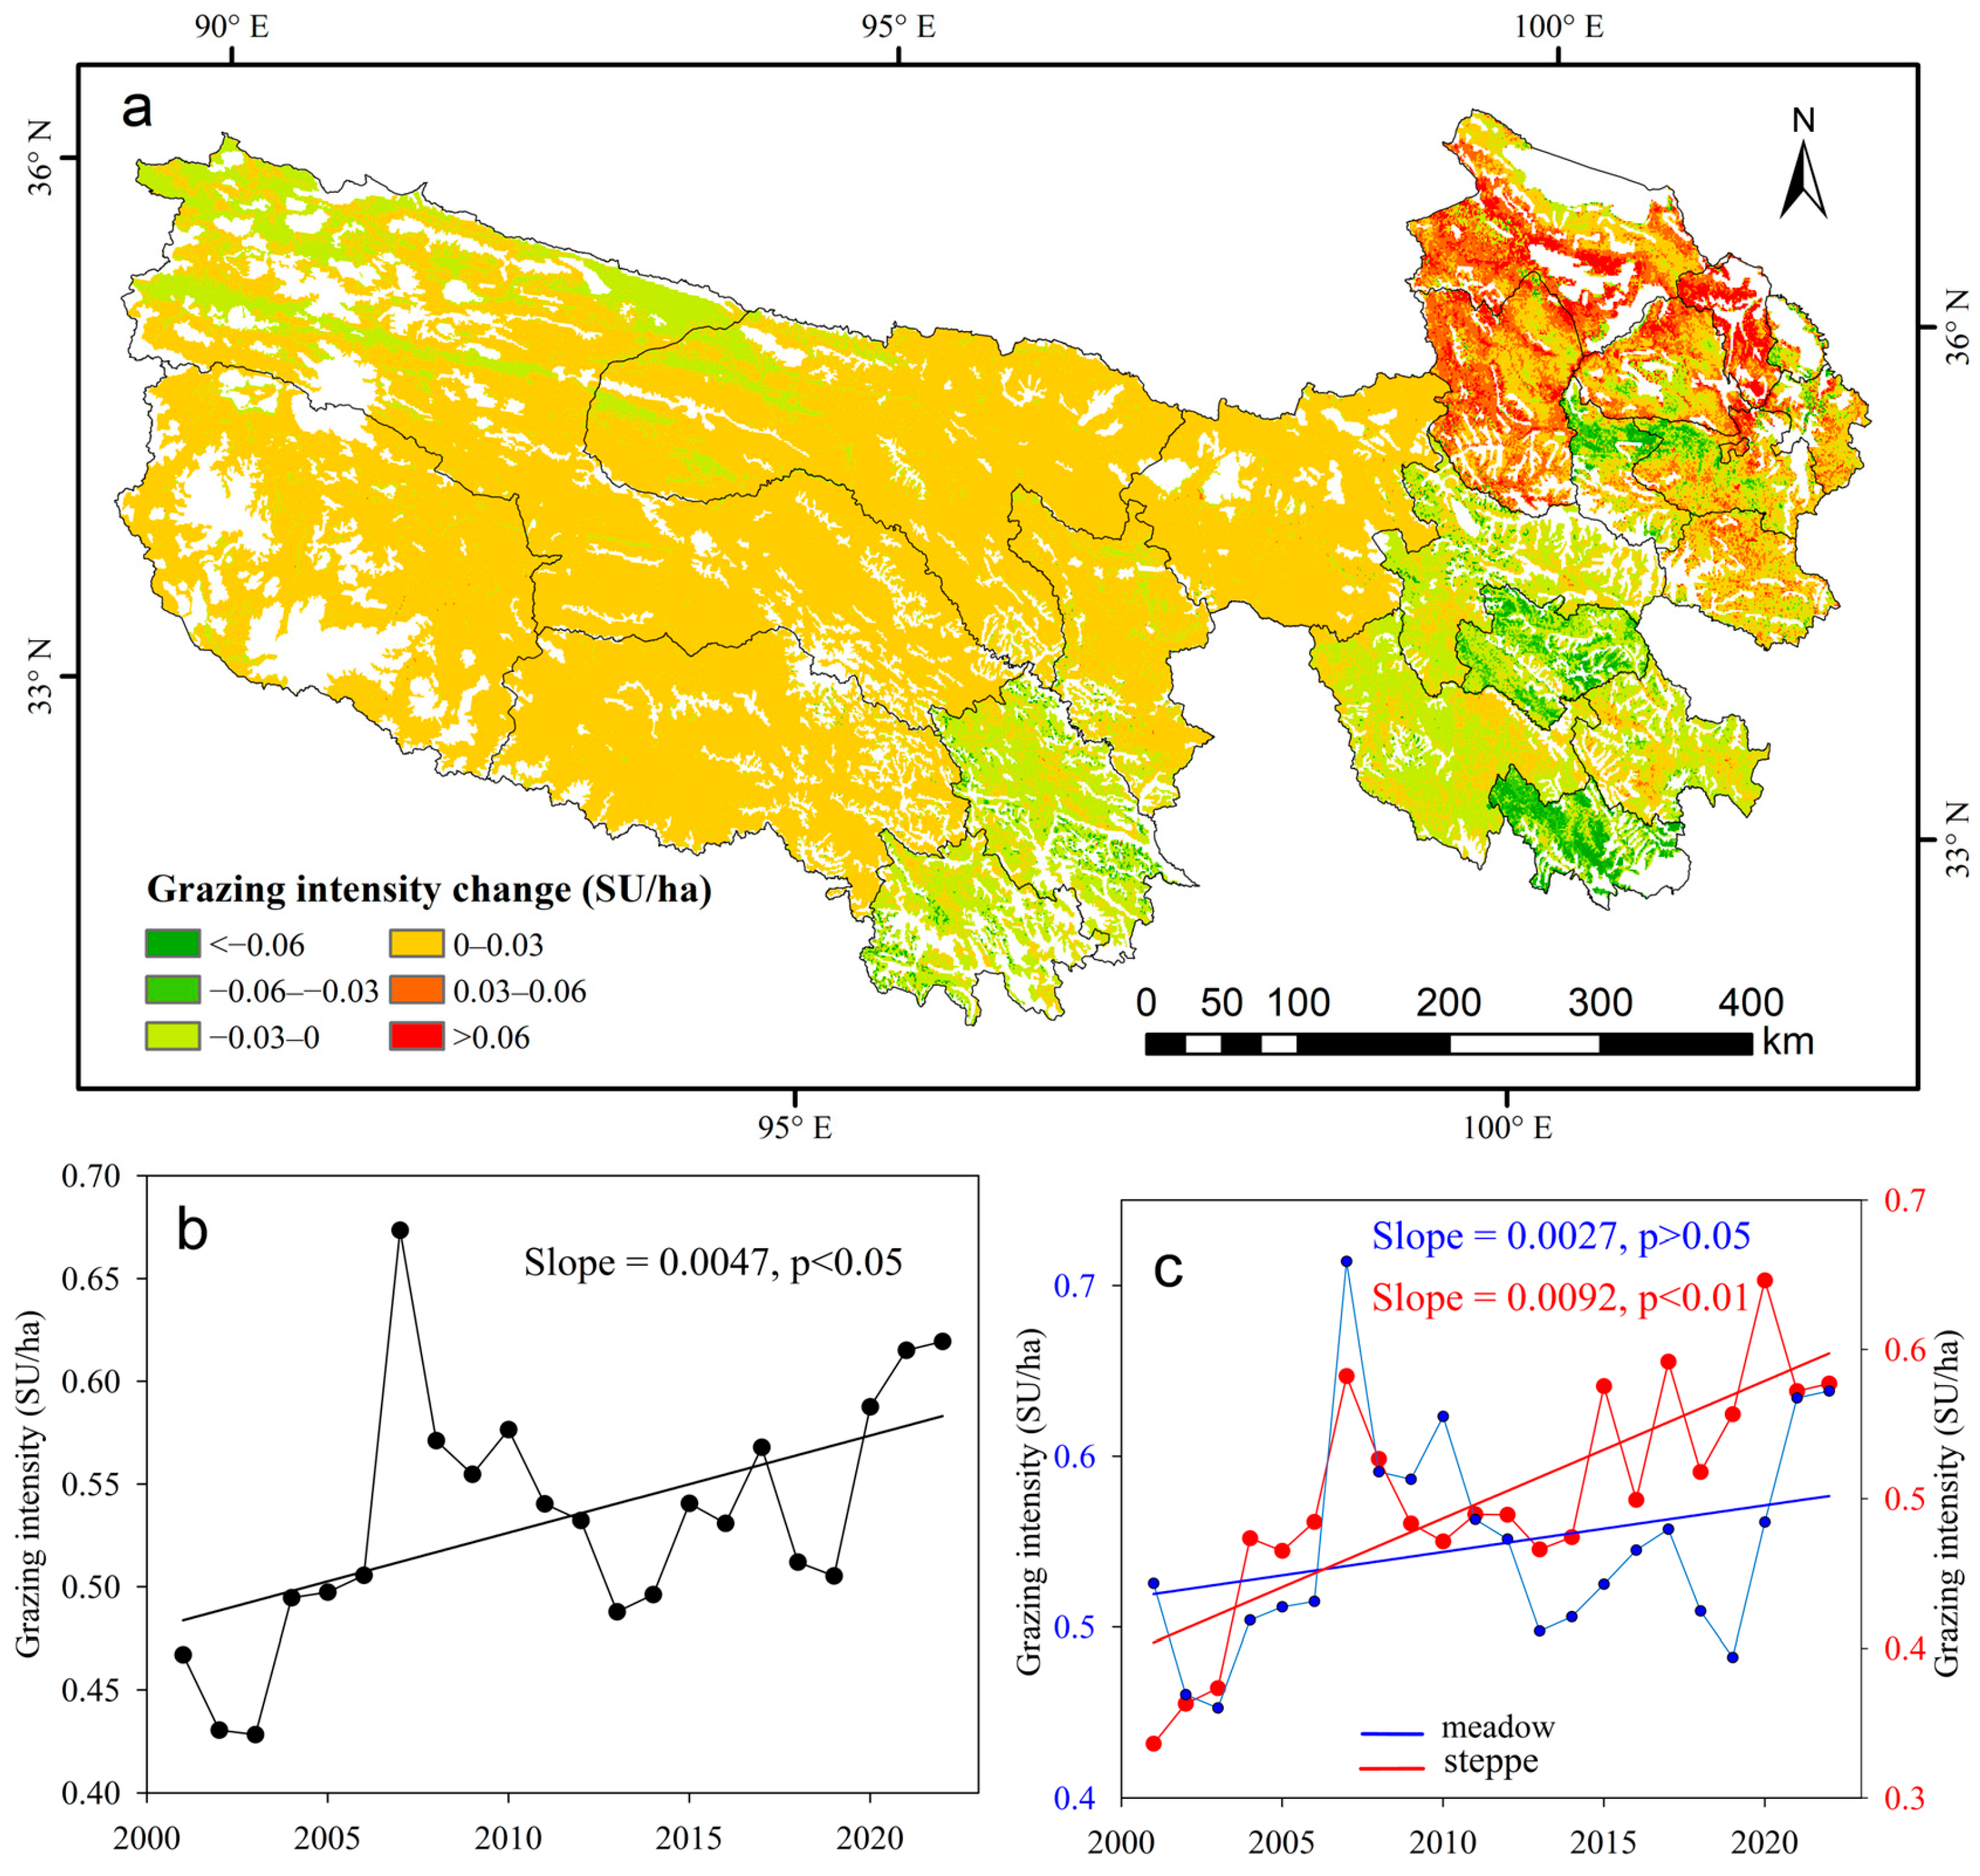
2.2.5. Grazing Intensity Data

The grazing intensity data from 2001 to 2022 with a spatial resolution of 250 m were obtained from the National Ecological Science Data Center (http://www.nesdc.org.cn (1 July 2024)).

2.3. Modeling Actual NPP, Climate NPP, and Human Activity NPP

The Carnegie–Ames–Stanford approach (CASA) model [33], which is a light use efficiency model based on resource balance theory, was employed to model the actual NPP (NPPA) and climate NPP (NPPC). The specific formula of the CASA is as follows:
NPPA(x, t) = APAR(x, t) × ε(x, t),
In the formula, APAR(x, t) represents the absorbed photosynthetically active radiation (MJm−2) of pixel x in time t and ε(x, t) represents the actual light energy utilization efficiency (gC·MJ−1) of pixel x in time t.
APAR(x, t) = SOL(x, t) × 0.5 × FPAR(x, t),
FPAR (x, t) = 1 − e−k×LAI,
SOL(x, t) represents the total solar shortwave radiation (MJm−2) received by pixel x during time t. The coefficient 0.5 accounts for the proportion of total solar radiation that is available for vegetation utilization. FPAR(x, t) stands for the fraction of incident photosynthetically active radiation (FPAR) intercepted by vegetation, which was determined by the LAI, and k is the light extinction coefficient, set to be 0.5.
ε(x, t) = Tε1(x, t) × Tε2(x, t) × Wε(x, t) × εmax,
Tε1(x, t) = 0.8 + 0.02 × Topt(x) − 0.0005 × [Topt(x)]2,
Tε2(x, t) = 1.184/{1 + exp [0.2 × (Topt(x) − 10 − T(x, t))]} × 1/{1 + exp [0.3 × (−Topt(x) − 10 − T(x, t))]}
Wε(x, t) = 0.5 + 0.5 × ET(x, t)/PET(x, t),
εmax is the maximum light energy utilization efficiency under ideal conditions (gC·MJ−1). Following a previous study [34], in the current research, the εmax value for grassland was set as 0.542. Tε1(x, t) and Tε2(x, t) indicate the stress effects of low and high temperatures on maximum light energy utilization efficiency. T(x, t) is the air temperature of pixel x in month t, and Topt(x) is the optimal air temperature when the vegetation biomass reaches its maximum value in a year. Wε(x, t) is the impact of water stress on maximum light energy utilization efficiency, reflecting the influence of water conditions, the value of which is from 0.5 (dry) to 1 (wet). ET(x, t) and PET(x, t) are the evapotranspiration and potential evapotranspiration from MOD16A2GF datasets.
The calculation method for the potential NPP is the same as for the actual NPP, but differs in the FPAR. In this study, the potential FPAR (PFPAR) was calculated using the potential leaf area index (PLAI) and meteorological data. The model can be expressed as follows:
PFPAR = 1 − e−k×PLAI,
PLAI = LAImin + fsw × fst × (LAImax − LAImin),
where LAImax and LAImin represent the maximum and minimum values of the LAI in a month. fst refers to the temperature stress, and fsw is calculated based on soil moisture (SM) and Formula (12):
fst = [(T − Tmin)(T − Tmax)]/[(T − Tmin)(T − Tmax) − (T − Topt)],
fsw = (1 + SM)/(1 + SMmax),
where Tmax and Tmin are the maximum and minimum air temperatures in a month. Topt is the optimum air temperature. SMmax is the maximum soil moisture value of month in a year for each pixel.
NPPC = NPPA + NPPH,
Wang [3] argued that the NPP influenced by climate (NPPC) consists of the actual NPP and the NPP influenced by human activities (NPPH). The same method was adopted to calculate the NPP.

2.4. Attribution of Changes in NPP

2.4.1. NPP Dynamic Assessment

The slope of the linear regression equation reflects the overall trend of NPP during the study period. Compared to the traditional range method, its advantage lies in fitting all the data values using time series information, thereby reducing the impact of occasional abnormal factors on vegetation growth during the study period and more accurately reflecting the long-term evolution trend of vegetation productivity. The formula is as follows:
Slope = n × i = 1 n i × Var i i = 1 n i i = 1 n Var i n × i = 1 n i 2 i = 1 n i 2 ,
where n is the number of years and i is the sequence number of the year. Vari is the total annual NPP in year i.

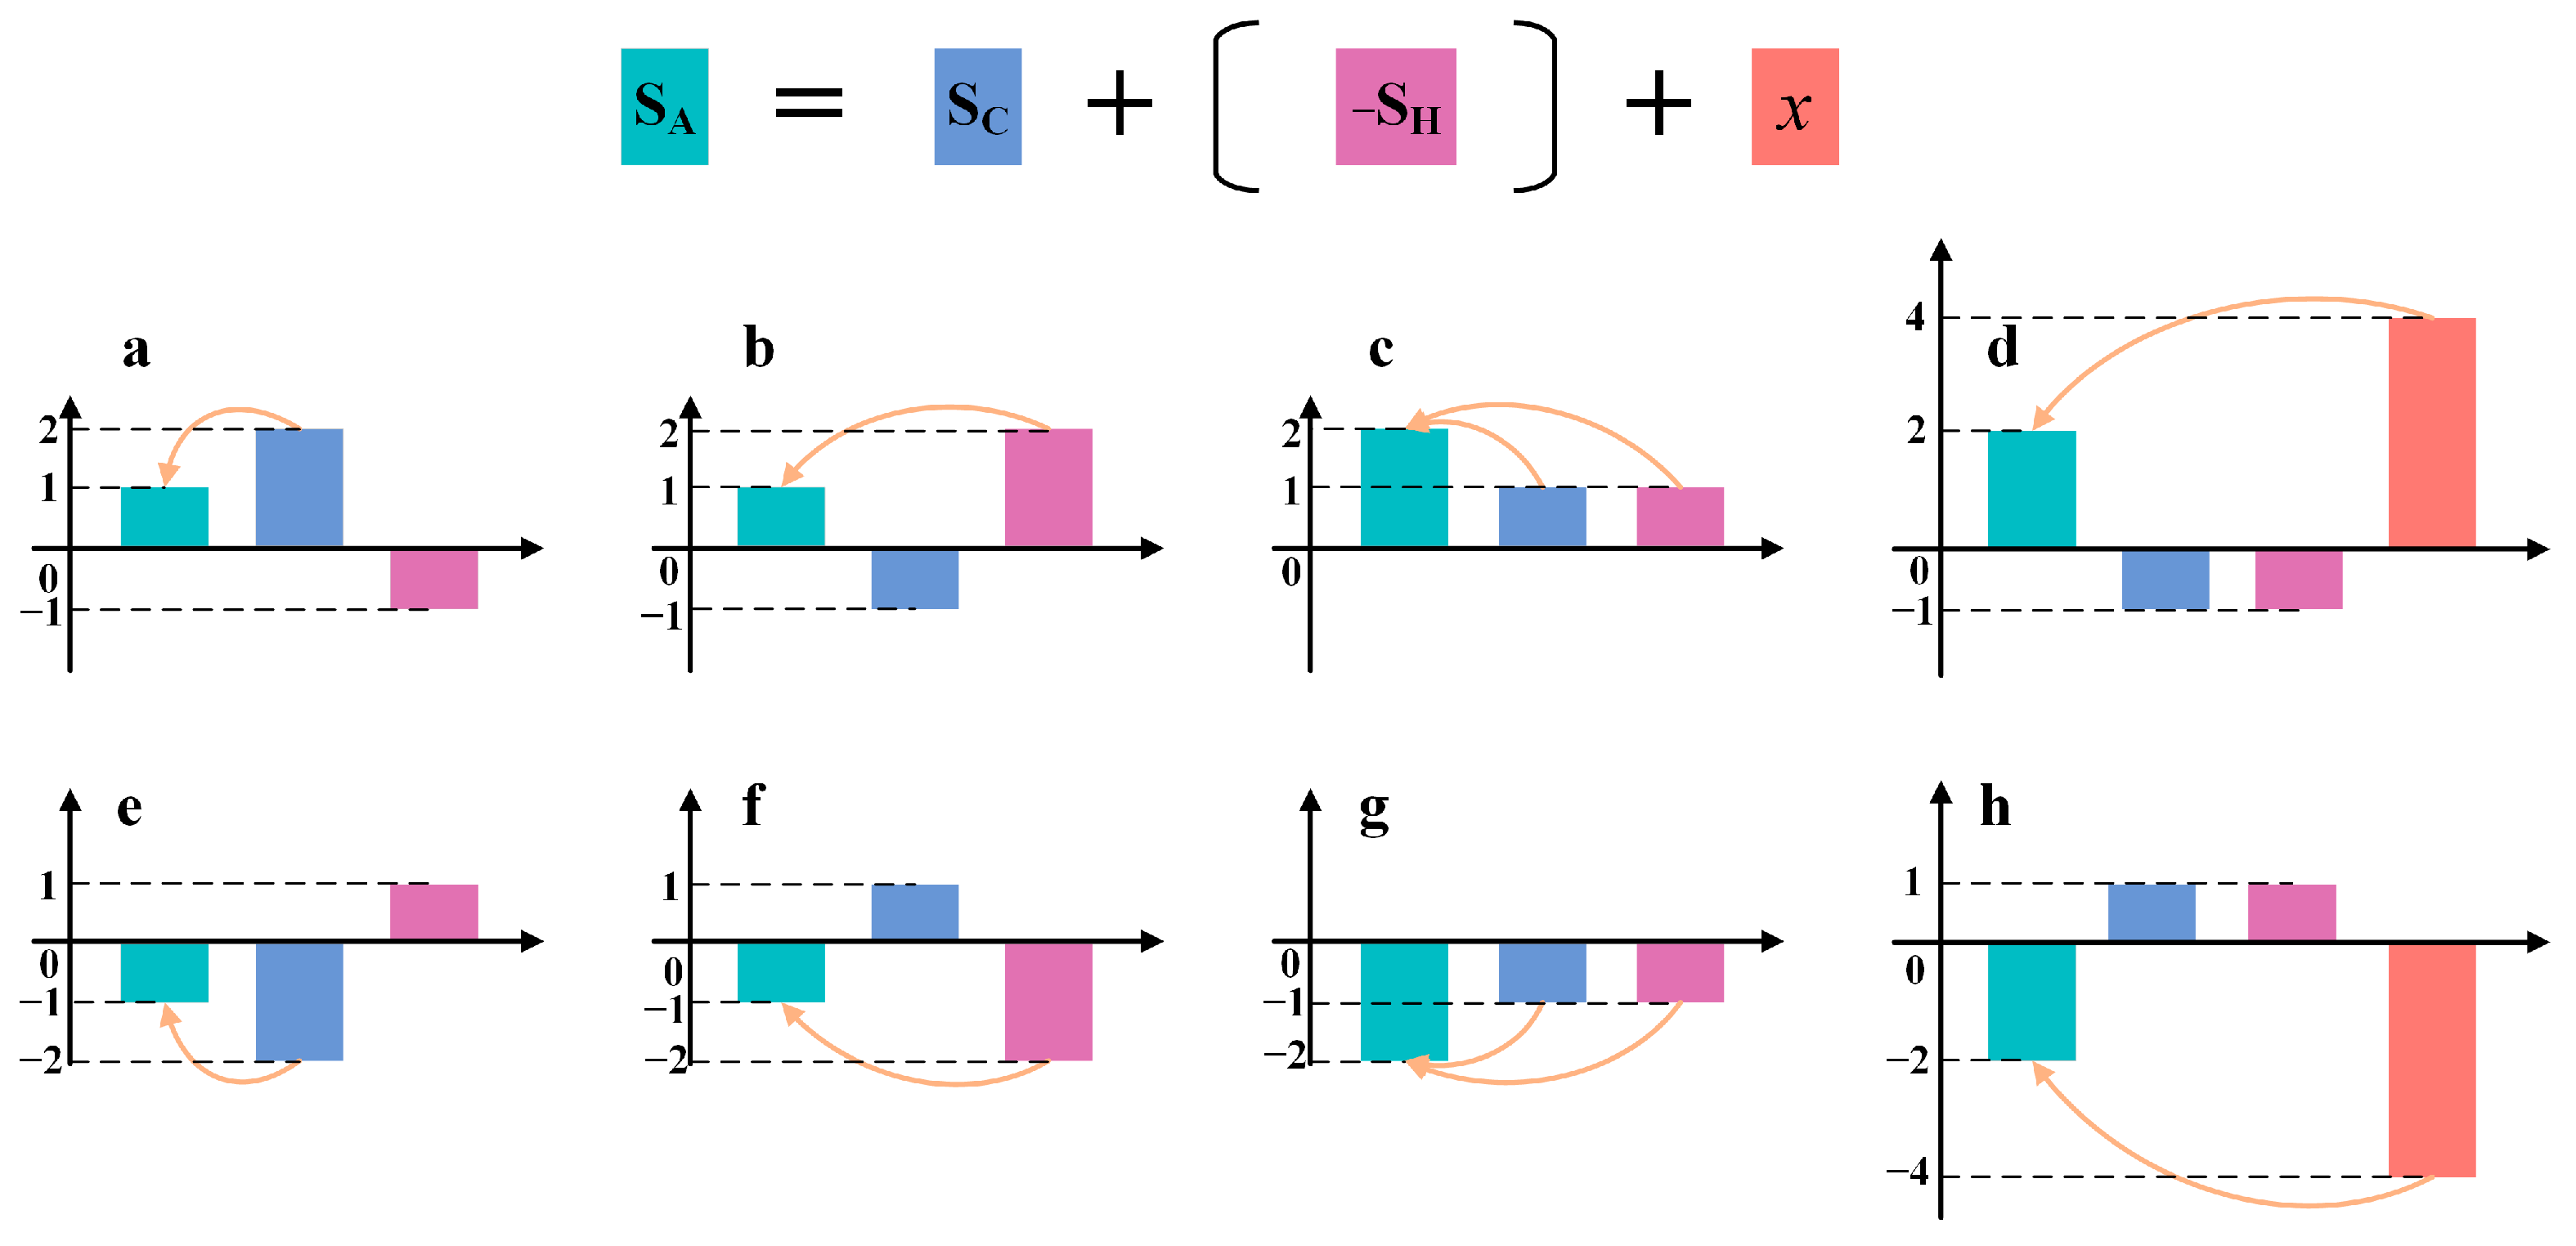
2.4.2. Establishing Scenarios

This study established 8 scenarios (Figure 2) based on the slope of the NPPA (Sactual), NPPC (Sclimate), and NPPH (Shuman), and x refers to factors other than climate change and human activities. The occurrence of Sactual > 0 indicates grassland recovery during the research period, while Sactual < 0 indicates grassland degradation during the research period.
Under the Sactual > 0 situation, Sclimate > 0 and Shuman > 0 indicate that the increase in the NPPA is entirely attributed to climate variations (CDI, Figure 2a), while Sclimate < 0 and Shuman < 0 indicate that the increase in the NPPA is entirely attributed to human activities (HDI, Figure 2b). Sclimate > 0 and Shuman < 0 indicate that the increase in the NPPA is a result of the combined effects of climate variations and human activities (BDI, Figure 2c). Sclimate < 0 and Shuman > 0 indicate that the decrease in the NPP is entirely attributed to other factors (Figure 2d).
Under the Sactual < 0 situation, Sclimate < 0 and Shuman < 0 indicate that the decrease in the NPP is entirely attributed to climate variations (CDD, Figure 2e), while Sclimate > 0 and Shuman > 0 indicate that the decrease in the NPP is entirely attributed to human activities (HDD, Figure 2f). Sclimate < 0 and Shuman > 0 indicate that the decrease in the NPP is a result of the combined effects of climate variations and human activities (BDD, Figure 2g). Sclimate > 0 and Shuman < 0 indicate that the decrease in the NPP is entirely attributed to other factors (Figure 2h).
This study subdivided 20 possible scenarios based on the spatial distribution of three factors: temperature, soil moisture, and grazing intensity. Based on the abbreviations for the preceding dominant factors, please add numbers to represent different factors: 1 for temperature, 2 for soil moisture, 3 for the combined effect of temperature and soil moisture, and 4 for grazing intensity. The number 1 after the “-” indicates an increase, while 2 indicates a decrease. Within these scenarios, four were identified where climate change led to an increase in the NPPA, including scenarios where the temperature increase (CDI1-1), the soil moisture increase (CDI2-1), both the temperature and soil moisture increases (CDI3-1), and both the temperature and soil moisture decreases (CDI3-2) all resulted in an increase. Similarly, four scenarios were identified where climate change led to a decrease in the NPPA due to temperature reductions (CDD1-2), soil moisture reductions (CDD2-2), both temperature and soil moisture reductions (CDD3-2), and a specific context where both temperature and soil moisture increases led to a decrease (CDD3-1). Considering human activities, four scenarios were identified based on grazing intensity, where an increase resulted in an increase (HDI4-1) or decrease (HDD4-1) in the NPPA and a decrease resulted in an increase (HDI4-2) or decrease (HDD4-2) in the NPPA. In the scenarios where both climate change and human activities contribute to an increase in the NPPA, four sub-scenarios have been identified: an increase in grazing intensity as the primary factor leading to an increase in the NPPA (BDI4-1), a decrease in grazing intensity as the primary factor unexpectedly leading to an increase in the NPPA (BDI4-2), an increase in temperature as the primary factor leading to an increase in the NPPA (BDI1-1), and an increase in soil moisture leading to an increase in the NPPA (BDI2-1). Similarly, for decreases in the NPPA, the main factors were increased grazing intensity (BDD4-1), decreased grazing intensity (BDD4-2), decreased temperature (BDD1-2), and decreased soil moisture (BDD2-2).

3. Results

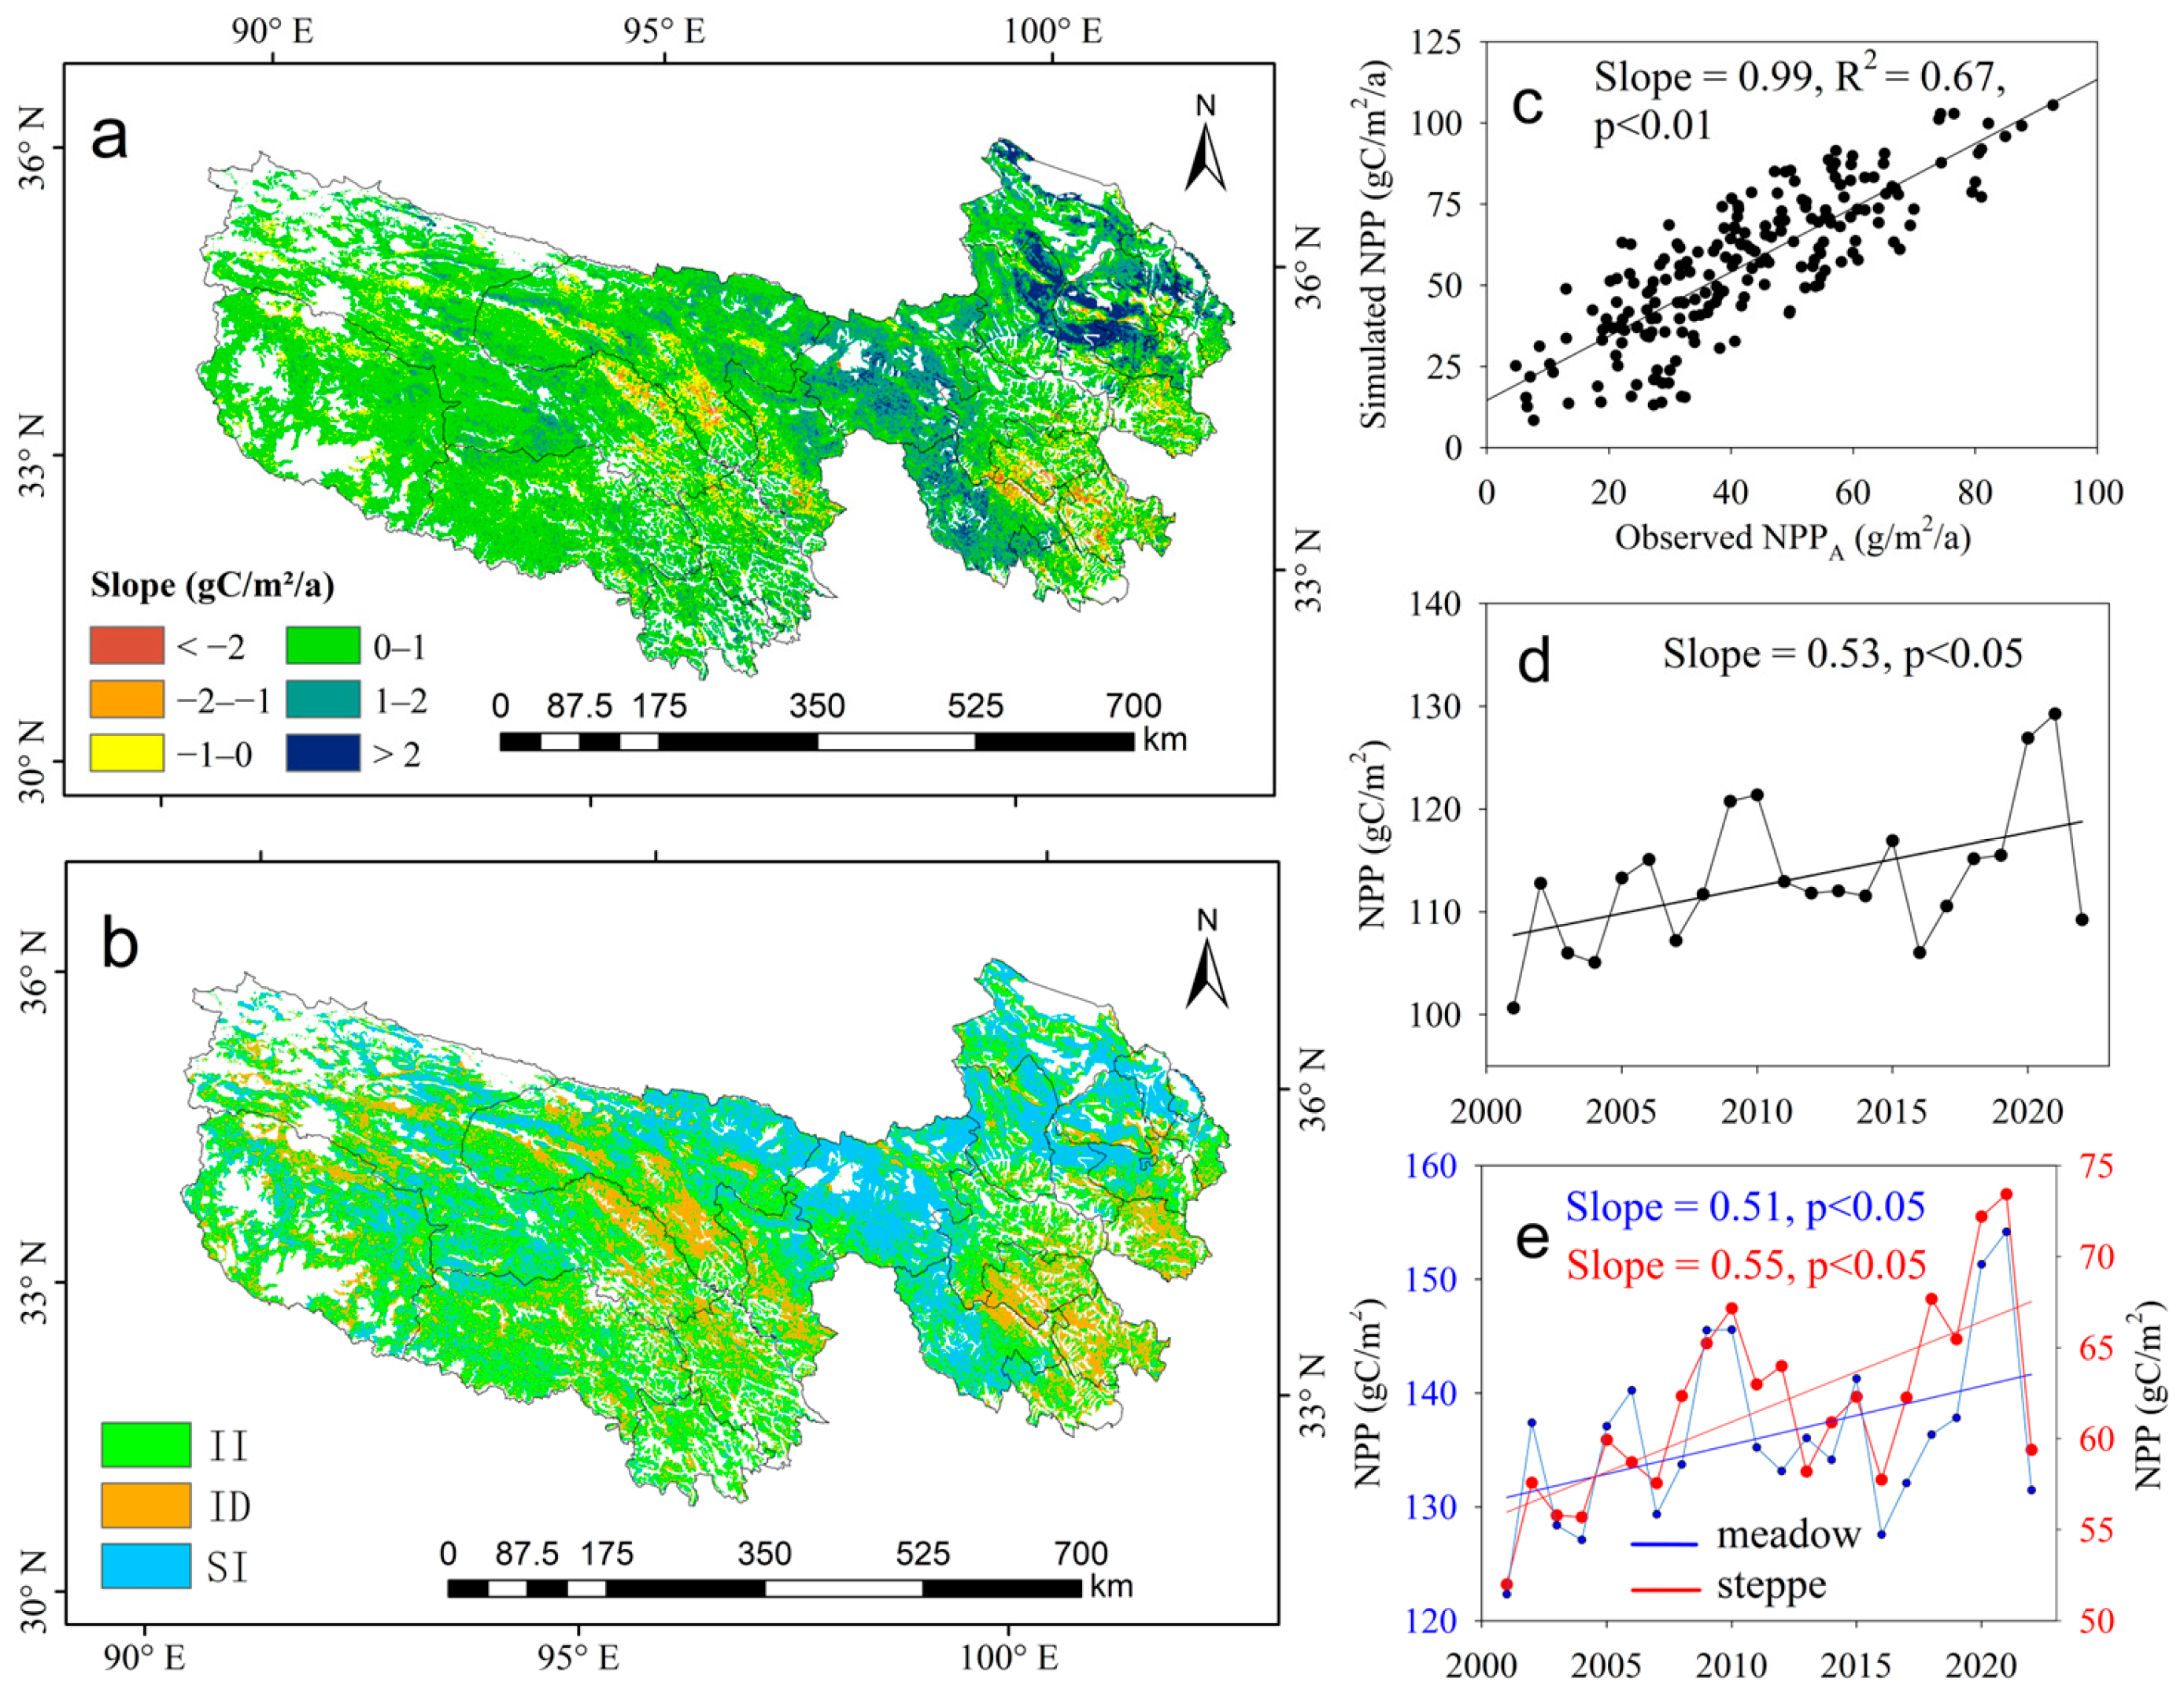
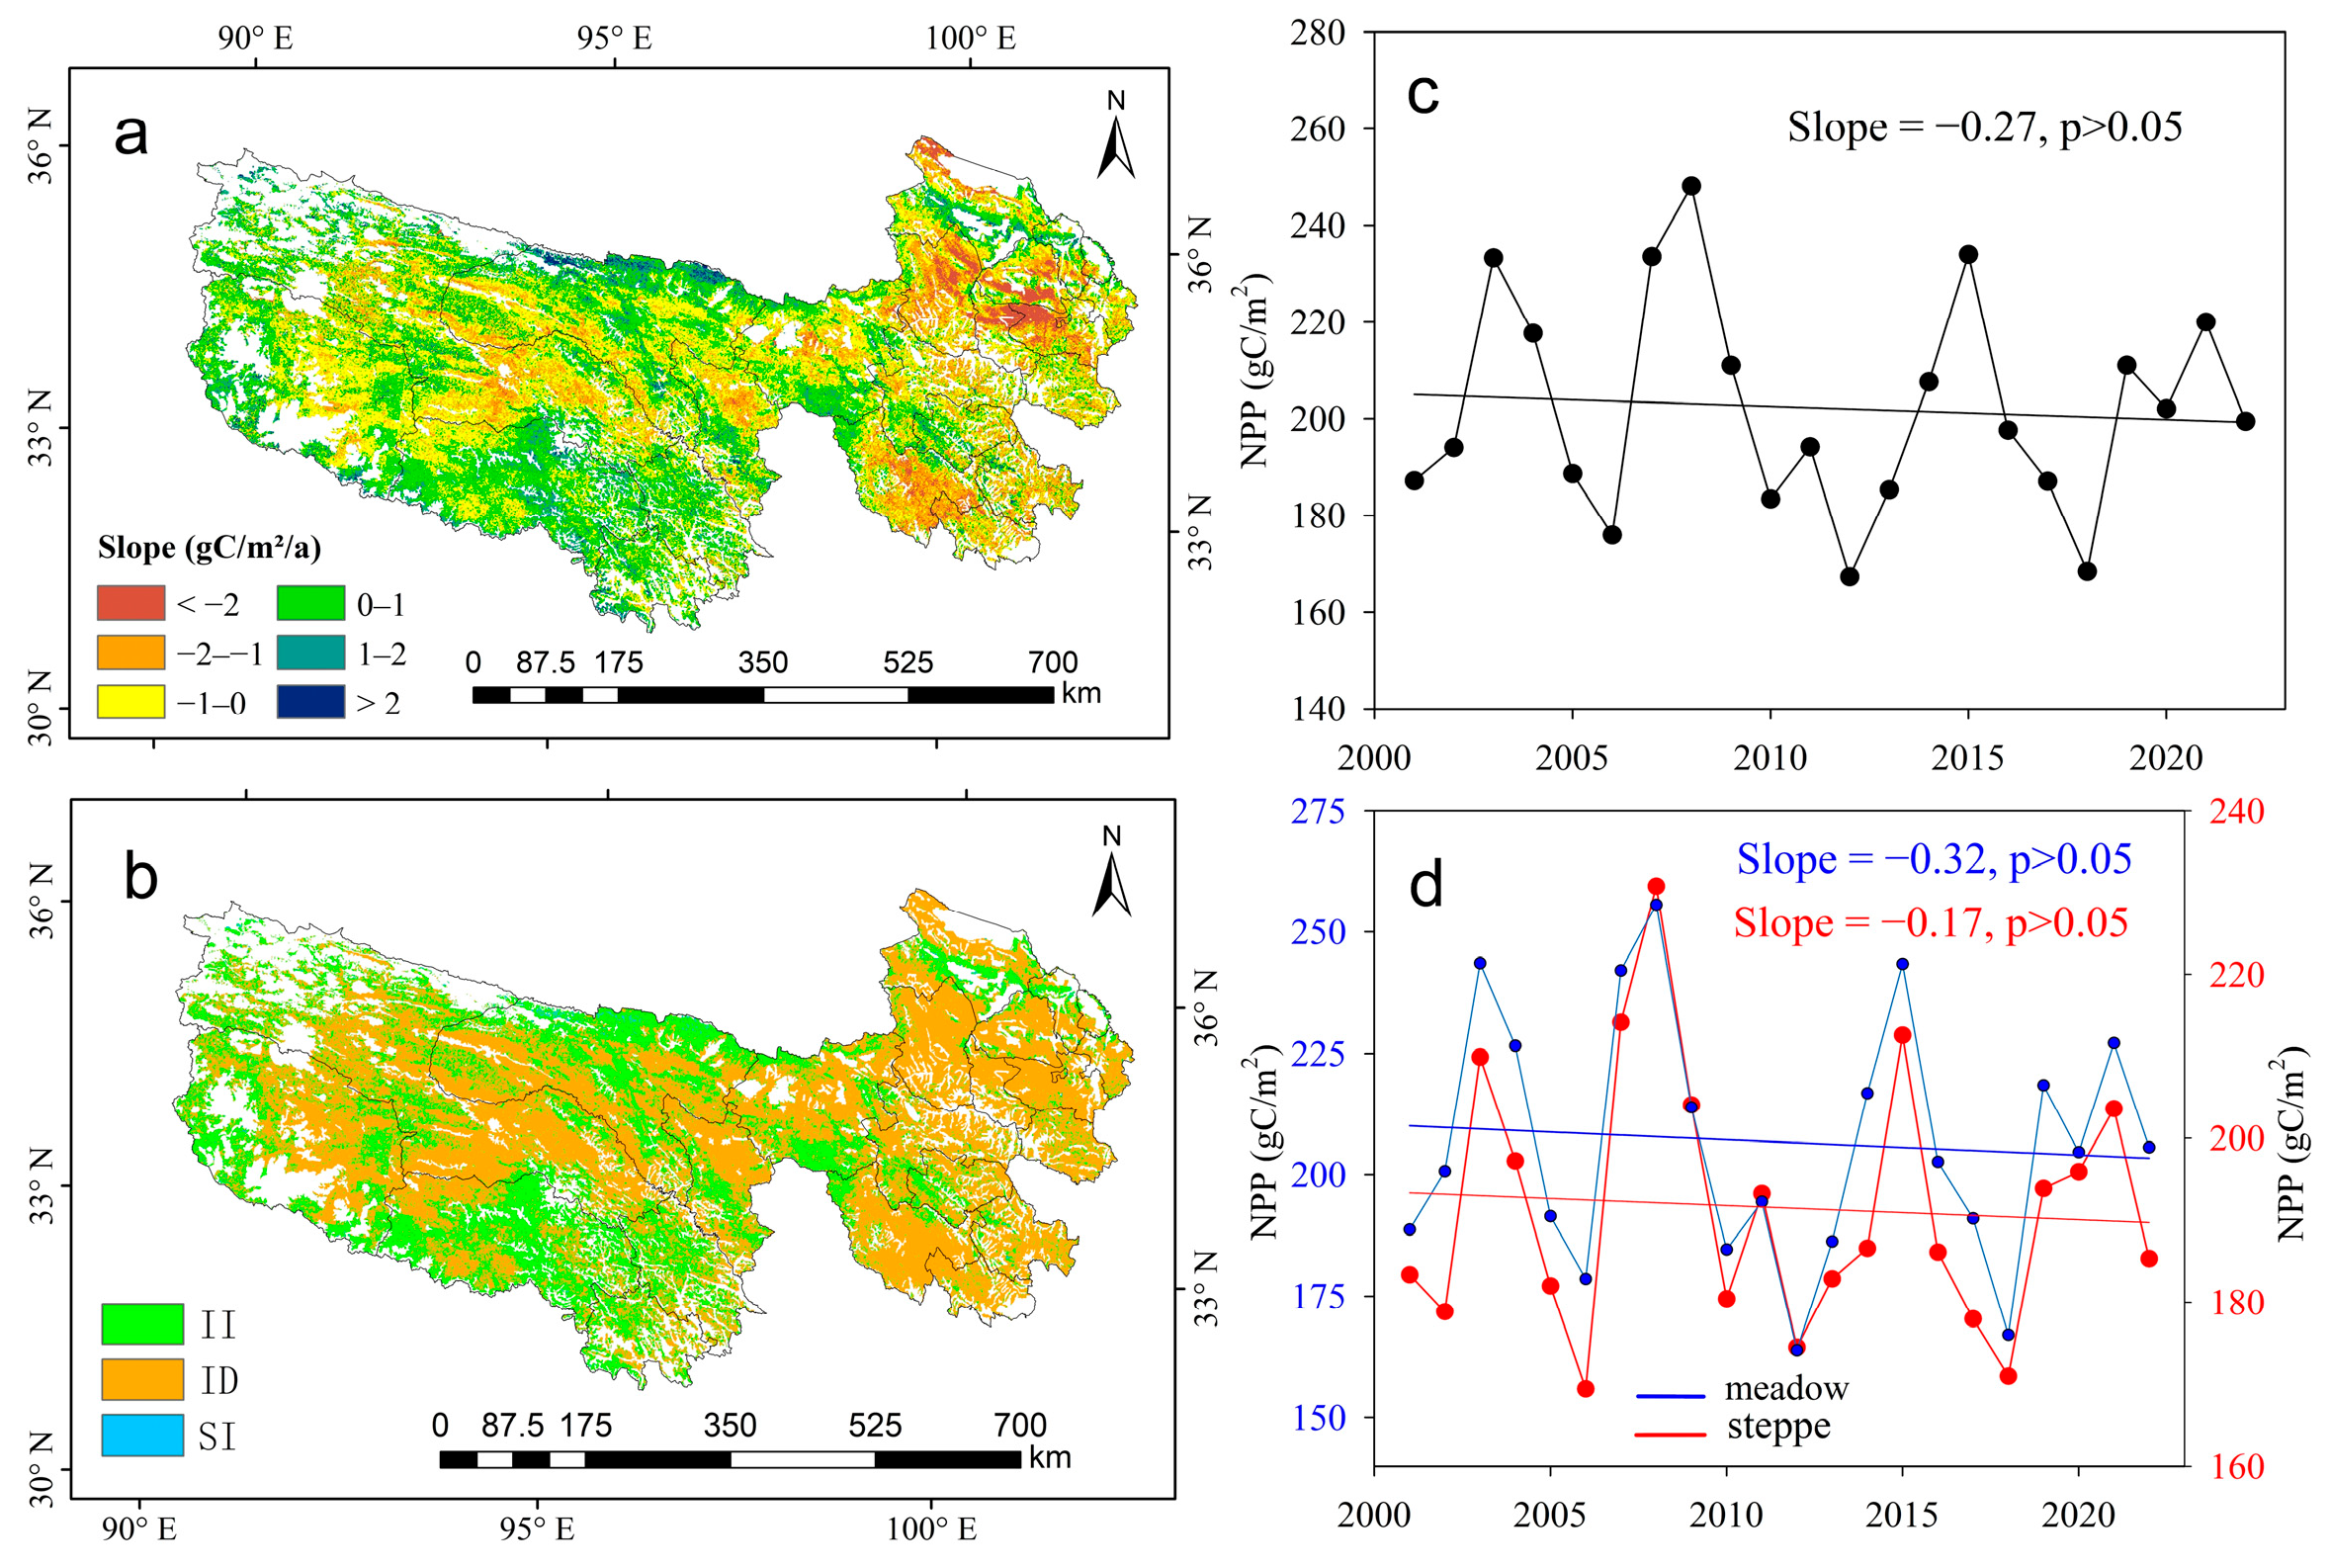
3.1. Trends of NPPA in Meadow and Steppe

Nearly 81.04% of the TRHR exhibit positive slopes of the NPPA from 2001 to 2022 (Figure 3a). In particular, the slopes are greater than 2 gC/m2/a in the northeastern TRHR. In contrast, only 18.96% of the region shows negative trends that can be found in the southwest and center of the TRHR. However, all the decreasing slopes are not statistically significant. The significant increasing (SI) slope areas are mainly distributed in the central and northeastern regions of the TRHR. Among them, the main vegetation type in the central region is meadow, covering an area of 56,573 km2, while the main vegetation type in the northeastern region is steppe, covering an area of 32,354 km2. The insignificant increasing (II) slope areas are mainly distributed in the southeastern and southwestern parts of the TRHR (Figure 3b). Certainly, in order to ensure the reliability of the simulated NPPA, a regression analysis between the actual biomass and simulated NPPA (Figure 3c) was performed and resulted in a highly significant relationship with a slope close to 1, indicating that the simulated NPPA is equivalent to the actual NPP. Overall, the NPPA of grassland presents a significant increasing trend in the TRHR from 2001 to 2022 (0.53gC/m2/a, p < 0.05, Figure 3d). And we found a sudden drop in 2022, which was consistent with the changing trend of the LAI (Figure A2). Although the average NPP of meadow is higher than that of steppe, the slope value of the steppe NPP (0.55 gC/m2/a) is greater than the meadow’s (0.51 gC/m2/a, as shown in Figure 3e).

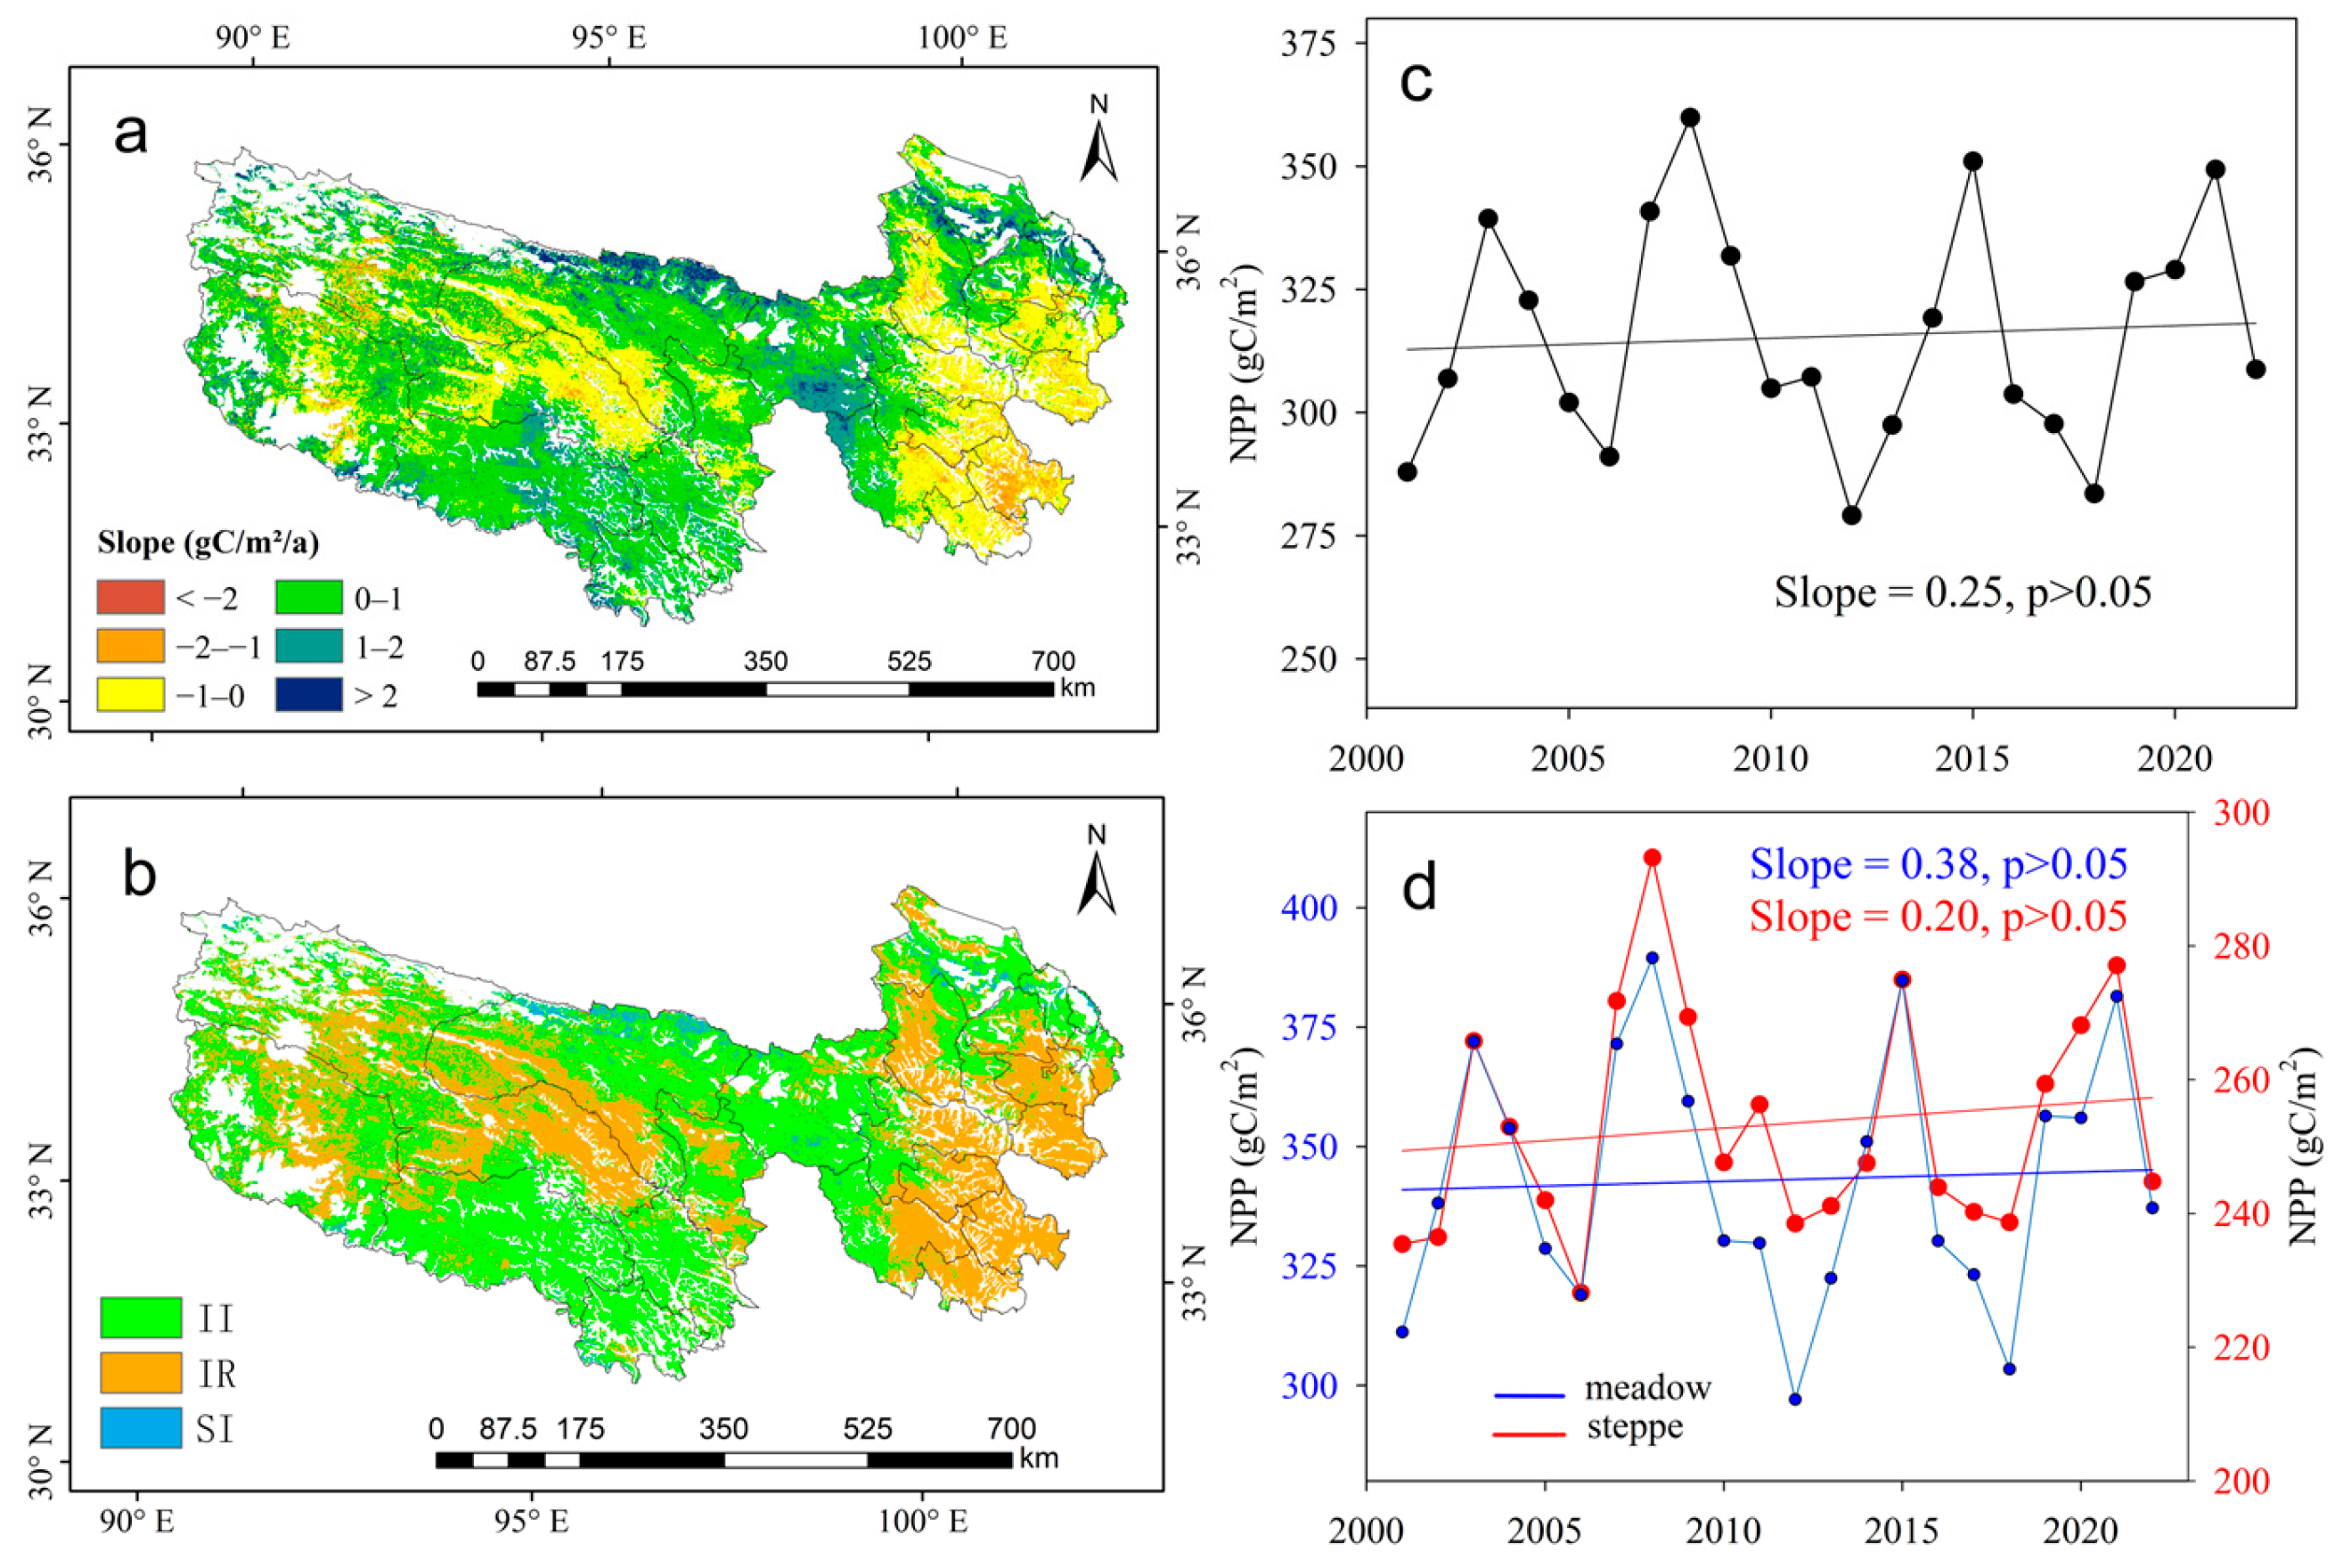
3.2. Trends of NPPC in Meadow and Steppe

In general, the NPPC increased by 0.25 gC/m2/a from 2001 to 2022. The regions with an increasing NPPC are found in the northeastern, southern, and central–northern TRHR. It is noteworthy that in certain areas of the northeastern and central–northern regions, the slope variation of the NPPC is greater than 2 gC/m2/a (Figure 4a). The NPPC shows decreasing trends in the southeast and central parts of the TRHR, particularly in the Jiuzhi County and the eastern part of Zhiduo County, though the decreasing trends of the NPPC are not significant (Figure 4b). The areas with significantly increasing (SI) slopes are mainly distributed in the central–northern parts of the TRHR. Overall, the trend of the mean annual NPPC is insignificant in the TRHR from 2001 to 2022 (0.25 gC/m2/a, p > 0.05, Figure 4c). Moreover, the trends of the NPPC are higher in meadow (0.38 gC/m2/a, p > 0.05) than in steppe (0.20 gC/m2/a, p > 0.05, Figure 4d).

3.3. Trends of NPPH in Meadow and Steppe

We found that the NPPH in most areas of the TRHR exhibited a downward trend after conducting a linear regression analysis. The northeastern region exhibits a lower slope, indicating a larger magnitude of decline in the NPPH. In contrast, the northwestern, southwestern, and southern TRHR have positive slopes, indicating an increasing trend in the NPPH (Figure 5a). Through significance analysis (Figure 5b), we discovered that the increasing trend of the NPPH in most areas is not significant, nor the decreasing trend observed in the NPPH. The overall average NPPH shows a slope of −0.28 gC/m2/a, but the regression equation is not significant (Figure 5c). When calculating the average slope separately for steppe and meadow, the slope for steppe is also negative (−0.17 gC/m2/a, p > 0.05), while the slope for meadow is −0.32 gC/m2/a (p > 0.05, Figure 5d).

3.4. Contribution of Climate and Human Activities on NPPA Dynamics

We present the spatial distribution of grassland NPPA change affected by climate and human activities (Figure 6). Simultaneously, cross-validation was performed using deep neural network (DNN) computation, as illustrated in Figure A4 and Table A1. The results from the CASA model demonstrated a comparable distribution to those obtained from the DNN, with area similarities ranging between 95.60% and 99.52%. This finding validates the accuracy of the CASA model’s calculation results. The regions where human-dominated NPPA decreases (HDDs) are primarily concentrated in the central and southern TRHR, while the areas where climate-dominated NPPA decreases (CDDs) are predominantly found in the southeastern and western TRHR. The decreasing NPPA dominated by both factors (BDD), on the other hand, exhibits a higher frequency in the southeastern and central TRHR. The decreases in the mean annual NPPA induced by the CDDs, HDDs, and BDDs are −0.27 gC/m2/a, −0.37 gC/m2/a, and −1.05 gC/m2/a, respectively (Table 1). Although the CDD occupies the largest area, the changes in the mean annual NPPA by the BDD are much greater than that of the CDD. Therefore, the BDD leads to the greatest reduction in the total NPPA.
On the contrary, there are large areas with an increased NPPA. The climate-dominated NPPA increases (CDIs) are mainly distributed in the southern and western TRHR, a small portion is distributed in the north and northeast of the TRHR. The human-dominated NPPA increases (HDIs) are primarily distributed in the central and southeastern parts of the TRHR, as well as certain areas in the western region. The increased NPPA dominated by both factors (BDI) is distributed in the central, northeast, and southeast parts of the TRHR. The increased mean annual NPPA by the BDI is the highest (1.16 gC/m2/a), and the areas of BDIs, CDIs, and HDIs are relatively similar, so the BDI has the largest contribution to the overall increased NPPA. The HDI contributes more to the total NPPA than the CDI. In summary, first of all, the regions where climate variations and human activities have a combined impact contributed 76.95 GgC (90.59 GgC–13.64 GgC), accounting for the largest proportion (48.57%). Secondly, the regions dominated by human activities contributed 46.61 GgC (52.69 GgC–6.08 GgC), accounting for 29.42%. Finally, the regions dominated by climate variations contributed 34.88 GgC (41.98 GgC–7.10 GgC), accounting for 22.01%.
Regarding steppes and meadows (Table 1), the BDIs and BDDs are the primary drivers of the increase (steppes: 1.40 gC/m2/a, meadows: 1.08 gC/m2/a) and decrease (steppe: −0.62 gC/m2/a, meadow: −1.08 gC/m2/a) in the mean annual NPPA of meadows and steppes. The regions where climate variations and human activities have a combined impact on steppes and meadows contribute 26.80 GgC (27.34 GgC–0.54 GgC) and 50.17 GgC (63.26 GgC–13.09 GgC), accounting for 52.19% and 46.84% of the total NPPA. In the regions dominated by human activities, the NPPA decrease (HDD) in meadows exceeds that of steppes and the NPPA increase (HDI) in meadows surpasses that of steppes. Steppes and meadows contribute 19.86% and 33.99% to the overall NPPA increase, respectively. In the regions dominated by climate variations, the decreased NPPA of the CDD in meadows is lower than in steppes, and the increased NPPA of the CDI in meadows is higher than in steppes. They contributed 27.95% and 19.17% to the increase in the NPPA, respectively.
In terms of climate-driven changes in the NPP, particularly through the CDI and CDD, the areas where increased temperature (CDI1-1) and increased soil moisture (CDI2-1) contributed to an increase in the steppe NPP were comparable. However, the area where decreased soil moisture led to a decrease in the steppe NPP (CDD2-2) was larger than that where decreased temperature (CDD1-2) caused a reduction, indicating that soil moisture reduction is more detrimental to vegetation growth (Figure 6b and Table 2). When both temperature and soil moisture increased concurrently (CDI3-2) or decreased simultaneously (CDI3-1), they primarily led to an increase in the NPP. Yet, a considerable proportion of the meadow NPP decreased despite this increase (CDD3-1, Figure 6c and Table 2). In areas where grazing intensity increased, the NPP primarily increased (HDI4-1). Notably, the increase in the meadow NPP due to reduced grazing intensity and the decrease in the meadow NPP due to increased grazing intensity were also predominantly observed (Figure 6d and Table 2), suggesting that meadows are more sensitive to changes in grazing intensity than steppes. In regions influenced by both climate change and human activities, increased temperature (BDI1-1) and increased soil moisture (BDI2-1) emerged as the primary factors driving an increase in the NPP (Figure 6e and Table 2).

4. Discussion

4.1. Trends of NPP Are Increasing but Slowing Down

In recent decades, the NPPA of grasslands experienced an increasing rate of 0.53 gC/m2/a in the TRHR from 2001 to 2022. However, the area with a significant increasing trend accounted for only 30.17% of the grassland in the TRHR. Although we did not detect a significantly decreasing trend region, we found that the NPP decreased rapidly in 2022, and the LAI exhibited a similar trend. The possible reason for this could be the consecutive decrease in precipitation in 2021 and 2022, as well as the significant relationship between the LAI and precipitation (Figure A2). The regions with a significantly increased NPPA in the TRHR are consistent with previous research findings [35]. However, the increase in the NPPA varies by region due to varying geographical environments, policy implementation, livestock numbers, population density, and climatic conditions across different counties within the TRHR. The other factors include slope, aspect, altitude, soil moisture, ground evapotranspiration, and temperature [36,37]. Decreasing livestock numbers and population density can alleviate grazing pressures on grasslands and promote healthier growth [38]. There is a well-established link between grassland productivity and climate variations [39,40], and different climate patterns can lead to varying changes in grassland productivity across different counties.

4.2. Climate and Human Activities on NPP Variations

It is widely acknowledged that there is a strong correlation between grassland productivity and climate variations, with the latter being one of the primary factors affecting grassland vegetation shifts [1,39,40]. Due to the gradual warming and humidification of the Qinghai–Tibet Plateau [41,42], the increasing precipitation and temperature in the TRHR (Figure A1) have led to a significant increase in grassland productivity [43].
However, this warming and humidification is unevenly distributed, resulting in the heterogeneous spatiotemporal changes in grassland productivity (Figure A1). The increase in the NPPC in the steppes is mainly distributed in the western, central–northern, and northeastern parts of the TRHR, where both the temperature and precipitation have increased in these regions (Figure A1). Therefore, the primary driver for the increase in the NPPC is the combined increase in temperature and precipitation. The meadows where the NPPC increases are primarily the western, southwestern, and central–southern parts of the TRHR, where precipitation has increased significantly (Figure A1). In contrast, the regions where the NPPC decreases are mainly the southeastern and central parts of the TRHR, where precipitation has increased less or decreased, while the temperature has increased (Figure A1). Therefore, in the TRHR where temperatures have generally risen, the primary factor affecting the variation in the meadow NPPC is the amount of precipitation. A significant increase in precipitation can increase the NPPC, while a slight increase in precipitation is insufficient to offset the decrease in the NPPC caused by rising temperatures. Research has shown that alpine meadows are less vulnerable to climate change than alpine steppes, meaning they have a stronger resistance to climate change [44]. Furthermore, the length of the growing season in alpine steppes is significantly shorter than that in alpine meadows [45], giving meadows more growth time under climate change. Consequently, the growth rate of the NPPC in alpine meadows is faster than that in steppes (Figure 4d).
Since the beginning of the 21st century, the Chinese government has established various national protected areas and national parks [38]. These protected areas, including the Three-River-Source National Park, allowing for rapid grassland recovery [46,47]. Additionally, the cultivation of artificial grasslands has contributed significantly to the increase in grassland productivity [48,49]. The cultivation of artificial grasslands provide forage replenishment for livestock in the fall and winter when there is a shortage of natural forage, which will further alleviate competition between domestic and wildlife in the reserve and relieve grazing pressure. In the northeast region of the TRHR, the cultivation of artificial grasslands has been the primary factor behind the increase in the NPPH (Figure 5). The successful implementation of protected area and national park policies is critical in changing human activities [50]. However, policy implementation promoting vegetation productivity varies across different counties in the TRHR, influenced by local population density, geographical environment, cultural background, and government capabilities. Among the 22 counties of the TRHR, the northeast region includes Guide County, Guinan County, Jianzha County, Xinghai County, Tongde County, and Maduo County, which have made significant contributions to the decrease in the NPPH (Figure 1b and Figure 5) due to their proximity to the provincial capital, ease of population migration, and the effective implementation of grazing prohibition policies. On the other hand, in the southwest part of the TRHR, including Nangqian County, Zaduo County, Yushu County, and Zhiduo County, the contribution of human activities to the increase in the NPPH is relatively high, owing to their distance from the provincial capital and the less efficient implementation of policies.

4.3. Responses of Alpine Meadow and Steppe to Climate and Human Activity

The negative impact of human activities on meadows is mainly observed in the southern and northwest regions of the TRHR (Figure 5). Meanwhile, precipitation in these regions increased significantly, so the increase in the NPPA of these areas is primarily driven by climate (Figure 6). The continuous negative impacts of human activities on steppes in the northern, northeastern, and western regions of the TRHR are evident (Figure 5), despite the fact that precipitation and temperature have increased in these areas (Figure A1). Therefore, climate variation is the driving force behind the increase in the NPPA in steppes in these regions. The area of steppes (330.29 km2) with CDIs is smaller than that of meadows (491.62 km2), and the NPPA variation in meadows (0.53 gC/m2/a) is greater than that in steppes (0.49 gC/m2/a). Therefore, meadows account for 61.82% of the CDI, which is significantly higher than the 38.18% attributed to steppes. From the perspective of specific factors (Figure 1 and Figure 6b,c, and Table 2), the central–northern and northwestern regions of the TRHR experience relatively low temperatures, making temperature the primary factor driving the increase in the NPP of steppes and meadows in these areas (CDI1-1). Similarly, in regions with less precipitation, soil moisture is the main contributor to the increase in the NPP (CDI2-1). Increased moisture may have adverse effects on vegetation [51]. In the southeastern part of the TRHR, the significant increase in precipitation combined with a relatively minor increase in temperature may be the primary reason for the decrease in the NPP. Rising temperatures can lead to a decline in the reproductive rate of alpine grasslands [52]. In some areas, a decrease in temperature coupled with minimal reduction in precipitation can have beneficial effects on vegetation, thereby increasing the NPP (CDI3-2). Overall, temperature, soil moisture, and their combined effects are the main factors influencing the changes in the NPP due to climate change.
Climate variations have a negative effect on the NPPA of meadows in both the southeastern and western regions of the TRHR (Figure 4). Consequently, the increase in the NPPA in these areas is primarily caused by human activities, rather than climate (Figure 6). Furthermore, due to the minimal increase or even decrease in precipitation (Figure A1), the grasslands distributed in the northeastern and western regions of the TRHR have been negatively impacted by climate change, making human activities the primary driver behind the increase in the NPPA in these areas. In the HDI region, both the area of meadows (603.51 km2) and the change in the NPPA (0.70g C/m2/a) are greater than those of steppes (182.90 km2, 0.59 gC/m2/a). Consequently, meadows contribute more significantly (79.65%) to the increase in the NPPA within the HDI region than steppes (20.35%). In many regions, the process of the warming and humidification of the Qinghai–Tibet Plateau [42] and the construction of the Three-River-Source National Park [46] are occurring simultaneously. Based on the distribution changes in grazing intensity (Figure A3), the grazing intensity in the TRHR has been consistently increasing. From the perspective of specific factors (Figure 6d and Table 2), the area with the largest increase in grazing intensity is within the HDI zone, suggesting that grazing intensity is not the primary factor contributing to the HDI. The literature indicates [53] that the large-scale planting of artificial grasslands in the TRHR area is occurring. Although there is no large-scale data to support this, it may be the main reason for the HDI. Because the growth environment of meadows is relatively harsher compared to steppes, including higher altitudes and lower temperatures (Figure 1b,c), meadows grow slower and have a longer growing period [45]. Consequently, increases or decreases in grazing intensity have a greater impact on meadows (HDD4-1, HDI4-2). In the BDI region, the combined effect contributed more to the increase in the NPPA for steppes (1.40 gC/m2/a) than for meadows (1.08 gC/m2/a). In addition, the area of meadows (585.88 km2) is significantly larger than that of steppes (194.60 km2). Therefore, the BDI-induced meadows contribute 69.83% to the total NPPA, which is higher than the 30.17% of steppes.
In some parts of the western region of the TRHR, including steppes and meadows, precipitation has increased slightly or even decreased, while temperatures have risen significantly (Figure A1), resulting in restricted vegetation growth. Notably, this restriction has a greater impact on meadows (−0.31 gC/m2/a) than on steppes (−0.19 gC/m2/a), subsequently leading to a larger contribution (76.20%) from meadows to the decrease in the NPPA within the CDD region. The HDD region is mainly distributed in the central TRHR, where human activities have a more significant destructive impact on meadows (−0.39 gC/m2/a), contributing to a larger decrease in the NPPA (91.45%). Similarly, the BDD region primarily located in the central and southeastern TRHR and dominated by meadows sees a much larger meadow area (121.67 km2) compared to steppes (8.72 km2), contributing substantially (95.97%) to the decrease in the NPPA. In summary, meadows have a greater contribution to both the increase and decrease in the NPPA compared to steppes. For the overall change in the NPPA across the grasslands of the TRHR, meadows account for 67.60%, while steppes contribute 32.40% (Table 1).

5. Conclusions

In this study, the actual NPP (NPPA) of grasslands exhibits an increasing but slowing trend in the TRHR from 2001 to 2022. The increase in steppes NPPA (0.55 gC/m2/a) is greater than that in the NPPA of meadows (0.51 gC/m2/a). Since the area of meadows is much larger than that of steppes, the contribution of meadows (67.60%) to the increase in the NPPA is greater than that of steppes (32.40%). Climate, human activities, and both of the two dominated 22.01%, 29.42%, and 48.57% of the NPPA changes in the TRHR from 2001 to 2022. Temperature and soil moisture are the main reasons for the impact of climate change on the NPP, whereas changes in grazing intensity are not the primary factors among human activities. Due to the more suitable climate variations for meadows, good policies, and larger areas, climate variations and human activities contributed more to the increase in the NPPA in the meadows (20.54 GgC and 36.41 GgC) than that in the steppes (14.35 GgC and 10.20 GgC).

Author Contributions

K.Z.: conceptualization, methodology, visualization, and writing—original draft preparation; Z.W.: methodology, writing—review and editing; X.L.: data curation; X.Z.: investigation. All authors have read and agreed to the published version of the manuscript.

Funding

This research was funded by the Natural Science Foundation of Qinghai Province of China (Grant No. 2021-ZJ-973Q); the National Natural Science Foundation of China (Grant No. 32001188).

Data Availability Statement

All data were created in this study can be provided by the corresponding author upon reasonable request.

Conflicts of Interest

The authors declare no conflicts of interest.

Appendix A

Figure A1. Distribution of the linear regression of precipitation (a) and temperature (b) in the TRHR from 2001 to 2022.
Remotesensing 17 00471 g0a1
Figure A2. Inter-annual variation trends of the LAI and precipitation (a) and the linear relationship between the LAI and precipitation (b) in the TRHR from 2001 to 2022.
Remotesensing 17 00471 g0a2
Figure A3. Spatial pattern of the grazing intensity trend (a) in the TRHR from 2001 to 2022. (b) denotes the overall grazing intensity trends, and (c) represents grazing intensity trends in alpine meadows (blue line) and steppe (red line).
Remotesensing 17 00471 g0a3
Figure A4. Attribution of climate and human activities to the dynamics of the grassland NPP computed by a deep neural network (DNN) in the TRHR from 2001 to 2022.
Remotesensing 17 00471 g0a4
Table A1. The area (102 km2) of NPP-dominant factors calculated by the CASA model and deep neural networks (DNNs).
Dominated FactorCASADNNSimilarity
CDD262.42252.6896.29%
HDD166.23163.3898.29%
BDD130.39129.7799.52%
CDI821.91794.7296.69%
HDI786.41790.8999.43%
BDI780.48816.3895.60%
Figure A5. Spatial pattern of the NPPA (actual NPP) trend by Theil–Sen method (a) in the TRHR from 2001 to 2022. And a comparison of areas between linear regression and Theil–Sen with different slope ranges (b).
Remotesensing 17 00471 g0a5

References

  1. Wang, J.; Wang, K.; Zhang, M.; Zhang, C. Impacts of climate change and human activities on vegetation cover in hilly southern China. Ecol. Eng. 2015, 81, 451–461. [Google Scholar] [CrossRef]
  2. Rull, V.; González-Sampériz, P.; Pablo, J.; Mario, C.; Santiago, J.M. Vegetation changes in the southern Pyrenean flank during the last millennium in relation to climate and human activities: The Montcortès lacustrine record. J. Paleolimnol. 2010, 46, 387–404. [Google Scholar] [CrossRef]
  3. Wang, Z.; Zhang, Y.; Yang, Y.; Zhou, W.; Gang, C.; Zhang, Y.; Li, J.; An, R.; Wang, K.; Odeh, I.; et al. Quantitative assess the driving forces on the grassland degradation in the Qinghai–Tibet Plateau, in China. Ecol. Inform. 2016, 33, 32–44. [Google Scholar] [CrossRef]
  4. Zheng, K.; Wei, J.Z.; Pei, J.Y.; Cheng, H.; Zhang, X.L.; Huang, F.Q.; Li, F.M.; Ye, J.S. Impacts of climate change and human activities on grassland vegetation variation in the Chinese Loess Plateau. Sci. Total Environ. 2019, 660, 236–244. [Google Scholar] [CrossRef]
  5. Yuan, X.; Li, L.; Chen, X. Increased grass NDVI under contrasting trends of precipitation change over North China during 1982–2011. Remote Sens. Lett. 2015, 6, 69–77. [Google Scholar] [CrossRef]
  6. Suzuki, R.; Tanaka, S.; Yasunari, T. Relationships between meridional profiles of satellite-derived vegetation index (NDVI) and climate over Siberia. Int. J. Climatol. 2015, 20, 955–967. [Google Scholar] [CrossRef]
  7. Huang, S.; Zheng, X.; Ma, L.; Wang, H.; Huang, Q.; Leng, G.; Meng, E.; Guo, Y. Quantitative contribution of climate change and human activities to vegetation cover variations based on GA-SVM model. J. Hydrol. 2020, 584, 124687. [Google Scholar] [CrossRef]
  8. Li, S.; Yang, S.; Liu, X.; Liu, Y.; Shi, M. NDVI-Based Analysis on the Influence of Climate Change and Human Activities on Vegetation Restoration in the Shaanxi-Gansu-Ningxia Region, Central China. Remote Sens. 2015, 7, 11163–11182. [Google Scholar] [CrossRef]
  9. Wang, Z.; Song, K.; Hu, L. China’s Largest Scale Ecological Migration in the Three-River Headwater Region. AMBIO 2010, 39, 443–446. [Google Scholar] [CrossRef] [PubMed]
  10. Gao, Q.; Li, Y.; Wan, Y.; Jiangcun, W.; Qin, X.; Wang, B. Significant Achievements in Protection and Restoration of Alpine Grassland Ecosystem in Northern Tibet, China. Restor. Ecol. 2010, 17, 320–323. [Google Scholar] [CrossRef]
  11. Caviezel, C.; Hunziker, M.; Schaffner, M.; Kuhn, N. Soil–vegetation interaction on slopes with bush encroachment in the central Alps—Adapting slope stability measurements to shifting process domains. Earth Surf. Process. Landf. 2014, 39, 509–521. [Google Scholar] [CrossRef]
  12. Wang, Z.; Chang, J.; Peng, S.; Piao, S.; Ciais, P.; Betts, R. Changes in productivity and carbon storage of grasslands in China under future global warming scenarios of 1.5 °C and 2 °C. J. Plant Ecol. 2019, 12, 804–814. [Google Scholar] [CrossRef]
  13. Li, X.L.; Gao, J.; Brierley, G.; Qiao, Y.M.; Zhang, J.; Yang, Y.W. Rangeland degradation on the Qinghai-Tibet Plateau: Implications for rehabilitation. Land Degrad. Dev. 2013, 24, 72–80. [Google Scholar] [CrossRef]
  14. Fan, J.W.; Shao, Q.Q.; Liu, J.Y.; Wang, J.B.; Harris, W.; Chen, Z.Q.; Zhong, H.P.; Xu, X.L.; Liu, R.G. Assessment of effects of climate change and grazing activity on grassland yield in the Three Rivers Headwaters Region of Qinghai–Tibet Plateau, China. Environ. Monit. Assess. 2010, 170, 571–584. [Google Scholar] [CrossRef] [PubMed]
  15. Zhao, J.; Xiang, R.; Tian, L.; Zhang, T. Effect of grazing exclusion on ecosystem respiration among three different alpine grasslands on the central Tibetan Plateau. Ecol. Eng. 2016, 94, 599–607. [Google Scholar] [CrossRef]
  16. Meng, L.; Zhang, X.; Niu, B.; He, Y.; Wu, J. Changes in plant species richness distribution in Tibetan alpine grasslands under different precipitation scenarios. Glob. Ecol. Conserv. 2020, 21, e00848. [Google Scholar]
  17. Zou, S.; Lv, F. Two Special Vegetation Types on the Qinghai Tibet Plateau: Alpine Grassland and Alpine Meadow. Geogr. Teach. 2016, 2, 4–7. [Google Scholar]
  18. Schloss, A.L.; Kicklighter, D.W.; Kaduk, J.; Wittenberg, U. Comparing global models of terrestrial net primary productivity (NPP): Comparison of NPP to climate and the Normalized Difference Vegetation Index (NDVI). Glob. Change Biol. 1999, 5, 25–34. [Google Scholar] [CrossRef]
  19. Zhao, C.; Ma, Y.; Shang, W.; Chen, X.; Rong, J.; Tian, Y.; Yuan, Q. RESTREND-based assessment of factors affecting vegetation dynamics on the Mongolian Plateau. Ecol. Model. 2021, 440, 109415. [Google Scholar] [CrossRef]
  20. Potter, C.S.; Randerson, J.T.; Field, C.B.; Matson, P.A.; Vitousek, P.M.; Mooney, H.A.; Klooster, S.A. Terrestrial ecosystem production: A process model based on global satellite and surface data. Glob. Biogeochem. Cycles 1993, 7, 811–841. [Google Scholar] [CrossRef]
  21. Lieth, H. Primary production: Terrestrial ecosystems. Hum. Ecol. 1973, 1, 303–332. [Google Scholar] [CrossRef]
  22. Zhang, Y.; Zhang, C.; Wang, Z.; Chen, Y.; Gang, C.; An, R.; Li, J. Vegetation dynamics and its driving forces from climate change and human activities in the Three-River Source Region, China from 1982 to 2012. Sci. Total Environ. 2016, 563–564, 210–220. [Google Scholar] [CrossRef]
  23. Gang, C.; Zhou, W.; Chen, Y.; Wang, Z.; Sun, Z.; Li, J.; Qi, J.; Odeh, I. Quantitative assessment of the contributions of climate change and human activities on global grassland degradation. Environ. Earth Sci. 2014, 72, 4273–4282. [Google Scholar] [CrossRef]
  24. Li, J.; Peng, S.; Zhi, L. Detecting and attributing vegetation changes on China’s Loess Plateau. Agric. For. Meteorol. 2017, 247, 260–270. [Google Scholar] [CrossRef]
  25. Zhang, C.; Wang, X.; Li, J.; Hua, T. Roles of climate changes and human interventions in land degradation: A case study by net primary productivity analysis in China’s Shiyanghe Basin. Environ. Earth Sci. 2011, 64, 2183–2193. [Google Scholar] [CrossRef]
  26. Ruimy, A.; Kergoat, A.; Bondeau, A. Comparing global models of terrestrial net primary productivity (NPP): Analysis of differences in light absorption and light-use efficiency. Glob. Change Biol. 1999, 5 (Suppl. 1), 56–64. [Google Scholar] [CrossRef]
  27. Holben, B.N. Characteristics of maximum-value composite images from temporal AVHRR data. Int. J. Remote Sens. 1986, 7, 1417–1434. [Google Scholar] [CrossRef]
  28. Zhang, X. Vegetation of China and Its Geographic Pattern: Illustration of the Vegetation Map of the People’s Republic of China (1:1,000,000); Geological Publishing House: Beijing, China, 2007. [Google Scholar]
  29. Sun, Y.; Chang, J.; Fang, J. Above-and belowground net-primary productivity: A field-based global database of grasslands. Ecol. Ecol. Soc. Am. 2023, 104, e3904. [Google Scholar] [CrossRef]
  30. Xia, J.; Ma, M.; Liang, T.; Wu, C.; Yang, Y.; Zhang, L.; Zhang, Y.; Yuan, W. Estimates of grassland biomass and turnover time on the Tibetan Plateau. Environ. Res. Lett. 2018, 13, 014020. [Google Scholar] [CrossRef]
  31. Yang, Y.; Fang, J.; Ma, W.; Guo, D.; Mohammat, A. Large-scale pattern of biomass partitioning across China’s grasslands. Glob. Ecol. Biogeogr. 2010, 19, 268–277. [Google Scholar] [CrossRef]
  32. He, L.; Li, Z.-L.; Wang, X.; Xie, Y.; Ye, J.-S. Lagged precipitation effect on plant productivity is influenced collectively by climate and edaphic factors in drylands. Sci. Total Environ. 2021, 755, 142506. [Google Scholar] [CrossRef]
  33. Zhu, W.; Pan, Y.; Zhang, J. Estimation of net primary productivity of chinese terrestrial vegetation based on remote sensing. J. Plant Ecol. 2007, 31, 412–424. [Google Scholar]
  34. Zhu, W.; Pan, Y.; Hao, H.E. Simulation of maximum light use efficiency for some typical vegetation types in China. Chin. Sci. Bull. 2006, 51, 457–463. [Google Scholar] [CrossRef]
  35. Han, Z.; Song, W.; Deng, X.; Xu, X. Grassland ecosystem responses to climate change and human activities within the Three-River Headwaters region of China. Sci. Rep. 2018, 8, 9079. [Google Scholar] [CrossRef] [PubMed]
  36. Maeda, E.E. Downscaling MODIS LST in the East African mountains using elevation gradient and land-cover information. Int. J. Remote Sens. 2014, 35, 3094–3108. [Google Scholar] [CrossRef]
  37. Quinonez-Pinon, R.; Mendoza-Duran, A.; Valeo, C. Design of an environmental monitoring program using NDVI and cumulative effects assessment. Int. J. Remote Sens. 2007, 28, 1643–1664. [Google Scholar] [CrossRef]
  38. Huang, K.; Zhang, Y.; Zhu, J.; Liu, Y.; Zu, J.; Zhang, J. The Influences of Climate Change and Human Activities on Vegetation Dynamics in the Qinghai-Tibet Plateau. Remote Sens. 2016, 8, 876. [Google Scholar] [CrossRef]
  39. Zhang, J.; Dong, W.; Fu, C.; Wu, L. The influence of vegetation cover on summer precipitation in China: A statistical analysis of NDVI and climate data. Adv. Atmos. Sci. 2003, 20, 1002–1006. [Google Scholar]
  40. Ge, W.; Lin, H. The Vegetation NDVI Variation Trend in Qinghai-Tibet Plateau and Its Response to Climate Change. In Proceedings of the Remote Sensing, Environment and Transportation Engineering (RSETE), 2012 2nd International Conference on IEEE, Nanjing, China, 1–3 June 2012. [Google Scholar]
  41. Zhang, Z.; Han, W.; Wang, J.; Cai, Y.; Gang, L.I.; Cai, Z.; Zhang, C.; Sheng, H.; Zhao, C. Characteristics of Climate Change and its Response in the Qinghai-Tibet Plateau during 1971–2010. J. Landsc. Res. 2016, 8, 41–45,52. [Google Scholar]
  42. Cao, J.; Wu, E.; Wu, S.; Fan, R.; Xu, L.; Ning, K.; Li, Y.; Lu, R.; Xu, X.; Zhang, J.; et al. Spatiotemporal Dynamics of Ecological Condition in Qinghai-Tibet Plateau Based on Remotely Sensed Ecological Index. Remote Sens. 2022, 14, 4234. [Google Scholar] [CrossRef]
  43. Zheng, Y.; Han, J.; Huang, Y.; Fassnacht, S.R.; Shuai, X.; Lv, E.; Min, C. Vegetation response to climate conditions based on NDVI simulations using stepwise cluster analysis for the Three-River Headwaters region of China. Ecol. Indic. 2017, 92, 18–29. [Google Scholar] [CrossRef]
  44. Li, M.; Zhang, X.; He, Y.; Niu, B.; Wu, J. Assessment of the vulnerability of alpine grasslands on the Qinghai-Tibetan Plateau. PeerJ 2020, 8, e8513. [Google Scholar] [CrossRef] [PubMed]
  45. Duan, H.; Xue, X.; Wang, T.; Kang, W.; Liao, J.; Liu, S. Spatial and temporal differences in alpine meadow, alpine steppe and all vegetation of the Qinghai-Tibetan Plateau and their responses to climate change. Remote Sens. 2021, 13, 669. [Google Scholar] [CrossRef]
  46. State Council of the People’s Republic of China. Ecological Protection and Construction of Qinghai Three RiversNature Reserve Master Plan; State Council of the People’s Republic of China: Beijing, China, 2005; p. 54. (In Chinese) [Google Scholar]
  47. Zeng, C.; Zhang, F.; Wang, Q.; Chen, Y.; Joswiak, D. Impact of alpine meadow degradation on soil hydraulic properties over the Qinghai-Tibetan Plateau. J. Hydrol. 2013, 478, 148–156. [Google Scholar] [CrossRef]
  48. Wu, H.; Lü, L.; Zhang, Y.; Xu, C.; Yu, Q. Sediment addition and legume cultivation result in sustainable, long-term increases in ecosystem functions of sandy grasslands. Land Degrad. Dev. 2019, 30, 1667–1676. [Google Scholar] [CrossRef]
  49. Wen, L.; Jinlan, W.; Xiaojiao, Z.; Shangli, S.; Wenxia, C. Effect of degradation and rebuilding of artificial grasslands on soil respiration and carbon and nitrogen pools on an alpine meadow of the Qinghai-Tibetan Plateau. Ecol. Eng. 2018, 111, 134–142. [Google Scholar] [CrossRef]
  50. Mackenzie, C.A.; Salerno, J.; Hartter, J.; Chapman, C.A.; Drake, M. Changing perceptions of protected area benefits and problems around Kibale National Park, Uganda. J. Environ. Manag. 2017, 200, 217–228. [Google Scholar] [CrossRef]
  51. Kim, Y.; Wang, G. Soil moisture-vegetation-precipitation feedback over North America: Its sensitivity to soil moisture climatology. J. Geophys. Res. Atmos. 2012, 117, 1–18. [Google Scholar] [CrossRef]
  52. Zhang, T.; Chen, Y.; Yang, X.; Zhang, H.; Guo, Z.; Hu, G. Indirect effects of warming via phenology on reproductive success of alpine plants. J. Ecol. 2024, 113, 180–193. [Google Scholar] [CrossRef]
  53. Zhang, X. Plant Community and Soil Change Characteristics of Artificial Grassland in Black Soil Beach Based on Different Restoration Measures; Qinghai University: Xining, China, 2021. [Google Scholar]
Figure 1. Location of the Three-River Headwaters Region and its spatial patterns of nature factors. (a) Red triangles are field sites for aboveground biomass collection. Blue and green regions are steppes and meadows. (b) represents the counties and elevation. Precipitation (c) and temperature (d) are the mean values from 2001 to 2022.
Remotesensing 17 00471 g001
Figure 2. Schematic diagram of the scenarios for attribution driving forces on the NPP dynamics. The unit value of SA (as indicated on the y-axis) equals the sum of the values of all subsequent influencing factors. This figure illustrates the 8 scenarios (ah) set in this study.
Remotesensing 17 00471 g002
Figure 3. Spatial pattern of the NPPA (actual NPP) trend (a) and its significance (b) in the TRHR from 2001 to 2022. (c) shows the validation between the simulated NPPA and observed NPPA. (d) denotes the overall NPPA trends, and (e) represents the NPPA trends in alpine meadows (blue line) and steppe (red line). Insignificant increasing (II), insignificant decreasing (ID), significantly increasing (SI).
Remotesensing 17 00471 g003
Figure 4. Spatial pattern of the NPPC (NPP affected by climate change) trend (a) and its significance (b) in the TRHR from 2001 to 2022. (c) denotes the overall NPPC trends, and (d) represents NPPC trends in alpine meadows (blue line) and steppe (red line). Insignificant increasing (II), insignificant decreasing (ID), significantly increasing (SI).
Remotesensing 17 00471 g004
Figure 5. Spatial pattern of the NPPH (NPP affected by human activities) trend (a) and its significance (b) in the TRHR from 2001 to 2022. (c) denotes the overall NPPC trends, and (d) represents the NPPH trends in alpine meadows (blue line) and steppe (red line). Insignificant increasing (II), insignificant decreasing (ID), significantly increasing (SI).
Remotesensing 17 00471 g005
Figure 6. Attribution of climate and human activities to the dynamics of the grassland NPP in the TRHR from 2001 to 2022 (a). Subdivision of the effects of temperature, soil moisture, and grazing intensity on the NPP changes (bd). Main factors involved in their combined effects (e). Based on the abbreviations for the preceding dominant factors, please add numbers to represent different factors: 1 for temperature, 2 for soil moisture, 3 for the combined effect of temperature and soil moisture, and 4 for grazing intensity. The number 1 after the “-” indicates an increase, while 2 indicates a decrease.
Remotesensing 17 00471 g006
Table 1. The contribution of the relative role of climate and human activities on the changes in the mean annual NPPA and total NPPA (1 Gg = 109 g).
Dominated FactorArea (102 km2)NPP Change (gC/m2/a)Total NPP (GgC)
TotalSteppes Meadows TotalSteppes Meadows TotalSteppes Meadows
CDD 1262.4289.72172.70−0.27−0.19−0.31−7.10−1.68−5.41
HDD 2166.2323.99142.24−0.37−0.22−0.39−6.08−0.52−5.56
BDD 3130.398.72121.67−1.05−0.62−1.08−13.64−0.54−13.09
CDI 4821.91330.29491.620.510.490.5341.9816.0325.95
HDI 5786.41182.90603.510.670.590.7052.6910.7241.97
BDI 6780.48194.60585.881.161.401.0890.5927.3463.26
1 CDDs: climate-dominated NPPA decreases. 2 HDDs: human-dominated NPPA decreases. 3 BDD: the decreasing NPPA dominated by both factors. 4 CDIs: climate-dominated NPPA increases. 5 HDIs: human-dominated NPPA increases. 6 BDI: the increasing NPPA dominated by both factors.
Table 2. The area of the relative role of temperature, soil moisture, and grazing intensity on the changes in the NPPA.
Dominated FactorArea (102 km2)Dominated FactorArea (102 km2)
TotalSteppesMeadowsTotalSteppesMeadows
CDI1-119.679.1310.54HDI4-159.9116.6343.29
CDD1-22.601.241.36HDD4-112.881.9910.89
CDI2-117.505.5011.99HDI4-220.201.6418.56
CDD2-27.902.625.27HDD4-23.580.223.36
CDI3-215.598.846.74BDI1-147.7116.7031.01
CDD3-24.342.701.64BDD1-210.540.849.69
CDI3-128.619.2219.39BDI2-130.403.6626.74
CDD3-111.032.288.75BDD2-22.340.032.30
Based on the abbreviations for the preceding dominant factors, please add numbers to represent different factors: 1 for temperature, 2 for soil moisture, 3 for the combined effect of temperature and soil moisture, and 4 for grazing intensity. The number 1 after the “-” indicates an increase, while 2 indicates a decrease.
Disclaimer/Publisher’s Note: The statements, opinions and data contained in all publications are solely those of the individual author(s) and contributor(s) and not of MDPI and/or the editor(s). MDPI and/or the editor(s) disclaim responsibility for any injury to people or property resulting from any ideas, methods, instructions or products referred to in the content.

