
Adaptive Variational Mode Decomposition and Principal Component Analysis-Based Denoising Scheme for Borehole Radar Data

 ,
,  , and
, and
Abstract
:
1. Introduction
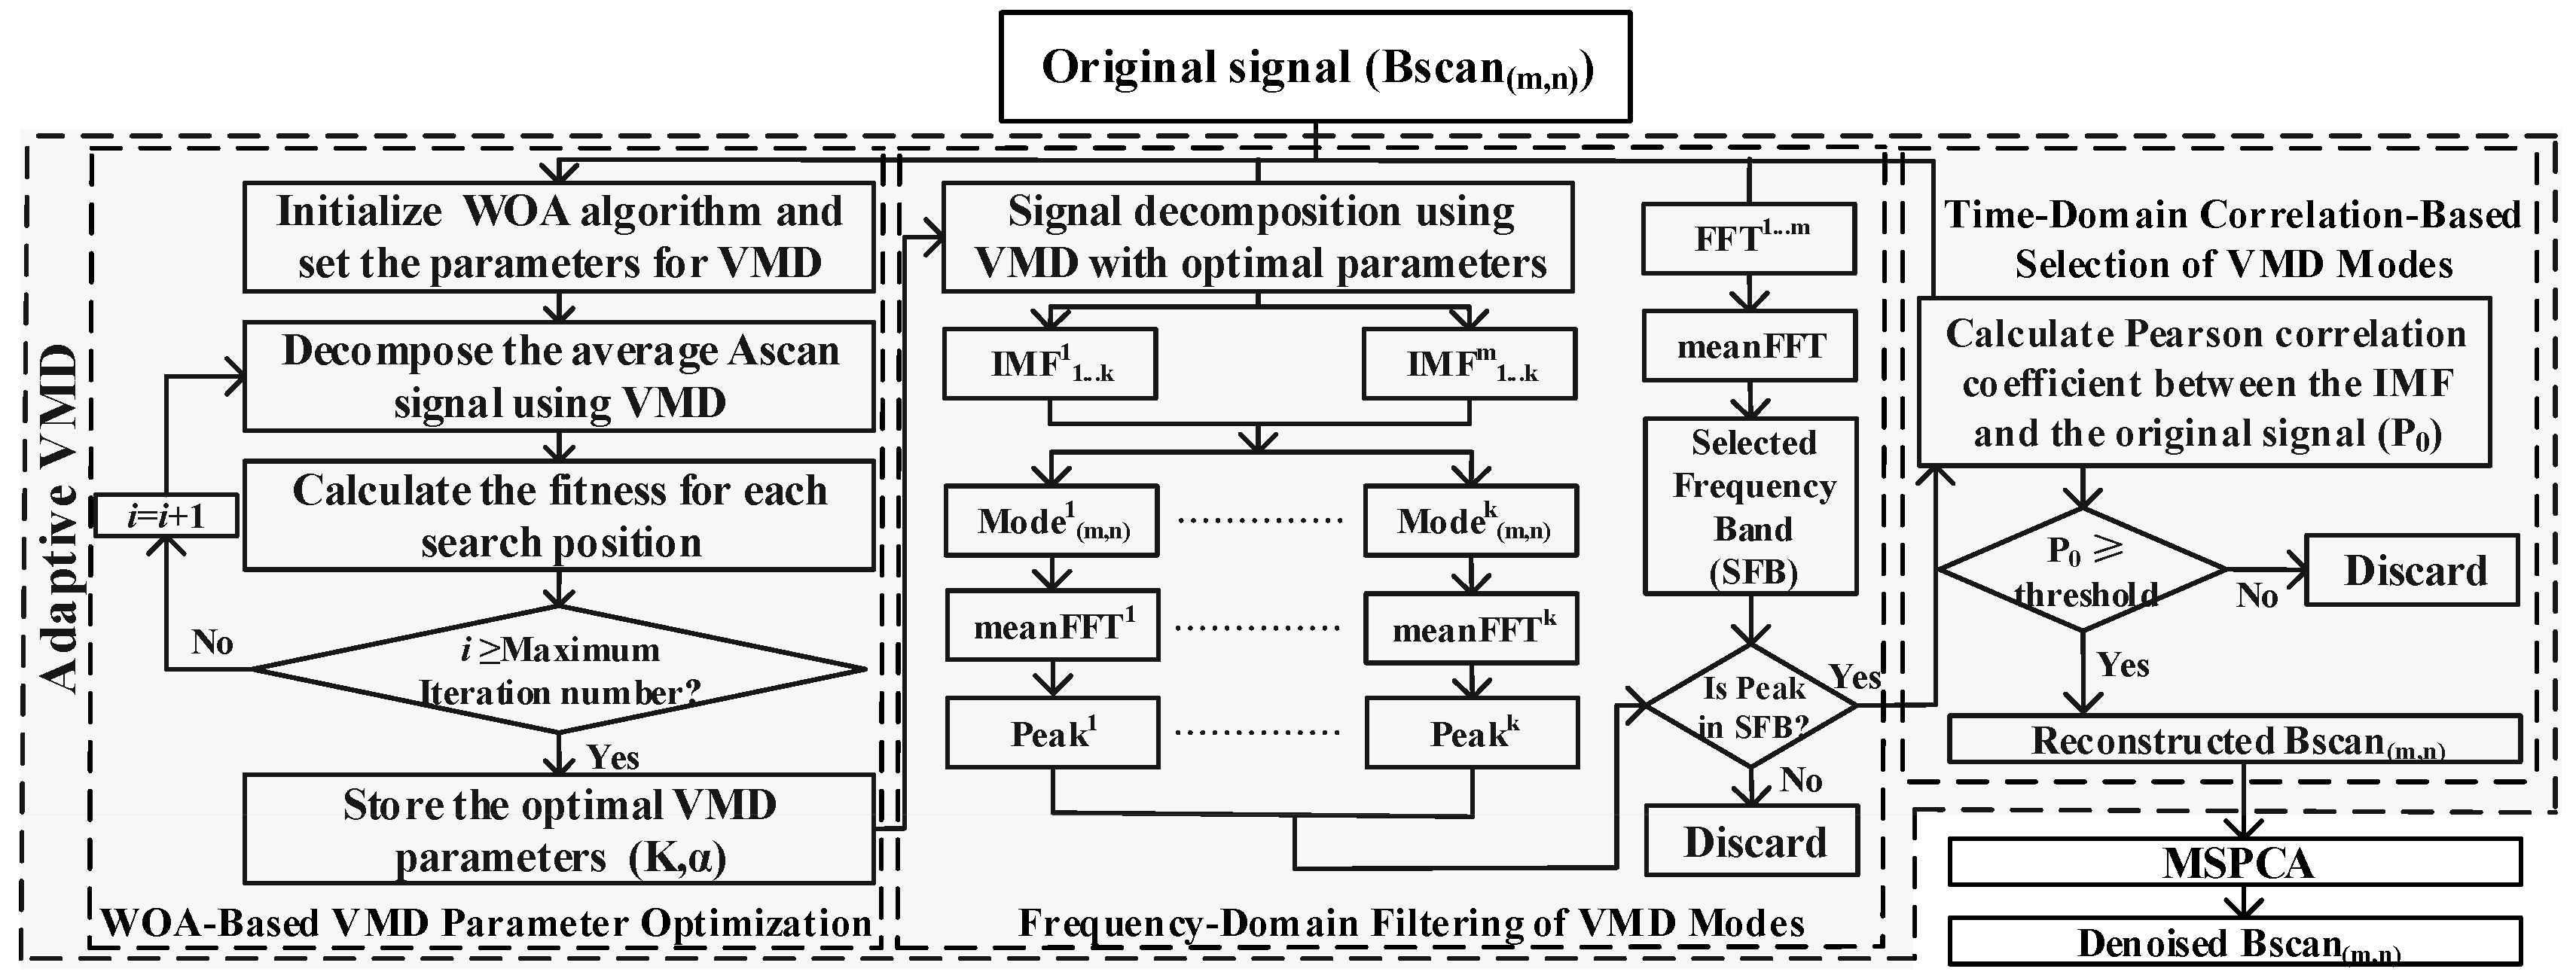
2. Proposed Scheme
2.1. Adaptive VMD Algorithm
2.2. Multiscale Principal Component Analysis (MSPCA)
3. Examples
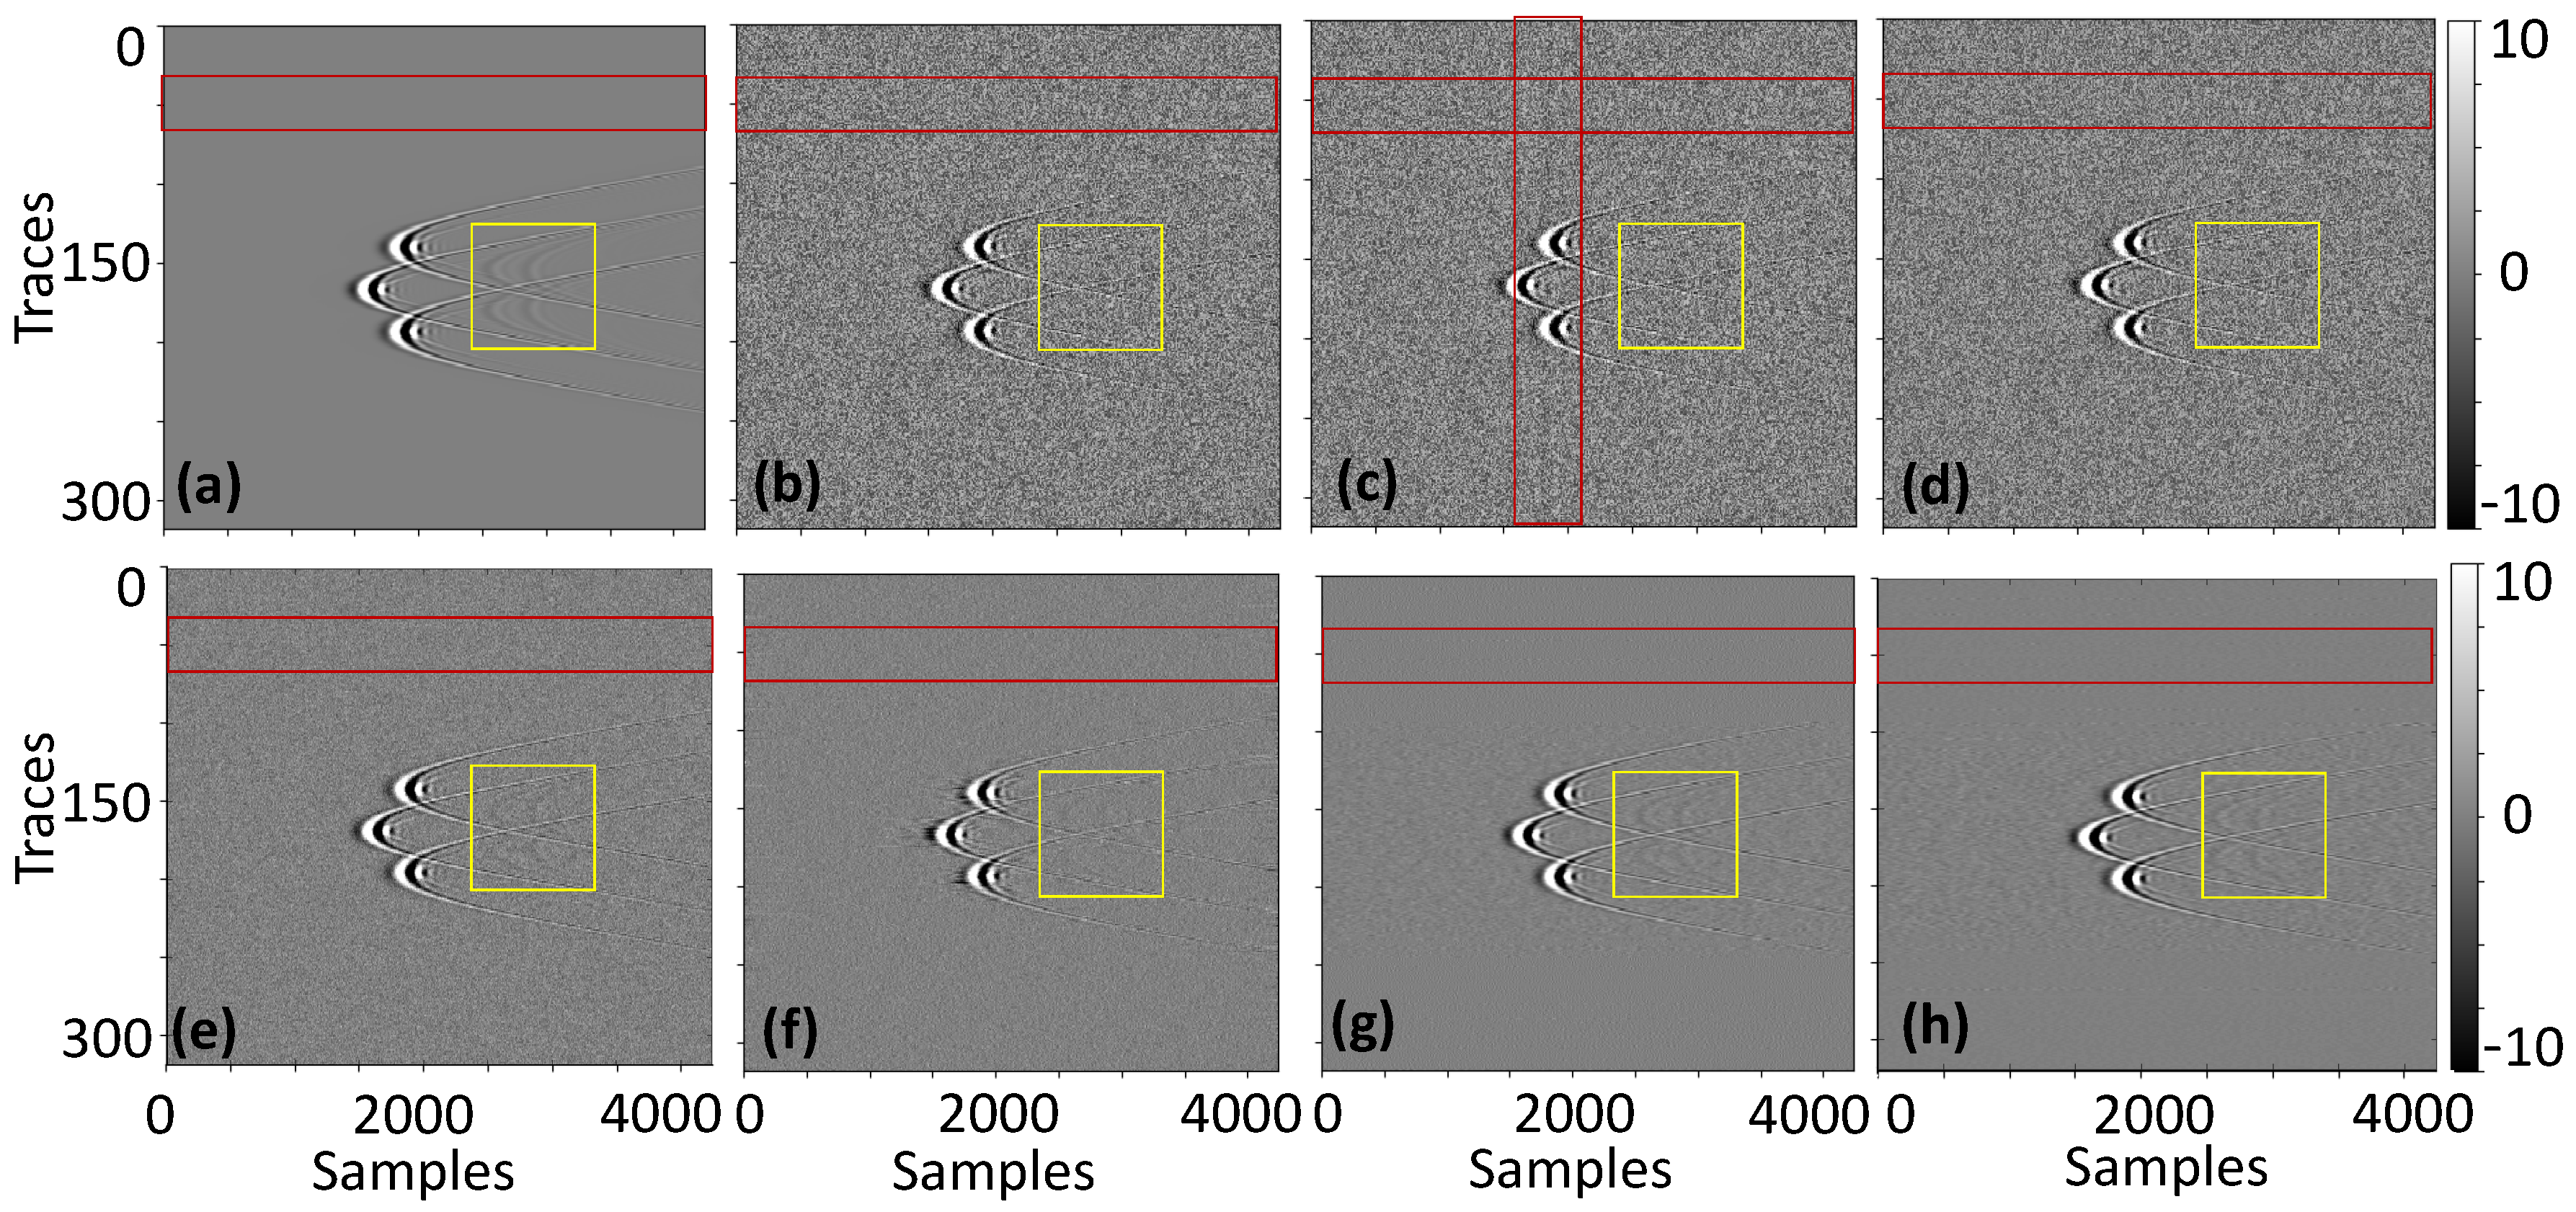
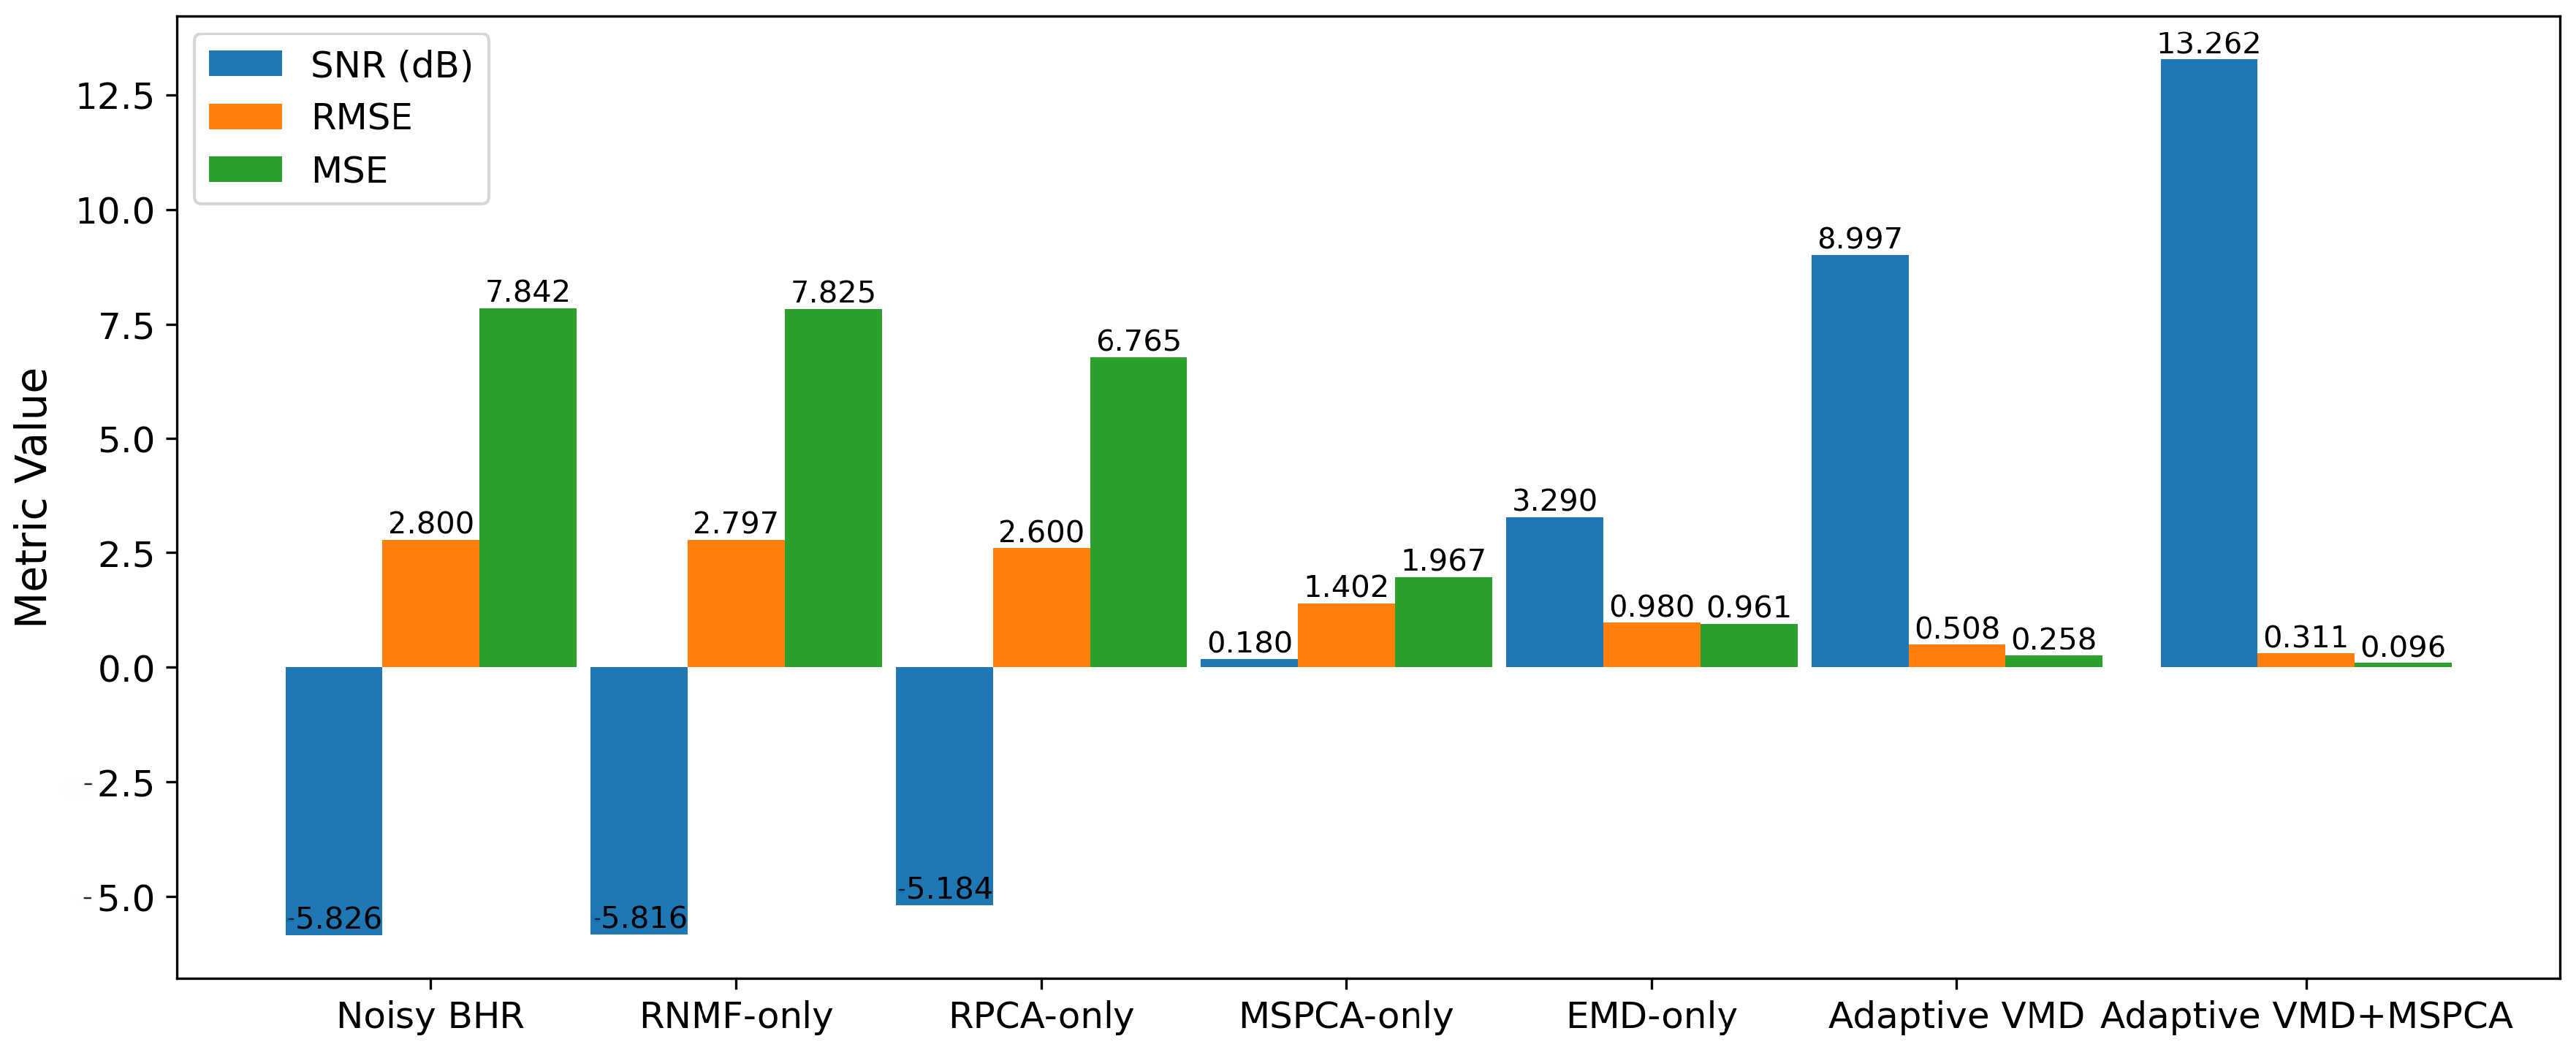
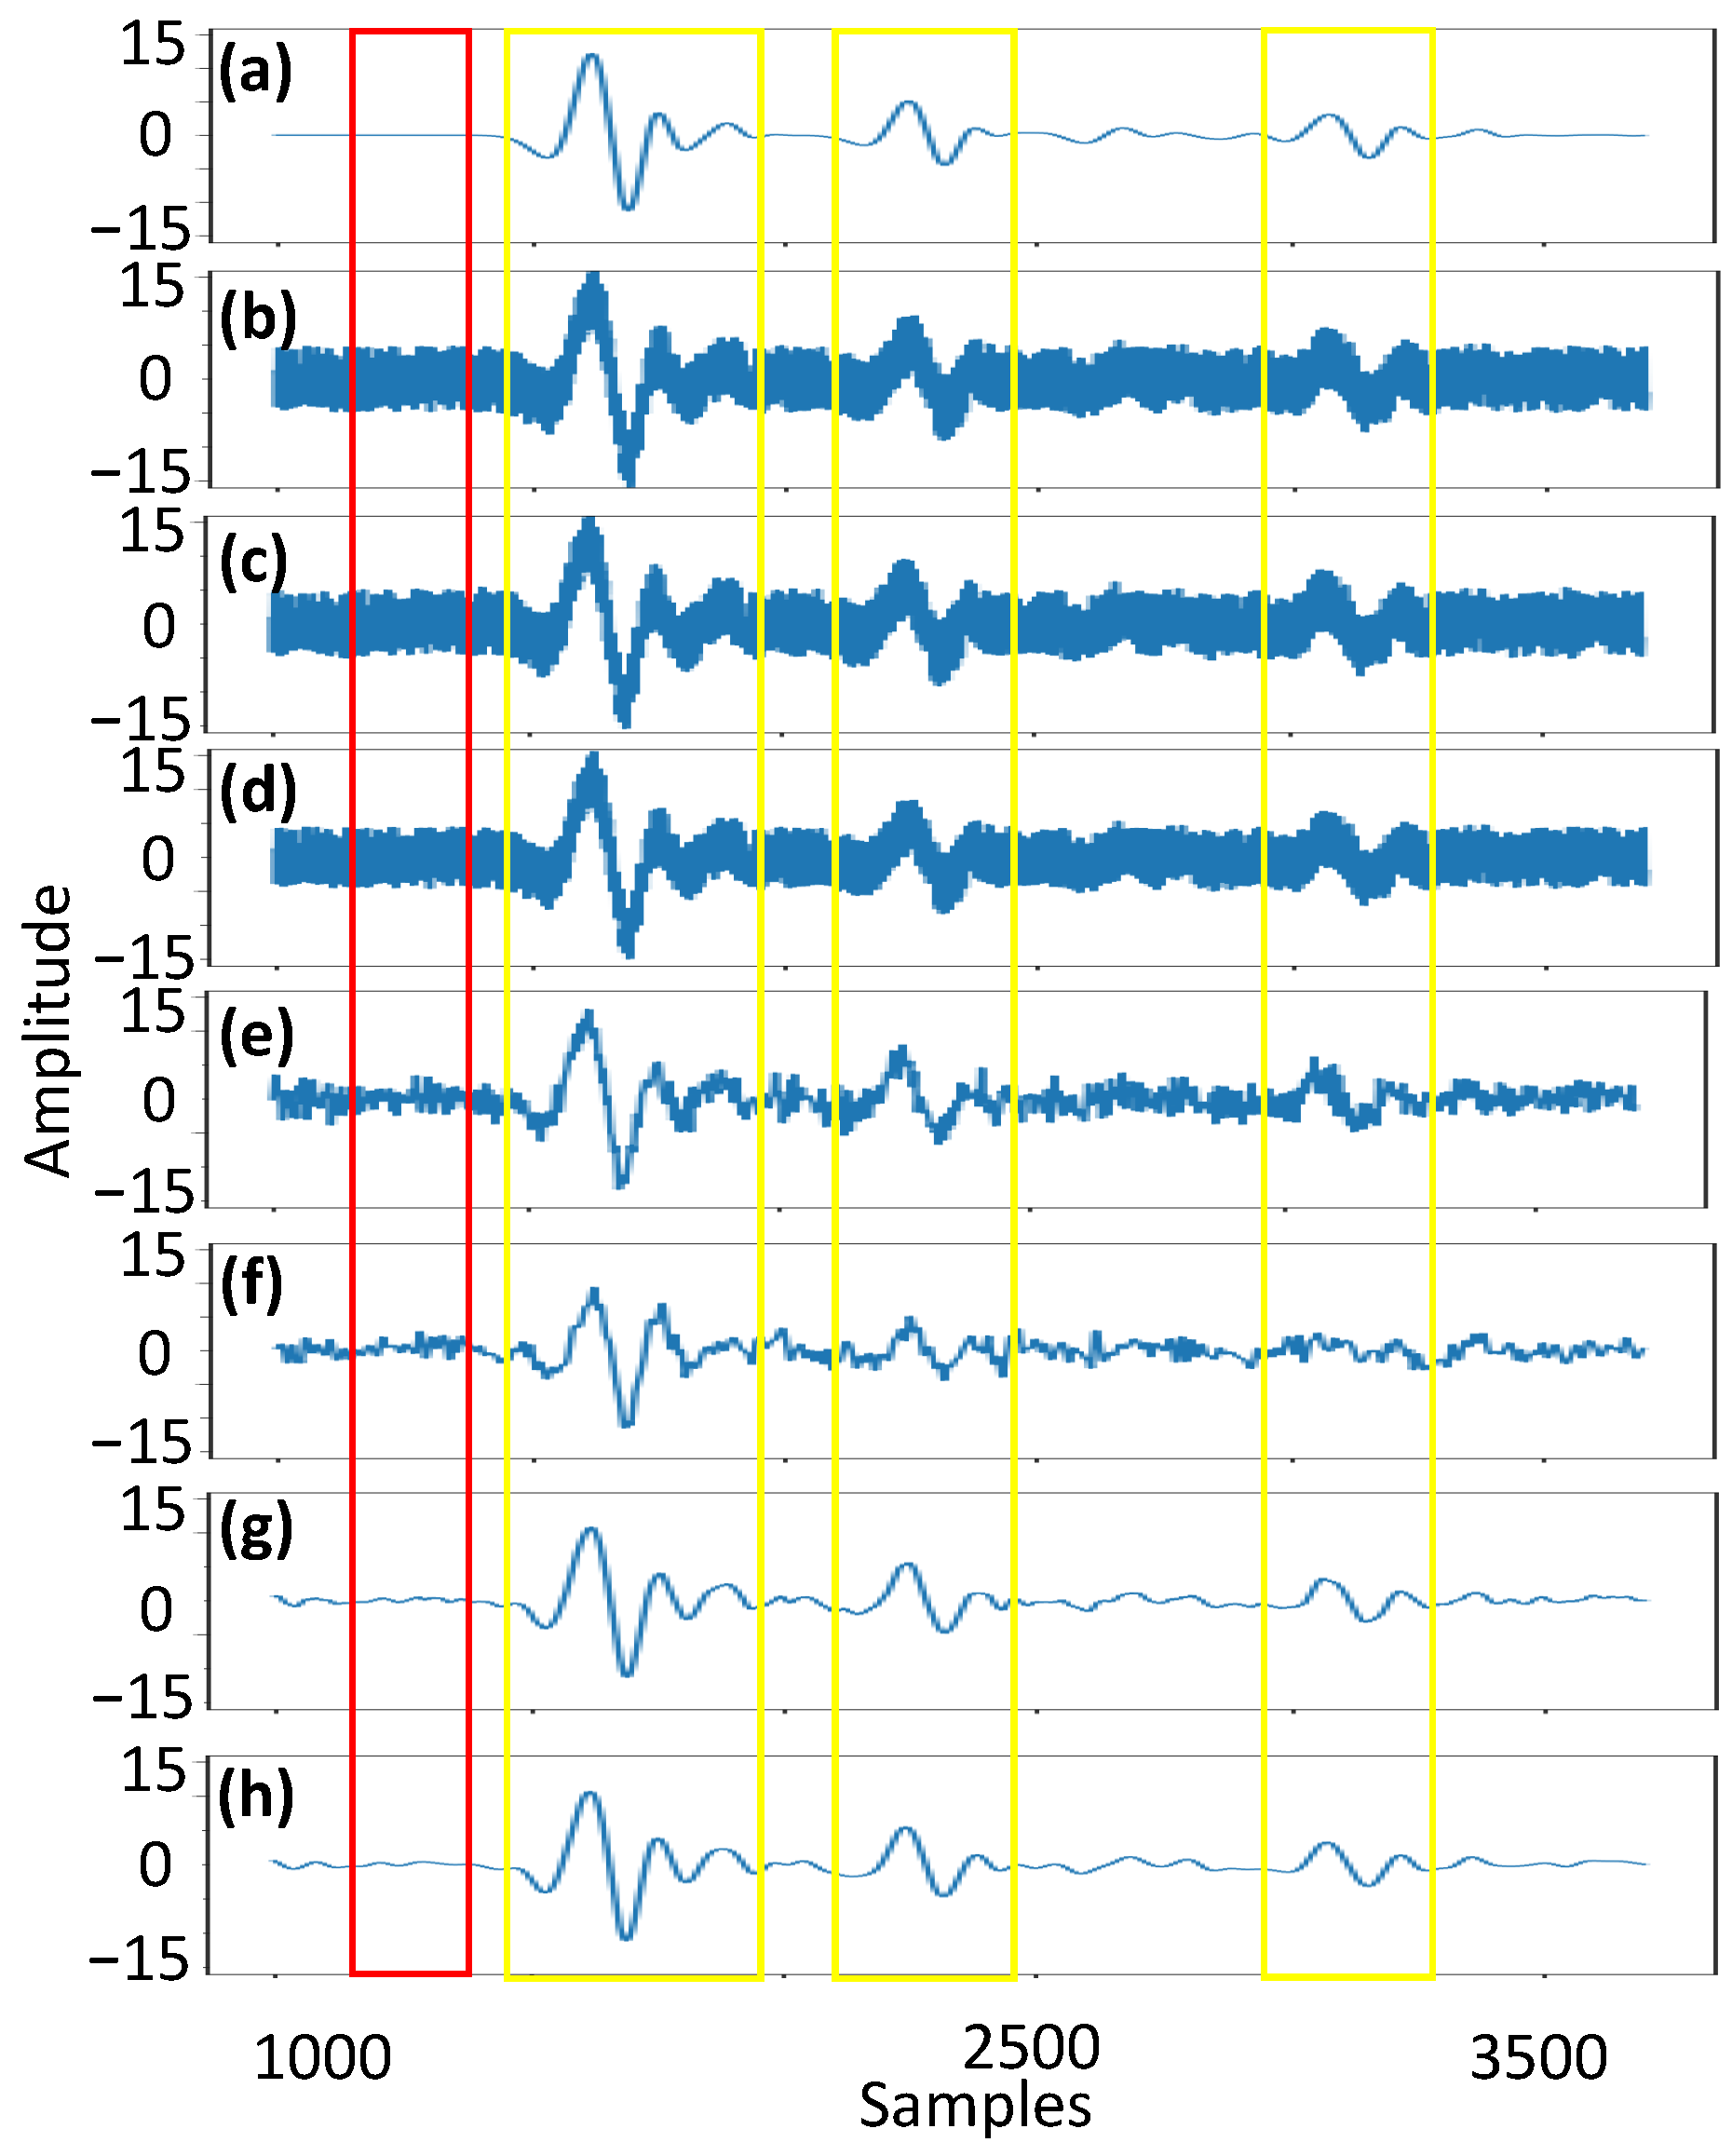
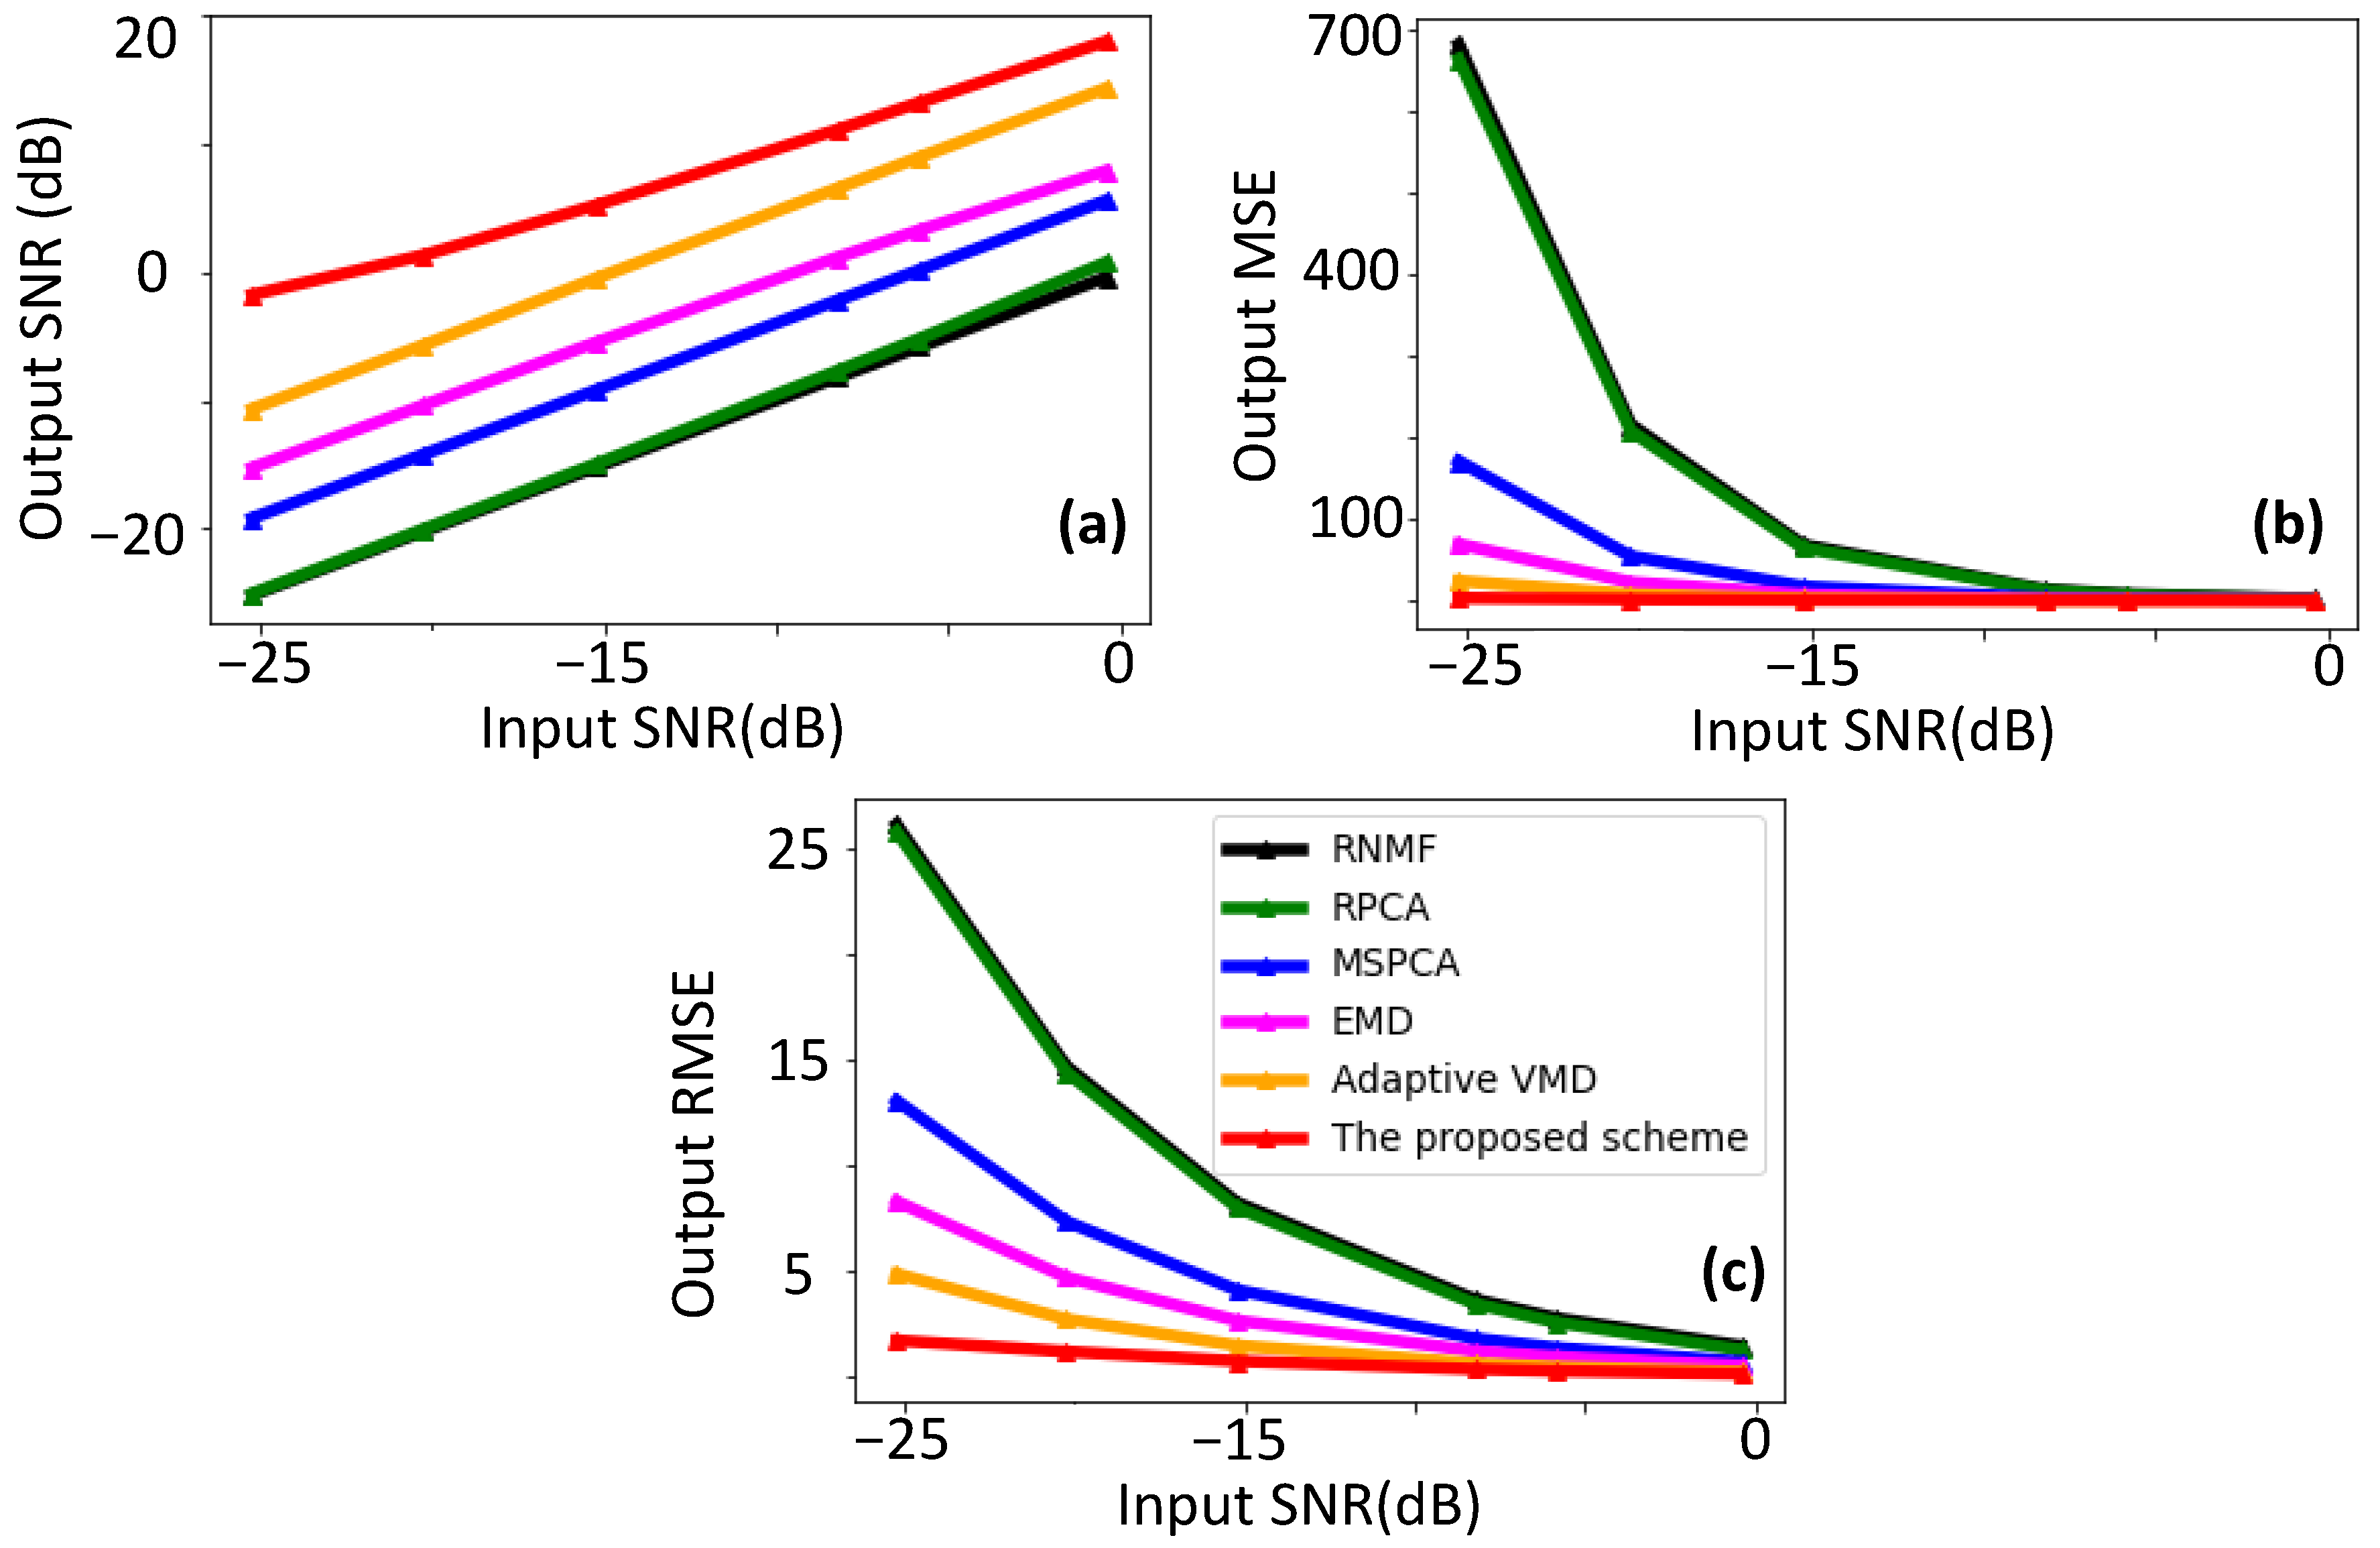
3.1. Numerical Simulation Results
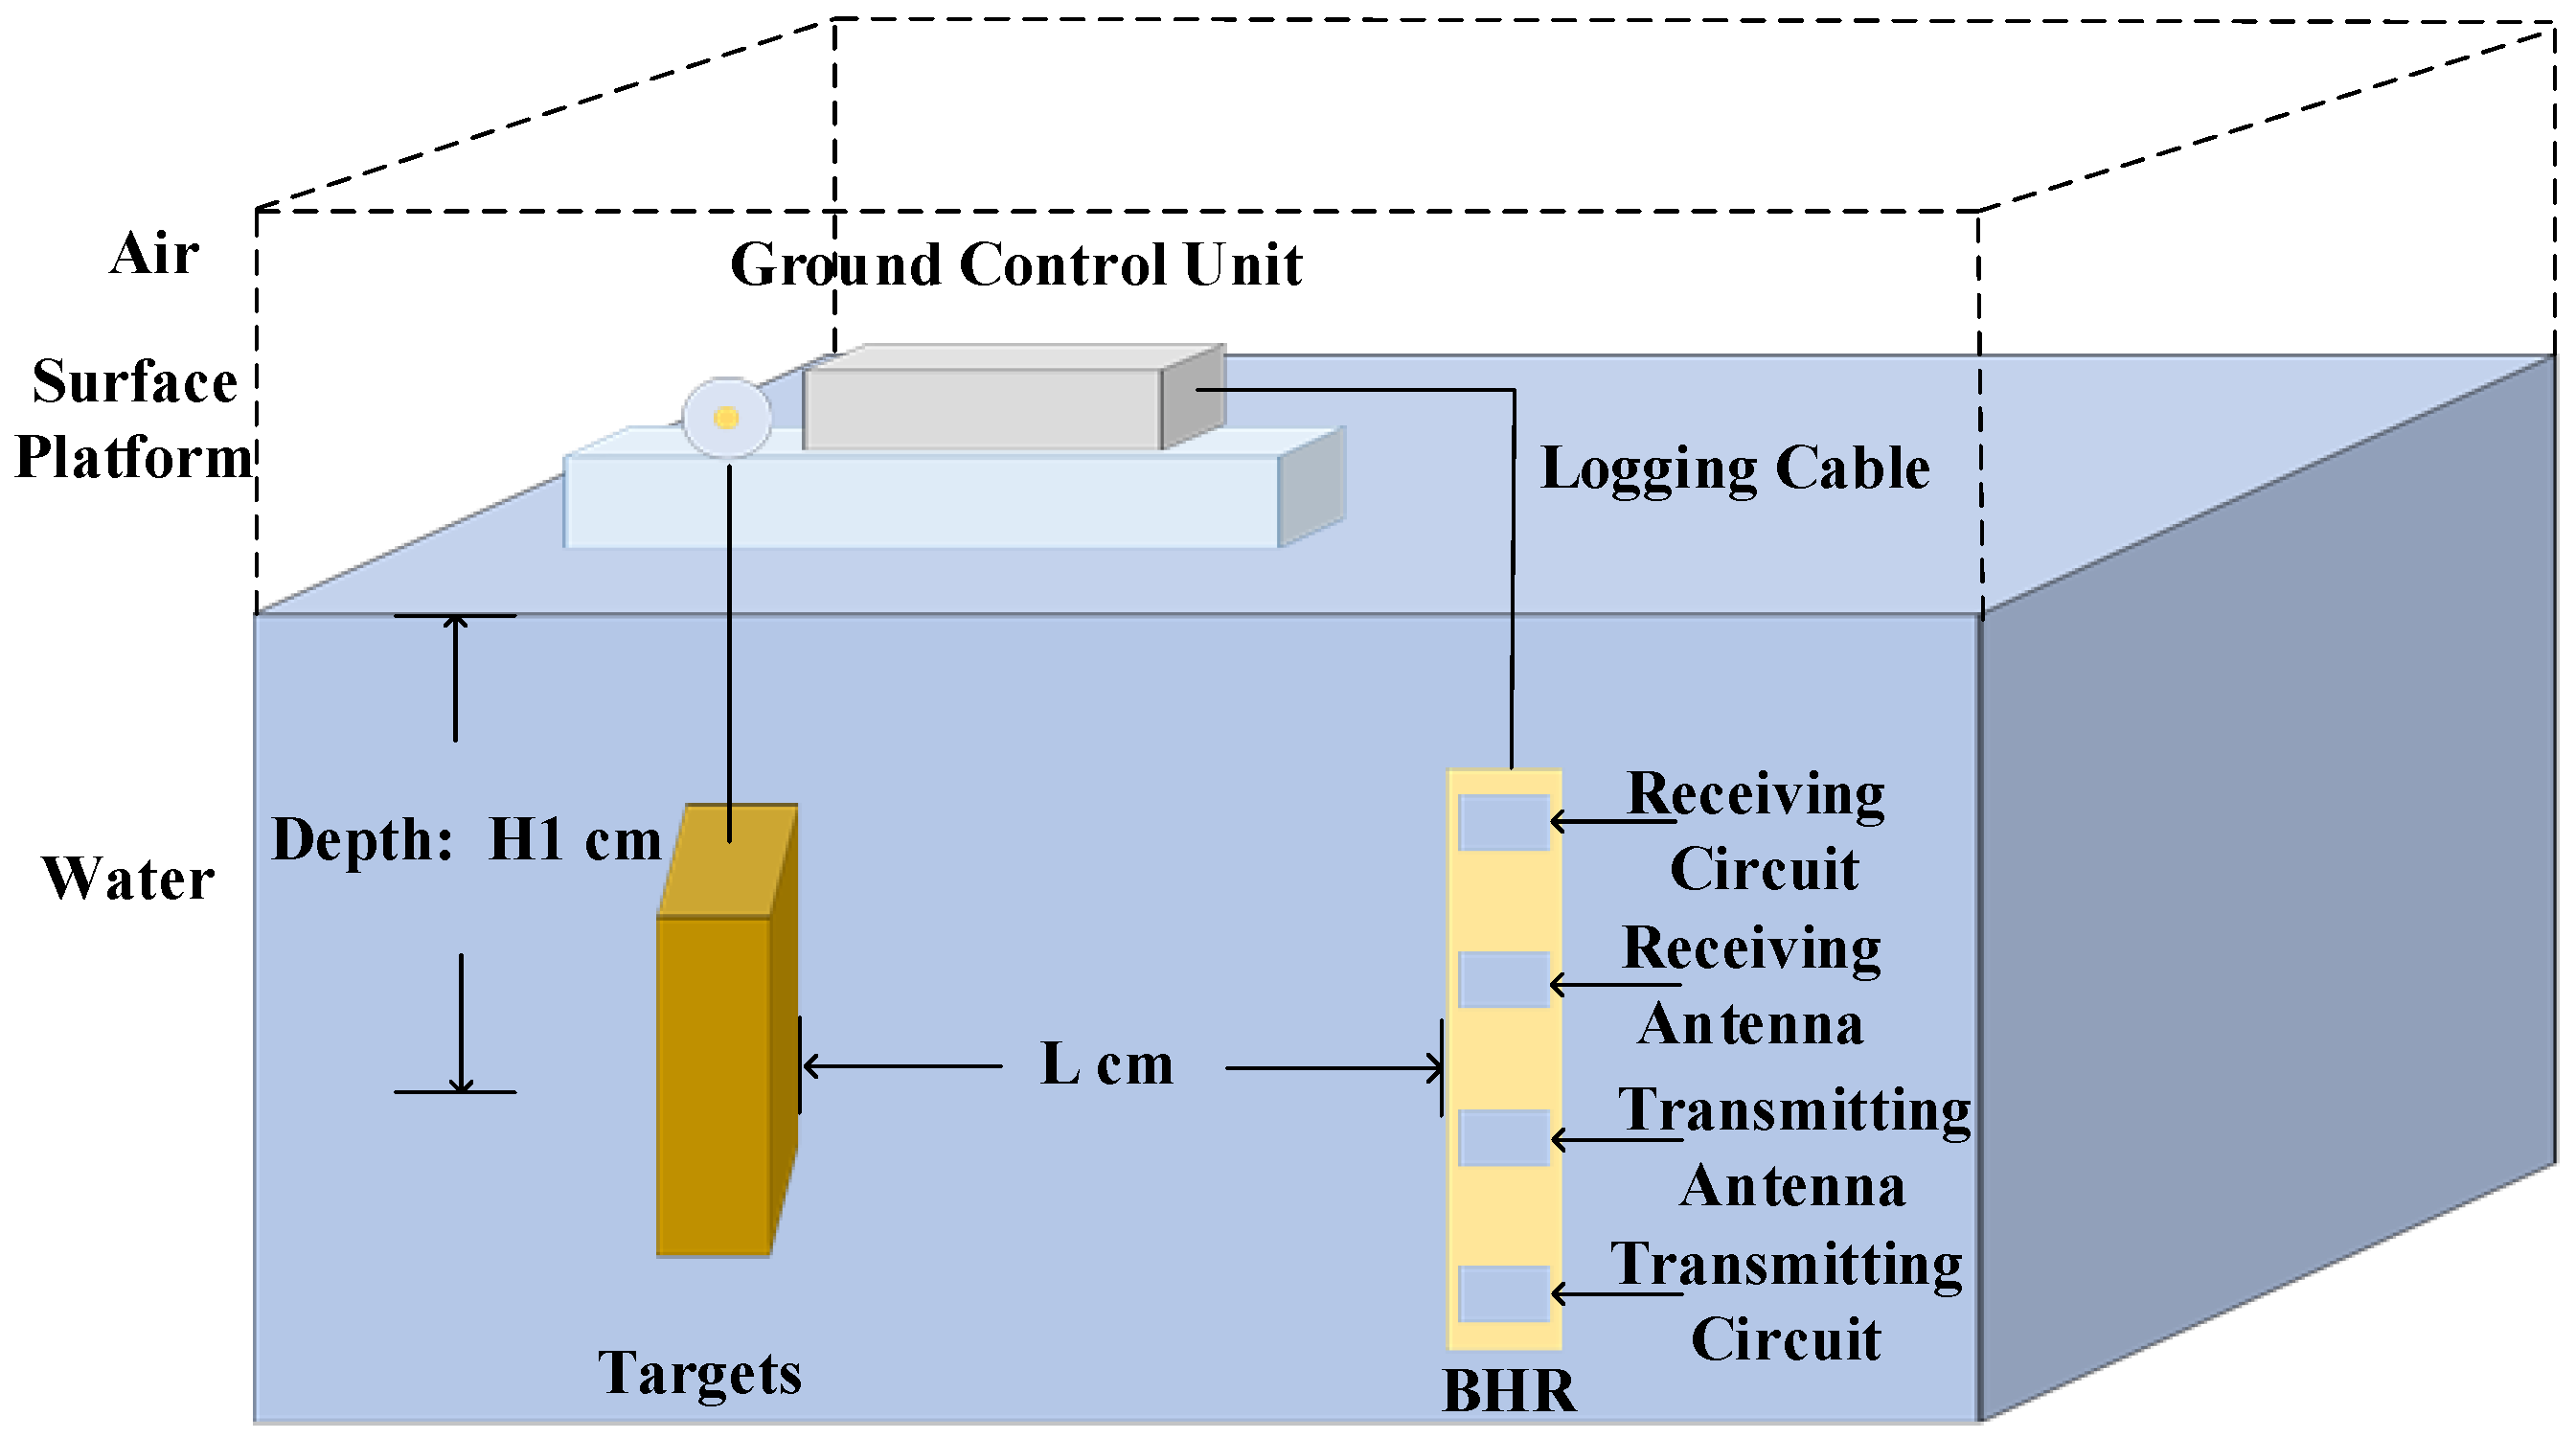
3.1.1. Case 1: Underwater Scenario with Multiple Rectangular Targets
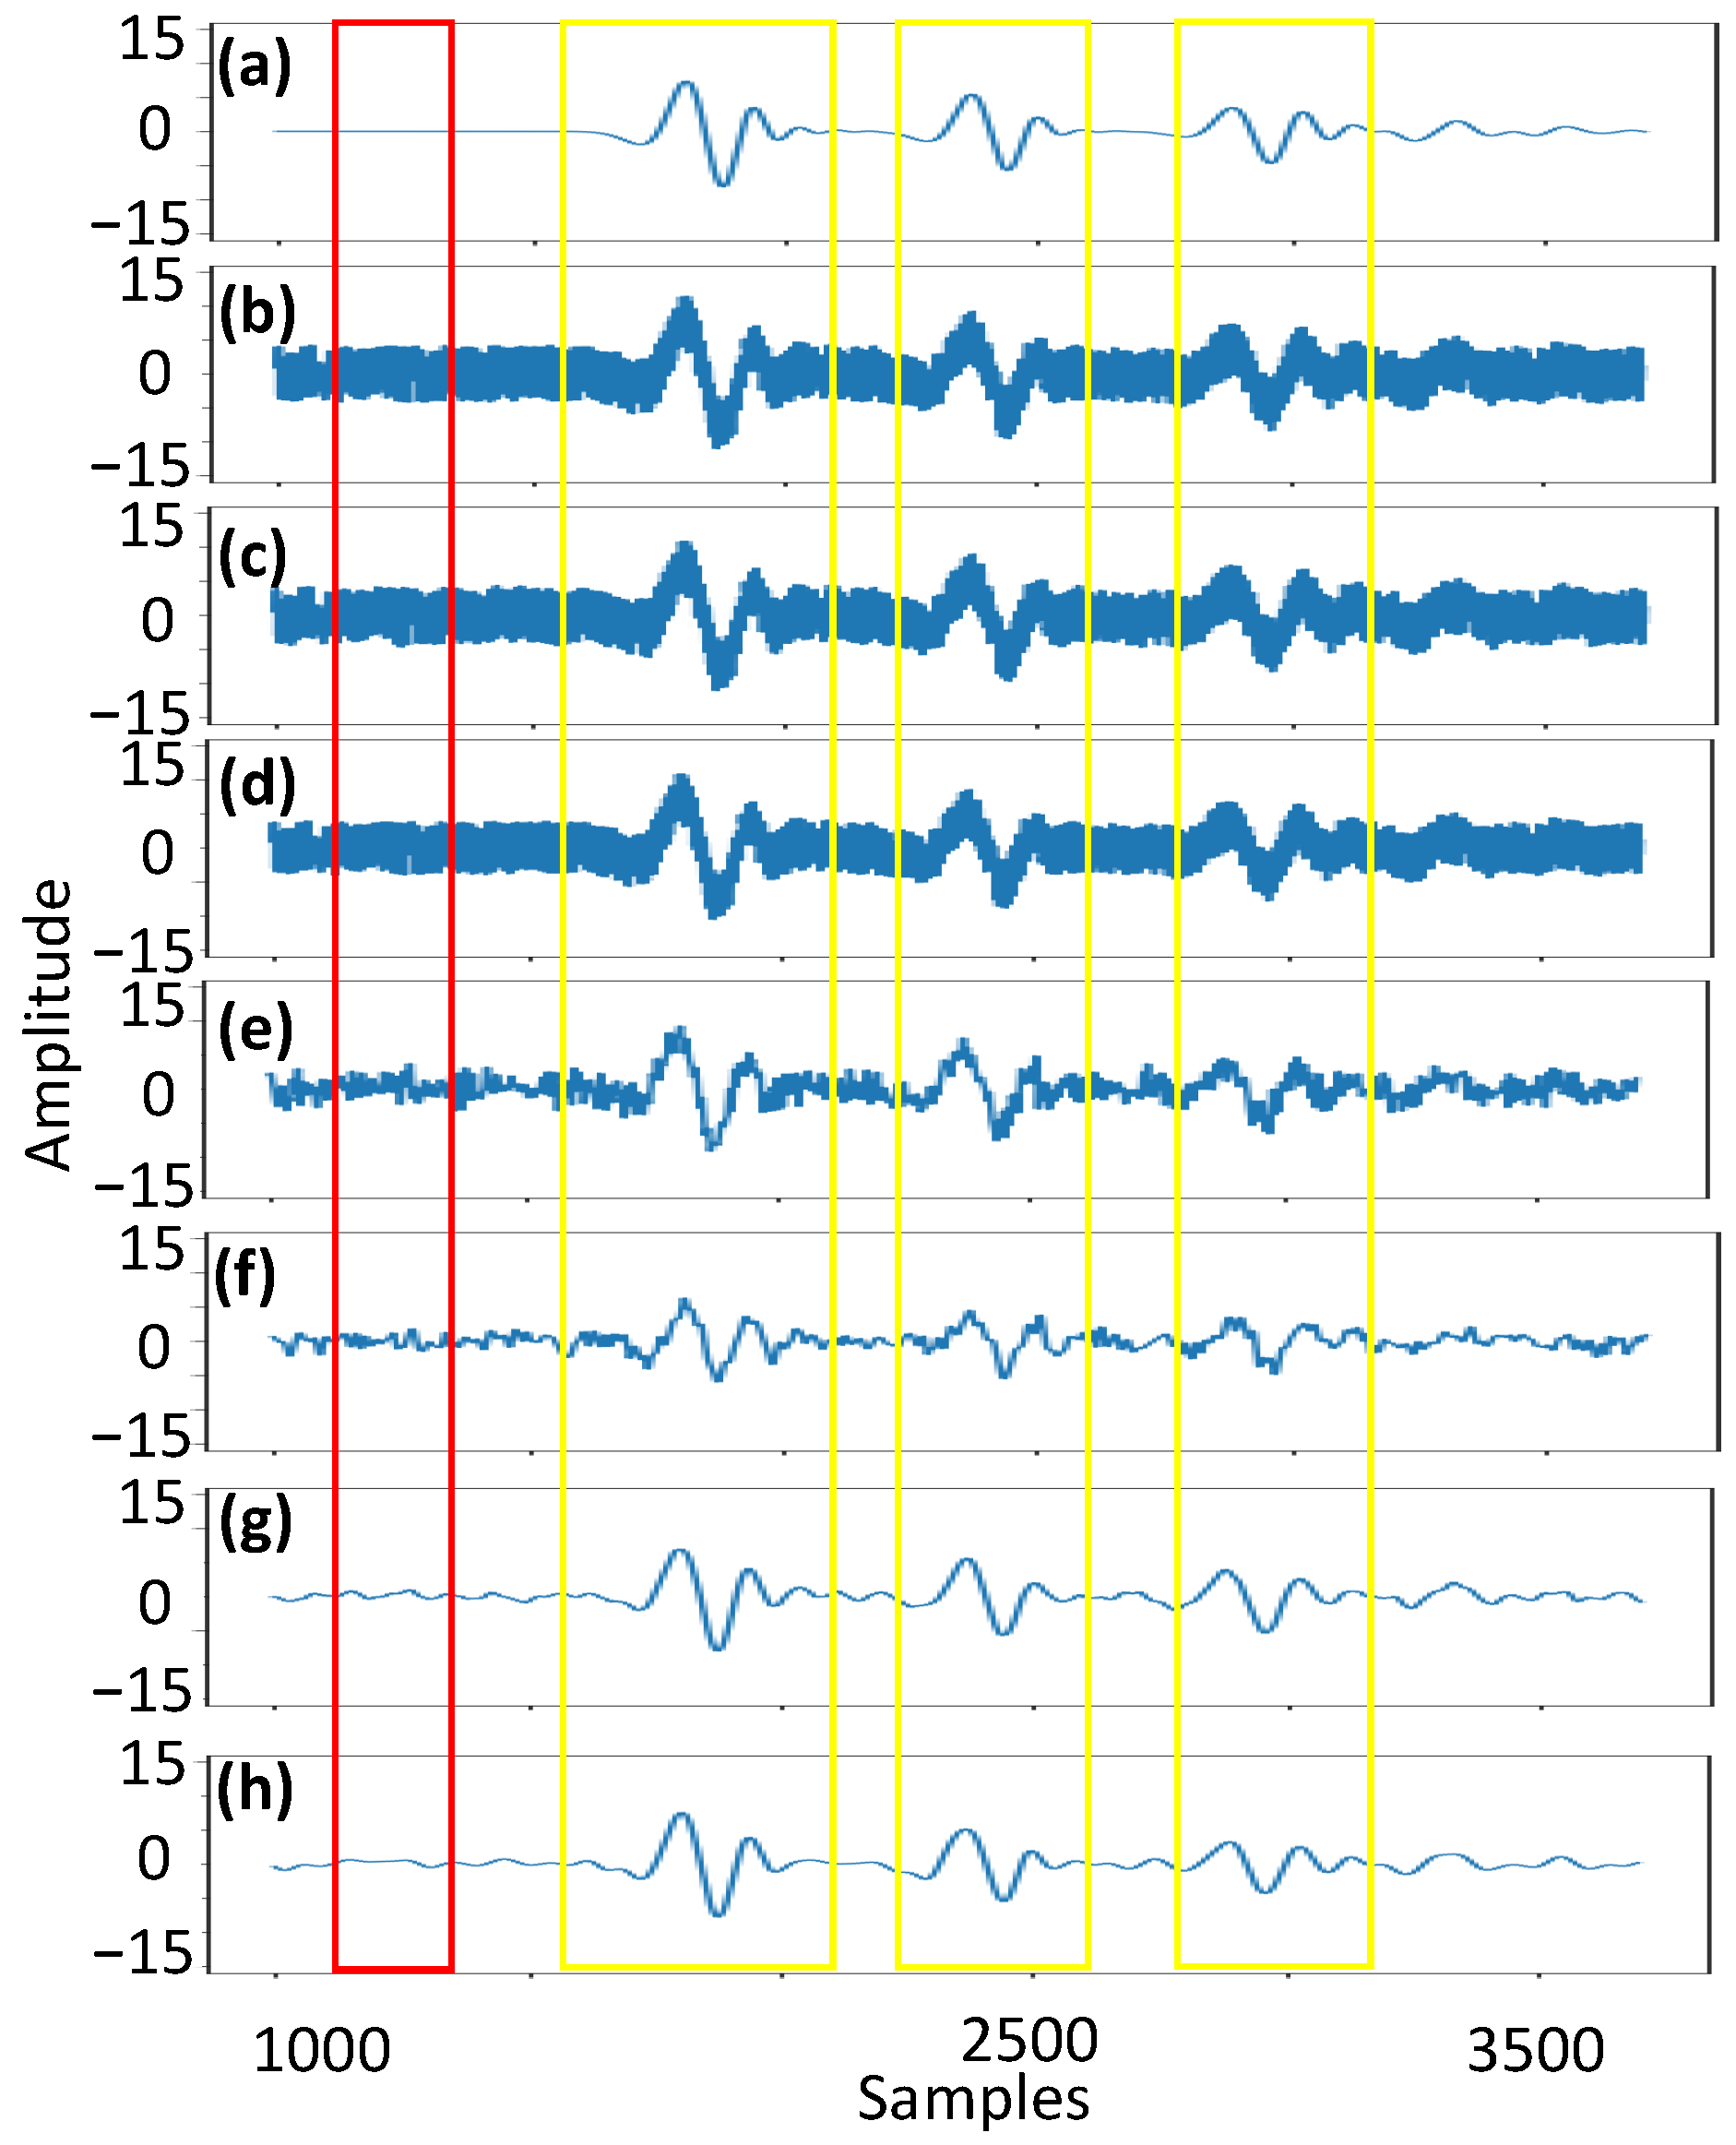
3.1.2. Case 2: Underwater Scenario with Multiple Circular Targets
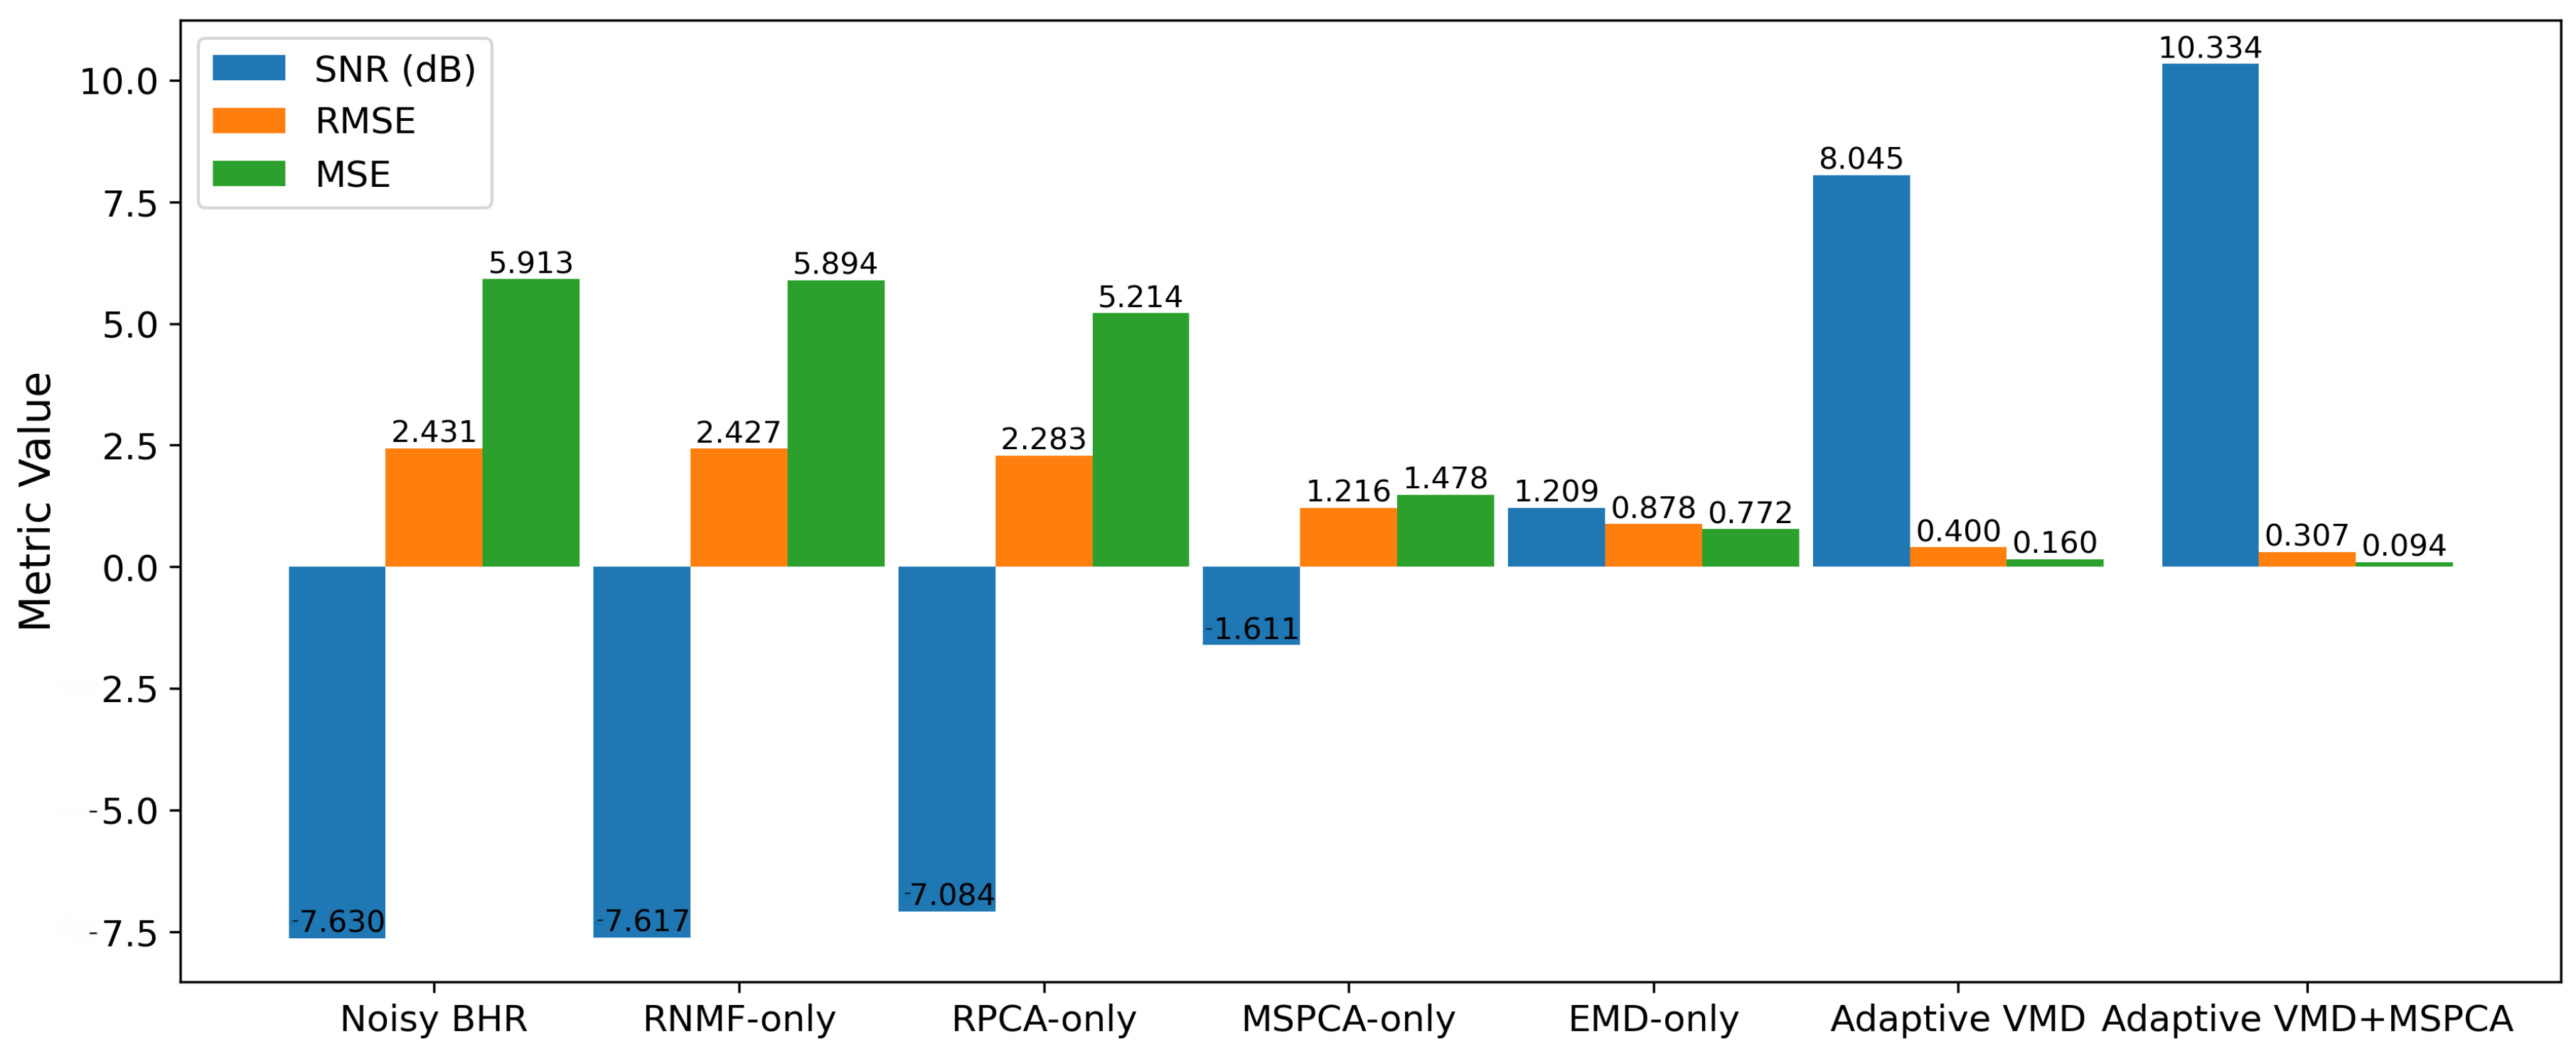
3.2. Experimental Results
4. Conclusions
Author Contributions
Funding
Data Availability Statement
Conflicts of Interest
References
- Tong, J.; Guo, J.; Huo, J.; Jiao, J.; Guo, C.; Zhang, H.; Liu, Y.; Liu, S.; Zhao, Q. A Compact Nonsymmetric Wideband Dipole Antenna for Borehole Radar Application. IEEE Trans. Antennas Propag. 2021, 69, 4323–4331. [Google Scholar] [CrossRef]
- Persico, R.; Marasco, F.; Morelli, G.; Esposito, G.; Catapano, I. A posteriori insertion of information for focusing and time–depth conversion of ground-penetrating radar data. Geophys. Prospect. 2023, 71, 1756–1771. [Google Scholar] [CrossRef]
- Persico, R.; Morelli, G. Combined migrations and time-depth conversions in GPR prospecting: Application to reinforced concrete. Remote Sens. 2020, 12, 2778. [Google Scholar] [CrossRef]
- Persico, R.; Morelli, G.; Esposito, G.; Catapano, I.; Capozzoli, L.; De Martino, G.; Yang, D. An innovative time-depth conversion for the management of buried scenarios with strong discontinuities. J. Appl. Geophys. 2024, 105435. [Google Scholar] [CrossRef]
- Yang, D.; Guo, C.; Wang, F.; Xie, L.; Zhang, K.; Jin, Y.; Zhang, S.; Zhao, Q. PICGAN: Conditional adversarial neural network-based permittivity inversions for ground penetrating radar data. J. Appl. Geophys. 2023, 217, 105164. [Google Scholar] [CrossRef]
- Kong, Q.; Ye, S.; Liang, X.; Li, X.; Liu, X.; Fang, G.; Si, G. A clutter removal method based on the FK domain for ground-penetrating radar in complex scenarios. Remote Sens. 2024, 16, 935. [Google Scholar] [CrossRef]
- Luo, W.; Lee, Y.H.; Jian, X.; Hao, T. A New Method for GPR Clutter Suppression Based on Stationary Graph Signals Processing. IEEE Trans. Geosci. Remote Sens. 2024, 60, 1–13. [Google Scholar] [CrossRef]
- Liu, S.; Wu, J.; Zhou, J.; Zeng, Z. Numerical Simulations of Borehole Radar Detection for Metal Ore. IEEE Geosci. Remote Sens. Lett. 2010, 8, 308–312. [Google Scholar] [CrossRef]
- Huo, J.; Zhou, B.; Mason, I.M.; Zhao, Q. An Application of Reflected Guided Borehole Radar Waves to Detection of Subhorizontal Structures. IEEE Trans. Geosci. Remote Sens. 2021, 59, 7201–7210. [Google Scholar] [CrossRef]
- Zhang, H.; Wang, J.; Huo, J. SVD Description to Subsurface Strata Based on Borehole Radar. In Proceedings of the International Applied Computational Electromagnetics Society Symposium (ACES-China), Hangzhou, China, 15–18 August 2023; pp. 1–3. [Google Scholar]
- Deiana, R.; Cassiani, G.; Kemna, A.; Villa, A.; Bruno, V.; Bagliani, A. An Experiment of Non-Invasive Characterization of the Vadose Zone via Water Injection and Cross-Hole Time-Lapse Geophysical Monitoring. Near Surf. Geophys. 2007, 5, 183–194. [Google Scholar] [CrossRef]
- Oloumi, D.; Pettersson, M.I.; Mousavi, P.; Rambabu, K. Imaging of Oil-Well Perforations Using UWB Synthetic Aperture Radar. IEEE Trans. Geosci. Remote Sens. 2015, 53, 4510–4520. [Google Scholar] [CrossRef]
- Wada, K.; Karasawa, S.; Kawata, K.; Ebihara, S. Fractures and Rock Properties Estimated by 3D Directional Borehole Radar. In Proceedings of the International Workshop on Advanced Ground Penetrating Radar (IWAGPR), Florence, Italy, 7–10 July 2015; pp. 1–4. [Google Scholar]
- Hao, T.; Jing, L.; He, W. An Automated GPR Signal Denoising Scheme Based on Mode Decomposition and Principal Component Analysis. IEEE Geosci. Remote Sens. Lett. 2023, 20, 1–5. [Google Scholar] [CrossRef]
- Li, R.; Zhang, H.; Chen, Z.; Yu, N.; Kong, W.; Li, T.; Wang, E.; Wu, X.; Liu, Y. Denoising Method of Ground-Penetrating Radar Signal Based on Independent Component Analysis with Multifractal Spectrum. Measurement 2022, 192, 110886. [Google Scholar] [CrossRef]
- Li, Y.; Yang, X.; Lan, T.; Liu, R.; Qu, X. Parameter Inversion by a Modified Reflected Signal Reconstruction Method for Thin-Layered Media. IEEE Antennas Wirel. Propag. Lett. 2022, 21, 958–962. [Google Scholar] [CrossRef]
- Xie, L.; Zhao, Q.; Ma, C.; Liao, B.; Huo, J. U-Net: Deep-Learning Schemes for Ground Penetrating Radar Data Inversion. J. Environ. Eng. Geophys. 2020, 25, 287–292. [Google Scholar] [CrossRef]
- Zhang, G.; Cui, F.; Zhang, X.; Cheng, Q.; Wang, R.; Zhang, M. Research on Underground Pipeline Spatial Positioning Method Based on Multi-Offset Ground Penetrating Radar. Meas. Sci. Technol. 2024, 36, 015140. [Google Scholar] [CrossRef]
- Cheng, Q.; Cui, F.; Chen, B.; Dong, G.; Wang, R.; Zhang, G.; Fu, J. Attenuation of Non-Stationary Random Noise in Ground Penetrating Radar Data Based on Time-Varying Filtering. Measurement 2024, 236, 115169. [Google Scholar] [CrossRef]
- Zhang, X.; Qin, Y.; Hu, Z.; Hu, X.; Feng, X.; Chai, Y. GPR Energy Attribute Slices Based on Multivariate Variational Mode Decomposition and Teager–Kaiser Energy Operator. Remote Sens. 2022, 14, 4805. [Google Scholar] [CrossRef]
- He, X.; Wang, C.; Zheng, R.; Li, X. GPR Image Noise Removal Using Grey Wolf Optimisation in the NSST Domain. Remote Sens. 2021, 13, 4416. [Google Scholar] [CrossRef]
- Liu, H.; Long, Z.; Tian, B.; Han, F.; Fang, G.; Liu, Q. Two-Dimensional Reverse-Time Migration Applied to GPR with a 3-D-to-2-D Data Conversion. IEEE J. Sel. Top. Appl. Earth Obs. Remote Sens. 2017, 10, 4313–4320. [Google Scholar] [CrossRef]
- Dai, Q.; Li, Y.; Jiang, T.; Sun, Q. A New B-Scan Interpretation Model in Complex Environments. IEEE Trans. Instrum. Meas. 2022, 71, 1–15. [Google Scholar] [CrossRef]
- Feng, D.; Liu, Y.; Wang, X.; Zhang, B.; Ding, S.; Yu, T.; Li, B.; Feng, Z. Inspection and Imaging of Tree Trunk Defects Using GPR Multifrequency Full-Waveform Dual-Parameter Inversion. IEEE Trans. Geosci. Remote Sens. 2023, 61, 1–15. [Google Scholar] [CrossRef]
- Zhao, Y.; Yang, X.; Qu, X.; Lan, T.; Gong, J. Clutter Removal Method for GPR Based on Low-Rank and Sparse Decomposition with Total Variation Regularization. IEEE Geosci. Remote Sens. Lett. 2023, 20, 1–5. [Google Scholar] [CrossRef]
- Gutierrez, S.; Vega, F.; González, F.A.; Baer, C.; Sachs, J. Application of Polarimetric Features and Support Vector Machines for Classification of Improvised Explosive Devices. IEEE Antennas Wireless Propag. Lett. 2019, 18, 2282–2286. [Google Scholar] [CrossRef]
- Abujarad, F.; Omar, A. Comparison of Independent Component Analysis (ICA) Algorithms for GPR Detection of Non-Metallic Land Mines. In Proceedings of the Image and Signal Processing for Remote Sensing XII, Stockholm, Sweden, 13–15 September 2006; Volume 6365, pp. 362–373. [Google Scholar]
- Chen, G.; Fu, L.; Chen, K.; Boateng, C.D.; Ge, S. Adaptive Ground Clutter Reduction in Ground-Penetrating Radar Data Based on Principal Component Analysis. IEEE Trans. Geosci. Remote Sens. 2019, 57, 3271–3282. [Google Scholar] [CrossRef]
- Brown, J. Choosing the Right Number of Components or Factors in PCA and EFA. JALT Test. Eval. SIG Newsl. 2009, 13, 2. [Google Scholar]
- Temlioglu, E.; Erer, I. Clutter Removal in Ground-Penetrating Radar Images Using Morphological Component Analysis. IEEE Geosci. Remote Sens. Lett. 2016, 13, 1802–1806. [Google Scholar] [CrossRef]
- Kumlu, D.; Erer, I. Improved Clutter Removal in GPR by Robust Nonnegative Matrix Factorization. IEEE Geosci. Remote Sens. Lett. 2020, 17, 958–962. [Google Scholar] [CrossRef]
- Gao, Q.; Zhang, P.; Xia, W.; Xie, D.; Gao, X.; Tao, D. Enhanced Tensor RPCA and Its Application. IEEE Trans. Pattern Anal. Mach. Intell. 2020, 43, 2133–2140. [Google Scholar] [CrossRef]
- Masarik, M.P.; Burns, J.; Thelen, B.T.; Kelly, J.; Havens, T.C. GPR Anomaly Detection with Robust Principal Component Analysis. In Detection and Sensing of Mines, Explosive Objects, and Obscured Targets XX; SPIE: Paris, France, 2015; Volume 9454, pp. 395–405. [Google Scholar]
- Song, X.; Xiang, D.; Zhou, K.; Su, Y. Improving RPCA-Based Clutter Suppression in GPR Detection of Antipersonnel Mines. IEEE Geosci. Remote Sens. Lett. 2017, 14, 1338–1342. [Google Scholar] [CrossRef]
- Song, X.; Xiang, D.; Zhou, K.; Su, Y. Fast Prescreening for GPR Antipersonnel Mine Detection via GO Decomposition. IEEE Geosci. Remote Sens. Lett. 2018, 16, 15–19. [Google Scholar] [CrossRef]
- Shu, X.; Porikli, F.; Ahuja, N. Robust Orthonormal Subspace Learning: Efficient Recovery of Corrupted Low-Rank Matrices. In Proceedings of the IEEE Conference on Computer Vision and Pattern Recognition, Columbus, OH, USA, 23–28 June 2014; pp. 3874–3881. [Google Scholar]
- Zhang, S.; Zhang, L.; Ling, T.; Fu, G.; Guo, Y. Experimental Research on Evaluation of Soil Water Content Using Ground Penetrating Radar and Wavelet Packet-Based Energy Analysis. Remote Sens. 2021, 13, 5047. [Google Scholar] [CrossRef]
- Cui, H.; Song, G. Study of the Wavelet Basis Selections. In Proceedings of the International Conference on Computational and Information Science, Reading, UK, 28–31 May 2006; pp. 1009–1017. [Google Scholar]
- Wang, X.; Liu, S. Noise Suppression and Direct Wave Arrivals Removal in GPR Data Based on Shearlet Transform. Signal Process. 2017, 132, 227–242. [Google Scholar] [CrossRef]
- Oskooi, B.; Parnow, S.; Smirnov, M.; Varfinezhad, R.; Yari, M. Attenuation of random noise in GPR data by image processing. Arab. J. Geosci. 2018, 11, 1–10. [Google Scholar] [CrossRef]
- Bakshi, B.R. Multiscale PCA with Application to Multivariate Statistical Process Monitoring. AIChE J. 1998, 44, 1596–1610. [Google Scholar] [CrossRef]
- Sheriff, M.Z.; Mansouri, M.; Karim, M.N.; Nounou, H.; Nounou, M. Fault Detection Using Multiscale PCA-Based Moving Window GLRT. J. Process Control 2017, 54, 47–64. [Google Scholar] [CrossRef]
- Sharma, L.N.; Dandapat, S.; Mahanta, A. Multichannel ECG Data Compression Based on Multiscale Principal Component Analysis. IEEE Trans. Inf. Technol. Biomed. 2012, 16, 730–736. [Google Scholar] [CrossRef] [PubMed]
- Li, Y.; Chen, C.; Fang, R.; Yi, L. Accuracy Enhancement of High-Rate GNSS Positions Using a Complete Ensemble Empirical Mode Decomposition-Based Multiscale Multiway PCA. J. Asian Earth Sci. 2019, 169, 67–78. [Google Scholar] [CrossRef]
- Jeng, Y.; Chen, C.-S. A Nonlinear Method of Removing Harmonic Noise in Geophysical Data. Nonlinear Process. Geophys. 2011, 18, 367–379. [Google Scholar] [CrossRef]
- Terrasse, G.; Nicolas, J.M.; Trouvé, E.; Drouet, E. Application of the Curvelet Transform for Clutter and Noise Removal in GPR Data. IEEE J. Sel. Top. Appl. Earth Obs. Remote Sens. 2017, 10, 4280–4294. [Google Scholar] [CrossRef]
- He, X.; Yan, H.; Wang, C.; Zheng, R.; Li, Y.; Li, X. Non-Stationary Random Noise Removal in Ground-Penetrating Radar Images by Using Self-Guided Filtering. Digit. Signal Process. 2022, 129, 103690. [Google Scholar] [CrossRef]
- Sun, H.H.; Cheng, W.; Fan, Z. Learning to Remove Clutter in Real-World GPR Images Using Hybrid Data. IEEE Trans. Geosci. Remote Sens. 2022, 60, 1–14. [Google Scholar] [CrossRef]
- Temlioglu, E.; Erer, I. A Novel Convolutional Autoencoder-Based Clutter Removal Method for Buried Threat Detection in Ground-Penetrating Radar. IEEE Trans. Geosci. Remote Sens. 2021, 60, 1–13. [Google Scholar] [CrossRef]
- Ni, Z.; Ye, S.; Shi, C.; Li, C.; Fang, G. Clutter Suppression in GPR B-Scan Images Using Robust Autoencoder. IEEE Geosci. Remote Sens. Lett. 2020, 19, 1–5. [Google Scholar] [CrossRef]
- Ma, C.; Zhao, Q.; Huo, J.; Xie, L. Borehole Radar Data Processing Based on Empirical Mode Decomposition. In Proceedings of the International Conference on Ground Penetrating Radar (GPR), Rapperswil, Switzerland, 18–21 June 2018; pp. 1–4. [Google Scholar]
- Wu, Z.; Huang, N.E. Ensemble Empirical Mode Decomposition: A Noise-Assisted Data Analysis Method. Adv. Adapt. Data Anal. 2009, 1, 1–41. [Google Scholar] [CrossRef]
- Li, J.; Liu, C.; Zeng, Z.; Chen, L. GPR Signal Denoising and Target Extraction with the CEEMD Method. IEEE Geosci. Remote Sens. Lett. 2015, 12, 1615–1619. [Google Scholar]
- Colominas, M.A.; Schlotthauer, G.; Torres, M.E. Improved Complete Ensemble EMD: A Suitable Tool for Biomedical Signal Processing. Biomed. Signal Process. Control 2014, 14, 19–29. [Google Scholar] [CrossRef]
- Liu, S.; Chen, Y.; Luo, C.; Jiang, H.; Li, H.; Li, H.; Lu, Q. Particle Swarm Optimization-Based Variational Mode Decomposition for Ground Penetrating Radar Data Denoising. Remote Sens. 2022, 14, 2973. [Google Scholar] [CrossRef]
- Dragomiretskiy, K.; Zosso, D. Variational Mode Decomposition. IEEE Trans. Signal Process. 2013, 62, 531–544. [Google Scholar] [CrossRef]
- Mirjalili, S.; Lewis, A. The Whale Optimization Algorithm. Adv. Eng. Softw. 2016, 95, 51–67. [Google Scholar] [CrossRef]
- Richman, J.S.; Lake, D.E.; Moorman, J.R. Sample Entropy. In Methods in Enzymology; Elsevier: Amsterdam, The Netherlands, 2004; Volume 384, pp. 172–184. [Google Scholar]
- Cohen, I.; Huang, Y.; Chen, J.; Benesty, J. Pearson Correlation Coefficient. In Noise Reduct. Speech Process; Springer: Berlin/Heidelberg, Germany, 2009; pp. 1–4. [Google Scholar]
- Warren, C.; Giannopoulos, A.; Giannakis, I. gprMax: Open Source Software to Simulate Electromagnetic Wave Propagation for Ground Penetrating Radar. Comput. Phys. Commun. 2016, 209, 163–170. [Google Scholar] [CrossRef]

Disclaimer/Publisher’s Note: The statements, opinions and data contained in all publications are solely those of the individual author(s) and contributor(s) and not of MDPI and/or the editor(s). MDPI and/or the editor(s) disclaim responsibility for any injury to people or property resulting from any ideas, methods, instructions or products referred to in the content. |
© 2025 by the authors. Licensee MDPI, Basel, Switzerland. This article is an open access article distributed under the terms and conditions of the Creative Commons Attribution (CC BY) license (https://creativecommons.org/licenses/by/4.0/).
Share and Cite
Yang, D.; Guo, C.; Persico, R.; Liu, Y.; Liu, H.; Bai, C.; Lian, C.; Zhao, Q. Adaptive Variational Mode Decomposition and Principal Component Analysis-Based Denoising Scheme for Borehole Radar Data. Remote Sens. 2025, 17, 525. https://doi.org/10.3390/rs17030525
Yang D, Guo C, Persico R, Liu Y, Liu H, Bai C, Lian C, Zhao Q. Adaptive Variational Mode Decomposition and Principal Component Analysis-Based Denoising Scheme for Borehole Radar Data. Remote Sensing. 2025; 17(3):525. https://doi.org/10.3390/rs17030525
Chicago/Turabian StyleYang, Ding, Cheng Guo, Raffaele Persico, Yajie Liu, Handing Liu, Changjin Bai, Chao Lian, and Qing Zhao. 2025. "Adaptive Variational Mode Decomposition and Principal Component Analysis-Based Denoising Scheme for Borehole Radar Data" Remote Sensing 17, no. 3: 525. https://doi.org/10.3390/rs17030525
APA StyleYang, D., Guo, C., Persico, R., Liu, Y., Liu, H., Bai, C., Lian, C., & Zhao, Q. (2025). Adaptive Variational Mode Decomposition and Principal Component Analysis-Based Denoising Scheme for Borehole Radar Data. Remote Sensing, 17(3), 525. https://doi.org/10.3390/rs17030525