Abstract
Resistance, resilience, and recovery time are critical for quantifying the stability of grasslands in response to drought disturbances. Few studies have simultaneously considered both drought intensity and duration to analyze the stability of different grassland types, which may overlook short-term extreme or long-term cumulative effects. This study used the monthly Standardized Precipitation Evapotranspiration Index (SPEI) to identify distinct drought patterns in Inner Mongolia, China, from 1998 to 2020, accounting for both intensity and duration. Grassland stability was assessed using monthly SPOT-VGT Normalized Difference Vegetation Index (NDVI) data. We focused on the vegetation response to short-term climate changes while minimizing the influence of seasonal fluctuations in vegetation growth. Six drought patterns were identified, and the resistance of grassland types under the same drought pattern followed this order: temperate desert steppe (TDS) > temperate typical steppe (TTS) > temperate meadow steppe (TMS). Resilience was ranked as TDS < TTS < TMS, while recovery time followed the reverse trend: TDS > TTS > TMS. A trade-off was observed between resilience and resistance. Most grasslands were able to recover within five months following a drought. These findings provide scientific support for enhancing ecosystem adaptability to climate change and for managing grassland resources more effectively.
1. Introduction
Drought profoundly affects the structure and function of terrestrial ecosystems, influencing vital components such as biodiversity, vegetation phenology, and carbon sequestration [1]. The intensity, frequency, and severity of global droughts will escalate, which may change the biological composition of vegetation communities [2,3,4]. Understanding the ecosystem response to drought can aid in predicting ecosystem feedback to future climate change and inform risk management and resource planning [5,6,7].
The ability of ecosystems to remain healthy is referred to as stability [8]. Three indicators, including resistance, resilience, and recovery time, are commonly used to quantify ecosystem stability. Resistance refers to the capacity of an ecosystem to maintain its original growth state during a drought [9,10]. Resilience is the ability of the ecosystem to return to its normal state following a drought [11]. Recovery time is the duration required for the ecosystem to recover to its normal state [12]. Generally, higher resistance, higher resilience, and shorter recovery time indicate stronger adaptive capacity to drought [7,13,14,15].
Different vegetation types exhibit distinct physiological characteristics, leading to varied responses to drought [16]. Previous studies have explored the response of different vegetation types to drought using various indices [17,18,19]. Nevertheless, previous studies primarily concentrated on annual-scale ecosystem stability, particularly resistance and resilience [7]. Grasslands, one of the most widely distributed plant types globally, play a critical role in soil conservation and nutrient cycling as pioneer species in ecological succession. They also serve as the material foundation for the livestock industry [20]. Grasslands in arid, semi-arid, and semi-humid regions are highly sensitive to drought [21,22]. Currently, our understanding of the stability of different grassland ecosystems at the monthly scale remains limited.
Ecosystem stability is closely related to both drought intensity and duration, respectively [23,24,25]. While the temporal and spatial distributions of drought intensity and duration have been well analyzed in many regions, most studies have examined the effects of each drought characteristic on vegetation separately [26,27,28]. Droughts with the same intensity can vary in duration, leading to classification as either short-term extreme droughts or long-term mild droughts, which risks overlooking the combined impact of short-term extreme or long-term cumulative effects. Therefore, it is essential to define drought patterns that account for both the intensity and duration.
Temperate grasslands in Inner Mongolia represent a crucial component of the Eurasian steppe and exhibit high sensitivity to climate change [29,30]. The variability among different grassland types is a pressing concern. This study aims to explore the resistance, resilience, and recovery time of various grassland types in response to different drought patterns. Our objectives are: (1) to provide a detailed delineation of drought patterns and conduct spatial and temporal analyses using monthly-scale SPEI data; and (2) to investigate the stability of different grassland types in response to various drought patterns, ranging from short to long term, based on fine-scale multisource data.
2. Study Area and Datasets
2.1. Study Area
Inner Mongolia, located in Northern China, has an elevation ranging from 85 to 3500 m above sea level and is characterized by a temperate continental monsoon climate, with an annual average temperature of 5.6 °C. The annual average precipitation from 1998 to 2020 was 262 mm, decreasing from the northeast to the southwest. The average annual evapotranspiration during the same period was 1264.7 mm. Drought is the most severe meteorological disaster in this region [31]. Frequent drought events threaten agricultural and livestock production, resulting in water scarcity and land degradation. Economic losses attributed to droughts from 2001 to 2020 reached 141.2 billion yuan [32].
The grassland ecosystem in Inner Mongolia occupies the largest distribution area in China and is a significant component of the Eurasian steppe. Grasslands vary according to climate conditions and can be classified into three groups: TMS, TTS, and TDS (Figure 1). TMS is located in the semi-humid zone, where the annual precipitation is 350–500 mm, with an annual average temperature of −2.3–5 °C. TTS is found in the semi-arid zone, west to TMS, characterized by annual precipitation of 300–400 mm and an annual average temperature of 1–4 °C. TDS is distributed further west in the arid zone, with annual precipitation of 135–311 mm and an annual average temperature between 0.8 °C and 5.3 °C [33].
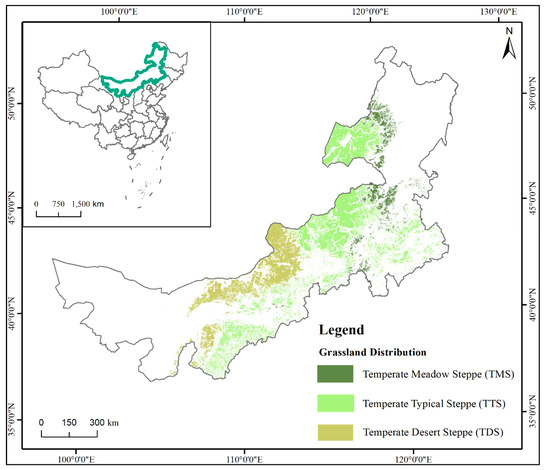
Figure 1.
Distribution of three grassland types in Inner Mongolia that have not changed from 1980s to 2020.
2.2. Datasets and Processing
The data used in this study include meteorological data, NDVI data and grassland distribution data. Meteorological data were used to calculate and validate SPEI results, while NDVI data were used to quantify stability indicators of grassland ecosystems.
2.2.1. Meteorological Data
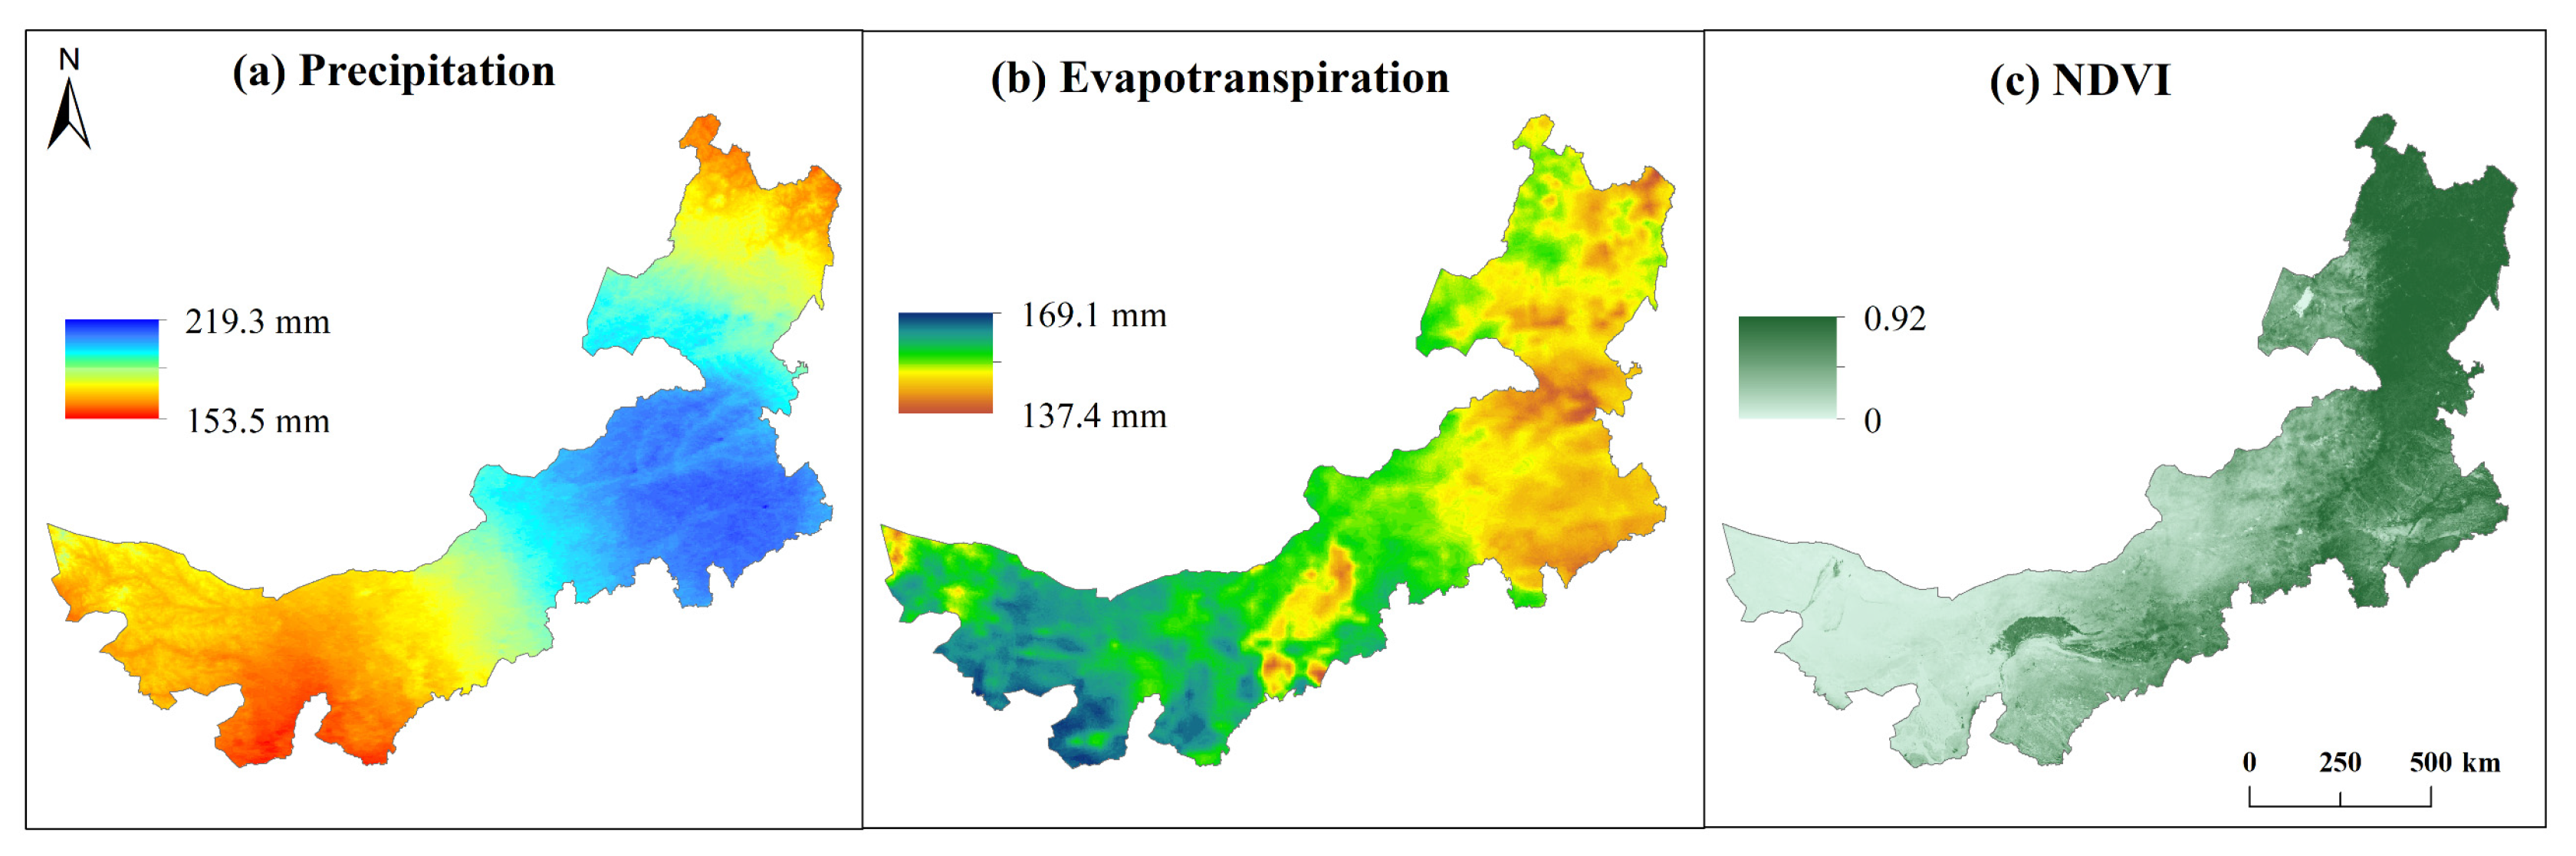
Meteorological data, including the monthly precipitation and potential evapotranspiration datasets from 1998 to 2020, were obtained from the National Tibetan Plateau Science Data Center (https://data.tpdc.ac.cn/zh-hans/, accessed on 1 January 2022), with a spatial resolution of ~1 km in Network Common Data Format (NetCDF) (Figure 2). The mean absolute error between the precipitation data product and the observations from 496 weather stations was 17.85 mm [34,35]. The potential evapotranspiration product was derived from the Hargreaves potential evapotranspiration formula, based on a 1 km resolution temperature dataset. To facilitate the subsequent analysis and visualization, the precipitation and potential evapotranspiration in NetCDF format were converted to Geotiff format using Python, producing 552 images in total.
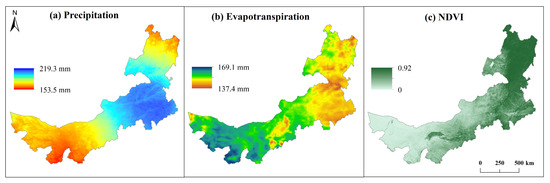
Figure 2.
Spatial distribution of (a) precipitation, (b) evapotranspiration, and (c) NDVI in July 2019.
The monthly SPEI from 1998 to 2020 was calculated based on the precipitation and potential evapotranspiration datasets. Additionally, meteorological station data, including monthly precipitation and average temperature, were obtained from the China Meteorological Data Network (http://data.cma.cn/, accessed on 1 January 2022). A total of 39 meteorological stations from 1998 to 2020 were selected to verify the accuracy of the calculated SPEI.
2.2.2. NDVI Data
Monthly NDVI data were used to quantify the stability of three grassland types. The SPOT-VGT NDVI dataset, with a spatial resolution of 1 km from 1998 to 2020, was downloaded from the Resources and Environmental Science Data Platform (http://www.resdc.cn accessed on 1 January 2022) (Figure 2c). The dataset was obtained from the VEGETATION sensor onboard the SPOT-4 satellite.
2.2.3. Grassland Distribution Data
Grassland distribution data for 2020 were obtained from Sentinel-2 imagery using the Random Forest algorithm, which incorporated phenological, topographical and spectral features [36]. To simplify the comparison of stability indicators among grassland types, the 2020 grassland distribution was intersected with the 1:1,000,000 Vegetation Map of China produced in 2001 [37]. We assumed that the grassland distribution had not changed over the past two decades. The area of TMS is 26,512 km2, TTS is 151,970 km2, and TDS is 72,821 km2 (Figure 1).
3. Methodology
3.1. Identification of Drought Patterns
Based on the meteorological drought standard (GB/T 20481-2017) [38], drought events from 1998 to 2020 were categorized into six drought patterns according to drought intensity and duration. SPEI, a drought index, normalizes the cumulative probability of the difference series between precipitation and potential evapotranspiration [39]. SPEI considers the influence of temperature on potential evapotranspiration, improving upon the Standardized Precipitation Index (SPI), which only considers precipitation data. SPEI has been demonstrated in previous studies to have advantages over other indicators, particularly in capturing typical drought events, and has been widely used for drought monitoring in the grasslands of Inner Mongolia [40,41,42,43,44]. Monthly SPEI was used to characterize drought events. Drought intensity denoted as , is defined as the sum of SPEI for the duration of the drought events [45]. A smaller value indicates stronger drought intensity.
where is the number of months during each drought event. According to the meteorological drought standard (GB/T 20481-2017) [38], a threshold of SPEI ≤ −0.5 was used to define the onset of a drought event, while SPEI > −0.5 marked its end. Drought events that began before January 1998 or extended beyond December 2020 were excluded from the sequence.
The pixel-by-pixel SPEI was calculated on the basis of the monthly potential evapotranspiration and precipitation products from 1998 to 2020. The difference between monthly precipitation and potential evapotranspiration can be expressed as:
where represents moisture gain/loss, indicates monthly precipitation, denotes potential evapotranspiration, and is month.
The three-parameter log-logistic distribution was used for normalizing the monthly series to obtain SPEI [39]. The cumulative distribution function of the three-parameter log-logistic distribution is given by:
where , and , respectively represent the scale parameter, shape parameter and position parameter, obtained based on the linear matrix.
3.2. Stability Indicators
Monthly NDVI data were used to investigate the response of grasslands to drought events. Stability indicators include resistance, resilience, and recovery time. To avoid the influence of intra-annual growth cycles, the series NDVI data were detrended to retain the fluctuation information relative to the multi-year mean NDVI. For example, NDVI data for every April from 1998 to 2020 were organized into time series, which were detrended to obtain relative anomalies for every April.
Below is the description of how to derive the stability indicators in this study:
(1) Resistance (Ω) is defined as the ability of an ecosystem to maintain its original growth state before a drought event. In the study, considering that the state of the ecosystem prior to a drought can influence resistance [46], resistance is modified as the difference between the relative anomalies before and during the drought event, based on Isbell, et al. [18]:
where is the cumulative relative anomalies of NDVI during the drought event and is the relative anomaly of NDVI before the event. The range of is (0, ∞). A value of 0 indicates that the ecosystem is unable to resist external disturbances and is highly susceptible to damage, while higher values represent greater resistance.
(2) Resilience (Δ) is defined as the ability of the ecosystem to return to pre-drought levels. In this study, resilience is the difference in vegetation relative anomalies before, during and after a drought event. The resilience was modified based on Liu, et al. [47] as the difference between the relative anomaly of NDVI after drought and the minimum value of it during a drought event :
The range of is (0, ). Higher values indicate greater resilience. Both resistance and resilience are dimensionless.
(3) Recovery time refers to the duration required for a drought-affected ecosystem to return to its normal state, defined as the average NDVI value for that month from 1998 to 2020 [12]. To minimize the influence of non-drought factors on grasslands and to consider the lag response to drought, NDVI data were selected from those with a relative anomaly below 0 within 2 months following the drought event [48].
4. Results and Discussion
4.1. Drought Patterns of Grasslands
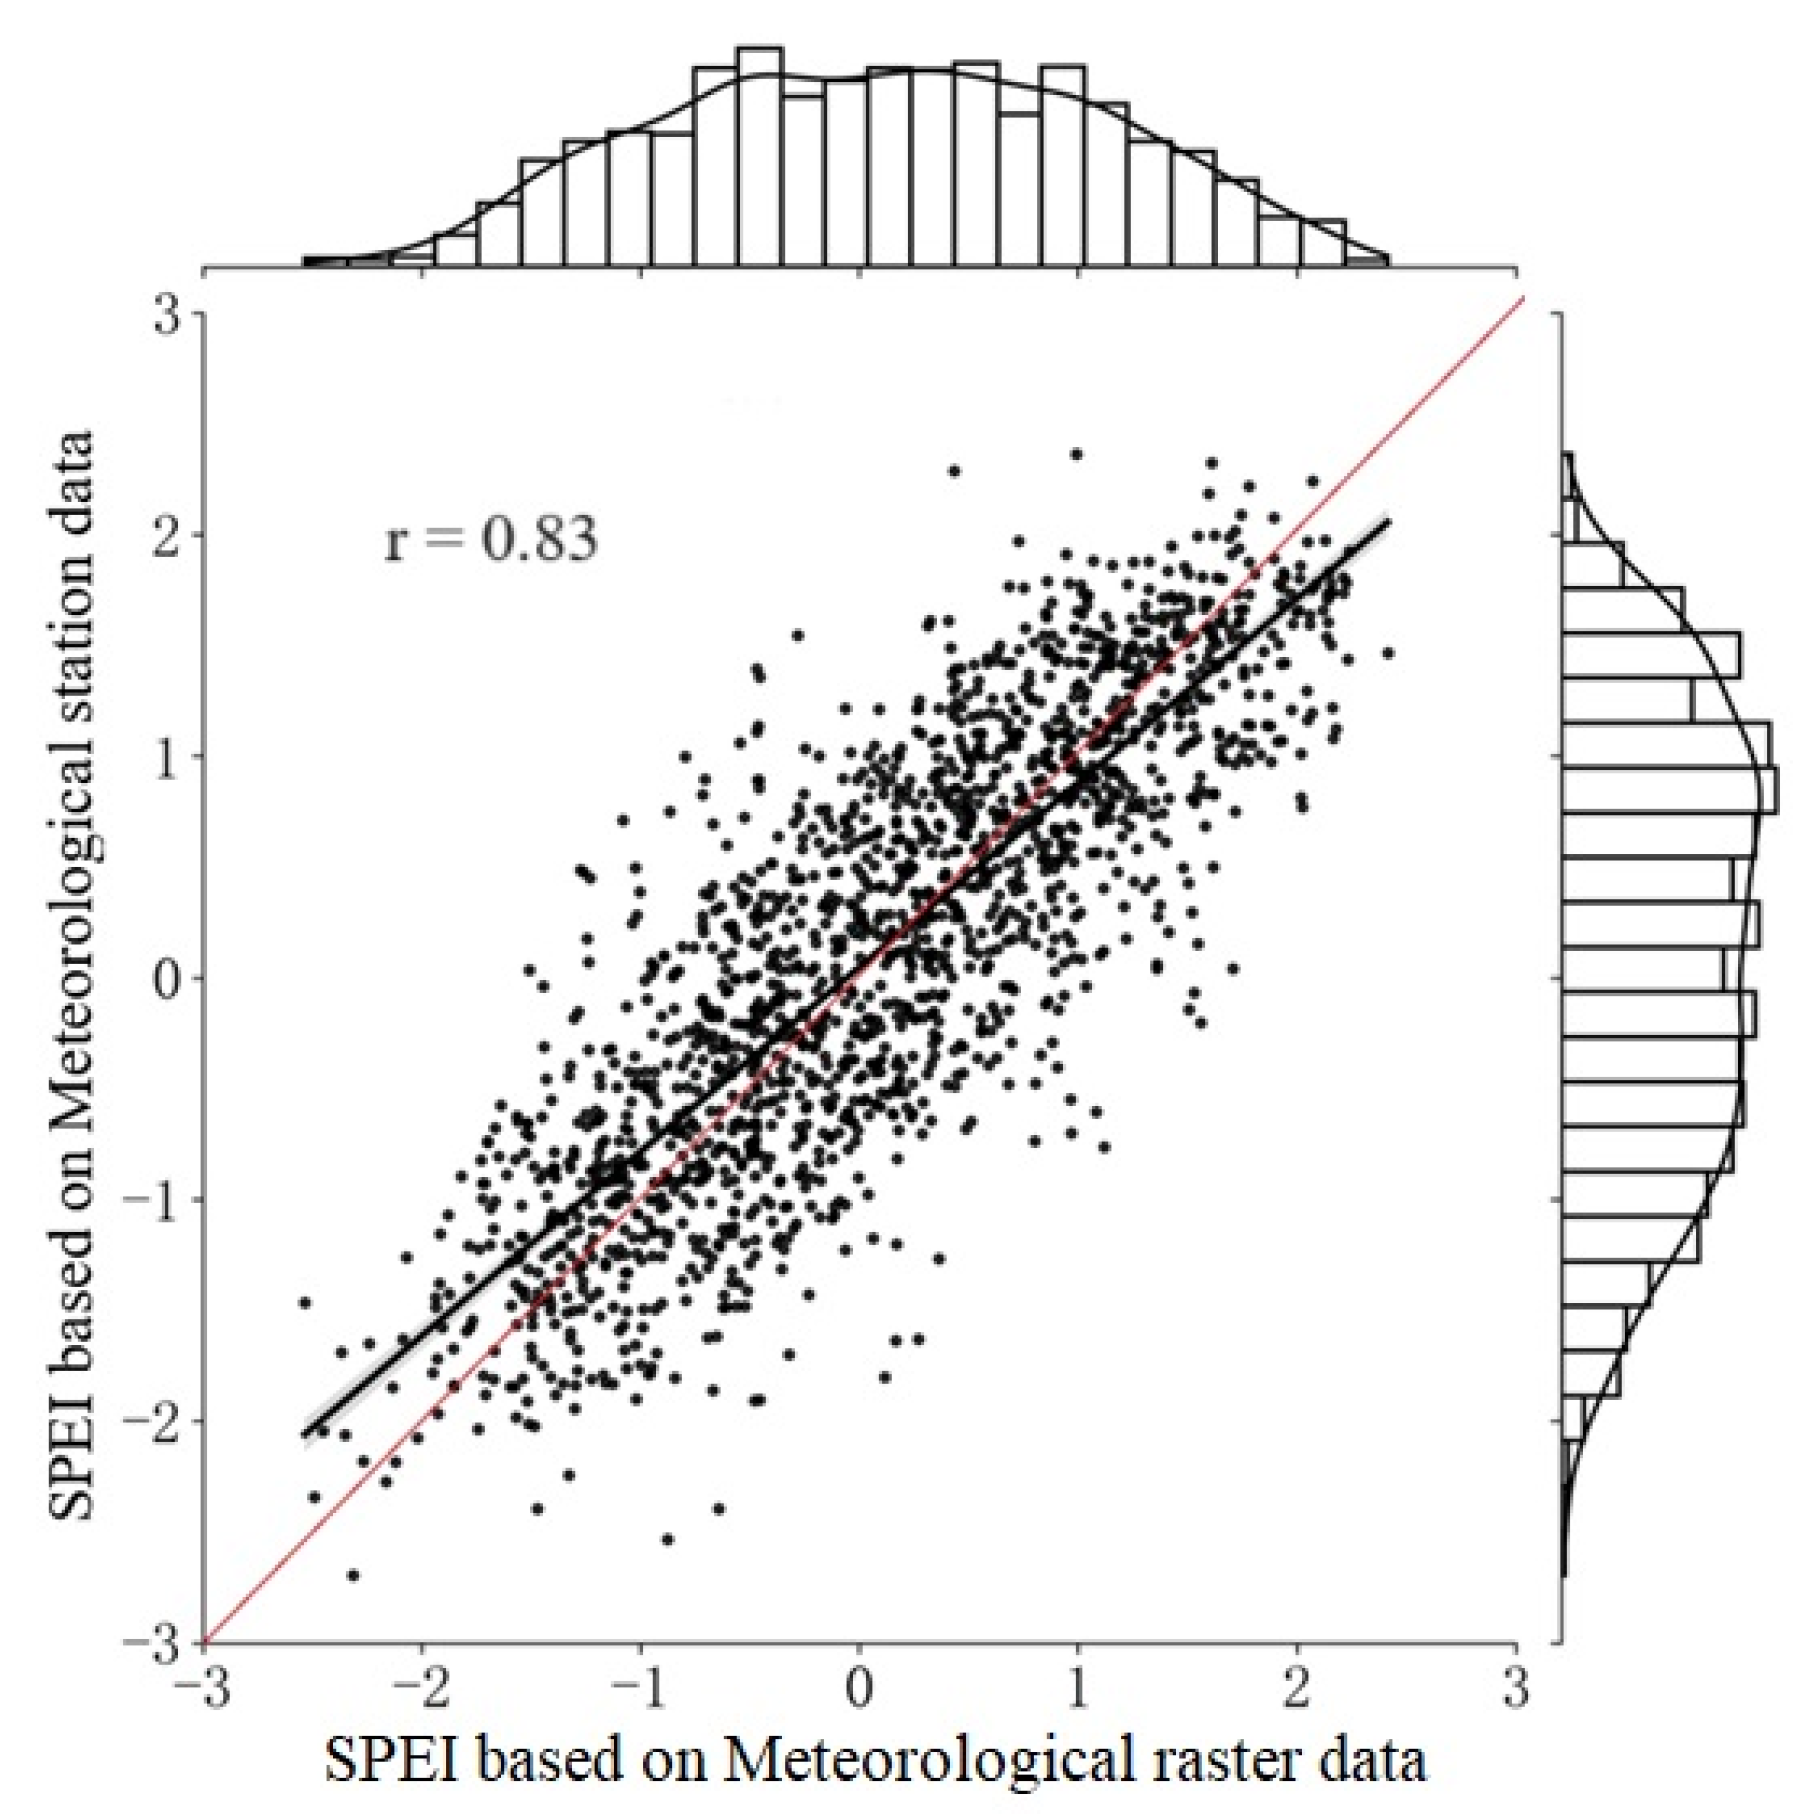
The SPEI values were calculated using monthly precipitation and potential evapotranspiration products, along with data from 39 meteorological stations. These calculations yielded a correlation coefficient of 0.83 (Figure 3), demonstrating the reliability of the results during the period from 1998 to 2020.
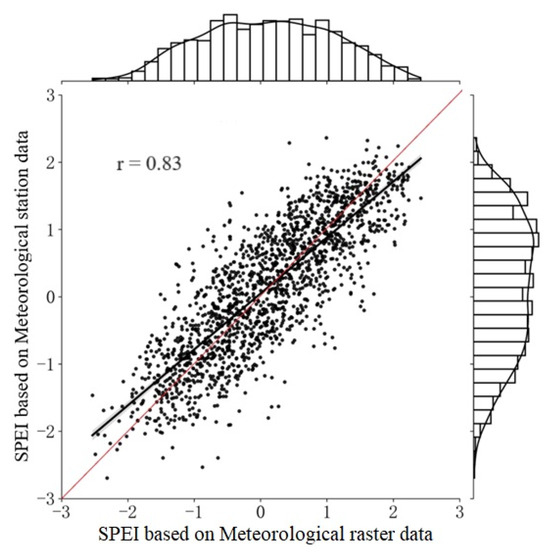
Figure 3.
Validation of SPEI (1998–2020) calculation. The histograms on the upper and right sides represent the distribution of SPEI based on monthly precipitation and potential evapotranspiration products and station data, respectively. The red line is the y = x reference line.
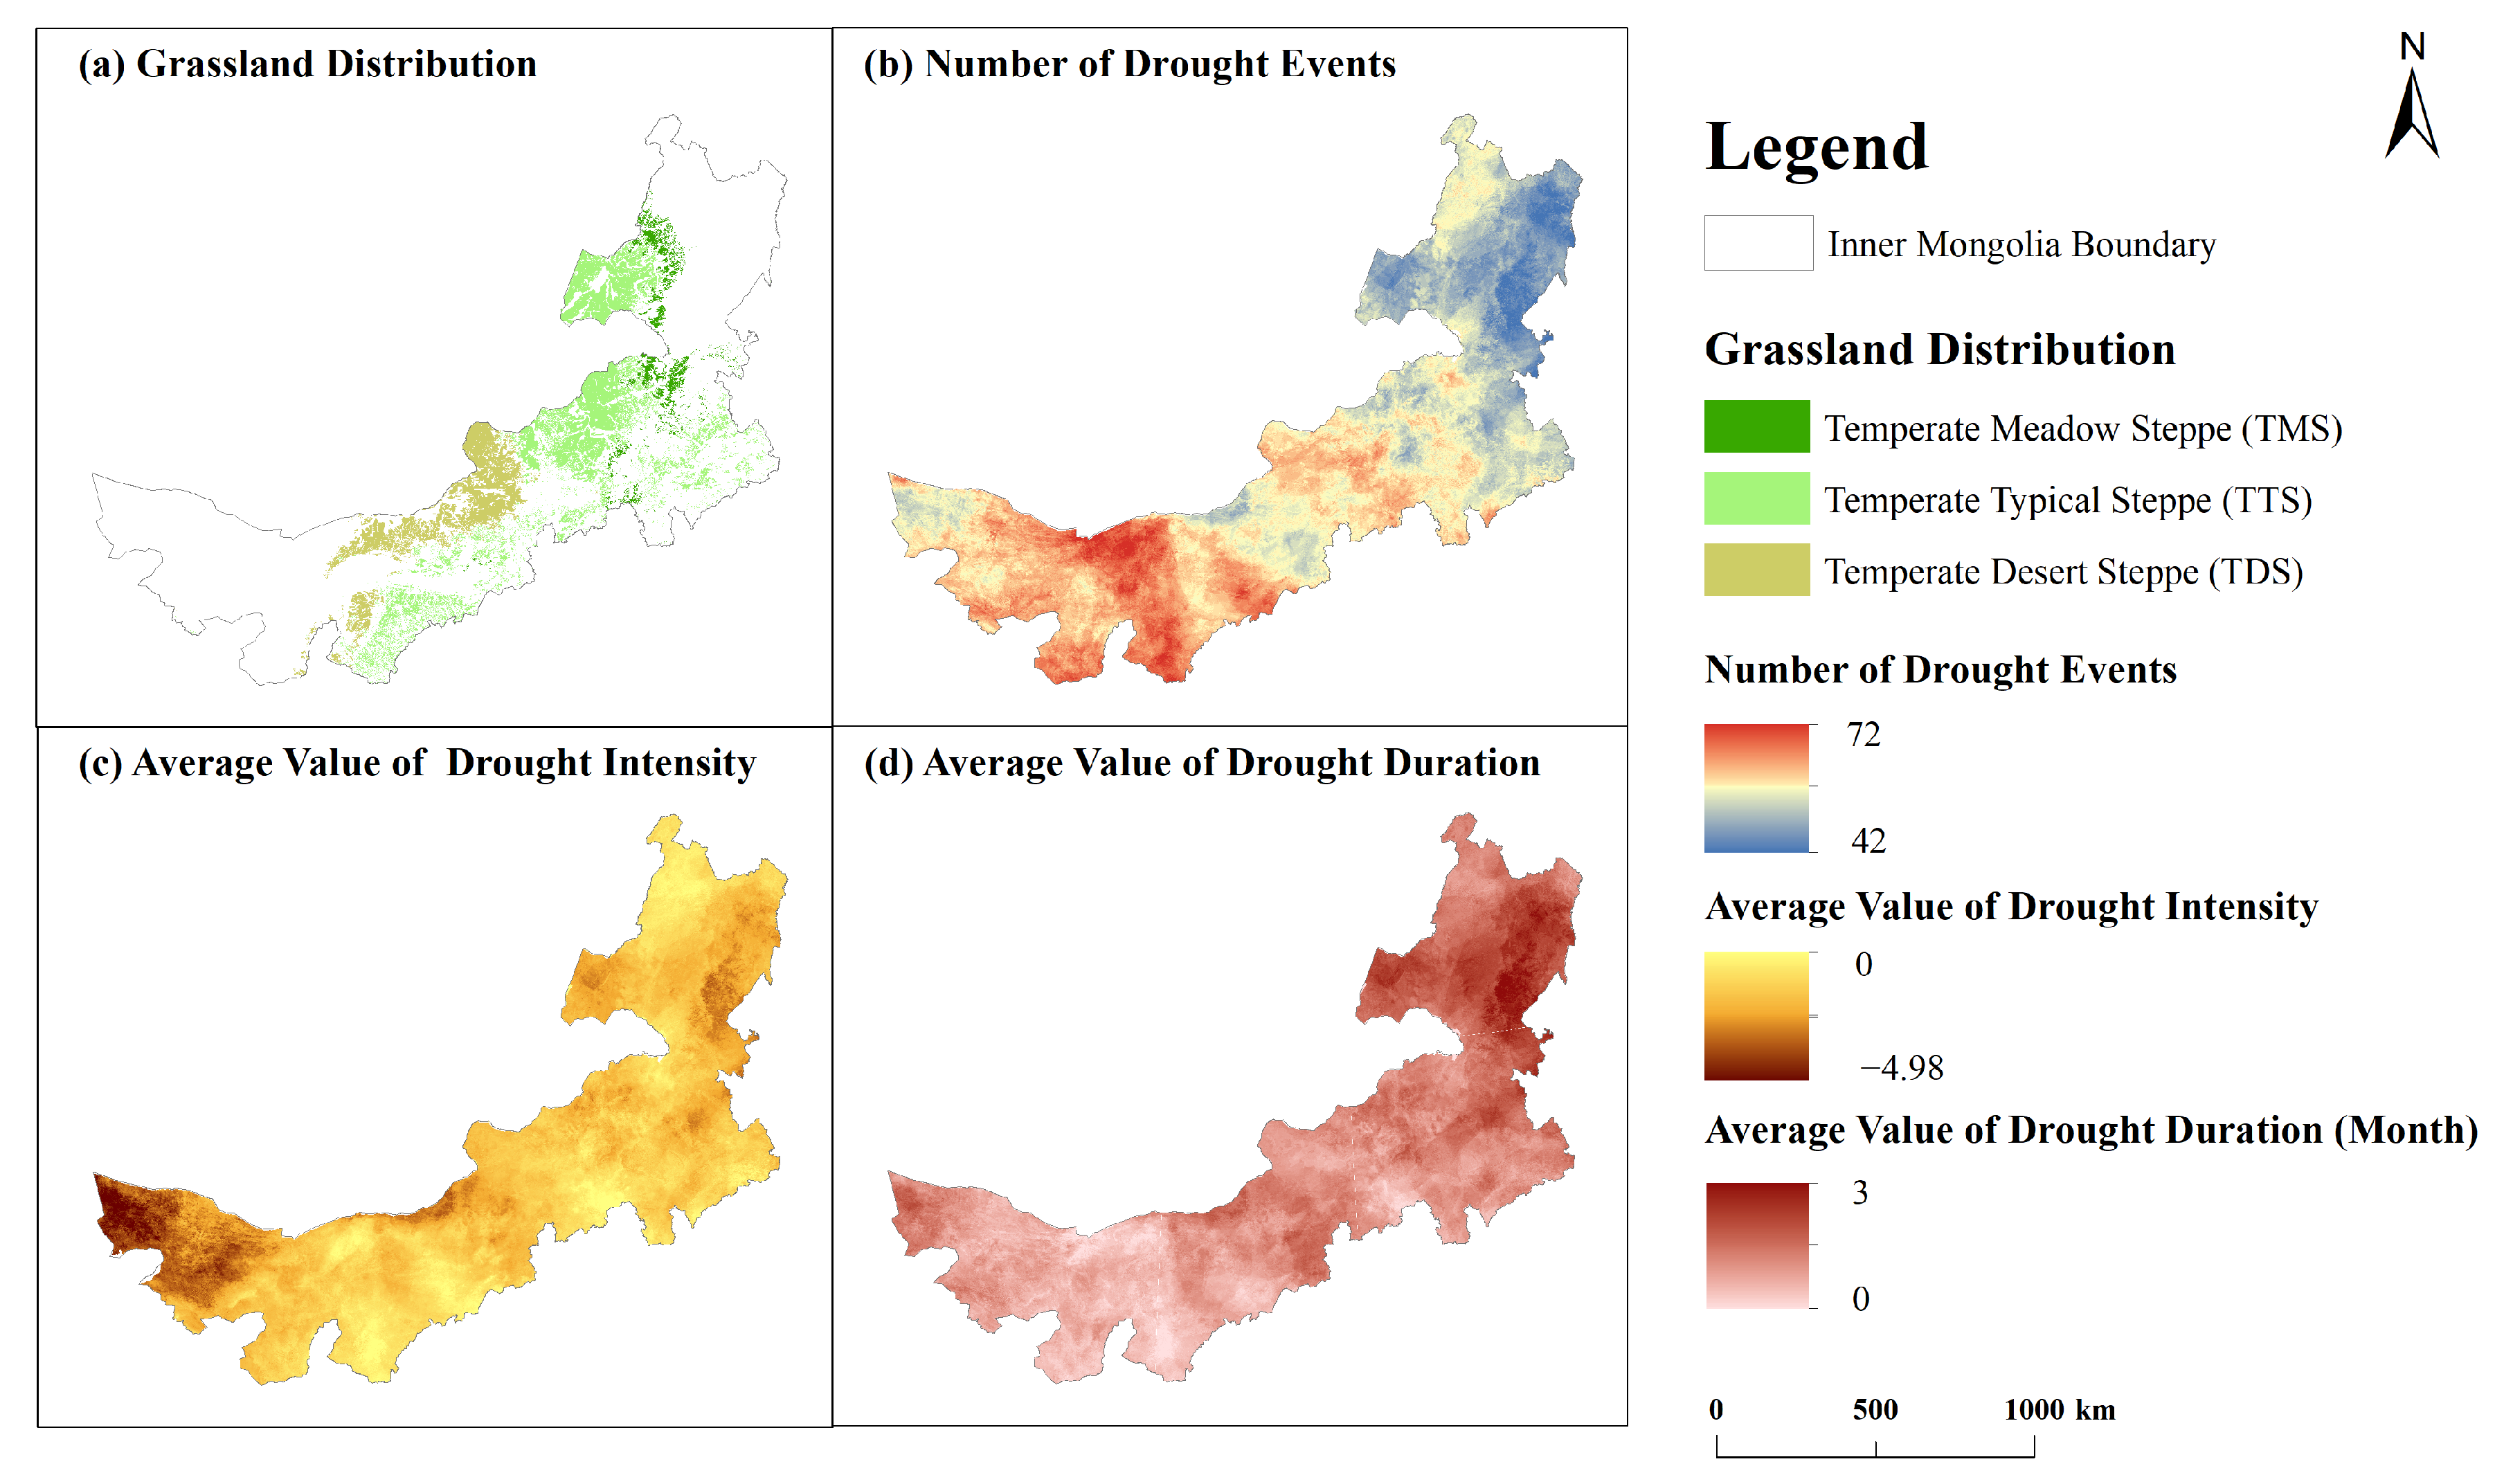
There are significant spatial variations in the number, intensity, and duration of drought events in the study area (Figure 4). The number of drought events ranges from 42 to 72 between 1998 and 2020. In the northeast, drought events are relatively infrequent, and generally have lower intensity and longer duration. This phenomenon is due to the relatively high precipitation, making the region less susceptible to drought events. In contrast, the western region experiences more frequent droughts with higher intensity and shorter duration, particularly in desert areas. This region lies in an arid zone with lower precipitation.
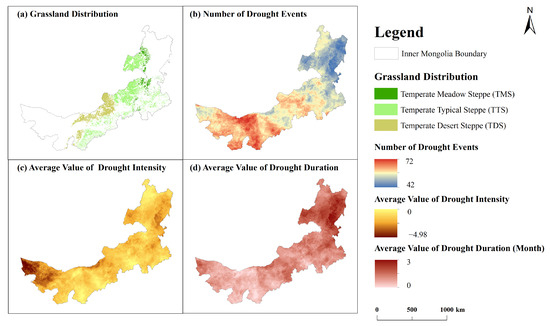
Figure 4.
Distribution of (a) three types of grassland, (b) number of drought events, (c) average value of drought intensity, and (d) average value of drought duration between 1998 and 2020.
The distribution of grasslands in Inner Mongolia shows spatial heterogeneity due to variations in climate, elevation, and soil conditions. These differences have also resulted in considerable regional variation in grassland phenology. For instance, the start and end of the growing season can vary by up to 100 days across grasslands from west to east [36,49]. The proportion of drought events during the non-growing season (from November to February) accounts for 29.76%, with an average drought duration of nearly two months. Due to the relatively short non-growing season, and the 2–3 months lag response of grasslands to drought [21,50], a drought during a non-growing season may affect grassland productivity in the following growing season, and vice versa. Considering this delayed and cumulative manner [22,51], the study did not distinguish between drought events occurring in the growing and non-growing seasons. The average intensity of drought events ranges from −1.8 to −2.6, while the average duration is primarily between 1.4 and 2.0 months (Figure 5). Drought events with an intensity of −2.18 and a duration of 1.7 months exhibit the highest distribution density, reflecting the severity of droughts in Inner Mongolia.
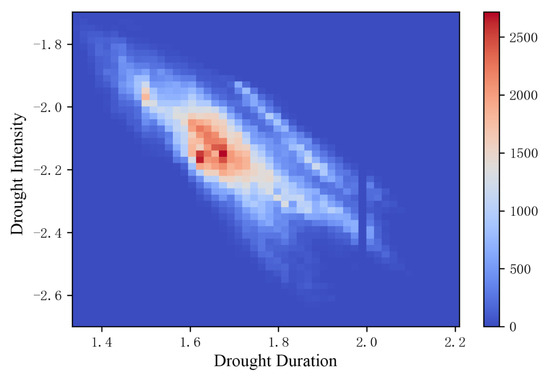
Figure 5.
Heat map of average duration-intensity of drought events from 1998 to 2020. The deeper red color corresponds to larger pixel number, while the bluest color corresponds to the minimum of pixel number.
Four drought patterns are identified: mild drought, moderate drought, severe drought, and extreme drought, based on drought intensity and the meteorological drought standard (GB/T20481-2017) [38]. Extreme drought constitutes the highest proportion among the different levels of drought intensity, accounting for 39.4% of all drought events, followed by mild drought at 26.2% (Table 1). In terms of duration, events lasting for 1–2 months make up 83.3% of all drought events, while those lasting for more than two months account for only 16.7%. These findings indicate that grasslands in the study area are more likely to experience drought events with short duration but high intensity. Based on the frequency of different drought intensities and durations, drought events in the grasslands are categorized into six distinct drought patterns: short-duration mild drought, short-duration moderate drought, short-duration severe drought, short-duration extreme drought, prolonged severe drought, and prolonged extreme drought.

Table 1.
Percentage of drought events with different intensities and durations.
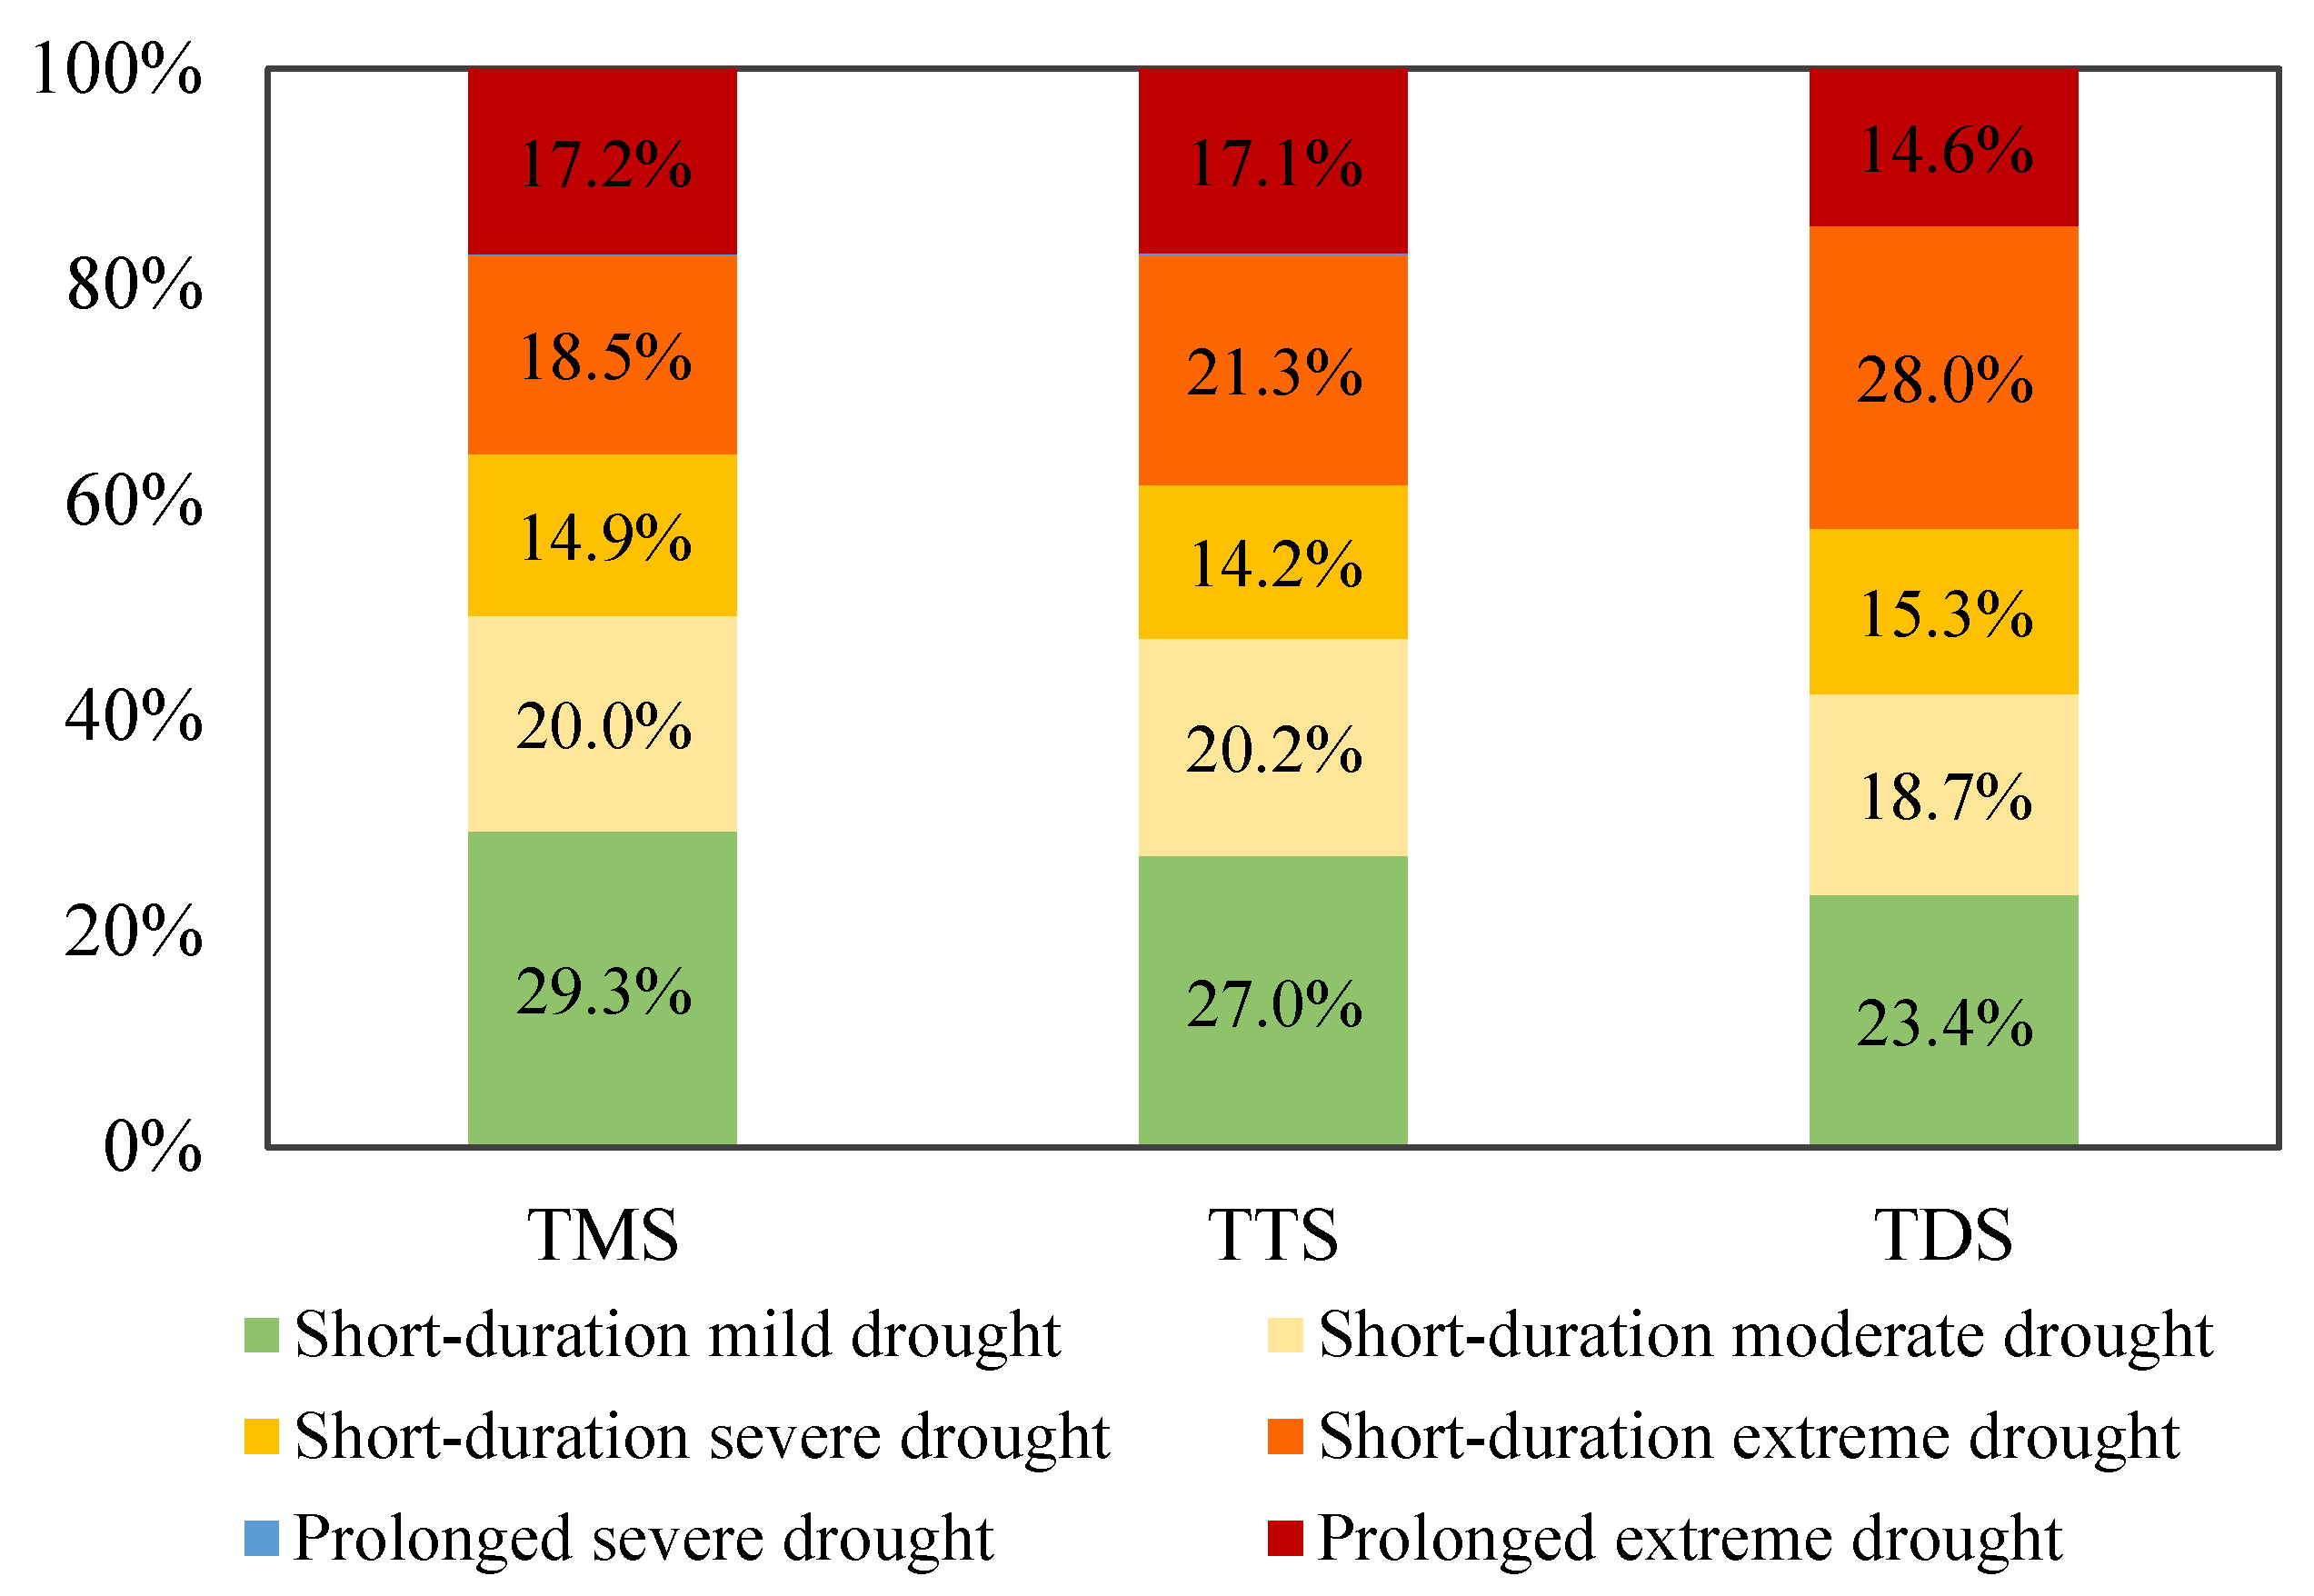
TMS and TTS exhibit the highest percentage of short-duration mild droughts among all drought patterns, accounting for 29.3% and 27%, respectively (Figure 6), which is attributed to their predominant distribution in the wetter regions of Inner Mongolia. Conversely, TDS shows the highest percentage of short-duration extreme drought events at 28%, followed by short-duration mild drought at 23.4%. The proportion of prolonged severe drought is less than 0.2% across all grassland types. However, this category is included in the classification as the sample comprised approximately 80,000 pixels. Moreover, the proportion of short-duration extreme drought gradually increases from TMS to TDS, while the proportion of prolonged extreme drought decreases correspondingly. This suggests that extreme drought events in TDS are more frequently caused by severe droughts occurring within one month, whereas extreme drought events in TMS are primarily driven by prolonged droughts compared to TDS.
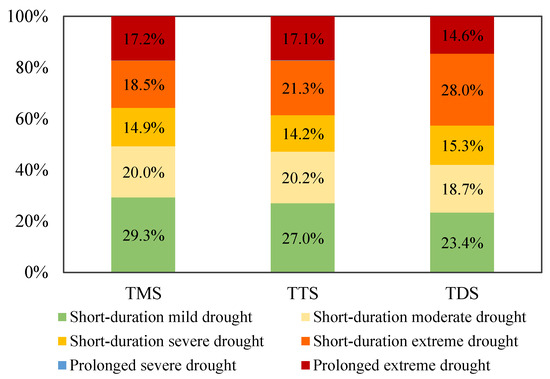
Figure 6.
Percentage of different drought patterns in different grassland types.
4.2. Overall Stability
4.2.1. Resistance
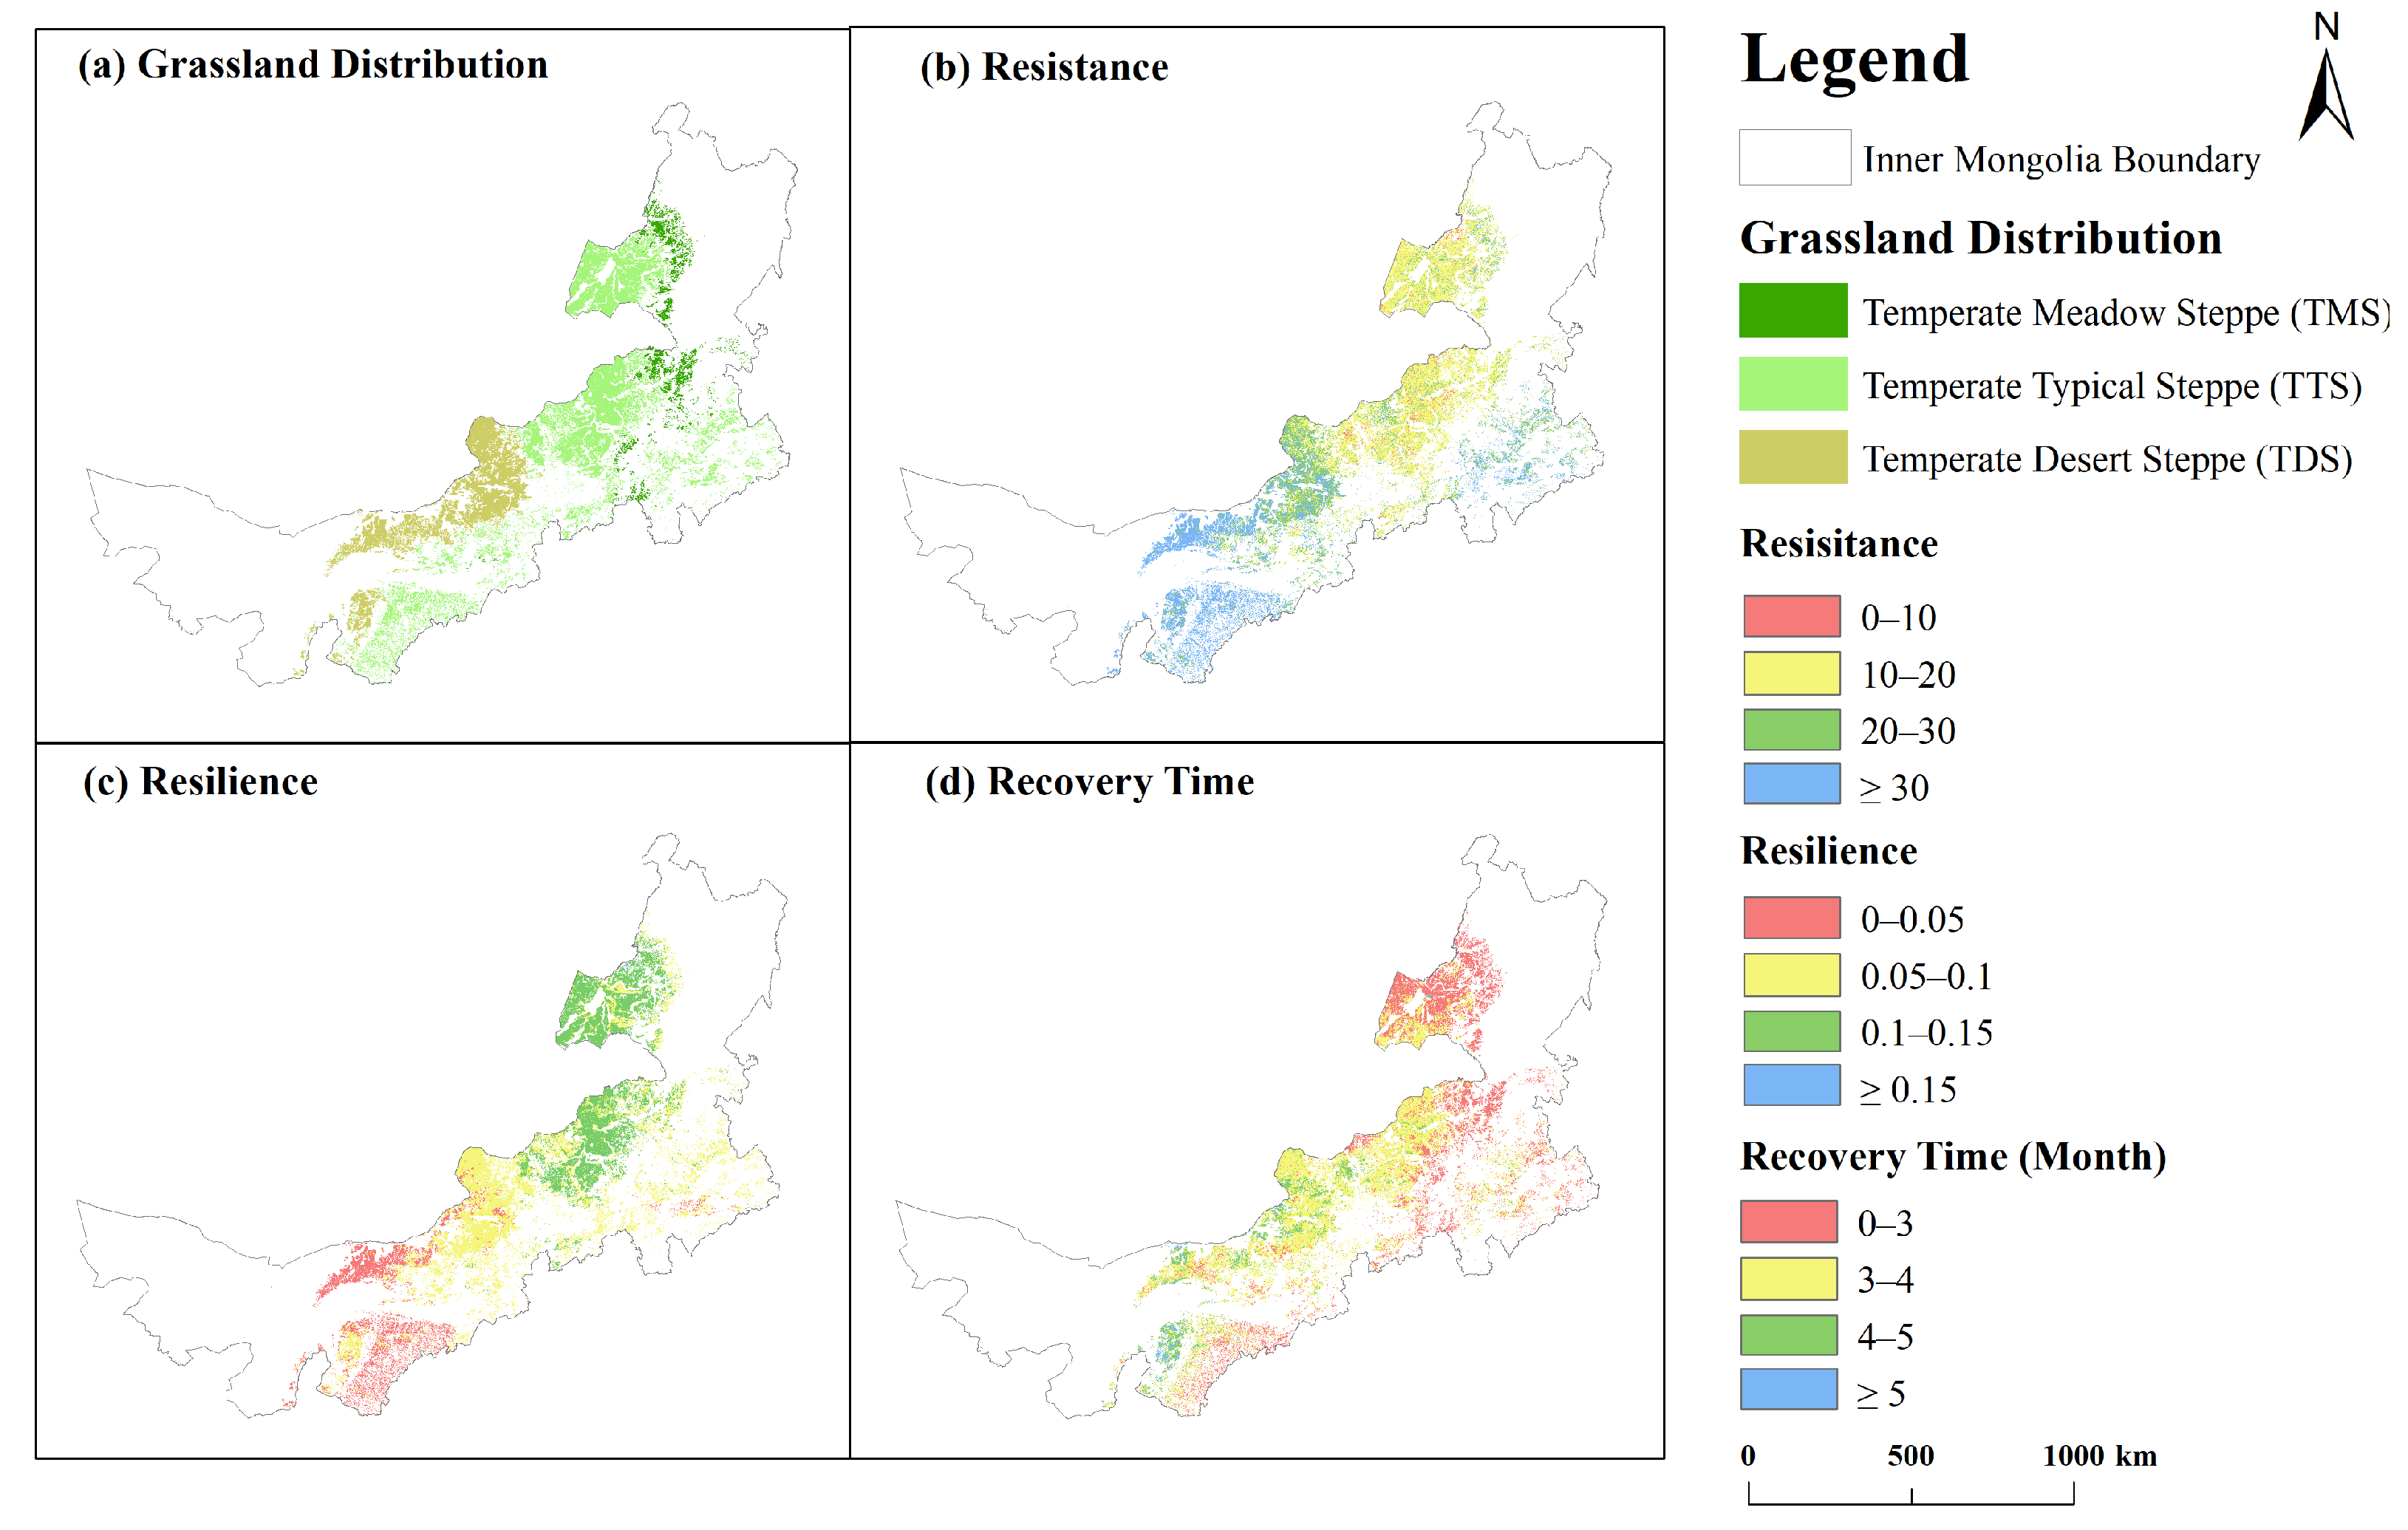
The resistance, resilience, and recovery time were quantified for all image pixels of different grassland types in the study area from 1998 to 2020. The grassland resistance is lower in the northeastern and center parts of the region, predominantly ranging from 10 to 20 (Figure 7). Conversely, it is higher in the southeastern and west-central grasslands, which could be attributed to the spatial distribution of mean temperature in the study area. In the northeastern and central regions, the mean temperature is relatively low, especially in winter. This results in slower plant metabolic rates and reduced efficiency in nutrient uptake and utilization in the cold environment. Additionally, the decrease in photosynthetic efficiency further impedes plant growth and diminishes overall immunity.
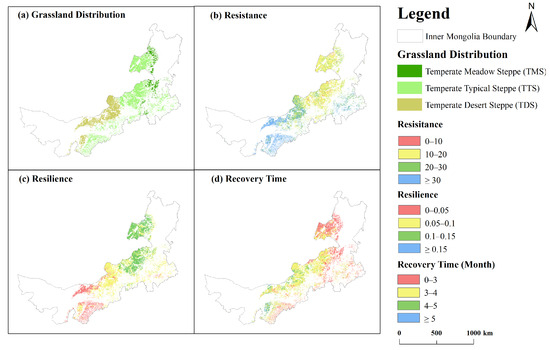
Figure 7.
The spatial distribution of (a) grassland types, (b) resistance. Dimensionless, and higher values indicate greater resistance. (c) resilience. Dimensionless, and higher values indicate greater resilience. And (d) recovery time (month) for each pixel.
The resistance for TDS is primarily distributed between 22.57 and 40.29, while for TTS, it mainly ranges from 13.88 to 27.37. The resistance for TMS is predominantly distributed between 14.33 and 21.07. Overall, TDS exhibits the highest resistance, with a median of 29.81, followed by TTS with a median of 17.67, while TMS shows the lowest resistance with a median of 17.11.
The variation in resistance can be attributed to the drought-tolerant plants in TDS, which have adapted to the local climate [52]. The dominant species in TDS exhibit high drought resistance and water-use efficiency, contributing to their elevated resistance levels. Huang, et al. [53] found no significant differences in resistance and resilience among grassland types in Inner Mongolia, which differs from our findings. This discrepancy can be explained by the fact that they used SPEI at 0.5° resolution to determine drought events and annual-scale vegetation index data to quantify stability, making it difficult to observe detailed spatial differences.
4.2.2. Resilience
The resilience and resistance of grasslands in the study area exhibit opposite patterns. Grasslands in the northeastern and central parts of the region show high resilience, primarily ranging from 0.1 to 0.15, while grasslands in the southeastern and western parts display low resilience, mainly distributed between 0 and 0.1. Overall, TMS exhibits the highest resilience with a median of 0.099, followed by TTS with a median of 0.098, while TDS has the lowest resilience, with a median of 0.057.
Notably, despite the low resistance of TMS, the plants quickly resume growth and metabolic rates, demonstrating high resilience. In a study conducted by Yao, et al. [54] comparing the resistance and resilience of forest and grassland ecosystems in humid, semi-humid, and semi-arid zones in China, it was found that forest ecosystems exhibit higher resistance, while grassland ecosystems display higher resilience. Drought-tolerant vegetation occupies a wider ecological niche in areas with drier climates, but it recovers more slowly due to water and nutrient limitations under harsh climatic conditions [55,56]. Moreover, since vegetation with low resilience tends to require higher resistance to cope with external climate change, it is inferred that resistance is negatively correlated with resilience. This conclusion is also supported in different grassland ecosystems in Inner Mongolia, despite the different methods used to quantify resistance and resilience.
4.2.3. Recovery Time
The recovery time of grasslands in the study area is shorter in the northeastern and southern regions, typically within 3 months. The central grasslands have an average recovery time ranging from 3 to 4 months, while grasslands in the western region take longer, with recovery times exceeding 4 months. Statistically, TMS displays the shortest recovery time, with a median of 2.6 months, followed by TTS with a median of 3.2 months. On the other hand, TDS has the longest recovery time, with a median of 3.7 months. The length of recovery time is closely related to the drought intensity and duration, as TDS experiences more prolonged extreme drought events, leading to a longer recovery period.
Moreover, recovery time also depends on post-drought meteorological conditions. A more favorable meteorological period following a drought would support grassland recovery to a greater extent than a less favorable period. TMS and TTS, located in semi-humid and semi-arid zones, receive more annual precipitation in their growing areas. After a drought, favorable precipitation conditions allow for rapid moisture uptake, facilitating quicker recovery and a shorter recovery time compared to TDS. Previous studies have also indicated that grassland ecosystems in arid regions may recover more slowly due to natural environmental constraints and more severe drought conditions [57].
4.3. Stability Under Different Drought Patterns
As other studies have suggested a quick recovery in grasslands following short-term droughts over the past decade [58,59], we selected four relatively severe drought patterns (short-duration severe drought, short-duration extreme drought, prolonged severe drought, and prolonged extreme drought) out of the six identified patterns for analysis.
4.3.1. Resistance
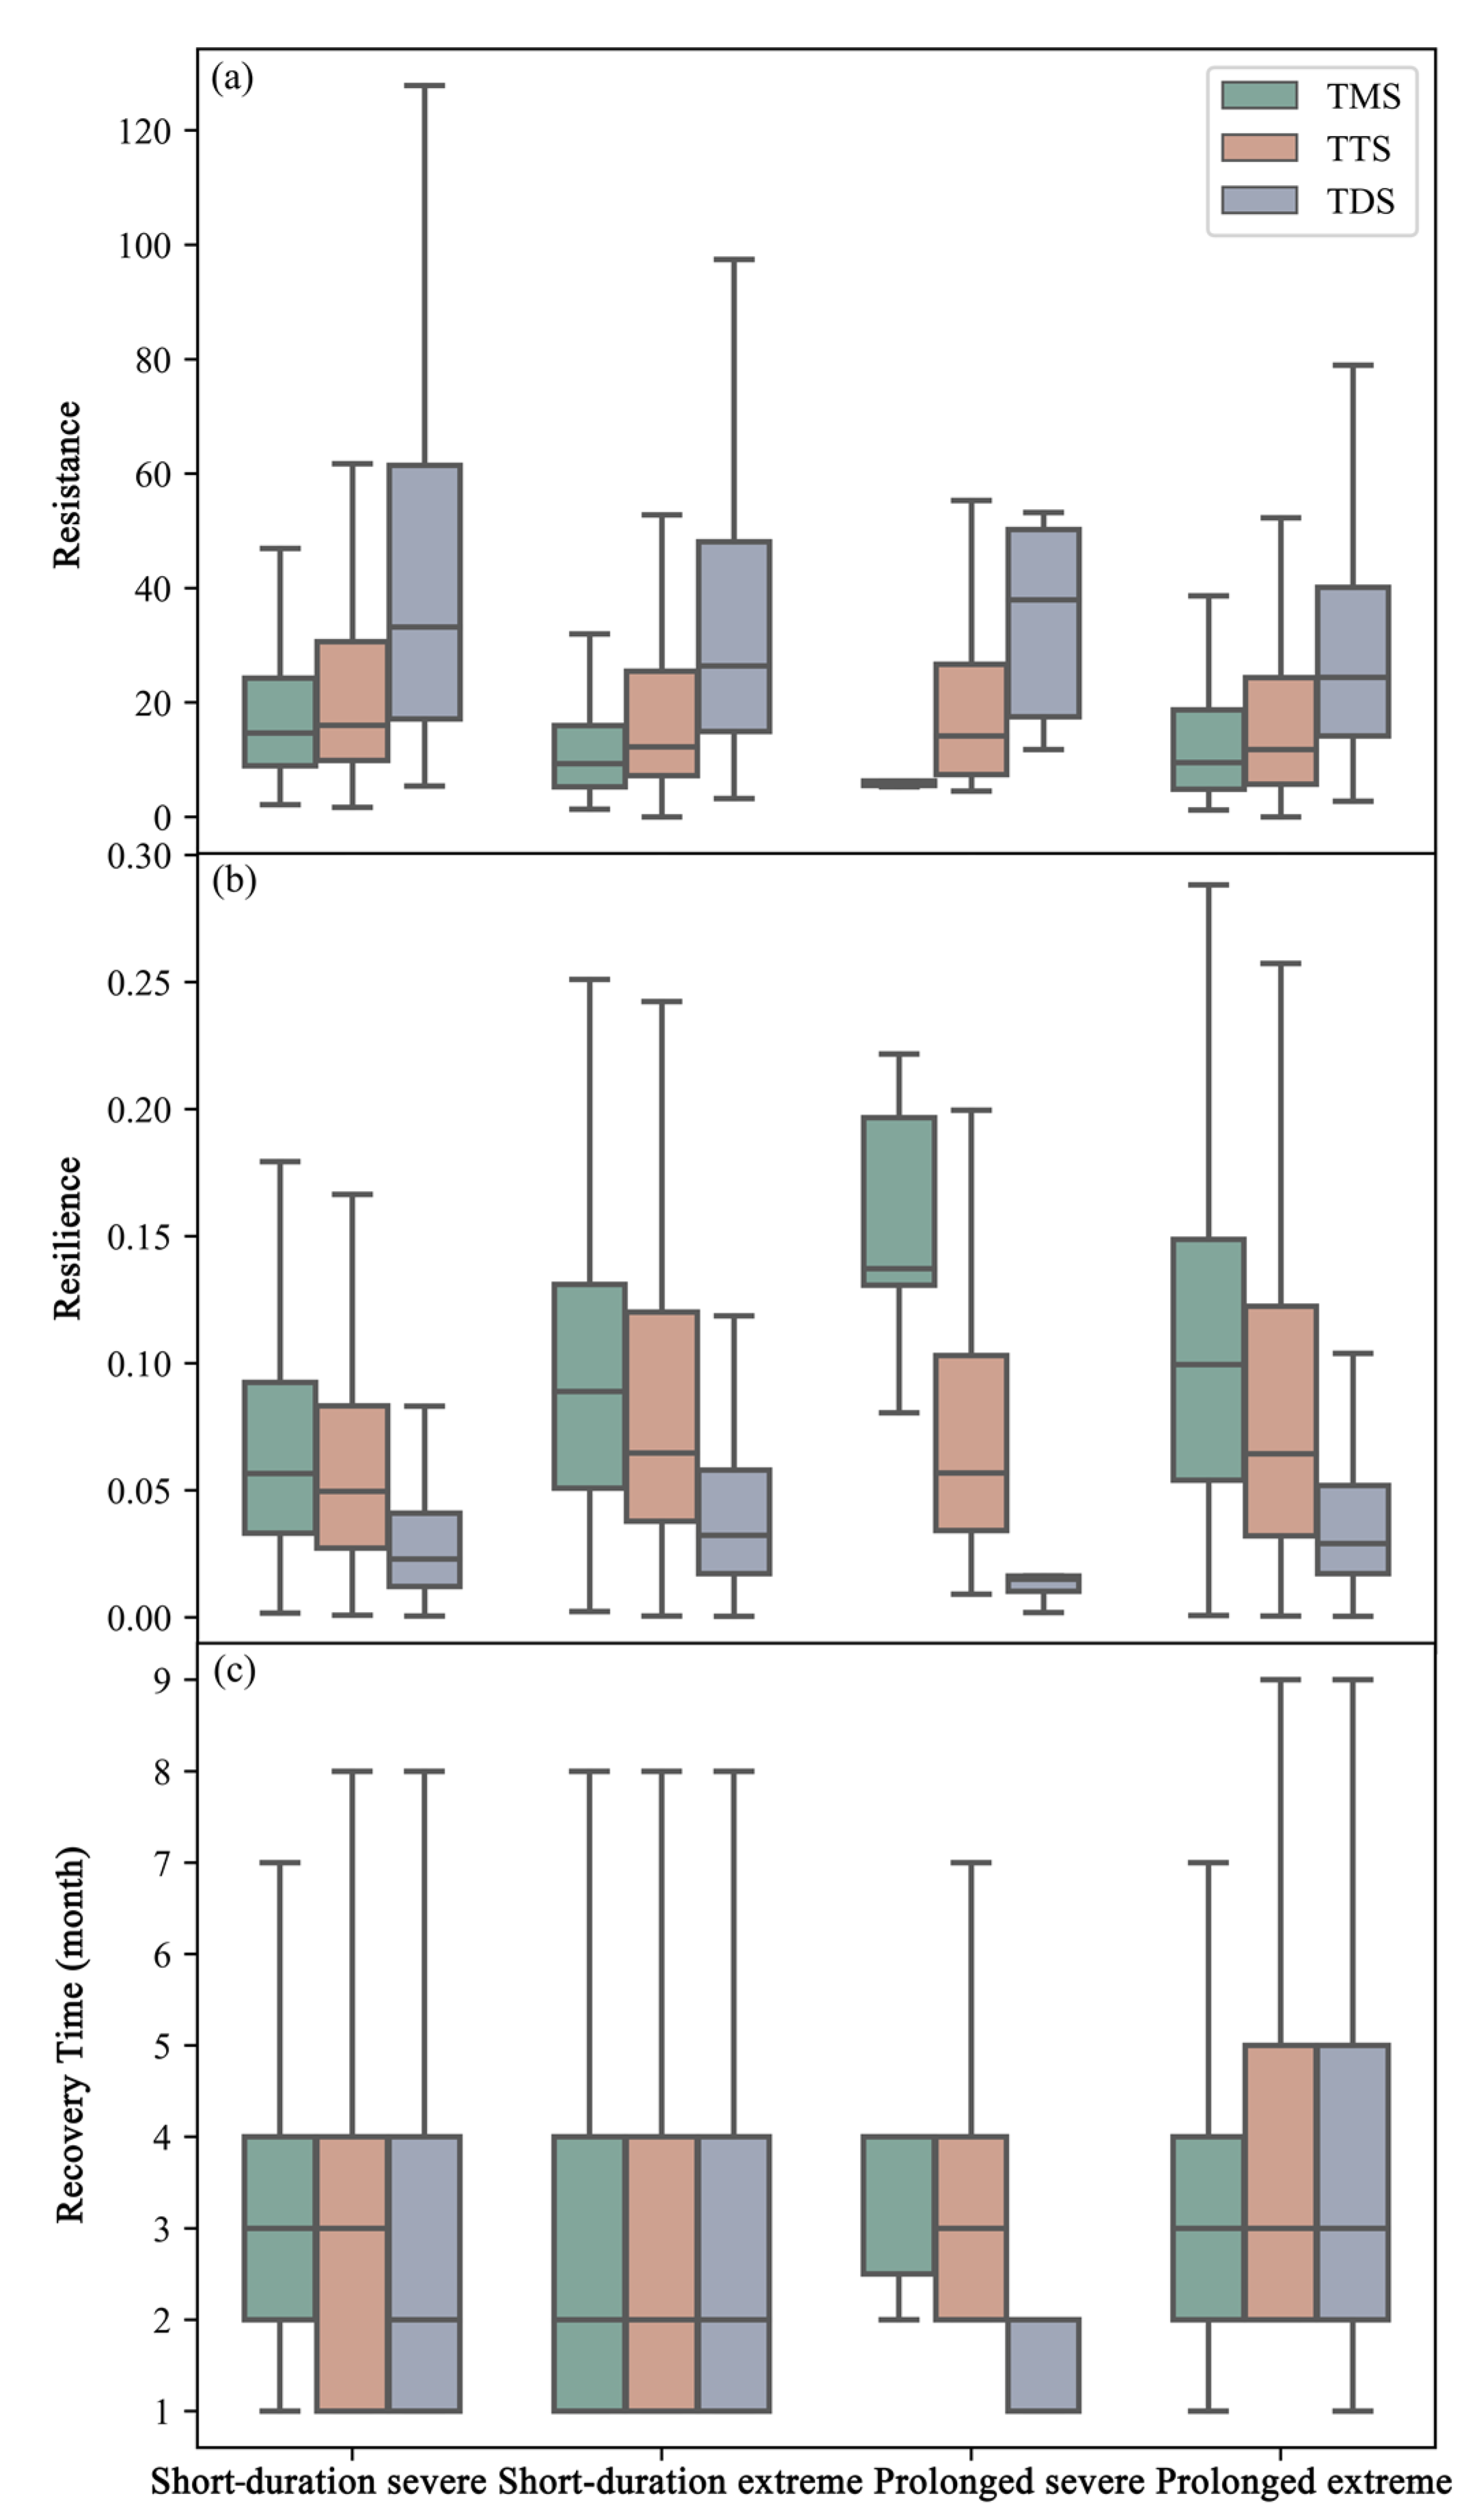
Upon further comparison of the stability indicators for different grassland types under various drought patterns, it is observed that, regardless of the drought pattern, the resistance follows this trend: TDS > TTS > TMS (Figure 8a).
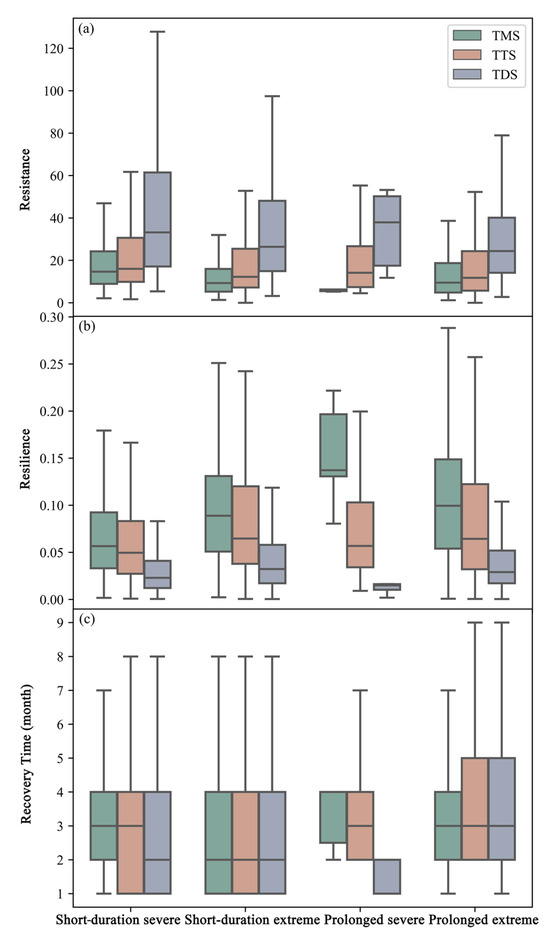
Figure 8.
Distribution of the (a) resistance, (b) resilience, and (c) recovery time of different grassland types under different drought patterns.
However, there are some variations in the resistance of different grassland types under different drought patterns. For TMS, the resistance ranks as follows: short-duration severe drought > prolonged extreme drought > short-duration extreme drought > prolonged severe drought. For TTS, the ranking is short-duration severe drought > prolonged severe drought > short-duration extreme drought > prolonged extreme drought. For TDS, the resistance follows this order: prolonged severe drought > short-duration severe drought > short-duration extreme drought > prolonged extreme drought.
All three grassland types are relatively vulnerable to extreme drought events. However, TMS and TTS exhibit the highest resistance to short-duration severe drought events (with −1.5 < drought intensity ≤ −2, and duration within 2 months). It suggests that such drought conditions may trigger defense mechanisms in these grasslands. Nevertheless, due to the prolonged exposure to semi-humid and semi-arid conditions, these grasslands may face challenges in resisting droughts with an intensity lower than −2 and a duration exceeding 2 months.
In contrast, TDS displays the strongest resistance to prolonged severe droughts, which can be attributed to its adaptation to the high frequency of drought events, allowing it to endure longer drought periods compared to other grassland types. Furthermore, the experimental findings of Pfisterer and Schmid [60] support the notion that ecosystems with lower species diversity tend to exhibit higher resistance to drought disturbances than those with higher species diversity.
4.3.2. Resilience
The resilience of different grassland types under the same drought pattern generally shows an inverse relationship to their resistance, with TMS > TTS > TDS (Figure 8b). Since TDS exhibits the lowest resilience, it may be particularly vulnerable to damage if future extreme drought events exceed its resilience threshold. Therefore, it is essential to prioritize the conservation of TDS.
The resilience characteristics of different grassland types also vary under different drought patterns. For TMS, resilience is ranked as follows: prolonged severe drought > prolonged extreme drought > short-duration extreme drought > short-duration severe drought. The resilience of TTS is ranked as short-duration extreme drought > prolonged extreme drought > prolonged severe drought > short-duration severe drought. The resilience of TDS is ranked as short-duration extreme drought > prolonged extreme drought > short-duration severe drought > prolonged severe drought.
The higher resilience of TMS during prolonged drought events may be attributed to its adaptation to the longer average duration of drought events. This grassland type is better equipped to withstand prolonged droughts, aided by the semi-humid climate, which facilitates more effective recovery after prolonged drought events. Additionally, both TTS and TDS exhibit higher resilience in response to extreme droughts compared to severe droughts.
4.3.3. Recovery Time
In this study, we analyzed the recovery time of different grassland ecosystems in the study area and found no significant differences among the recovery time of various grassland types under the same drought pattern (Figure 8c). Particularly for short-duration droughts, all grassland types generally recover within 1–4 months. Although longer drought episodes increase the likelihood of prolonged recovery, most grasslands can achieve recovery within 5 months, even after prolonged droughts [61]. In contrast, Schwalm, et al. [14] found that the recovery time in arid regions with low precipitation (<500 mm) increases as precipitation decreases. The lack of distinction in the recovery time could be attributed to the influence of various external factors, including environmental conditions and human activities. Overall, grasslands tend to recover more quickly from the effects of drought than other vegetation types. For future studies, it might be necessary to quantify recovery time using data with higher temporal resolution, such as daily values.
Considering both drought intensity and duration, this study analyzed the differences in the stability of different grasslands in response to drought in Inner Mongolia at a spatial scale of 1 km and a temporal scale of one month. Although we have removed the influence of non-drought factors by limiting the timing of drought events, we cannot completely rule out anthropogenic influences at this stage. Due to the shallow roots of grasslands, their physiological activities rely on soil moisture in the surface layer, making them sensitive to rainfall and temperature dynamics [62]. However, they are also affected by human activities and soil properties. For example, China has implemented a series of grassland policies that have produced positive outcomes [63]. Soils mitigate the effects of drought by capturing and storing precipitation for plant roots [64]. Soil pH and soil organic carbon stock are two important factors influencing the likelihood of vegetation decline under drought conditions [65]. Future research could incorporate these factors and combine them with climate models to predict changes in the stability of different ecosystems.
5. Conclusions
This study uncovered the response of the stability (resistance, resilience, and recovery time) of grasslands to different drought patterns, by combining SPEI and SPOT-VGT NDVI data on a monthly scale. Six distinct drought patterns were identified based on drought intensity and duration. Our key findings are as follows: First, TDS in western Inner Mongolia experienced more severe droughts than TMS and TTS in eastern and central Inner Mongolia from 1998 to 2020, with the highest frequency of prolonged extreme drought events. Second, stability indicators vary among these grasslands; TMS has the lowest resistance but the highest resilience, while TDS shows the opposite trend, revealing a trade-off between resilience and resistance. Third, grassland ecosystems can recover from drought quickly (within five months from the onset of the drought) despite their vulnerability to drought. However, given that TDS may face more severe droughts in the future, enhanced protection is necessary. Our research contributes to the future policy formulation aimed at improving the stability of grassland ecosystems. Future studies should focus on detecting differences in recovery times across grasslands using higher temporal resolution data. Additionally, more refined research is needed, such as examining how post-drought meteorological conditions affect grassland recovery and investigating the effects of drought on grasslands during growing and non-growing seasons, considering different climatic zones and grassland types.
Author Contributions
Conceptualization, H.Y. and L.Z.; methodology, H.Y., L.Z. and X.H.; software, H.Y. and X.H.; validation, H.Y. and Y.Z.; formal analysis, H.Y., X.H. and Y.C.; investigation, F.L.; resources, L.Z. and F.L.; data curation, H.Y. and Y.Z; writing—original draft preparation, H.Y. and L.Z.; writing—review and editing, Y.C. and L.Z.; visualization, X.H. and Y.Z.; supervision, L.Z. and Y.C.; project administration, L.Z.; funding acquisition, L.Z. All authors have read and agreed to the published version of the manuscript.
Funding
This research was funded by National Natural Science Foundation of China (42271082) and the National Key R&D Program of China (2021YFE0117500).
Data Availability Statement
The data presented in this study are available on request from the corresponding author.
Conflicts of Interest
The authors declare no conflicts of interest.
References
- Pennekamp, F.; Pontarp, M.; Tabi, A.; Altermatt, F.; Alther, R.; Choffat, Y.; Fronhofer, E.A.; Ganesanandamoorthy, P.; Garnier, A.; Griffiths, J.I.; et al. Biodiversity increases and decreases ecosystem stability. Nature 2018, 563, 109–112. [Google Scholar] [CrossRef] [PubMed]
- Vicente-Serrano, S.M.; Quiring, S.M.; Peña-Gallardo, M.; Yuan, S.; Domínguez-Castro, F. A review of environmental droughts: Increased risk under global warming? Earth-Sci. Rev. 2020, 201, 102953. [Google Scholar] [CrossRef]
- Robinson, D.A.; Jones, S.B.; Lebron, I.; Reinsch, S.; Domínguez, M.T.; Smith, A.R.; Jones, D.L.; Marshall, M.R.; Emmett, B.A. Experimental evidence for drought induced alternative stable states of soil moisture. Sci. Rep. 2016, 6, 20018. [Google Scholar] [CrossRef]
- Hänke, H.; Börjeson, L.; Hylander, K.; Enfors-Kautsky, E. Drought tolerant species dominate as rainfall and tree cover returns in the West African Sahel. Land Use Policy 2016, 2016, 111–120. [Google Scholar] [CrossRef]
- Sitch, S.; Huntingford, C.; Gedney, N.; Levy, P.E.; Lomas, M.; Piao, S.L.; Betts, R.; Ciais, P.; Cox, P.; Friedlingstein, P.; et al. Evaluation of the terrestrial carbon cycle, future plant geography and climate-carbon cycle feedbacks using five Dynamic Global Vegetation Models (DGVMs). Glob. Change Biol. 2008, 14, 2015–2039. [Google Scholar] [CrossRef]
- Reichstein, M.; Bahn, M.; Ciais, P.; Frank, D.; Mahecha, M.; Seneviratne, S.; Zscheischler, J.; Beer, C.; Buchmann, N.; Frank, D.; et al. Climate extremes and the carbon cycle. Nature 2013, 500, 287–295. [Google Scholar] [CrossRef]
- Huang, K.; Xia, J. High ecosystem stability of evergreen broadleaf forests under severe droughts. Glob. Change Biol. 2019, 25, 3494–3503. [Google Scholar] [CrossRef]
- Pimm, S.L. The complexity and stability of ecosystems. Nature 1984, 307, 321–326. [Google Scholar] [CrossRef]
- Ivits, E.; Horion, S.; Erhard, M.; Fensholt, R. Assessing European ecosystem stability to drought in the vegetation growing season. Glob. Ecol. Biogeogr. 2016, 25, 1131–1143. [Google Scholar] [CrossRef]
- Jia, Y.; van der Heijden, M.G.A.; Wagg, C.; Feng, G.; Walder, F. Symbiotic soil fungi enhance resistance and resilience of an experimental grassland to drought and nitrogen deposition. J. Ecol. 2021, 109, 3171–3181. [Google Scholar] [CrossRef]
- Nimmo, D.G.; Mac Nally, R.; Cunningham, S.C.; Haslem, A.; Bennett, A.F. Vive la résistance: Reviving resistance for 21st century conservation. Trends Ecol. Evol. 2015, 30, 516–523. [Google Scholar] [CrossRef] [PubMed]
- Fu, Z.; Li, D.; Hararuk, O.; Schwalm, C.; Luo, Y.; Yan, L.; Niu, S. Recovery time and state change of terrestrial carbon cycle after disturbance. Environ. Res. Lett. 2017, 12, 104004. [Google Scholar] [CrossRef]
- Gazol, A.; Camarero, J.J.; Vicente-Serrano, S.M.; Sánchez-Salguero, R.; Gutiérrez, E.; de Luis, M.; Sangüesa-Barreda, G.; Novak, K.; Rozas, V.; Tíscar, P.A.; et al. Forest resilience to drought varies across biomes. Glob. Change Biol. 2018, 24, 2143–2158. [Google Scholar] [CrossRef] [PubMed]
- Schwalm, C.R.; Anderegg, W.R.L.; Michalak, A.M.; Fisher, J.B.; Biondi, F.; Koch, G.; Litvak, M.; Ogle, K.; Shaw, J.D.; Wolf, A.; et al. Global patterns of drought recovery. Nature 2017, 548, 202–205. [Google Scholar] [CrossRef]
- Bazzichetto, M.; Sperandii, M.G.; Penone, C.; Keil, P.; Allan, E.; Lepš, J.; Prati, D.; Fischer, M.; Bolliger, R.; Gossner, M.M.; et al. Biodiversity promotes resistance but dominant species shape recovery of grasslands under extreme drought. J. Ecol. 2024, 112, 1087–1100. [Google Scholar] [CrossRef]
- Lu, M.; Sun, H.; Cheng, L.; Li, S.; Qin, H.; Yi, S.; Zhang, H.; Zhang, W. Heterogeneity in vegetation recovery rates post-flash droughts across different ecosystems. Environ. Res. Lett. 2024, 19, 074028. [Google Scholar] [CrossRef]
- Xu, H.; Wang, X.; Zhao, C.; Yang, X. Diverse responses of vegetation growth to meteorological drought across climate zones and land biomes in northern China from 1981 to 2014. Agric. For. Meteorol. 2018, 262, 1–13. [Google Scholar] [CrossRef]
- Isbell, F.; Craven, D.; Connolly, J.; Loreau, M.; Schmid, B.; Beierkuhnlein, C.; Bezemer, T.M.; Bonin, C.; Bruelheide, H.; de Luca, E.; et al. Biodiversity increases the resistance of ecosystem productivity to climate extremes. Nature 2015, 526, 574–577. [Google Scholar] [CrossRef]
- Lv, Y.; He, H.; Ren, X.; Zhang, L.; Qin, K.; Wu, X.; Niu, Z.; Feng, L.; Xu, Q.; Zhang, M. High resistance of deciduous forests and high recovery rate of evergreen forests under moderate droughts in China. Ecol. Indic. 2022, 144, 109469. [Google Scholar] [CrossRef]
- Liu, L.; Guan, J.; Zheng, J.; Wang, Y.; Han, W.; Liu, Y. Cumulative effects of drought have an impact on net primary productivity stability in Central Asian grasslands. J. Environ. Manag. 2023, 344, 118734. [Google Scholar] [CrossRef]
- Zhao, A.; Yu, Q.; Feng, L.; Zhang, A.; Pei, T. Evaluating the cumulative and time-lag effects of drought on grassland vegetation: A case study in the Chinese Loess Plateau. J. Environ. Manag. 2020, 261, 110214. [Google Scholar] [CrossRef] [PubMed]
- Wei, Y.; Zhu, L.; Chen, Y.; Cao, X.; Yu, H. Spatiotemporal Variations in Drought and Vegetation Response in Inner Mongolia from 1982 to 2019. Remote Sens. 2022, 14, 3803. [Google Scholar] [CrossRef]
- Li, X.; Li, Y.; Chen, A.; Gao, M.; Slette, I.J.; Piao, S. The impact of the 2009/2010 drought on vegetation growth and terrestrial carbon balance in Southwest China. Agric. For. Meteorol. 2019, 269–270, 239–248. [Google Scholar] [CrossRef]
- Wang, X.; Xu, T.; Xu, C.; Liu, H.; Chen, Z.; Li, Z.; Li, X.; Wu, X. Enhanced growth resistance but no decline in growth resilience under long-term extreme droughts. Glob. Change Biol. 2024, 30, e17038. [Google Scholar] [CrossRef] [PubMed]
- Hoover, D.L.; Pfennigwerth, A.A.; Duniway, M.C. Drought resistance and resilience: The role of soil moisture–plant interactions and legacies in a dryland ecosystem. J. Ecol. 2021, 109, 3280–3294. [Google Scholar] [CrossRef]
- Gumus, V. Evaluating the effect of the SPI and SPEI methods on drought monitoring over Turkey. J. Hydrol. 2023, 626, 130386. [Google Scholar] [CrossRef]
- Jiang, L.; Liu, W.; Liu, B.; Yuan, Y.; Bao, A. Monitoring vegetation sensitivity to drought events in China. Sci. Total Environ. 2023, 893, 164917. [Google Scholar] [CrossRef]
- Wu, C.; Zhong, L.; Yeh, P.J.F.; Gong, Z.; Lv, W.; Chen, B.; Zhou, J.; Li, J.; Wang, S. An evaluation framework for quantifying vegetation loss and recovery in response to meteorological drought based on SPEI and NDVI. Sci. Total Environ. 2024, 906, 167632. [Google Scholar] [CrossRef]
- You, C.; Wang, Y.; Tan, X.; Cui, E.; Zhang, B.; Bian, C.; Chen, B.; Xu, M.; Han, X.; Xia, J.; et al. Inner Mongolia grasslands act as a weak regional carbon sink: A new estimation based on upscaling eddy covariance observations. Agric. For. Meteorol. 2023, 342, 109719. [Google Scholar] [CrossRef]
- Su, R.; Yu, T.; Dayananda, B.; Bu, R.; Su, J.; Fan, Q. Impact of climate change on primary production of Inner Mongolian grasslands. Glob. Ecol. Conserv. 2020, 22, e00928. [Google Scholar] [CrossRef]
- Yin, H.; Zhang, Z.; Zhang, W.; Lai, H.; Wang, F. Using Vegetation Health Index to Calculate Spatiotemporal Variation in Drought and Its Determinants in Inner Mongolia. J. Irrig. Drain. 2023, 42, 80–89. [Google Scholar]
- Wang, S. Soil Moisture Retrieval and Drought Monitoring and Vegetation Response Based on Multi-Source Remote Sensing and Machine Learning Algorithm. Ph.D. Thesis, Inner Mongolia Agricultural University, Hohhot, China, 2022. [Google Scholar]
- Miao, B.; Liang, C.; Han, F.; Liang, M.; Zhang, Z. Responses of phenology to climate change over the major grassland types. Acta Ecol. Sin. 2016, 36, 7689–7701. [Google Scholar]
- Peng, S.; Gang, C.; Cao, Y.; Chen, Y. Assessment of climate change trends over the Loess Plateau in China from 1901 to 2100. Int. J. Climatol. 2018, 38, 2250–2264. [Google Scholar] [CrossRef]
- Peng, S.; Ding, Y.; Liu, W.; Li, Z. 1km monthly temperature and precipitation dataset for China from 1901 to 2017. Earth Syst. Sci. Data 2019, 11, 1931–1946. [Google Scholar] [CrossRef]
- Yu, H.; Zhu, L.; Chen, Y.; Yue, Z.; Zhu, Y. Improving grassland classification accuracy using optimal spectral-phenological-topographic features in combination with machine learning algorithm. Ecol. Indic. 2024, 158, 111392. [Google Scholar] [CrossRef]
- Zhang, X.; Sun, S.; Yong, S.; Zhou, Z.; Wang, R. Vegetation map of the People’s Republic of China (1:1000000); Geology Publishing House: Beijing, China, 2007. [Google Scholar]
- GB/T 20481-2017; Grades of Meteorological Drought. General Administration of Quality Supervision, Inspection and Quarantine of the People Republic of China, China National Standardization Administration Committee: Beijing, China, 2017.
- Vicente-Serrano, S.M.; Beguería, S.; López-Moreno, J.I. A Multiscalar Drought Index Sensitive to Global Warming: The Standardized Precipitation Evapotranspiration Index. J. Clim. 2010, 23, 1696–1718. [Google Scholar] [CrossRef]
- Lloyd-Hughes, B.; Saunders, M.A. A drought climatology for Europe. Int. J. Climatol. 2002, 22, 1571–1592. [Google Scholar] [CrossRef]
- Pei, Z.; Fang, S.; Wang, L.; Yang, W. Comparative Analysis of Drought Indicated by the SPI and SPEI at Various Timescales in Inner Mongolia, China. Water 2020, 12, 1925. [Google Scholar] [CrossRef]
- Wang, Y.; Liu, G.; Guo, E. Spatial distribution and temporal variation of drought in Inner Mongolia during 1901–2014 using Standardized Precipitation Evapotranspiration Index. Sci. Total Environ. 2019, 654, 850–862. [Google Scholar] [CrossRef]
- Wang, F.; Men, R.; Lai, H.; Feng, K.; Yan, S.; Gao, S.; Wang, Z.; Tian, Q.; Guo, W.; Yang, H. The response of vegetation dynamics to drought and its driving factors identification in Inner Mongolia of China. Ecol. Indic. 2024, 164, 112125. [Google Scholar] [CrossRef]
- Gao, S.; Huang, S.; Singh, V.P.; Deng, X.; Duan, L.; Leng, G.; Guo, W.; Li, Y.; Zhang, L.; Han, Z.; et al. Dynamic response of vegetation to meteorological drought and driving mechanisms in Mongolian Plateau. J. Hydrol. 2024, 650, 132541. [Google Scholar] [CrossRef]
- Chiang, F.; Mazdiyasni, O.; AghaKouchak, A. Evidence of anthropogenic impacts on global drought frequency, duration, and intensity. Nat. Commun. 2021, 12, 2754. [Google Scholar] [CrossRef] [PubMed]
- Vogel, A.; Scherer-Lorenzen, M.; Weigelt, A. Grassland resistance and resilience after drought depends on management intensity and species richness. PLoS ONE 2012, 7, e36992. [Google Scholar] [CrossRef] [PubMed]
- Liu, Y.; You, C.; Zhang, Y.; Chen, S.; Zhang, Z.; Li, J.; Wu, Y. Resistance and resilience of grasslands to drought detected by SIF in inner Mongolia, China. Agric. For. Meteorol. 2021, 308–309, 108567. [Google Scholar] [CrossRef]
- Gampe, D.; Zscheischler, J.; Reichstein, M.; O’Sullivan, M.; Smith, W.K.; Sitch, S.; Buermann, W. Increasing impact of warm droughts on northern ecosystem productivity over recent decades. Nat. Clim. Change 2021, 11, 772–779. [Google Scholar] [CrossRef]
- Li, H.; Li, F.Y.; Guo, J.; Gao, X. An improved dynamic threshold method for determining the start of the vegetation greening season in remote sensing monitoring: The case of Inner Mongolia. Ecol. Inform. 2023, 78, 102378. [Google Scholar] [CrossRef]
- Zhan, C.; Liang, C.; Zhao, L.; Jiang, S.; Niu, K.; Zhang, Y. Drought-related cumulative and time-lag effects on vegetation dynamics across the Yellow River Basin, China. Ecol. Indic. 2022, 143, 109409. [Google Scholar] [CrossRef]
- Peng, J.; Wu, C.; Zhang, X.; Wang, X.; Gonsamo, A. Satellite detection of cumulative and lagged effects of drought on autumn leaf senescence over the Northern Hemisphere. Glob. Change Biol. 2019, 25, 2174–2188. [Google Scholar] [CrossRef]
- Council, N.R. Grasslands and Grassland Sciences in Northern China; National Academies Press: Washington, DC, USA, 1992. [Google Scholar]
- Huang, W.; Wang, W.; Cao, M.; Fu, G.; Xia, J.; Wang, Z.; Li, J. Local climate and biodiversity affect the stability of China’s grasslands in response to drought. Sci. Total Environ. 2021, 768, 145482. [Google Scholar] [CrossRef]
- Yao, N.; Li, L.; Feng, P.; Feng, H.; Li Liu, D.; Liu, Y.; Jiang, K.; Hu, X.; Li, Y. Projections of drought characteristics in China based on a standardized precipitation and evapotranspiration index and multiple GCMs. Sci. Total Environ. 2020, 704, 135245. [Google Scholar] [CrossRef]
- Hossain, M.L.; Li, J. NDVI-based vegetation dynamics and its resistance and resilience to different intensities of climatic events. Glob. Ecol. Conserv. 2021, 30, e01768. [Google Scholar] [CrossRef]
- Liu, P.; Chi, Y.; Huang, Z.; Zhong, D.; Zhou, L. Multidimensional response of China’s grassland stability to drought. Glob. Ecol. Conserv. 2024, 52, e02961. [Google Scholar] [CrossRef]
- Stuart-Haëntjens, E.; De Boeck, H.J.; Lemoine, N.P.; Mänd, P.; Kröel-Dulay, G.; Schmidt, I.K.; Jentsch, A.; Stampfli, A.; Anderegg, W.R.L.; Bahn, M.; et al. Mean annual precipitation predicts primary production resistance and resilience to extreme drought. Sci. Total Environ. 2018, 636, 360–366. [Google Scholar] [CrossRef] [PubMed]
- Xu, X.; Piao, S.; Wang, X.; Chen, A.; Ciais, P.; Myneni, R.B. Spatio-temporal patterns of the area experiencing negative vegetation growth anomalies in China over the last three decades. Environ. Res. Lett. 2012, 7, 035701. [Google Scholar] [CrossRef]
- Ponce-Campos, G.E.; Moran, M.S.; Huete, A.; Zhang, Y.; Bresloff, C.; Huxman, T.E.; Eamus, D.; Bosch, D.D.; Buda, A.R.; Gunter, S.A.; et al. Ecosystem resilience despite large-scale altered hydroclimatic conditions. Nature 2013, 494, 349–352. [Google Scholar] [CrossRef]
- Pfisterer, A.B.; Schmid, B. Diversity-dependent production can decrease the stability of ecosystem functioning. Nature 2002, 416, 84–86. [Google Scholar] [CrossRef]
- Ahmadi, B.; Ahmadalipour, A.; Tootle, G.; Moradkhani, H. Remote Sensing of Water Use Efficiency and Terrestrial Drought Recovery across the Contiguous United States. Remote Sens. 2019, 11, 731. [Google Scholar] [CrossRef]
- Kulmatiski, A.; Beard, K.H. Woody plant encroachment facilitated by increased precipitation intensity. Nat. Clim. Change 2013, 3, 833–837. [Google Scholar] [CrossRef]
- Shi, Y.; Jin, N.; Ma, X.; Wu, B.; He, Q.; Yue, C.; Yu, Q. Attribution of climate and human activities to vegetation change in China using machine learning techniques. Agric. For. Meteorol. 2020, 294, 108146. [Google Scholar] [CrossRef]
- Saco, P.; McDonough, K.; Rodriguez, J.; Rivera-Zayas, J.; Sandi, S. The role of soils in the regulation of hazards and extreme events. Philos. Trans. R. Soc. B 2021, 376, 20200178. [Google Scholar] [CrossRef]
- Liu, S.; Li, T.; Liu, B.; Xu, C.; Zhu, Y.; Xiao, L. Grassland vegetation decline is exacerbated by drought and can be mitigated by soil improvement in Inner Mongolia, China. Sci. Total Environ. 2024, 908, 168464. [Google Scholar] [CrossRef]


Disclaimer/Publisher’s Note: The statements, opinions and data contained in all publications are solely those of the individual author(s) and contributor(s) and not of MDPI and/or the editor(s). MDPI and/or the editor(s) disclaim responsibility for any injury to people or property resulting from any ideas, methods, instructions or products referred to in the content. |
© 2025 by the authors. Licensee MDPI, Basel, Switzerland. This article is an open access article distributed under the terms and conditions of the Creative Commons Attribution (CC BY) license (https://creativecommons.org/licenses/by/4.0/).