
High-Precision Rayleigh Doppler Lidar with Fiber Solid-State Cascade Amplified High-Power Single-Frequency Laser for Wind Measurement

 , , ,
, , ,
Abstract
:1. Introduction
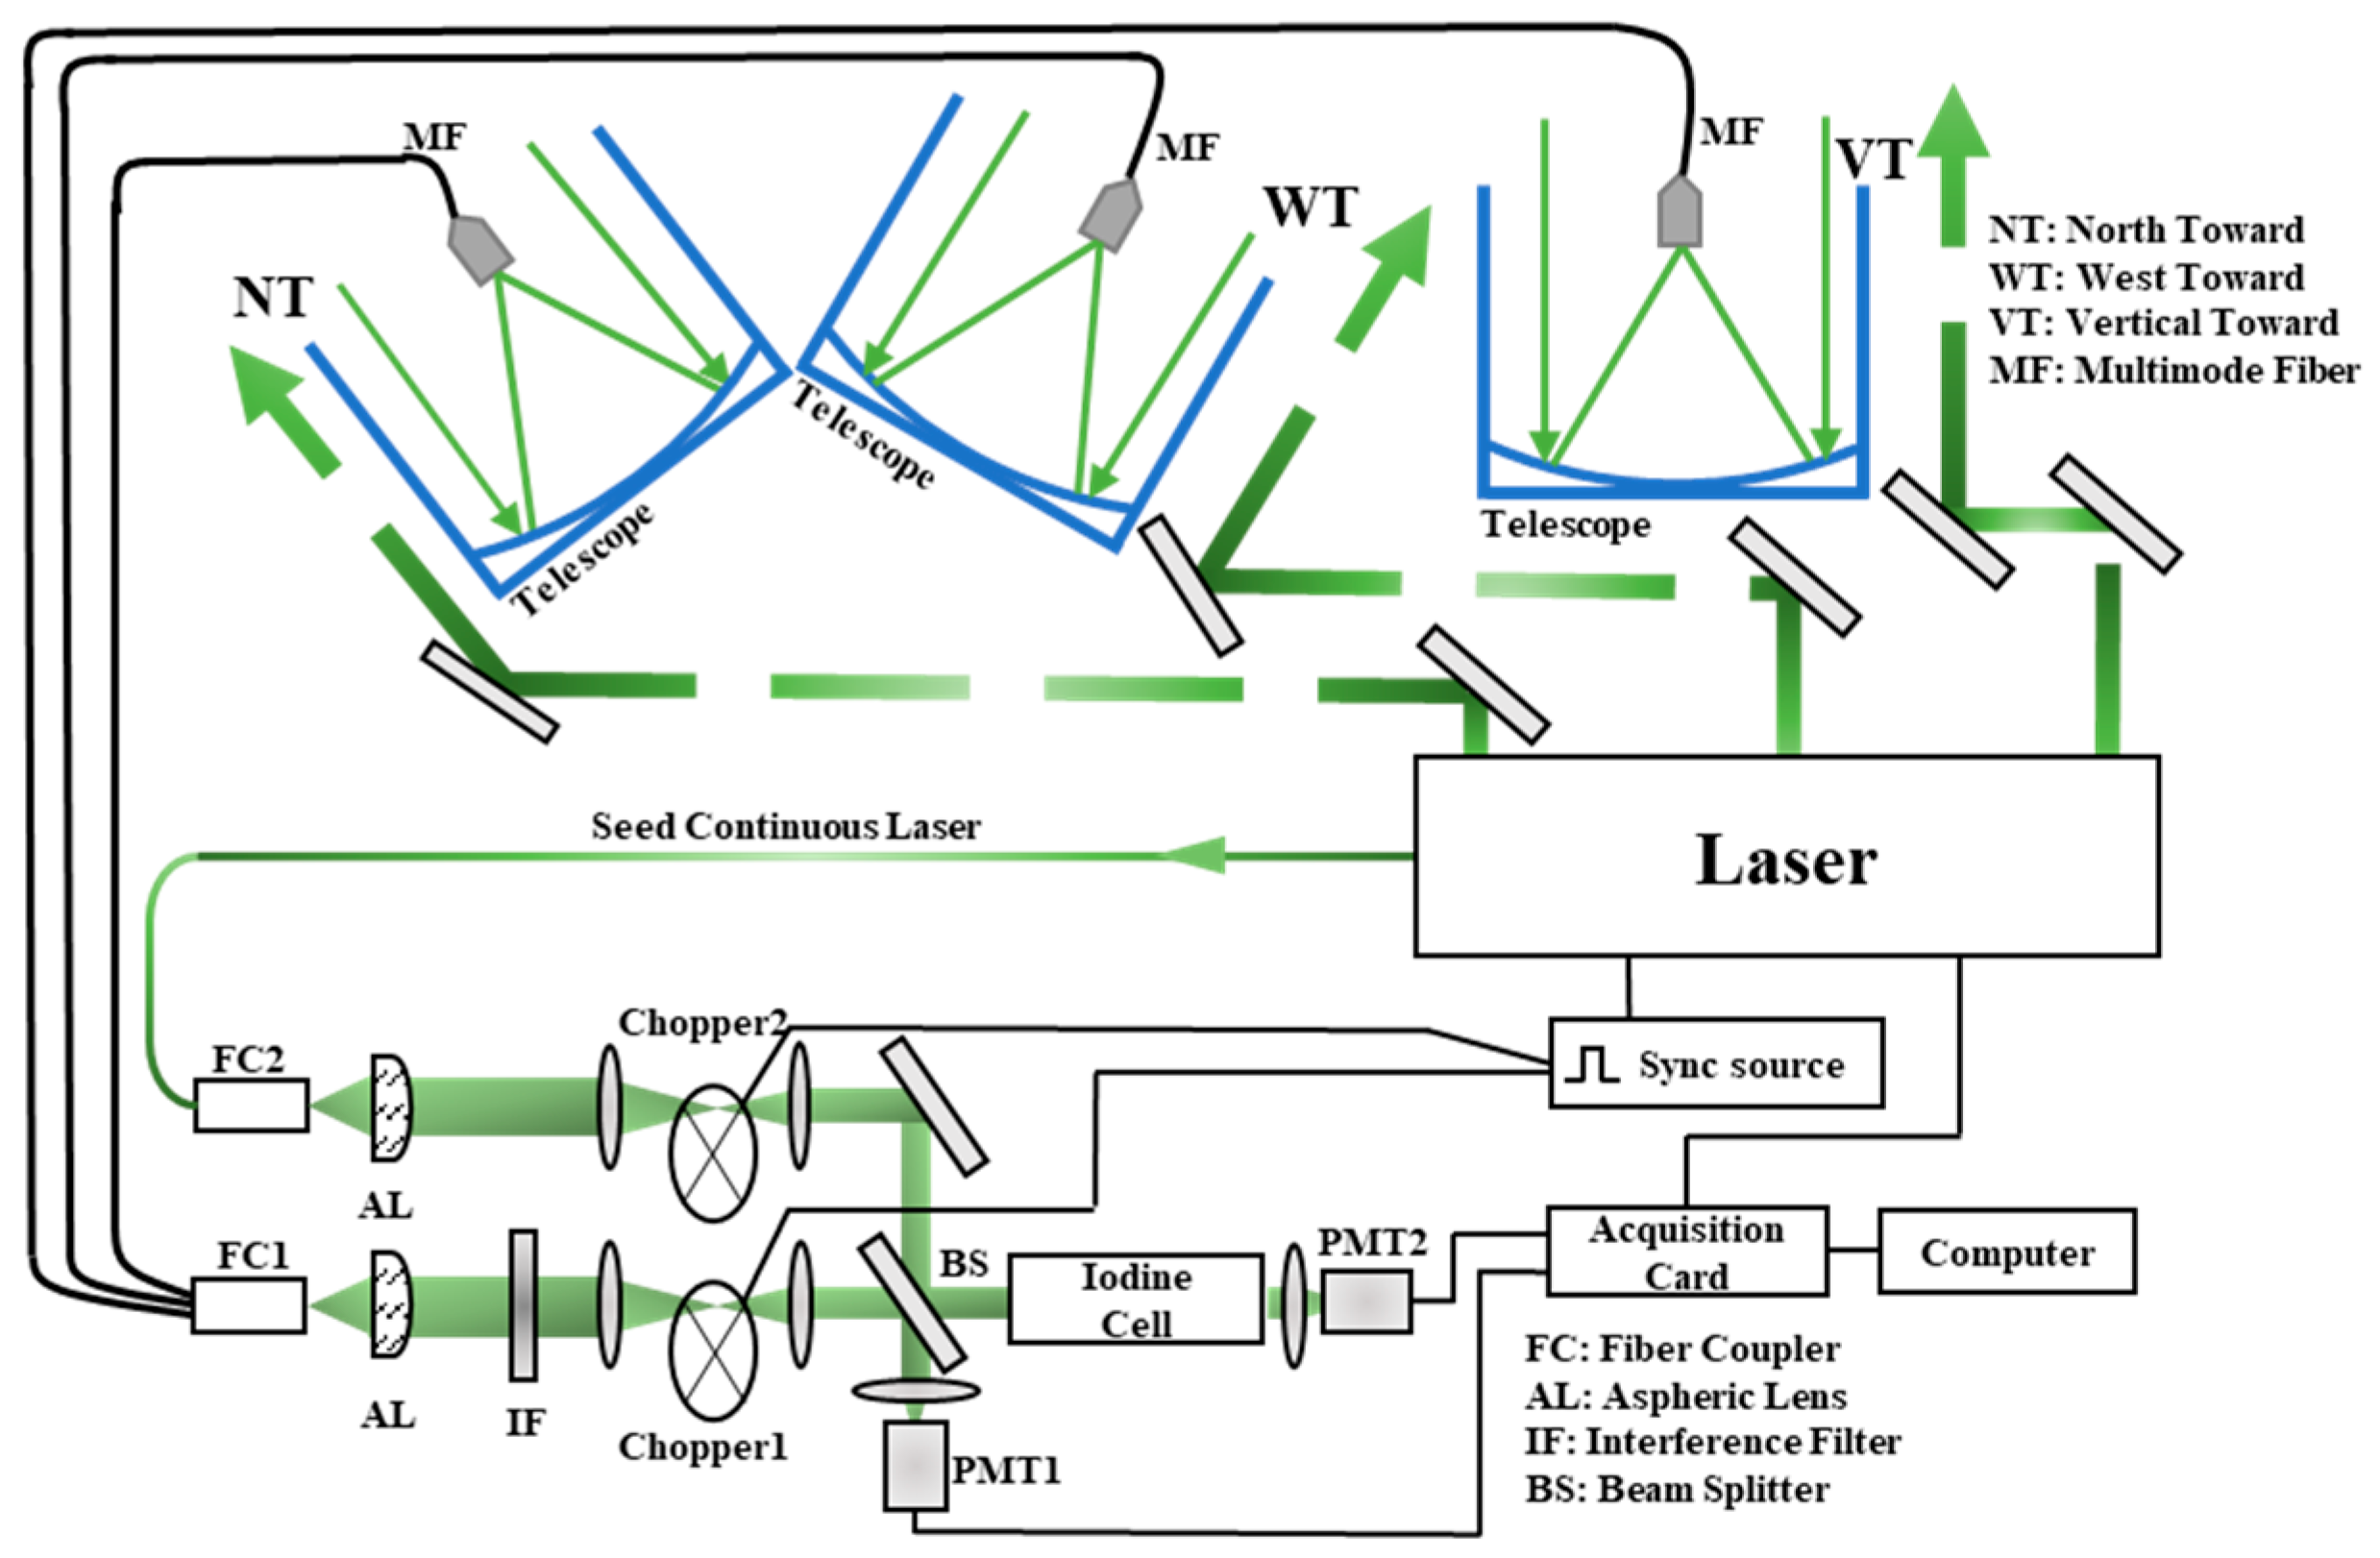
2. RDLD System
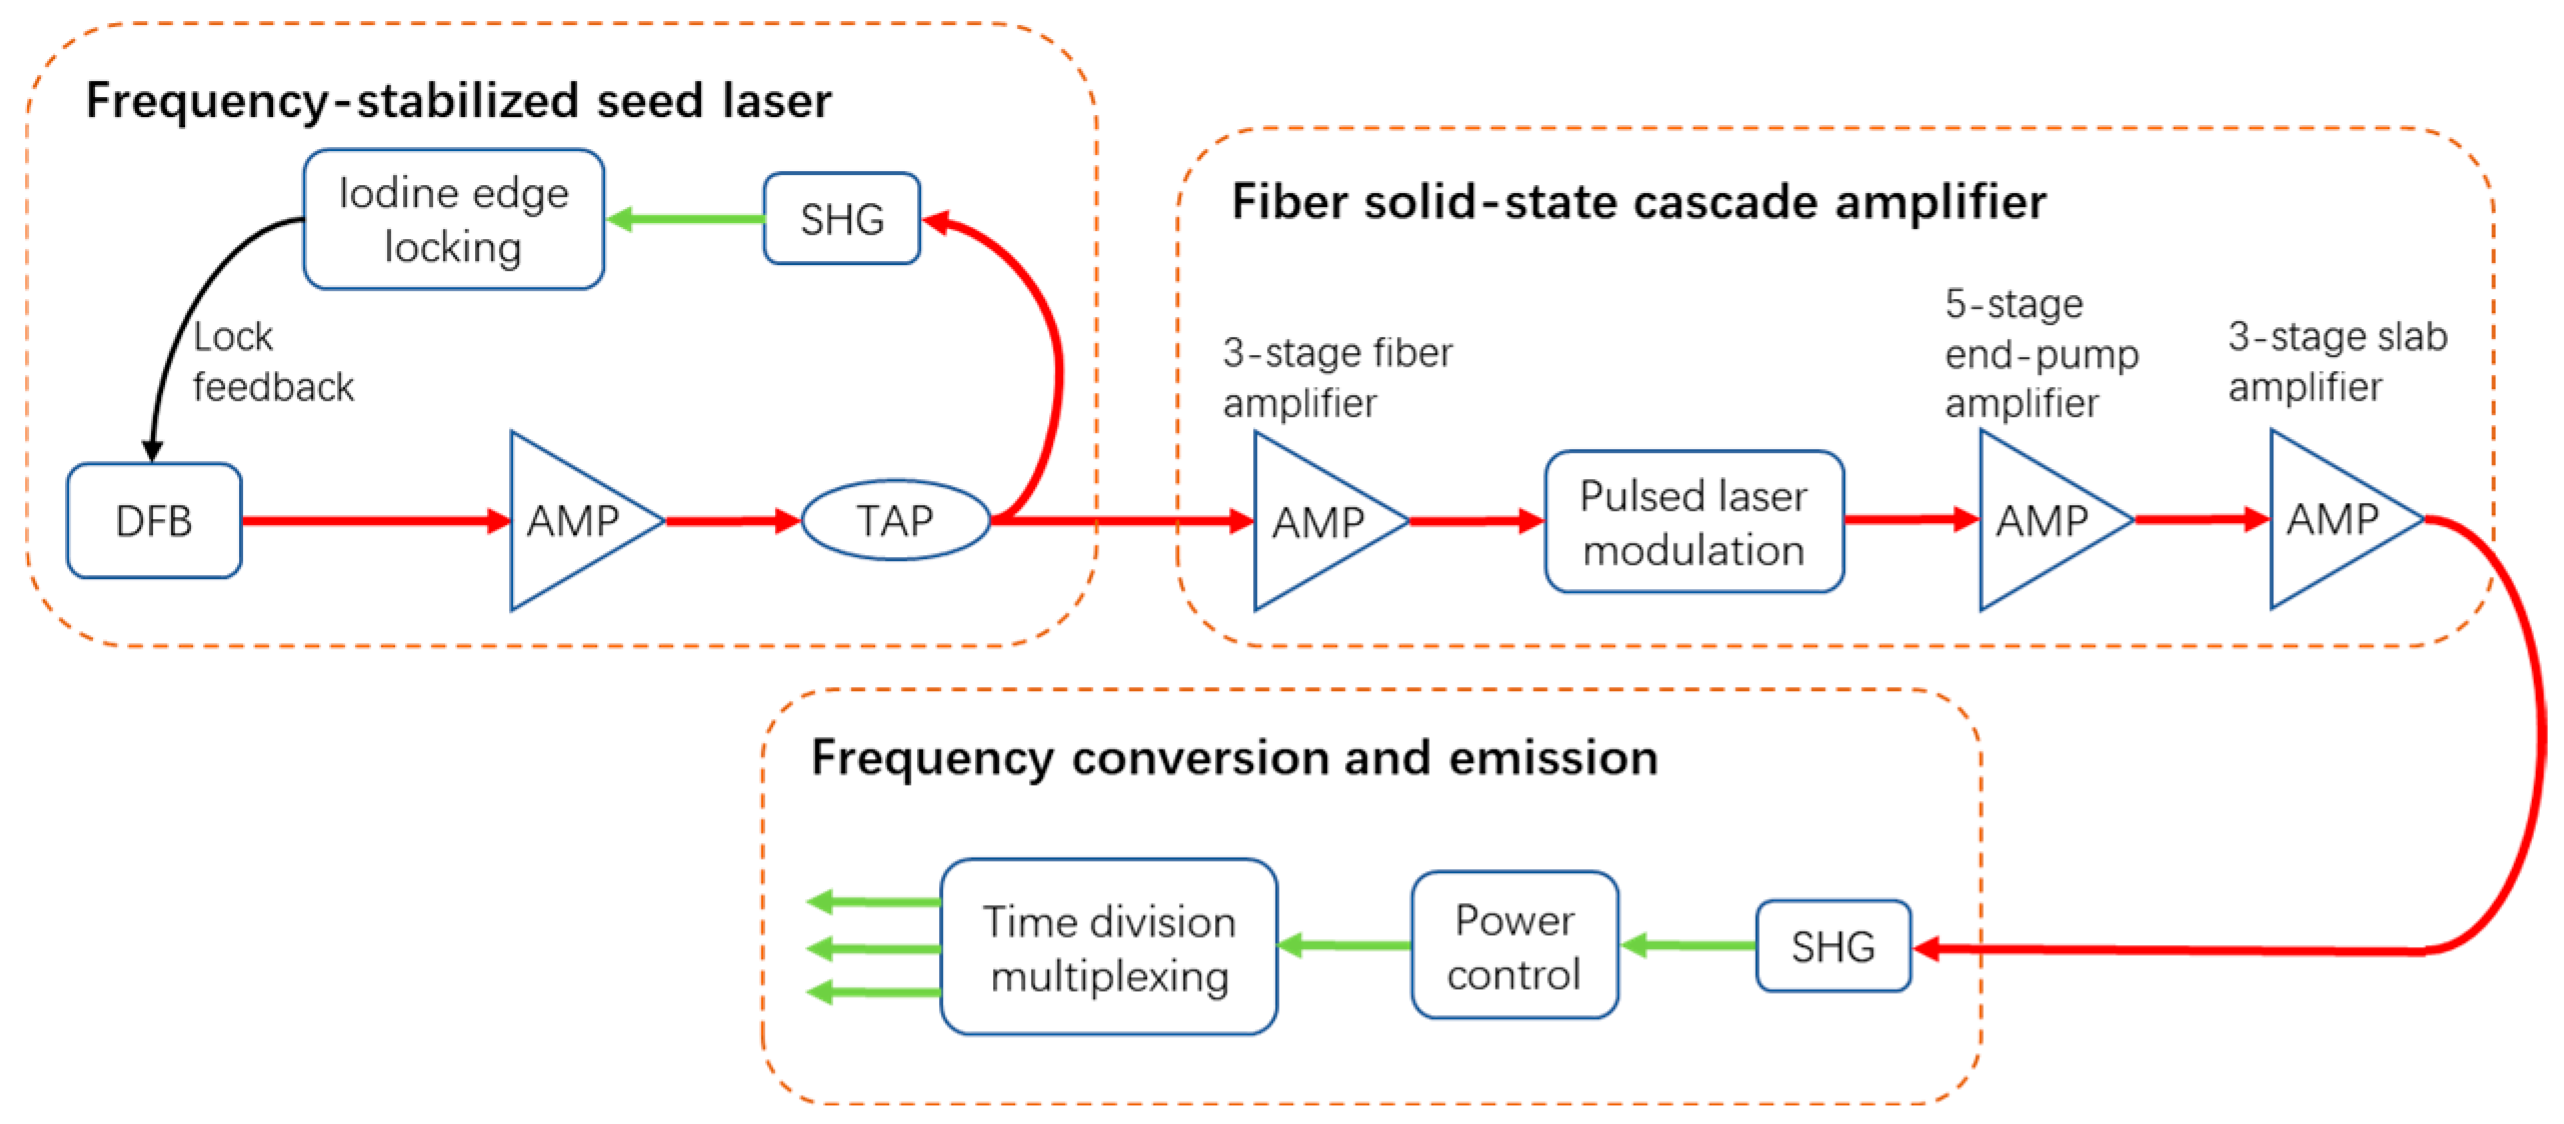
2.1. Laser Emission System
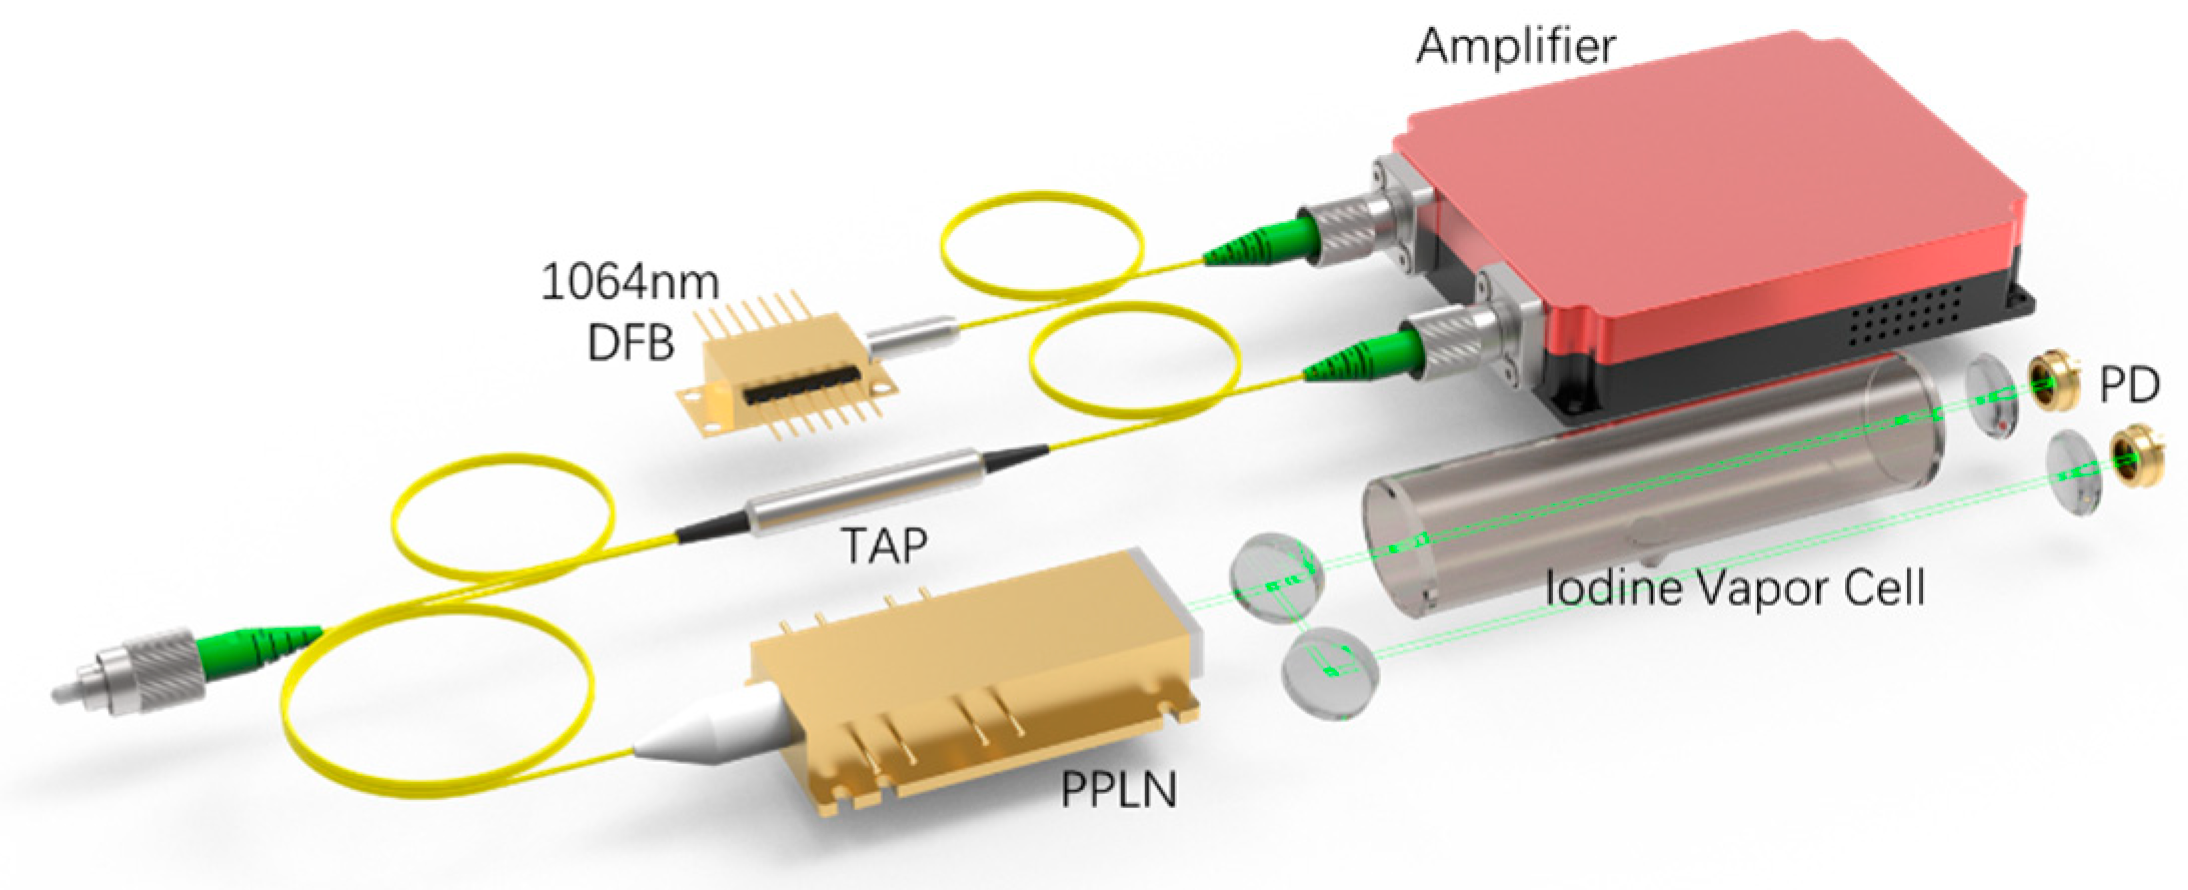
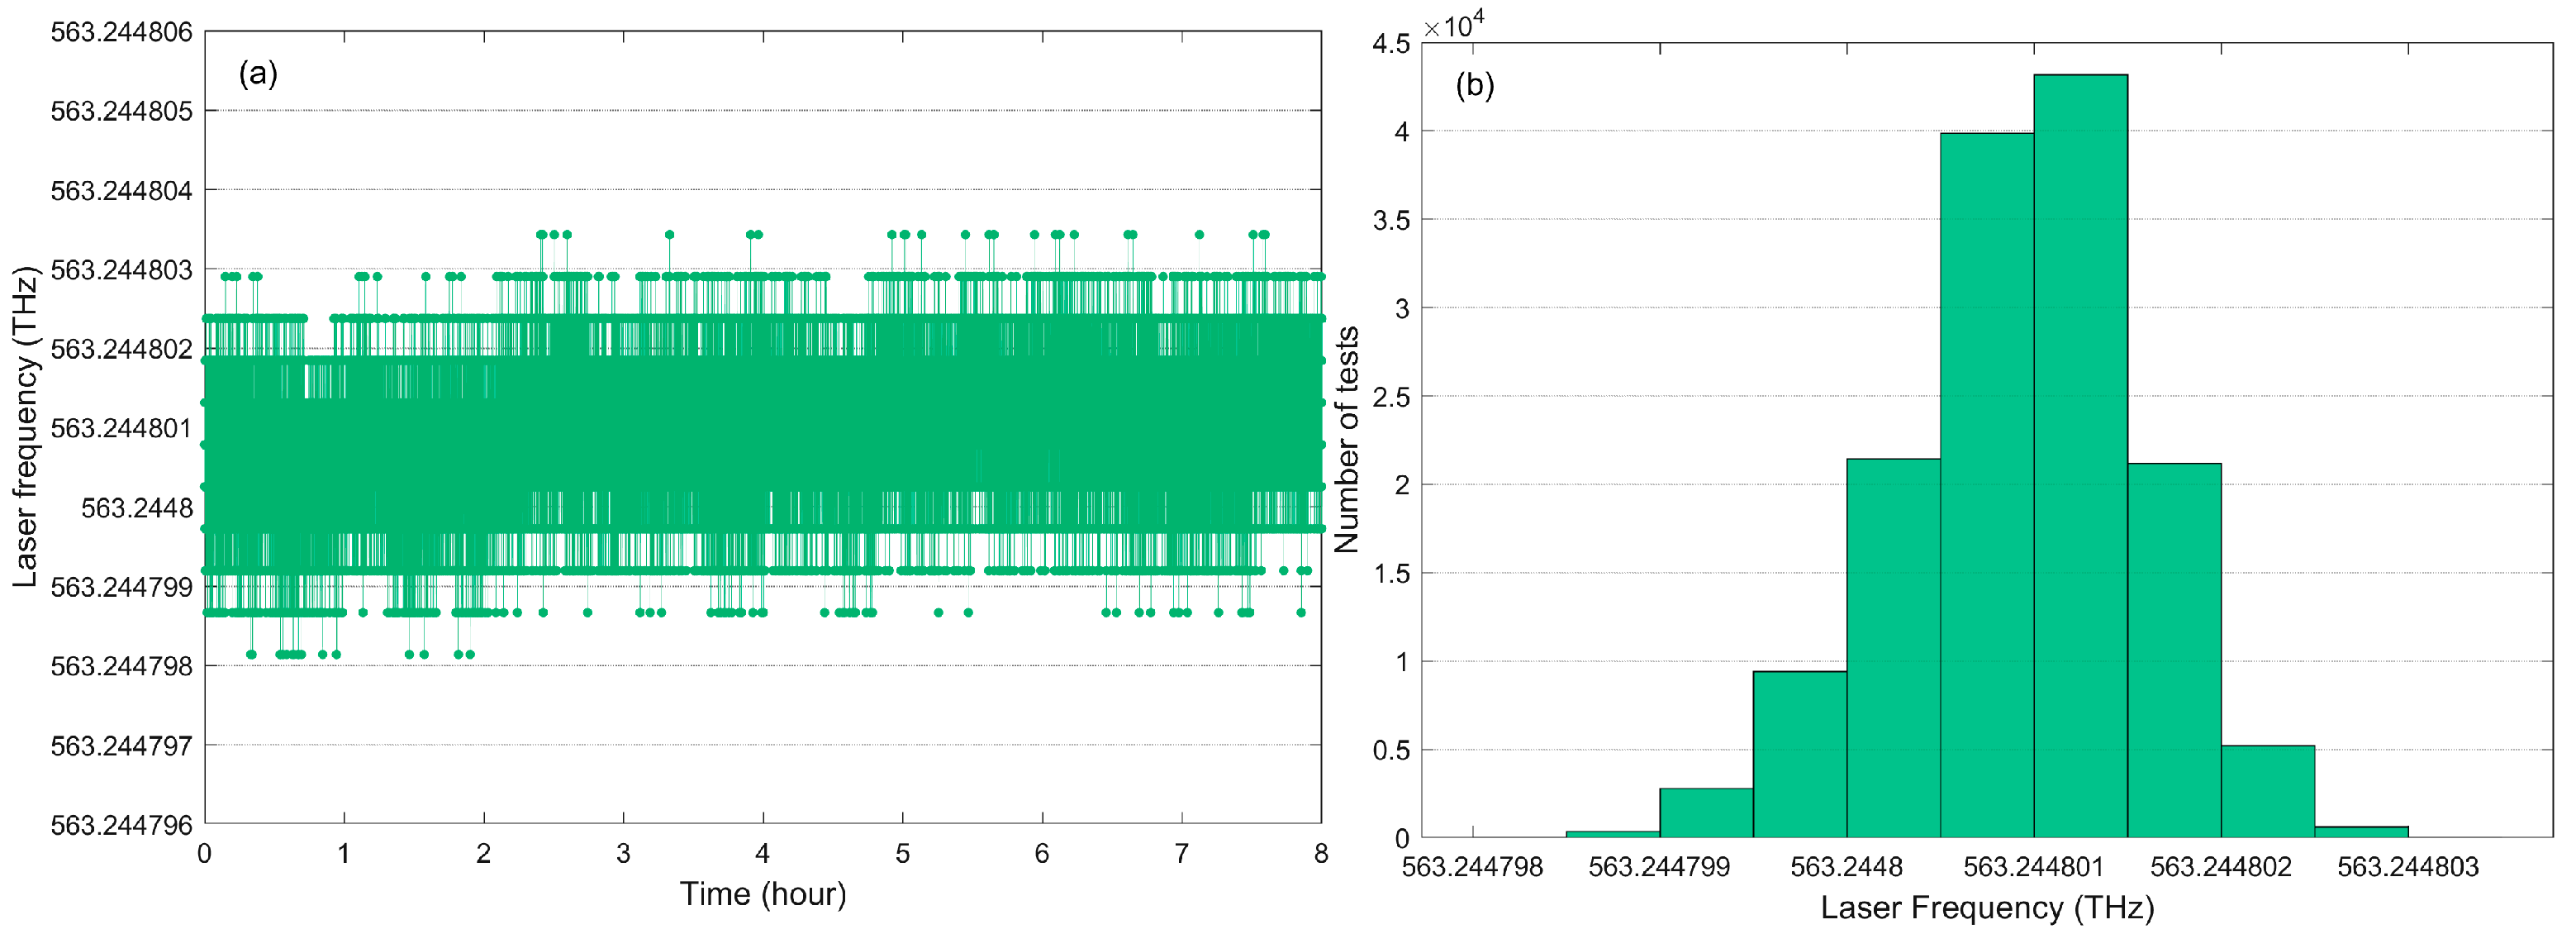
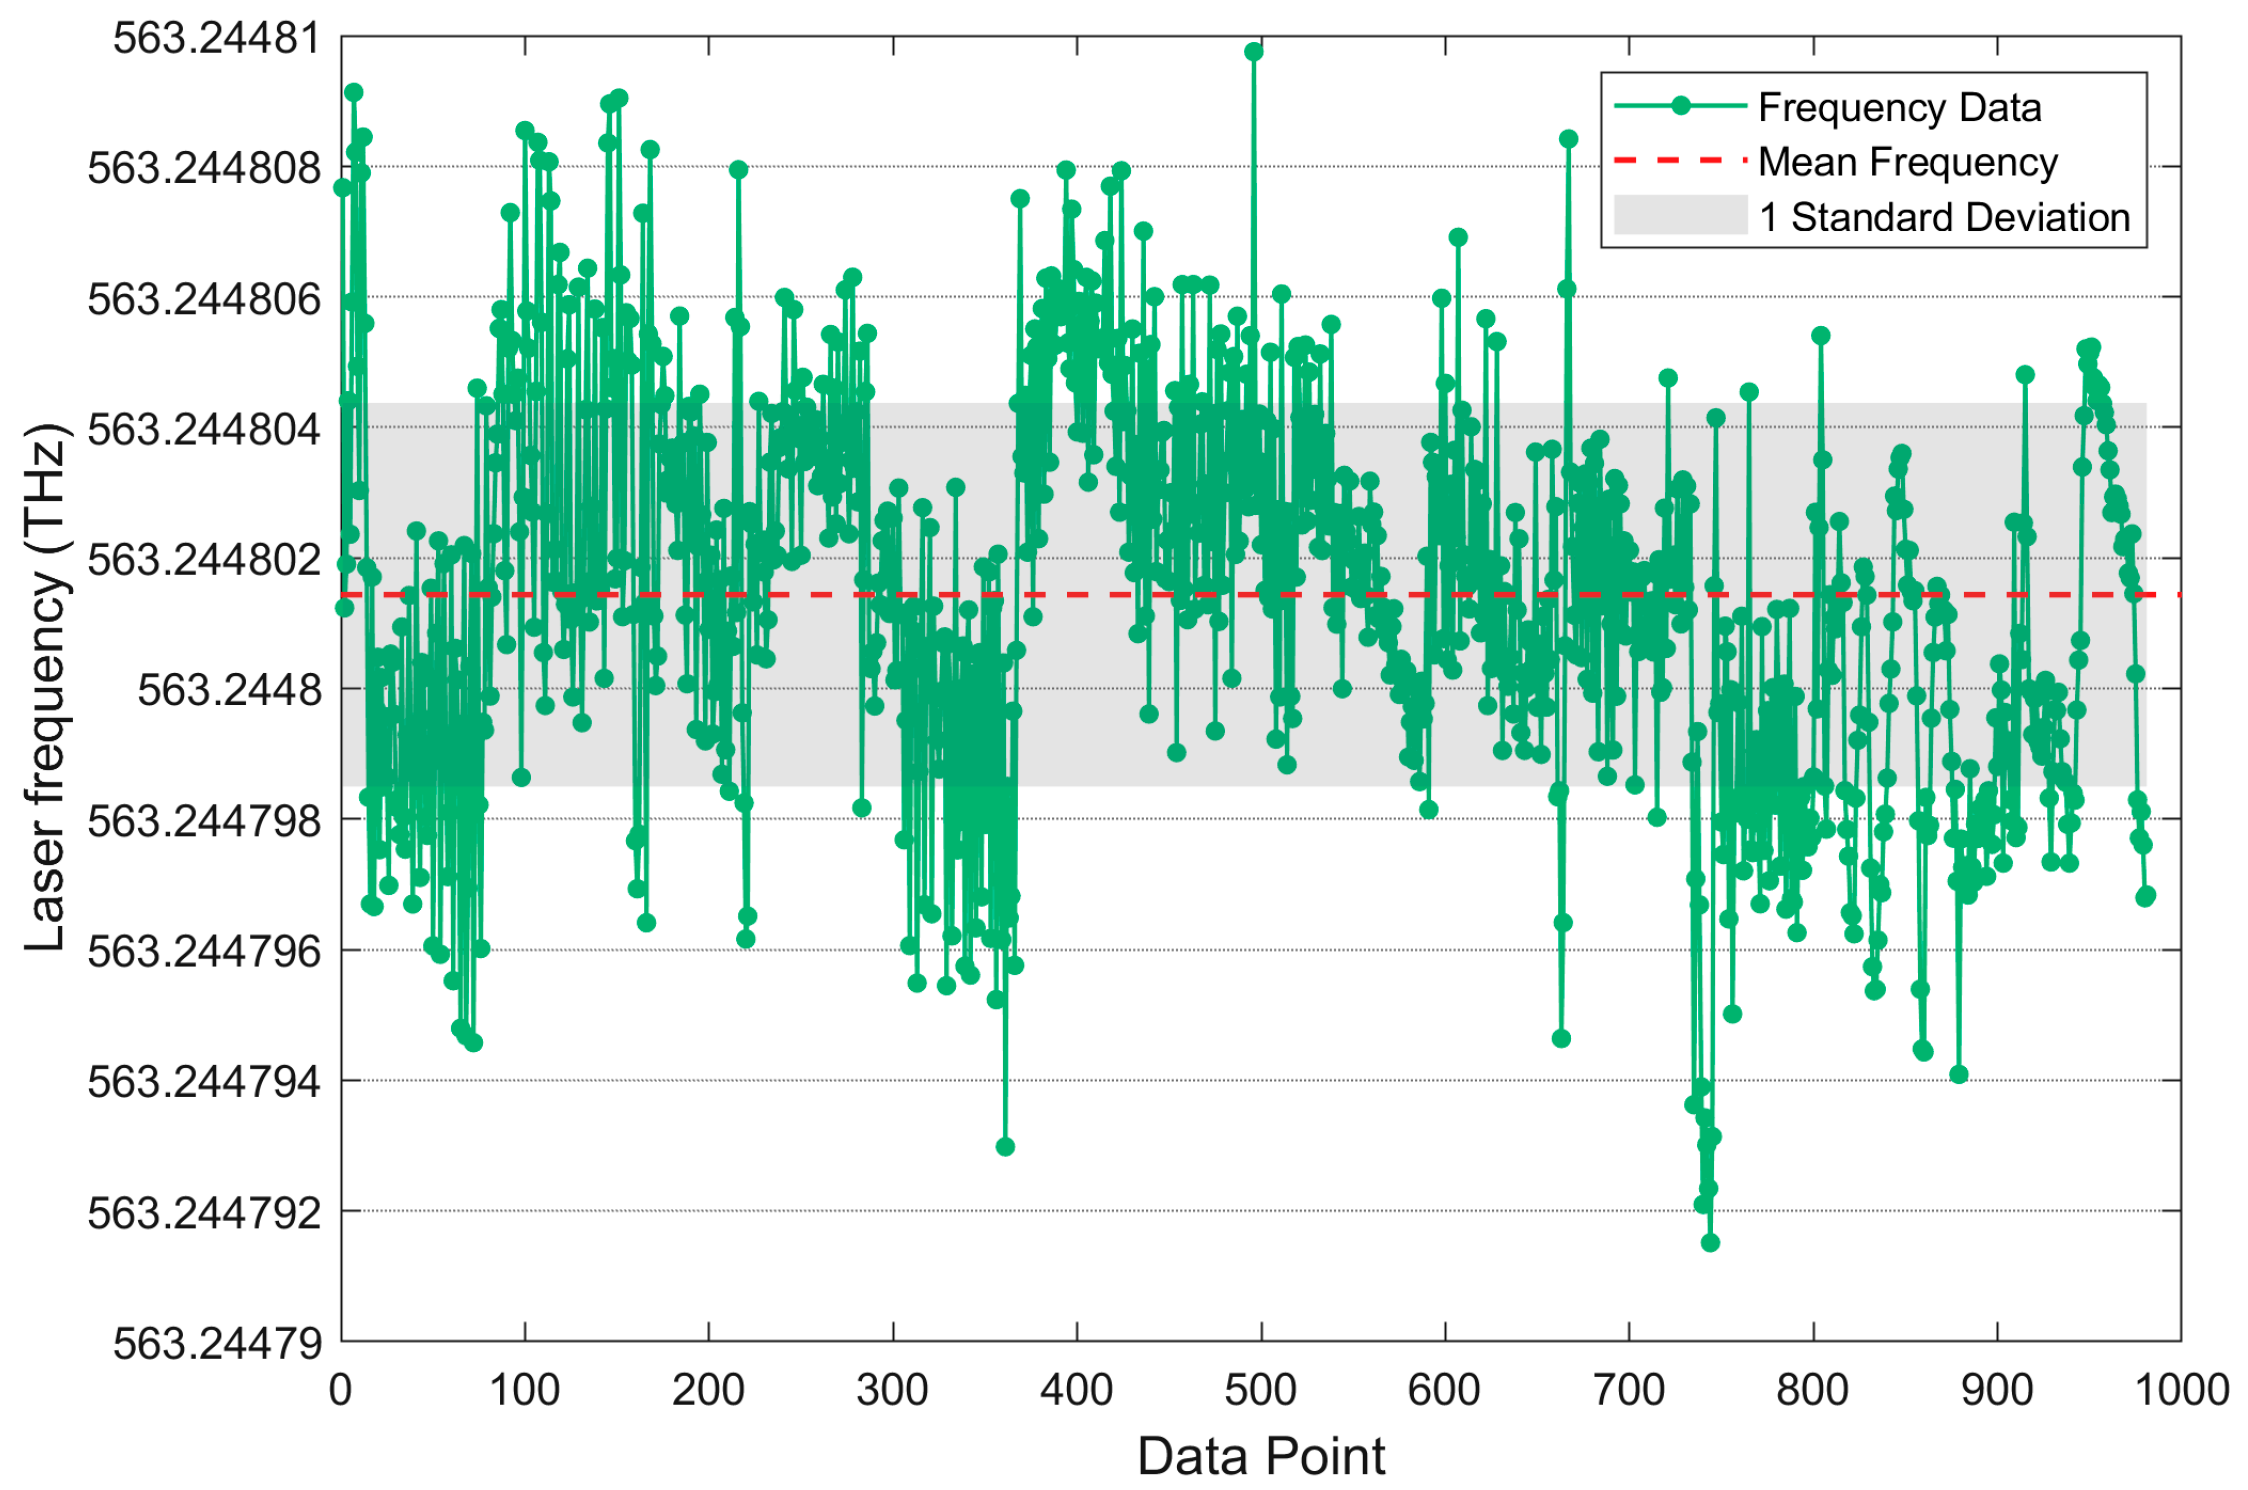
2.1.1. Frequency-Stabilized Seed Laser
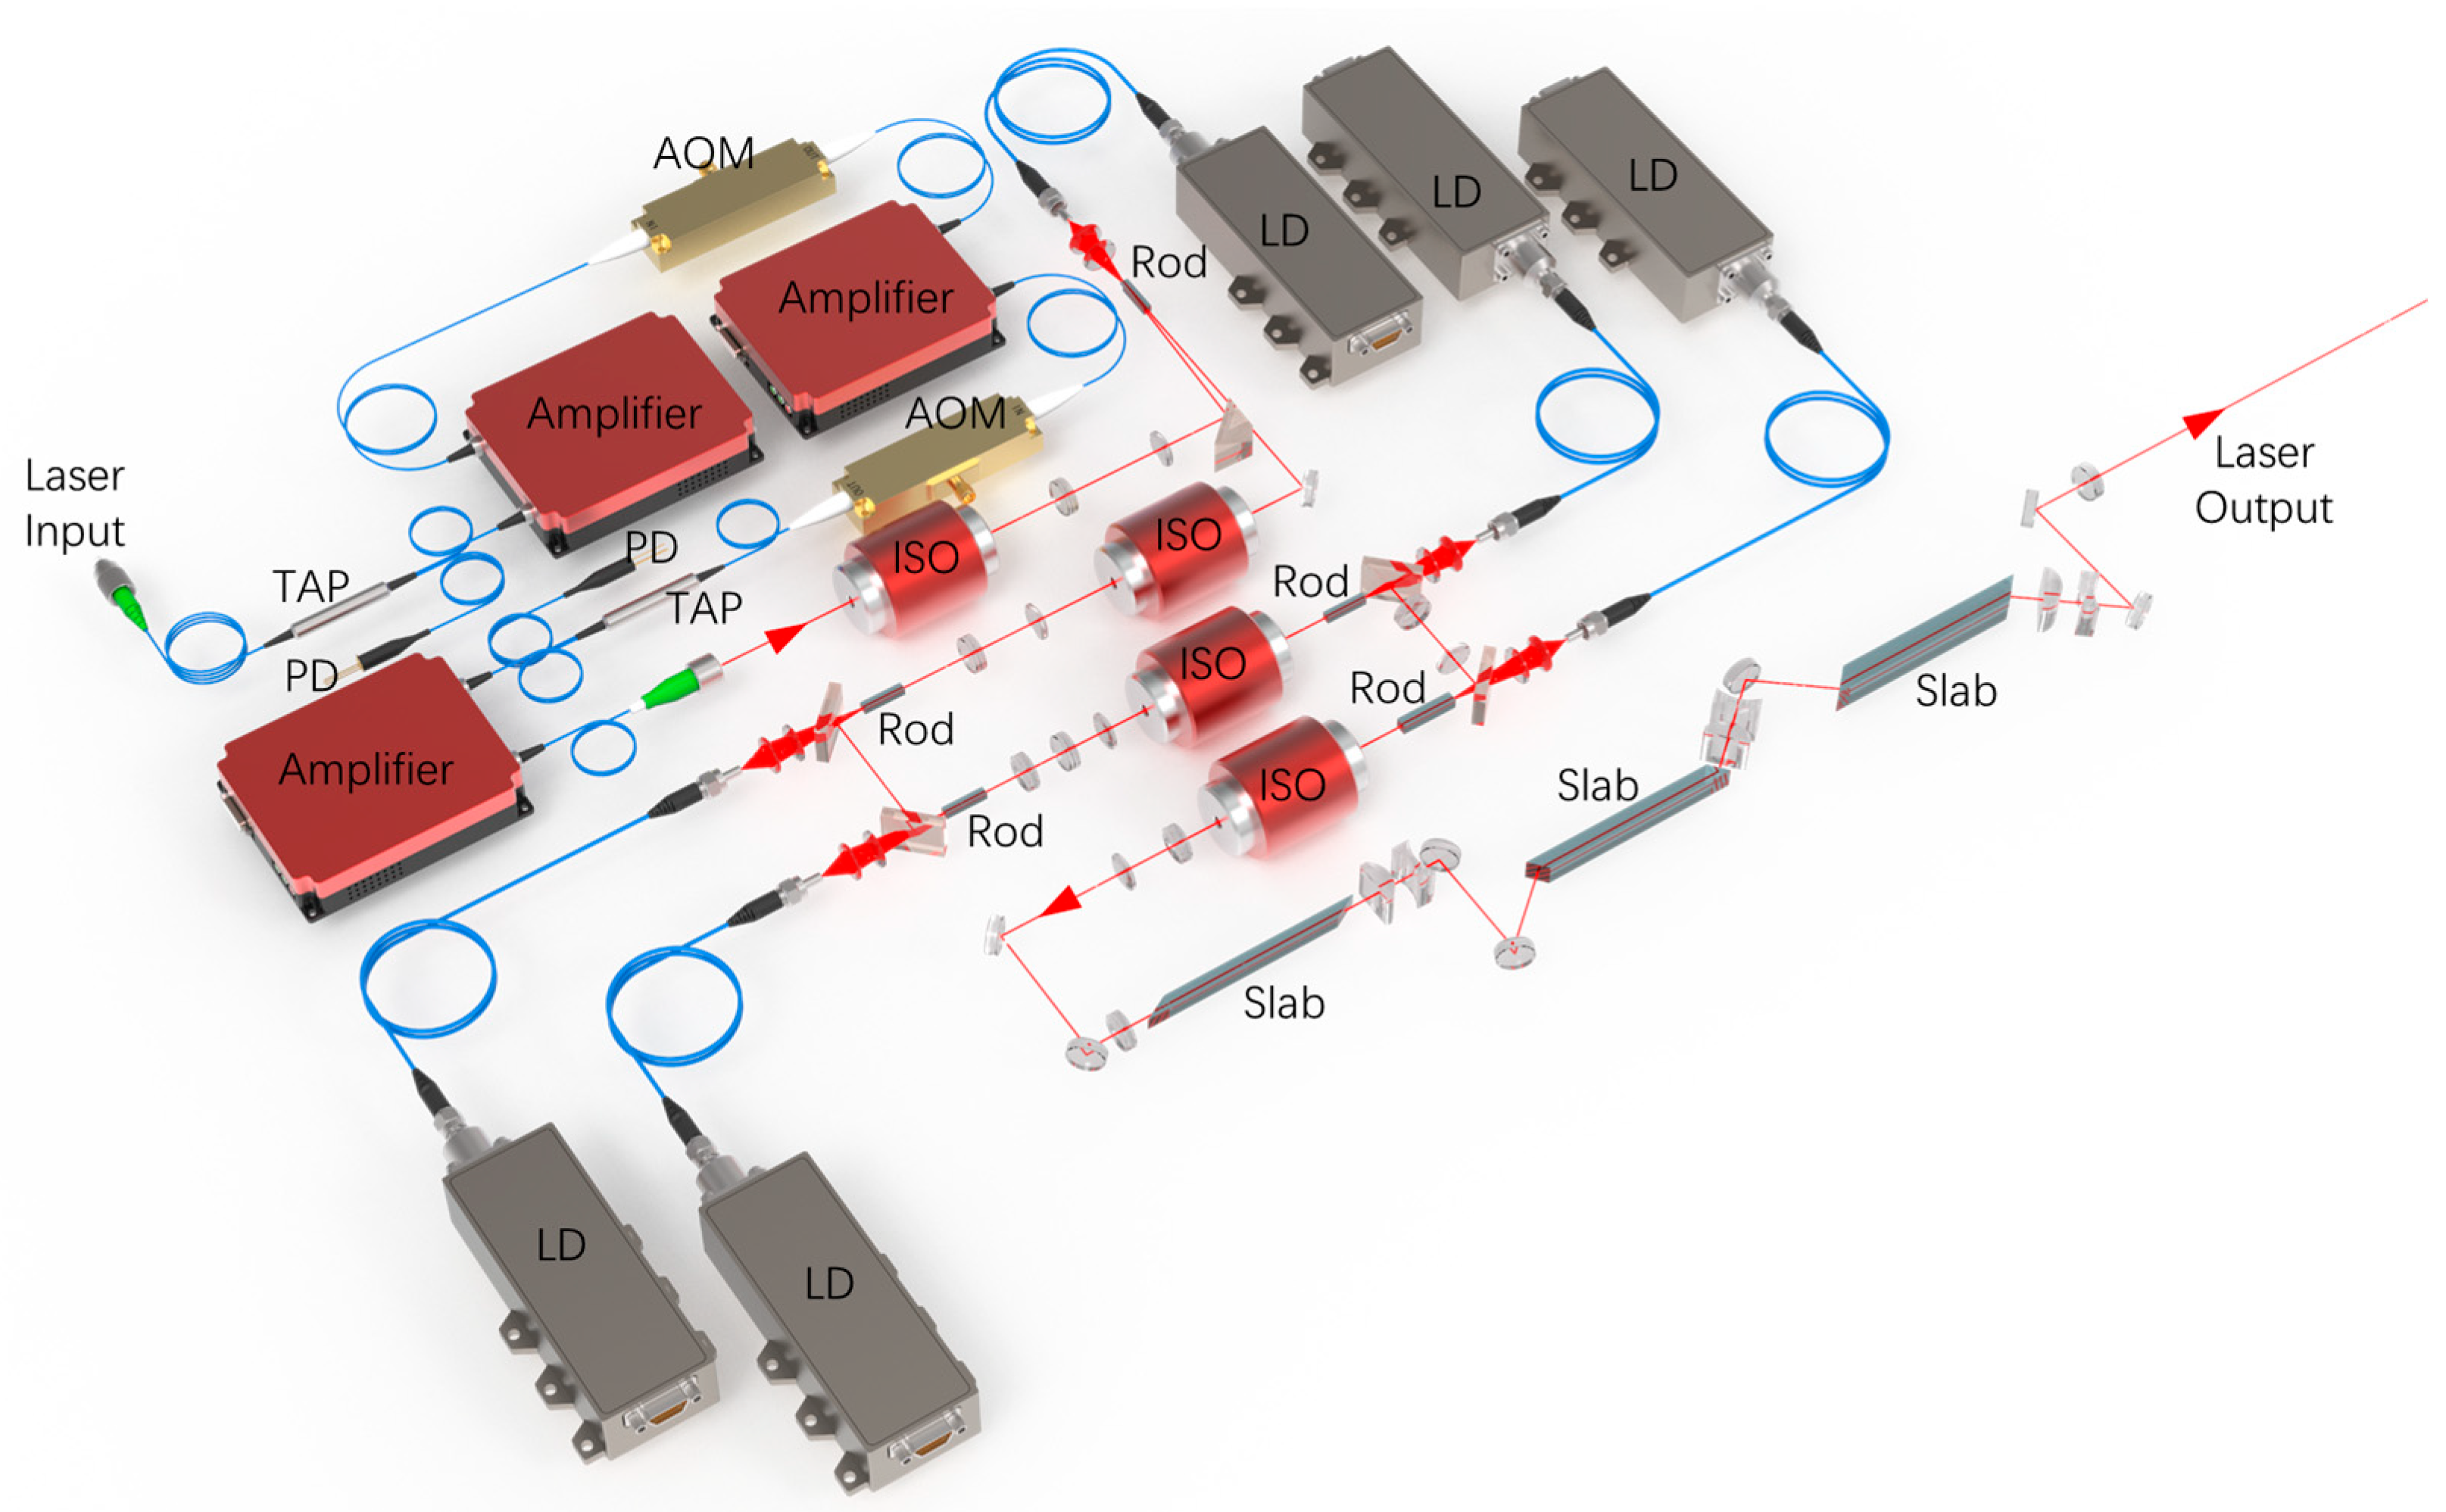
2.1.2. Fiber Solid-State Cascade Amplifier
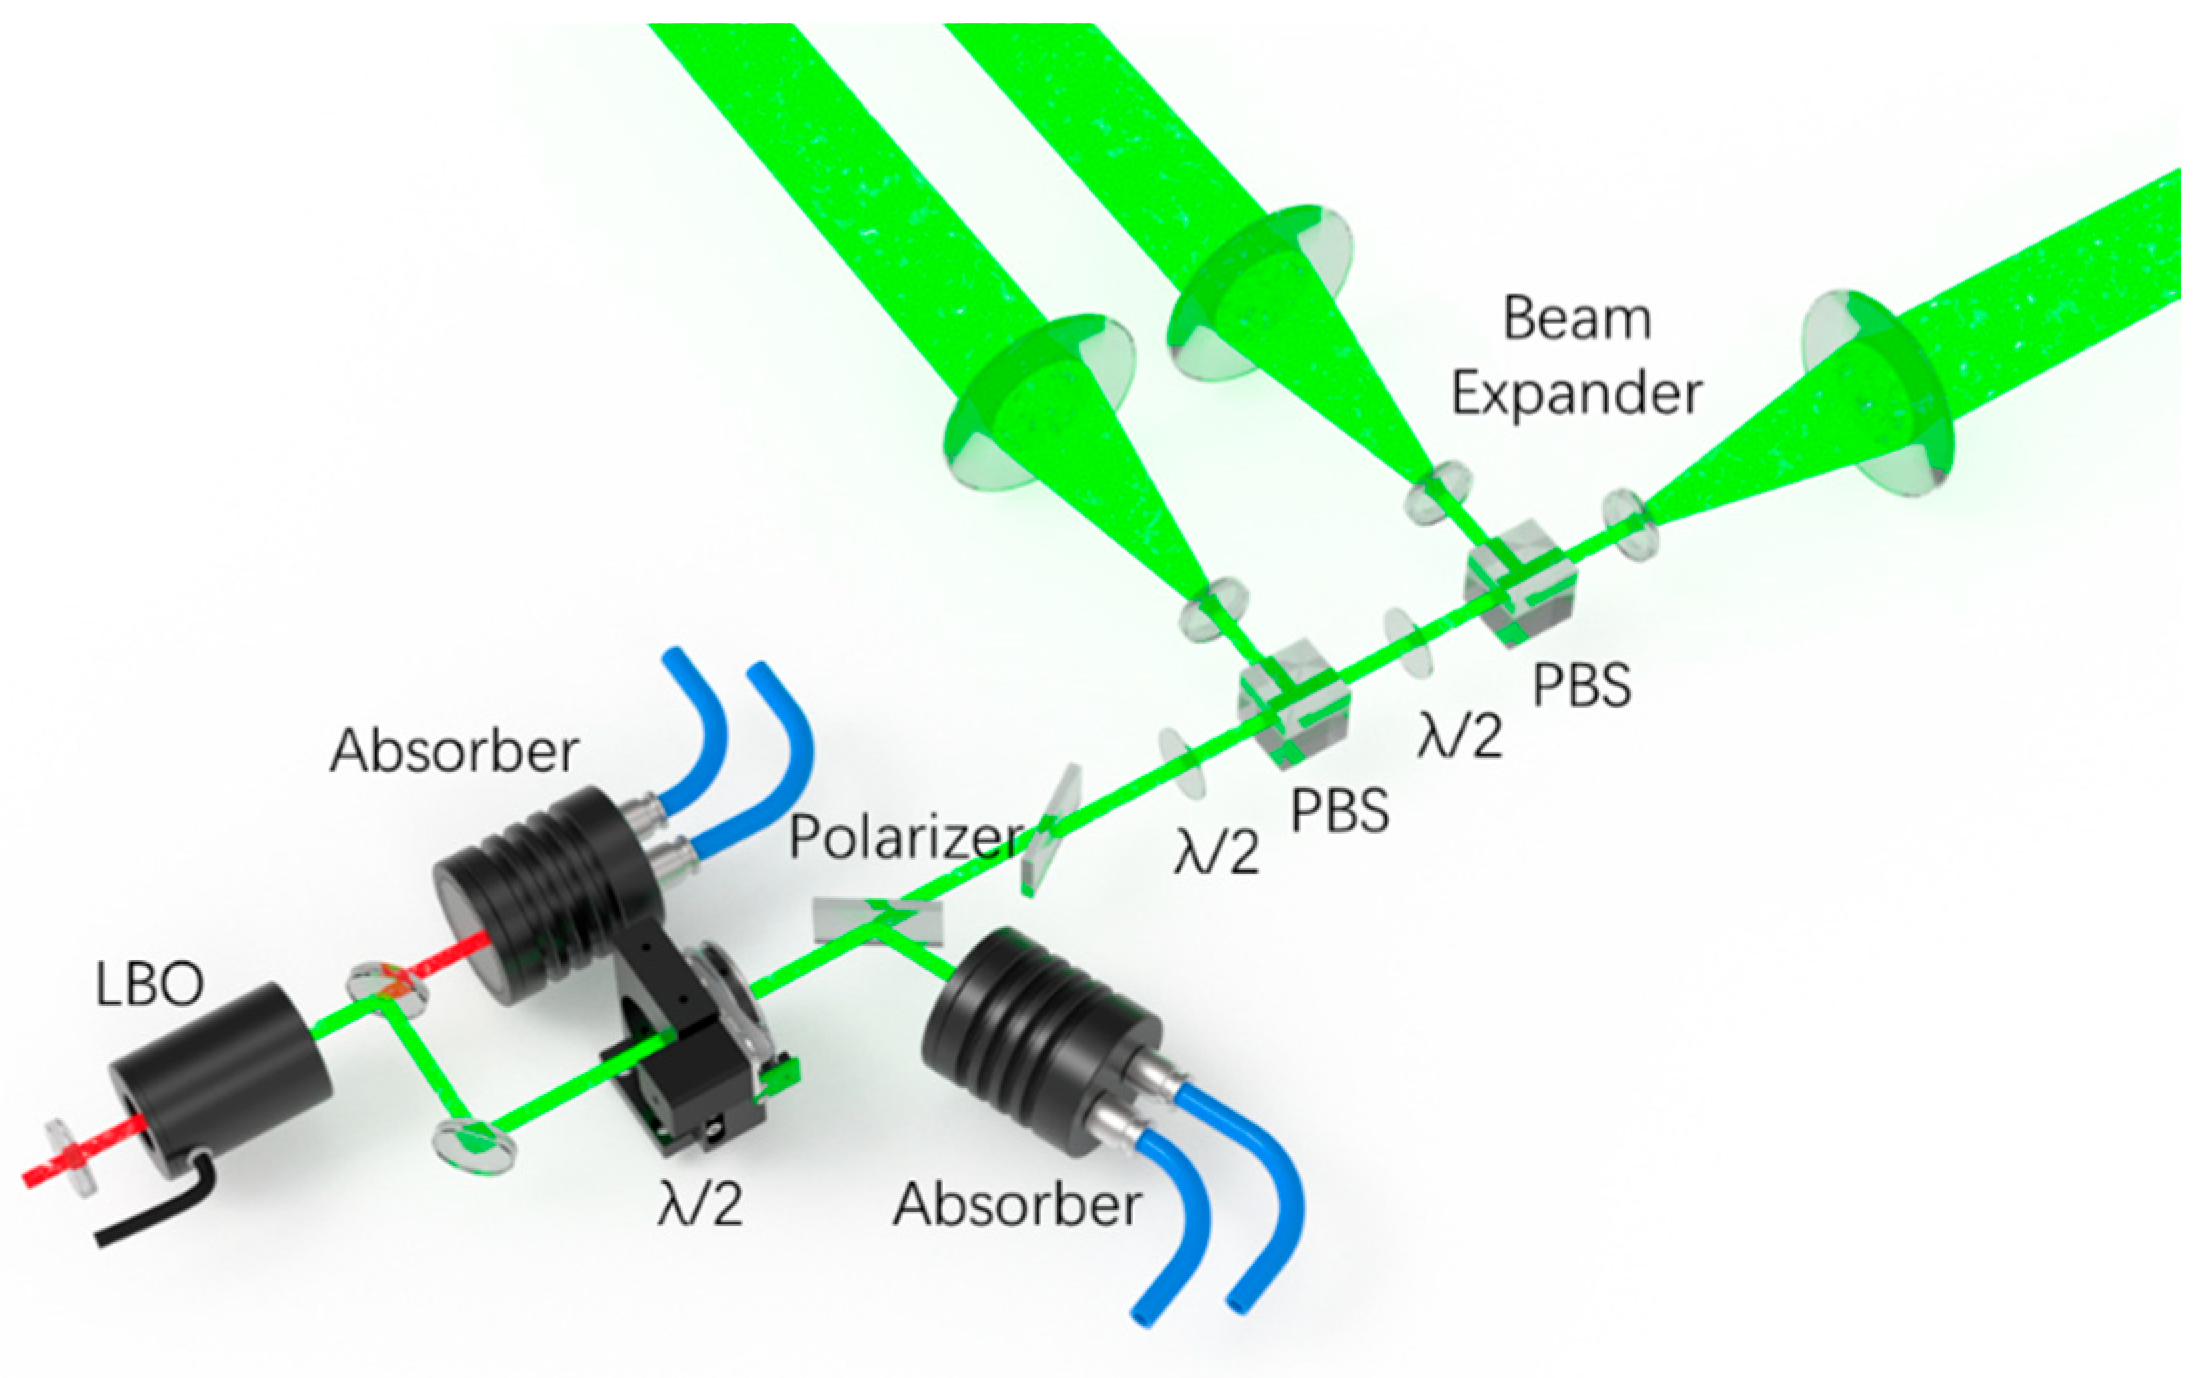
2.1.3. Frequency Conversion and Emission
2.2. Signal Acquisition System
3. Observations and Validation
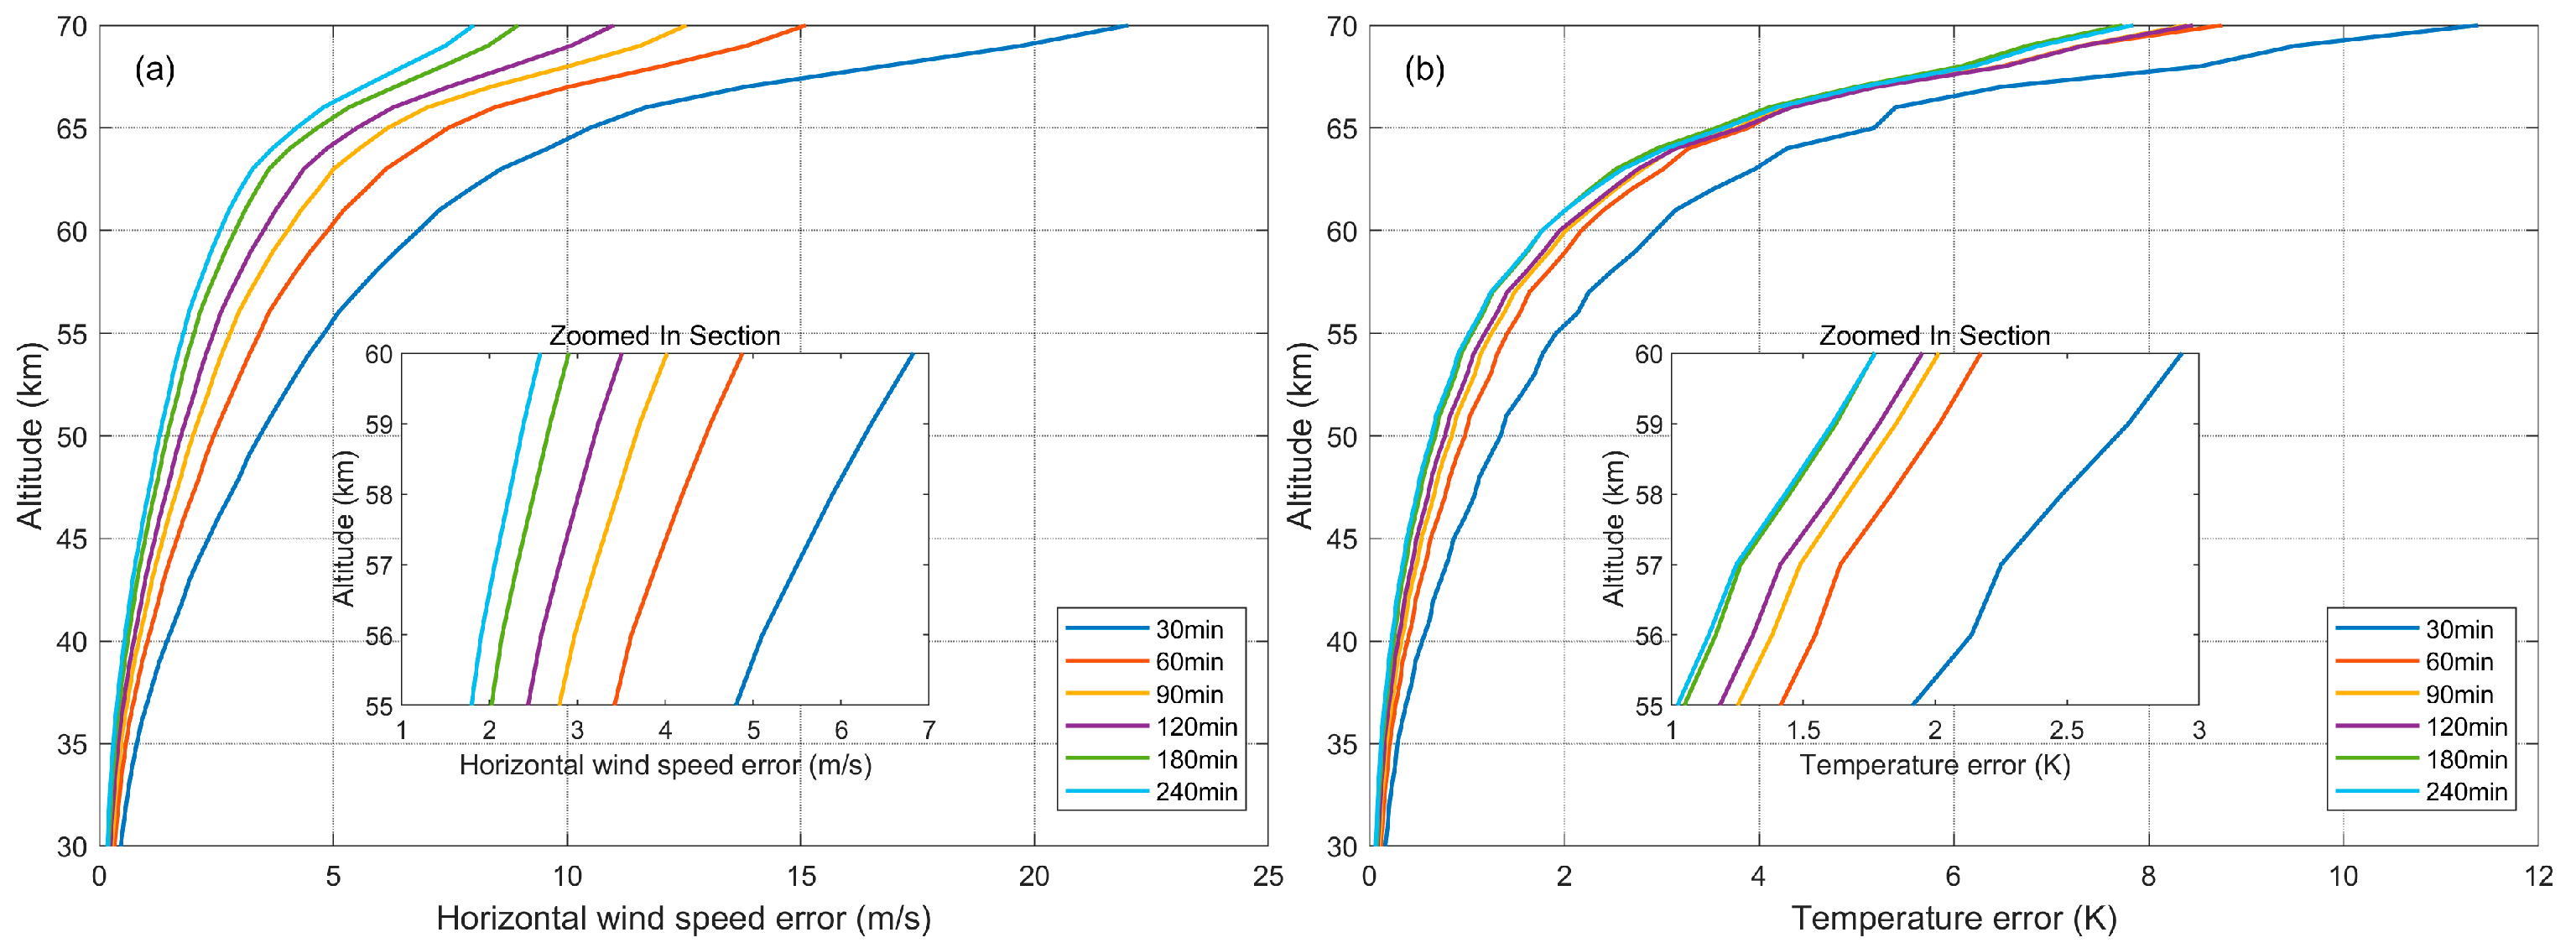
3.1. Analysis of Measured Data
3.2. Comparative Validation
4. Observational Applications
5. Conclusions
Author Contributions
Funding
Data Availability Statement
Conflicts of Interest
References
- Zhao, M.; Xie, C.; Wang, B.; Xing, K.; Chen, J.; Fang, Z.; Li, L.; Cheng, L. A Rotary Platform Mounted Doppler Lidar for Wind Measurements in Upper Troposphere and Stratosphere. Remote Sens. 2022, 14, 5556. [Google Scholar] [CrossRef]
- Zhao, R.; Dou, X.; Xue, X.; Sun, D.; Han, Y.; Chen, C.; Zheng, J.; Li, Z.; Zhou, A.; Han, Y.; et al. Stratosphere and Lower Mesosphere Wind Observation and Gravity Wave Activities of the Wind Field in China Using a Mobile Rayleigh Doppler Lidar. J. Geophys. Res. Space Phys. 2017, 122, 8847–8857. [Google Scholar] [CrossRef]
- Li, X.; Zhong, K.; Zhang, X.; Wu, T.; Zhang, Y.; Wang, Y.; Li, S.; Yan, Z.; Xu, D.; Yao, J. Uncertainty Evaluation on Temperature Detection of Middle Atmosphere by Rayleigh Lidar. Remote Sens. 2023, 15, 3688. [Google Scholar] [CrossRef]
- Baumgarten, G. Doppler Rayleigh/Mie/Raman Lidar for Wind and Temperature Measurements in the Middle Atmosphere up to 80 Km. Atmos. Meas. Tech. 2010, 3, 1509–1518. [Google Scholar] [CrossRef]
- Ratynski, M.; Khaykin, S.; Hauchecorne, A.; Wing, R.; Cammas, J.-P.; Hello, Y.; Keckhut, P. Validation of Aeolus Wind Profiles Using Ground-Based Lidar and Radiosonde Observations at Réunion Island and the Observatoire de Haute-Provence. Atmos. Meas. Tech. 2023, 16, 997–1016. [Google Scholar] [CrossRef]
- Stoffelen, A.; Benedetti, A.; Borde, R.; Dabas, A.; Flamant, P.; Forsythe, M.; Hardesty, M.; Isaksen, L.; Källén, E.; Körnich, H.; et al. Wind Profile Satellite Observation Requirements and Capabilities. Bull. Am. Meteorol. Soc. 2020, 101, E2005–E2021. [Google Scholar] [CrossRef]
- Lübken, F.-J.; Höffner, J. VAHCOLI, a New Concept for Lidars: Technical Setup, Science Applications, and First Measurements. Atmos. Meas. Tech. 2021, 14, 3815–3836. [Google Scholar] [CrossRef]
- Zhao, W.; Hu, X.; Pan, W.; Yan, Z.; Guo, W. Mesospheric Gravity Wave Potential Energy Density Observed by Rayleigh Lidar above Golmud (36.25°N, 94.54°E), Tibetan Plateau. Atmosphere 2022, 13, 1084. [Google Scholar] [CrossRef]
- Rüfenacht, R.; Baumgarten, G.; Hildebrand, J.; Schranz, F.; Matthias, V.; Stober, G.; Lübken, F.-J.; Kämpfer, N. Intercomparison of Middle-Atmospheric Wind in Observations and Models. Atmos. Meas. Tech. 2018, 11, 1971–1987. [Google Scholar] [CrossRef]
- Chanin, M.L.; Garnier, A.; Hauchecorne, A.; Porteneuve, J. A Doppler Lidar for Measuring Winds in the Middle Atmosphere. Geophys. Res. Lett. 1989, 16, 1273–1276. [Google Scholar] [CrossRef]
- Khaykin, S.M.; Hauchecorne, A.; Wing, R.; Keckhut, P.; Godin-Beekmann, S.; Porteneuve, J.; Mariscal, J.-F.; Schmitt, J. Doppler Lidar at Observatoire de Haute-Provence for Wind Profiling up to 75 Km Altitude: Performance Evaluation and Observations. Atmos. Meas. Tech. 2020, 13, 1501–1516. [Google Scholar] [CrossRef]
- Mense, T.H.; Höffner, J.; Baumgarten, G.; Eixmann, R.; Froh, J.; Mauer, A.; Munk, A.; Wing, R.; Lübken, F.-J. 3D Wind Observations with a Compact Mobile Lidar Based on Tropo- and Stratospheric Aerosol Backscatter. Atmos. Meas. Tech. 2024, 17, 1665–1677. [Google Scholar] [CrossRef]
- von Zahn, U.; von Cossart, G.; Fiedler, J.; Fricke, K.H.; Nelke, G.; Baumgarten, G.; Rees, D.; Hauchecorne, A.; Adolfsen, K. The ALOMAR Rayleigh/Mie/Raman Lidar: Objectives, Configuration, and Performance. Ann. Geophys. 2000, 18, 815–833. [Google Scholar] [CrossRef]
- Fiedler, J.; Baumgarten, G. The ALOMAR Rayleigh/Mie/Raman Lidar: Status after 30 Years of Operation. Atmos. Meas. Tech. 2024, 17, 5841–5859. [Google Scholar] [CrossRef]
- Khaykin, S.M.; Hauchecorne, A.; Porteneuve, J.; Mariscal, J.-F.; D’Almeida, E.; Cammas, J.-P.; Payen, G.; Evan, S.; Keckhut, P. Ground-Based Rayleigh-Mie Doppler Lidar for Wind Measurements in the Middle Atmosphere. EPJ Web Conf. 2016, 119, 13005. [Google Scholar] [CrossRef]
- Khaykin, S.M.; Hauchecorne, A.; Cammas, J.-P.; Marqestaut, N.; Mariscal, J.-F.; Posny, F.; Payen, G.; Porteneuve, J.; Keckhut, P. Exploring Fine-Scale Variability of Stratospheric Wind above the Tropical La Reunion Island Using Rayleigh-Mie Doppler Lidar. EPJ Web Conf. 2018, 176, 03004. [Google Scholar] [CrossRef]
- Yan, Z.; Hu, X.; Guo, W.; Guo, S.; Cheng, Y.; Gong, J.; Yue, J. Development of a Mobile Doppler Lidar System for Wind and Temperature Measurements at 30–70 Km. J. Quant. Spectrosc. Radiat. Transf. 2017, 188, 52–59. [Google Scholar] [CrossRef]
- Dou, X.; Han, Y.; Sun, D.; Xia, H.; Shu, Z.; Zhao, R.; Shangguan, M.; Guo, J. Mobile Rayleigh Doppler Lidar for Wind and Temperature Measurements in the Stratosphere and Lower Mesosphere. Opt. Express 2014, 22, A1203–A1221. [Google Scholar] [CrossRef]
- Gerding, M.; Wing, R.; Franco-Diaz, E.; Baumgarten, G.; Fiedler, J.; Köpnick, T.; Ostermann, R. The Doppler Wind, Temperature, and Aerosol RMR Lidar System at Kühlungsborn/Germany—Part 1: Technical Specifications and Capabilities. EGUsphere 2023. [Google Scholar] [CrossRef]
- Sun, L.; Fang, X.; Li, T.; Yang, C.; Dou, X. Design of a Three-Frequency Rayleigh Lidar for Simultaneous Temperature and Wind Measurements. Opt. Express 2024, 32, 25995–26005. [Google Scholar] [CrossRef]
- Chen, J.; Xie, C.; Zhao, M.; Ji, J.; Wang, B.; Xing, K. Research on the Performance of an Active Rotating Tropospheric and Stratospheric Doppler Wind Lidar Transmitter and Receiver. Remote Sens. 2023, 15, 952. [Google Scholar] [CrossRef]
- Lux, O.; Lemmerz, C.; Weiler, F.; Kanitz, T.; Wernham, D.; Rodrigues, G.; Hyslop, A.; Lecrenier, O.; McGoldrick, P.; Fabre, F.; et al. ALADIN Laser Frequency Stability and Its Impact on the Aeolus Wind Error. Atmos. Meas. Tech. 2021, 14, 6305–6333. [Google Scholar] [CrossRef]
- Lux, O.; Wernham, D.; Bravetti, P.; McGoldrick, P.; Lecrenier, O.; Riede, W.; D’Ottavi, A.; De Sanctis, V.; Schillinger, M.; Lochard, J.; et al. High-Power and Frequency-Stable Ultraviolet Laser Performance in Space for the Wind Lidar on Aeolus. Opt. Lett. 2020, 45, 1443–1446. [Google Scholar] [CrossRef]
- Wu, S.; Sun, K.; Dai, G.; Wang, X.; Liu, X.; Liu, B.; Song, X.; Reitebuch, O.; Li, R.; Yin, J.; et al. Inter-Comparison of Wind Measurements in the Atmospheric Boundary Layer and the Lower Troposphere with Aeolus and a Ground-Based Coherent Doppler Lidar Network over China. Atmos. Meas. Tech. 2022, 15, 131–148. [Google Scholar] [CrossRef]
- Flesia, C.; Korb, C.L. Theory of the Double-Edge Molecular Technique for Doppler Lidar Wind Measurement. Appl. Opt. 1999, 38, 432–440. [Google Scholar] [CrossRef] [PubMed]
- She, C.-Y.; Yue, J.; Yan, Z.-A.; Hair, J.W.; Guo, J.-J.; Wu, S.-H.; Liu, Z.-S. Direct-Detection Doppler Wind Measurements with a Cabannes–Mie Lidar: A Comparison between Iodine Vapor Filter and Fabry–Perot Interferometer Methods. Appl. Opt. 2007, 46, 4434–4443. [Google Scholar] [CrossRef]
- de Rosnay, P.; Browne, P.; de Boisséson, E.; Fairbairn, D.; Hirahara, Y.; Ochi, K.; Schepers, D.; Weston, P.; Zuo, H.; Alonso-Balmaseda, M.; et al. Coupled Data Assimilation at ECMWF: Current Status, Challenges and Future Developments. Q. J. R. Meteorol. Soc. 2022, 148, 2672–2702. [Google Scholar] [CrossRef]
- Han, L.; Chen, M.; Chen, K.; Chen, H.; Zhang, Y.; Lu, B.; Song, L.; Qin, R. A Deep Learning Method for Bias Correction of ECMWF 24–240 h Forecasts. Adv. Atmos. Sci. 2021, 38, 1444–1459. [Google Scholar] [CrossRef]
- Yang, D.; Wang, W.; Hong, T. A Historical Weather Forecast Dataset from the European Centre for Medium-Range Weather Forecasts (ECMWF) for Energy Forecasting. Sol. Energy 2022, 232, 263–274. [Google Scholar] [CrossRef]
- Frnda, J.; Durica, M.; Rozhon, J.; Vojtekova, M.; Nedoma, J.; Martinek, R. ECMWF Short-Term Prediction Accuracy Improvement by Deep Learning. Sci. Rep. 2022, 12, 7898. [Google Scholar] [CrossRef] [PubMed]
- Schneider, R.; Bonavita, M.; Geer, A.; Arcucci, R.; Dueben, P.; Vitolo, C.; Le Saux, B.; Demir, B.; Mathieu, P.-P. ESA-ECMWF Report on Recent Progress and Research Directions in Machine Learning for Earth System Observation and Prediction. Npj Clim. Atmos. Sci. 2022, 5, 51. [Google Scholar] [CrossRef]


| Subsystem | Parameter | Value |
|---|---|---|
| Laser emission system | Wavelength/nm | 532.259 |
| Pulse energy/mJ | >300 | |
| Repetition rate/Hz | 200 | |
| Linewidth/MHz | <200 | |
| Signal acquisition system | Telescope aperture/mm | 1000 |
| Field of view/mrad | 0.4 | |
| Optical filter FWHM/nm | 0.15 | |
| Quantum efficiency of PMT/% | 40 | |
| Max photon counting rate/MHz | 800 |
Disclaimer/Publisher’s Note: The statements, opinions and data contained in all publications are solely those of the individual author(s) and contributor(s) and not of MDPI and/or the editor(s). MDPI and/or the editor(s) disclaim responsibility for any injury to people or property resulting from any ideas, methods, instructions or products referred to in the content. |
© 2025 by the authors. Licensee MDPI, Basel, Switzerland. This article is an open access article distributed under the terms and conditions of the Creative Commons Attribution (CC BY) license (https://creativecommons.org/licenses/by/4.0/).
Share and Cite
Yang, B.; Bu, L.; Huang, C.; Tan, Z.; Hu, Z.; Shu, S.; Deng, C.; Li, B.; Ding, J.; Yu, G.; et al. High-Precision Rayleigh Doppler Lidar with Fiber Solid-State Cascade Amplified High-Power Single-Frequency Laser for Wind Measurement. Remote Sens. 2025, 17, 573. https://doi.org/10.3390/rs17040573
Yang B, Bu L, Huang C, Tan Z, Hu Z, Shu S, Deng C, Li B, Ding J, Yu G, et al. High-Precision Rayleigh Doppler Lidar with Fiber Solid-State Cascade Amplified High-Power Single-Frequency Laser for Wind Measurement. Remote Sensing. 2025; 17(4):573. https://doi.org/10.3390/rs17040573
Chicago/Turabian StyleYang, Bin, Lingbing Bu, Cong Huang, Zhiqiang Tan, Zhongyu Hu, Shijiang Shu, Chen Deng, Binbin Li, Jianyong Ding, Guangli Yu, and et al. 2025. "High-Precision Rayleigh Doppler Lidar with Fiber Solid-State Cascade Amplified High-Power Single-Frequency Laser for Wind Measurement" Remote Sensing 17, no. 4: 573. https://doi.org/10.3390/rs17040573
APA StyleYang, B., Bu, L., Huang, C., Tan, Z., Hu, Z., Shu, S., Deng, C., Li, B., Ding, J., Yu, G., Wang, Y., Wang, C., Lin, W., & Zong, W. (2025). High-Precision Rayleigh Doppler Lidar with Fiber Solid-State Cascade Amplified High-Power Single-Frequency Laser for Wind Measurement. Remote Sensing, 17(4), 573. https://doi.org/10.3390/rs17040573