

Deep Learning-Based Seedling Row Detection and Localization Using High-Resolution UAV Imagery for Rice Transplanter Operation Quality Evaluation

 ,
,  and
and
Abstract
1. Introduction
- (1)
- Constructed a deep learning model (CAD-UNet) for rice seedling segmentation based on high-resolution UAV images.
- (2)
- Further excavated the data information contained in high-resolution UAV RGB images, generated high-resolution distribution maps of seedlings in the field, and visualized the operation effectiveness of the transplanter.
- (3)
- Established a quality evaluation model for rice transplanter operation.
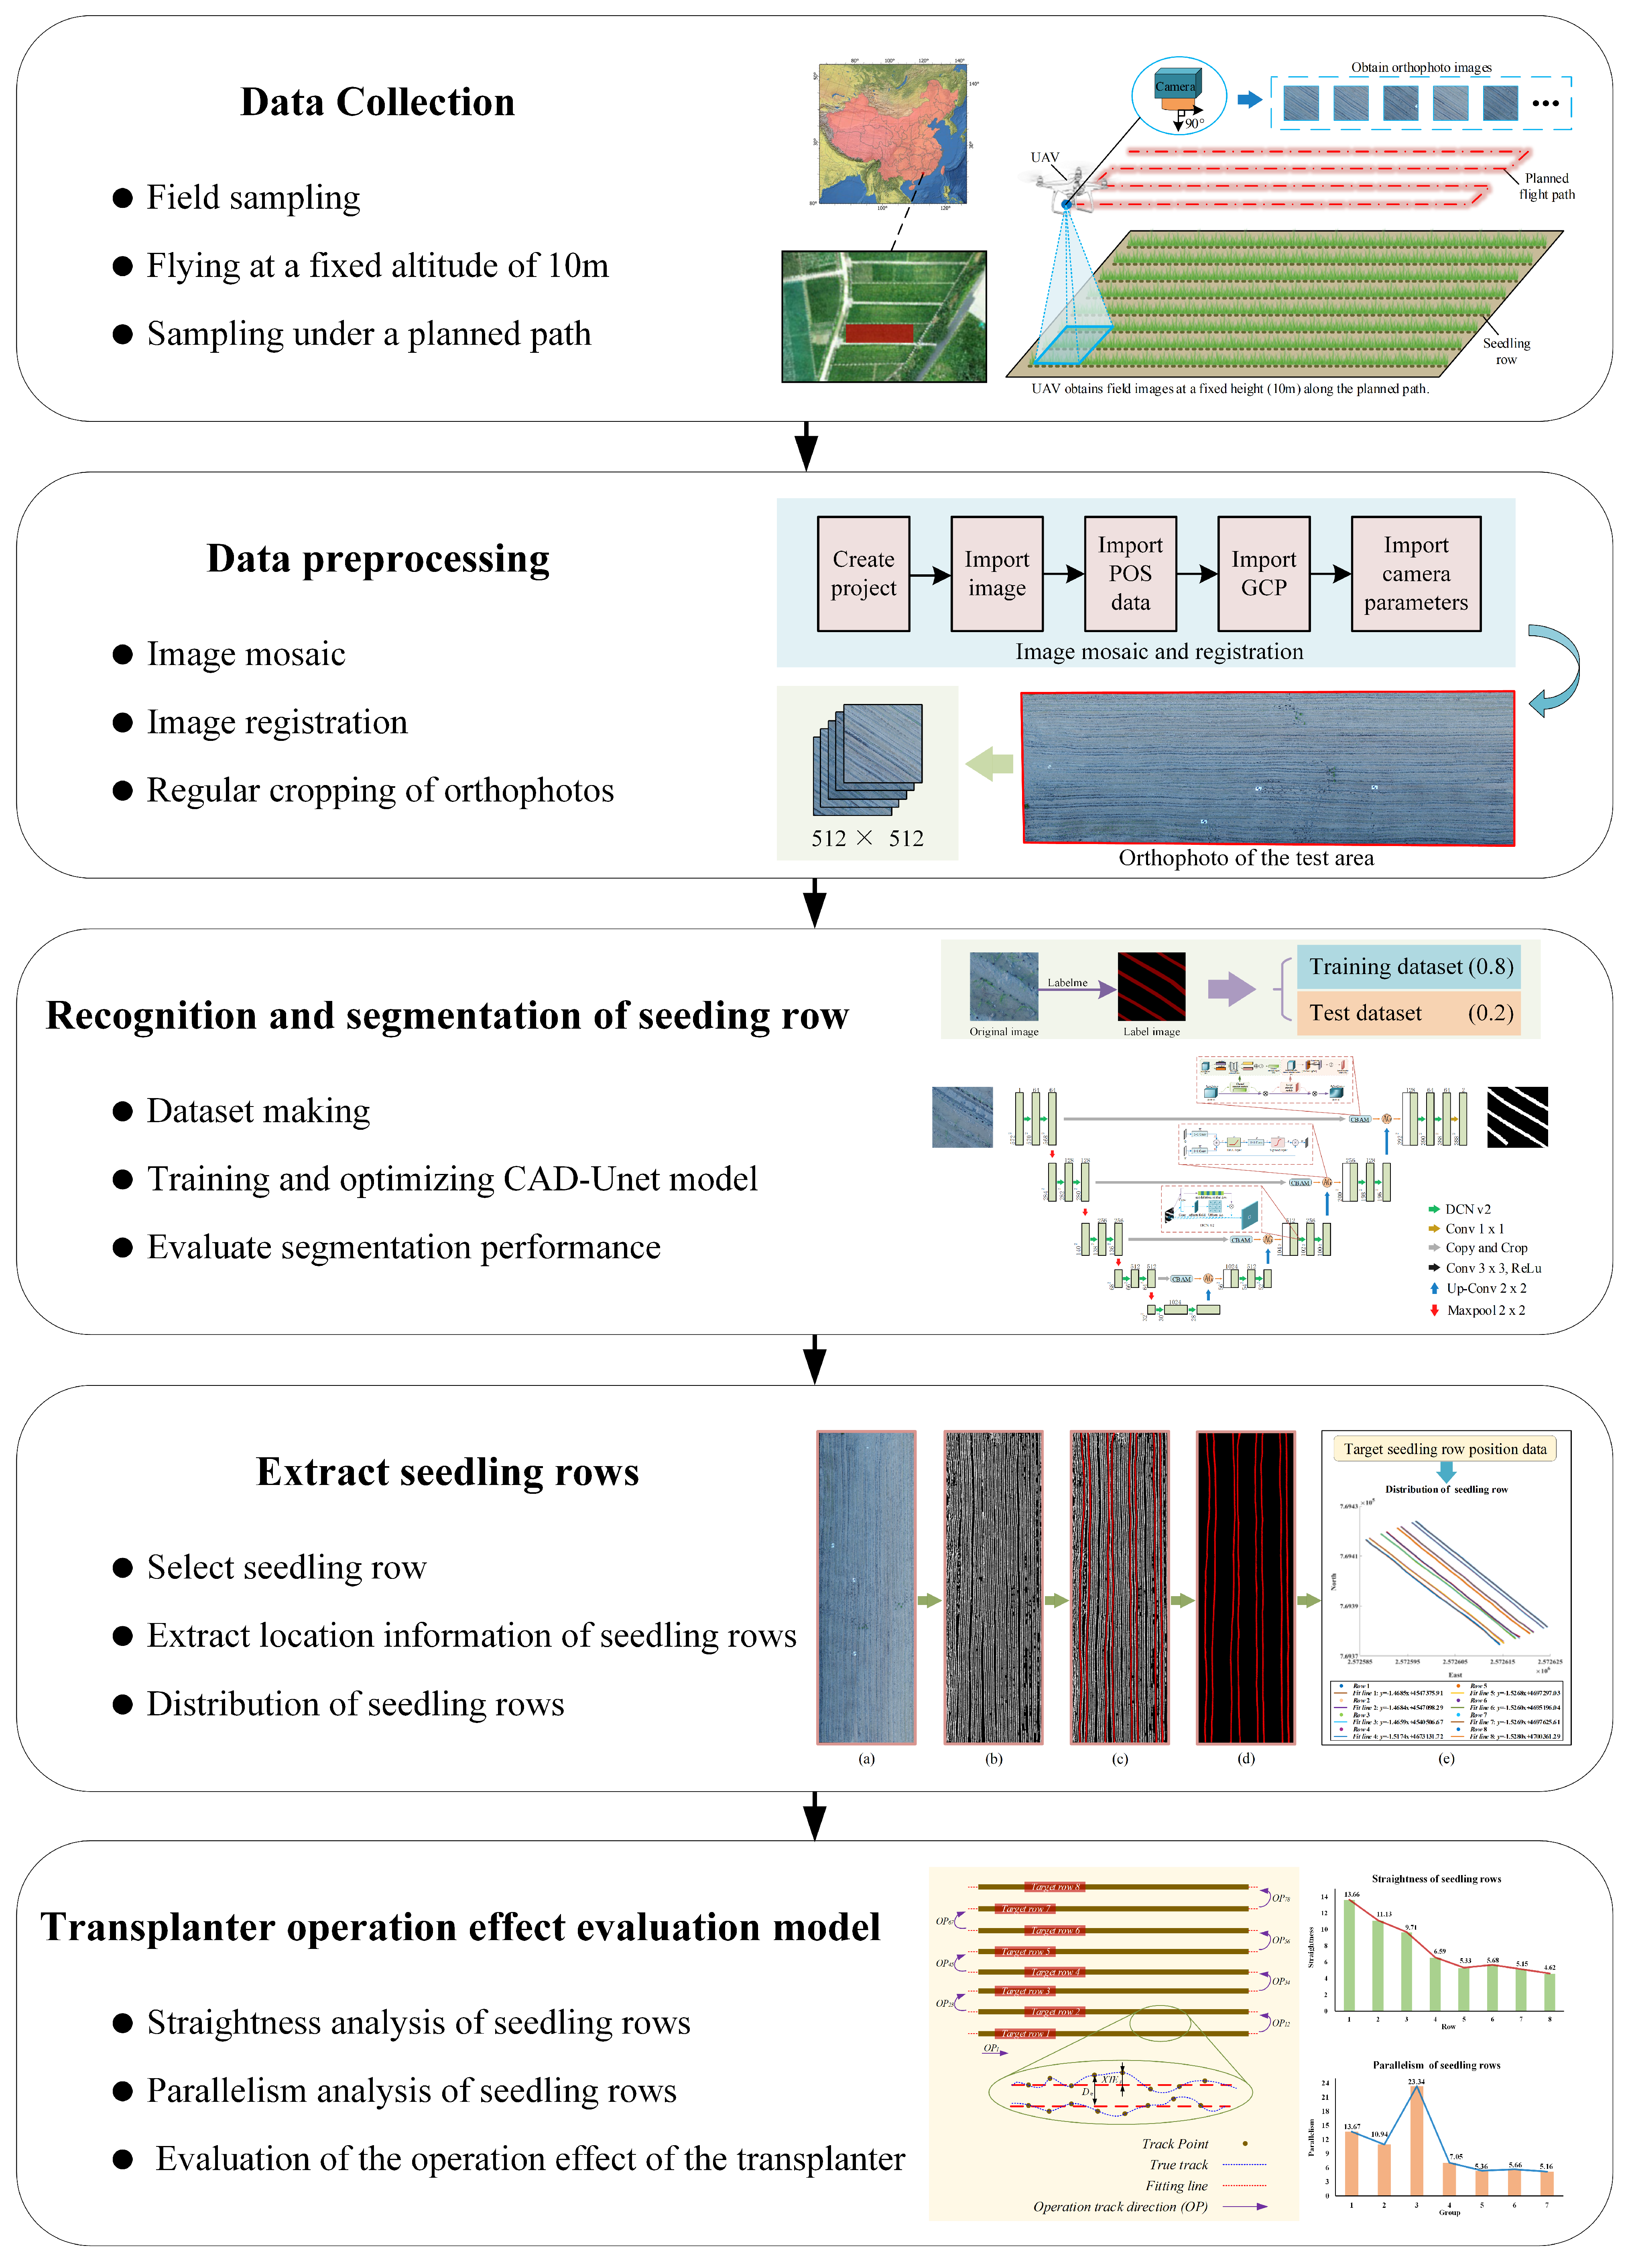
2. Materials and Methods
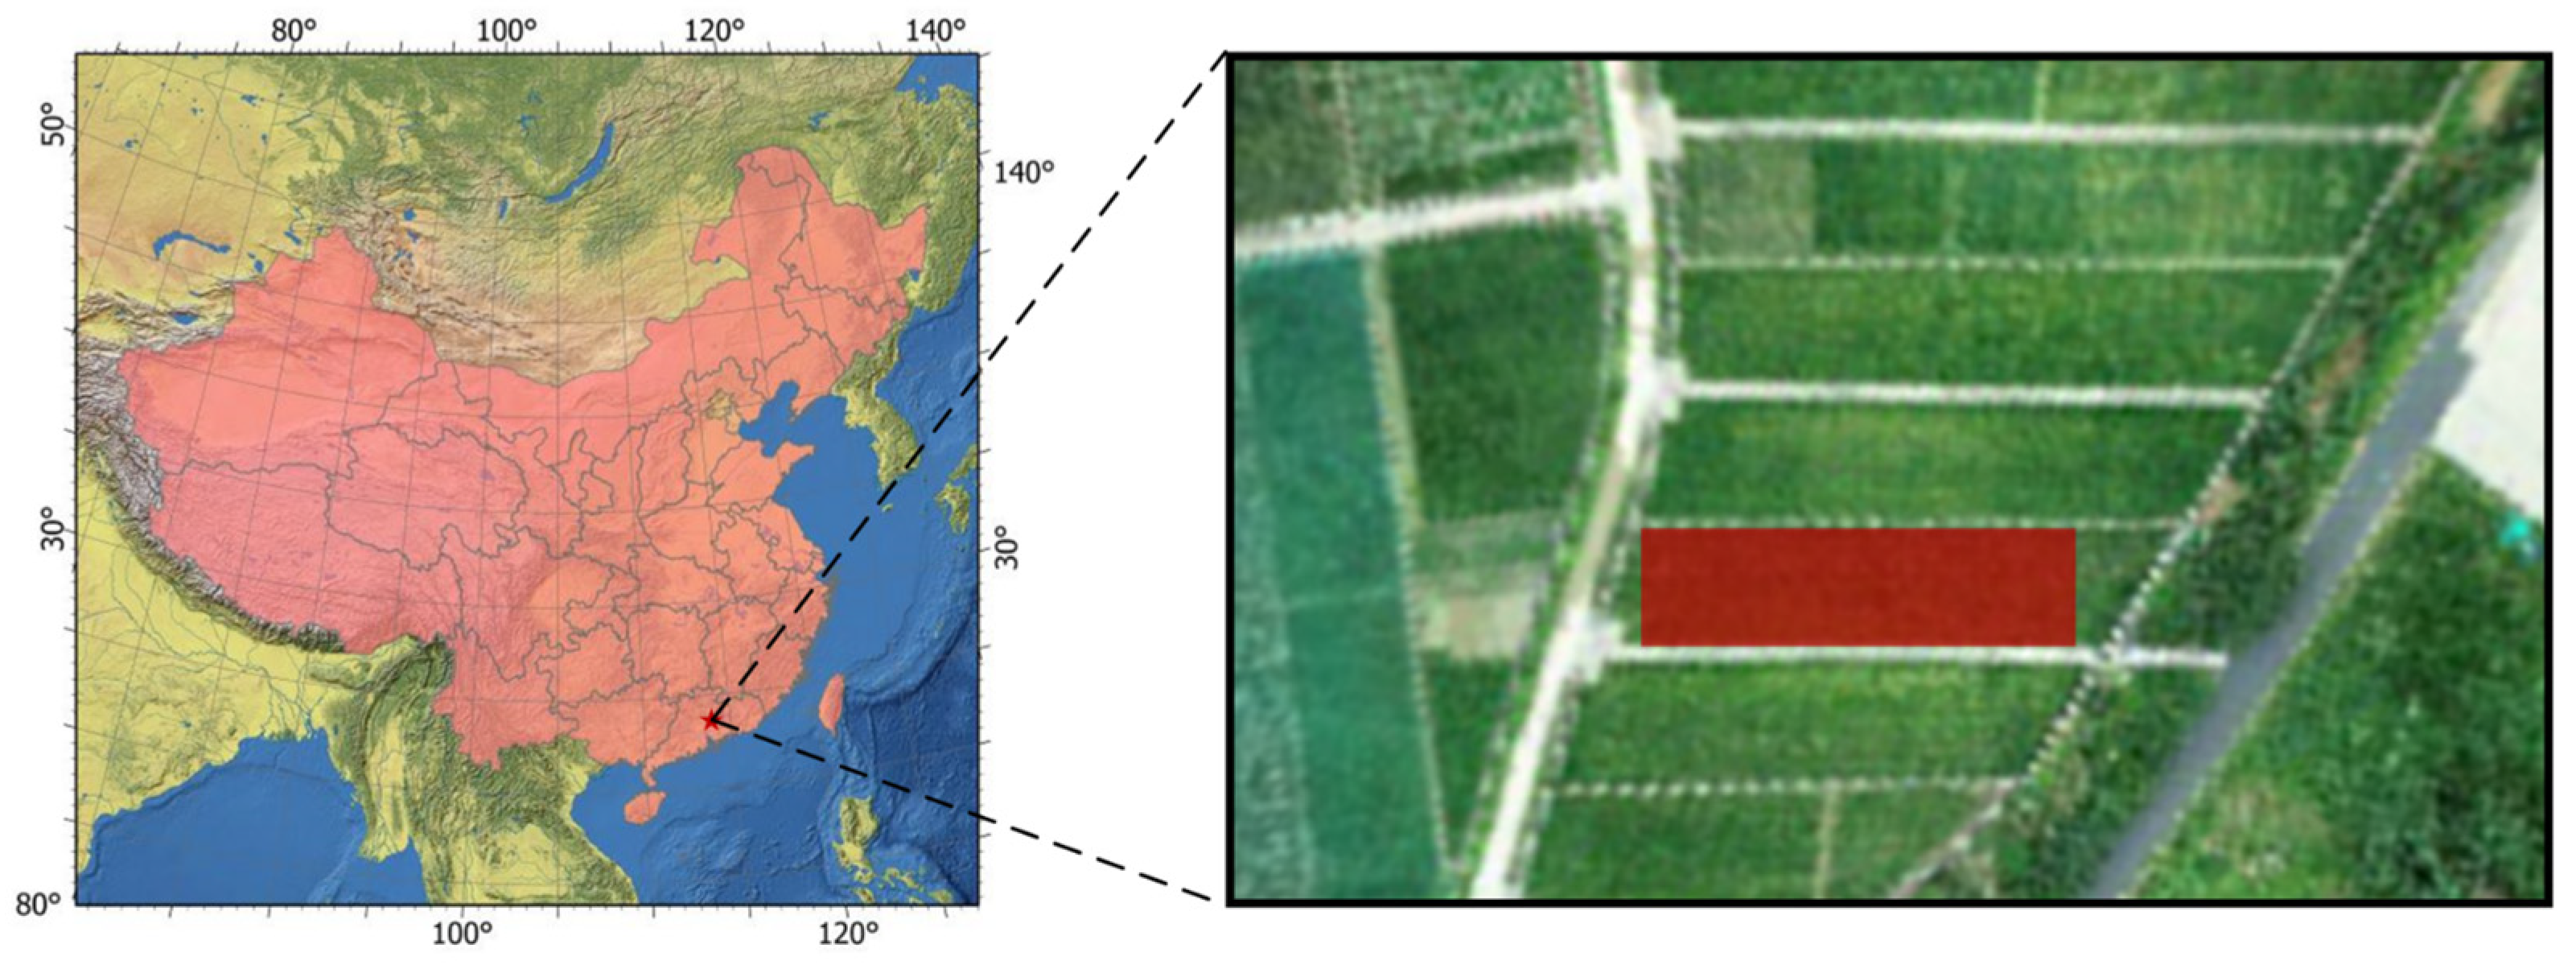
2.1. Study Area
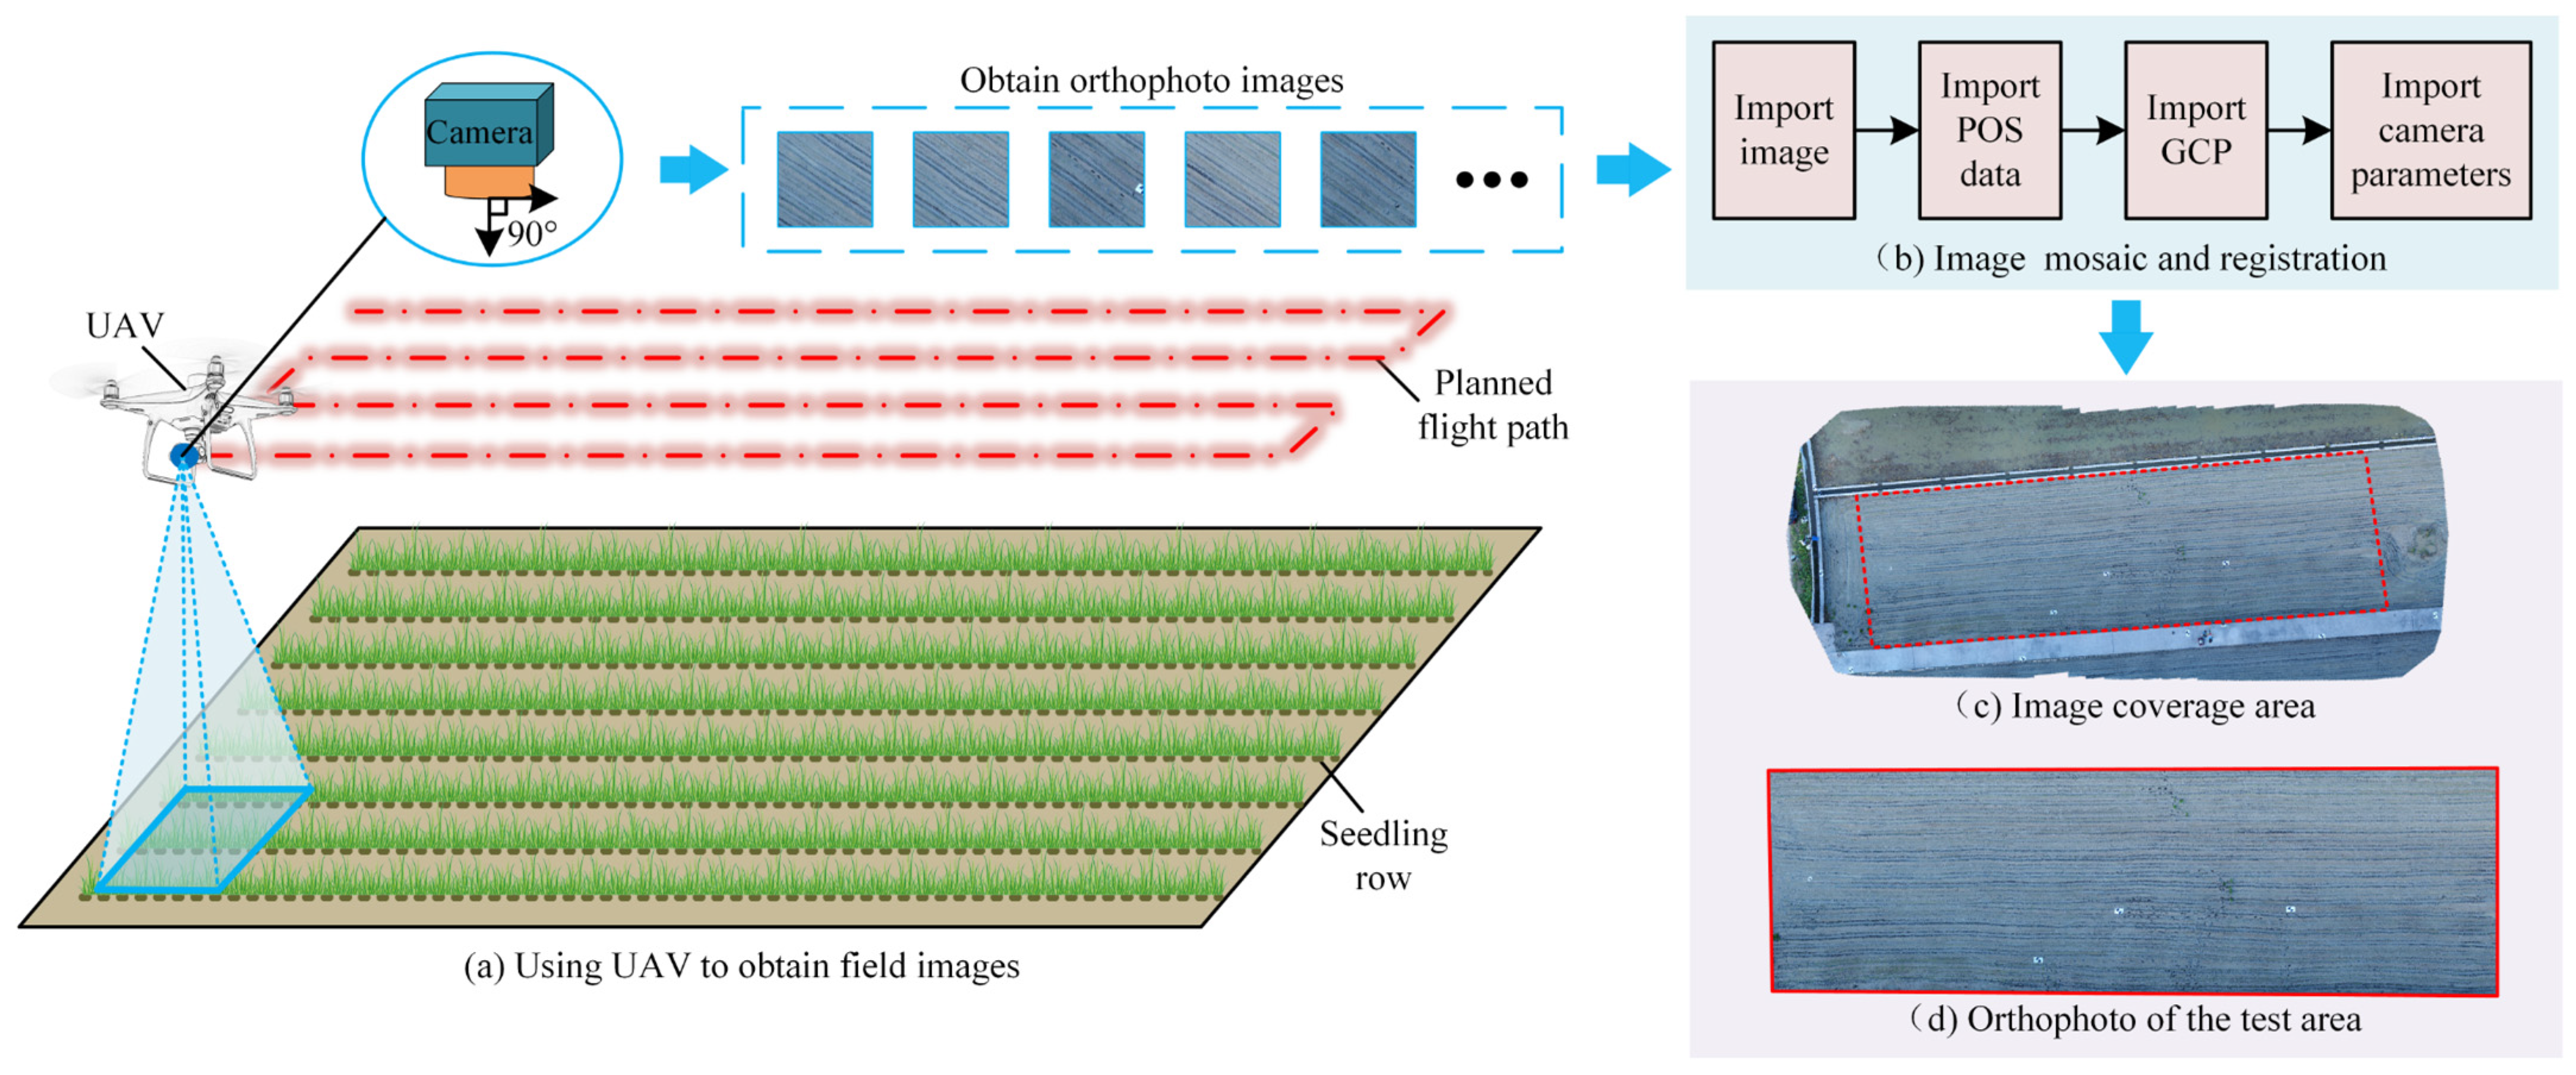
2.2. Remote Sensing Image Collection and Preprocessing
2.2.1. Remote Sensing Image Acquisition and Stitching
2.2.2. Construction of Training Sample Sets
2.3. Construction of Seedling Row Extraction Model
2.3.1. CAD-UNet
- (1)
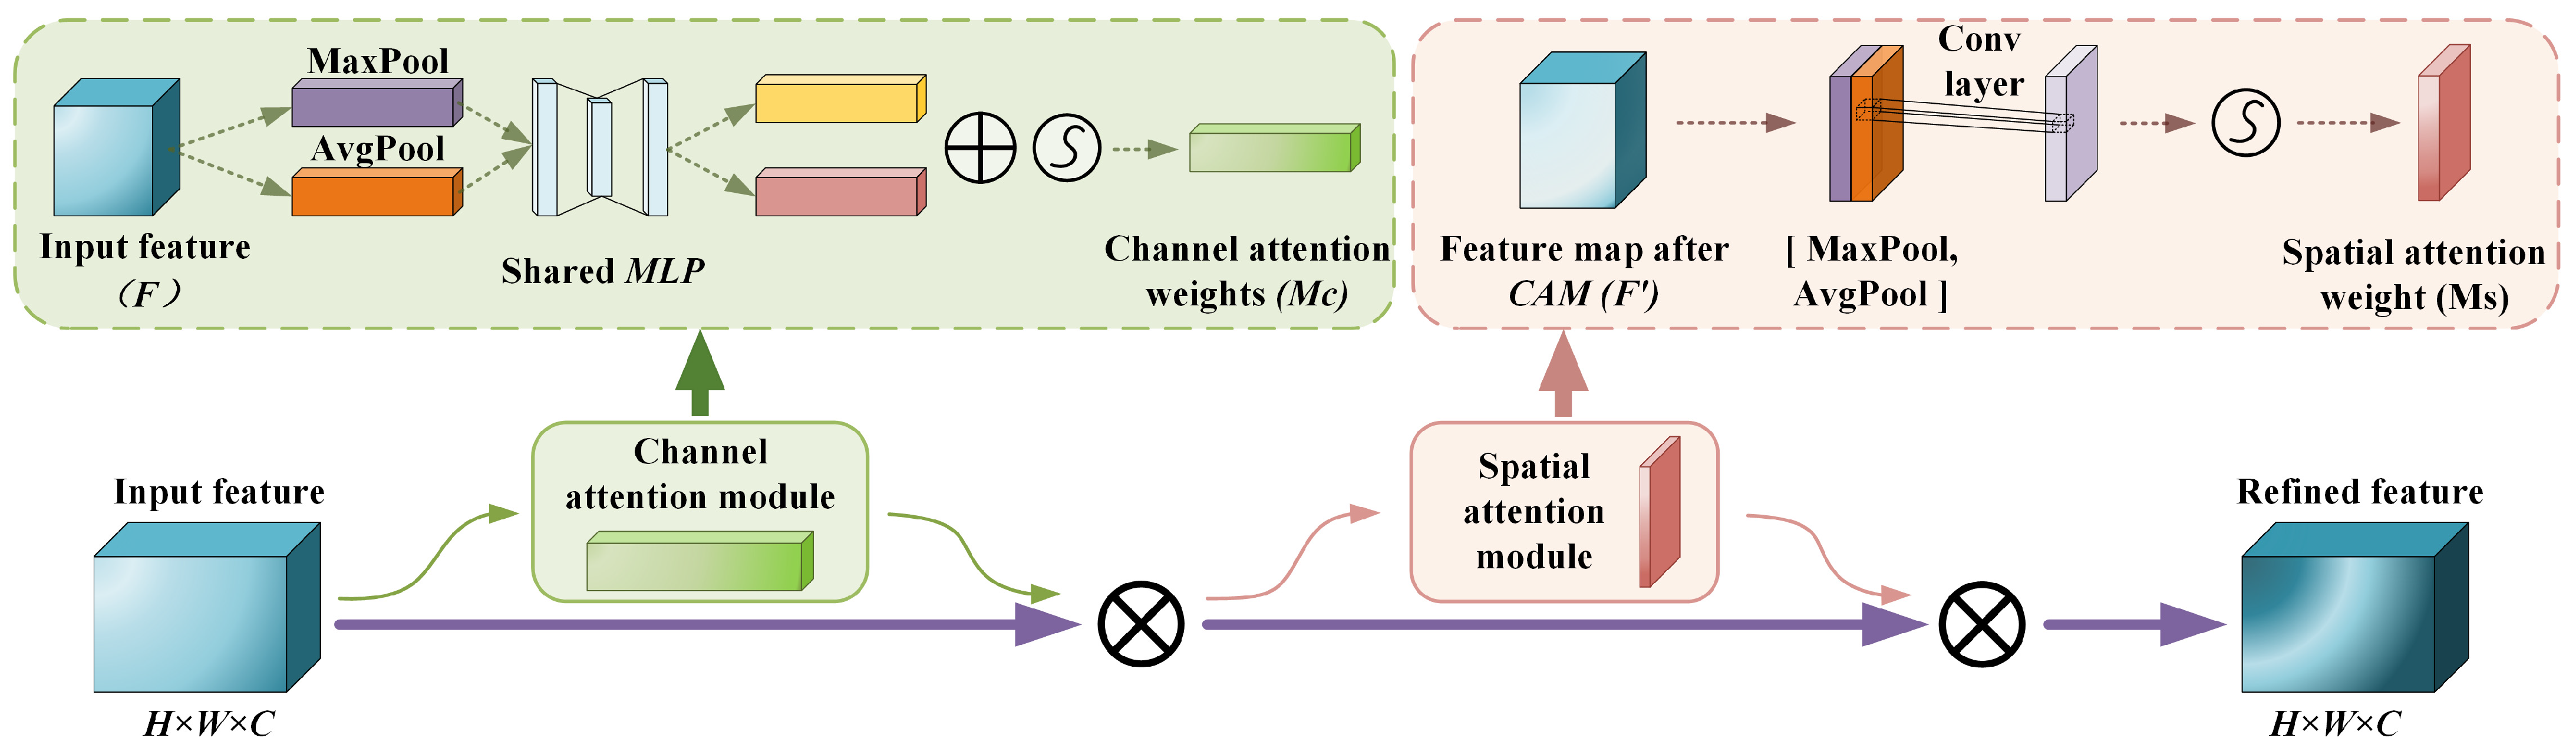
- Convolutional Block Attention Module (CBAM)
- (2)
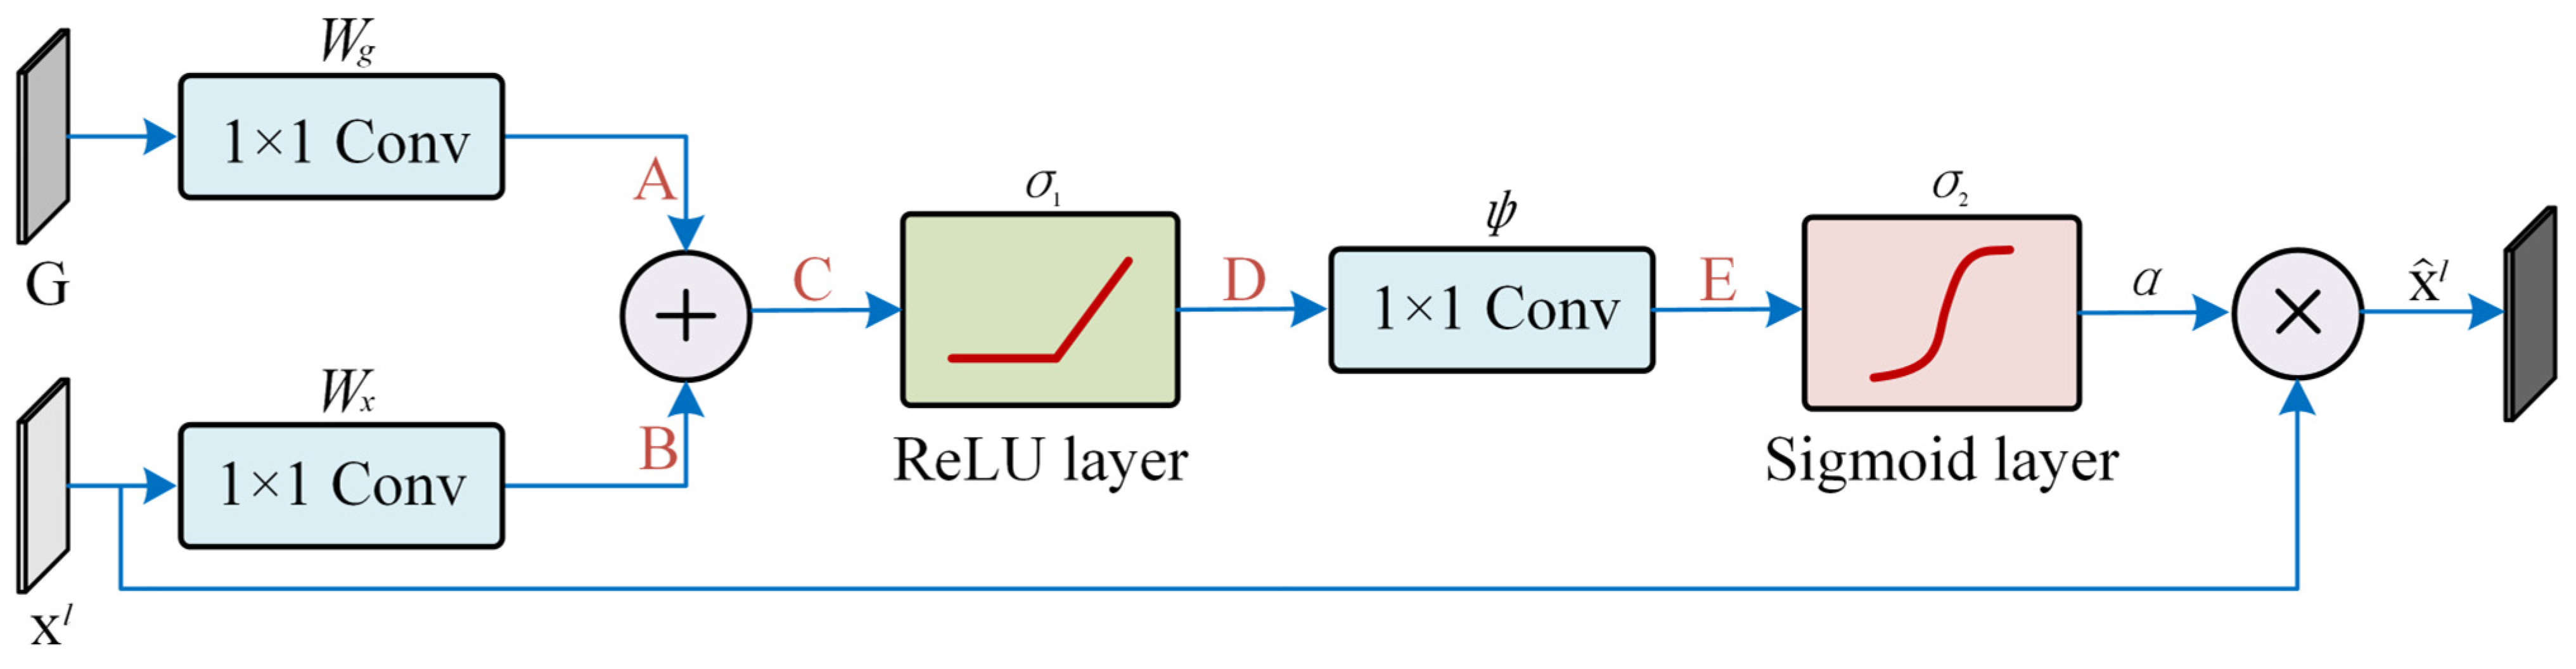
- Attention Gate (AG)
- (3)
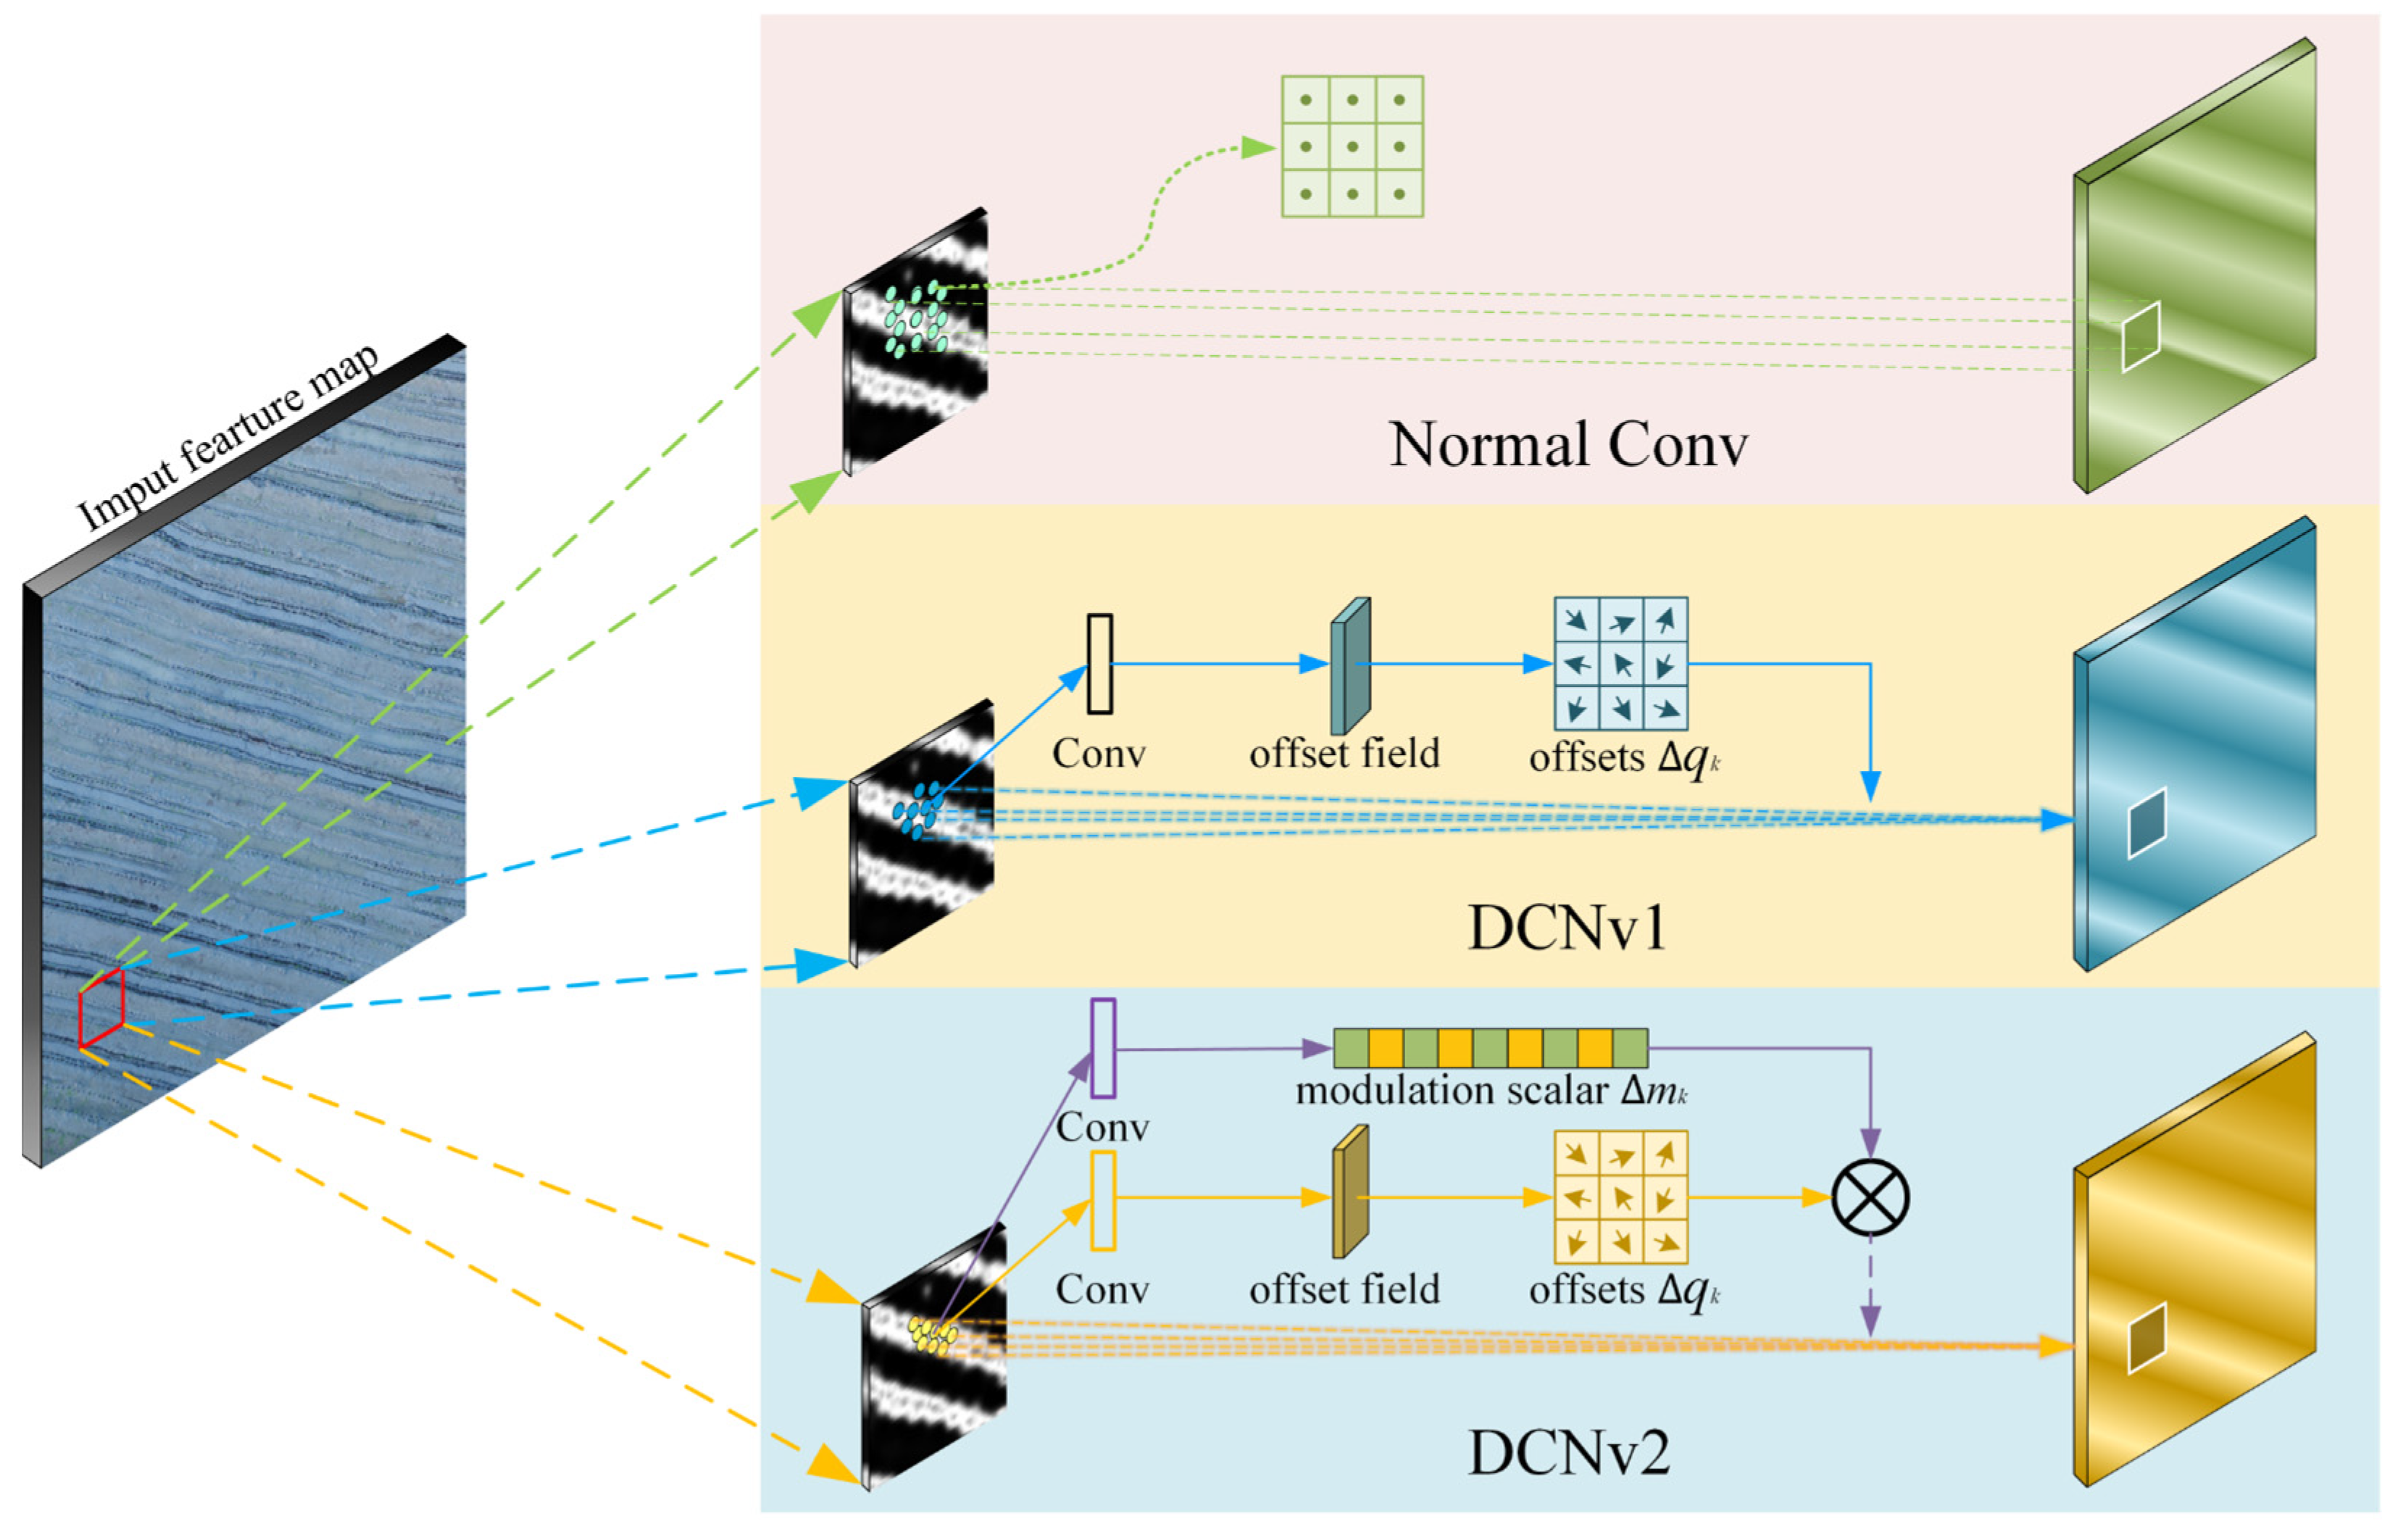
- Deformable Convolutional Networks (DCNs)
2.3.2. Model Training Parameters and Performance Evaluation
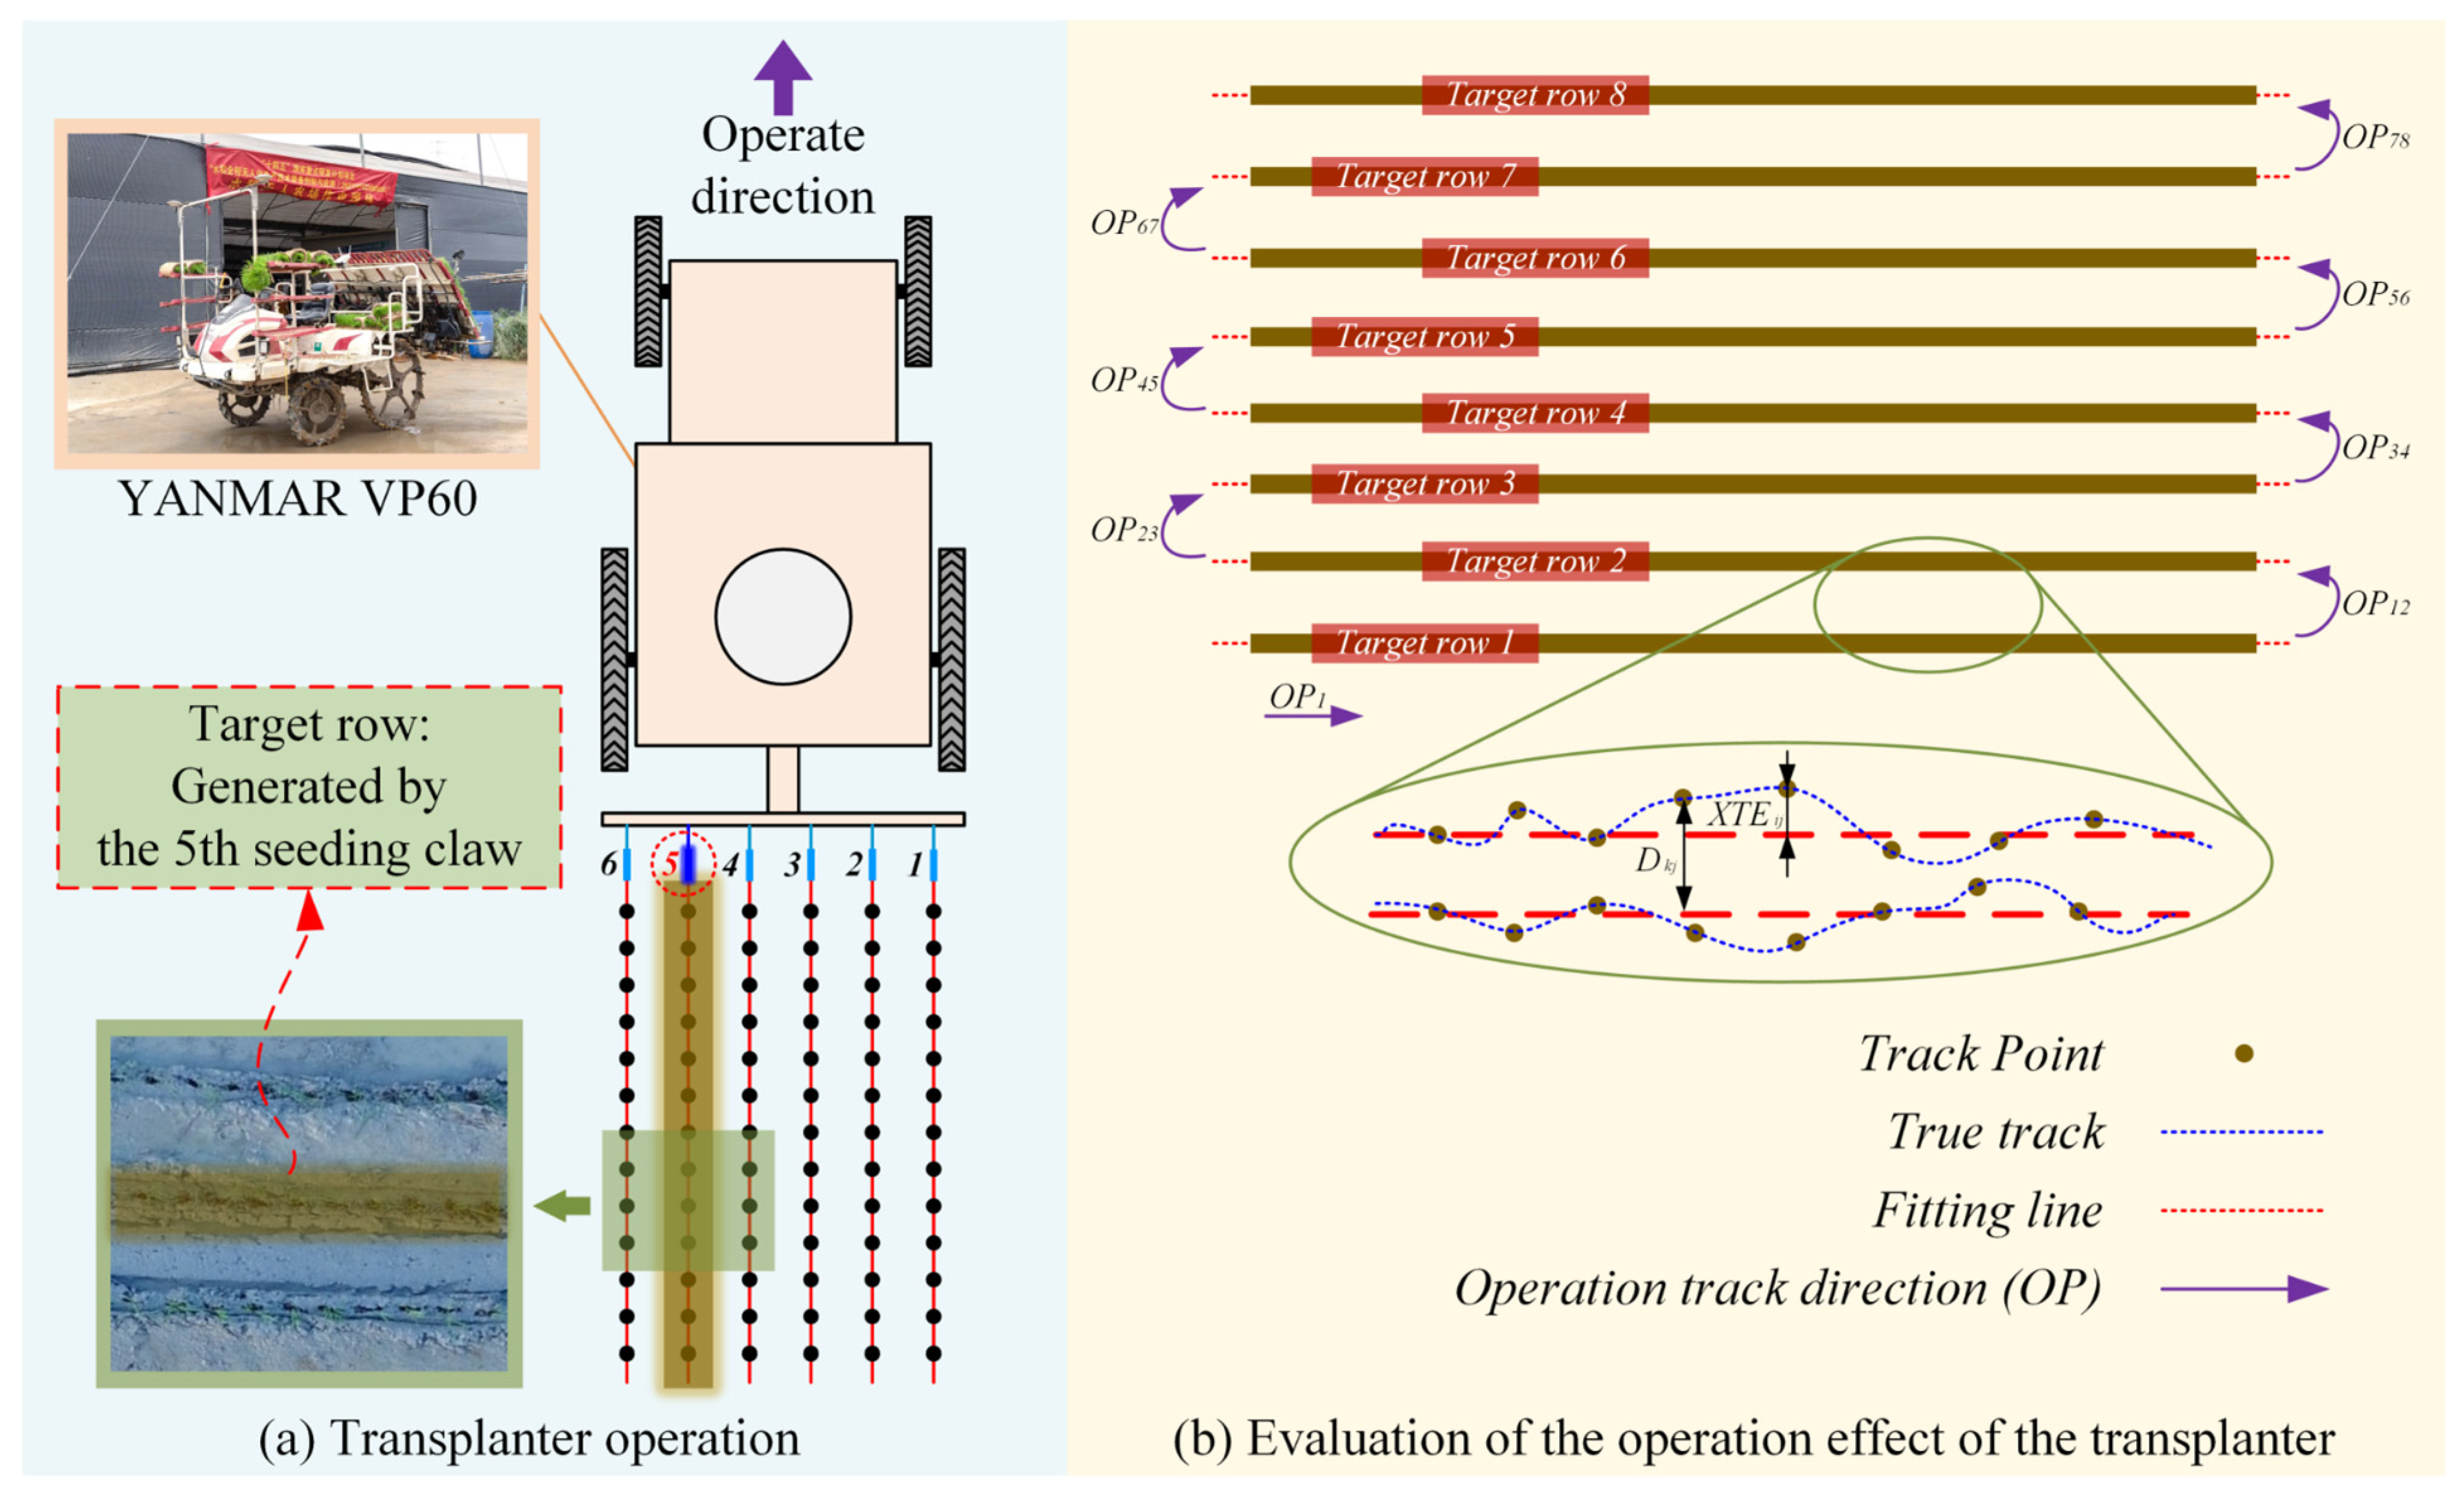
2.4. Rice Transplanter Operation Effectiveness Evaluation
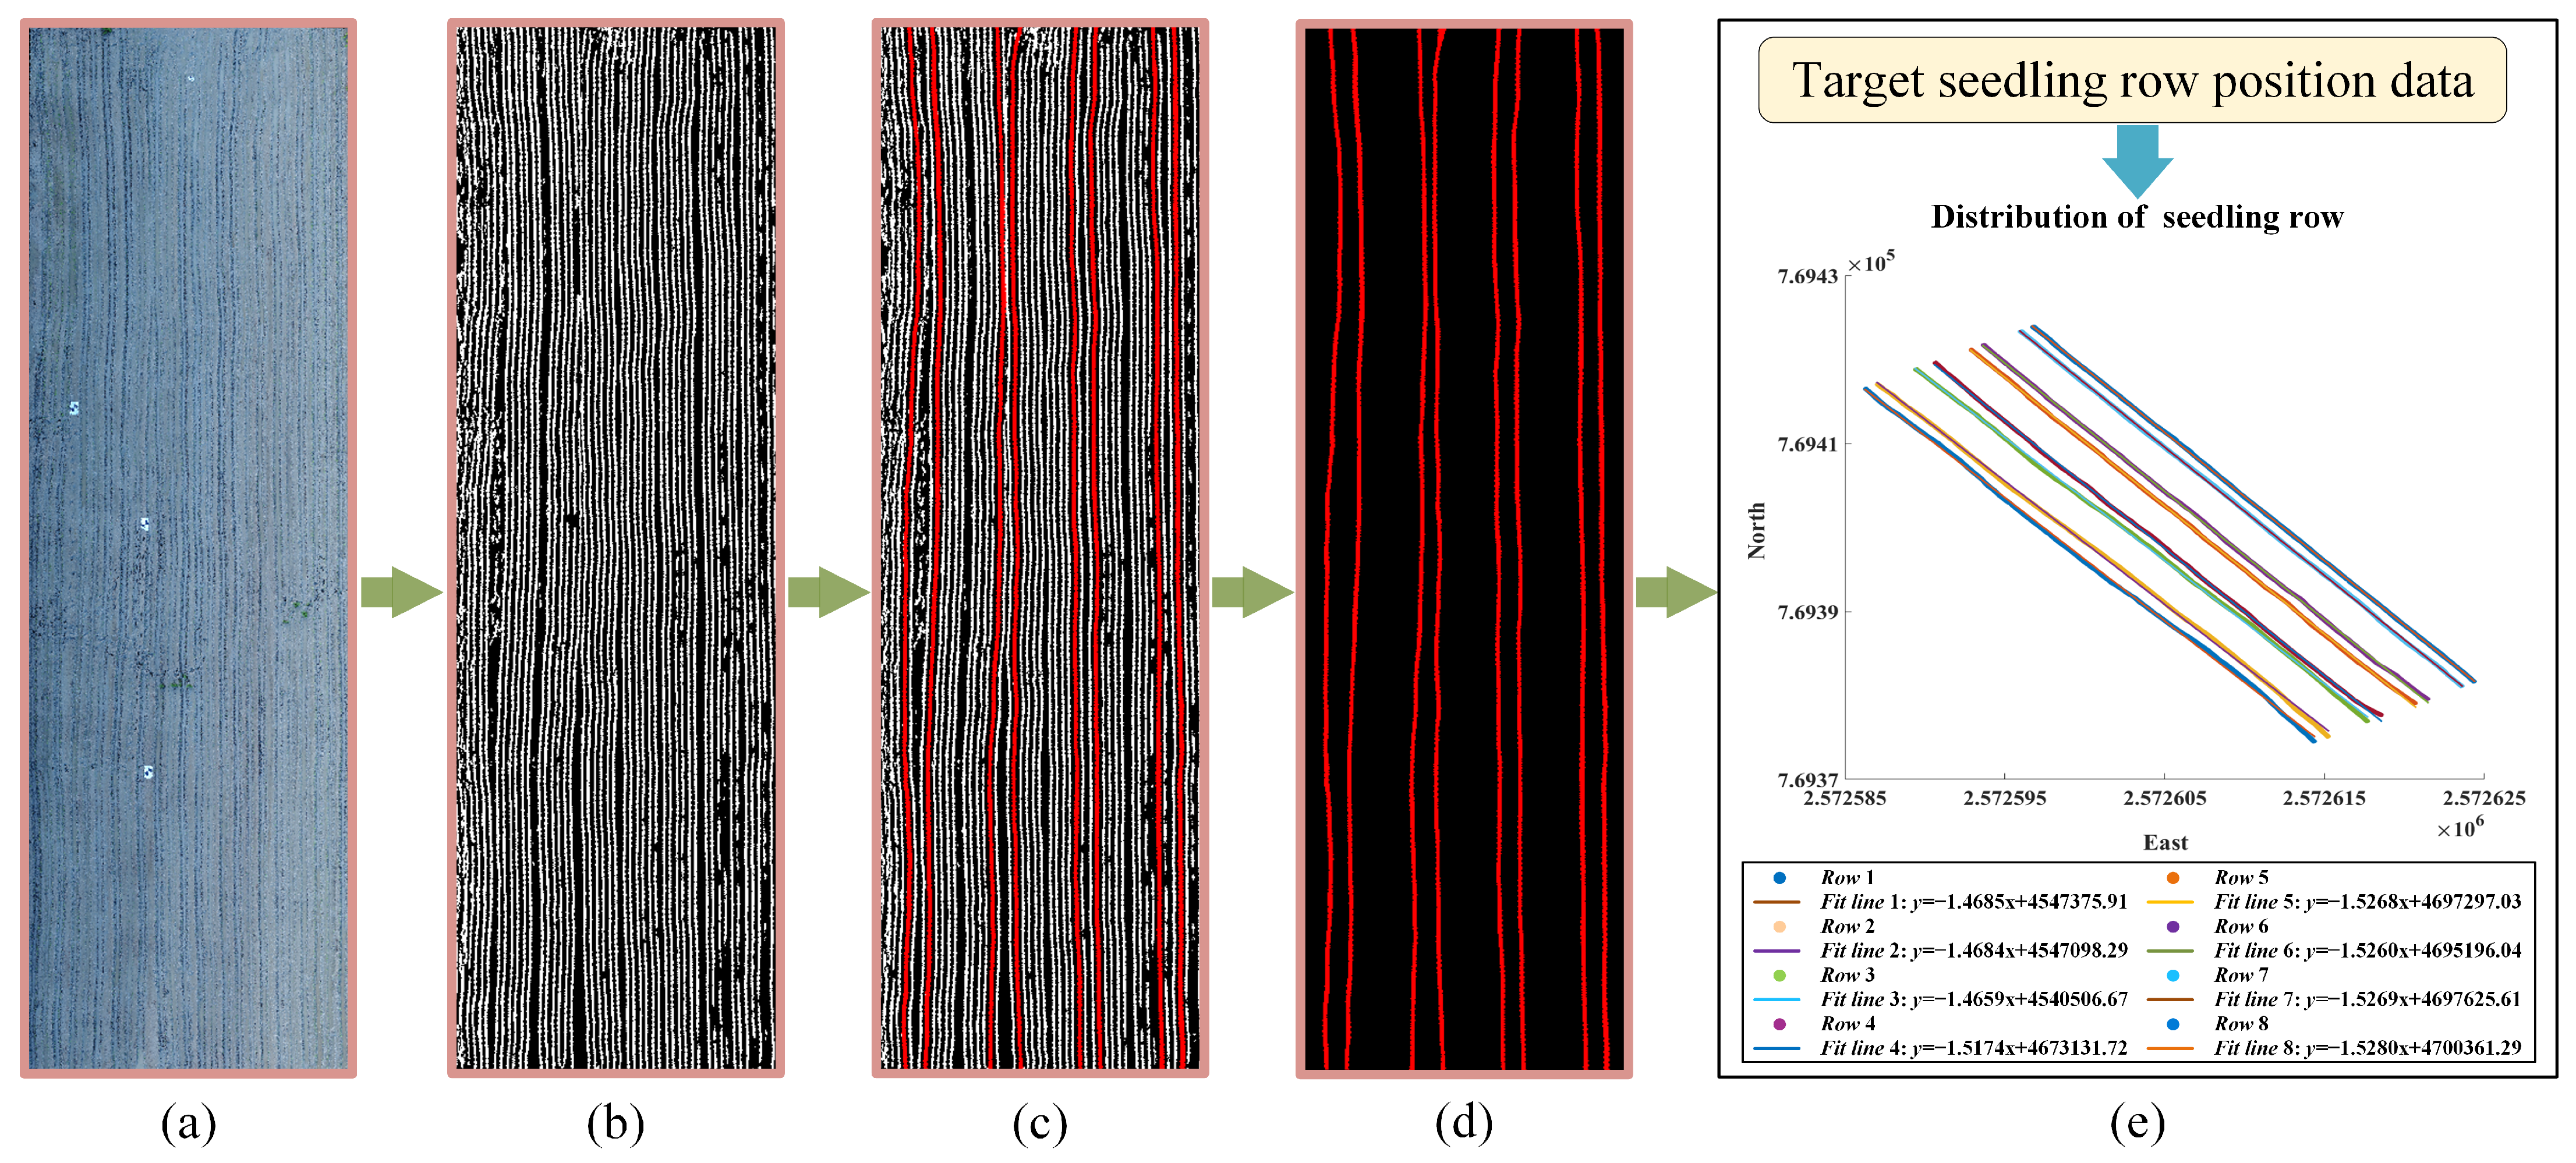
2.4.1. Extract Target Seedling Rows
2.4.2. Evaluation Indicators for Rice Transplanter Operation Quality
- (1).
- Straightness
- (2).
- Parallelism
3. Results
3.1. Performance Comparison of Different Models
3.2. Ablation Experiment
3.3. Analysis of the Operation Effectiveness of Transplanter
3.3.1. Straightness of Rice Transplanter Operation
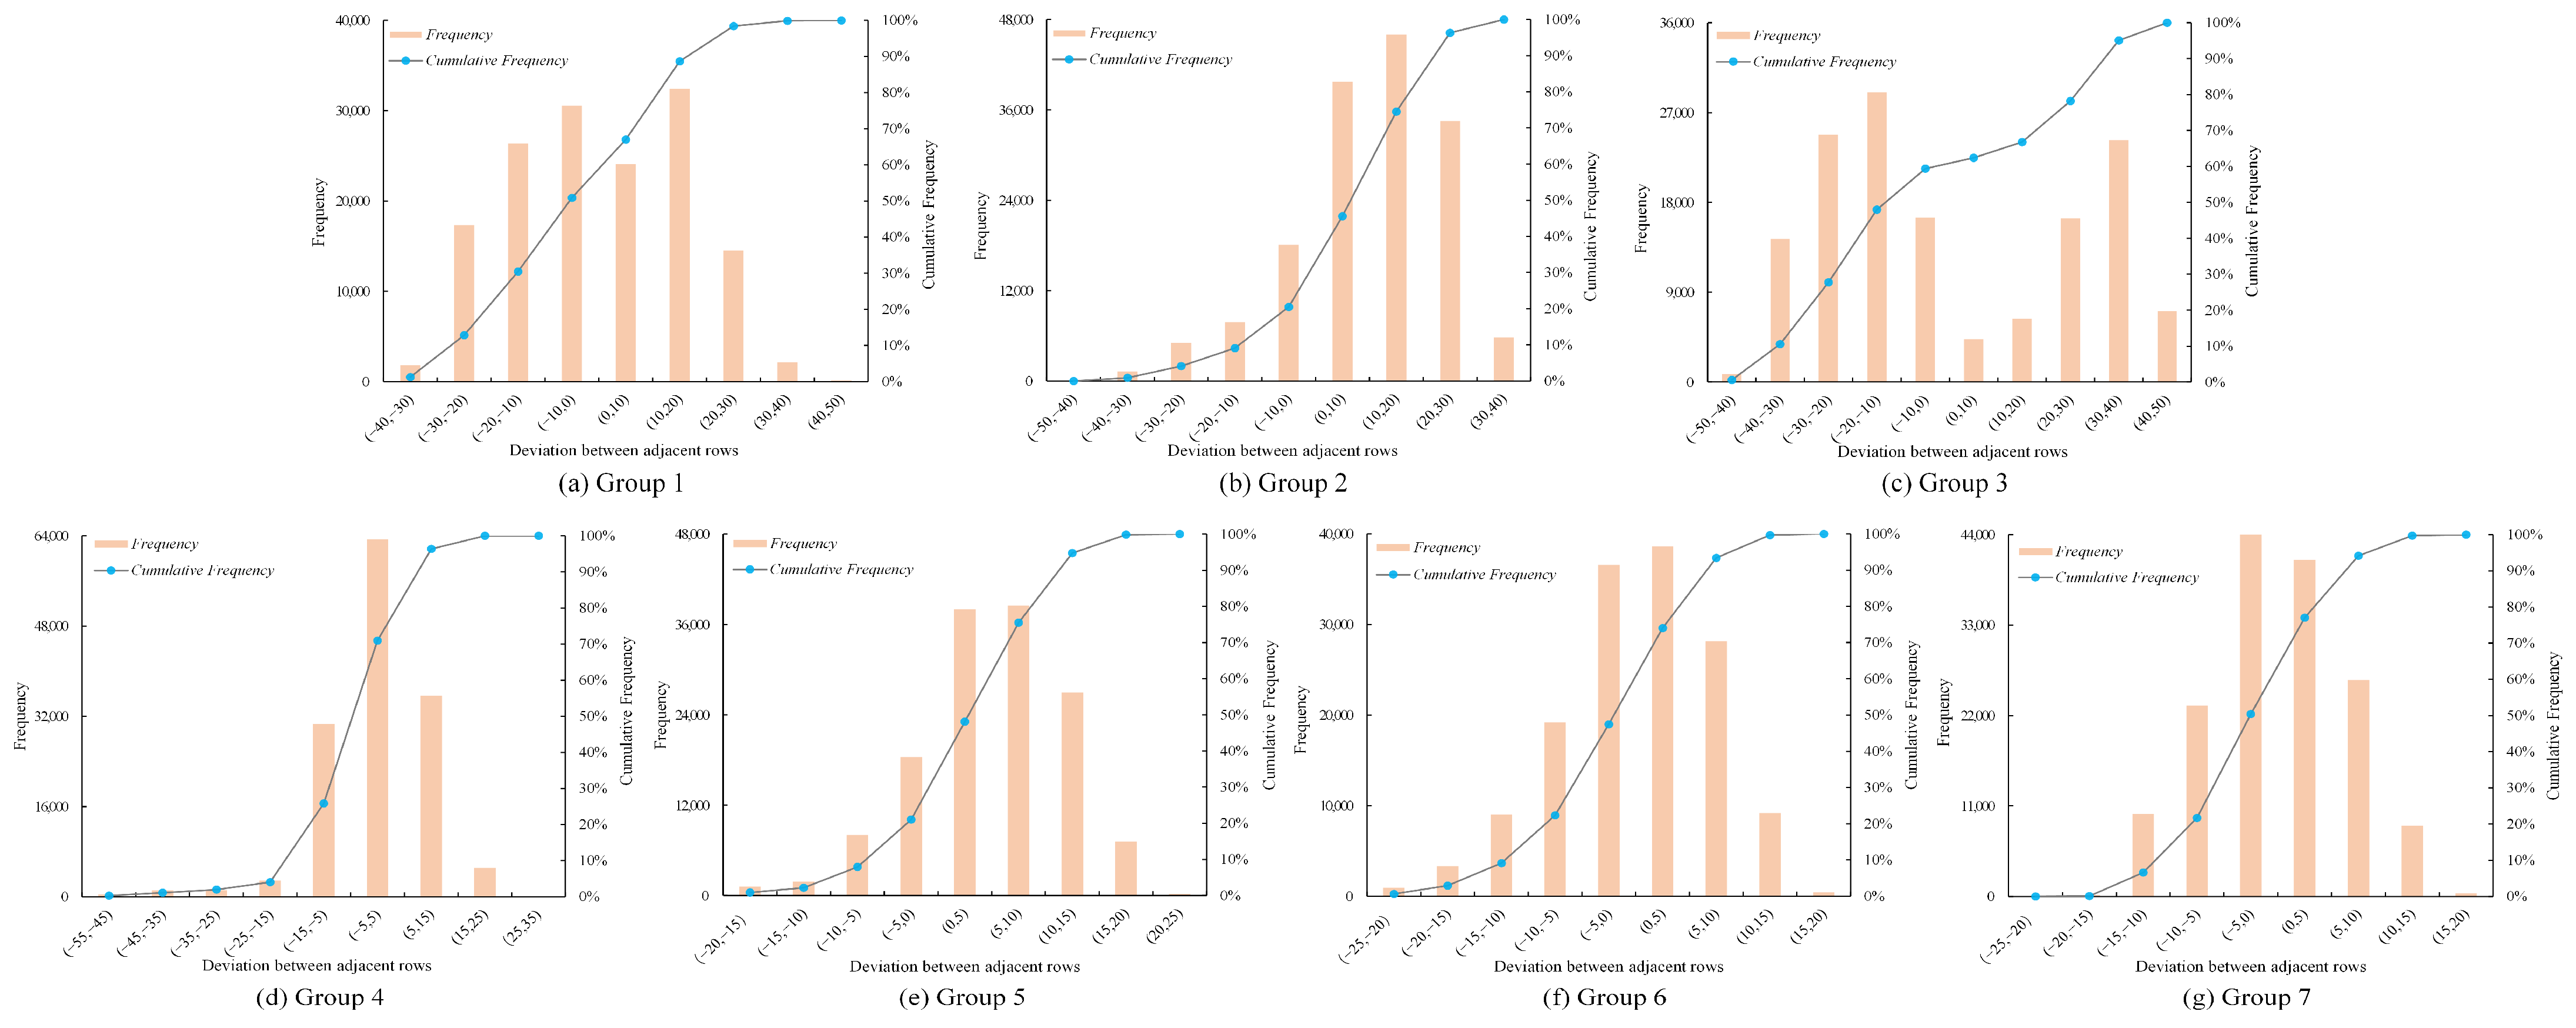
3.3.2. Parallelism of Rice Transplanter Operation
4. Discussion
- (1)
- Expand the scope and depth of evaluation. Future research can try to introduce agricultural machinery satellite navigation operation data to expand the evaluation scale, such as combining indicators such as land utilization rate to comprehensively analyze the quality of agricultural machinery operations, and further promote the improvement of the standardized management level of agricultural machinery field operations.
- (2)
- Optimize model design and reasoning efficiency. In the design of future seedling row extraction models, compression techniques such as model pruning and knowledge distillation will be used, and lightweight clipping type segmentation networks will be given priority to reduce model size and computational complexity, thereby improving reasoning efficiency.
- (3)
- Explore self-supervised learning methods. The quantity and quality of labeled data determine the accuracy and reliability of the final recognition results. However, it is obvious that collecting and generating paddy field seedling samples is very time-consuming. Therefore, future research can try deep learning self-supervised methods, which have the potential to perform image segmentation tasks in large and complex scenes using a limited number of manually labeled data samples, thereby achieving accuracy comparable to fully supervised methods.
5. Conclusions
Author Contributions
Funding
Data Availability Statement
Acknowledgments
Conflicts of Interest
References
- Cisternas, I.; Velásquez, I.; Caro, A.; Rodríguez, A. Systematic literature review of implementations of precision agriculture. Comput. Electron. Agric. 2020, 176, 105626. [Google Scholar] [CrossRef]
- Mathenge, M.; Sonneveld, B.G.J.S.; Broerse, J.E.W. Application of GIS in Agriculture in Promoting Evidence-Informed Decision Making for Improving Agriculture Sustainability: A Systematic Review. Sustainability 2022, 14, 9974. [Google Scholar] [CrossRef]
- Delavarpour, N.; Koparan, C.; Nowatzki, J.; Bajwa, S.; Sun, X. A Technical Study on UAV Characteristics for Precision Agriculture Applications and Associated Practical Challenges. Remote Sens. 2021, 13, 1204. [Google Scholar] [CrossRef]
- Pérez-Ruiz, M.; Slaughter, D.; Gliever, C.; Upadhyaya, S. Automatic GPS-based intra-row weed knife control system for transplanted row crops. Comput. Electron. Agric. 2012, 80, 41–49. [Google Scholar] [CrossRef]
- Yang, L.; Wang, X.; Li, Y.; Xie, Z.; Xu, Y.; Han, R.; Wu, C. Identifying Working Trajectories of the Wheat Harvester In-Field Based on K-Means Algorithm. Agriculture 2022, 12, 1837. [Google Scholar] [CrossRef]
- Tian, Y.; Mai, Z.; Zeng, Z.; Cai, Y.; Yang, J.; Zhao, B.; Zhu, X.; Qi, L. Design and experiment of an integrated navigation system for a paddy field scouting robot. Comput. Electron. Agric. 2023, 214, 108336. [Google Scholar] [CrossRef]
- Yao, Z.; Zhao, C.; Zhang, T. Agricultural machinery automatic navigation technology. iScience 2023, 27, 108714. [Google Scholar] [CrossRef] [PubMed]
- Nguyen, N.V.; Cho, W. Performance Evaluation of a Typical Low-Cost Multi-Frequency Multi-GNSS Device for Positioning and Navigation in Agriculture—Part 2: Dynamic Testing. AgriEngineering 2023, 5, 127–140. [Google Scholar] [CrossRef]
- Ma, Z.; Yin, C.; Du, X.; Zhao, L.; Lin, L.; Zhang, G.; Wu, C. Rice row tracking control of crawler tractor based on the satellite and visual integrated navigation. Comput. Electron. Agric. 2022, 197, 106935. [Google Scholar] [CrossRef]
- Perez-Ruiz, M.; Slaughter, D.C.; Gliever, C.; Upadhyaya, S.K. Tractor-based Real-time Kinematic-Global Positioning System (RTK-GPS) guidance system for geospatial mapping of row crop transplant. Biosyst. Eng. 2012, 111, 64–71. [Google Scholar] [CrossRef]
- Cao, M.; Tang, F.; Ji, P.; Ma, F. Improved real-time semantic segmentation network model for crop vision navigation line detection. Front. Plant Sci. 2022, 13, 898131. [Google Scholar] [CrossRef] [PubMed]
- García-Santillán, I.D.; Montalvo, M.; Guerrero, J.M.; Pajares, G. Automatic detection of curved and straight crop rows from images in maize fields. Biosyst. Eng. 2017, 156, 61–79. [Google Scholar] [CrossRef]
- García-Santillán, I.; Guerrero, J.M.; Montalvo, M.; Pajares, G. Curved and straight crop row detection by accumulation of green pixels from images in maize fields. Precis. Agric. 2018, 19, 18–41. [Google Scholar] [CrossRef]
- Wu, S.; Chen, Z.; Bangura, K.; Jiang, J.; Ma, X.; Li, J.; Peng, B.; Meng, X.; Qi, L. A navigation method for paddy field management based on seedlings coordinate information. Comput. Electron. Agric. 2023, 215, 108436. [Google Scholar] [CrossRef]
- Wang, Y.; Fu, Q.; Ma, Z.; Tian, X.; Ji, Z.; Yuan, W.; Kong, Q.; Gao, R.; Su, Z. YOLOv5-AC: A Method of Uncrewed Rice Transplanter Working Quality Detection. Agronomy 2023, 13, 2279. [Google Scholar] [CrossRef]
- Pang, Y.; Shi, Y.; Gao, S.; Jiang, F.; Veeranampalayam-Sivakumar, A.-N.; Thompson, L.; Luck, J.; Liu, C. Improved crop row detection with deep neural network for early-season maize stand count in UAV imagery. Comput. Electron. Agric. 2020, 178, 105766. [Google Scholar] [CrossRef]
- Li, D.; Li, B.; Feng, H.; Kang, S.; Wang, J.; Wei, Z. Low-altitude remote sensing-based global 3D path planning for precision navigation of agriculture vehicles-beyond crop row detection. ISPRS J. Photogramm. Remote Sens. 2024, 210, 25–38. [Google Scholar] [CrossRef]
- Rabab, S.; Badenhorst, P.; Chen, Y.-P.P.; Daetwyler, H.D. A template-free machine vision-based crop row detection algorithm. Precis. Agric. 2021, 22, 124–153. [Google Scholar] [CrossRef]
- Grayson, B.; Penna, N.T.; Mills, J.P.; Grant, D.S. GPS precise point positioning for UAV photogrammetry. Photogramm. Rec. 2018, 33, 427–447. [Google Scholar] [CrossRef]
- De Silva, R.; Cielniak, G.; Wang, G.; Gao, J. Deep learning-based crop row detection for infield navigation of agri-robots. J. Field Robot. 2024, 41, 2299–2321. [Google Scholar] [CrossRef]
- Teshome, F.T.; Bayabil, H.K.; Hoogenboom, G.; Schaffer, B.; Singh, A.; Ampatzidis, Y. Unmanned aerial vehicle (UAV) imaging and machine learning applications for plant phenotyping. Comput. Electron. Agric. 2023, 212, 108064. [Google Scholar] [CrossRef]
- Khan, M.N.; Rahi, A.; Rajendran, V.P.; Al Hasan, M.; Anwar, S. Real-time crop row detection using computer vision-application in agricultural robots. Front. Artif. Intell. 2024, 7, 1435686. [Google Scholar] [CrossRef]
- Zhang, S.; Liu, Y.; Xiong, K.; Tian, Y.; Du, Y.; Zhu, Z.; Du, M.; Zhai, Z. A review of vision-based crop row detection method: Focusing on field ground autonomous navigation operations. Comput. Electron. Agric. 2024, 222, 109086. [Google Scholar] [CrossRef]
- Ruan, Z.; Chang, P.; Cui, S.; Luo, J.; Gao, R.; Su, Z. A precise crop row detection algorithm in complex farmland for unmanned agricultural machines. Biosyst. Eng. 2023, 232, 1–12. [Google Scholar] [CrossRef]
- Bah, M.D.; Hafiane, A.; Canals, R. Deep learning with unsupervised data labeling for weed detection in line crops in UAV images. Remote Sens. 2018, 10, 1690. [Google Scholar] [CrossRef]
- Tenhunen, H.; Pahikkala, T.; Nevalainen, O.; Teuhola, J.; Mattila, H.; Tyystjärvi, E. Automatic detection of cereal rows by means of pattern recognition techniques. Comput. Electron. Agric. 2019, 162, 677–688. [Google Scholar] [CrossRef]
- Zhang, X.; Li, X.; Zhang, B.; Zhou, J.; Tian, G.; Xiong, Y.; Gu, B. Automated robust crop-row detection in maize fields based on position clustering algorithm and shortest path method. Comput. Electron. Agric. 2018, 154, 165–175. [Google Scholar] [CrossRef]
- Chen, P.; Ma, X.; Wang, F.; Li, J. A new method for crop row detection using unmanned aerial vehicle images. Remote Sens. 2021, 13, 3526. [Google Scholar] [CrossRef]
- Li, Y.; Zhao, Z.; Luo, Y.; Qiu, Z. Real-Time Pattern-Recognition of GPR Images with YOLO v3 Implemented by Tensorflow. Sensors 2020, 20, 6476. [Google Scholar] [CrossRef] [PubMed]
- Li, Y.; Zhao, Z.; Xu, W.; Liu, Z.; Wang, X. An effective FDTD model for GPR to detect the material of hard objects buried in tillage soil layer. Soil Tillage Res. 2019, 195, 104353. [Google Scholar] [CrossRef]
- Guo, Z.; Cai, D.; Zhou, Y.; Xu, T.; Yu, F. Identifying rice field weeds from unmanned aerial vehicle remote sensing imagery using deep learning. Plant Methods 2024, 20, 105. [Google Scholar] [CrossRef]
- Punithavathi, R.; Rani, A.D.C.; Sughashini, K.; Kurangi, C.; Nirmala, M.; Ahmed, H.F.T.; Balamurugan, S. Computer Vision and Deep Learning-enabled Weed Detection Model for Precision Agriculture. Comput. Syst. Sci. Eng. 2023, 44, 2759–2774. [Google Scholar] [CrossRef]
- Lin, S.; Jiang, Y.; Chen, X.; Biswas, A.; Li, S.; Yuan, Z.; Wang, H.; Qi, L. Automatic detection of plant rows for a transplanter in paddy field using faster r-cnn. IEEE Access 2020, 8, 147231–147240. [Google Scholar] [CrossRef]
- Li, Y.; Wang, X.; Zhao, Z.; Han, S.; Liu, Z. Lagoon water quality monitoring based on digital image analysis and machine learning estimators. Water Res. 2020, 172, 115471. [Google Scholar] [CrossRef] [PubMed]
- Osco, L.P.; de Arruda, M.d.S.; Gonçalves, D.N.; Dias, A.; Batistoti, J.; de Souza, M.; Gomes, F.D.G.; Ramos, A.P.M.; de Castro Jorge, L.A.; Liesenberg, V. A CNN approach to simultaneously count plants and detect plantation-rows from UAV imagery. ISPRS J. Photogramm. Remote Sens. 2021, 174, 1–17. [Google Scholar] [CrossRef]
- Bah, M.D.; Hafiane, A.; Canals, R. CRowNet: Deep network for crop row detection in UAV images. IEEE Access 2019, 8, 5189–5200. [Google Scholar] [CrossRef]
- Zhang, P.; Sun, X.; Zhang, D.; Yang, Y.; Wang, Z. Lightweight Deep Learning Models for High-Precision Rice Seedling Segmentation from UAV-Based Multispectral Images. Plant Phenomics 2023, 5, 0123. [Google Scholar] [CrossRef]
- Khan, S.; Naseer, M.; Hayat, M.; Zamir, S.W.; Khan, F.S.; Shah, M. Transformers in vision: A survey. ACM Comput. Surv. (CSUR) 2022, 54, 1–41. [Google Scholar] [CrossRef]
- Zheng, S.; Lu, J.; Zhao, H.; Zhu, X.; Luo, Z.; Wang, Y.; Fu, Y.; Feng, J.; Xiang, T.; Torr, P.H. Rethinking semantic segmentation from a sequence-to-sequence perspective with transformers. In Proceedings of the IEEE/CVF Conference on Computer Vision and Pattern Recognition, Nashville, TN, USA, 20–25 June 2021; pp. 6881–6890. [Google Scholar]
- Xie, E.; Wang, W.; Yu, Z.; Anandkumar, A.; Alvarez, J.M.; Luo, P. SegFormer: Simple and efficient design for semantic segmentation with transformers. Adv. Neural Inf. Process. Syst. 2021, 34, 12077–12090. [Google Scholar]
- Liu, Z.; Lin, Y.; Cao, Y.; Hu, H.; Wei, Y.; Zhang, Z.; Lin, S.; Guo, B. Swin transformer: Hierarchical vision transformer using shifted windows. In Proceedings of the IEEE/CVF International Conference on Computer Vision, Montreal, QC, Canada, 10–17 October 2021; pp. 10012–10022. [Google Scholar]
- dos Santos Ferreira, A.; Junior, J.M.; Pistori, H.; Melgani, F.; Gonçalves, W.N. Unsupervised domain adaptation using transformers for sugarcane rows and gaps detection. Comput. Electron. Agric. 2022, 203, 107480. [Google Scholar] [CrossRef]
- Wang, C.; Yang, S.; Zhu, P.; Zhang, L. Extraction of Winter Wheat Planting Plots with Complex Structures from Multispectral Remote Sensing Images Based on the Modified Segformer Model. Agronomy 2024, 14, 2433. [Google Scholar] [CrossRef]
- Zhang, Q.; Wang, G.; Wang, G.; Song, W.; Wei, X.; Hu, Y. Identifying Winter Wheat Using Landsat Data Based on Deep Learning Algorithms in the North China Plain. Remote Sens. 2023, 15, 5121. [Google Scholar] [CrossRef]
- Yan, C.; Li, Z.; Zhang, Z.; Sun, Y.; Wang, Y.; Xin, Q. High-resolution mapping of paddy rice fields from unmanned airborne vehicle images using enhanced-TransUnet. Comput. Electron. Agric. 2023, 210, 107867. [Google Scholar] [CrossRef]
- Wang, H.; Chen, X.; Zhang, T.; Xu, Z.; Li, J. CCTNet: Coupled CNN and transformer network for crop segmentation of remote sensing images. Remote Sens. 2022, 14, 1956. [Google Scholar] [CrossRef]
- Woo, S.; Park, J.; Lee, J.-Y.; Kweon, I.S. CBAM: Convolutional block attention module. In Proceedings of the European Conference on Computer Vision (ECCV), Munich, Germany, 8–14 September 2018; pp. 3–19. [Google Scholar]
- Luo, Y.; Huang, Y.; Wang, Q.; Yuan, K.; Zhao, Z.; Li, Y. An improved YOLOv5 model: Application to leaky eggs detection. LWT 2023, 187, 115313. [Google Scholar] [CrossRef]
- Hu, J.; Shen, L.; Sun, G. Squeeze-and-excitation networks. In Proceedings of the IEEE Conference on Computer Vision and Pattern Recognition, Lake City, UT, USA, 18–23 June 2018; pp. 7132–7141. [Google Scholar]
- Gao, Z.; Xie, J.; Wang, Q.; Li, P. Global second-order pooling convolutional networks. In Proceedings of the IEEE/CVF Conference on Computer Vision and Pattern Recognition, Long Beach, CA, USA, 15–20 June 2019; pp. 3024–3033. [Google Scholar]
- Li, R.; Li, M.; Li, J.; Zhou, Y. Connection sensitive attention U-NET for accurate retinal vessel segmentation. arXiv 2019, arXiv:1903.05558. [Google Scholar]
- Zhang, X.; Wang, Q.; Wang, X.; Li, H.; He, J.; Lu, C.; Yang, Y.; Jiang, S. Automated detection of Crop-Row lines and measurement of maize width for boom spraying. Comput. Electron. Agric. 2023, 215, 108406. [Google Scholar] [CrossRef]
- Wu, X.; Fang, P.; Liu, X.; Liu, M.; Huang, P.; Duan, X.; Huang, D.; Liu, Z. AM-UNet: Field Ridge Segmentation of Paddy Field Images Based on an Improved MultiResUNet Network. Agriculture 2024, 14, 637. [Google Scholar] [CrossRef]
- Kazaj, P.M.; Koosheshi, M.; Shahedi, A.; Sadr, A.V. U-net-based models for skin lesion segmentation: More attention and augmentation. arXiv 2022, arXiv:2210.16399. [Google Scholar]
- Oktay, O.; Schlemper, J.; Folgoc, L.L.; Lee, M.; Heinrich, M.; Misawa, K.; Mori, K.; McDonagh, S.; Hammerla, N.Y.; Kainz, B. Attention u-net: Learning where to look for the pancreas. arXiv 2018, arXiv:1804.03999. [Google Scholar]
- Dai, J.; Qi, H.; Xiong, Y.; Li, Y.; Zhang, G.; Hu, H.; Wei, Y. Deformable convolutional networks. In Proceedings of the IEEE International Conference on Computer Vision, Venice, Italy, 22–29 October 2017; pp. 764–773. [Google Scholar]
- Zhu, X.; Hu, H.; Lin, S.; Dai, J. Deformable convnets v2: More deformable, better results. In Proceedings of the IEEE/CVF Conference on Computer Vision and Pattern Recognition, Long Beach, CA, USA, 15–20 June 2019; pp. 9308–9316. [Google Scholar]
- Badrinarayanan, V.; Kendall, A.; Cipolla, R. Segnet: A deep convolutional encoder-decoder architecture for image segmentation. IEEE Trans. Pattern Anal. Mach. Intell. 2017, 39, 2481–2495. [Google Scholar] [CrossRef] [PubMed]
- Chen, L.-C.; Zhu, Y.; Papandreou, G.; Schroff, F.; Adam, H. Encoder-decoder with atrous separable convolution for semantic image segmentation. In Proceedings of the European Conference on Computer Vision (ECCV), Munich, Germany, 8–14 September 2018; pp. 801–818. [Google Scholar]
- Ronneberger, O.; Fischer, P.; Brox, T. U-net: Convolutional Networks for Biomedical Image Segmentation. In Proceedings of the International Conference on Medical Image Computing And Computer-Assisted Intervention, Munich, Germany, 5–9 October 2015; pp. 234–241. [Google Scholar]
- DB 4405/T 295-2022; Technical Regulations for Mechanized Rice Transplanting. China National Standardizing Committee, Shantou Municipal Market Supervision and Administration Bureau: Shantou, China, 2022. Available online: https://std.samr.gov.cn/db/search/stdDBDetailed?id=DACBC26985C90ADEE05397BE0A0AE231 (accessed on 24 November 2024).
- He, Y.; Zhou, J.; Sun, J.; Jia, H.; Liang, Z.; Awuah, E. An adaptive control system for path tracking of crawler combine harvester based on paddy ground conditions identification. Comput. Electron. Agric. 2023, 210, 107948. [Google Scholar] [CrossRef]
- Chen, Z.; Yin, J.; Yang, J.; Zhou, M.; Wang, X.; Farhan, S.M. Development and Experiment of an Innovative Row-Controlled Device for Residual Film Collector to Drive Autonomously along the Ridge. Sensors 2023, 23, 8484. [Google Scholar] [CrossRef] [PubMed]
- He, R.; Luo, X.; Zhang, Z.; Zhang, W.; Jiang, C.; Yuan, B. Identification Method of Rice Seedlings Rows Based on Gaussian Heatmap. Agriculture 2022, 12, 1736. [Google Scholar] [CrossRef]


| Parameters | Value |
|---|---|
| Resolution of CMOS sensor | 20 million |
| Flight altitude | 10 m |
| Camera angle | Orthophoto (90°) |
| Shooting overlap rate | Forward overlap: 80%. Lateral overlap: 80% |
| Positioning accuracy (RMS) | Vertical: 1.5 cm + 1 ppm; horizontal: 1 cm + 1 ppm 1 |
| Climatic conditions | Sunny, wind speed < 4 m/s |
| Models | P (%) | R (%) | F1 (%) | OA (%) | IoU (%) |
|---|---|---|---|---|---|
| SegNet | 72.98 | 81.55 | 77.03 | 92.30 | 62.64 |
| Deeplabv3+ | 78.73 | 84.59 | 81.56 | 93.70 | 68.86 |
| UNet | 86.73 | 83.50 | 85.08 | 94.82 | 74.04 |
| SegFormer | 87.94 | 84.51 | 86.19 | 95.21 | 75.74 |
| CAD-UNet | 91.14 | 87.96 | 89.52 | 96.35 | 81.03 |
| Models | P (%) | R (%) | F1 (%) | OA (%) | IoU (%) |
|---|---|---|---|---|---|
| UNet | 86.73 | 83.50 | 85.08 | 94.82 | 74.04 |
| UNet + CBAM | 88.65 | 86.54 | 87.58 | 95.66 | 77.91 |
| UNet + CBAM + AG | 89.50 | 87.22 | 88.34 | 95.93 | 79.12 |
| UNet + CBAM + AG + DCNv2 | 91.14 | 87.96 | 89.52 | 96.35 | 81.03 |
| Row | Length (m) | Points Number | Density (/m) | Slope | (%) |
|---|---|---|---|---|---|
| 1 | 50.58 | 150,035 | 2966.37 | −1.4685 | 99.95 |
| 2 | 50.57 | 158,973 | 3143.41 | −1.4684 | 99.95 |
| 3 | 50.57 | 143,820 | 2843.98 | −1.4659 | 99.97 |
| 4 | 50.39 | 141,545 | 2809.01 | −1.5174 | 99.99 |
| 5 | 50.48 | 140,419 | 2781.83 | −1.5268 | 99.98 |
| 6 | 50.54 | 145,380 | 2876.26 | −1.5260 | 99.99 |
| 7 | 50.49 | 153,617 | 3042.17 | −1.5269 | 99.99 |
| 8 | 50.51 | 161,577 | 3199.09 | −1.5280 | 99.99 |
| Row (i) | (cm) | (cm) | (cm) | High-Frequency Interval (cm) |
|---|---|---|---|---|
| 1 | 13.66 | 16.00 | 15.99 | (−20, 30) |
| 2 | 11.13 | 15.42 | 13.75 | (−15, 25) |
| 3 | 9.71 | 12.16 | 12.02 | (−20, 20) |
| 4 | 6.59 | 10.11 | 8.64 | (0, 30) |
| 5 | 5.33 | 6.77 | (−5, 15) | |
| 6 | 5.68 | 9.87 | 7.09 | (−5, 20) |
| 7 | 5.15 | 6.44 | 6.31 | (−10, 15) |
| 8 | 4.62 | 4.88 | 5.58 | (−10,10) |
| Group (k) | (cm) | (cm) | (cm) | Mean Spacing (cm) | High-Frequency Interval (cm) |
|---|---|---|---|---|---|
| 1 | 13.67 | 59.38 | 15.99 | 57.19 | (−30, 30) |
| 2 | 10.94 | 53.20 | 13.82 | 51.37 | (−10, 30) |
| 3 | 23.34 | 39.91 | 25.84 | 29.58 | (−40, 40) |
| 4 | 7.05 | 37.81 | 9.52 | 36.59 | (−15, 15) |
| 5 | 5.36 | 19.83 | 6.78 | 41.37 | (−5, 15) |
| 6 | 5.66 | 22.09 | 7.10 | 20.92 | (−10, 10) |
| 7 | 5.16 | 23.09 | 6.32 | 37.80 | (−15, 10) |
Disclaimer/Publisher’s Note: The statements, opinions and data contained in all publications are solely those of the individual author(s) and contributor(s) and not of MDPI and/or the editor(s). MDPI and/or the editor(s) disclaim responsibility for any injury to people or property resulting from any ideas, methods, instructions or products referred to in the content. |
© 2025 by the authors. Licensee MDPI, Basel, Switzerland. This article is an open access article distributed under the terms and conditions of the Creative Commons Attribution (CC BY) license (https://creativecommons.org/licenses/by/4.0/).
Share and Cite
Luo, Y.; Dai, J.; Shi, S.; Xu, Y.; Zou, W.; Zhang, H.; Yang, X.; Zhao, Z.; Li, Y. Deep Learning-Based Seedling Row Detection and Localization Using High-Resolution UAV Imagery for Rice Transplanter Operation Quality Evaluation. Remote Sens. 2025, 17, 607. https://doi.org/10.3390/rs17040607
Luo Y, Dai J, Shi S, Xu Y, Zou W, Zhang H, Yang X, Zhao Z, Li Y. Deep Learning-Based Seedling Row Detection and Localization Using High-Resolution UAV Imagery for Rice Transplanter Operation Quality Evaluation. Remote Sensing. 2025; 17(4):607. https://doi.org/10.3390/rs17040607
Chicago/Turabian StyleLuo, Yangfan, Jiuxiang Dai, Shenye Shi, Yuanjun Xu, Wenqi Zou, Haojia Zhang, Xiaonan Yang, Zuoxi Zhao, and Yuanhong Li. 2025. "Deep Learning-Based Seedling Row Detection and Localization Using High-Resolution UAV Imagery for Rice Transplanter Operation Quality Evaluation" Remote Sensing 17, no. 4: 607. https://doi.org/10.3390/rs17040607
APA StyleLuo, Y., Dai, J., Shi, S., Xu, Y., Zou, W., Zhang, H., Yang, X., Zhao, Z., & Li, Y. (2025). Deep Learning-Based Seedling Row Detection and Localization Using High-Resolution UAV Imagery for Rice Transplanter Operation Quality Evaluation. Remote Sensing, 17(4), 607. https://doi.org/10.3390/rs17040607