Article

STMSF: Swin Transformer with Multi-Scale Fusion for Remote Sensing Scene Classification

by
Yingtao Duan
1,
Chao Song
2,
Yifan Zhang
2,
Puyu Cheng
2 and
Shaohui Mei
2,*
1
School of Mathematics and Statistics, Hanshan Normal University, Chaozhou 521041, China
2
School of Electronics and Information, Northwestern Polytechnical University, Xi’an 710072, China
*
Author to whom correspondence should be addressed.
Remote Sens. 2025, 17(4), 668; https://doi.org/10.3390/rs17040668
Submission received: 1 January 2025 / Revised: 9 February 2025 / Accepted: 12 February 2025 / Published: 16 February 2025

Abstract

:
Emerging vision transformers (ViTs) are more powerful in modeling long-range dependences of features than conventional deep convolution neural networks (CNNs). Thus, they outperform CNNs in several computer vision tasks. However, existing ViTs fail to encounter the multi-scale characteristics of ground objects with various spatial sizes when they are applied to remote sensing (RS) scene images. Therefore, in this paper, a Swin transformer with multi-scale fusion (STMSF) is proposed to alleviate such an issue. Specifically, a multi-scale feature fusion module is proposed, so that features of ground objects at different scales in the RS scene can be well considered by merging multi-scale features. Moreover, a spatial attention pyramid network (SAPN) is designed to enhance the context of coarse features extracted with the transformer and further improve the network’s representation ability of multi-scale features. Experimental results over three benchmark RS scene datasets demonstrate that the proposed network obviously outperforms several state-of-the-art CNN-based and transformer-based approaches.

Graphical Abstract

1. Introduction

Recent advancements in remote sensing (RS) have transformed the field, with deep learning techniques becoming increasingly prevalent in various applications [1,2,3,4,5,6,7,8,9]. This surge in technological capabilities has paved the way for more sophisticated methods in RS scene classification, enhancing the ability to analyze complex aerial imagery. RS scene classification aims at classifying the given aerial image into a semantic-level category. It is a fundamental issue for Earth observations which has a wide range of applications, such as environmental monitoring, traffic supervision, and urban planning [10,11,12,13,14]. Therefore, RS scene classification has attracted increasing attentions of the RS community in recent years.
In the early years, traditional scene classification methods are widely used, which classify images based on various handcrafted features [15,16,17]. However, these handcrafted features are usually extracted based on prior knowledge or domain expert experience, lacking of robustness and flexibility. Moreover, these methods normally have difficulties in learning a proper representation of RS images with complicated ground object distribution. Hence, performance of the traditional classification methods are limited. With the remarkable progress of deep learning techniques, promising results have been achieved in RS scene classification. In particular, methods based on deep convolutional neural networks (CNNs) greatly improve the accuracy of RS scene classification [18,19,20,21,22,23,24,25]. In [18], Gong et al. evaluated the performance of some popular CNNs on RS scene classification, exhibiting salient superiority over many state-of-the-art (SOTA) traditional methods. However, CNNs have fixed local structure of kernels, which are inferior in representation of long-range dependences within a scene image. The under-explored global interactions in RS image hinder further improvement in performance of RS scene classification.
The recent vision transformer (ViT) based on multi-head self-attention (MSA) mechanism shows great potential for learning representation of long-distance correlation [26,27,28,29,30,31,32,33]. Several transformer-based methods have been developed for RS scene classification [34,35,36]. Ma et al. [34] proposed a homo–heterogeneous transformer learning framework for RS scene classification. They also explore the scene classification performance of some classical vision transformers. As an emerging backbone, the vision transformer was originally designed for natural images, which are quite different from RS images. RS scene images are captured with bird view, and the observed ground objects vary in scales. Objects with different spatial size in the scene contribute differently to final classification result. However, the existing vision transformers for RS scene classification only use the top layer features which containing more semantic information of large-scale objects, whereas the features of small objects, that usually appear in shallow layers of network are neglected. Thus, it is reasonable to expect that RS scene classification performance can be further improved via a full usage of features extracted with different layers.
To this end, a Swin tranformer with multi-scale fusion (STMSF) for RS scene classification is proposed in this paper. Multi-scale features are generated using a Swin transformer as well as the proposed spatial attention pyramid network (SAPN). A Swin transformer is a hierarchical vision transformer learning feature maps with multiple semantic information. The context of feature maps is then further enriched by SAPN. Finally, the fused feature vector containing object information at different scale is recognized with a fully connected layer. The main contributions of this paper are summarized as follows:
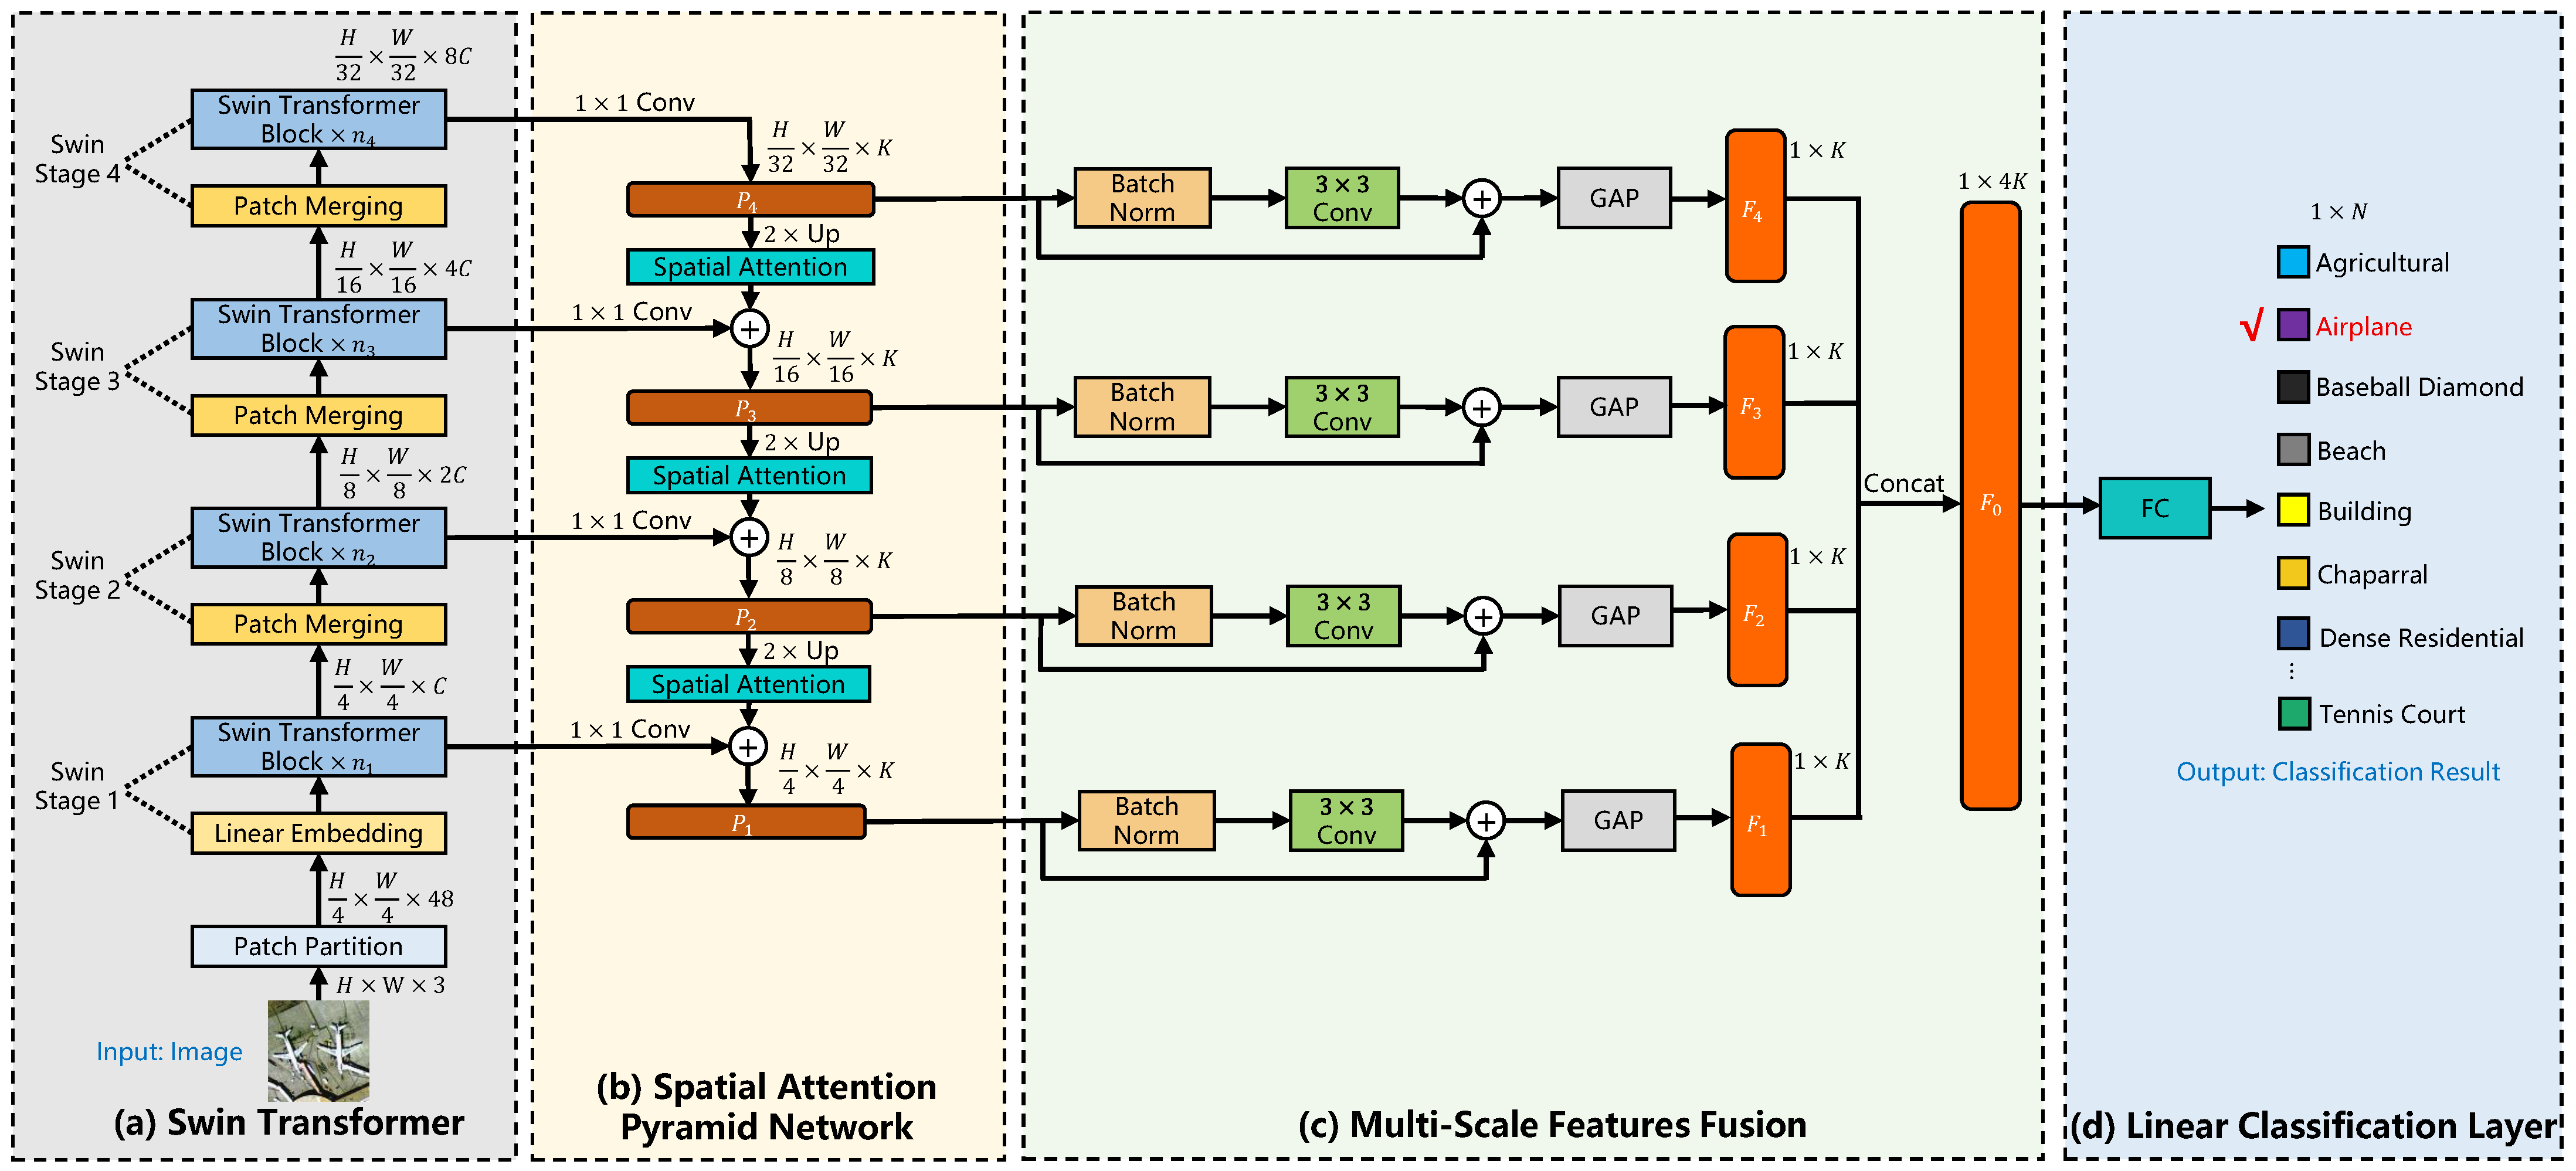
  • A multi-scale feature fusion mechanism is designed for a Swin transformer, by which the multi-scale presence of ground objects in remote sensing scenes is encountered for a classification task.
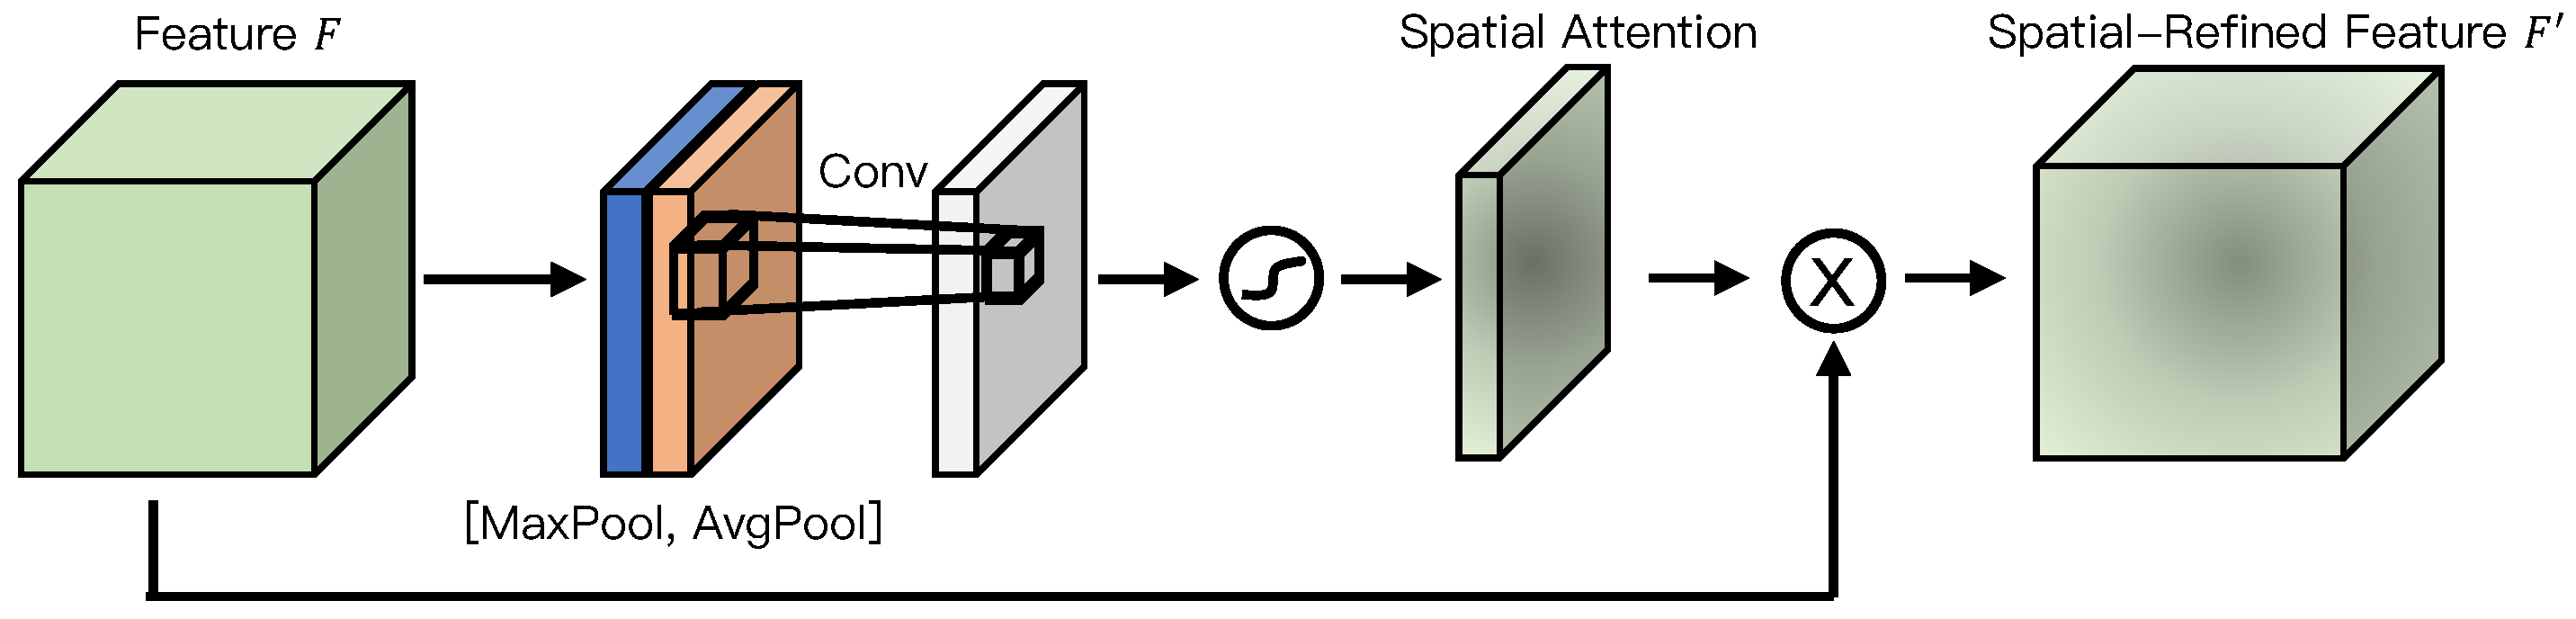
  • A spatial attention pyramid network is designed to emphasize spatial context of different scales, which can improve the ability of transformer in multi-scale feature representation.
The remainder of this paper is organized as follows: Related work is reviewed in Section 2. Then, in Section 3, the proposed Swin transformer with multi-scale fusion is described in detail. To illustrate the correctness, validity and advancement of the proposed method, verification and comparison experiments are conducted in Section 4. In Section 5, some conclusions are drawn and future directions are suggested.

2. Related Work

In recent years, in view of the challenges faced by classification tasks in remote sensing scenarios, global research teams have provided rich solutions and conducted extensive experimental demonstration. The research ideas adopted in this paper are in line with cutting-edge remote sensing image classification schemes: exploring multi-scale feature fusion strategies and semantic information analysis based on vision transformer to improve the task effect.

2.1. RS Scene Classification with Multi-Scale Features

According to experimental fact, network’s recognition performance in complex environment can be definitely improved with more discriminative features input. In order to cope with the massive feature requirement in various scenes, researchers have introduced a deep learning method to remote sensing task for years, which has the ability to generate more effective features than traditional techniques. Though popular deep learning algorithms represented by convolutional neural networks led RS classification to a higher level, classical feature processing strategies reveal their restriction to networks. The features contained in low-resolution feature maps are usually lost after multi-layer convolution, which is an important basis for filtering out environmental information and realizing the feature classification of small targets in remote sensing scenarios. Designing a method to fuse low-level features and high-level features to achieve the overall classification efficiency of the network is the research goal of multi-scale feature fusion. Cheng et al. [37] designed an efficient systematic architecture named multi-scale feature fusion network with enhanced feature correlation (EFCOMFF-Net) to narrow the differences among multi-scale features of objects in the same category and fuse multi-scale features to improve the representation capability of remote sensing images. In other research directions, multi-scale feature fusion requires the use of each convolution layer’s feature map and the upsampling method to strengthen the relationship between scaled features, respectively. Song et al. [38]. explored a feature fusion strategy in urban remote sensing semantic segmentation and proposed a CNN and transformer multi-scale feature fusion network (STMFF-Net), in which they designed a multilayer dense connectivity network (MDCN) to achieve interaction of multiscale features via up-sampling among convolution layers. In addition, the widely applied feature pyramid structure has proved its excellent performance in a multi-scale feature fusion strategy, and some studies on feature pyramid network (FPN) improvements have significantly improved the classification ability of networks in complex scenarios. Wei et al. [39] designed a feature enhancement pyramid network (FE-FPN) to reduce the loss of essential information during mapping processing. The paper makes three improvements on the classical FPN structure: Firstly, the researchers add a channel enhancement module (CEM) connected to a convolutional feature map of each layer to enhance the information. Since the low-resolution feature map from the last convolution layer contains a large number of global features, FE-FPN also introduces an adaptive pooling spatial attention module (APSAM), which can reduce the information loss caused by the reduction of the map channels, so that the network is able to fully utilize global information. Finally, the researchers replace the original upsampling with upsampling feature fusion (UPFF) to enhance the efficiency of information exchange between different scales. The experimental results show that FE-FPN significantly improves the accuracy of network classification. Yuan et al. [40] proposed a multi-scale and multi-network deep feature fusion strategy, which strikes a balance between the requirements of efficiency and accuracy in RS scene classification. Wang et al. [41] designed a reverse multi-scale feature fusion network to build a hybrid architecture for extracting features of different object sizes in RS scene images. Dai et al. [42] used a multi-scale dense residual correlation network (MDRCN) for RS scene classification to fully consider different levels of feature diversity. From the aforementioned existing studies, it is evident that the hierarchical design paradigm of modern networks facilitates the enhancement of RS scene classification performance through the fusion of multi-scale image features.

2.2. Transformer for RS Scene Classification

Benefiting from the self-attention mechanism, ViT performs better in image processing than traditional deep learning algorithms such as CNNs and recurrent neural networks (RNNs) [43]. In particular, the global receptive field (GRF) of ViT allows it to perceive the global semantic information of the image, so it can avoid the misjudgment caused by local features. ViT is undoubtedly a promising classification model in the practical scenarios where the features of remote sensing small targets are often highly similar. Recently, many researchers have chosen a transformer for remote sensing image classification [43,44,45,46,47,48,49,50,51,52]. Because of transformer’s excellent expansibility and adaptability, many improved transformer configurations have been proposed for different task requirements. In the studies related to remote sensing images and high-altitude geographic images, researchers proposed hierarchical transformer modules such as a pyramid ViT [28] and Swin transformer [29] out for reducing soaring computing costs caused by the consistent block size. This kind of architecture is similar to CNNs, which generate varying block sizes at different layers, bringing about feature diversity and also inspiring research ideas on feature fusion. Chen et al. [44] proposes a hierarchical feature fusion of transformer with patch dilating (HFFT-PD), enabling the model to bridge the semantic gaps among features from different hierarchical layers. In another direction, a novel position-sensitive cross-layer interactive transformer (PSCLI-TF) model adopts an alternative strategy to enhance the accuracy of transformer-based remote sensing image classification [45]. Initially, researchers use ResNet50 as the backbone to extract multi-layer feature maps from the images. Then, they devise a position-sensitive cross-layer interactive attention (PSCLIA) mechanism to detect local features. Subsequently, they construct a new PSCLI-TF encoder that fuses multi-layer feature maps layer by layer through interaction, thereby improving network performance. There are also researchers adapting a generation method of tokens to overcome this transformer’s weakness. Roy et al. [46] point out that the randomly initialized external classification (CLS) token has a low generalization ability. Therefore, they introduced a new multimodal transformer containing a multi-head cross-patch attention to achieve data fusion. In this work, the CLS token is fused with a multimodal patch token gained from various datasets, and the experiment proves that it enhances multimodal data. Wang et al. [47] propose a multi-level fusion Swin transformer (MFST), integrating a multi-level feature merging (MFM) module and an adaptive feature compression (AFC) module to further enhance the performance of RS scene classification. Hao et al. [48] recognized the issue that the Swin transformer lacks typical inductive bias capability, which leads to poor performance under low-sample scenarios. Therefore, they designed the inductive biased Swin transformer with a cyclic regressor used with a random dense sampler (IBSwin-CR), which effectively improves the classification performance of the model under the condition of insufficient remote sensing datasets. In addition to former research topics, some researchers have also attempted to introduce the multinstance vision transformer (MITformer) to remote sensing image classification [49], achieving outstanding results. At the same time, some researchers choose to leverage the transformer’s advantage in natural language processing and utilize remote sensing caption datasets to develop the potential of algorithms when facing a situation where they lack data [50]. Guo et al. [51] proposed a channel-spatial attention transformer (CSAT) to effectively capture long-distance dependencies and spatial relationships, addressing challenges like intra-class differences and inter-class similarity in RS scene images. Zheng et al. [52] used a lightweight dual-branch Swin transformer (LDBST) for RS scene classification, with the discriminative ability of features being enhanced in LDBST. Transformers have shown great performance in the realm of RS. Their ability to model global dependencies allows for rich contextual relationships in extracted features. However, the effective fusion of multi-scale features through the transformer’s hierarchical structure remains under-explored, presenting a significant opportunity to enhance feature representation and improve performance in RS scene image classification.
Building on the advancements in multi-scale feature learning and transformer-based architectures for remote sensing scene classification, this work addresses the critical gap in effectively leveraging hierarchical structures for multi-scale feature fusion, while existing methods have demonstrated the potential of transformers in modeling global dependencies. However, their ability to integrate and emphasize multi-scale spatial contexts remains limited. To this end, our work makes two key contributions: First, we propose SAPN, which dynamically enhances spatial context across different scales, significantly improving the transformer’s ability to capture discriminative multi-scale features. Second, we introduce a novel multi-scale feature fusion mechanism tailored for a Swin transformer, which effectively integrates features enhanced with spatial semantic information. These innovations not only bridge the gap in multi-scale feature representation but also provide a robust framework for advancing transformer-based approaches in RS scene classification tasks.

3. Methodology

Schematic diagram of the proposed STMSF is shown in Figure 1, containing four main modules: (a) Swin transformer, (b) spatial attention pyramid network, (c) multi-scale features fusion, and (d) linear classification layer.
With Swin transformer, hierarchical deep features at different levels of semantic information are extracted. The second module is the SAPN. The SAPN connects features to generate multi-scale features, which are denotes as { P 1 , P 2 , P 3 , P 4 } . The third model is the fusion module, which concatenates multiple constructed features { F 1 , F 2 , F 3 , F 4 } into a single feature F 0 . The last one is the classification layer, in which the integrated feature F 0 is fed for determine the class of the input scene image.

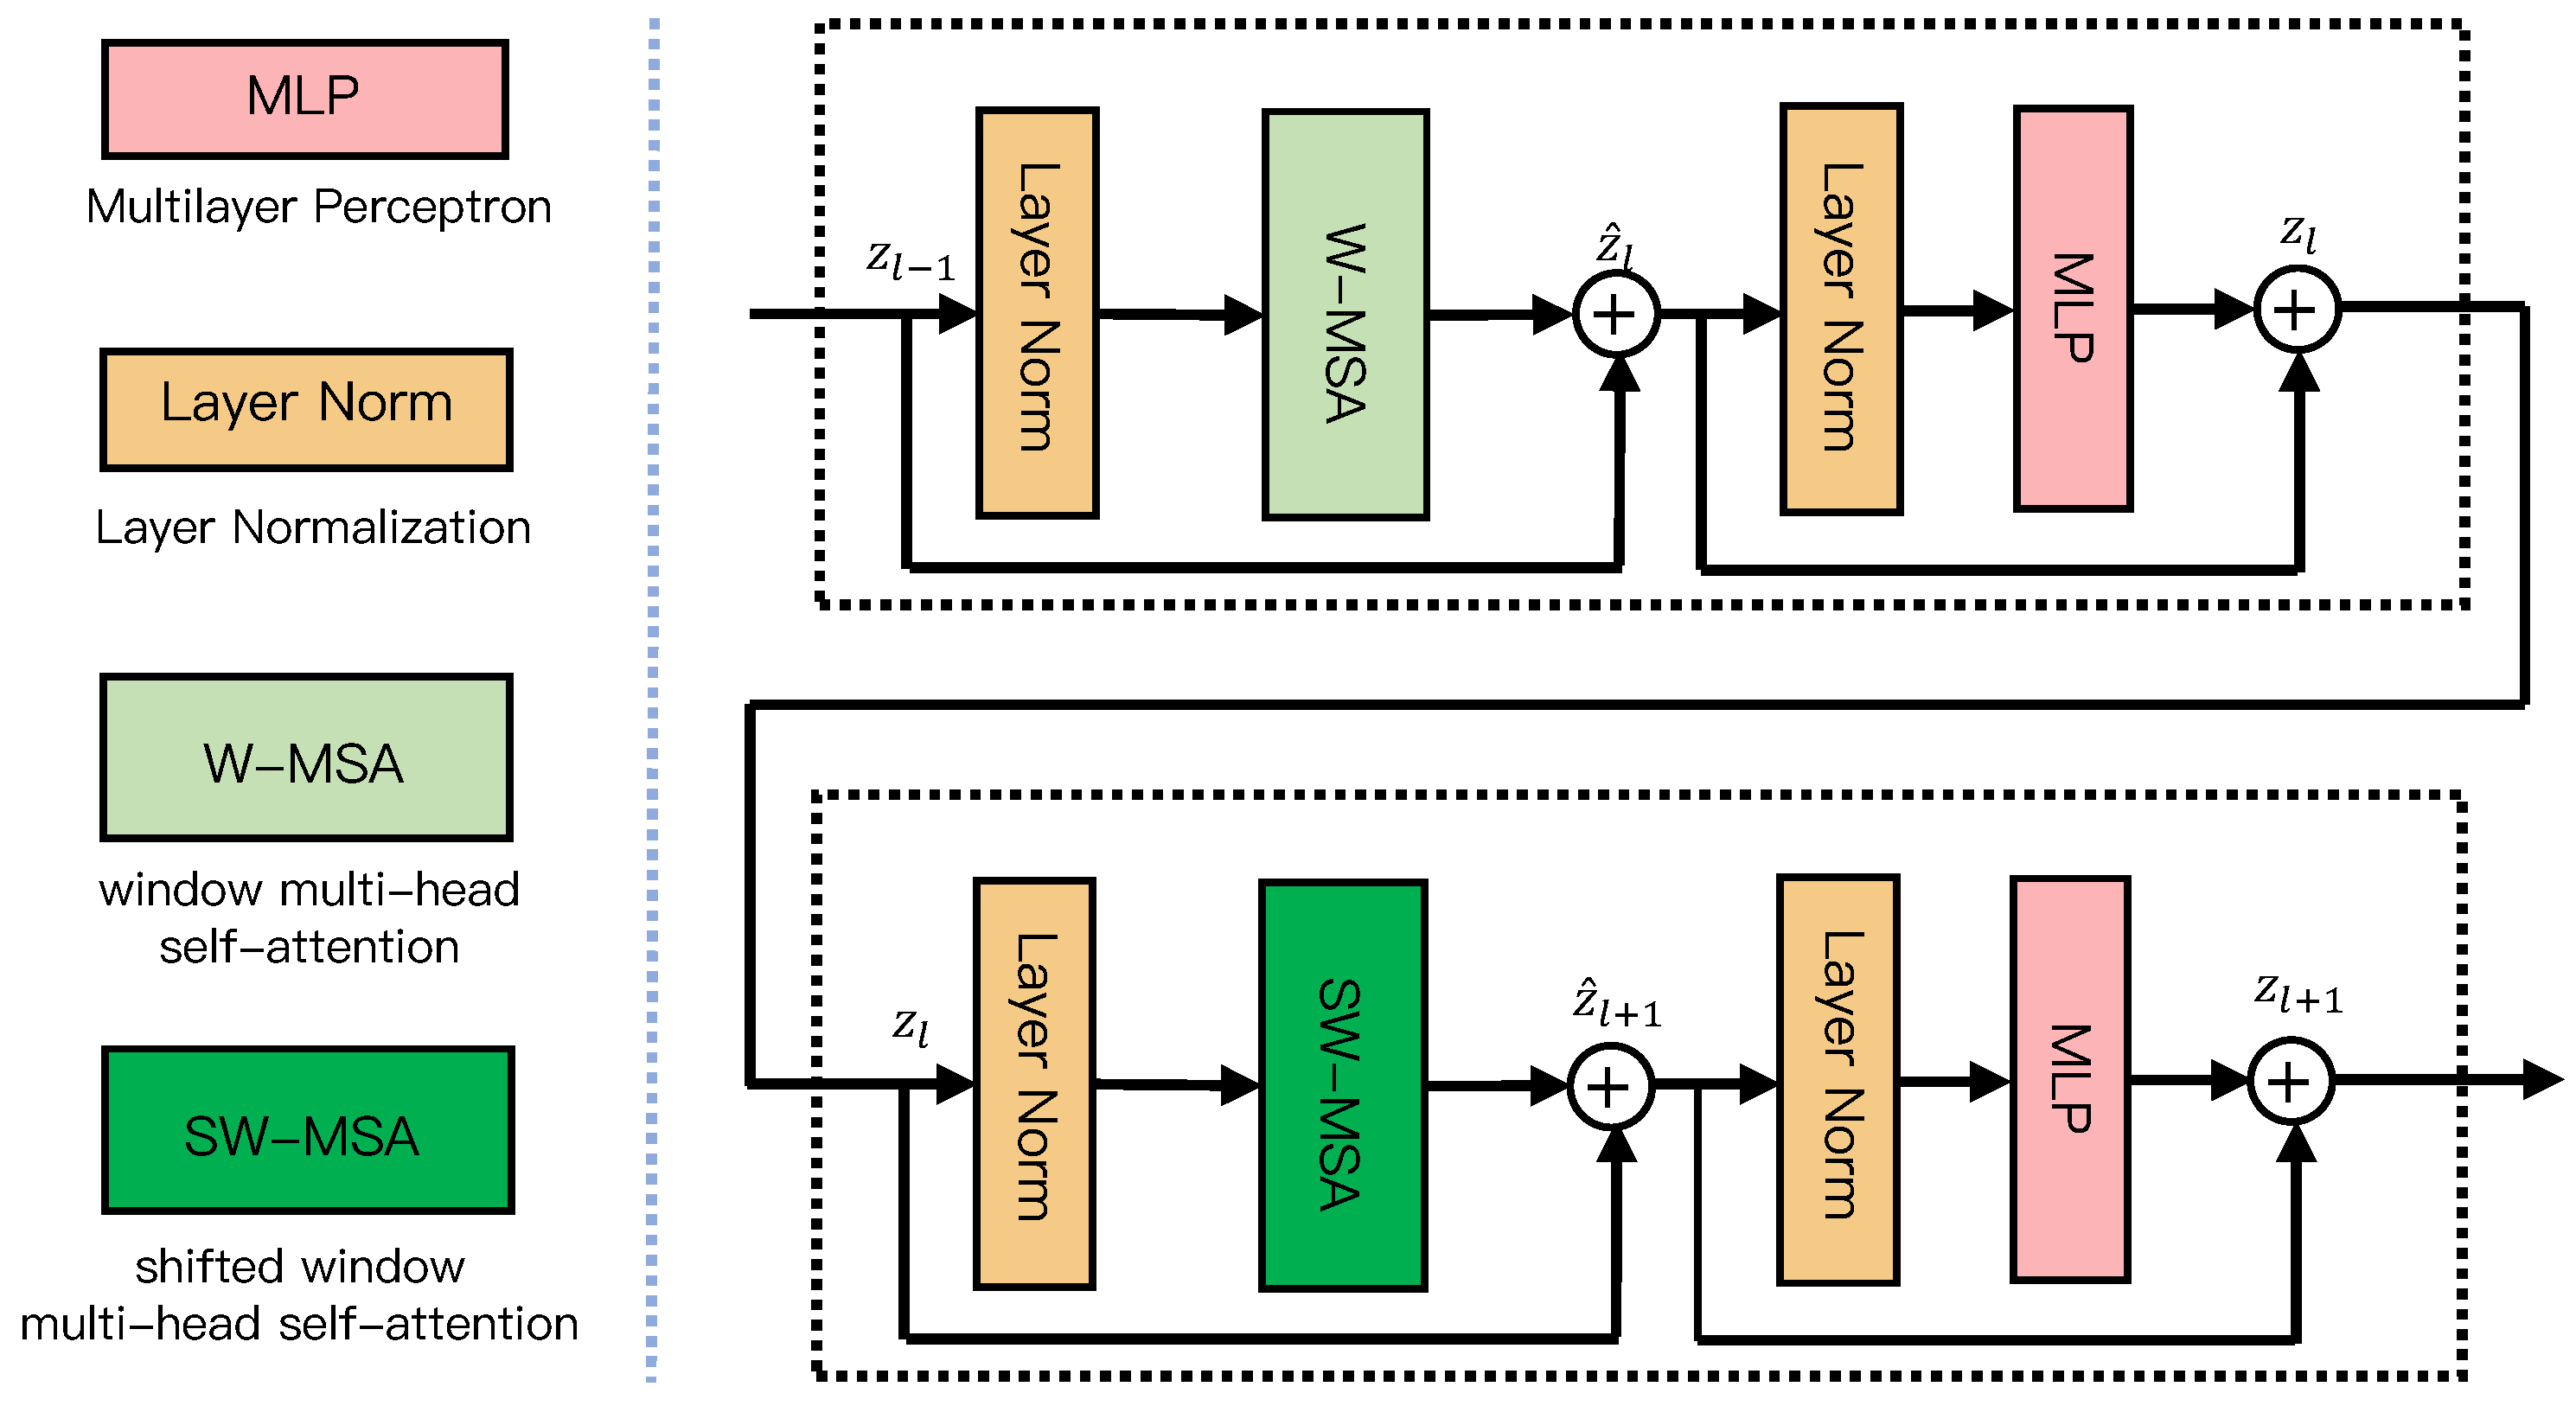
3.1. Swin Transformer

In the front-end of Swin transformer, a patch partition module is employed to divide the RS scene I R H × W × 3 into non-overlapping patches. Each patch is treated as a token representing features of the corresponding locations within the original image. The patch size is set as 4 × 4 identical to the original implementation [29]. Thus, dimension of feature vector for each patch is 4 × 4 × 3 = 48 . Through the linear embedding layer, the channel dimension of each patch is projected to an arbitrary value C. Several Swin transformer blocks are applied on these patch tokens. Swin transformer block is combined with linear embedding and denoted as “Swin Stage 1”.
Swin Stages 2–4 share similar structures, consisting a patch merging layer and several Swin transformer blocks. The patch merging layer is mainly used for downsampling to increase the channel numbers and reduce the spatial resolution of feature maps. Moreover, Swin transformer blocks are responsible for effective feature extraction.
Figure 2 illustrates the detailed architecture of two consecutive Swin transformer blocks. Each block consists of a window-based multi-head self-attention (W-MSA) or shifted window-based multi-head self-attention (SW-MSA) module, followed by a 2-layer multilayer perceptron (MLP). The W-MSA module computes self-attention within non-overlapping local windows to reduce computational complexity, while the SW-MSA module introduces a shifted window partitioning mechanism to enable cross-window connections, enhancing the model’s ability to capture global context. Between the attention and MLP modules, LayerNorm (LN) layers are applied to stabilize training, and residual connections are added to facilitate gradient flow. Specifically, the MLP consists of two linear layers with a GELU activation function in-between, where the first layer expands the feature dimension by a factor of 4, and the second layer projects it back to the original dimension. The involved computation of consecutive Swin transformer blocks can be summarized as
z ^ l = W - MSA ( LayerNorm ( z l 1 ) ) + z l 1 , z l = MLP ( LayerNorm ( z ^ l ) ) + z ^ l , z ^ l + 1 = SW - MSA ( LayerNorm ( z l ) ) + z l , z l + 1 = MLP ( LayerNorm ( z ^ l + 1 ) ) + z ^ l + 1 ,
where z l and z ^ l are the output features of the SW-MSA module and MLP for block l, respectively. The number of Swin transformer blocks in each stage ( { n 1 , n 2 , n 3 , n 4 } ) is set as { 2 , 2 , 18 , 2 } in this paper, which is denoted as “Swin-S” in [29].

3.2. Spatial Attention Pyramid Network

In deep neural networks, high-level features contain more semantic information than low-level features, while low-level features provide richer spatial information. Features of small objects in the image may disappear in top layers of the network. The FPN was proposed to fuse features with different semantic information [53]. Since redundant information normally exists in features, FPN with spatial attention [54] mechanism, SAPN, is designed to highlight features useful for fusion. FPN primarily focuses on constructing a multi-scale feature pyramid by combining features from different layers, while SAPN enhances this process by incorporating a spatial attention mechanism to emphasize the most effective features and reduce redundant information. It is noteworthy that prior attempts have explored integrating spatial attention mechanisms with multi-scale network features [55] for object detection. However, unlike the approach in [55], which applies spatial attention to features obtained from an FPN in a post-processing manner, our SAPN embeds spatial attention directly into the hierarchical feature fusion process of the FPN architecture. This avoids the loss of spatial information during propagation within the FPN, while simultaneously enabling adaptive refinement of multi-scale semantic features at different pyramid levels.
As shown in Figure 1b, SAPN contains a top-down pathway and lateral connections. Specifically, the features extracted by Swin Stage 4 are fed into a 1 × 1 convolutional layer to reduce the channel dimension to K. The original size of P 4 is H 32 × W 32 × K . P 4 is upsampled with a spatial factor of 2 and then sent to spatial attention module to generate a spatially refined feature. Finally, the refined feature is merged with the feature map, which is 1 × 1 convoluted outputs of Stage 3 with element-wise addition. The multi-scale features { P 1 , P 2 , P 3 , P 4 } can be obtained with three iterations.
Figure 3 shows the spatial attention mechanism. Global max pooling (GMP) and global average pooling (GAP) are first applied on input feature F R H × W × C along channels. Then, concatenation of them produces an efficient feature representation. A convolution layer with a kernel size of 7 is applied on the feature representation to generate a 2D spatial attention feature map M s p a ( F ) R H × W . Finally, the spatially refined feature F is calculated via the multiplication of F and M s p a ( F ) in a broadcast way. The computation of spatial attention can be formulated as
M s p a ( F ) = σ ( f 7 × 7 [ AvgPool ( F ) ; MaxPool ( F ) ] ) ) , F = F M s p a ( F ) ,
where σ denotes the sigmoid function and f 7 × 7 represents a convolution layer with kernel size of 7 × 7 .

3.3. Multi-Scale Features Fusion

Since simple concatenation of features with different scaled is not able to provide enough critical information, designing a multi-scale features fusion module is promising for model accuracy improvement [55,56]. Hence, an independent fusion module is proposed to fully utilize multi-scale features, in which features are constructed to be more discriminative for scene classification. For features with specific scales, batch normalization and 3 × 3 convolutional filters are employed to learn a better descriptor for features
P i = ReLU ( f 3 × 3 ( BN ( P i ) ) ) + P i , i = 1 , 2 , 3 , 4 ,
where ReLU denotes linear rectification function, and P i stands for the enhanced feature. Four GAP layers convert these features into 1D vectors, which are concatenated into F 0 , a larger vector with dimension of 4 K :
F 0 = [ F 1 ; F 2 ; F 3 ; F 4 ] = [ GAP ( P 1 ) ; GAP ( P 2 ) ; GAP ( P 3 ) ; GAP ( P 4 ) ] .
Finally, a linear layer conducts category prediction based on the aggregated overall feature semantic representation. The layer contains a fully connected layer followed by a softmax function to outputs the category-oriented predictions in one-hot coding.

4. Experimental Results

In this section, the proposed method is evaluated on three remote sensing scene datasets. First, we provide a brief introduction to these datasets. Then, we present the experimental settings and outline the evaluation metrics. Finally, comparisons between the proposed model and some SOTA algorithms are demonstrated to show the superiority of the proposed method.

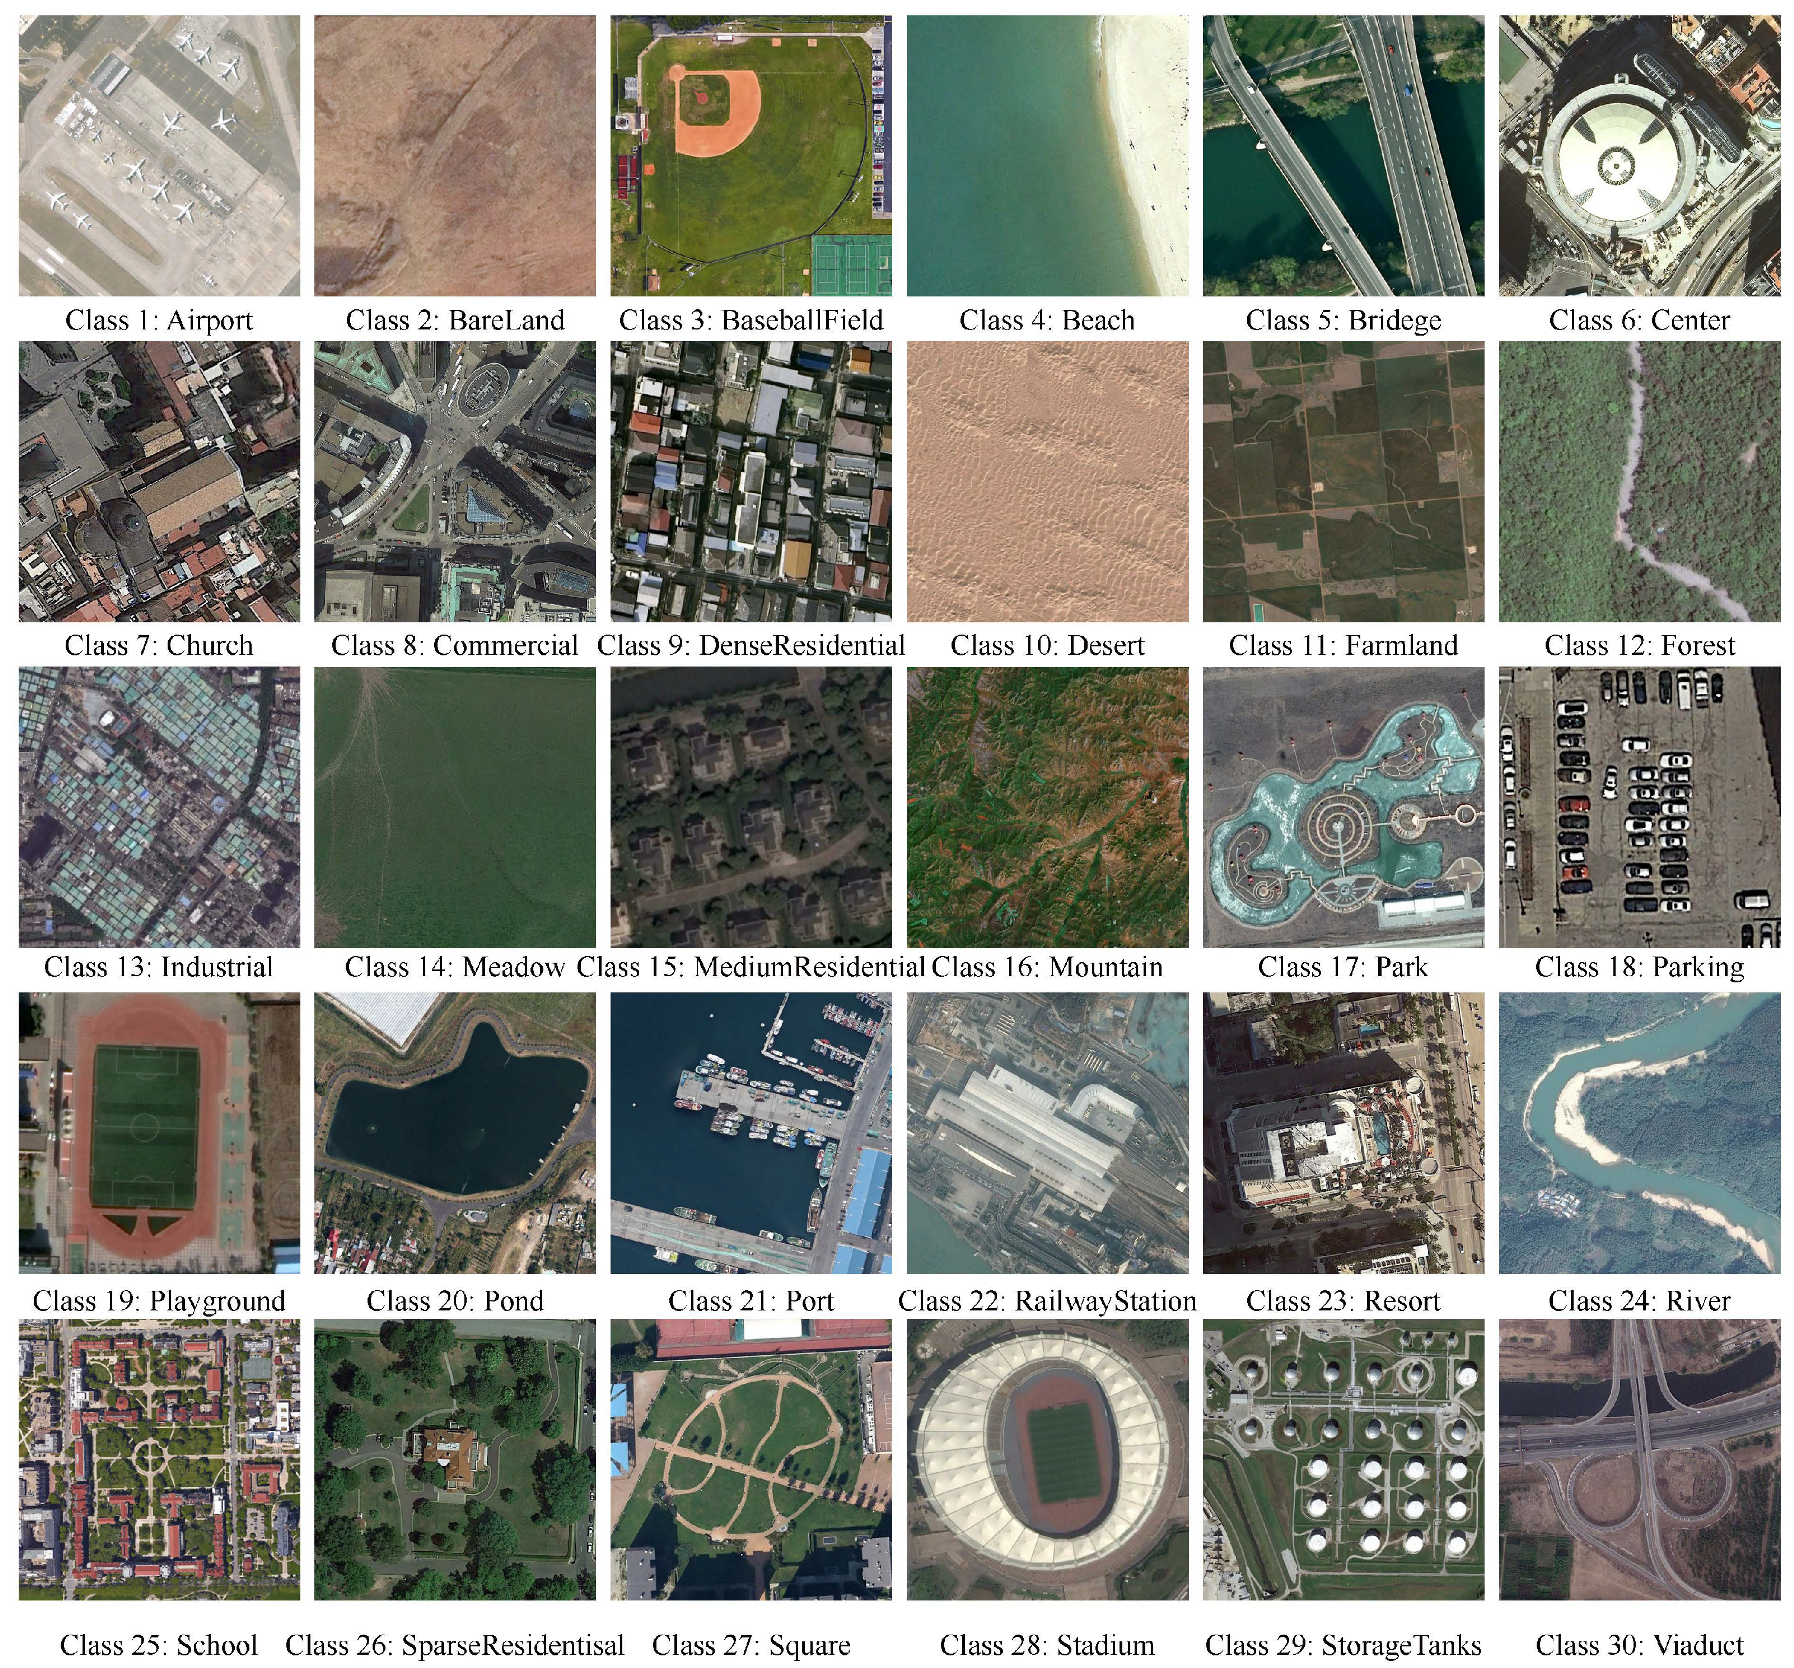
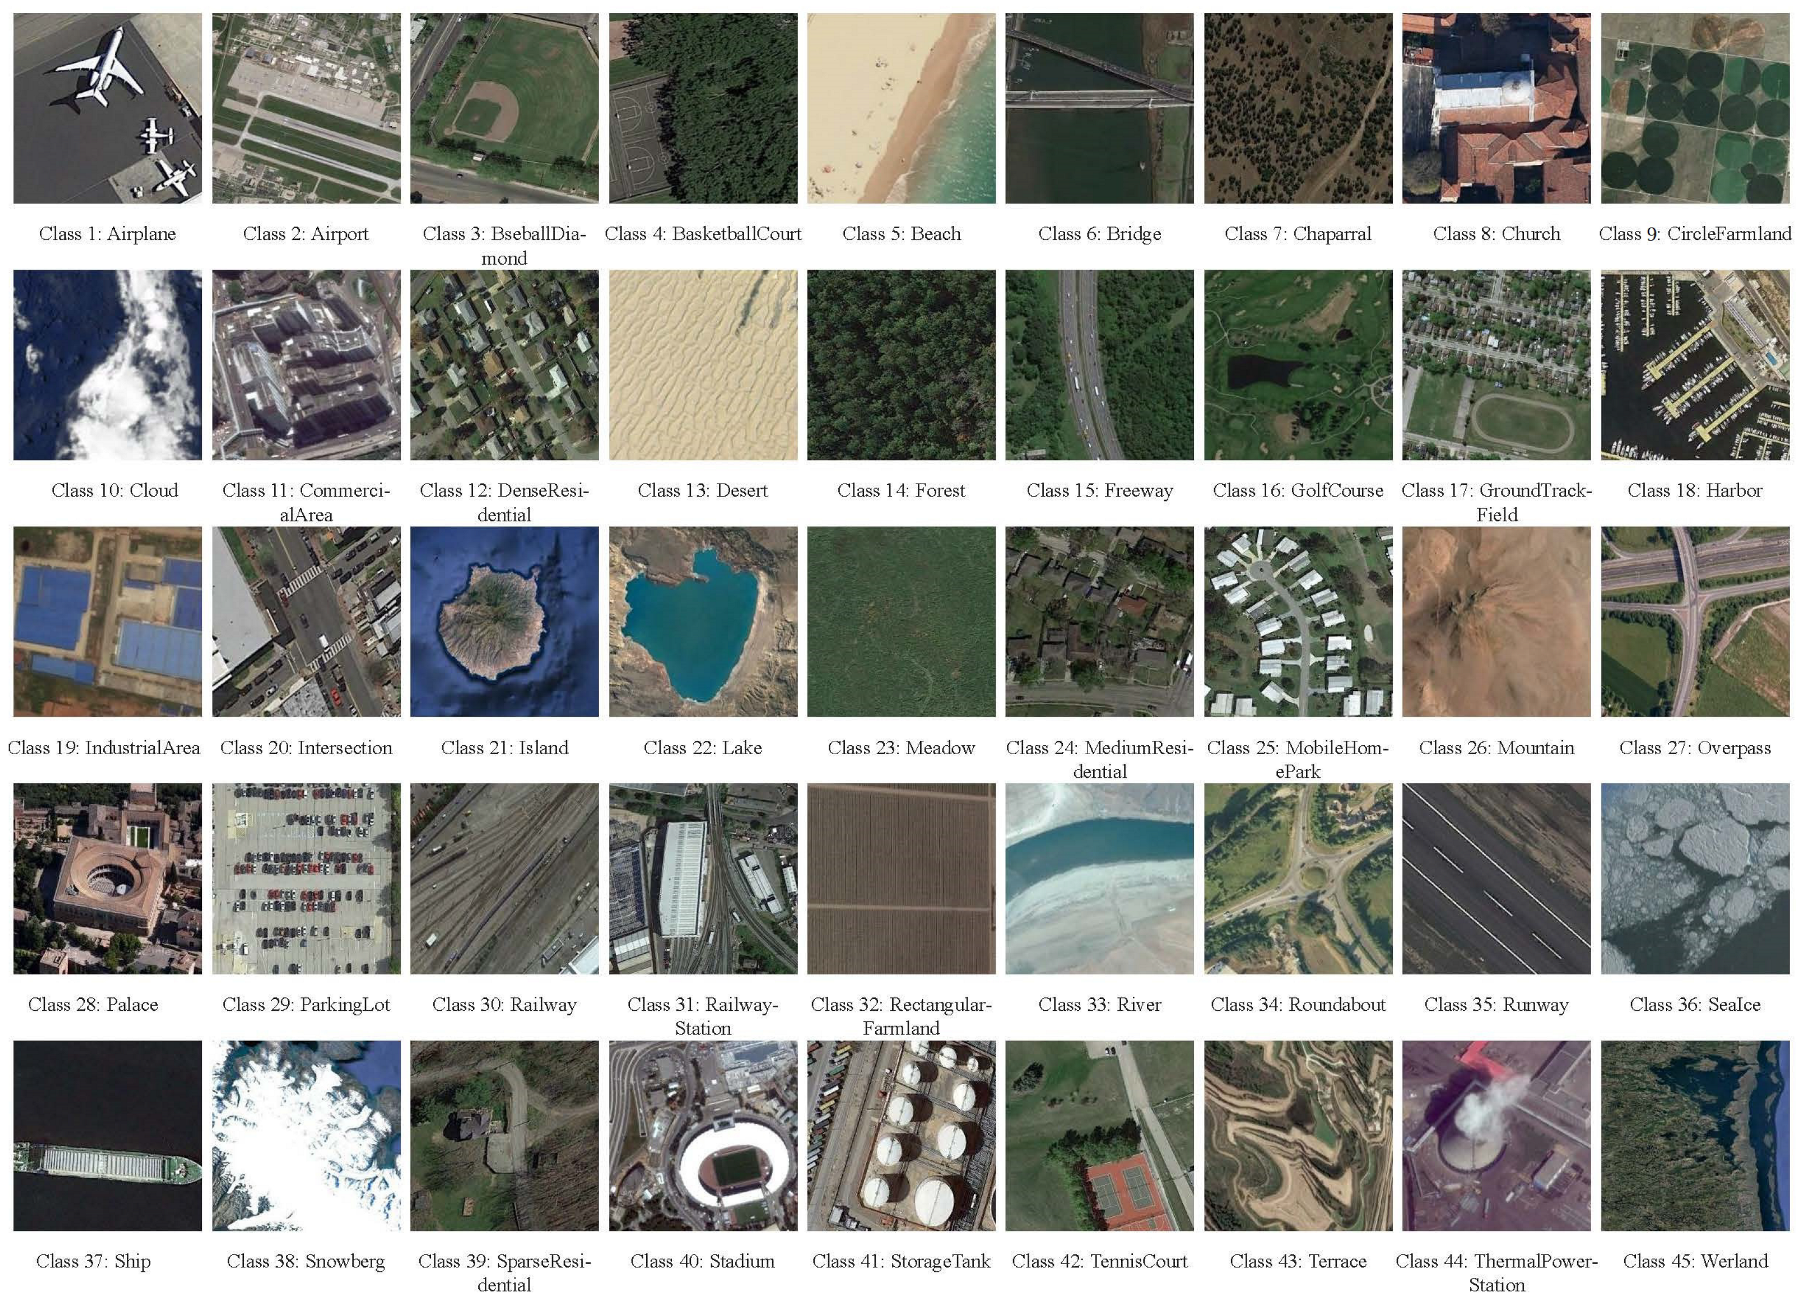
4.1. Dataset Introduction

The validation for performance of the proposed model is implemented on three popular aerial image datasets: UCM [57], AID [58] and NWPU RESISC45 [59].
UC Merced (UCM) Land Use Dataset is a 21-class image dataset for remote sensing classification tasks. There are 100 images for each category, as exhibited in Figure 4. Each image has a size of 256 × 256 pixels. The images were collected from large images from the USGS National Map Urban Area Imagery for various urban areas around the country. The pixel resolution of these public-domain images is 1 foot.
Aerial Image Dataset (AID) is a large scaled aerial image dataset, containing total 30 various RS classes. Each imaged is in size of 600 × 600 pixels, and the detailed classes are shown in Figure 5. These aerial images are collected through Google Earth images. Though the Google Map images were post-processed through RGB renderings from the original optical aerial images obtained by satellites, the dataset author proves that there is seldom difference between the selected images and raw optical images at the pixel level. Thus, the validation on AID is credible.
The NWPU-RESISC45 (NWPU) dataset referred by Northwestern Polytechnic University provides a large class range of land objection, sourced from aerial images in Google Map images. A total of 45 classes (in Figure 6) are involved, while 700 images of size 256 × 256 pixels are collected for each class. Compared with AID, the advantage of NWPU-RESISC45 is the same amount of pictures that it contains for all classes, which solves the problem of having an imbalance during training and testing. Therefore, it has become one of the most popular RS datasets since it was produced in 2016.
Three benchmark remote sensing scene datasets are employed in the following experiments, including UCM, AID, and NWPU. More details on the three datasets are outlined in Table 1.

4.2. Experimental Setup

4.2.1. Data Settings

In order to achieve objective results of classification, we divided all datasets randomly and repeated the experiments five times. The average results and their standard deviations are reported. To compare our model with other SOTA methods fairly, widely used training/testing ratios were adopted for each dataset. The training ratio was set to be 50% and 80% for the UCM dataset, 20% and 50% for the AID dataset, 10% and 20% for the NWPU dataset, respectively.

4.2.2. Implementation Details

All experiments were implemented by PyTorch 1.10.1 framework in an Ubuntu 18.04.6 LTS operating system. To accelerate the training process, four NVIDIA GeForce RTX 3080 GPUs with 10 GB memory were used for distributed data-parallel training. ImageNet-1k pre-trained model of Swin transformer was employed. Then, the model was fine-tuned on the remote sensing datasets for 300 epochs, and the batch size was set to 32. Cosine learning rate scheduler with linear warmup was adopted as a training strategy. Furthermore, an AdamW optimizer with an initial learning rate of 0.01 and weight decay of 0.05 was adopted to update model parameters. To facilitate the training, all input images were resized into 256 × 256. To avoid over-fitting problems, we employed data augmentations including horizontal random flip and random erasing.

4.2.3. Evaluation Metrics

Two commonly used evaluation metrics, overall accuracy (OA) and confusion matrix (CM), are employed for the quantitative evaluation of classification performance. OA serves as a fundamental metric for assessing the classification performance of a model across its entire dataset. It is defined as the ratio of correctly classified instances to the total number of instances. Mathematically, if a model classifies N instances, with M of them being correctly classified, then the OA is given by M / N , while the CM is a comprehensive evaluation tool that offers a detailed breakdown of the model’s performance across different classes. It is presented in a tabular format, where rows represent the actual classes and columns represent the predicted classes. Although OA and confusion matrices are the most commonly used evaluation methods for RS scene classification, they may not fully capture the performance of models, especially in cases of class imbalance or when both precision and recall are critical. Therefore, to provide a more comprehensive assessment, we also employ the F1-score as an additional metric to measure the performance of different models. The F1-score is calculated as the harmonic mean of precision and recall, defined as
F 1 = 2 · Precision · Recall Precision + Recall

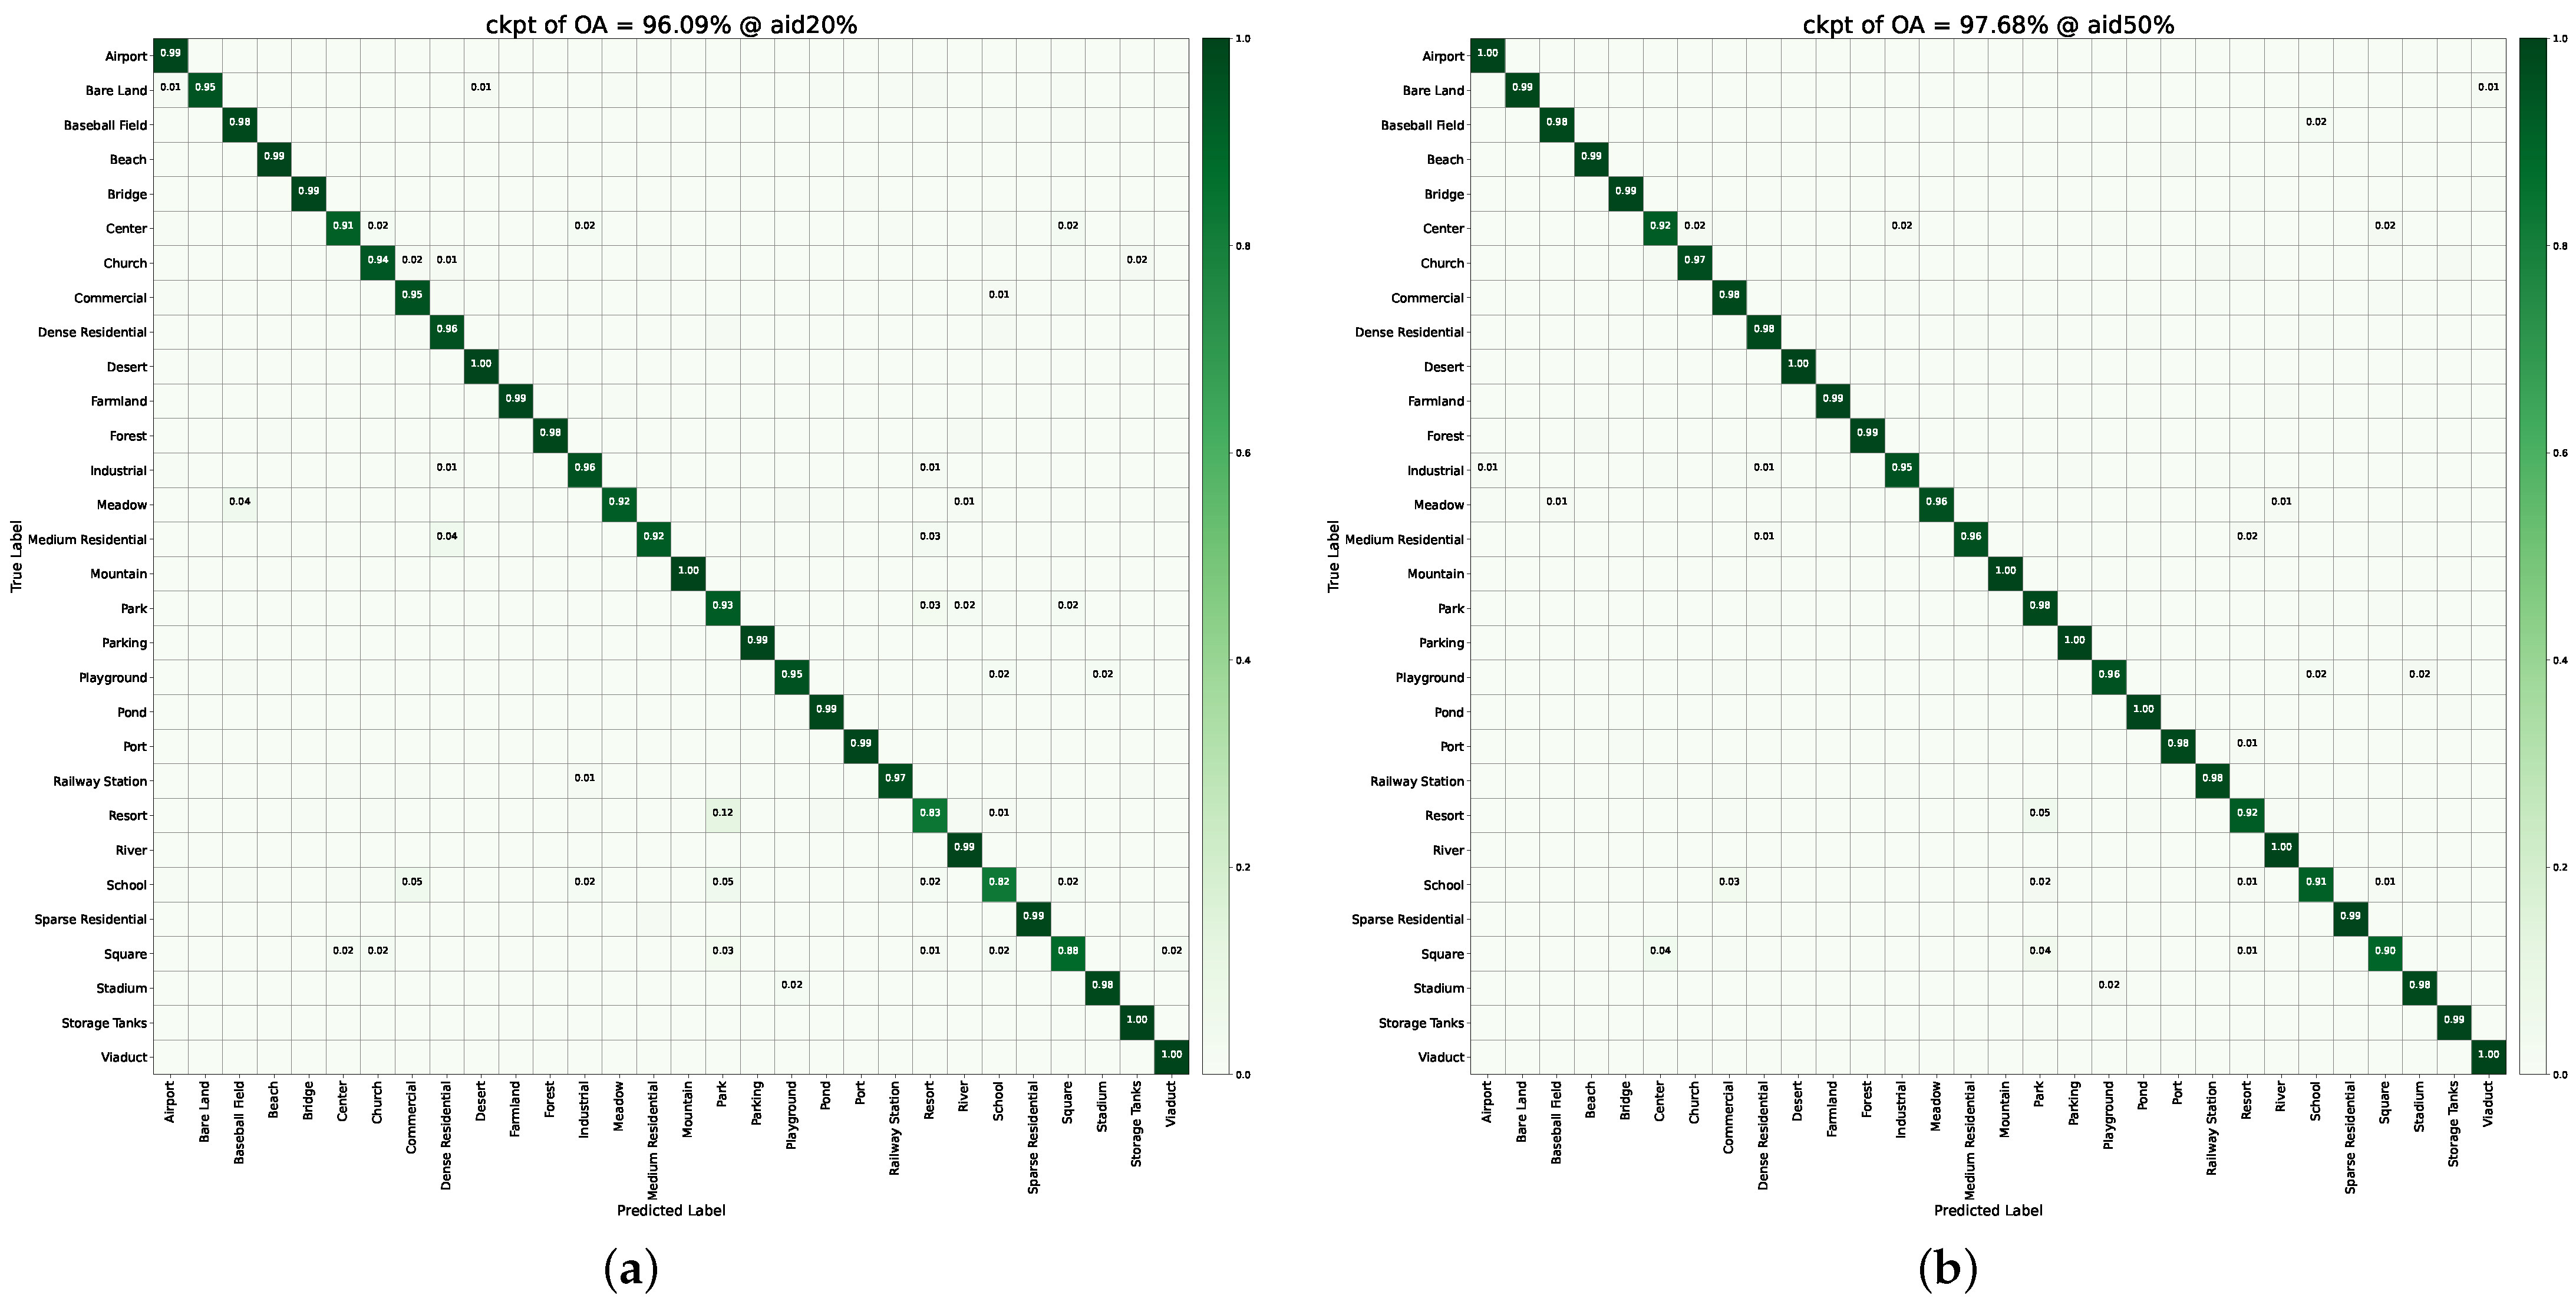
4.3. Experimental Results and Analysis

To illustrate the efficiency and superiority of the proposed STMSF method, it is compared with some SOTA CNN-based and transformer-based methods. For CNN-based methods, GoogLeNet [18], VGG-16 [18], APDC-Net [19], LCNN-BFF [20], BiMoblieNet [21], MSA-Network [22], PCNet [25], and MDRCD [42] are selected. For transformer-based methods, T2T-ViT-12 [27], PiT-S [30], PVT-Medium [28], HHTL [34], EMTCAL [35], CSAT [51], token merging (ToMe) [33], and LDBST [52] are selected. Moreover, among these methods, MSA-Network, MDRCN, and EMTCAL also use multi-scale features by incorporating the idea of FPN into their network architecture design. Comparing STMSF with these methods can further highlight the advantages of the proposed SAPN and the effectiveness of our multi-scale feature fusion strategy. For a fair comparison, we did not train these models from scratch but instead directly applied the results from the pre-trained models provided in the literature, which represent their best-reported performance. This approach ensures consistency and allows for a more accurate evaluation of our method against existing SOTA implementations. The evaluation metrics for different methods are reported in Table 2.
It can be clearly observed from Table 2 that the proposed STMSF method achieves the best classification accuracy on almost all datasets. Taking the UCM dataset as an example, the proposed STMSF achieves the highest classification accuracy of 99.01% at a 50% training ratio, making it the only method to surpass the 99% threshold among all compared approaches. At an 80% training ratio, STMSF attains an accuracy of 99.58%, ranking second overall and achieving the best performance among transformer-based models, slightly below the 99.64% accuracy achieved by the CNN-based MDRCN. On the AID dataset with a 20% training ratio, the proposed STMSF demonstrates superior performance, surpassing all compared methods by a significant margin. Specifically, STMSF achieves a notable improvement of 0.53% over HHTL, which is the best-performing method among the compared approaches. Similarly, on the NWPU dataset, the proposed STMSF achieves the highest accuracy across both evaluated training ratios. At a 10% training ratio, STMSF outperforms the second-best method, PCNet, by a margin of 0.24%, which achieved 92.64%. At a 20% training ratio, STMSF surpasses ToMe, the second-best performer with 94.65%, by a margin of 0.3%.
Apart from OA, we also report the CM results of the STMSF on three datasets in Figure 7, Figure 8 and Figure 9. Without loss of generality, we illustrate the superiority of our proposed model by explaining the results of the STMSF on the AID dataset with 50% training samples. It can be observed that STMSF achieves competitive classification results in most of the categories on the AID dataset. Classification accuracy over 90% can be obtained for all classes in the AID dataset. Moreover, the accuracy is higher than 95% in 26 categories and higher than 98% in 21 categories. Due to the high similarity within classes, the confusion matrix of the AID dataset indicates misclassification between some pairs of categories, such as park and resort, square and center, etc.
Considering the methods compared in this paper, some of the original implementations do not report the F1-score. For comparison purposes, we selected algorithms that provide the F1-score metric and compared them with STMSF, as shown in Table 3. Similar to the results for the OA metric, STMSF also performed well, with the exception of the F1-score on the UCM dataset with a 80% training ratio, which was 99.19%, 0.1% lower than that of LCNN-BFF. In all other cases, STMSF outperformed the other algorithms.

4.4. Ablation Study

To verify the effect of the key modules in the proposed STMSF, an ablation experiment was conducted with the NWPU dataset, which is the most challenging dataset due to the high similarity within classes. Table 4 shows the comparison results of different implementations. ST represents a Swin transformer using only top-layer features for classification. FPN or SAPN means that features are connected using an original feature pyramid network or the proposed SAPN. When the FPN or SAPN is included, the fusion module is obviously indispensable for the fusion of multi-scale features.
First, it can be observed that the vanilla Swin transformer achieves classification accuracies of 88.51% and 91.60% on the NWPU dataset at 10% and 20% training ratios, respectively, surpassing other transformer-based models such as T2T-ViT, PiT-S, and PVT-Medium. Given the inherent advantages of the Swin transformer in natural image scenarios, this phenomenon is not difficult to explain. Moreover, these results reinforce the research objective of this work, which is to further advance the application of transformer-based models, represented by the Swin transformer, in the application of RS scene classification. When multi-scale feature fusion is applied in the context of remote sensing scene classification, a remarkable improvement in classification accuracy can be observed. This significant enhancement underscores the crucial importance of multi-scale features in such tasks, demonstrating their indispensable role in boosting the performance of classification models. Furthermore, our experiments reveal that replacing the traditional FPN with the SAPN leads to a moderate yet noticeable improvement in classification accuracy. This improvement can be attributed to the spatial attention mechanism employed by SAPN, which is adept at enhancing the representation of important features in the spatial domain. By focusing on the most relevant parts of images or feature maps, the spatial attention mechanism helps to refine the multi-scale features and improve their effectiveness in the classification task.

4.5. Complexity Estimation

To evaluate the computational complexity, we listed the number of model parameters and floating-point operations per second (FLOPs) for each model. The number of parameters of a model indicates the total number of trainable variables in a model, reflecting its complexity and capacity to learn intricate patterns, while the FLOPs measure the computational speed of a model, indicating its ability to process image efficiently in terms of floating-point calculations. Similar to the calculation of the F1-score, since not all compared methods provide direct access to accurate model parameters and FLOPs, we only selected models that reported the relevant metrics for comparison.
The parameters and FLOPs of different models are shown in Table 5, where the unit for parameters is million (M); for FLOPs, the unit is billion (G). Since the proposed model is not specifically designed for lightweight purposes, parameters and FLOPs are not the primary advantages of STMSF. However, given that STMSF is an improvement based on a Swin transformer, its parameter count is not significantly different from that of a Swin transformer. Nonetheless, the ablation study results demonstrate a substantial performance improvement. Moreover, compared to CSAT, STMSF exhibits a clear advantage in terms of parameters and FLOPs, requiring only half of CSAT’s parameters and computational cost, which validates the effectiveness of STMSF to some extent.

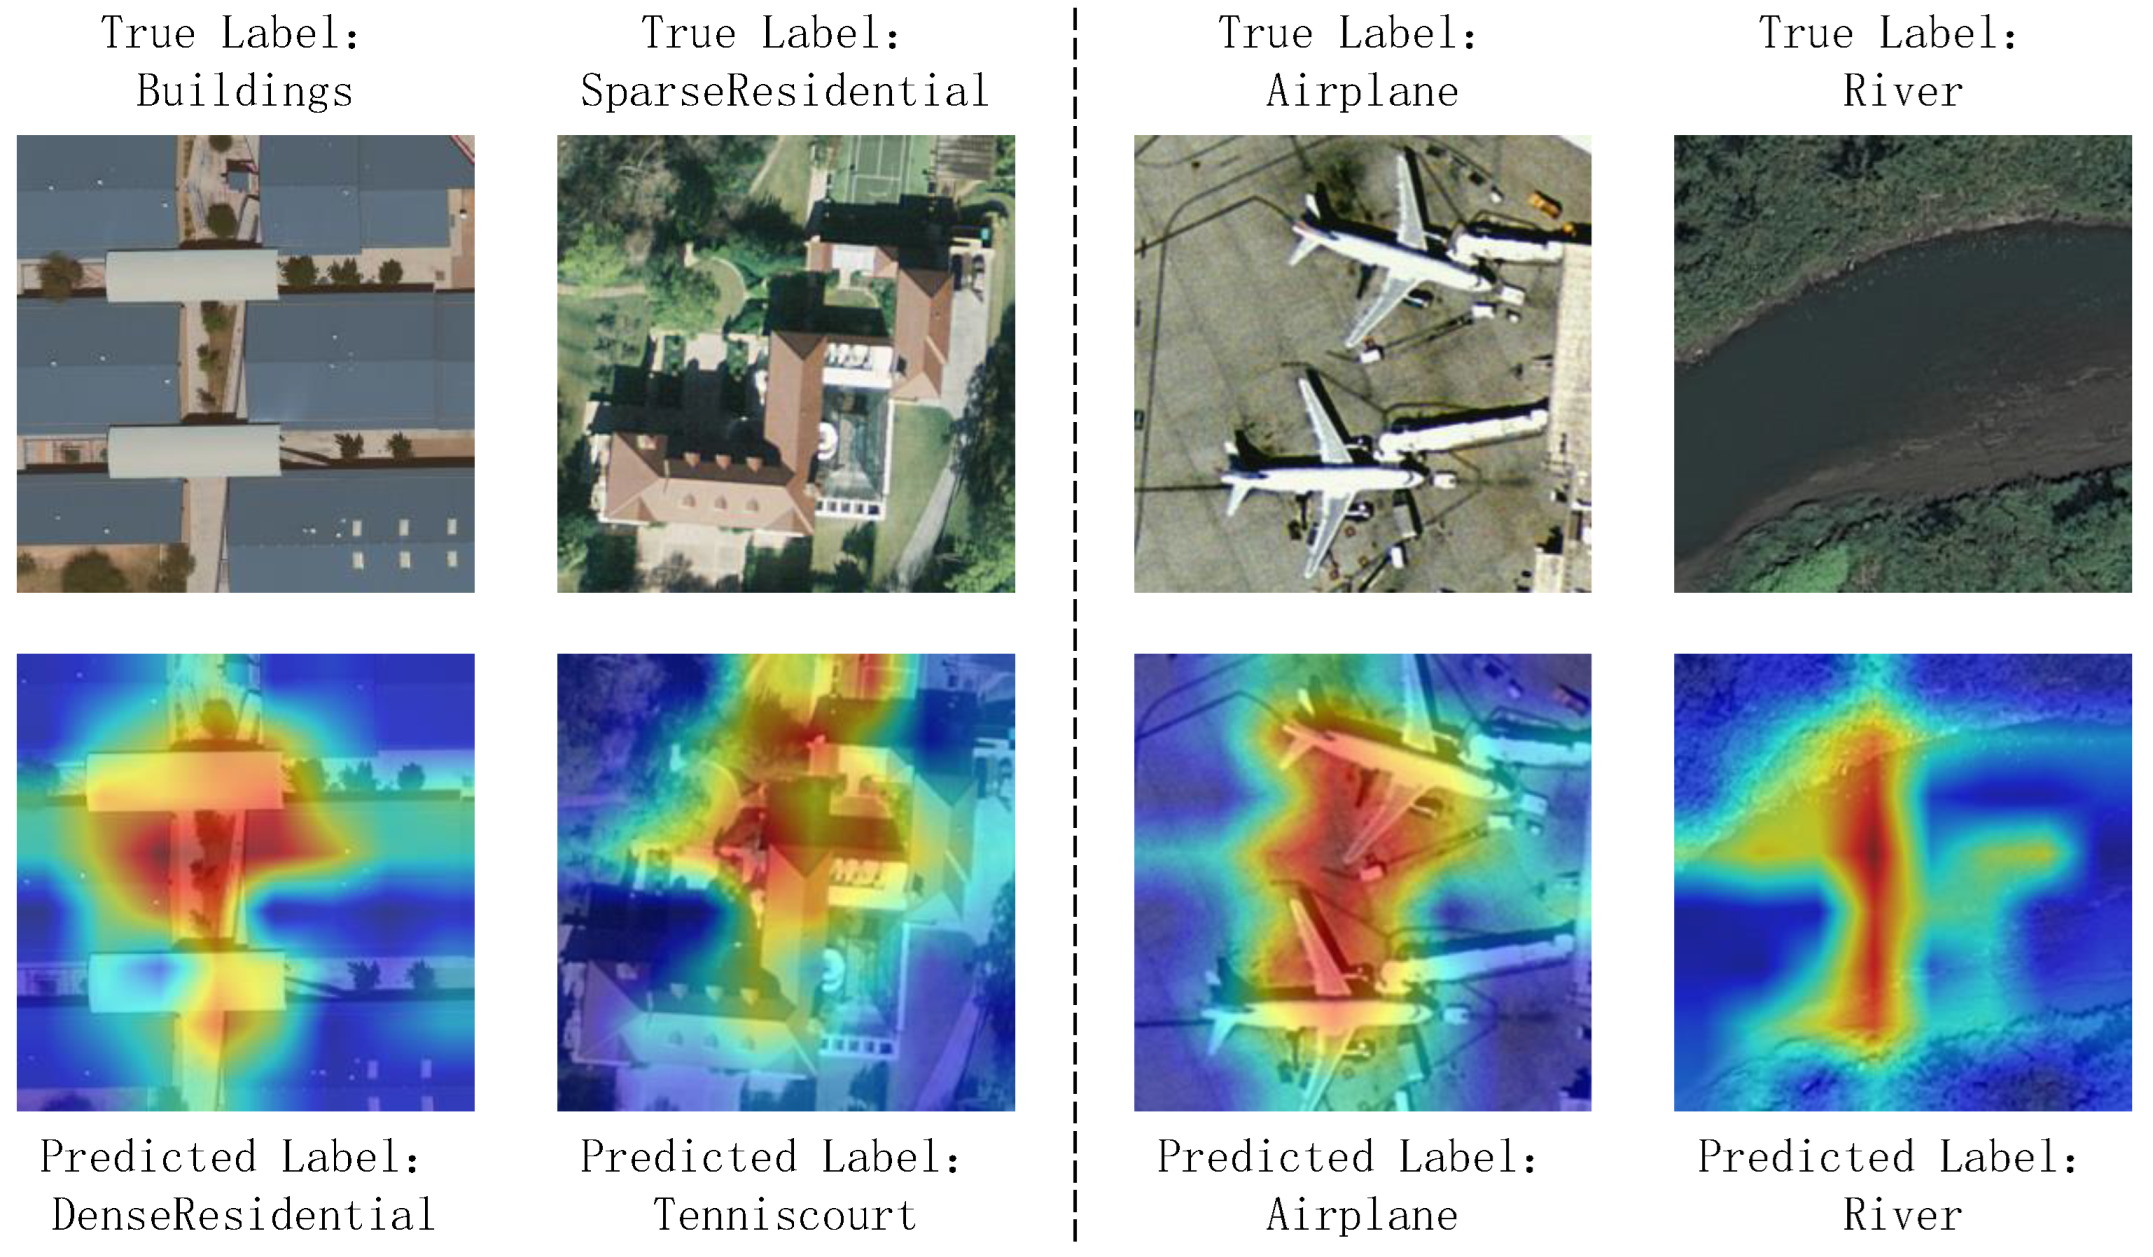
4.6. Explainable Artificial Intelligence Through Feature Visualization

To gain deeper insights into the decision-making process of the proposed STMSF model, we employ explainable artificial intelligence (XAI) techniques through feature visualization. Specifically, Grad-CAM [60] is utilized to generate class activation maps, highlighting the most influential regions in the input data that contribute to the model’s predictions. These visualizations provide an intuitive understanding of how STMSF processes different samples and identifies key features.
We applied the STMSF model to the UCM dataset and generated Grad-CAM results, as shown in Figure 10. For correctly classified samples—such as those in the “airplane” and “river” categories—the model’s attention was clearly concentrated on the most discriminative regions of the image, which are crucial for accurate predictions. However, in the case of the image from the “sparse residential” category, the presence of a tennis court at the top of the image attracted significant attention from the model, leading to an erroneous classification of a “tennis court”. Similarly, trees (commonly found in residential areas) present in the image of the “buildings” category misdirected the model, causing it to mistakenly label them as “dense residential”. These results indicate that while the attention mechanism in STMSF generally benefits prediction by focusing on key image regions, it can, in a few cases, result in misclassifications when it is drawn to misleading features.

5. Conclusions

In this paper, we propose a Swin transformer with multi-scale fusion for remote sensing scene classification. By leveraging the hierarchical structure of the Swin transformer, we effectively utilize multi-scale semantic information contained within the features. This information is further enhanced through the incorporation of a spatial attention module, which helps to focus on the most relevant parts of the image for classification. Finally, our multi-scale fusion layers seamlessly combine all these features into a cohesive vector, ready for accurate classification. Through extensive experiments on three benchmark datasets, we demonstrate that the proposed STMSF clearly outperforms some of the state-of-the-art methods, underscoring its superiority and advancement in the field of remote sensing scene classification. Our results not only validate the importance of the comprehensive utilization of multi-scale features within a transformer architecture but also highlight the potential for further refinement and enhancement of these features.
Looking ahead, there are several directions in which we plan to extend our work. First, we will delve deeper into the transformative potential of transformers and explore new ways to design more powerful feature fusion modules. By understanding how transformers can be tailored to better capture and integrate multi-scale features, we aim to push the boundaries of remote sensing scene classification even further. Additionally, we recognize that multi-scale features, while rich in semantic information, can be coarse in spatial information representation. Therefore, we will investigate methods to refine these features, potentially through the use of additional spatial attention mechanisms or convolutional layers, to capture finer details and improve classification accuracy. Furthermore, we plan to transfer our method to other remote sensing applications, such as land use classification, change detection, and target recognition. By demonstrating the versatility and effectiveness of our STMSF approach across a range of remote sensing tasks, we hope to contribute to the broader field of geospatial analytics and promote the adoption of transformer-based architectures in remote sensing research.

Author Contributions

Conceptualization, S.M.; methodology, Y.D. and C.S.; software, Y.D., C.S. and P.C.; validation, Y.D. and C.S.; formal analysis, Y.D. and C.S.; writing—original draft preparation, Y.D., C.S. and P.C.; writing—review and editing, Y.Z. and S.M.; supervision, S.M.; project administration, S.M.; funding acquisition, S.M. All authors have read and agreed to the published version of the manuscript.

Funding

This work was supported by the National Natural Science Foundation of China (No. 62171381).

Data Availability Statement

The original contributions presented in the study are included in the article, further inquiries can be directed to the corresponding author.

Acknowledgments

The authors thank the anonymous reviewers and editors for their suggestions and insightful comments on this article.

Conflicts of Interest

The authors declare no conflicts of interest.

References

  1. Mei, S.; Jiang, R.; Li, X.; Du, Q. Spatial and spectral joint super-resolution using convolutional neural network. IEEE Trans. Geosci. Remote Sens. 2020, 58, 4590–4603. [Google Scholar] [CrossRef]
  2. Mei, S.; Geng, Y.; Hou, J.; Du, Q. Learning hyperspectral images from RGB images via a coarse-to-fine CNN. Sci. China Inf. Sci. 2022, 65, 152102. [Google Scholar] [CrossRef]
  3. Mei, S.; Song, C.; Ma, M.; Xu, F. Hyperspectral image classification using group-aware hierarchical transformer. IEEE Trans. Geosci. Remote Sens. 2022, 60, 5539014. [Google Scholar] [CrossRef]
  4. Wen, Y.; Gao, T.; Zhang, J.; Li, Z.; Chen, T. Encoder-free multiaxis physics-aware fusion network for remote sensing image dehazing. IEEE Trans. Geosci. Remote Sens. 2023, 61, 4705915. [Google Scholar] [CrossRef]
  5. Liu, Q.; Peng, J.; Zhang, G.; Sun, W.; Du, Q. Deep contrastive learning network for small-sample hyperspectral image classification. J. Remote Sens. 2023, 3, 0025. [Google Scholar] [CrossRef]
  6. Mei, S.; Jiang, R.; Ma, M.; Song, C. Rotation-invariant feature learning via convolutional neural network with cyclic polar coordinates convolutional layer. IEEE Trans. Geosci. Remote Sens. 2023, 61, 5600713. [Google Scholar] [CrossRef]
  7. Han, Z.; Zhang, Z.; Zhang, S.; Zhang, G.; Mei, S. Aerial visible-to-infrared image translation: Dataset, evaluation, and baseline. J. Remote Sens. 2023, 3, 0096. [Google Scholar] [CrossRef]
  8. Gao, T.; Li, Z.; Wen, Y.; Chen, T.; Niu, Q.; Liu, Z. Attention-free global multiscale fusion network for remote sensing object detection. IEEE Trans. Geosci. Remote Sens. 2024, 62, 5603214. [Google Scholar] [CrossRef]
  9. Mei, S.; Lian, J.; Wang, X.; Su, Y.; Ma, M.; Chau, L.-P. A comprehensive study on the robustness of deep learning-based image classification and object detection in remote sensing: Surveying and benchmarking. J. Remote Sens. 2024, 4, 0219. [Google Scholar] [CrossRef]
  10. Chen, S.; Tian, Y. Pyramid of spatial relatons for scene-level land use classification. IEEE Trans. Geosci. Remote Sens. 2015, 53, 1947–1957. [Google Scholar] [CrossRef]
  11. Weng, Q.; Mao, Z.; Lin, J.; Guo, W. Land-use classification via extreme learning classifier based on deep convolutional features. IEEE Geosci. Remote Sens. Lett. 2017, 14, 704–708. [Google Scholar] [CrossRef]
  12. Huang, X.; Wen, D.; Li, J.; Qin, R. Multi-level monitoring of subtle urban changes for the megacities of china using high-resolution multi-view satellite imagery. Remote Sens. Environ. 2017, 196, 56–75. [Google Scholar] [CrossRef]
  13. Wang, X.; Wang, S.; Ning, C.; Zhou, H. Enhanced feature pyramid network with deep semantic embedding for remote sensing scene classification. IEEE Trans. Geosci. Remote Sens. 2021, 59, 7918–7932. [Google Scholar] [CrossRef]
  14. Qian, X.; Gao, S.; Deng, W.; Wang, W. Improving oriented object detection by scene classification and task-aligned focal loss. Mathematics 2024, 12, 1343. [Google Scholar] [CrossRef]
  15. Aptoula, E. Remote sensing image retrieval with global morphological texture descriptors. IEEE Trans. Geosci. Remote Sens. 2014, 52, 3023–3034. [Google Scholar] [CrossRef]
  16. Zohrevand, A.; Ahmadyfard, A.; Pouyan, A.; Imani, Z. A sift based object recognition using contextual information. In Proceedings of the 2014 Iranian Conference on Intelligent Systems, Bam, Iran, 4–6 February 2014; pp. 1–5. [Google Scholar]
  17. Gan, L.; Liu, P.; Wang, L. Rotation sliding window of the hog feature in remote sensing images for ship detection. In Proceedings of the 2015 8th International Symposium on Computational Intelligence and Design, Hangzhou, China, 12–13 December 2015; pp. 401–404. [Google Scholar]
  18. Cheng, G.; Han, J.; Lu, X. Remote sensing image scene classification: Benchmark and state of the art. Proc. IEEE 2017, 105, 1865–1883. [Google Scholar] [CrossRef]
  19. Bi, Q.; Qin, K.; Zhang, H.; Xie, J.; Xu, K. APDC-Net: Attention pooling-based convolutional network for aerial scene classification. IEEE Geosci. Remote Sens. Lett. 2019, 17, 1603–1607. [Google Scholar] [CrossRef]
  20. Shi, C.; Wang, T.; Wang, L. Branch feature fusion convolution network for remote sensing scene classification. IEEE J. Sel. Topics Appl. Earth Observ. Remote Sens. 2020, 13, 5194–5210. [Google Scholar] [CrossRef]
  21. Yu, D.; Xu, Q.; Guo, H.; Zhao, C.; Lin, Y.; Li, D. An efficient and lightweight convolutional neural network for remote sensing image scene classification. Sensors 2020, 20, 1999. [Google Scholar] [CrossRef] [PubMed]
  22. Zhang, G.; Xu, W.; Zhao, W.; Huang, C.; Yk, E.N.; Chen, Y.; Su, J. A multiscale attention network for remote sensing scene images classification. IEEE J. Sel. Topics Appl. Earth Observ. Remote Sens. 2021, 14, 9530–9545. [Google Scholar] [CrossRef]
  23. Tian, T.; Li, L.; Chen, W.; Zhou, H. SEMSDNet: A mltiscale dense network with attention for remote sensing scene classification. IEEE J. Sel. Topics Appl. Earth Observ. Remote Sens. 2021, 14, 5501–5514. [Google Scholar] [CrossRef]
  24. Joshi, G.P.; Alenezi, F.; Thirumoorthy, G.; Dutta, A.K.; You, J. Ensemble of deep learning-based multimodal remote sensing image classification model on unmanned aerial vehicle networks. Mathematics 2021, 9, 2984. [Google Scholar] [CrossRef]
  25. Zhang, Y.; Zheng, X.; Lu, X. Pairwise comparison network for remote-sensing scene classification. IEEE Geosci. Remote Sens. Lett. 2022, 19, 6505105. [Google Scholar] [CrossRef]
  26. Dosovitskiy, A.; Beyer, L.; Kolesnikov, A.; Weissenborn, D.; Zhai, X.; Unterthiner, T.; Dehghani, M.; Minderer, M.; Heigold, G.; Gelly, S.; et al. An image is worth 16 × 16 words: Transformers for image recognition at scale. In Proceedings of the International Conference on Learning Representations, Virtual, 3–7 May 2021; pp. 1–22. [Google Scholar]
  27. Yuan, L.; Chen, Y.; Wang, T.; Yu, W.; Shi, Y.; Jiang, Z.; Tay, F.E.; Feng, J.; Yan, S. Tokens-to-token ViT: Training vision transformers from scratch on imagenet. In Proceedings of the 2021 IEEE/CVF International Conference on Computer Vision, Montreal, QC, Canada, 10–17 October 2021; pp. 538–547. [Google Scholar]
  28. Wang, W.; Xie, E.; Li, X.; Fan, D.-P.; Song, K.; Liang, D.; Lu, T.; Luo, P.; Shao, L. Pyramid vision transformer: A versatile backbone for dense prediction without convolutions. In Proceedings of the 2021 IEEE/CVF International Conference on Computer Vision, Montreal, QC, Canada, 10–17 October 2021; pp. 568–578. [Google Scholar]
  29. Liu, Z.; Lin, Y.; Cao, Y.; Hu, H.; Wei, Y.; Zhang, Z.; Lin, S.; Guo, B. Swin transformer: Hierarchical vision transformer using shifted windows. In Proceedings of the 2021 IEEE/CVF International Conference on Computer Vision, Montreal, QC, Canada, 10–17 October 2021; pp. 10012–10022. [Google Scholar]
  30. Heo, B.; Yun, S.; Han, D.; Chun, S.; Choe, J.; Oh, S.J. Rethinking spatial dimensions of vision transformers. In Proceedings of the 2021 IEEE/CVF International Conference on Computer Vision, Montreal, QC, Canada, 10–17 October 2021; pp. 11936–11945. [Google Scholar]
  31. Zhang, Z.; Miao, C.; Liu, C.; Tian, Q.; Zhou, Y. Hybrid attention transformer with multi-branch for large-scale high-resolution dense road segmentation. Mathematics 2022, 10, 1915. [Google Scholar] [CrossRef]
  32. He, S.; Yang, H.; Zhang, X.; Li, X. MFTransNet: A multi-modal fusion with CNN-transformer network for semantic segmentation of HSR remote sensing images. Mathematics 2023, 11, 722. [Google Scholar] [CrossRef]
  33. Bolya, D.; Fu, C.-Y.; Dai, X.; Zhang, P.; Feichtenhofer, C.; Hoffman, J. Token merging: Your ViT but faster. In Proceedings of the Eleventh International Conference on Learning Representations, Kigali, Rwanda, 1–5 May 2023; pp. 1–20. [Google Scholar]
  34. Ma, J.; Li, M.; Tang, X.; Zhang, X.; Liu, F.; Jiao, L. Homo–heterogenous transformer learning framework for rs scene classification. IEEE J. Sel. Topics Appl. Earth Observ. Remote Sens. 2022, 15, 2223–2239. [Google Scholar] [CrossRef]
  35. Tang, X.; Li, M.; Ma, J.; Zhang, X.; Liu, F.; Jiao, L. EMTCAL: Efficient multiscale transformer and cross-level attention learning for remote sensing scene classification. IEEE Trans. Geosci. Remote Sens. 2022, 60, 5626915. [Google Scholar] [CrossRef]
  36. Lv, P.; Wu, W.; Zhong, Y.; Du, F.; Zhang, L. SCViT: A spatial channel feature preserving vision transformer for remote sensing image scene classification. IEEE Trans. Geosci. Remote Sens. 2022, 60, 4409512. [Google Scholar] [CrossRef]
  37. Chen, J.; Yi, J.; Chen, A.; Jin, Z. EFCOMFF-Net: A multiscale feature fusion architecture with enhanced feature correlation for remote sensing image scene classification. IEEE Trans. Geosci. Remote Sens. 2023, 61, 5604917. [Google Scholar] [CrossRef]
  38. Song, P.; Li, J.; An, Z.; Fan, H.; Fan, L. CTMFNet: CNN and transformer multiscale fusion network of remote sensing urban scene imagery. IEEE Trans. Geosci. Remote Sens. 2023, 61, 5900314. [Google Scholar] [CrossRef]
  39. Wei, R.; Feng, Z.; Wu, Z.; Yu, C.; Song, B.; Cao, C. Optical remote sensing image target detection based on improved feature pyramid. IEEE J. Sel. Topics Appl. Earth Observ. Remote Sens. 2023, 16, 7507–7517. [Google Scholar] [CrossRef]
  40. Yuan, B.; Sehra, S.S.; Chiu, B. Multi-scale and multi-network deep feature fusion for discriminative scene classification of high-resolution remote sensing images. Remote Sens. 2024, 16, 3961. [Google Scholar] [CrossRef]
  41. Wang, W.; Shi, Y.; Wang, X. RMFFNet: A reverse multi-scale feature fusion network for remote sensing scene classification. In Proceedings of the 2024 International Joint Conference on Neural Networks, Yokohama, Japan, 30 June–5 July 2024; pp. 1–8. [Google Scholar]
  42. Dai, W.; Shi, F.; Wang, X.; Xu, H.; Yuan, L.; Wen, X. A multi-scale dense residual correlation network for remote sensing scene classification. Sci. Rep. 2024, 14, 22197. [Google Scholar] [CrossRef] [PubMed]
  43. Lv, P.; Wu, W.; Zhong, Y.; Zhang, L. Review of vision transformer models for remote sensing image scene classification. In Proceedings of the 2022 IEEE International Geoscience and Remote Sensing Symposium, Kuala Lumpur, Malaysia, 17–22 July 2022; pp. 2231–2234. [Google Scholar]
  44. Chen, X.; Ma, M.; Li, Y.; Mei, S.; Han, Z.; Zhao, J.; Cheng, W. Hierarchical feature fusion of transformer with patch dilating for remote sensing scene classification. IEEE Trans. Geosci. Remote Sens. 2023, 61, 4410516. [Google Scholar] [CrossRef]
  45. Li, D.; Liu, R.; Tang, Y.; Liu, Y. PSCLI-TF: Position-sensitive cross-layer interactive transformer model for remote sensing image scene classification. IEEE Geosci. Remote Sens. Lett. 2024, 21, 5001305. [Google Scholar] [CrossRef]
  46. Roy, S.K.; Deria, A.; Hong, D.; Rasti, B.; Plaza, A.; Chanussot, J. Multimodal fusion transformer for remote sensing image classification. IEEE Trans. Geosci. Remote Sens. 2023, 61, 5515620. [Google Scholar] [CrossRef]
  47. Wang, G.; Zhang, N.; Liu, W.; Chen, H.; Xie, Y. MFST: A multi-level fusion network for remote sensing scene classification. IEEE Geosci. Remote Sens. Lett. 2022, 19, 6516005. [Google Scholar] [CrossRef]
  48. Hao, S.; Li, N.; Ye, Y. Inductive biased swin-transformer with cyclic regressor for remote sensing scene classification. IEEE J. Sel. Topics Appl. Earth Observ. Remote Sens. 2023, 16, 6265–6278. [Google Scholar] [CrossRef]
  49. Sha, Z.; Li, J. MITformer: A multiinstance vision transformer for remote sensing scene classification. IEEE Geosci. Remote Sens. Lett. 2022, 19, 6510305. [Google Scholar] [CrossRef]
  50. Kandala, H.; Saha, S.; Banerjee, B.; Zhu, X.X. Exploring transformer and multilabel classification for remote sensing image captioning. IEEE Geosci. Remote Sens. Lett. 2022, 19, 6514905. [Google Scholar] [CrossRef]
  51. Guo, J.; Jia, N.; Bai, J. Transformer based on channel-spatial attention for accurate classification of scenes in remote sensing image. Sci. Rep. 2022, 12, 15473. [Google Scholar] [CrossRef] [PubMed]
  52. Zheng, F.; Lin, S.; Zhou, W.; Huang, H. A lightweight dual-branch swin transformer for remote sensing scene classification. Remote Sens. 2023, 15, 2865. [Google Scholar] [CrossRef]
  53. Lin, T.-Y.; Dollár, P.; Girshick, R.; He, K.; Hariharan, B.; Belongie, S. Feature pyramid networks for object detection. In Proceedings of the 2017 IEEE Conference on Computer Vision and Pattern Recognition, Honolulu, HI, USA, 21–26 July 2017; pp. 2117–2125. [Google Scholar]
  54. Woo, S.; Park, J.; Lee, J.-Y.; Kweon, I.S. CBAM: Convolutional block attention module. In Proceedings of the 15th European Conference on Computer Vision, Munich, Germany, 8–14 September 2018; pp. 3–19. [Google Scholar]
  55. Cheng, G.; Lang, C.; Wu, M.; Xie, X.; Yao, X.; Han, J. Feature enhancement network for object detection in optical remote sensing images. J. Remote Sens. 2021, 2021, 9805389. [Google Scholar] [CrossRef]
  56. Mei, S.; Yan, K.; Ma, M.; Chen, X.; Zhang, S.; Du, Q. Remote sensing scene classification using sparse representation-based framework with deep feature fusion. IEEE J. Sel. Topics Appl. Earth Observ. Remote Sens. 2021, 14, 5867–5878. [Google Scholar] [CrossRef]
  57. Yang, Y.; Newsam, S. Bag-of-visual-words and spatial extensions for land-use classification. In Proceedings of the 18th SIGSPATIAL International Conference on Advances in Geographic Information Systems, San Jose, CA, USA, 2–5 November 2010; pp. 270–279. [Google Scholar]
  58. Xia, G.-S.; Hu, J.; Hu, F.; Shi, B.; Bai, X.; Zhong, Y.; Zhang, L.; Lu, X. AID: A benchmark data set for performance evaluation of aerial scene classification. IEEE Trans. Geosci. Remote Sens. 2017, 55, 3965–3981. [Google Scholar] [CrossRef]
  59. Cheng, G.; Li, Z.; Yao, X.; Guo, L.; Wei, Z. Remote sensing image scene classification using bag of convolutional features. IEEE Geosci. Remote Sens. Lett. 2017, 14, 1735–1739. [Google Scholar] [CrossRef]
  60. Selvaraj, R.R.; Cogswell, M.; Das, A.; Vedantam, R.; Parikh, D.; Batra, D. Grad-CAM: Visual explanations from deep networks via gradient-based localization. In Proceedings of the 2017 IEEE Conference on Computer Vision and Pattern Recognition, Honolulu, HI, USA, 21–26 July 2017; pp. 618–626. [Google Scholar]
Figure 1. Schematic diagram of RS scene classification of the proposed STMSF.
Remotesensing 17 00668 g001
Figure 2. Two consecutive Swin transformer blocks.
Remotesensing 17 00668 g002
Figure 3. Diagram of spatial attention module.
Remotesensing 17 00668 g003
Figure 4. Sample images of the 21 categories involved in the UCM dataset.
Remotesensing 17 00668 g004
Figure 5. Sample images of AID; one image is selected for each category.
Remotesensing 17 00668 g005
Figure 6. Sample images of the 45 categories involved in the NWPU-RESISC45 dataset.
Remotesensing 17 00668 g006
Figure 7. Confusion matrices of the proposed method under training ratios of 50% and 80% on the UCM dataset (checkpoint model with median classification of five experiments is used, and values below 0.01 in CM are discarded). (a) CM on the UCM dataset with 50% training images. (b) CM on the UCM dataset with 80% training images.
Remotesensing 17 00668 g007
Figure 8. Confusion matrices of the proposed method under training ratios of 20% and 50% on the AID dataset (checkpoint model with median classification of five experiments is used, and values below 0.01 in CM are discarded). (a) CM on the AID dataset with 20% training images. (b) CM on the AID dataset with 50% training images.
Remotesensing 17 00668 g008
Figure 9. Confusion matrices of the proposed method under training ratios of 10% and 20% on the NWPU dataset (checkpoint model with median classification of five experiments is used, and values below 0.01 in CM are discarded). (a) CM on the NWPU dataset with 10% training images. (b) CM on the NWPU dataset with 20% training images.
Remotesensing 17 00668 g009
Figure 10. Attention maps of STMSF. In Grad-CAM, redder regions indicate higher importance for the model’s predictions, while bluer areas suggest lower relevance.
Remotesensing 17 00668 g010
Table 1. Descriptions of used remote sensing scene datasets.
DatasetTotalClassesN per ClassResolutionSize
UCM2100211000.3m256 × 256
AID10,00030220–4200.5–8 m600 × 600
NWPU31,500457000.2–30 m256 × 256
Table 2. Comparison of the proposed method with other state-of-the-art models in terms of OA (%) on three remote sensing scene datasets (displayed as mean ± std).
MethodUCM@50%UCM@80%AID@20%AID@50%NWPU@10%NWPU@20%
GoogLeNet [18]92.70 ± 0.6094.31 ± 0.8983.44 ± 0.4086.39 ± 0.5576.19 ± 0.3878.48 ± 0.26
VGG-16 [18]94.14 ± 0.6995.21 ± 1.2086.59 ± 0.2989.64 ± 0.3676.47 ± 0.1879.79 ± 0.15
APDC-Net [19]95.01 ± 0.4397.05 ± 0.4388.56 ± 0.2992.15 ± 0.2985.94 ± 0.2287.84 ± 0.26
LCNN-BFF [20]94.64 ± 0.2199.29 ± 0.2491.66 ± 0.4894.62 ± 0.1686.53 ± 0.1591.73 ± 0.17
BiMoblieNet [21]98.45 ± 0.2799.03 ± 0.2894.38 ± 0.2496.87 ± 0.2392.06 ± 0.1494.08 ± 0.11
MSA-Network [22]97.80 ± 0.3398.96 ± 0.2193.53 ± 0.2196.01 ± 0.4390.38 ± 0.1793.52 ± 0.21
PCNet [25]98.71 ± 0.2299.25 ± 0.3795.53 ± 0.1696.76 ± 0.2592.64 ± 0.1394.59 ± 0.07
MDRCN [42]98.57 ± 0.1999.64 ± 0.1293.64 ± 0.1995.66 ± 0.1891.59 ± 0.2993.82 ± 0.17
T2T-ViT-12 [27]95.68 ± 0.6197.81 ± 0.4990.09 ± 0.0893.82 ± 0.5584.91 ± 0.3089.43 ± 0.23
PiT-S [30]95.83 ± 0.3998.33 ± 0.5090.51 ± 0.5794.17 ± 0.3685.85 ± 0.1889.91 ± 0.19
PVT-Medium [28]96.27 ± 0.4298.48 ± 0.4992.13 ± 0.4595.28 ± 0.2387.40 ± 0.3691.39 ± 0.09
HHTL [34]98.87 ± 0.2899.48 ± 0.2895.62 ± 0.1396.88 ± 0.2192.07 ± 0.4494.21 ± 0.09
EMTCAL [35]98.67 ± 0.1699.57 ± 0.2894.69 ± 0.1496.41 ± 0.2391.63 ± 0.1993.65 ± 0.12
CSAT [51]95.72 ± 0.2397.86 ± 0.1692.55 ± 0.2895.44 ± 0.1789.70 ± 0.1893.06 ± 0.16
ToMe [33]98.54 ± 0.1099.20 ± 0.0795.19 ± 0.0997.17 ± 0.1292.56 ± 0.1094.65 ± 0.16
LDBST [52]98.76 ± 0.2999.52 ± 0.2495.10 ± 0.0996.84 ± 0.2090.83 ± 0.1193.56 ± 0.07
STMSF99.01 ± 0.3199.58 ± 0.2396.15 ± 0.1697.51 ± 0.3792.88 ± 0.1694.95 ± 0.11
Bold denotes the best result.
Table 3. F1-score (%) for different methods on UCM, AID, and NWPU datasets.
MethodF1-Score (%)
UCM AID NWPU
50% 80% 20% 50% 10% 20%
VGG-16 [18]87.8588.1269.9073.3459.9963.29
LCNN-BFF [20]-99.2991.6194.5686.4491.67
Vit-B [26]96.7997.7493.3995.3889.4392.10
PVT-Medium [28]98.1399.0893.8995.2089.8391.22
STMSF98.2599.1994.5196.2691.9192.30
Bold denotes the best result.
Table 4. Ablation study of our proposed STMSF. Experiments over the NWPU dataset (displayed as mean ± std).
STFPNSAPNFusionNWPU@10%NWPU@20%
88.51 ± 0.1991.60 ± 0.10
91.65 ± 0.1493.88 ± 0.23
92.88 ± 0.1694.95 ± 0.11
Bold denotes the best result.
Table 5. Compare parameters and speed with other models.
ArchitectureParameters (M)FLOPs (G)
GoogLeNet [18]6.8-
VGG-16 [18]138-
APDC-Net [19]0.6-
LCNN-BFF [20]6-
BiMoblieNet [21]7.760.45
PCNet [25]32.13.87
EMTCAL [35]-4.23
CSAT [51]85.9916.88
ToMe [33]-4.6
LDBST [52]9.32.6
Swin Transformer48.818.54
STMSF48.858.60
Bold denotes the best result.
Disclaimer/Publisher’s Note: The statements, opinions and data contained in all publications are solely those of the individual author(s) and contributor(s) and not of MDPI and/or the editor(s). MDPI and/or the editor(s) disclaim responsibility for any injury to people or property resulting from any ideas, methods, instructions or products referred to in the content.

