Article

A Geometric Calibration Method for Spaceborne Single-Photon Lasers That Integrates Laser Detectors and Corner Cube Retroreflectors

1
Faculty of Geography, Yunnan Normal University, Kunming 650500, China
2
The Engineering Research Center of GIS Technology in Western China, Ministry of Education of China, Kunming 650500, China
3
Land Satellite Remote Sensing Application Center, Ministry of Natural Resources of China, Beijing 100048, China
*
Author to whom correspondence should be addressed.
Remote Sens. 2025, 17(5), 773; https://doi.org/10.3390/rs17050773
Submission received: 2 January 2025 / Revised: 15 February 2025 / Accepted: 21 February 2025 / Published: 23 February 2025

Abstract

:
Geometric calibration, as a crucial method for ensuring the precision of spaceborne single-photon laser point cloud data, has garnered significant attention. Nonetheless, prevailing geometric calibration methods are generally limited by inadequate precision or are unable to accommodate spaceborne lasers equipped with multiple payloads on a single platform. To overcome these limitations, a novel geometric calibration method for spaceborne single-photon lasers that integrates laser detectors with corner cube retroreflectors (CCRs) is introduced in this study. The core concept of this method involves the use of triggered detectors to identify the laser footprint centerline (LFC). The geometric relationships between the triggered CCRs and the LFC are subsequently analyzed, and CCR data are incorporated to determine the coordinates of the nearest laser footprint centroids. These laser footprint centroids are then utilized as ground control points to perform the geometric calibration of the spaceborne single-photon laser. Finally, ATLAS observational data are used to simulate the geometric calibration process with detectors and CCRs, followed by conducting geometric calibration experiments with the gt2l and gt2r beams. The results demonstrate that the accuracy of the calibrated laser pointing angle is approximately 1 arcsec, and the ranging precision is better than 2.1 cm, which verifies the superiority and reliability of the proposed method. Furthermore, deployment strategies for detectors and CCRs are explored to provide feasible implementation plans for practical calibration. Notably, as this method only requires the positioning of laser footprint centroids using ground equipment for calibration, it provides exceptional calibration accuracy and is applicable to single-photon lasers across various satellite platforms.

1. Introduction

Over the past two decades, rapid advancements in laser technology have transformed spaceborne Earth observation lasers from full-waveform systems, exemplified by the Geoscience Laser Altimeter System (GLAS) [1], to the current generation of single-photon lasers spearheaded by the Advanced Topographic Laser Altimeter System (ATLAS) [2,3]. Leveraging its high-repetition-rate capabilities [4], ATLAS has amassed an extensive global repository of photon point clouds, achieving remarkable progress in areas such as terrestrial carbon sink estimation [5,6], polar ice sheet measurement [7,8], inland lake water level inversion [9,10], and shallow marine topographic mapping [11,12]. These applications are fundamentally underpinned by the precision of spaceborne single-photon laser point cloud data, making the geometric calibration of spaceborne single-photon lasers a critical endeavor to ensure sufficient accuracy [13]. Furthermore, inspired by the success of ATLAS, China and other nations are incorporating single-photon lasers into their forthcoming multi-payload satellite platforms. Consequently, the development of a universal geometric calibration methodology for spaceborne single-photon lasers has emerged as a pivotal area of research.
Geometric calibration methods for spaceborne Earth observation lasers are broadly categorized into three primary types. The first category comprises the traditional detector-based calibration method, which achieves geometric calibration by deploying laser detectors within ground calibration fields to capture the footprints of spaceborne lasers [14,15,16,17,18,19]. This method depends on the detection of single-laser footprint data by detectors, from which the footprint centroids are extracted and used as ground control points to facilitate laser geometric calibration. This method is primarily suited for full-waveform lasers with low repetition frequencies and widely spaced laser footprints. However, due to the high repetition rates characteristic of spaceborne single-photon lasers, ground detectors are subjected to strip-patterned triggering (detectors along the track are triggered consecutively, forming a strip pattern). As a result, it becomes impossible to identify individual laser footprints and accurately determine their centroids. Consequently, the traditional detector-based calibration method is challenging to apply to the geometric calibration of spaceborne single-photon lasers.
The second category encompasses geometric calibration methods based on terrain matching. These techniques primarily leverage digital terrain data to compute elevation or range residuals between laser point clouds and terrain datasets, thereby enabling geometric calibration. This approach was first introduced by Tang et al. in 2019 [20], who calibrated the ZiYuan3-02 (ZY3-02) satellite laser by calculating elevation residuals between laser data and terrain data under varying pointing angle conditions. Nan et al. subsequently developed a rapid pointing angle calibration method for spaceborne single-photon lasers via localized LiDAR data [21]. By establishing a calibration error analysis model and utilizing ATLAS simulation data, they successfully performed calibration. Zhao et al. utilized continuous spaceborne single-photon laser ranging values to derive surface contours, which were then matched with actual terrain contours to estimate biases in the ATLAS laser system [22]. Schenk et al. adjusted the ATLAS signal photon point clouds by minimizing the sum of squared elevation residuals between the photons and the fitting plane of a digital elevation model (DEM) to determine the optimal photon positions [23], a technique also applicable to calibration. Compared with traditional detector-based methods, although terrain matching approaches are not hindered by the high repetition rates of single-photon lasers, they are highly dependent on accurate digital terrain data and generally provide low calibration precision [24,25].
The third category comprises calibration methods that are based on satellite attitude maneuvers. This method requires the spaceborne laser to perform conical motions by periodically adjusting the satellite’s roll and pitch angles over the open ocean. Geometric calibration is then achieved by applying range residual minimization to the periodic ranging data [26,27,28,29]. To meet the ATLAS plane accuracy requirement of 6.5 m, attitude maneuver calibrations were conducted twice weekly for extended periods and twice daily for short durations [13,30]. The satellite attitude maneuver calibration method is not limited by laser type or digital terrain data, but it requires high flexibility for the satellite platform and precise attitude measurements. This makes it challenging to apply to large satellites with poor attitude stability or those with multiple payloads, limiting its applicability. For example, applying such methods to the single-photon laser satellites planned by China, which are mounted with optical cameras, could introduce uncertainty errors into optical systems. Nevertheless, the high-precision calibration of spaceborne single-photon lasers can be achieved using appropriate ground-based equipment, particularly by combining active detectors and passive corner cube retroreflectors (CCRs) to determine laser footprint centroids and perform geometric calibration. However, current methods have not explored integrating both active and passive detectors for calibration.
Therefore, this study presents a geometric calibration method for spaceborne single-photon lasers that integrates laser detectors and corner cube retroreflectors, abbreviated as the CMDC (calibration method integrating detectors and CCRs). This method overcomes the limitation of being unable to determine the centroid of a single-photon laser footprint using only detectors by integrating the CCR, thus enabling geometric calibration for spaceborne single-photon lasers. The CMDC method deploys a dense array of laser detectors and a sparse arrangement of CCRs in the calibration field. Detectors capture laser footprint data to calculate the laser footprint centerline (LFC), defined as the fitting line of the centroid along the track direction. Emission pulses are identified by matching triggered CCRs with the CCR echo photon point clouds. The centroids are then determined by correlating triggered CCRs with the LFC. Finally, precise centroids, along with laser emission pulses, are used to achieve the high-precision geometric calibration of the spaceborne single-photon laser. This method will significantly enhance the positioning accuracy of spaceborne single-photon lasers. It not only provides high-precision photon point clouds for environmental monitoring applications such as forest surveys and water-level measurements but also optimizes the design of subsequent single-photon laser satellite systems.

2. Materials and Methods

2.1. Study Area and Experimental Data

2.1.1. Study Area

The proposed method requires deploying detectors and CCRs on the surface, and on the basis of prior experience in China with spaceborne laser geometric calibration experiments, the Sonid Right Banner in Inner Mongolia was selected as the study area. This region serves as the calibration site for the GaoFen7-01 (GF7-01) [17] and ZY3-02 [18] satellite lasers and accommodates the calibration of the forthcoming GF7-02 satellite laser. The Sonid Right Banner is characterized by a dry, low-precipitation climate, with a flat and exposed sandy terrain devoid of significant tall vegetation. Additionally, the region boasts relatively convenient transportation infrastructure, making it well suited for the ground deployment of detectors and CCRs. The specific experimental location is the blue semitransparent rectangular area illustrated in Figure 1a, which extends approximately 25 km in length from northeast to southwest and is approximately 1.5 km in width. This area is situated northwest of the Sonid Right Banner city, approximately 90 km from its center.

2.1.2. Experimental Data

  • ATLAS Single-Photon Laser Data
Within the study area outlined in Figure 1a, all ATLAS laser data from October 2018 to October 2024 were retrieved, spanning a total of 37 tracks that passed through the study area. To align the ATLAS experimental data with the digital surface model (DSM) observation time in the study region, ATLAS laser data from the 118th track, dated 3 April 2020, were selected for the experiment. The data file name is ATL**_20200403061741_01180702_005_01 (** represents a number from 01 and 23), and the data distribution is shown in Figure 1a. To achieve global 2 km forest height measurements over a 2-year period, the ATLAS laser was continuously swung at mid- and low latitudes [13]. Since the swing angle of the satellite and the fixed installation relationship between the ATLAS laser and the satellite platform have not been publicly disclosed, beams in the nadir direction, namely gt2l and gt2r, were selected as the experimental targets to minimize the impact of uncertainties.
Notably, ATLAS observational data are not used directly for calibration. Instead, calibration data simulated from the ATL02 and ATL03 products, which model the satellite laser passing over the ground detectors and CCRs, are applied. The experiments in this study are based on simulated data, with the simulated calibration data shown in Section 3.1. The ATL02 and ATL03 products used in this study are detailed in Table A1 of Appendix A.
2.
High-Precision DSM
A high-precision DSM is a key data source for simulating spaceborne single-photon laser calibration data. As early as July 2020, we used the Topcon Sirius PRO drone surveying system to perform aerial measurements in the experimental area, obtaining high-precision DSM data. A total of 35 drone ground base stations were set up around the experimental area to ensure the accuracy of the drone survey. After completing the aerial survey, we used PhotoScan professional edition (version 1.4) software [31] to postprocess the images captured by the drone and generate a high-precision DSM within the experimental area at a scale of 1:500, as shown in Figure 1b. The DSM data were in the World Geodetic System, with a resolution of 0.2 m, positioning accuracy better than 0.25 m, and elevation accuracy better than 5 cm. The DSM is primarily used in this study to simulate spaceborne single-photon laser calibration data.

2.2. Methodology

Laser detectors are capable of actively capturing laser footprints but cannot identify individual footprints or determine their centroids. Recent research has demonstrated that CCRs can effectively mark the point clouds of spaceborne single-photon laser echo photons, establishing a one-to-one correspondence between the echo photon point clouds and the laser footprints [32,33]. Consequently, the integration of detectors and CCRs enables the precise determination of the centroid of spaceborne single-photon laser footprints. This concept has inspired the development of a novel geometric calibration method for spaceborne single-photon lasers, which involves three primary steps. First, an LFC model based on the detector is constructed. Second, CCRs are integrated with the LFC to create a high-precision centroid positioning model, allowing for an accurate determination of the laser footprint centroids for spaceborne single-photon lasers. Finally, a geometric calibration model for spaceborne single-photon lasers is developed, using the precise centroid of the laser footprint as the ground control point to calibrate the laser pointing and ranging errors. The technical workflow of the proposed method is illustrated in Figure 2.

2.2.1. Construction of an LFC Model Based on Detectors

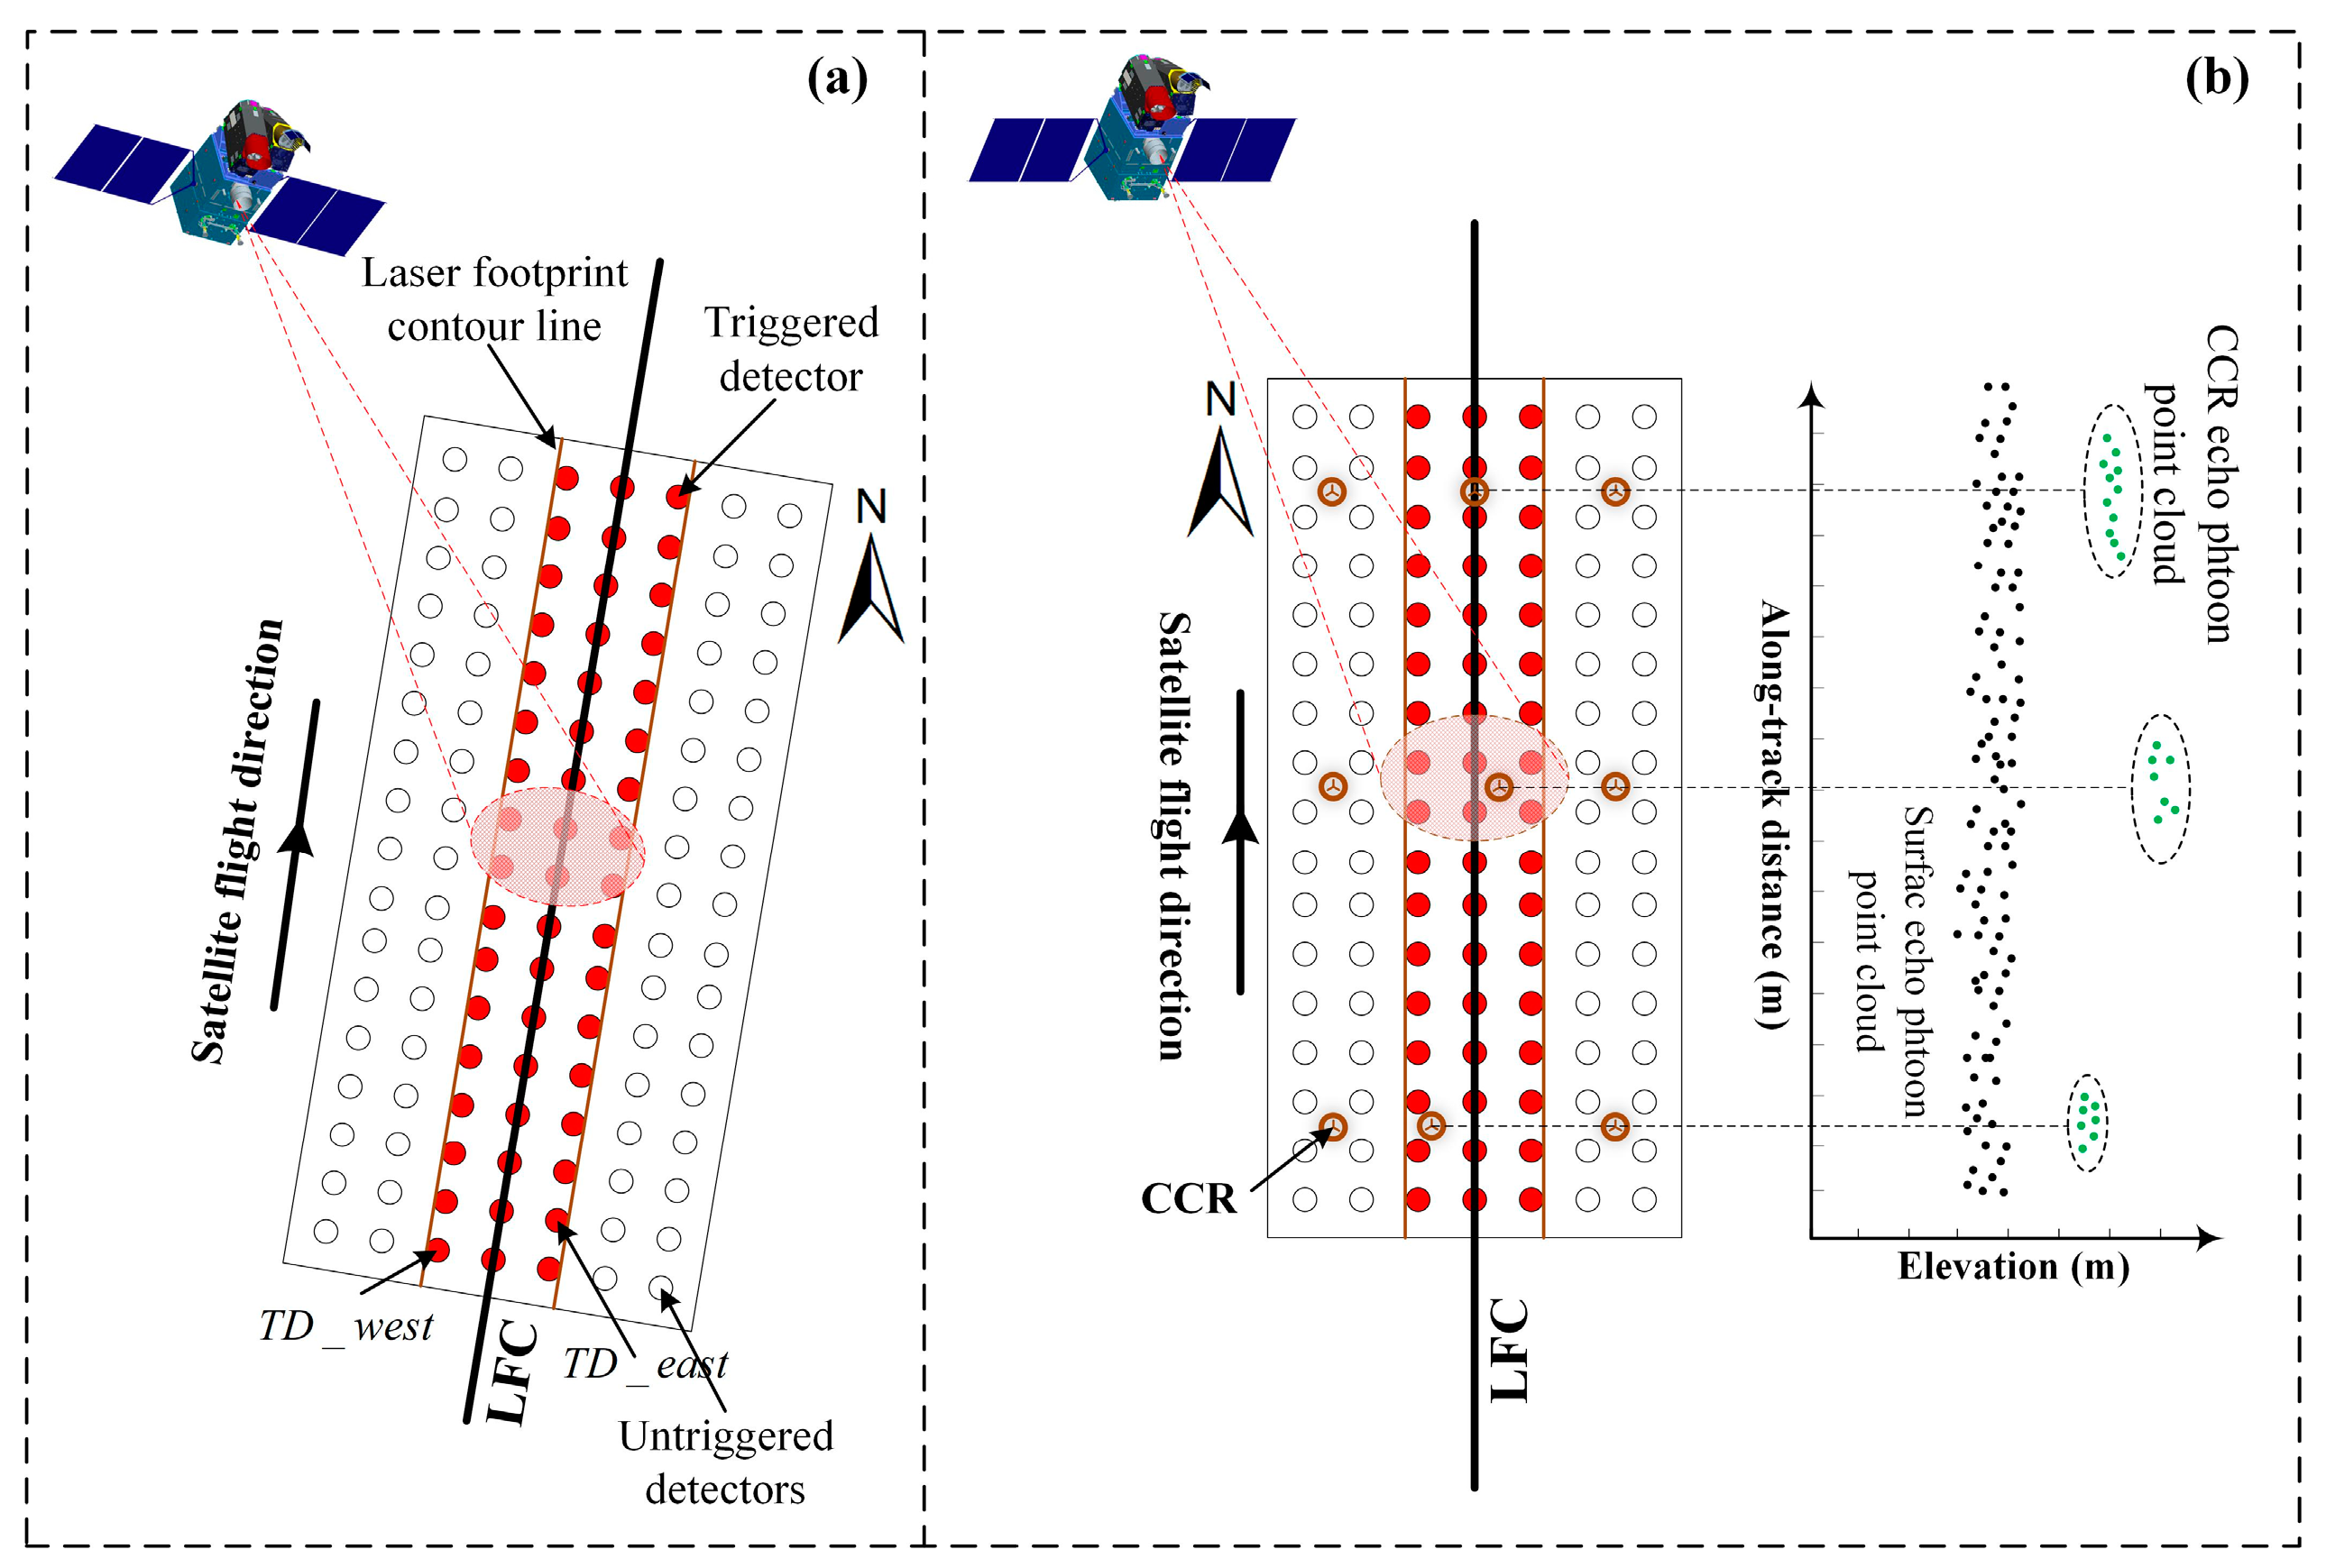
Spaceborne single-photon lasers operate at a high repetition rate. In the case of ATLAS, its laser footprints in the track direction overlap by up to 96%, with the same ground object illuminated multiple times in consecutive footprints. As the spaceborne single-photon laser traverses the ground detector array within the calibration field, the detectors are triggered in a strip-like pattern along the track, as illustrated in Figure 3a. Assuming that the laser footprint is approximately circular and that variations within the calibration area are negligible, the triggered detectors form an approximately rectangular array. The edges of this array correspond to the contour lines of the laser footprint along the track. Owing to the symmetrical energy distribution within the laser footprint, the LFC is defined as the midline connecting the two contour lines.
The three-dimensional coordinates of all triggered detectors are obtained after the spaceborne laser passes over the detector array. The detectors triggered on the eastern and western sides along the track are then extracted to form sets of triggered detectors on both sides, as shown in Formula (1).
{ T D _ e a s t = { ( x 1 , y 1 ) , ( x 2 , y 2 ) , , ( x n , y n ) } T D _ w e s t = { ( x 1 , y 1 ) , ( x 2 , y 2 ) , , ( x m , y m ) }
where T D _ e a s t and T D _ w e s t denote the sets of detectors triggered on the eastern and western sides along the track, respectively; n and m represent the number of detectors triggered on the eastern and western sides, respectively; and ( x n , y n ) and ( x m , y m ) correspond to the ground coordinates of the detectors on each side.
Owing to atmospheric interference and detector consistency issues, the actual triggering of detectors on the eastern and western sides is not perfectly aligned, preventing the direct formation of laser footprint contour lines. Therefore, in this study, a total least squares method [34,35] is applied to fit the detectors triggered on both sides, as described in Formula (2), to approximate the laser footprint contour lines.
y e = a e x + b e ;   y w = a w x + b w
where a e and b e are the parameters of the eastern laser footprint contour equation and a w and b w are the parameters of the western laser footprint contour equation.
On the basis of the equation of the spaceborne laser footprint contour line in Formula (2), the equation of the LFC in Figure 3 is directly derived, as shown in Formula (3).
y = a e + a w 2 x + b e + b w 2

2.2.2. Development of an Accurate Laser Footprint Centroid Positioning Model Using CCRs and Detectors

After the CCRs are deployed within the detector array in the calibration field, both the detectors and CCRs are triggered simultaneously when the spaceborne laser passes over the array. The detectors indicate whether they have been triggered by the received laser signal, whereas the CCRs mark the single-photon laser echo photon cloud, forming a distinct CCR photon cloud, as shown in Figure 3b. The precise positioning of the laser footprint centroid via the combined data from the detectors and CCRs involves the following two main steps:
  • Identification of Triggered CCRs and Matching of CCR Photon Clouds
Since a CCR is a passive instrument and cannot directly indicate whether it has been triggered, the CCRs within the triggered detector array strip are considered triggered CCRs. After the spaceborne laser passes over the detector array, the echo photon cloud data are collected. The CCR and surface echo photon clouds are then identified separately, and the height of the CCR photon cloud is calculated on the basis of these data. Finally, by comparing the CCR photon cloud height with the actual height of the triggered CCR, a one-to-one correspondence between the triggered CCR and the CCR photon cloud is established. The matched CCR photon cloud is then used to determine the laser emission pulse for precisely positioning the centroid of the laser footprint. This laser pulse is used to interpolate satellite attitude and orbital data and to calculate atmospheric and tidal error corrections. Given the along-track symmetry of the CCR echo photon cloud, the laser pulse corresponding to the middle photon in the CCR echo photon point cloud is selected as the emission pulse for the precisely positioned laser footprint centroid.
2.
Precise Positioning of Laser Footprint Centroids Based on the LFC Azimuth
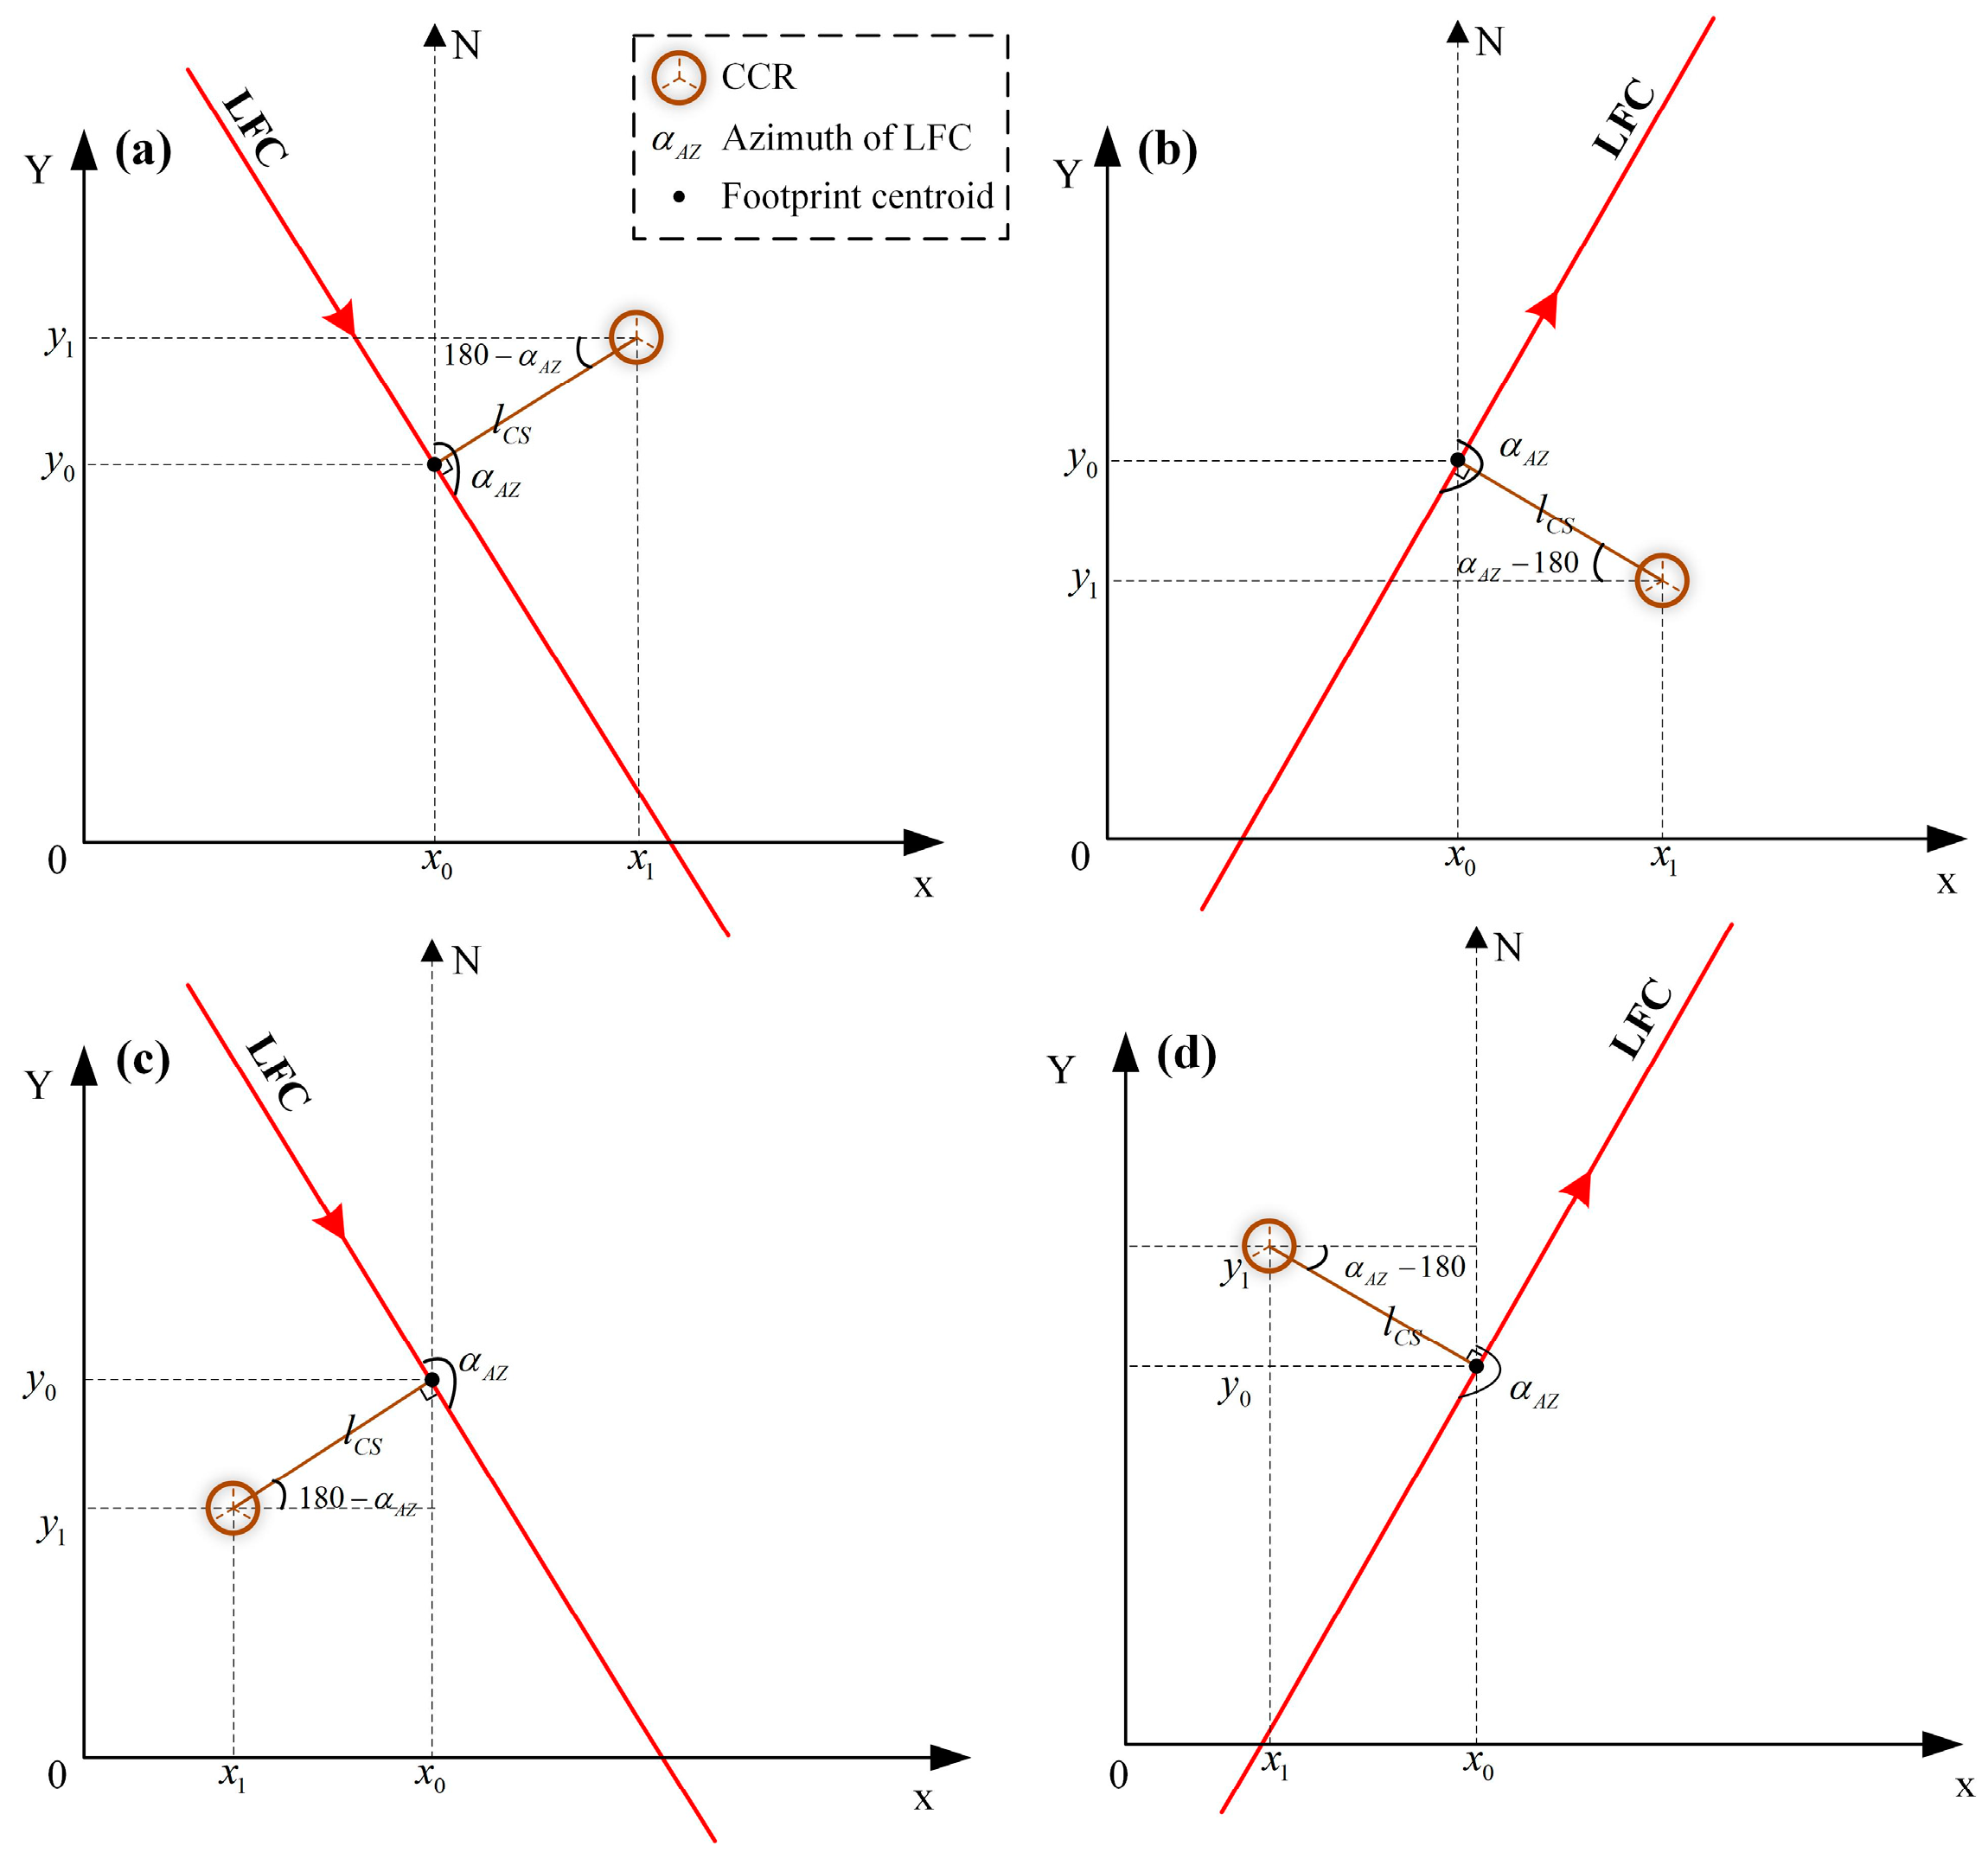
The geometric relationship between the LFC and the CCR is categorized into three types as follows: (1) the CCR is located directly on the LFC, (2) the CCR is situated east of the LFC, and (3) the CCR is positioned west of the LFC. The first scenario is relatively rare; in this case, the CCR coordinates are assigned as the coordinates of the nearest laser footprint centroid. In the latter two scenarios, the azimuth ( α A Z ) of the LFC is used as the ground truth to achieve the precise positioning of the laser footprint centroid. Spaceborne lasers perform both ascending and descending track observations, resulting in two possible ranges for the azimuth of the LFC, which are 0–180° and 180–360°. Under these circumstances, when the CCR is not aligned with the LFC, their geometric relationship is further subdivided into four distinct cases, as illustrated in Figure 4.
For the four cases depicted in Figure 4, the coordinates of the CCR and the azimuth of the LFC, as determined by the laser detector, are utilized within a trigonometric model to derive the centroid coordinates of the laser footprint. The corresponding formulas are as follows:
(a)
CCR located east of the LFC with azimuth α A Z between 0° and 180°:
{ x 0 = x 1 l C S cos ( 180 α A Z ) = x 1 + l C S cos α A Z y 0 = y 1 l C S sin ( 180 α A Z ) = y 1 l C S sin α A Z
(b)
CCR located east of the LFC with azimuth α A Z between 180° and 360°:
{ x 0 = x 1 l C S cos ( α A Z 180 ) = x 1 + l C S cos α A Z y 0 = y 1 + l C S sin ( α A Z 180 ) = y 1 l C S sin α A Z
(c)
CCR located west of the LFC with azimuth α A Z between 0° and 180°:
{ x 0 = x 1 + l C S cos ( 180 α A Z ) = x 1 l C S cos α A Z y 0 = y 1 + l C S sin ( 180 α A Z ) = y 1 + l C S sin α A Z
(d)
CCR located west of the LFC with azimuth α A Z between 180° and 360°:
{ x 0 = x 1 + l C S cos ( α A Z 180 ) = x 1 l C S cos α A Z y 0 = y 1 l C S sin ( α A Z 180 ) = y 1 + l C S sin α A Z
where ( x 0 , y 0 ) represents the coordinates of the laser footprint centroid; ( x 1 , y 1 ) denotes the coordinates of the CCR; α A Z is the azimuth of the LFC, which is calculated via the azimuth calculation model and Formula (3); and l C S is the distance from the CCR to the centroid of the laser footprint.
The results obtained from Formulas (4) and (5) are entirely consistent, as are those from Formulas (6) and (7). Consequently, the proposed method for calculating the laser footprint centroid only needs to include the geometric relationship between the CCR and the LFC. Specifically, it is sufficient to determine whether the CCR is located east or west of the LFC, thereby supporting the calculation of the coordinates of the nearest laser footprint centroid relative to the CCR. The simplified formulas are as follows:
  • CCR located east of the LFC:
{ x 0 = x 1 + l C S cos α A Z y 0 = y 1 l C S sin α A Z
  • CCR located west of the LFC:
{ x 0 = x 1 l C S cos α A Z y 0 = y 1 + l C S sin α A Z
  • CCR located on the LFC:
{ x 0 = x 1 y 0 = y 1
The geometric relationship between the CCR and the LFC is determined on the basis of the LFC and the CCR coordinates, as defined in Section 2.2.1. The CCR coordinates are typically measured directly via real-time kinematics. Importantly, in Formulas (8) and (9), the distance l C S from the CCR to the centroid of the laser footprint is initially unknown. However, since the laser footprint centroid in this study is the centroid one closest to the CCR and the spacing between spaceborne single-photon laser footprint centroids is minimal (for example, ALTAS has a spacing of only 0.7 m), l C S is approximated as the perpendicular distance from the CCR to the LFC. According to the CCR coordinates and the LFC equation, the distance l C S from the CCR to the centroid of the laser footprint is derived as follows:
l C S = ( a e + a w ) x 1 2 y 1 + b e + b w 4 + ( a e + a w ) 2

2.2.3. Establishment of a Geometric Calibration Model for a Spaceborne Single-Photon Laser

According to the principles of geometric altimetry for spaceborne single-photon lasers and satellite photogrammetry, a geometric positioning model for spaceborne single-photon lasers was developed using laser range measurements, satellite attitude data, orbital data and corrections for atmospheric and tidal errors, as presented in Formula (12).
[ x P y P z P ] I T R F = [ x B y B z B ] I T R F + R I C R F I T R F R S B F I C R F ( [ Δ x Δ y Δ z ] + ( ρ + ρ a t m + Δ ρ ) [ cos α cos β cos γ ] ) [ 0 0 Δ t i d e ]
where [ x P y P z P ] I T R F T represents the photon coordinates; [ x B y B z B ] I T R F T represents the satellite centroid coordinates; R I C R F I T R F represents the transition matrix from the International Celestial Reference Frame (ICRF) to the International Terrestrial Reference Frame (ITRF); R S B F I C R F represents the rotation matrix from the satellite body fixed frame (SBF) to the ICRF; [ Δ x Δ y Δ z ] T represents the offset of the laser relative to the satellite centroid—since the offset of the ATLAS laser relative to the satellite body is unknown, it is set to zero in this study; ρ represents the photon ranging value; ρ a t m is the atmospheric error correction value; Δ ρ denotes the ranging error value; α , β and γ are the angles between the laser beam axis and the X, Y, and Z axes of the SBF [20], respectively; and Δ t i d e is the tidal error correction value.
Spaceborne single-photon lasers are similar to full-waveform lasers, and their calibration parameters are the laser pointing angle and ranging error. By converting their three-dimensional pointing angles ( α , β , γ ) into two-dimensional pointing angles ( ϕ , φ ) [20], the geometric calibration condition equation for spaceborne single-photon lasers was established, as shown in Formula (13).
[ F X F Y F Z ] [ x B x P y B y P z B y P ] I T R F + R I C R F I T R F R S B F I C R F [ [ Δ x Δ y Δ z ] + ( ρ + ρ a t m + Δ ρ ) [ cos φ cos ϕ cos φ sin ϕ sin φ ] ] [ 0 0 Δ t i d e ]
where ϕ represents the angle between the projection of the laser beam onto the XOY plane and the X-axis within the SBF and φ denotes the angle between the laser beam and its projection onto the XOY plane within the SBF.
Obviously, Equation (12) is nonlinear. By expanding it via the Taylor series approach and retaining only the linear (first-order) terms while neglecting the higher-order nonlinear terms, a geometric calibration error equation for spaceborne single-photon lasers was formulated, as illustrated in Formula (14).
{ d F X = F X ϕ d ϕ + F X φ d φ + F X ρ d ρ F X 0 d F Y = F Y ϕ d ϕ + F Y β d φ + F Y ρ d ρ F Y 0 d F Z = F Z ϕ d ϕ + F Z φ d φ + F Z ρ d ρ F Z 0
where F X 0 , F Y 0 , and F Z 0 are the initial values calculated by substituting the initial parameters of the laser pointing angles and ranging errors into Formula (13). For ease of computation, Formula (14) is rewritten in matrix form as follows:
V = A X L
where V = [ d F X d F Y d F Z ] T ; X = [ d ϕ d φ d ρ ] T ; A = [ F X ϕ F X φ F X ρ F Y ϕ F Y β F Y ρ F Z ϕ F Z φ F Z ρ ] ; and L = [ F X 0 F Y 0 F Z 0 ] T .
Subsequently, according to the least squares principle [18,36] and the V T P V = min criterion, Formula (15) is used to derive the geometric calibration normal equation for spaceborne single-photon lasers, as shown in Formula (16).
( A T P A ) X = A T P L
The flight time of spaceborne single-photon lasers across the same calibration field is exceedingly short, and their observational data are considered to have equal precision. Consequently, in Formula (16), the observation weight matrix is the identity matrix. On the basis of this assumption, the solution to Formula (16) is derived as Formula (17).
X = ( A T A ) 1 A T L
In summary, the calibration of laser pointing angles and ranging errors is effectively accomplished by utilizing precisely positioned laser footprint centroids as ground control points and incorporating satellite attitude and orbital data into the geometric calibration model for spaceborne single-photon lasers.

3. Results

3.1. Simulation of Calibration Data for Spaceborne Single-Photon Lasers

  • Simulation of Laser Pointing Angles and Footprint Centroids
Initially, single-photon point clouds from ATL03 for beams gt2l and gt2r within the study area were acquired. For each laser footprint, the three-dimensional coordinates and ranging values of all the signal photons were averaged to estimate the coordinates and ranging values of the centroids of the laser footprint. Using the estimated coordinates of the laser footprint centroids from beams gt2l and gt2r over flat terrain as ground control points, the geometric calibration model for spaceborne single-photon lasers was applied to calculate the laser pointing angles and ranging errors for beams gt2l and gt2r, treating these as the true values. The results are presented in Table 1.
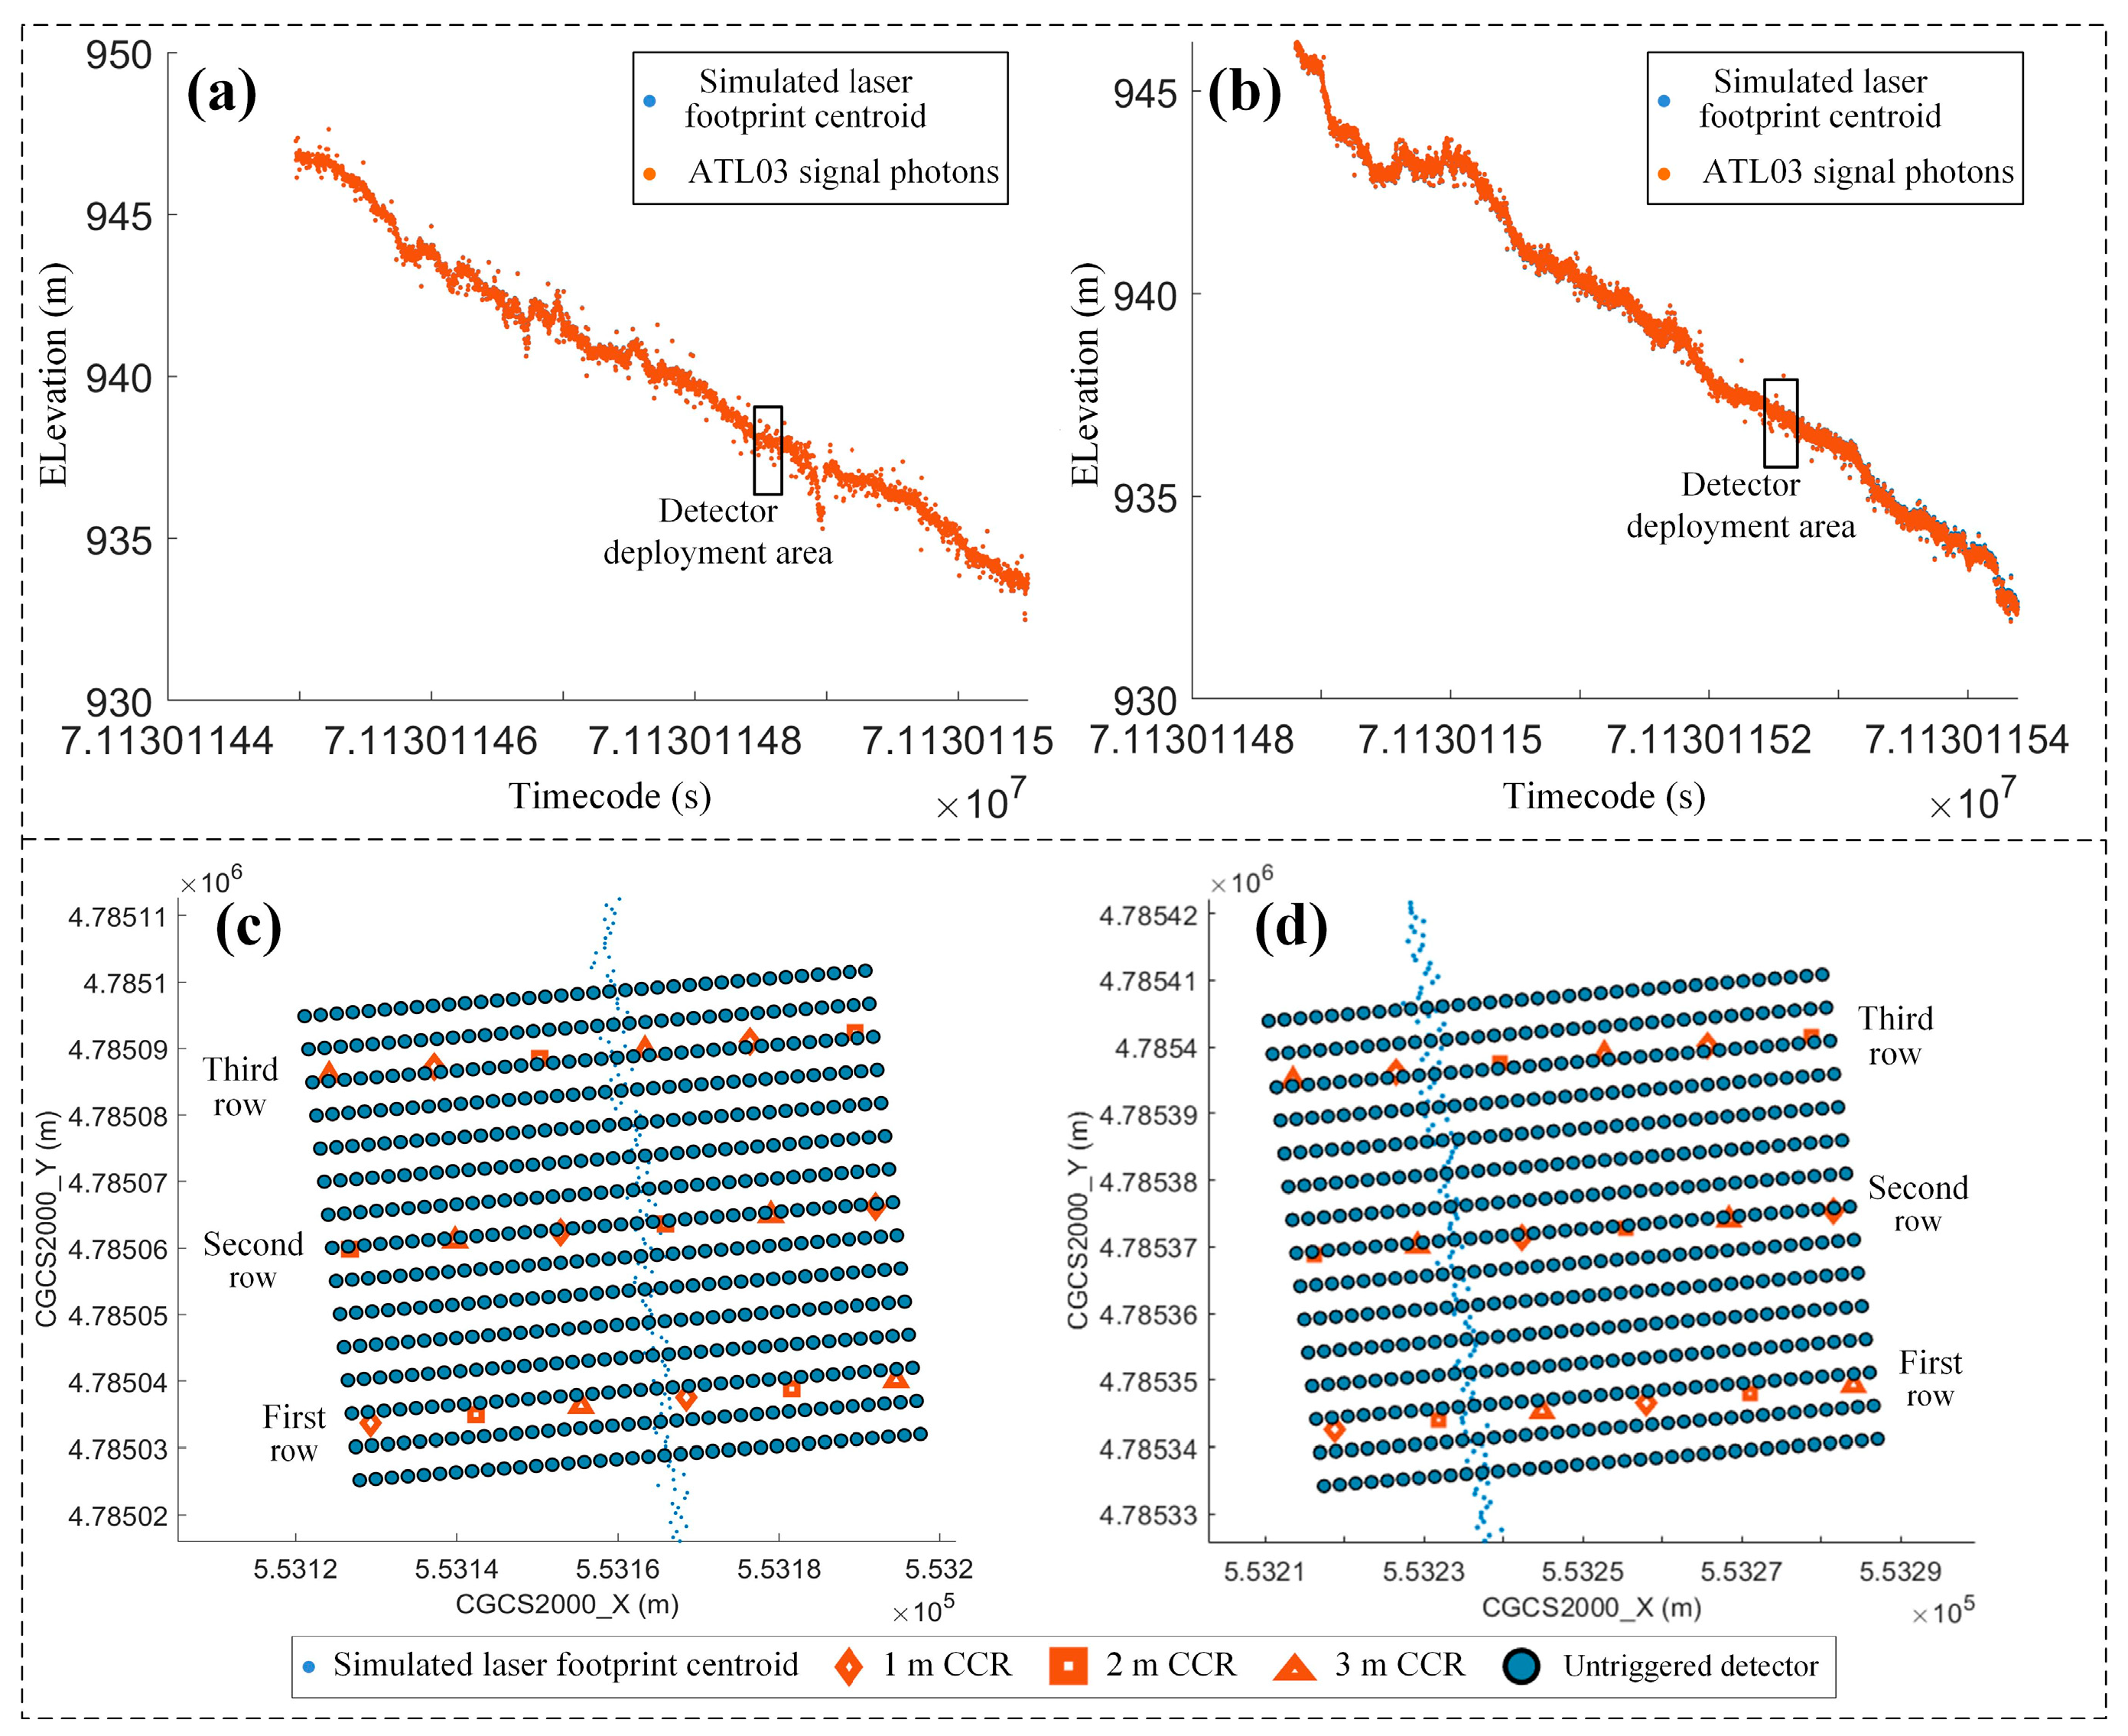
Subsequently, according to the satellite attitude, orbital data and the estimated ranging values of the laser footprint centroids, the pointing angles, and ranging errors for gt2l and gt2r, as detailed in Table 1, were input into the geometric positioning model for spaceborne single-photon lasers to compute the coordinates of the laser footprint centroids for simulation purposes. The results are depicted in Figure 5a,b. These figures illustrate that the simulated laser footprint centroids are encompassed by the ATL03 signal photons, indicating a high degree of consistency. This consistency validates the reliability of the simulated laser footprint centroids.
2.
Simulation of the Detectors and CCRs
In practical calibration operations, the precise positions of laser footprint centroids remain unattainable, and only approximate locations can be forecasted. Consequently, detectors and CCRs are regularly deployed near the predicted laser footprint centroids, with the predicted positions in the across-track direction typically exhibiting an error margin of approximately 30 m [37]. To account for this uncertainty, a random across-track error of 30 m was introduced to the simulated laser footprint centroids in Figure 5a,b. Subsequently, the detector arrays and CCRs were modeled over flat terrain, resulting in the configurations depicted in Figure 5c,d. These deployments are confined within the black rectangular regions illustrated in Figure 5a,b. Specifically, detectors were spaced 5 m along the track and 2 m across the track, whereas CCRs were positioned 26 m along the track and 13 m across the track. The CCR details for Figure 5c,d are provided in Table A2 of Appendix A, where the CCR numbers are sequentially incremented from left to right and accumulate by row.
3.
Simulation of Ground-Triggered Detectors
To simulate the actual triggering of ground-based detectors as spaceborne lasers traverse the detector array, a random error of 2.85 m was added to each simulated laser footprint centroid in Figure 5a,b on the basis of the measurement accuracy of existing spaceborne laser auxiliary data. This error encompasses a 1 arcsec satellite attitude jitter error, a 0.4 m laser pointing jitter error, and a 0.05 m orbital error. With the laser centroids after error addition used as reference centers, the triggering scenarios for the detectors and CCRs were subsequently simulated, as illustrated in Figure 6a,b. The results indicate that random jitter errors in the laser footprint centroids lead to inconsistent responses from detectors at the edges of the laser footprints. Specifically, the maximum discrepancy for detectors triggered by beam gt2l was two detector spacings, whereas for beam gt2r, it was one detector spacing.
4.
Simulation of Ground and CCR Echo Photon Clouds
In accordance with the spaceborne single-photon laser echo simulation model and methodology [38,39], the satellite attitude and orbital data, ATLAS basic parameters, simulated laser footprint centroids and range values, along with high-precision DSM data, were employed to simulate echo photon point clouds for the ground and CCRs within the study area on the basis of beams gt2l and gt2r. The results are shown in Figure 6c,d. In these figures, the rectangular regions represent the deployment areas of the detectors and CCRs, whereas the sporadic photons below illustrate the simulated CCR echo photon point clouds.

3.2. Precise Positioning of Laser Footprint Centroids Through the Integration of Detectors and CCRs

1.
Extraction of the LFC Based on the Detectors
First, the detectors triggered by the gt2l and gt2r beams, along with the internal CCRs within the detector arrays shown in Figure 6a,b, were extracted as illustrated in Figure 7. The sets of detectors on the eastern and western sides of the laser footprints were constructed using the coordinates of the first and last detectors in each row of the triggered detector arrays. Following the methodology outlined in Section 2.2.1, the laser footprint contour lines for beams gt2l and gt2r were subsequently fitted, resulting in the black solid lines in Figure 7. Finally, the LFC for beams gt2l and gt2r was computed by utilizing the fitted contour lines and applying Formula (3), depicted as the red solid lines in Figure 7. The results in Figure 7 demonstrate that the fitted laser footprint contour lines closely align with the edges of the triggered detector arrays and that the LFC is accurately positioned at the midpoints of the laser footprint centroids. This confirms the efficacy of the proposed method in effectively extracting the LFC.
The fitted laser footprint contour lines and the equations of the LFC for beams gt2l and gt2r are shown in Formulas (18) and (19).
{ y = 7.77811 x + 9087549.25 ; t h e   w e s t e r n   f o o t p r i n t   c o n t o u r   l i n e   o f   g t 2 l y = 9.36298 x + 9964404.91 ; t h e   e a s t e r n   f o o t p r i n t   c o n t o u r   l i n e   o f   g t 2 l y = 8.57054 x + 9525977.08 ; t h e   L F C   o f   g t 2 l
{ y = 9.55204 x + 10069798.98 ; t h e   w e s t e r n   f o o t p r i n t   c o n t o u r   l i n e   o f   g t 2 r y = 10.4152 x + 10547476.97 ; t h e   e a s t e r n   f o o t p r i n t   c o n t o u r   l i n e   o f   g t 2 r y = 9.98360 x + 10308637.98 ; t h e   L F C   o f   g t 2 r
2.
Precise Positioning of Laser Footprint Centroids Integrated with CCRs
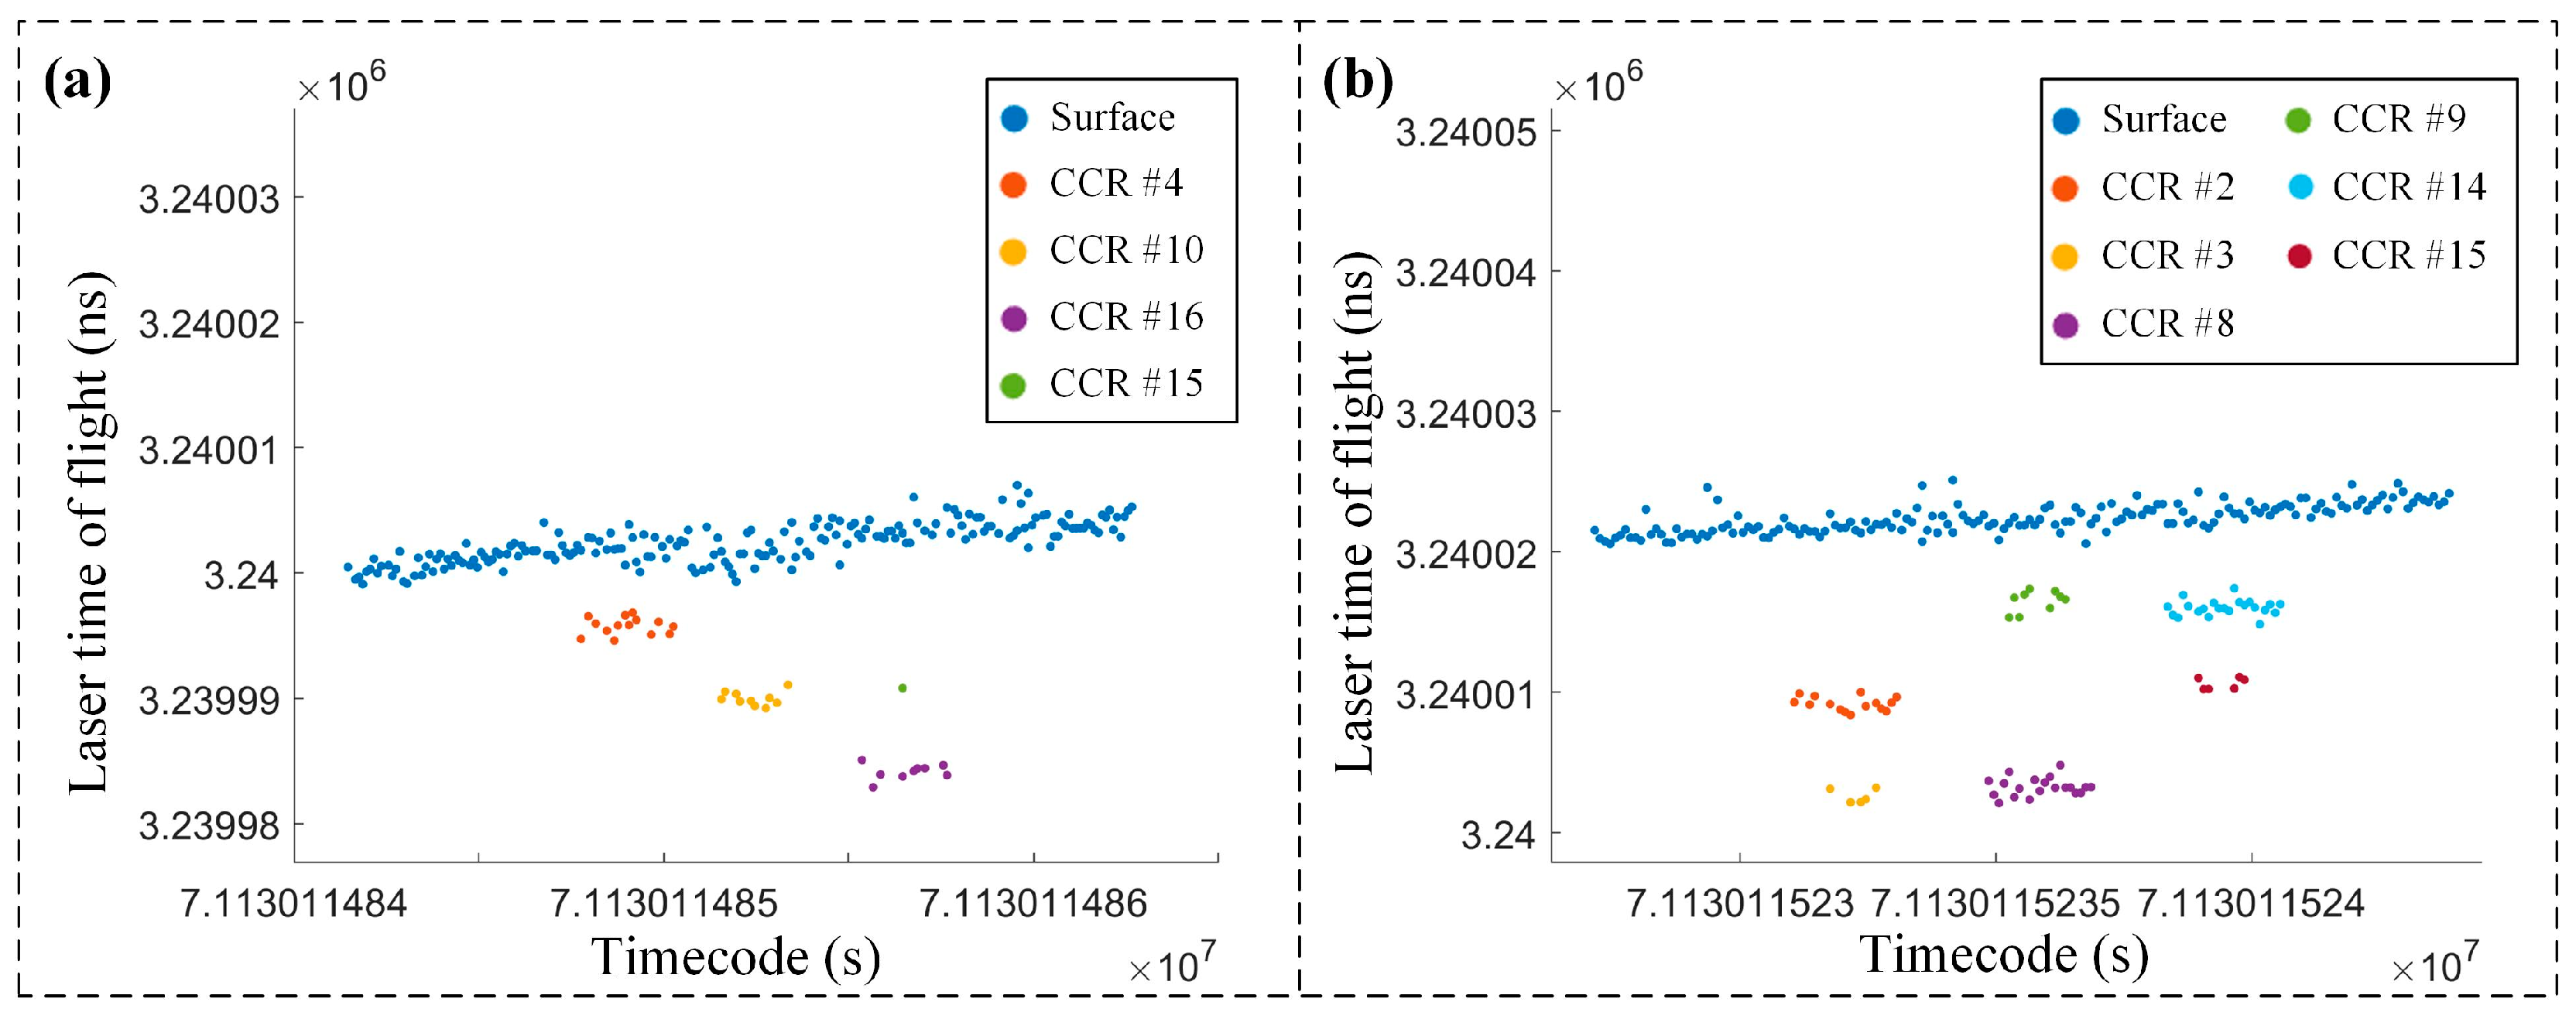
Triggered detectors not only facilitate the determination of the LFC but also enable the identification of triggered CCRs, as illustrated in Figure 7. First, based on the basis of the CCR echo photon point clouds and ground echo photon point clouds presented in Figure 6c,d, the heights of the CCR echo photon point clouds were calculated. A one-to-one correspondence between these CCR echo photon point clouds and the triggered CCRs was established by matching their calculated heights with the actual heights of the CCRs, as shown in Figure 8. Figure 8 provides an enlarged view of the photon point clouds within the black rectangular regions in Figure 6c,d.
The distance from each CCR to the LFC was subsequently computed via the coordinates of the CCRs and the equations of the LFC. Finally, according to Formulas (8)–(10), the centroid coordinates of the laser footprint nearest the triggered CCRs were calculated by using the LFC azimuth, the CCR coordinates, and the geometric relationship between the CCRs and the LFC. The results are presented in Table 2. Notably, CCR #15 for beam gt2l returned only one photon, which may indicate an error; hence, this CCR was disregarded from subsequent analyses.
In Table 2, the timecode represents the emission pulse time of the central photon in the CCR echo photon point cloud, corresponding to the emission pulse time of the nearest laser footprint. The coordinates of the laser footprint centroids in Table 2 alongside the CCR distribution in Figure 7 reveal consistency in the centroids determined by the CCRs within the same row, such as CCRs #2 and #3, CCRs #8 and #9, and CCRs #14 and #15 for beam gt2r. Therefore, when the laser footprint centroids calculated with multiple CCRs are the same, the CCR with the highest number of echo photons is selected for calibration. Consequently, for beam gt2r, CCRs #2, #8, and #14 were chosen, and for beam gt2l, CCRs #4, #10, and #16 were selected as ground control points for calibration.

3.3. Geometric Calibration of a Spaceborne Single-Photon Laser

The geometric calibration of spaceborne single-photon lasers relies not only on laser ranging values but also on satellite attitudes, orbital data, timing, atmospheric, and tidal data. However, these data inherently possess random errors during actual observations. To simulate practical conditions, random errors were introduced to the ATL02 auxiliary data for Track 118 on 3 April 2020 via the Monte Carlo method, which is based on the measurement accuracy of the GF7-01 satellite laser auxiliary data. These errors included a 1 arcsec satellite attitude error [40], a 5 cm satellite orbital error [41], a 10 μs laser timing error [2], a 2 mm tidal correction error [42], and a 2 cm atmospheric delay correction error [43]. Within the experimental area, due to varying data frequencies, there were 510 data points for satellite attitude and orbit, along with 5423 laser footprints for each of the beams, gt2l and gt2r. The results with the added errors are shown in Figure 9.
Finally, the precisely positioned laser footprint centroids from Section 3.2 were used as ground control points and added to the geometric calibration model for spaceborne single-photon lasers. The calibration results were computed for beams gt2l and gt2r under seven different error conditions. A total of seven calibration experiments were conducted as follows: (1) no error added; (2) only attitude error added; (3) only orbital error added; (4) only timing error added; (5) only atmospheric error added; (6) only tidal error added; and (7) total error added. For simplicity, these are referred to as “no error”, “attitude error”, “orbital error”, “timing error”, “atmospheric error”, “tidal error”, and “total error”, respectively. After each calibration, the differences between the calibration results and the true parameters were calculated, with the outcomes detailed in Table 3 and Table 4. Since the laser pointing angle γ is derived from the laser angles α and β , this parameter was omitted from the tables.
The results in Table 3 and Table 4 demonstrate that the calibrations of the laser pointing angles for weak beam gt2l and strong beam gt2r achieved similar levels of precision, indicating that the proposed method is less affected by the beam energy intensity. A comparative analysis under various error conditions revealed that satellite attitude errors are the most significant sources of error in the geometric calibration of satellite lasers. Therefore, high-precision attitude data are recommended for calibration purposes. Satellite orbital and atmospheric errors have negligible impacts on the precision of laser pointing angle calibration and predominantly affect the accuracy of laser ranging calibration. Specifically, atmospheric errors influence the correction accuracy of laser ranging values. However, owing to the relatively small magnitude of satellite orbital errors (centimeter-level), their impact on laser plane positioning precision is negligible, although centimeter-level errors significantly affect laser ranging accuracy. Tidal errors, being of minimal magnitude (millimeter level), do not affect either pointing or ranging accuracy. Additionally, even without introducing any errors, there remained an approximately 0.3 arcsec pointing error and a 2 cm ranging error, attributable to random jitter errors in the simulated laser footprint centroids, which introduced minor discrepancies into the calibration results. When utilizing data with all types of introduced errors, the calibration of the ATLAS laser beams achieved a pointing accuracy of approximately −0.95 arcsec and a ranging accuracy of 2.1 cm for beam gt2l and a pointing accuracy of 1.01 arcsec and a ranging accuracy of 1.9 cm for beam gt2r.
In summary, the calibration results based on the simulated data for ATLAS beams gt2l and gt2r robustly validate the effectiveness of the proposed CMCD method. The laser pointing accuracy was approximately 1 arcsec, and the ranging accuracy reached 2.1 cm after calibration. Furthermore, satellite attitude errors emerged as the primary errors in laser calibration, whereas orbital and atmospheric errors were the main contributors to ranging calibration errors.

4. Discussion

4.1. Deployment Scheme for Detectors and CCRs

The key aspect of the proposed method lies in the effective deployment of ground-based detectors and CCRs to ensure the accurate capture of laser footprints. Failure to successfully capture these footprints not only hampers the geometric calibration of spaceborne lasers but also results in a substantial waste of both labor and financial resources. Building upon the proposed method, we introduce a comprehensive discussion of the deployment scheme for detectors and CCRs on the ground, addressing four key factors, namely the deployment range of detector and CCR arrays, CCR placement strategies, detector placement strategies, and integrated deployment strategies for detectors and CCRs.

4.1.1. Deployment Range of Detector and CCR Arrays

The deployment range for detector and CCR arrays is determined on the basis of the ground-based prediction accuracy of spaceborne single-photon laser footprints. The minimum required deployment range for these arrays should correspond to the maximum predicted positioning error of the laser footprints. This prediction error is influenced primarily by the combined uncertainties in satellite orbital prediction, satellite attitude prediction, and laser pointing prediction. On the basis of the orbital and attitude prediction errors of the GF7-01 satellite in China, as well as the laser pointing errors after initial calibration via the terrain matching method, the total prediction error for spaceborne single-photon laser footprints was estimated and is presented in Table 5.
To guarantee full coverage of the laser footprints by the detector and CCR arrays and considering existing experience gained from ground-based calibration experiments for spaceborne lasers, as well as other uncertainties such as temporal and atmospheric factors during footprint prediction, the deployment range of detector and CCR arrays should be set to 1.5 times the “total error” indicated in Table 5. This translates to a minimum deployment range of 280 × 70 m (along-track × across-track).
Unlike traditional spaceborne full-waveform lasers, the high repetition rate characteristic of spaceborne single-photon lasers results in echo photon point clouds that are linearly distributed along the track direction. Provided that the across-track deployment range of detectors is adequate, laser footprints invariably trigger detectors. Typically, the along-track deployment range is associated with the anticipated number of detector rows to be triggered. Assuming that n r detector rows are expected to be triggered along the track, with each row spaced l A l o n g r m apart, the final deployment range for the detector and CCR arrays is n r l A l o n g r m × 70 m (along-track × across-track).

4.1.2. CCR Placement Strategies

Each triggered CCR is utilized to locate a single laser footprint centroid; therefore, ensuring that at least two CCRs are triggered is essential. The deployment scheme is designed based on the successful triggering of three CCRs, necessitating the deployment of three rows of CCRs along the track. The along-track spacing, across-track spacing, and deployment height of CCRs are critical factors that merit detailed discussion.
  • Along-Track Spacing of CCRs
When adjacent rows of along-track CCRs are spaced too close together, the echo photon point clouds from these rows may be influenced by aliasing, making it challenging to distinguish CCR echo photon point clouds with similar heights. To prevent this issue, the along-track spacing of CCRs must exceed the diameter of a single laser footprint. For example, the theoretical diameter of the GF7-01 laser footprint is 17.5 m, whereas the actual ground-measured footprint diameter is approximately 20 m, indicating an amplification of approximately 15% due to atmospheric transmission. However, when designing the along-track spacing of CCRs, it is prudent to account for potentially adverse atmospheric conditions. Consequently, setting the along-track spacing of CCRs to 1.5 times the theoretical diameter of the laser footprint is recommended. Thus, if the theoretical diameter of the laser footprint is d S p o t , the along-track spacing between CCRs should be 1.5 d S p o t .
2.
Across-Track Spacing of CCRs
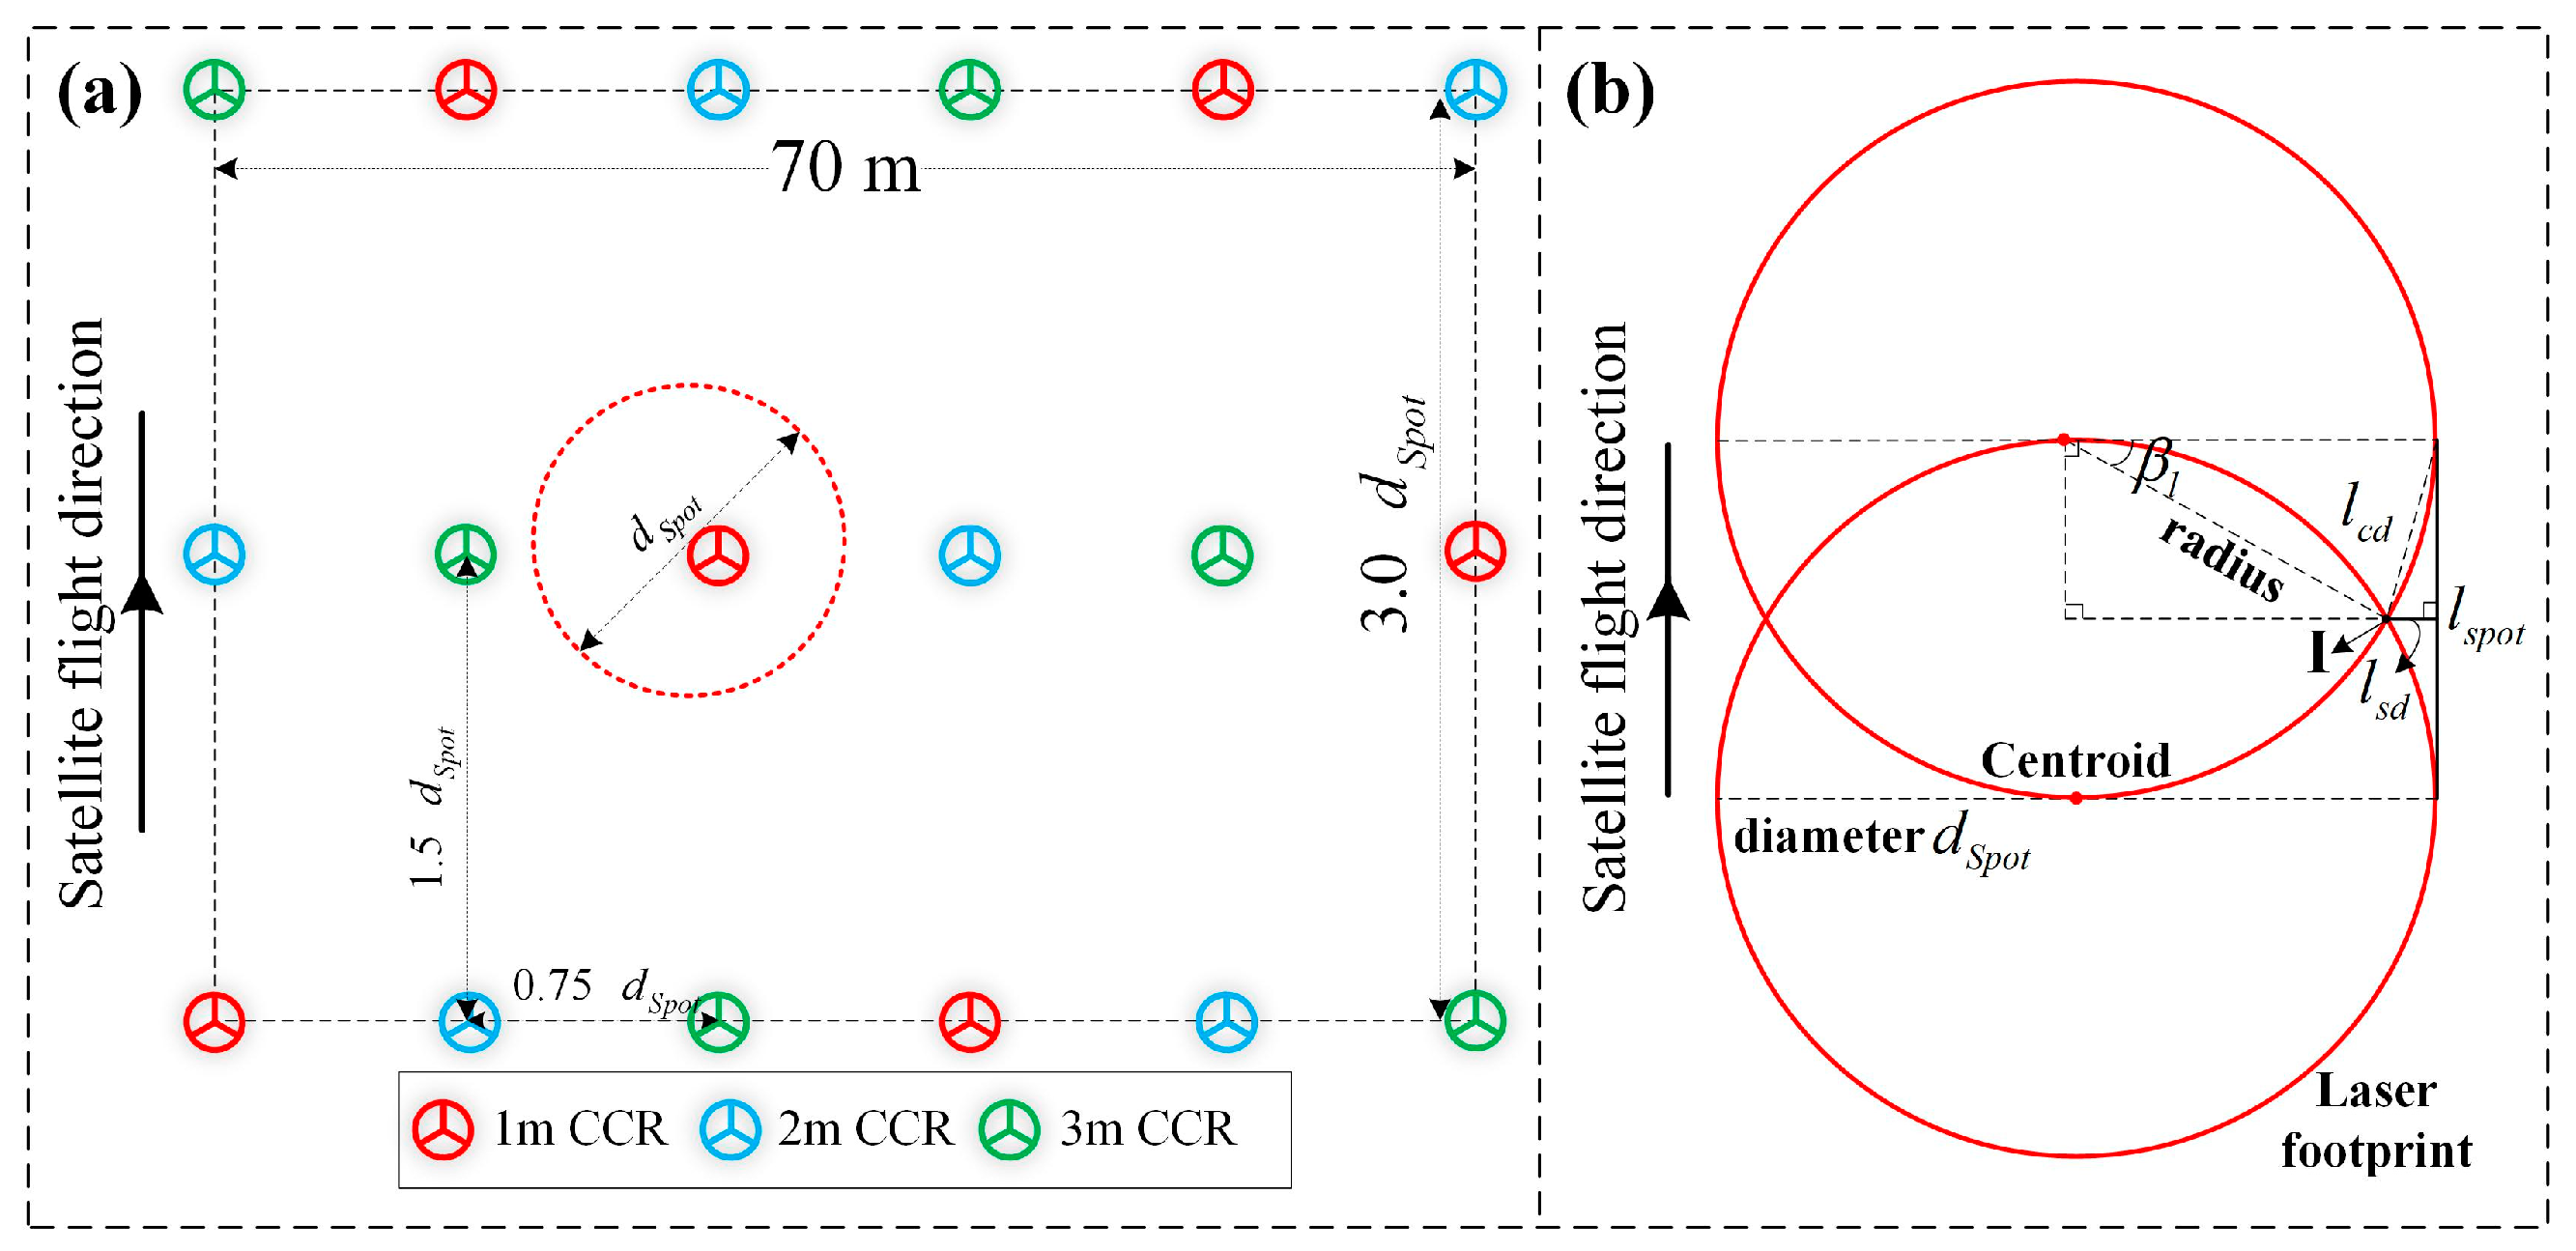
The across-track spacing of CCRs is more complex than along-track spacing because of the density of laser footprints along the track. To achieve accurate matching between triggered CCRs and CCR echo photon point clouds, the design objective for the across-track spacing of CCRs is to ensure that each laser footprint triggers at least one CCR and at most two CCRs at different heights. First, three typical across-track spacing configurations relative to the theoretical footprint diameter were examined, namely 0.5 d S p o t , 0.75 d S p o t , and 1.0 d S p o t , as illustrated in Figure 10a–c. When the across-track spacing is 0.5 d S p o t , poor atmospheric conditions can amplify the laser footprint, potentially triggering three CCRs (as shown in Figure 10a). This increases the difficulty of correctly matching CCR echo photons with their corresponding ground CCRs. Conversely, an across-track spacing of 1.0 d S p o t may result in the laser footprint falling within the gaps between adjacent CCRs, leading to instances where no CCRs are triggered (as depicted in Figure 10c).
Therefore, the optimal across-track spacing for CCRs should lie between 0.5 d S p o t and 1.0 d S p o t . After the satellite is launched into orbit, there may be uncertainty in the actual size of the laser footprint due to variations in the laser divergence angle, satellite operating altitude, and atmospheric environment errors. In this case, an across-track spacing of 0.75 d S p o t is deemed optimal, as shown in Figure 10b. This spacing ensures that regardless of whether the footprint size is amplified or reduced by 25%, one to two CCRs will still be triggered. Consequently, the across-track spacing for CCR deployment is set to 0.75 d S p o t .
3.
CCR Deployment Height and Scheme
The height difference between CCRs is the key indicator for distinguishing their echo photon point clouds. Given that up to two CCRs may be triggered by the same laser footprint in the across-track direction, it is imperative to avoid overlapping echo photon point clouds by ensuring significant height differences between adjacent CCRs within the same across-track row. On the basis of empirical data from actual CCR echo photon point cloud measurements obtained by ATLAS, three distinct heights are recommended, which are 1.0, 2.0, and 3.0 m. To accommodate multiple CCRs deployed in the across-track direction, these three heights should be cyclically arranged. Only three rows of CCRs need to be deployed along tracks, and given the considerable spacing between adjacent rows, it is advisable to interleave CCRs of different heights to ensure that CCRs in the same column across different rows do not have the same height. Accordingly, a CCR deployment scheme was devised as illustrated in Figure 11a, with a deployment range of 3.0 d S p o t m × 70 m (along track × across track).

4.1.3. Detector Placement Strategies

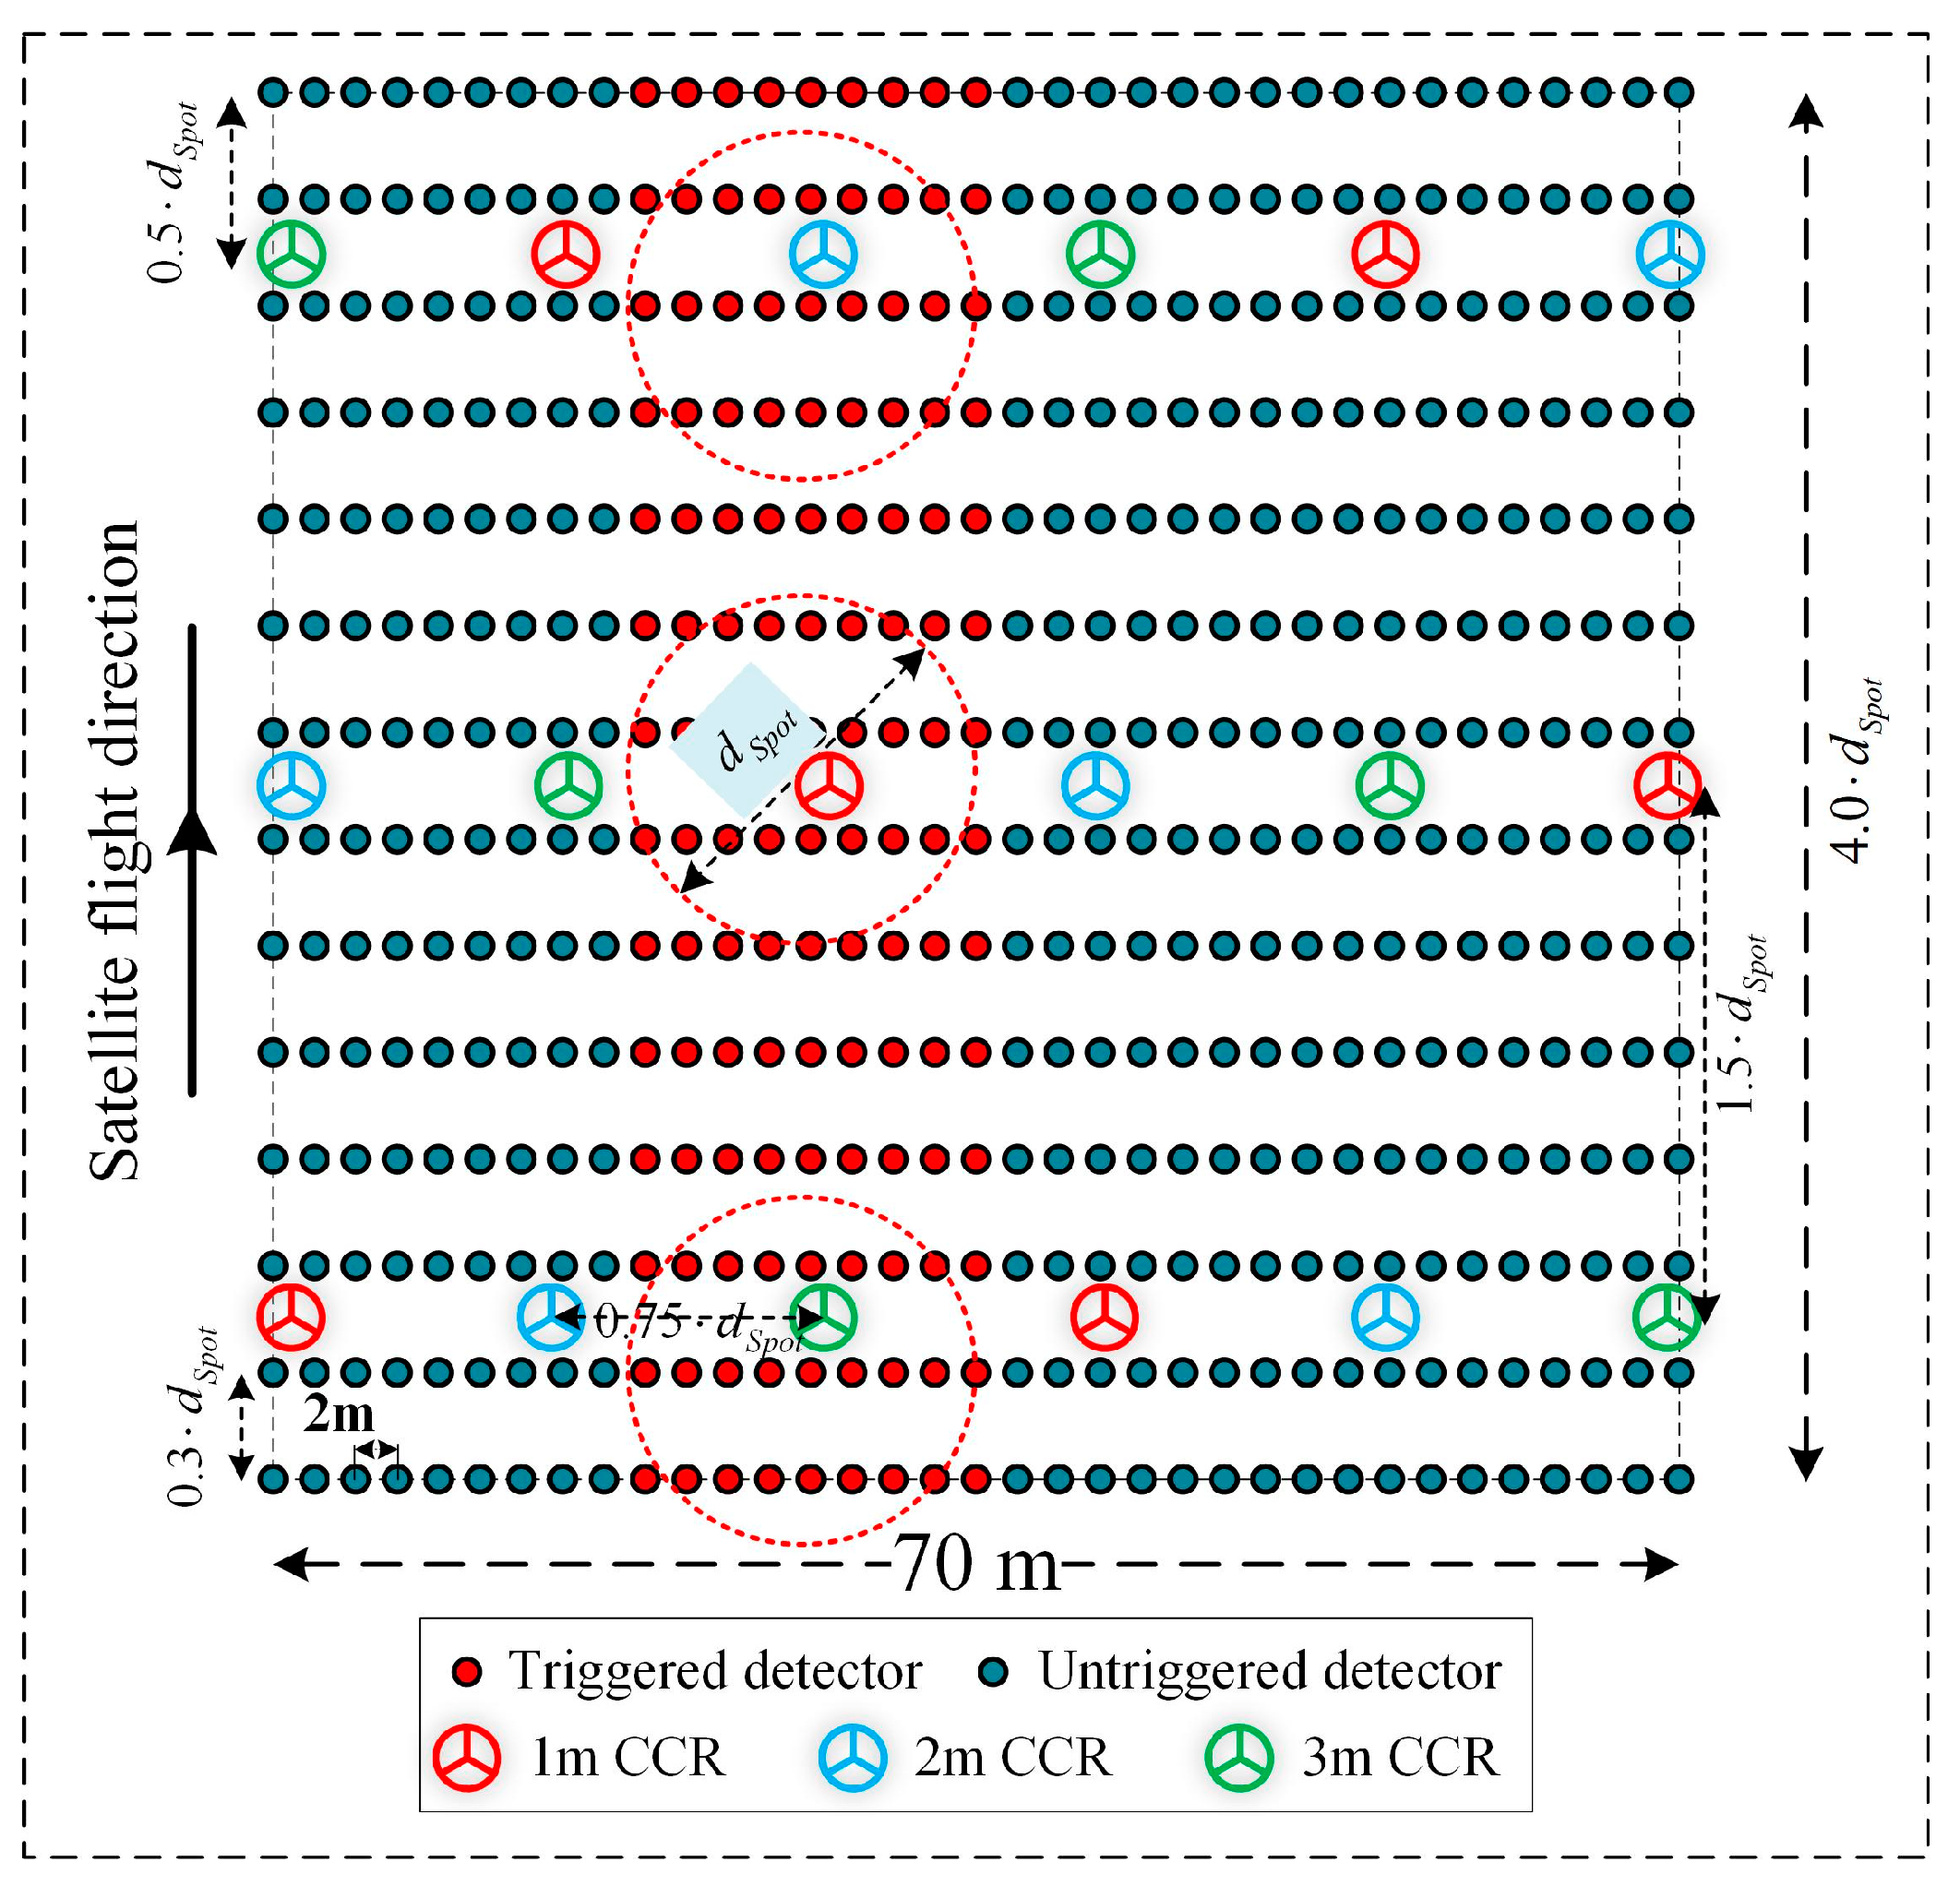
Detectors play a pivotal role in capturing continuous laser footprints, delineating the contour lines of these footprints along tracks and identifying triggered CCRs. To ensure that all laser footprints triggering CCRs are effectively captured by the detectors, the along-track deployment range of the detectors should extend at least 0.5 d S p o t beyond both ends of the CCR’s along-track deployment range. The across-track deployment length remains fixed at 70 m, resulting in a detector deployment range of 4.0 d S p o t × 70 m (along track × across track). The detector spacing design along tracks is relatively simple, as it merely requires ensuring that each laser footprint triggers two to three rows of detectors. The recommended along-track spacing between detector rows is 0.3 d S p o t . The across-track spacing of detectors is selected to eliminate the energy-blind zones between adjacent laser footprints, as depicted in Figure 11b. The energy-blind zone of a laser footprint refers to the region outside the intersection point I between adjacent footprints in the across-track direction, where detectors cannot be triggered. The distance from the blind zone intersection point I to the edge of the laser footprint is calculated via Formulas (20) and (21).
l s d = ( d S p o t sin β l 2 ) 2 ( l s p o t 2 ) 2
β l = 90 a cos ( l s p o t d S p o t )
where l s p o t represents the along-track spacing between adjacent laser footprints and d S p o t denotes the laser footprint diameter.
With ATLAS as an example, an along-track spacing ( l s p o t ) of 0.7 m between adjacent laser footprints and a laser footprint diameter of 17.5 m, the distance ( l s d ) is calculated to be 7 mm. Consequently, the energy-blind zones between adjacent laser footprints are negligible. According to ground-based calibration experiments with the GF7-01 full-waveform laser, an across-track spacing of 3.0 m is determined to be appropriate. However, given the smaller deployment area for spaceborne single-photon detector arrays, it is feasible to slightly reduce the detector spacing to increase the accuracy of laser footprint contour fitting. Thus, an across-track spacing of 2.0 m for detectors is recommended.

4.1.4. Integrated Deployment Strategies for Detectors and CCRs

According to the discussions outlined above, an integrated deployment scheme for the detector and CCR arrays was designed for the proposed calibration method, as depicted in Figure 12. The specifics of this deployment scheme are as follows: the minimum deployment range is 4.0 d S p o t × 70 m (along track × across track), the detector deployment spacing is 0.3 d S p o t × 2.0 m (along track × across track), the CCR deployment spacing is 1.5 d S p o t × 0.75 d S p o t m (along track × across track), and the CCR height is designed to be 1.0 m, 2.0 m, and 3.0 m. With a laser footprint diameter of 17.5 m in ATLAS as an example, the deployment parameters are as follows: the deployment range of the detector and CCR arrays is 70 m × 70 m; the detector spacing is 5.0 m × 2.0 m (along track × across track), and the CCR spacing is 26 m × 13 m (along track × across track). This configuration requires a total of 14 × 35 = 490 detectors and 3 × 6 = 18 CCRs.

4.2. Comparison with Other Methods

The only existing spaceborne single-photon laser for Earth observation is ATLAS, resulting in relatively few geometric calibration methods for spaceborne single-photon lasers. Currently, there are two main methods for spaceborne single-photon geometric calibration, namely satellite attitude maneuver calibration and terrain matching calibration. Compared to the method proposed in this study, the former requires the satellite to undergo high-frequency oscillations, making it difficult to apply to space station lasers and Chinese lasers with multiple payloads on the same satellite platform. The latter, on the other hand, only requires digital terrain data to achieve in-orbit geometric calibration of the spaceborne single-photon laser, making it a more universally applicable method. This study primarily compares the proposed method with the terrain matching calibration method. The data used in the terrain matching calibration experiment are the same as that used in this study, where the laser data consist of photon point clouds with simulated errors. Since the single-photon laser point clouds are dense, we selected laser points within 1.5 km before and after the detector layout positions shown in Figure 5 (a total of 3 km) as the experimental data. The terrain data used in the terrain matching calibration are the DSM from Section 2.1.2, and the calibration results are presented in Table 6.
The results in Table 6 indicate that the terrain matching calibration method effectively corrects the pointing angle of the spaceborne single-photon laser, achieving a corrected accuracy of approximately 3.2 arcsec. However, the laser ranging error after terrain matching calibration is not presented in Table 6, as the terrain matching method calculates the elevation residual sum between the laser and DSM by iterating over different laser pointing angles. The optimal laser pointing angle is identified by minimizing the elevation residual sum [20]. As a result, the laser ranging value cannot be corrected. The high accuracy of the terrain matching calibration in Table 6 is primarily attributed to the sufficiently high accuracy of the DSM and the use of simulated laser calibration data. In practical applications, however, its accuracy may decrease. Despite the high accuracy of the laser pointing after terrain matching calibration, the CMCD calibration method still yields much higher accuracy. The laser pointing accuracy after CMCD calibration is more than three times greater than that achieved with terrain matching calibration. This is because the CMCD method directly locates the centroid of the laser footprint and uses it as a ground control point for calibration. Theoretically, this method provides extremely high accuracy. In conclusion, the method proposed in this study offers superior calibration accuracy compared to the terrain matching calibration method.

4.3. Limitations and Suggestions

Laser detectors and CCRs have been extensively used in traditional full-waveform satellite laser calibration and precision verification, providing significant experience in their deployment within calibration fields [44,45]. However, challenges remain, with the primary issue being the selection of appropriate calibration fields. The selection of calibration fields plays a crucial role in determining whether the detector and CCR can successfully capture the single-photon laser footprint. Therefore, selecting the right calibration fields requires a careful consideration of several factors, such as terrain, weather, and traffic. Based on experience with traditional full-waveform satellite lasers, it is recommended that the calibration fields in this study be flat and free of vegetation. The climate around the calibration fields should be dry and rain-free year-round, with calibration ideally occurring during the dry season. Additionally, since workers will need to be hired to carry the instruments for detector and CCR deployment, it is advisable for the calibration fields to be as close to highways and urban areas as possible.
Although the method proposed in this study has achieved high calibration accuracy when tested with ATLAS simulation data. However, there are still some differences between simulated and actual measurement data, so further validation with real measurement data is required. Since laser parameters vary across different satellite platforms, the laser detector and CCR should be designed based on the specific laser parameters. This ensures that they effectively capture the spaceborne single-photon laser footprint.

5. Conclusions

Owing to the characteristics of laser detectors, which actively capture laser foot-prints, and CCRs, which passively mark single-photon laser echo point clouds, a novel and widely applicable geometric calibration method for spaceborne single-photon lasers, termed CMDC, is proposed. The CMDC method initially involves the use of laser detectors to delineate the contour lines of the laser footprints and subsequently determine the LFC. In the CMDC method, the centroids of the laser footprints are precisely determined by integrating the LFC with the triggered CCRs, and they serve as ground control points, thereby facilitating the geometric calibration of spaceborne single-photon lasers. The final validation of this method was conducted via simulated data from the ATLAS, accompanied by an in-depth discussion of the integrated deployment strategy for laser detectors and CCRs. The primary conclusions drawn from this study are as follows:
(1)
Simulation experiments using ATLAS data demonstrate that the proposed CMDC method can be used to effectively determine the LFC and accurately identify the positions of the centroids of spaceborne single-photon laser footprints by integrating triggered CCRs.
(2)
By employing precisely positioned laser footprint centroids as ground control points, the calibration of ATLAS beams gt2l and gt2r was achieved, with a pointing angle accuracy of approximately 1 arcsec and a ranging accuracy better than 2.1 cm. These results robustly validate the efficacy of the CMDC method.
(3)
An effective integrated deployment scheme for detectors and CCRs is one of the critical prerequisites for implementing the CMDC method. The following deployment parameters are recommended: a minimum deployment range of 4.0 d S p o t × 70 m (along track × across track), a detector deployment spacing of 0.3 d S p o t × 2.0 m (along-track × across-track), a CCR deployment spacing of 1.5 d S p o t × 0.75 d S p o t m (along track × across track), and CCR heights of 1.0, 2.0, and 3.0 m.
In summary, the CMDC method accurately locates the laser footprint center using detectors and CCRs, achieving the high-precision geometric calibration of spaceborne single-photon lasers. Since this method only requires surface operations and avoids additional adjustments to the satellite or laser, it reduces the demands on the satellite platform. As a result, it holds great potential for widespread application to single-photon lasers on various satellite platforms, such as space stations. However, the CMDC method requires the deployment of multiple detectors and CCRs, making it complex and costly. Therefore, developing a more convenient and cost-effective alternative for the high-precision geometric calibration of spaceborne single-photon lasers will be the focus of future research.

Author Contributions

Conceptualization, R.L. and L.H.; methodology, R.L. and J.X.; software, R.L.; validation, J.X.; formal analysis, F.M.; investigation, L.H.; resources, J.X.; data curation, F.M.; writing—original draft preparation, R.L. and L.H.; writing—review and editing, Z.J.; visualization, X.Y.; supervision, L.H.; project administration, R.L.; funding acquisition, L.H. All authors have read and agreed to the published version of the manuscript.

Funding

This research was funded by the China Postdoctoral Science Foundation (2024M752733), the National Natural Science Foundation of China (42401485), the Caiyun Postdoctoral Innovation Project in Yunnan Province (01300208011516003), and the Major Scientific and Technological Projects of Yunnan Province (202202AD080010).

Data Availability Statement

The ATLAS is publicly available, and airborne DSM data are not publicly available due to confidentiality agreements.

Conflicts of Interest

The authors declare no conflicts of interest.

Appendix A

Table A1. ATLAS products used in this study.
DescriptionProductData FieldsData Directory
Laser emission timeATL03delta_time/gtx/heights
Photon coordinateslat_ph, lon_ph, h_ph
Laser time of flightATL02ph_tof/atlas/pcex/altimetry/s_w/photons
Satellite orbit timedelta_time/atlas/housekeeping/position_velocity
Satellite orbit datax_eci_pos, y_eci_pos, z_eci_pos
Satellite attitude timeATL02delta_time/atlas/housekeeping/pointing
Satellite attitude quaternionq_sc_i2b_1, q_sc_i2b_2, q_sc_i2b_3, q_sc_i2b_4
Table A2. Simulated CCRs for ATLAS beams gt2l and gt2r.
Row NumberCCR Numbergt2lgt2r
Latitude (°)Longitude (°)Elevation (m)Height (m)Latitude (°)Longitude (°)Elevation (m)Height (m)
First row#143.20157111.65459938.131.043.20159111.65485938.111.0
#243.20158111.65475939.162.043.20160111.65501939.102.0
#343.20159111.65491940.073.043.20161111.65517940.243.0
#443.20160111.65507938.141.043.20162111.65533938.211.0
#543.20161111.65523939.212.043.20163111.65549939.182.0
#643.20162111.65539940.203.043.20164111.65565940.173.0
Second row#743.20180111.65456939.122.043.20182111.65482938.962.0
#843.20181111.65472940.043.043.20183111.65498940.033.0
#943.20182111.65488937.991.043.20184111.65514938.121.0
#1043.20184111.65504939.142.043.20185111.65530939.292.0
#1143.20185111.65521940.103.043.20186111.65546940.153.0
#1243.20186111.65537938.141.043.20187111.65562938.091.0
Third row#1343.20204111.65453940.013.043.20206111.65479940.043.0
#1443.20205111.65469938.211.043.20207111.65495938.021.0
#1543.20206111.65485938.982.043.20208111.65511939.022.0
#1643.20207111.65501940.093.043.20209111.65527940.003.0
#1743.20208111.65518938.201.043.20210111.65543938.031.0
#1843.20209111.65534938.942.043.20212111.65560939.132.0

References

  1. Schutz, B.E.; Zwally, H.J.; Shuman, C.A.; Hancock, D.; Dimarzio, J.P. Overview of the ICESat Mission. Geophys. Res. Lett. 2005, 32, 97–116. [Google Scholar] [CrossRef]
  2. Neumann, T.A.; Martino, A.J.; Markus, T.; Bae, S.; Bock, M.R.; Brenner, A.C.; Brunt, K.M.; Cavanaugh, J.; Fernandes, S.T.; Hancock, D.W. The Ice, Cloud, and Land Elevation Satellite–2 mission: A global geolocated photon product derived from the Advanced Topographic Laser Altimeter System. Remote Sens. Environ. 2019, 233, 111325. [Google Scholar] [CrossRef]
  3. Amy Neuenschwander, K.P. The ATL08 land and vegetation product for the ICESat-2 Mission. Remote Sens. Environ. 2018, 221, 247–259. [Google Scholar] [CrossRef]
  4. Markus, T.; Neumann, T.; Martino, A.; Abdalati, W.; Brunt, K.; Csatho, B.; Farrell, S.; Fricker, H.; Gardner, A.; Harding, D. The Ice, Cloud, and land Elevation Satellite-2 (ICESat-2): Science requirements, concept, and implementation. Remote Sens. Environ. 2017, 190, 260–273. [Google Scholar] [CrossRef]
  5. Ma, L.; Hurtt, G.; Tang, H.; Lamb, R.; Lister, A.; Chini, L.; Dubayah, R.; Armston, J.; Campbell, E.; Duncanson, L. Spatial heterogeneity of global forest aboveground carbon stocks and fluxes constrained by spaceborne lidar data and mechanistic modeling. Glob. Change Biol. 2023, 29, 3378–3394. [Google Scholar] [CrossRef]
  6. Wang, R.; Lu, Y.; Lu, D.; Li, G. Improving extraction of forest canopy height through reprocessing ICESat-2 ATLAS and GEDI data in sparsely forested plain regions. GISci. Remote Sens. 2024, 61, 2396807. [Google Scholar] [CrossRef]
  7. Huang, Q.; McMillan, M.; Muir, A.; Phillips, J.; Slater, T. Multipeak retracking of radar altimetry waveforms over ice sheets. Remote Sens. Environ. 2024, 303, 114020. [Google Scholar] [CrossRef]
  8. Robel, A.A.; Sim, S.J.; Meyer, C.; Siegfried, M.R.; Gustafson, C.D. Contemporary ice sheet thinning drives subglacial groundwater exfiltration with potential feedbacks on glacier flow. Sci. Adv. 2023, 9, 33. [Google Scholar] [CrossRef]
  9. Kossieris, S.; Tsiakos, V.; Tsimiklis, G.; Amditis, A. Inland Water Level Monitoring from Satellite Observations: A Scoping Review of Current Advances and Future Opportunities. Remote Sens. 2024, 16, 1181. [Google Scholar] [CrossRef]
  10. Liu, C.; Hu, R.; Wang, Y.; Lin, H.; Wu, D.; Dai, Y.; Zhu, Y.; Liu, Z.; Yang, D.; Zhang, Q. Integrating ICESat-2 laser altimeter observations and hydrological modeling for enhanced prediction of climate-driven lake level change. J. Hydrol. 2023, 626, 130304. [Google Scholar] [CrossRef]
  11. Liu, Y.; Tang, S.; Deng, R.; Huang, Y.; Ye, H.; Xu, Z.; Zeng, K. Mapping Ultrahigh-Spatial-Resolution Bathymetry for a Wide Range of Coastal Optically Shallow Waters Without in Situ Bathymetric Data. IEEE Trans. Geosci. Remote Sens. 2023, 61, 1–16. [Google Scholar] [CrossRef]
  12. Wang, E.; Li, D.; Wang, Z.; Cao, W.; Zhang, J.; Wang, J.; Zhang, H. Pixel-level bathymetry mapping of optically shallow water areas by combining aerial RGB video and photogrammetry. Geomorphology 2024, 449, 109049. [Google Scholar] [CrossRef]
  13. Luthcke, S.B.; Thomas, T.C.; Pennington, T.A.; Rebold, T.W.; Nicholas, J.B.; Rowlands, D.D.; Gardner, A.S.; Bae, S. ICESat-2 Pointing Calibration and Geolocation Performance. Earth Space Sci. 2020, 8, e2020EA001494. [Google Scholar] [CrossRef]
  14. Yi, H.; Li, S.; Ma, Y.; Huang, K.; Zhou, H.; Shi, G.Y. On-orbit calibration of satellite laser altimeters based on footprint detection. Acta Phys. Sin. 2017, 66, 134206. [Google Scholar] [CrossRef]
  15. Magruder, L.A.; Suleman, M.A.; Schutz, B.E. ICESat laser altimeter measurement time validation system. Meas. Sci. Technol. 2003, 14, 1978–1985. [Google Scholar] [CrossRef]
  16. Magruder, L.A.; Schutz, B.E.; Silverberg, E.C. Laser pointing angle and time of measurement verification of the ICESat laser altimeter using a ground-based electro-optical detection system. J. Geod. 2003, 77, 148–154. [Google Scholar] [CrossRef]
  17. Tang, X.M.; Xie, J.F.; Mo, F.; Dou, X.H.; Li, X.; Li, S.N.; Li, S.; Huang, G.H.; Fu, X.K.; Liu, R.; et al. GF-7 dual-beam laser altimeter on-orbit geometric calibration and test verification. Acta Geod. Cartogr. Sin. 2003, 77, 148–154. [Google Scholar]
  18. Xie, J.; Tang, X.; Mo, F.; Tang, H.; Wang, Z.; Wang, X.; Liu, Y.; Tian, S.; Liu, R.; Xia, X. In-orbit geometric calibration and experimental verification of the ZY3-02 laser altimeter. Photogramm. Rec. 2018, 33, 341–362. [Google Scholar] [CrossRef]
  19. Tang, X.M.; Xie, J.F.; Fu, X.K.; Mo, F.; Li, S.N.; Dou, X.H. ZY3-02 Laser Altimeter On-orbit Geometrical Calibration and Test. Acta Geod. Cartogr. Sin. 2017, 46, 714–723. [Google Scholar]
  20. Tang, X.; Xie, J.; Gao, X.; Mo, F.; Feng, W.; Liu, R. The In-Orbit Calibration Method Based on Terrain Matching with Pyramid-Search for the Spaceborne Laser Altimeter. IEEE J. Select. Top. Appl. Earth Obs. Remote Sens. 2019, 12, 1053–1062. [Google Scholar] [CrossRef]
  21. Nan, Y.; Feng, Z.; Liu, E.; Li, B. Iterative Pointing Angle Calibration Method for the Spaceborne Photon-Counting Laser Altimeter Based on Small-Range Terrain Matching. Remote Sens. 2019, 11, 2158. [Google Scholar] [CrossRef]
  22. Zhao, P.; Li, S.; Ma, Y.; Liu, X.; Yang, J.; Yu, D. A new terrain matching method for estimating laser pointing and ranging systematic biases for spaceborne photon-counting laser altimeters. ISPRS J. Photogramm. Remote Sens. 2022, 188, 220–236. [Google Scholar] [CrossRef]
  23. Schenk, T.; Csatho, B.; Neumann, T. Assessment of ICESat-2’s Horizontal Accuracy Using Precisely Surveyed Terrains in McMurdo Dry Valleys, Antarctica. IEEE Trans. Geosci. Remote Sens. 2022, 60, 1–11. [Google Scholar] [CrossRef]
  24. Filin, S. Calibration of spaceborne laser Altimeters-an algorithm and the site selection problem. IEEE Trans. Geosci. Remote Sens. 2006, 44, 1484–1492. [Google Scholar] [CrossRef]
  25. Xie, J.; Liu, R.; Tang, X.; Yang, X.; Zeng, J.; Mo, F.; Mei, Y. A Geometric Calibration Method Without a Field Site of the GF-7 Satellite Laser Relying on a Surface Mathematical Model. IEEE Trans. Geosci. Remote Sens. 2023, 61, 1–14. [Google Scholar] [CrossRef]
  26. Luthcke, S.B.; Carabajal, C.C.; Rowlands, D.D. Enhanced geolocation of spaceborne laser altimeter surface returns: Parameter calibration from the simultaneous reduction of altimeter range and navigation tracking data. J. Geodyn. 2002, 34, 447–475. [Google Scholar] [CrossRef]
  27. Luthcke, S.B.; Rowlands, D.D.; Williams, T.A.; Sirota, M. Reduction of ICESat systematic geolocation errors and the impact on ice sheet elevation change detection. Geophys. Res. Lett. 2005, 32, 312–321. [Google Scholar] [CrossRef]
  28. Luthcke, S.B.; Rowlands, D.D.; Mccarthy, J.J.; Pavlis, D.E.; Stoneking, E. Spaceborne Laser-Altimeter-Pointing Bias Calibration from Range Residual Analysis. J. Spacecraft Rockets 2000, 37, 374–384. [Google Scholar] [CrossRef]
  29. Rowlands, D.D.; Pavlis, D.E.; Lemoine, F.G.; Neumann, G.A.; Luthcke, S.B. The use of laser altimetry in the orbit and attitude determination of Mars Global Surveyor. Geophys. Res. Lett. 1999, 26, 1191–1194. [Google Scholar] [CrossRef]
  30. Bae, S.; Helgeson, B.; James, M.; Magruder, L.; Sipps, J.; Luthcke, S.; Thomas, T. Performance of ICESat-2 Precision Pointing Determination. Earth Space Sci. 2020, 8, e2020EA001478. [Google Scholar] [CrossRef]
  31. Tokunaga, M. Accuracy verification of DSM obtained from UAV using commercial software. In Proceedings of the 2015 IEEE International Geoscience and Remote Sensing Symposium (IGARSS), Milan, Italy, 26–31 July 2015. [Google Scholar] [CrossRef]
  32. Magruder, L.; Brunt, K.; Neumann, T.; Klotz, B.; Alonzo, M. Passive ground-based optical techniques for monitoring the on-orbit ICESat-2 altimeter geolocation and footprint diameter. Earth Space Sci. 2021, 8, e2020EA001414. [Google Scholar] [CrossRef]
  33. Magruder, L.A.; Brunt, K.M.; Alonzo, M. Early ICESat-2 on-orbit Geolocation Validation Using Ground-Based Corner Cube Retro-Reflectors. Remote Sens. 2020, 12, 3653. [Google Scholar] [CrossRef]
  34. Krystek, M.; Anton, M. A weighted total least-squares algorithm for fitting a straight line. Meas. Sci. Technol. 2007, 18, 3438. [Google Scholar] [CrossRef]
  35. Markovsky, I.; Van Huffel, S. Overview of total least-squares methods. Signal Process. 2007, 87, 2283–2302. [Google Scholar] [CrossRef]
  36. Xie, J.; Liu, R.; Mo, F.; Tang, H.; Jiao, H.; Mei, Y.; Yang, C. Pointing Bias Calibration of Gaofen-7 Laser Altimeter Based on Single Laser Footprint Image. ISPRS Ann. Photogramm. Remote Sens. Spatial Inf. Sci. 2020, V-2-2020, 113–119. [Google Scholar] [CrossRef]
  37. Xie, J.; Tang, X.; Mo, F.; Li, G.; Zhu, G.; Wang, Z.; Fu, X.; Gao, X.; Dou, X. ZY3-02 Laser Altimeter Footprint Geolocation Prediction. Sensors 2017, 17, 2165. [Google Scholar] [CrossRef]
  38. Liu, R.; Tang, X.; Xie, J.; Ma, R.; Yang, X.; Mo, F.; Lv, X. A Full-Link Simulation Method for Satellite Single-Photon LiDARs. IEEE Geosci. Remote Sens. Lett. 2023, 21, 1–5. [Google Scholar] [CrossRef]
  39. Yang, X.; Wang, Y.; Yin, T.; Wang, C.; Lauret, N.; Regaieg, O.; Xi, X.; Gastellu-Etchegorry, J.P. Comprehensive LiDAR simulation with efficient physically-based DART-Lux model (I): Theory, novelty, and consistency validation. Remote Sens. Environ. 2022, 272, 112952. [Google Scholar] [CrossRef]
  40. Wang, Y.; Jiang, W.J. High Precision Attitude Determination Method for Star Camera Based on UKF. Acta Photonica Sin. 2020, 49, 146–153. [Google Scholar] [CrossRef]
  41. Wu, Q.; Zhang, C.; Zhu, G.; Wang, Z. Rapid Precision Orbit Determination Based on Dual-Frequency GPS Receiver for ZY3-02 Satellite. J. Geod. Geodyn. 2018, 38, 73–77. [Google Scholar] [CrossRef]
  42. Fricker, H.A.; Ridgway, J.R.; Minster, J.B.; Yi, D.; Bentley, C. The Algorithm Theoretical Basis Document for Tidal Corrections; Goddard Space Flight Center: Greenbelt, MD, USA; National Aeronautics and Space Administration: Washington, DC, USA, 2012. Available online: https://ntrs.nasa.gov/api/citations/20130013632/downloads/20130013632.pdf (accessed on 20 February 2025).
  43. Petrov, L.; Luthcke, S. Revision of the Atmospheric Delay Correction for ICESat-2 Laser Altimeter Ranges; National Aeronautics and Space Administration: Washington, DC, USA, 2013. Available online: https://ntrs.nasa.gov/citations/20180006782 (accessed on 20 February 2025).
  44. Magruder, L.A.; Webb, C.E.; Urban, T.J.; Silverberg, E.C.; Schutz, B.E. ICESat Altimetry Data Product Verification at White Sands Space Harbor. IEEE Trans. Geosci. Remote Sens. 2006, 45, 147–155. [Google Scholar] [CrossRef]
  45. Xie, J.; Liu, R.; Yang, X.; Mo, F.; Zhang, F.; Liu, L. On-orbit geometric calibration of satellite laser altimeters using infrared detectors and corner-cube retroreflectors. Int. J. Digit. Earth 2023, 16, 2067–2088. [Google Scholar] [CrossRef]
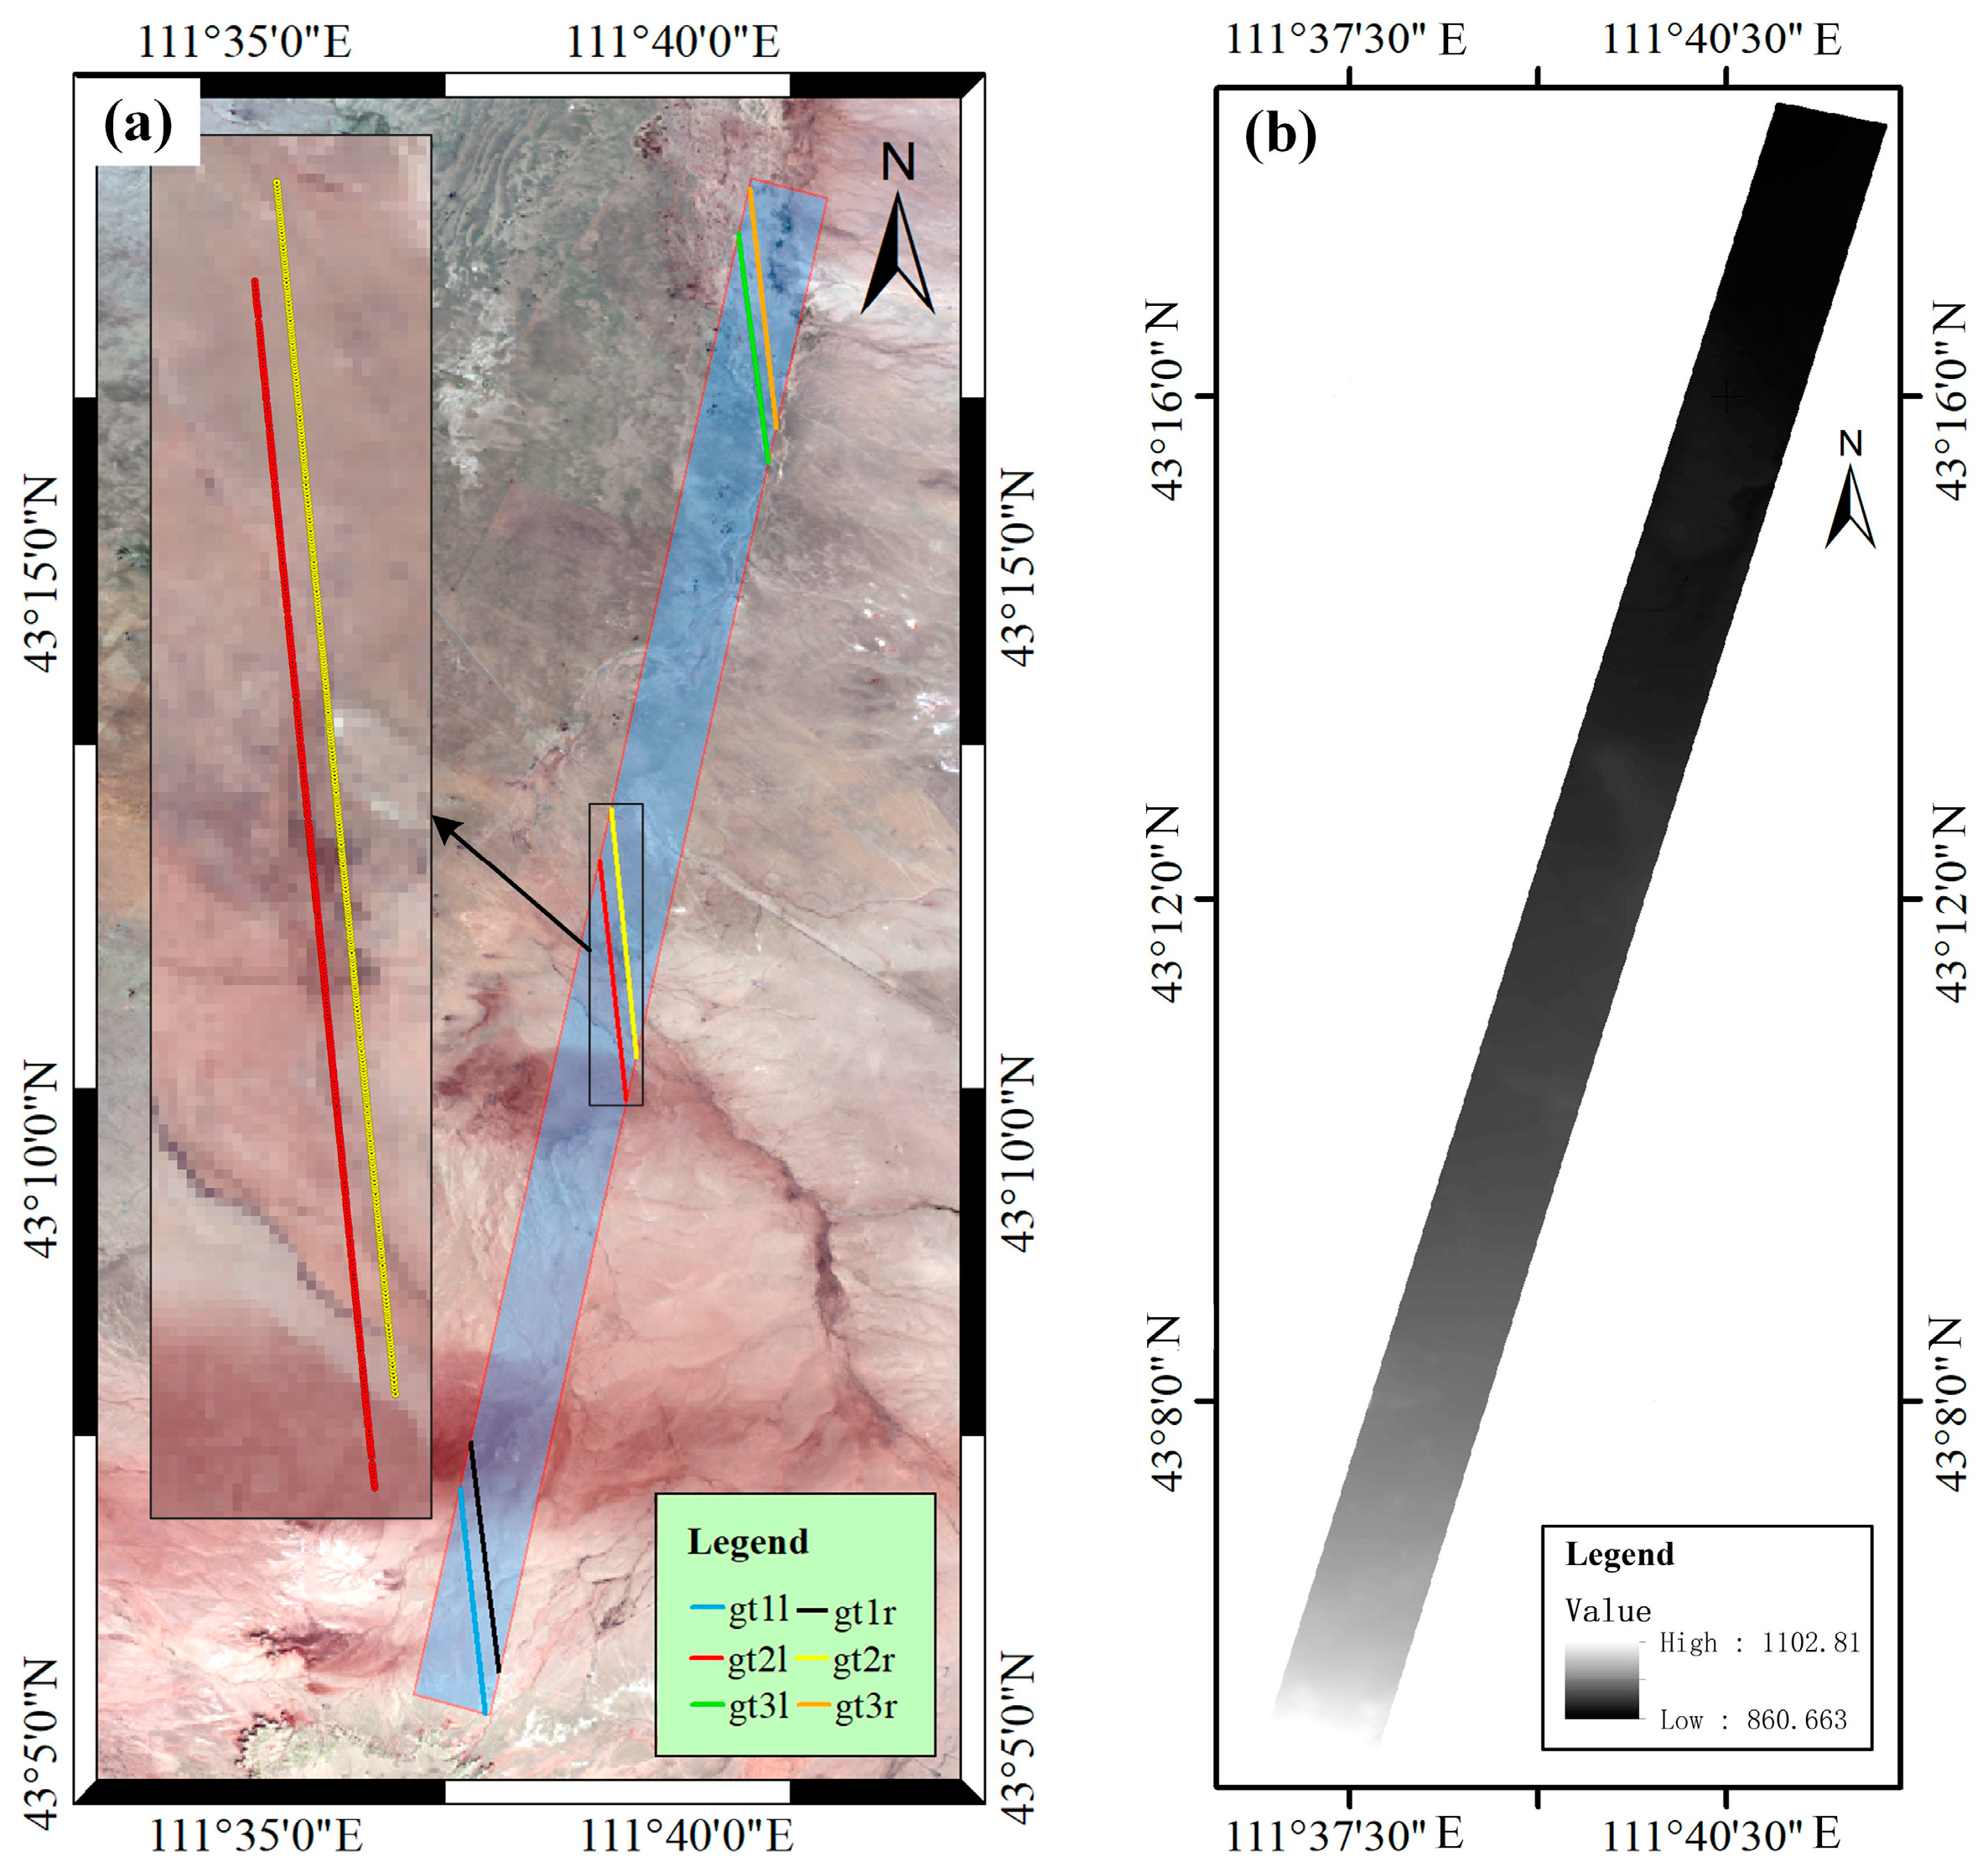
Figure 1. Spatial distribution of the study area and data. (a) Distribution of ATLAS data; (b) DSM within the study area.
Remotesensing 17 00773 g001
Figure 2. Overall technical workflow of the proposed method.
Remotesensing 17 00773 g002
Figure 3. Schematic of the spaceborne single-photon laser triggering detectors and CCRs. (a) Laser passing over the detector array; (b) laser passing over the detector and CCR array simultaneously.
Remotesensing 17 00773 g003
Figure 4. Geometric relationship between CCRs and laser footprint centroids. (a) CCR located east of the LFC with α A Z between 0° and 180°; (b) CCR located east of the LFC with α A Z between 180° and 360°; (c) CCR located west of the LFC with α A Z between 0° and 180°; (d) CCR located west of the LFC with α A Z between 180° and 360°.
Remotesensing 17 00773 g004
Figure 5. Simulated laser footprint centroids, detector, and CCR arrays. (a,b) The simulated laser footprint centroids for beams gt2l and gt2r, respectively; (c,d) the simulated detector and CCR arrays for beams gt2l and gt2r, respectively.
Remotesensing 17 00773 g005
Figure 6. Simulated detector triggering results and echo photon point clouds within the study area. (a,b) The simulated triggered detectors for beams gt2l and gt2r, respectively; (c,d) the simulated echo photon point clouds of ground and CCRs for beams gt2l and gt2r, respectively.
Remotesensing 17 00773 g006
Figure 7. LFC determined with the detectors. (a) Beam gt2l; (b) beam gt2r.
Remotesensing 17 00773 g007
Figure 8. Matching results between the CCR photon point clouds and triggered CCRs. (a) Beam gt2l; (b) beam gt2r.
Remotesensing 17 00773 g008
Figure 9. Simulation results with measurement errors for five different auxiliary data. (a) Satellite attitude error; (b) satellite orbital error; (c) laser timing error; (d) atmospheric delay correction error; (e) tidal correction error.
Remotesensing 17 00773 g009
Figure 10. Schematic diagram illustrating the geometric relationships between laser footprints and CCRs. (a) CCR across-track spacing is 0.5 d S p o t ; (b) CCR across-track spacing is 0.75 d S p o t ; (c) CCR across-track spacing is 1.0 d S p o t .
Remotesensing 17 00773 g010
Figure 11. Schematic diagram of the CCR deployment scheme and energy-blind zones of laser footprints. (a) Overall CCR deployment scheme; (b) schematic of energy-blind zones between adjacent laser footprints.
Remotesensing 17 00773 g011
Figure 12. Theoretical design of the integrated deployment scheme for detectors and CCRs.
Remotesensing 17 00773 g012
Table 1. Simulated parameters for ATLAS beams gt2l and gt2r.
BeamParameter Type α (°) β (°) γ (°) Δ ρ (m)
gt2lInitial value90.090.00.00.0
True value90.29430089.8675010.322752−2.308
gt2rInitial value90.090.00.00.0
True value90.58055989.8677890.5954249.237
Table 2. Accurate laser footprint centroid information.
BeamTimecode (s)Latitude (°)Longitude (°)Elevation (m)CCR Number l C S (m)
gt2l71,130,114.8489643.19902111.65414937.92# 41.79
71,130,114.8524643.19925111.65410937.74# 102.27
71,130,114.8564643.19949111.65407937.71# 162.76
gt2r71,130,115.2320643.20178111.65503937.02# 25.02
71,130,115.2320643.20178111.65503937.02# 38.10
71,130,115.2358643.20201111.65500937.30# 85.03
71,130,115.2358643.20201111.65500937.30# 98.10
71,130,115.2394643.20225111.65497936.98# 145.03
71,130,115.2394643.20225111.65497936.98# 158.09
Table 3. Beam gt2l parameters before and after calibration.
Calibration TypeLaser Pointing Angle and Ranging ErrorDifference
α (°) β (°) Δ ρ (m) α (’’) β (’’) Δ ρ (m)
Initial value90.090.00.0---
True value90.29430089.867501−2.308---
No error90.29419889.867426−2.01−0.3672−0.270.028
Attitude error90.29409889.867235−2.01−0.7272−0.95760.028
Orbital error90.29419889.867426−2.002−0.3672−0.270.036
Timing error90.29420489.867427−2.01−0.3456−0.26640.028
Atmospheric error90.29419889.867426−2.003−0.3672−0.270.035
Tidal error90.29419889.867426−2.01−0.3672−0.270.028
Total error90.29410489.867236−2.017−0.7056−0.9540.021
Table 4. Beam gt2r parameters before and after calibration.
Calibration TypeLaser Pointing Angle and Ranging ErrorDifference
α (°) β (°) Δ ρ (m) α (’’) β (’’) Δ ρ (m)
Initial value90.090.00.0---
True value90.58055989.8677899.237---
No error90.58059989.8677339.2590.1440−0.20160.022
Attitude error90.58048289.8675099.259−0.2772−1.00800.022
Orbital error90.58059989.8677339.2640.1440−0.20160.027
Timing error90.58059789.8677339.2590.1368−0.20160.022
Atmospheric error90.58059989.8677339.2650.1440−0.20160.028
Tidal error90.58059989.8677339.2590.1440−0.20160.022
Total error90.58047989.8675099.256−0.2880−1.00800.019
Table 5. Spaceborne laser footprint position prediction error.
TypeMaximum
Along Track Error (m)
Maximum
Across Track Error (m)
Total Error (m)
Pointing error202029
Orbital error1508150
Attitude error151518
Total error18543197
Table 6. Comparison of terrain matching and CMCD calibration results.
Beam TypeCalibration TypeLaser Pointing Angle and Ranging ErrorDifference
α (°) β (°) Δ ρ (m) α (’’) β (’’) Δ ρ (m)
gt2lTrue value90.29430089.867501−2.308---
Terrain matching90.29372189.866602-−2.0844−3.2364-
CMCD90.29410489.867236−2.017−0.7056-0.95400.021
gt2rTrue value90.58055989.8677899.237---
Terrain matching90.58010089.866947-−1.6524−3.0312-
CMCD90.58047989.8675099.256−0.2880−1.00800.019
Disclaimer/Publisher’s Note: The statements, opinions and data contained in all publications are solely those of the individual author(s) and contributor(s) and not of MDPI and/or the editor(s). MDPI and/or the editor(s) disclaim responsibility for any injury to people or property resulting from any ideas, methods, instructions or products referred to in the content.