Article

South China Sea SST Fronts, 2015–2022

College of Marine Science and Technology, Zhejiang Ocean University, Zhoushan 316022, China
*
Author to whom correspondence should be addressed.
Remote Sens. 2025, 17(5), 817; https://doi.org/10.3390/rs17050817
Submission received: 17 January 2025 / Revised: 18 February 2025 / Accepted: 20 February 2025 / Published: 27 February 2025
(This article belongs to the Section Ocean Remote Sensing)

Abstract

:
High-resolution (2 km), high-frequency (hourly) SST data of the Advanced Himawari Imager (AHI) flown onboard the Japanese Himawari-8 geostationary satellite were used to derive the monthly climatology of temperature fronts in the South China Sea. The SST data from 2015 to 2022 were processed with the Belkin–O’Reilly algorithm to generate maps of SST gradient magnitude GM. The GM maps were log-transformed to enhance contrasts in digital maps and reveal additional features (fronts). The combination of high-resolution, cloud-free, four-day-composite SST imagery from AHI, the advanced front-preserving gradient algorithm BOA, and digital contrast enhancement with the log-transformation of SST gradients allowed us to identify numerous mesoscale/submesoscale fronts (including a few fronts that have never been reported) and document their month-to-month variability and spatial patterns. The spatiotemporal variability of SST fronts was analyzed in detail in five regions: (1) In the Taiwan Strait, six fronts were identified: the China Coastal Front, Taiwan Bank Front, Changyun Ridge Front, East Penghu Channel Front, and Eastern/Western Penghu Islands fronts; (2) the Guangdong Shelf is dominated by the China Coastal Front in winter, with the eastern and western Guangdong fronts separated by the Pearl River outflow in summer; (3) Hainan Island is surrounded by upwelling fronts of various nature (wind-driven coastal and topographic) and tidal mixing fronts; in the western Beibu Gulf, the Red River Outflow Front extends southward as the Vietnam Coastal Front, while the northern Beibu Gulf features a tidal mixing front off the Guangxi coast; (4) Off SE Vietnam, the 11°N coastal upwelling gives rise to a summertime front, while the Mekong Outflow and associated front extend seasonally toward Cape Camau, close to the Gulf of Thailand Entrance Front; (5) In the Luzon Strait, the Kuroshio Front manifests as a chain of three fronts across the Babuyan Islands, while west of Luzon Island a broad offshore frontal zone persists in winter. The summertime eastward jet (SEJ) off SE Vietnam is documented from five-day mean SST data. The SEJ emerges in June–September off the 11°N coastal upwelling center and extends up to 114°E. The zonally oriented SEJ is observed to be located between two large gyres, each about 300 km in diameter.

1. Introduction

Fronts of the South China Sea were extensively studied from in situ data since the 1960s and from satellite data since the 1970s. The important role of these fronts in physical, chemical, biological, and geological processes was recognized and investigated, and several quasi-stationary, seasonally persistent fronts were identified, so that the large-scale pattern of fronts was established. Yet despite the tremendous progress in frontal studies of this vast sea, some aspects of its frontal oceanography remain unexplored or understudied. The in-situ data coverage of this sea is extremely uneven, with most data collected in the north. The remote sensing of the SCS is hampered by cloudiness, high humidity, and persistent haze, the latter often rendering satellite data unusable or unsuitable for research purposes. As a result, our knowledge of local fronts remains patchy and incomplete. While the general frontal pattern appears to be well known, most individual fronts still await in-depth observational studies. In particular, seasonal climatologies of individual fronts are sorely lacking. Meanwhile, such seasonal climatologies are needed in a variety of fundamental studies and maritime applications.
The rest of Section 1 is a concise review of satellite studies of SST fronts in the SCS. Section 2 and Section 3 describe data and methods, while Section 4, Section 5 and Section 6 present, discuss, and sum up our results, respectively.
Satellite studies of SST fronts in the SCS: The review below is organized chronologically. Regional aspects are discussed in Section 4 and Section 5.
The modern era of front detection in oceanography began with the Cayula–Cornillon algorithm [1,2] based on the histogram approach. This algorithm was used at the University of Rhode Island since mid-1990s, including a global survey of SST fronts by Belkin et al. (2009) [3] and a study of SST fronts in the Bohai, Yellow, and East China Seas by Hickox et al. (2000) [4].
Dongxiao Wang and collaborators studied temperature fronts in the northern SCS (NSCS; Wang DX et al., 2001 [5]), using the gradient approach. Following the Hickox et al. (2000) [4] method, Wang DX et al. (2001) [5] determined frontal envelopes and cross-frontal SST steps dSST for six fronts in the NSCS and noted the alongshore continuity of the Fujian–Guangdong Front in winter all the way down to the Pearl River outflow front. Farther west, the Fujian–Guangdong Front recovers as the Western Guangdong Front and continues as the Hainan Island East Coast Front. Hence, according to Wang DX et al. (2001) [5], the Fujian–Guangdong–Hainan Front consists of three fronts.
Thermal fronts in the NSCS were mapped with the Shimada algorithm (Shimada et al., 2005 [6]) in several studies conducted by Yi Chang and collaborators and published in 2006–2015 [7,8,9,10]. The main coastal front of the Mainland China was documented from high-resolution (1 km) SST data and traced continuously in winter down to Hainan Island.
Yu Y et al. (2019) [11] evaluated long-term trends of SST fronts. The only significant linear trends of GM (all positive) were found in three interconnected areas: over the Guangdong Shelf, east and south of Hainan Island, and off eastern Vietnam, with winter trends being larger than summer trends. The connectivity of these areas and winter amplification of positive trends of GM point to the advection as a key factor.
Wang YT et al. (2020) [12] mapped SST fronts from MODIS data using an algorithm based on Canny (1986) [13], Castelao and Wang YT (2014) [14], and Wang YT et al. (2015) [15]. Pixels were defined as frontal using the dual threshold method, with the low threshold set at 0.014°C/km, sufficiently low to allow weak fronts to be mapped and counted.
Zhao et al. (2022) [16] mapped SST fronts in the entire SCS from low-resolution (0.25°) data and studied SST fronts over a 40-year span (1981–2021), documenting both spatial and temporal variability of the fronts.
Chen JY and Hu ZF (2023) [17] mapped SST fronts in the NSCS from 1 km data (2002–2021) with the Shimada et al. (2005) [6] algorithm and explored the fronts’ associations with the bathymetry, following the approach developed by David Ullman and Peter Cornillon and published in 1999–2001 [18,19].
Xing et al. (2023) [20] documented long-term (1982–2021) variability of numerous (>50) fronts in the SCS, producing the most complete inventory of the SCS fronts to date. Xing et al. (2024) [21] expanded their SCS study [20] over the global ocean’s Large Marine Ecosystems to document significant long-term trends in fronts’ intensity and occurrence.
In this study, we set out to develop and analyze monthly climatologies of individual SST fronts in the SCS from high-quality satellite data with high resolution in space and time. Our main goals were (1) to document and analyze temperature fronts in the SCS and (2) to detect and document quasi-stationary fronts that feature prominently in frontal frequency maps (published in previous studies) and SST gradient maps (this study).

2. Data

We used the same data as in our previous study of the China Coastal Front [22,23]. Details are provided by Bessho et al. (2016) [24]. The temporal and spatial resolution of L3-level SST data is one hour and two km, respectively, while the time frame is from July 2015 to December 2022. The data were downloaded from a website (https://www.eorc.jaxa.jp/ptree, accessed on 14 January 2025) maintained by the Japan Aerospace Exploration Agency (JAXA; Tokyo, Japan).

3. Methods

In this study, we updated the methodology used in our previous study [22,23]. In particular, we used logarithmic transformation of SST gradient magnitude (GM) to bring out moderate and weak fronts.

3.1. Front Detection

We used the gradient method implemented as the Belkin–O’Reilly algorithm (BOA; Belkin and O’Reilly, 2009 [25]). The BOA is a morphological shape-preserving algorithm that retains certain features. The BOA preserves steps, ramps, ridge-like maxima (rooftop edges), valley-like minima, and significant peaks.

3.2. Front Mapping, Front Frequency, and Front Stability

The gradient magnitude (GM) maps generated by the BOA can be converted to front frequency maps by using a GM threshold. Every pixel with GM exceeding the threshold is declared a frontal pixel. Front frequency is computed for each pixel as FF = N1/N2, where N1 is the counter of fronts, and N2 is the counter of valid data in the pixel. Front stability is identified with front frequency FF.

3.3. Front Intensity, Front Strength, and Cross-Frontal Ranges of Oceanic Variables

Front intensity is identified with GM, while front strength is defined as the total cross-frontal SST range dSST. As an example, in our previous study [22,23] we determined the strength of the China Coastal Front along a series of closely spaced transects across the front. This approach allowed the authors to study and visualize the downstream variability of cross-frontal SST ranges.

3.4. Logarithmic Transformation of SST Gradient

Logarithmic transformation (or log-transform) of data is warranted when data distribution is highly skewed as is the case with SST gradients. Log-transform is an efficient method of contrast enhancement of digital images. In oceanography, log-transform has been routinely applied to chlorophyll data yet rarely applied to other remotely sensed observables or derivatives, particularly SST gradients. Recently, Belkin and Shen (2024) [26] used log-transform to study salinity fronts from satellite data. Here we apply the same technique to temperature fronts. After running the BOA algorithm over SST data to obtain SST gradients, we log-transformed SST gradient magnitude GM using natural logarithms (ln). Maps of log-transformed SST gradient magnitude ln(GM) reveal more fronts, particularly moderate and weak fronts in the open sea and in coastal waters.

4. Results

This section consists of three parts. In Part 1 (Section 4.1, Section 4.2 and Section 4.3) we present monthly maps of SST, SST gradient magnitude GM, and log-transformed gradient ln(GM) for the entire SCS. In Part 2 (Section 4.4, Section 4.5, Section 4.6, Section 4.7 and Section 4.8) we present monthly maps of GM in five regions that feature most fronts and warrant detailed investigations: Region 1, Taiwan Strait; Region 2, Guangdong Shelf; Region 3, Hainan Island and Beibu Gulf; Region 4, Mekong River Outflow and Gulf of Thailand entrance; Region 5, Luzon Strait and west of Luzon Island. Part 3 (Section 4.9) is focused on the summertime eastward jet off SE Vietnam. All maps in Section 4.1, Section 4.2, Section 4.3, Section 4.4, Section 4.5, Section 4.6, Section 4.7 and Section 4.8 are long-term mean monthly maps from 2015 to 2022. Section 4.9 is based on five-day mean maps from June to September 2015–2022.

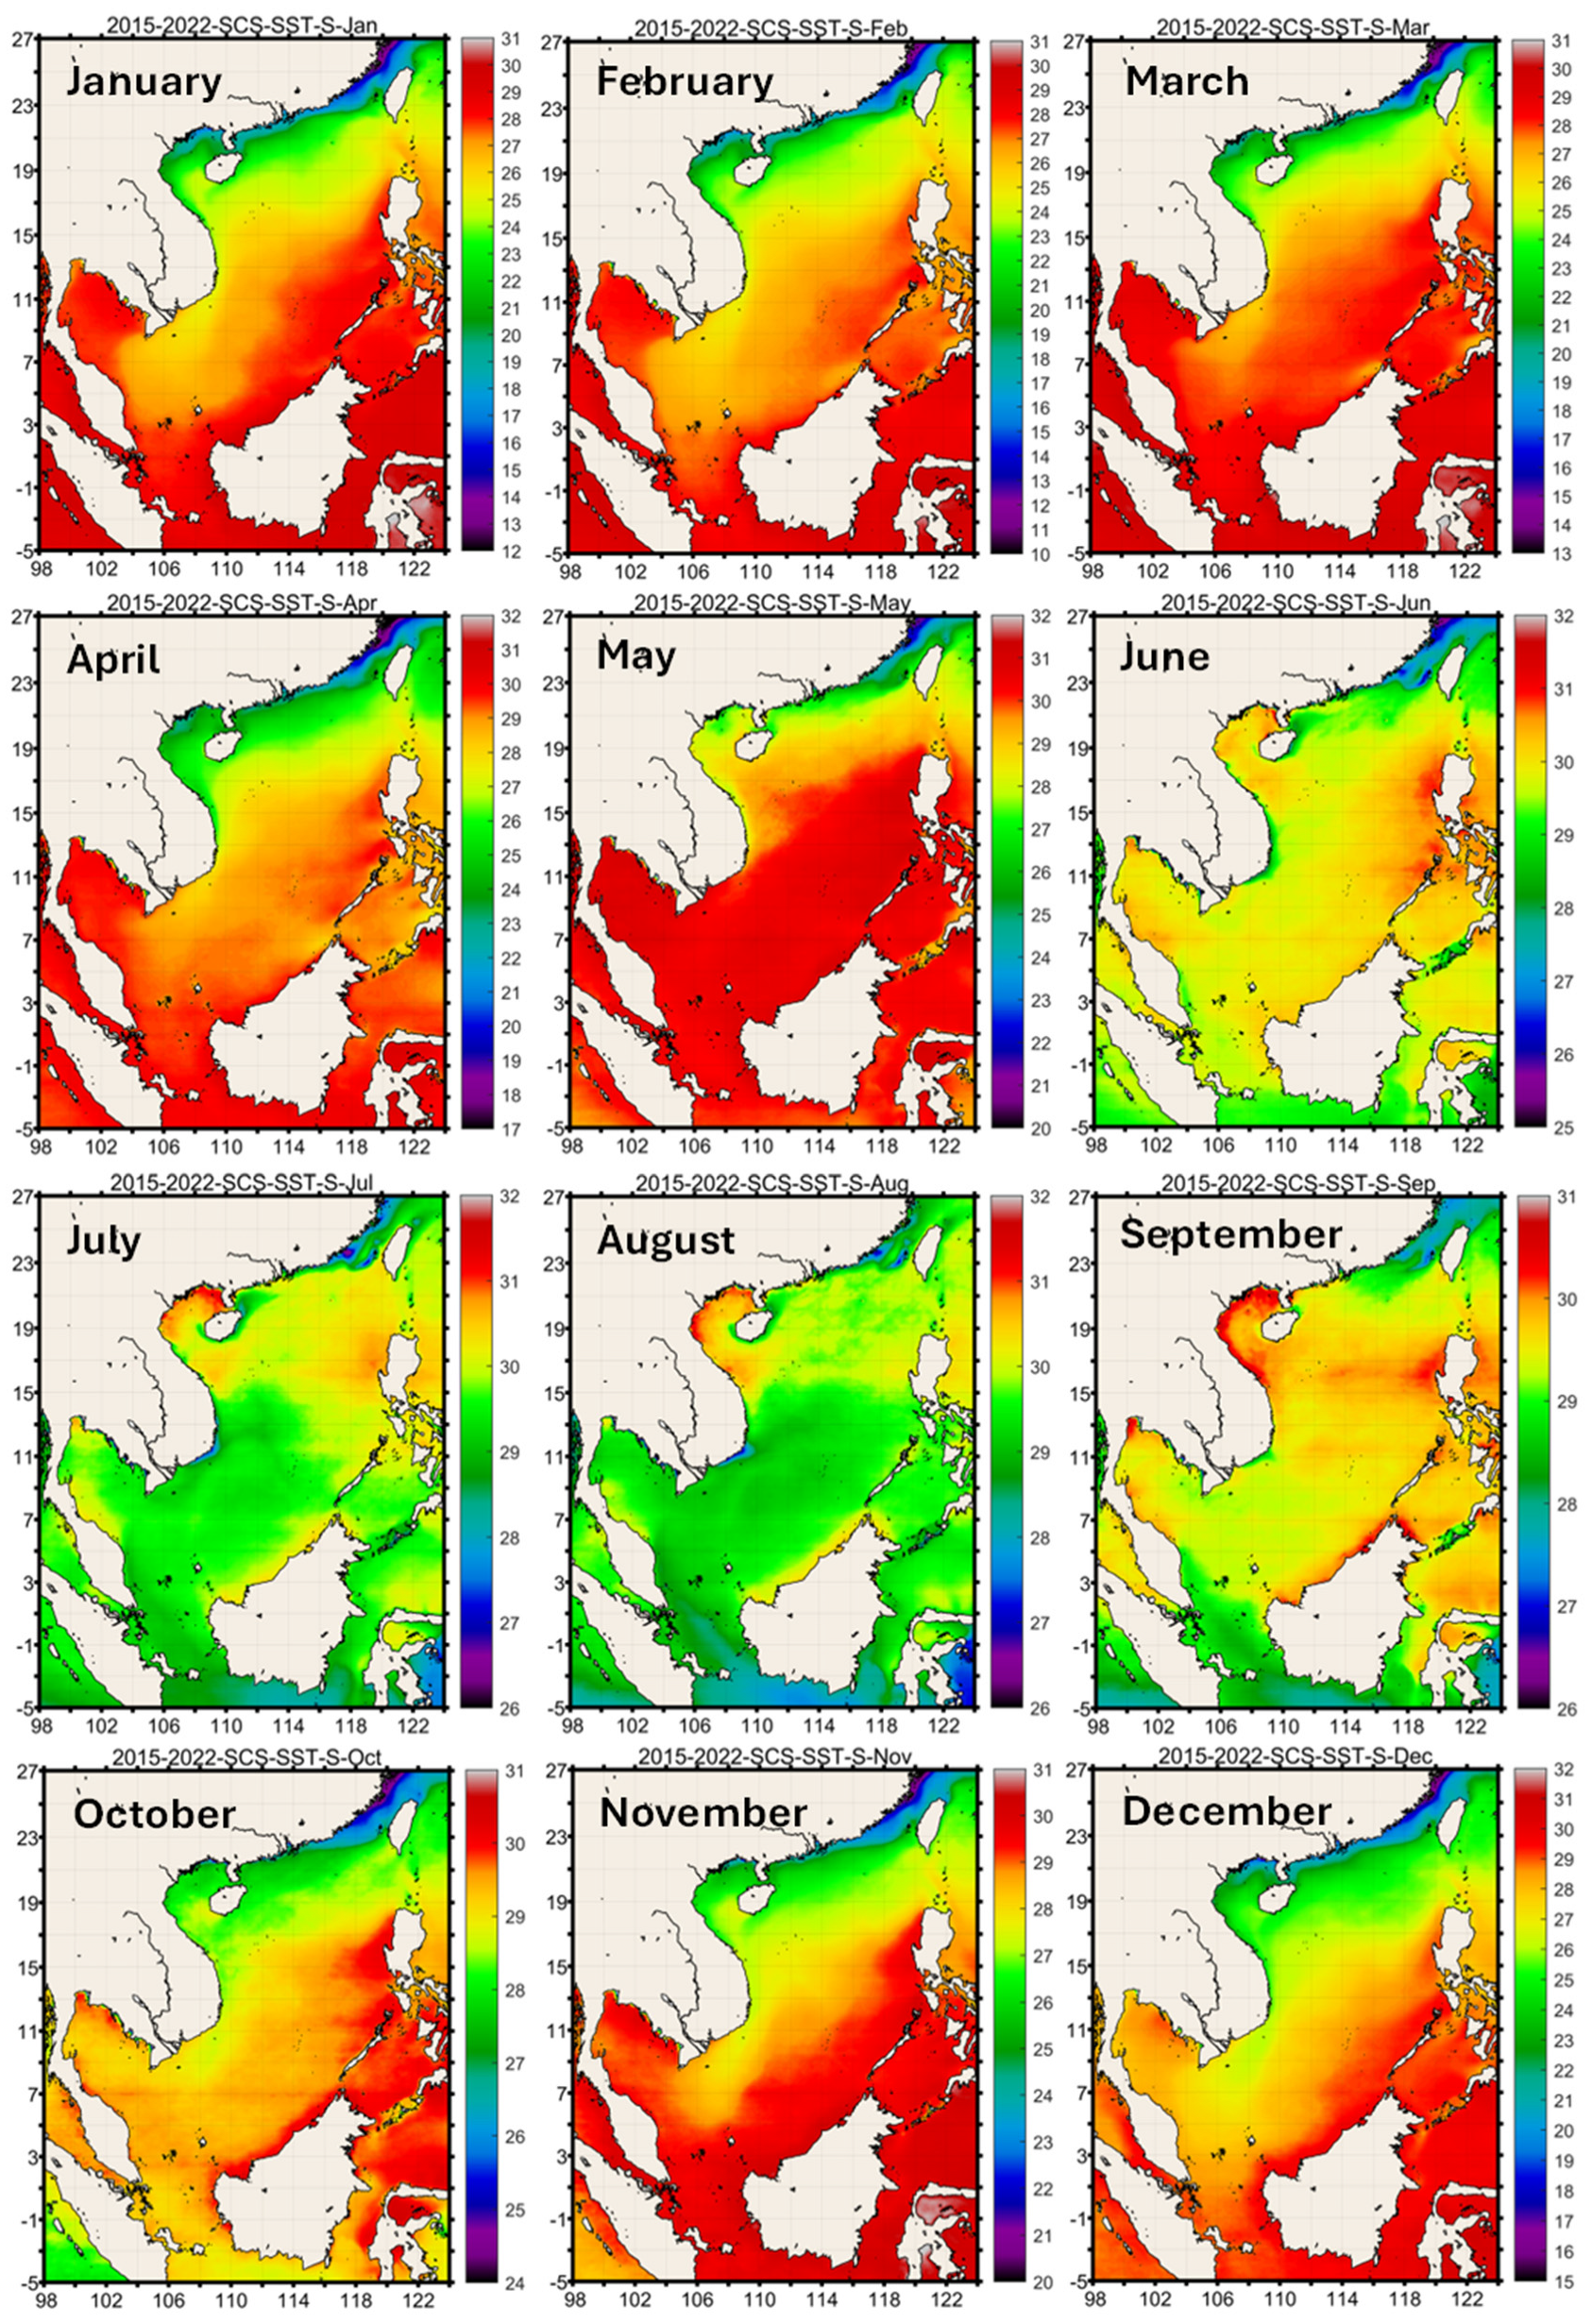
4.1. Sea Surface Temperature and Its Seasonal Variability: Large-Scale Pattern and Meso-Scale Features

Before presenting results on SST fronts, it is instructive to inspect monthly maps of SST (Figure 1). To visually enhance SST gradients and facilitate visual recognition of various features, we adjusted SST color scale for each monthly map. The three peculiar large-scale spatiotemporal patterns of SST variability in the SCS are (1) cold tongue in winter; (2) rapid warming in spring; (3) rapid cooling in June–July.

4.1.1. Cold Tongue in Winter

The meridional cold tongue is maintained by the southward Vietnam Coastal Current and its extension, the Sunda Slope Current (identified by Liu QY et al., 2004 [27]). Driven by the NE monsoon winds, the cold tongue develops by November (Liu QY et al., 2004, Figure 6) [27] and reaches its maximum extent and intensity in January–February (Varikoden et al., 2010, Figure 1) [28]. SST fronts are expected along the western and eastern flanks of the cold tongue. According to Varikoden et al. (2010, Figure 2) [28], zonal gradients of SST across the cold tongue’s western (coastal) flank exceed 0.5 °C/25 km.

4.1.2. Rapid Warming in Spring

In spring, the seasonal warming of surface water proceeds very fast. For example, in the northern Beibu Gulf, SST peaks at 30–31 °C as early as May–June. The rapid warming is explained by the extremely high solar radiation (400–600 W/m2) over most of the SCS (particularly off Vietnam, in the central SCS, and across the entire Gulf of Thailand) combined with very light winds and shallow upper mixed layer, UML (Tan HJ et al., 2022, Figures A2 and A3) [29]. The shallow UML efficiently traps solar radiation so that the rapid warming of the shallow UML in spring is maintained owing to positive feedback.

4.1.3. Rapid Cooling in June–July
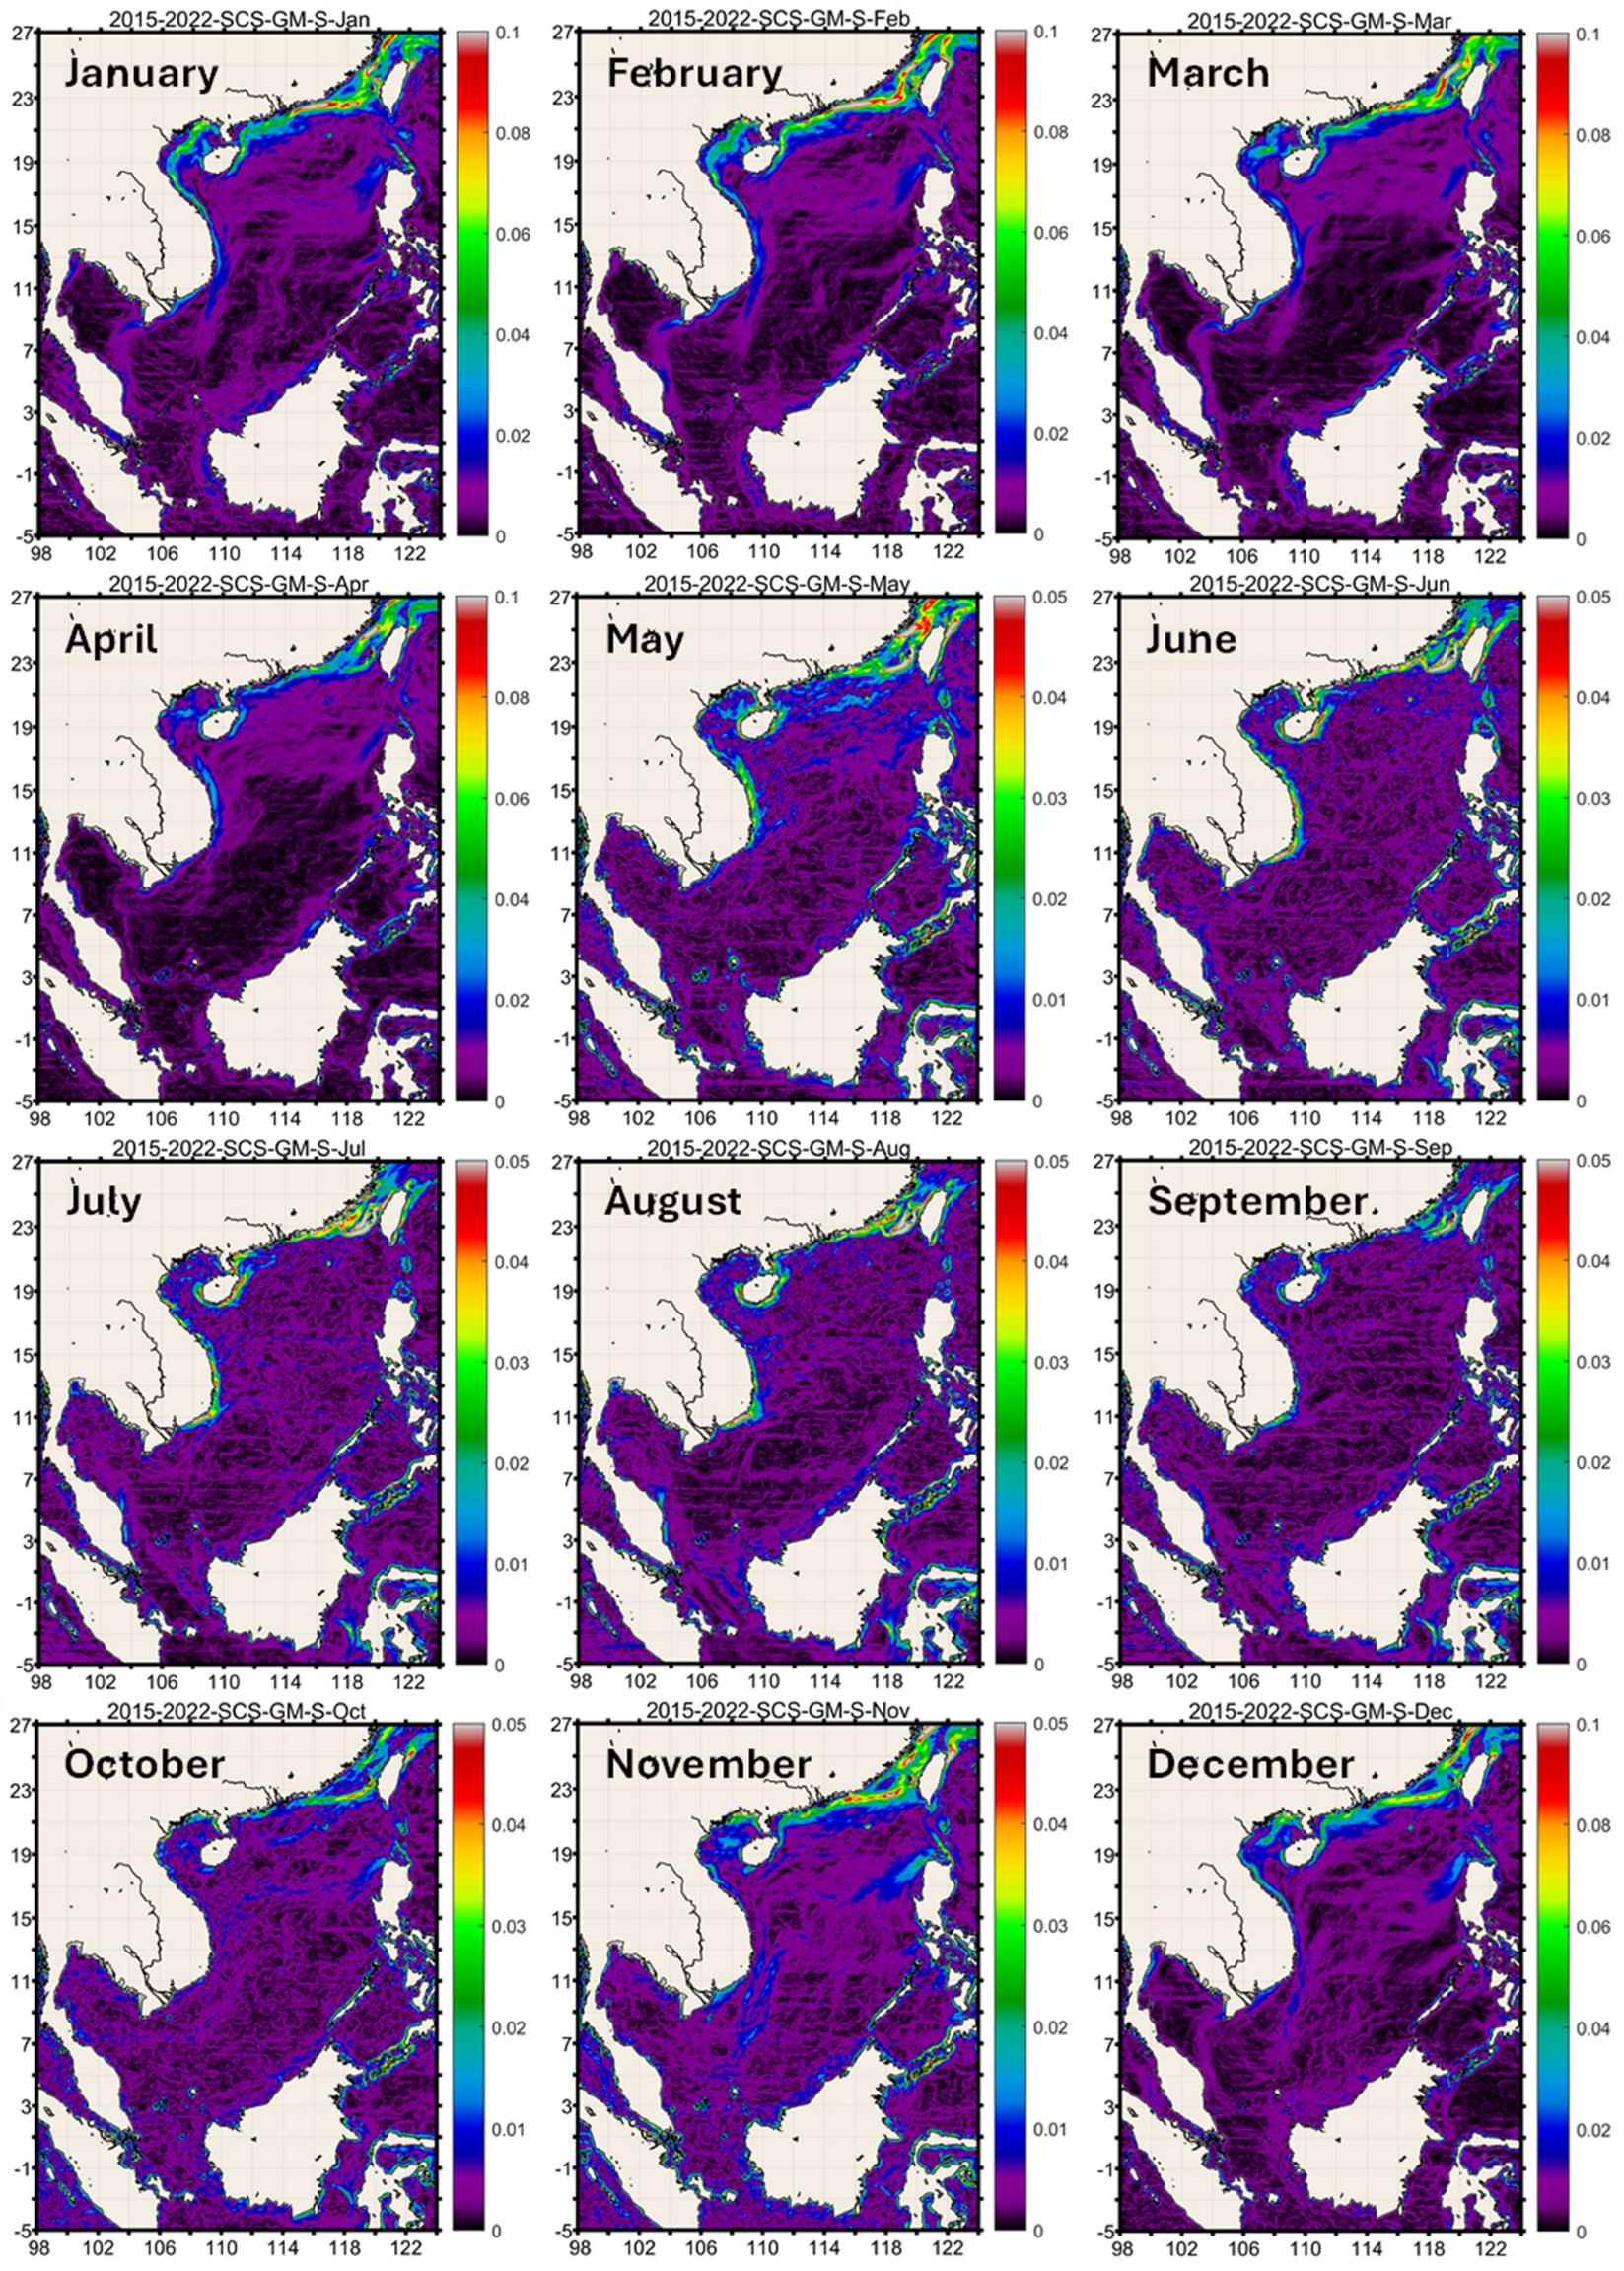
From late spring (May) to mid-summer (July), the seasonal warming trend reverses, and the SST decreases over large parts of the SCS. The cooling in June and July can be noticed in monthly maps of SST (Figure 1) despite the different color scales used in these maps. The custom color scales bring out subtle regional features but hinder month-to-month comparisons. Nonetheless, the contrast between May and June–July is too stark to be missed. To quantify the magnitude of the early summer cooling, we computed area-averaged long-term (2016–2022) mean monthly SST in three areas, where the early summer cooling appears most pronounced: (1) west of Luzon Island (12–15°N, 115–120°E); (2) central SCS (6–12°N, 110–115°E); (3) Gulf of Thailand (6–14°N, 99–105°E). The results in Table 1 show that in all three regions, the cooling occurred in June–July, and the cooling magnitude (difference between SST in May and July) was 0.70, 1.07, and 1.08 °C, respectively.
Our results are generally consistent with Qu (2001) [30], who used historical SST data and noted the dramatic warming in April/May, when the SST increase rate exceeded 2.0 °C/month. The early summer cooling can be explained by evaporative cooling (Wyrtki, 1961 [31]; Qu, 2001 [30]) or, alternatively, by coastal upwelling off SE Vietnam driven by the summer southwesterlies (Xie et al., 2003) [32]. Our monthly SST maps show that the coastal upwelling off SE Vietnam reaches its maximum intensity in August (see also Xie et al., 2003, Figure 3) [32], which is too late for this upwelling to be the main cause of the rapid cooling observed across the SCS in early summer (Table 1). Therefore, evaporative cooling appears to be the principal driver of the rapid cooling in June–July. Also, the rapid decrease of SST in the Gulf of Thailand cannot be explained by either the remote upwelling off SE Vietnam or by the much smaller and weaker upwelling along the east coast of Peninsular Malaysia (ECPM), even when the upwelling is augmented by advection of colder water from the Java Sea, because the local cooling is confined to a limited area off the ECPM (Kok et al., 2022) [33].

4.2. SST Gradients

We processed monthly maps of SST with the BOA algorithm (Belkin and O’Reilly, 2009) [25], which generates two scalar components of vector gradients of SST, namely gradient magnitude GM and gradient direction GD. Maps of GD can be quite useful for the detection of fronts with seasonally reversing cross-frontal SST gradients (Belkin, Cornillon, Sherman, 2009) [3] as, e.g., the Jiangsu Front (Subei Shoal Front) in the Yellow Sea (Hickox et al., 2000) [4]. In this paper, we presented and analyzed monthly maps of GM only (Figure 2).
January: In winter, the NE monsoon winds drive the southward advection of cold water from the ECS to the northern SCS, then westward along the Guangdong Shelf toward the Leizhou Peninsula, into the Qiongzhou Strait (and eventually into the Beibu Gulf), and toward eastern Hainan. The Western Beibu Gulf Front extends southward and continues as the Vietnam Coastal Current Front. The Mekong Outflow Front extends WSW along the coast. The Gulf of Thailand Entrance Front (GOTF) is developed off Cape Camau. The Kuroshio Front in the Luzon Strait trends SE–NW across the Babuyan Islands. The West Luzon Front persists as a broad NE–SW high-gradient zone west and northwest of Luzon Island. Submesoscale fronts are developed west and northwest of Borneo Island. High-gradient inshore fronts are observed along the entire east coast of the GOT from Cape Camau (9°N) in the south to the Upper GOT’s apex (13.5°N) in the north. The southward Vietnam Coastal Current/Front separates from the Vietnam coast at 11°N and continues SSW along a steep slope of the Sunda Shelf. This southward extension is integrated into a broader cold tongue driven southward by the NE monsoon winds.
February: The CCF is at the peak of its strength and intensity, extending all the way to the eastern Hainan Island and along Hainan’s SE coast. The Western Beibu Gulf Front, albeit weakened, still dominates the gulf. The Mekong Outflow Front propagates WSW along the Camau Peninsula. Fronts are developed NW of Borneo Island. The GOTF reaches its peak of strength and intensity.
March: The East Leizhou Peninsula Front emerges east of the Peninsula. This front persists through September. The Western Beibu Gulf Front is weakened and connected to the Vietnam Coastal Front. The NW Borneo fronts now extend along the entire length of the NW coast of Borneo except for the Kuching Bay (Sarawak, East Malaysia) south of 3°N.
April: The GOTF disappears. The Mekong Outflow Front is very weak. The submesoscale fronts off the NW coast of Borneo disappear except for a small area in the extreme north (5°N–7°N, north of Brunei and west of Sabah).
May: The West Palawan Coastal Front emerges to persist through November, extending from the Balabac Strait (~8°N) south of Palawan up to the Mindoro Strait (12.5°N) north of Palawan. Submesoscale fronts emerge around islands of the Sunda Shelf, particularly the Natuna Islands and smaller islands located SSE and WSW of the Natuna Islands. Submesoscale fronts are well developed around all islands in the Luzon Strait, particularly around the Babuyan and Batanes Islands. The Batanes Islands Front persists year-round, while the Babuyan Islands Front gradually weakens over summer and fall. The shelf break front in the northern SCS emerges in May along ~20°N yet disappears in June. A submesoscale front develops along the eastern shore of the Kuching Bay (Sarawak, Malaysia).
June: Nearshore fronts around the GOT are strong along the east coast and weak along the west coast. There is no trace of the Mekong Outflow Front. The Kuching Front (Sarawak) weakens. The Palawan Front weakens slightly. Coastal fronts spread around the Beibu Gulf. Fronts around the Babuyan and Batanes Islands persist. Well-developed fronts are observed off the west, south, and east coasts of Hainan Island.
July: Submesoscale coastal fronts emerge east of Peninsular Malaysia between 3°N and 6°N. The summertime eastward jet (SEJ) develops east of the 11°N upwelling center off SE Vietnam. The Palawan Front weakens. The Kuching Front weakens. Fronts around the islands of the Natuna Sea (Sunda Shelf) are no longer detectable.
August: The Babuyan Islands Front is weakened but still detectable. A strong upwelling front exists off SE Vietnam, near ~11°N. Fronts off Borneo and Palawan almost disappear. Coastal fronts around the Beibu Gulf are weak but detectable.
September: The Babuyan Islands Front disappears. The East Leizhou Peninsula Front still persists.
October: The West Luzon Front emerges. The Babuyan Islands Front is still detectable (the last month). The East Leizhou Peninsula Front disappears.
November: The quasi-meridional Cold Tongue flanked by two fronts emerges off SE Vietnam. The Batanes Islands Front is still detectable (the last month).
December: In the southern SCS, most fronts disappear except for nearshore fronts in the northwestern GOT (weak fronts) and northeastern GOT (strong fronts). The Western Beibu Gulf Front strengthens. The Vietnam Coastal Front strengthens.

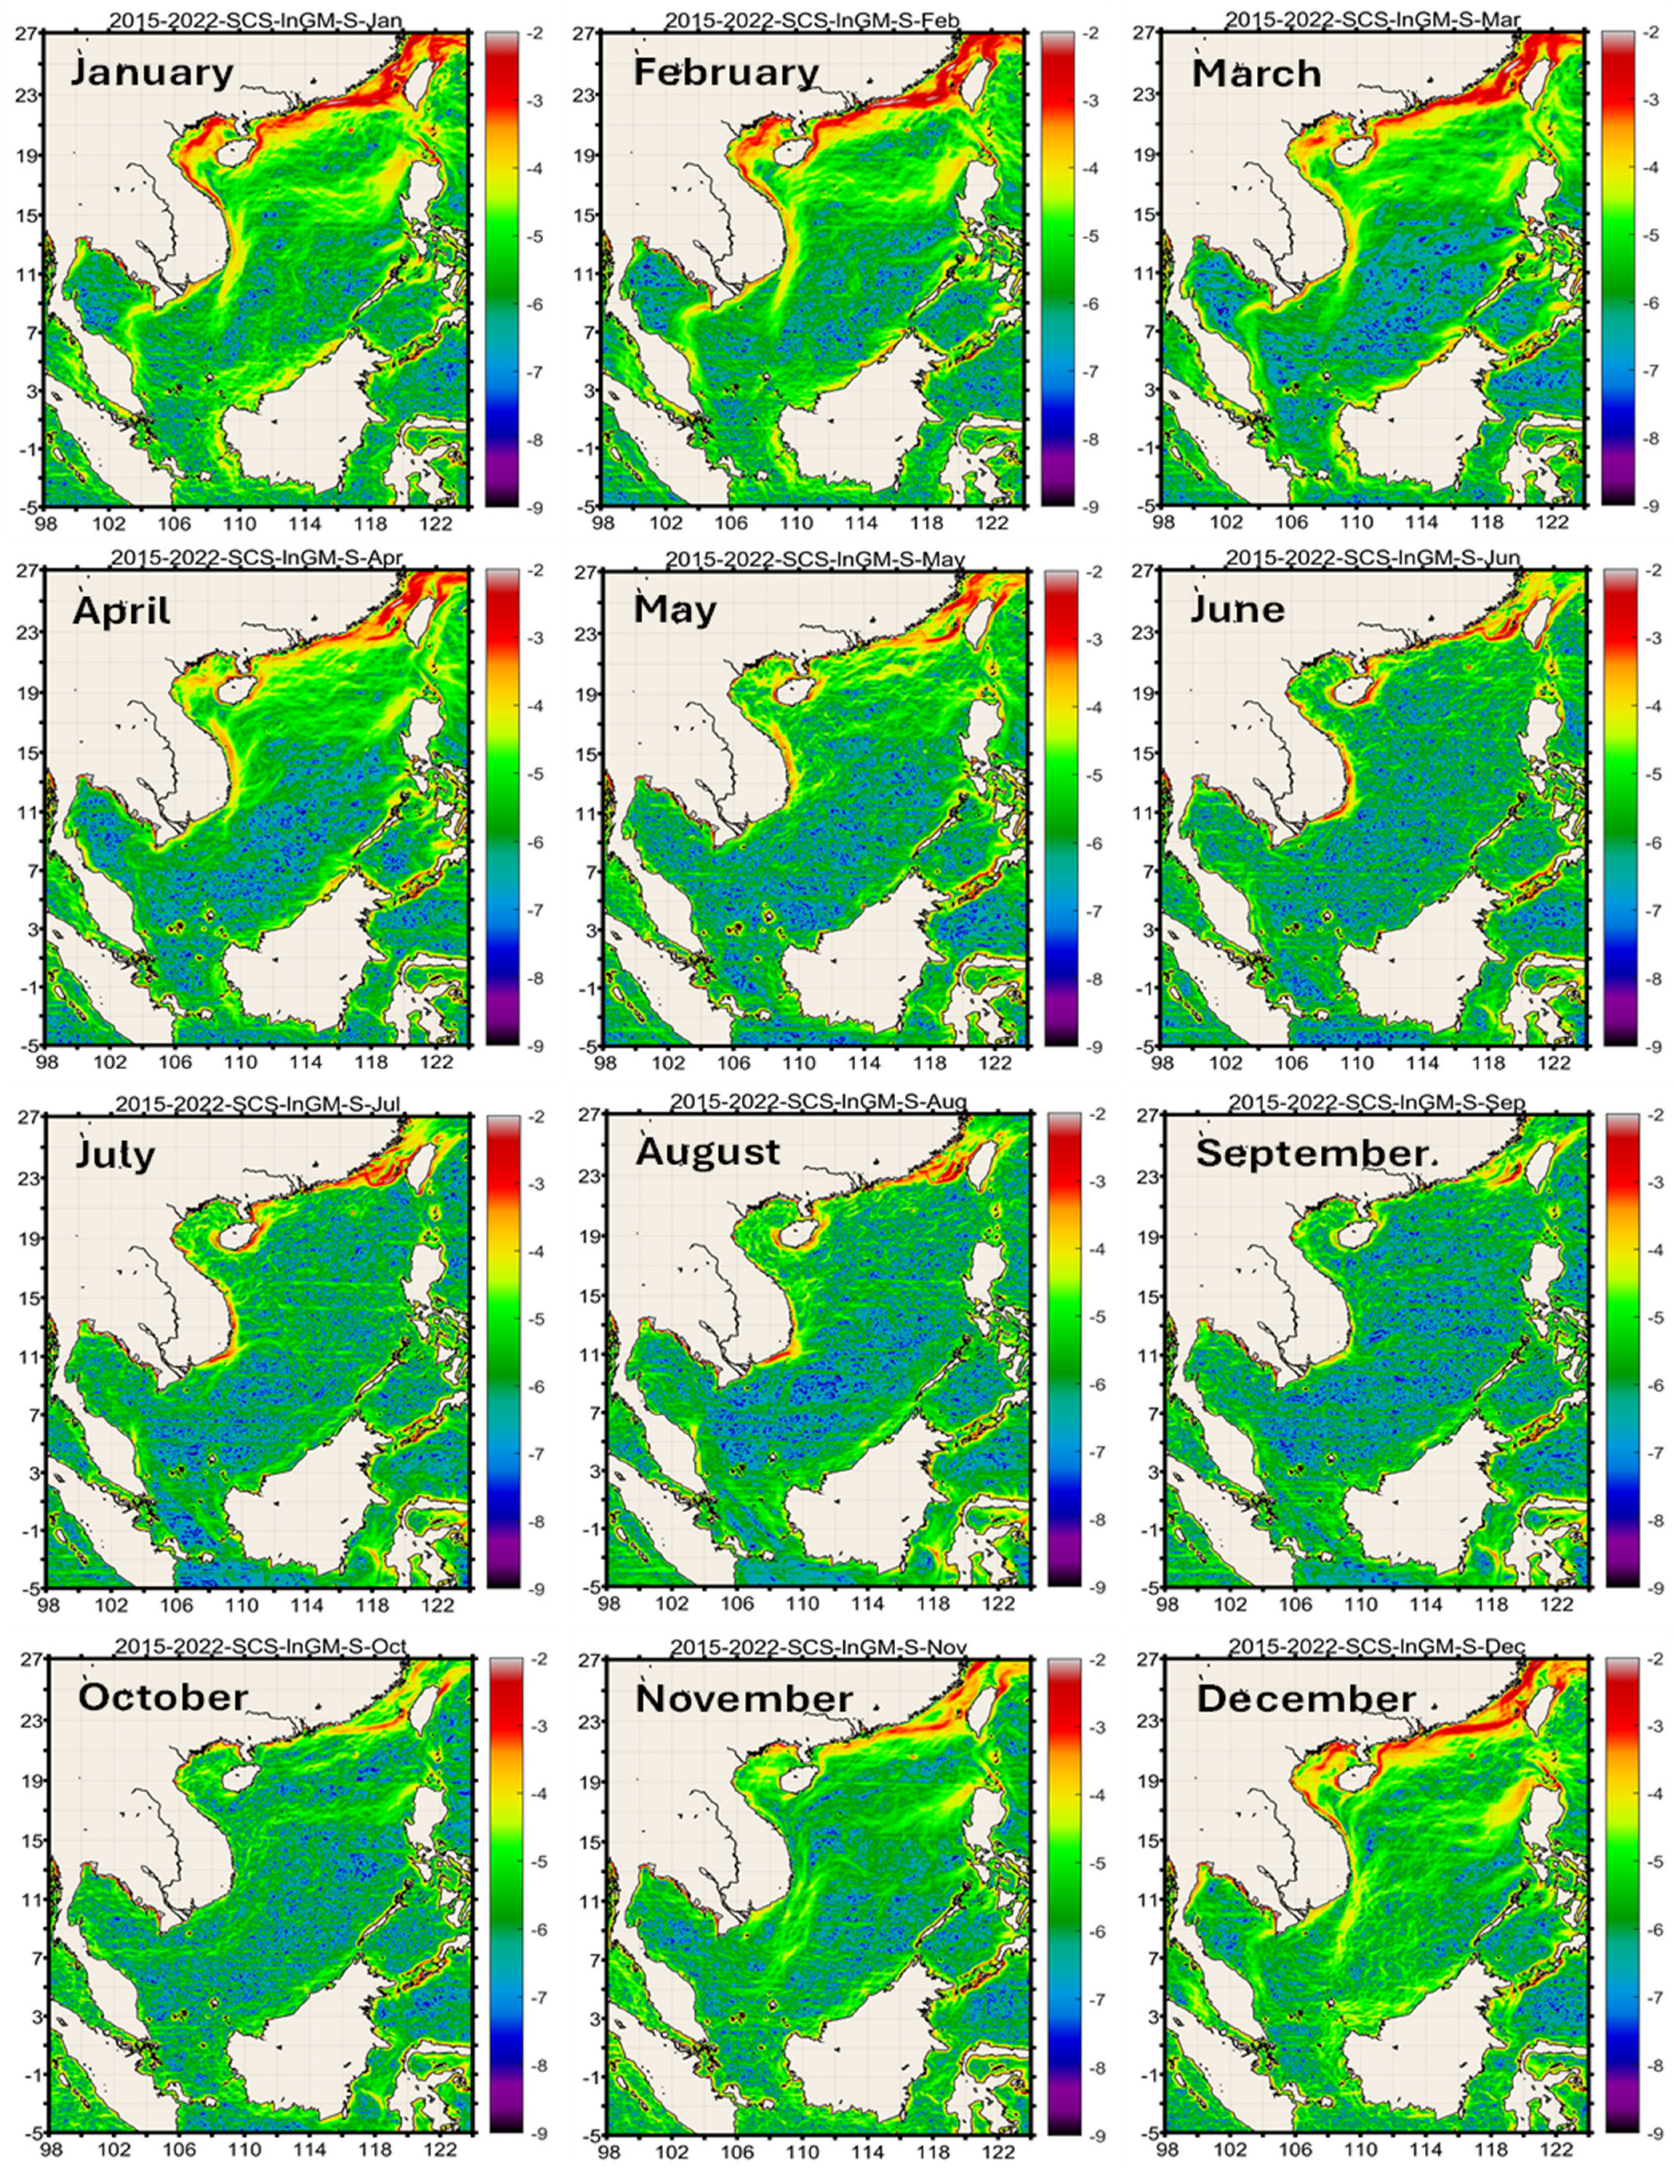
4.3. Log-Transformed Gradient of SST

Log-transformation of SST gradient magnitude GM enhances contrasts in digital maps of GM. The monthly maps of log-transformed GM (Figure 3) reveal numerous moderate and weak fronts that do not manifest in the respective monthly maps of GM. The description below is focused on a few features that are revealed by the maps of log-transformed gradient magnitude ln(GM). This approach allowed a multitude of moderate and moderate-to-weak fronts to be visualized and their spatiotemporal variability to be quantified and studied. Since all types of fronts are known to play important roles in marine ecosystems, an integral impact of numerous moderate and weak fronts might be significant. In the absence of quantitative estimates of such an impact, we can only hypothesize that the magnitude of the integral ecological impact of moderate and weak fronts can be comparable to the magnitude of the ecological impact of major large-scale fronts.
January: The extremely wide frontal zone occupies the entire northern SCS north of ~15°N. The Vietnam Coastal Front separates from the Vietnam coast at ~11°N and extends SSW along the steep slope of the Sunda Shelf down to 7°N. This front is the western edge of the cold tongue. The Kuroshio Current can be distinguished east and northeast of Luzon Island as a narrow band of low ln(GM) between two high-gradient bands (fronts). Two fronts are observed west of Borneo Island, south of the Equator.
February: The Vietnam Coastal Front and its extension as the Sunda Slope Front are strong. The Kuroshio Current and two fronts that border the current are clearly distinguishable. The dual fronts west of Borneo Island persist.
March: The Vietnam Coastal Front and Sunda Slope Front are strong. The dual West Borneo fronts persist.
April: The Sunda Slope Front disappears completely. The West Borneo fronts almost disappear. The broad frontal zone in the northern SCS persists north of 16°N.
May: The only strong fronts left in the SCS are the Taiwan Bank Front and Vietnam Coastal Front. All other fronts disappear.
June: The CCF reappears as an upwelling front, with the coastal upwelling off the eastern Guangdong driven by the SW monsoon winds. The Taiwan Bank Front is strong, maintained by the wind-induced upwelling. The 11°N upwelling center off SE Vietnam is well developed. The broad frontal zone north of 16°N is gone.
July: The coastal front northwest of Borneo Island extends along the entire NW coast of Borneo.
August: The Beibu Gulf is devoid of fronts. Strong fronts are observed around the Taiwan Bank, off the Fujian Coast, around Hainan Island, and off the 11°N upwelling center.
September: The Taiwan Bank front remains strong.
October: The only strong fronts are the 20°N shelf break front and the 16°N front in the central SCS.
November: The cold tongue bordered by two fronts is strong as it extends southward down to 7°N.
December: Two fronts in the western Beibu Gulf are observed.

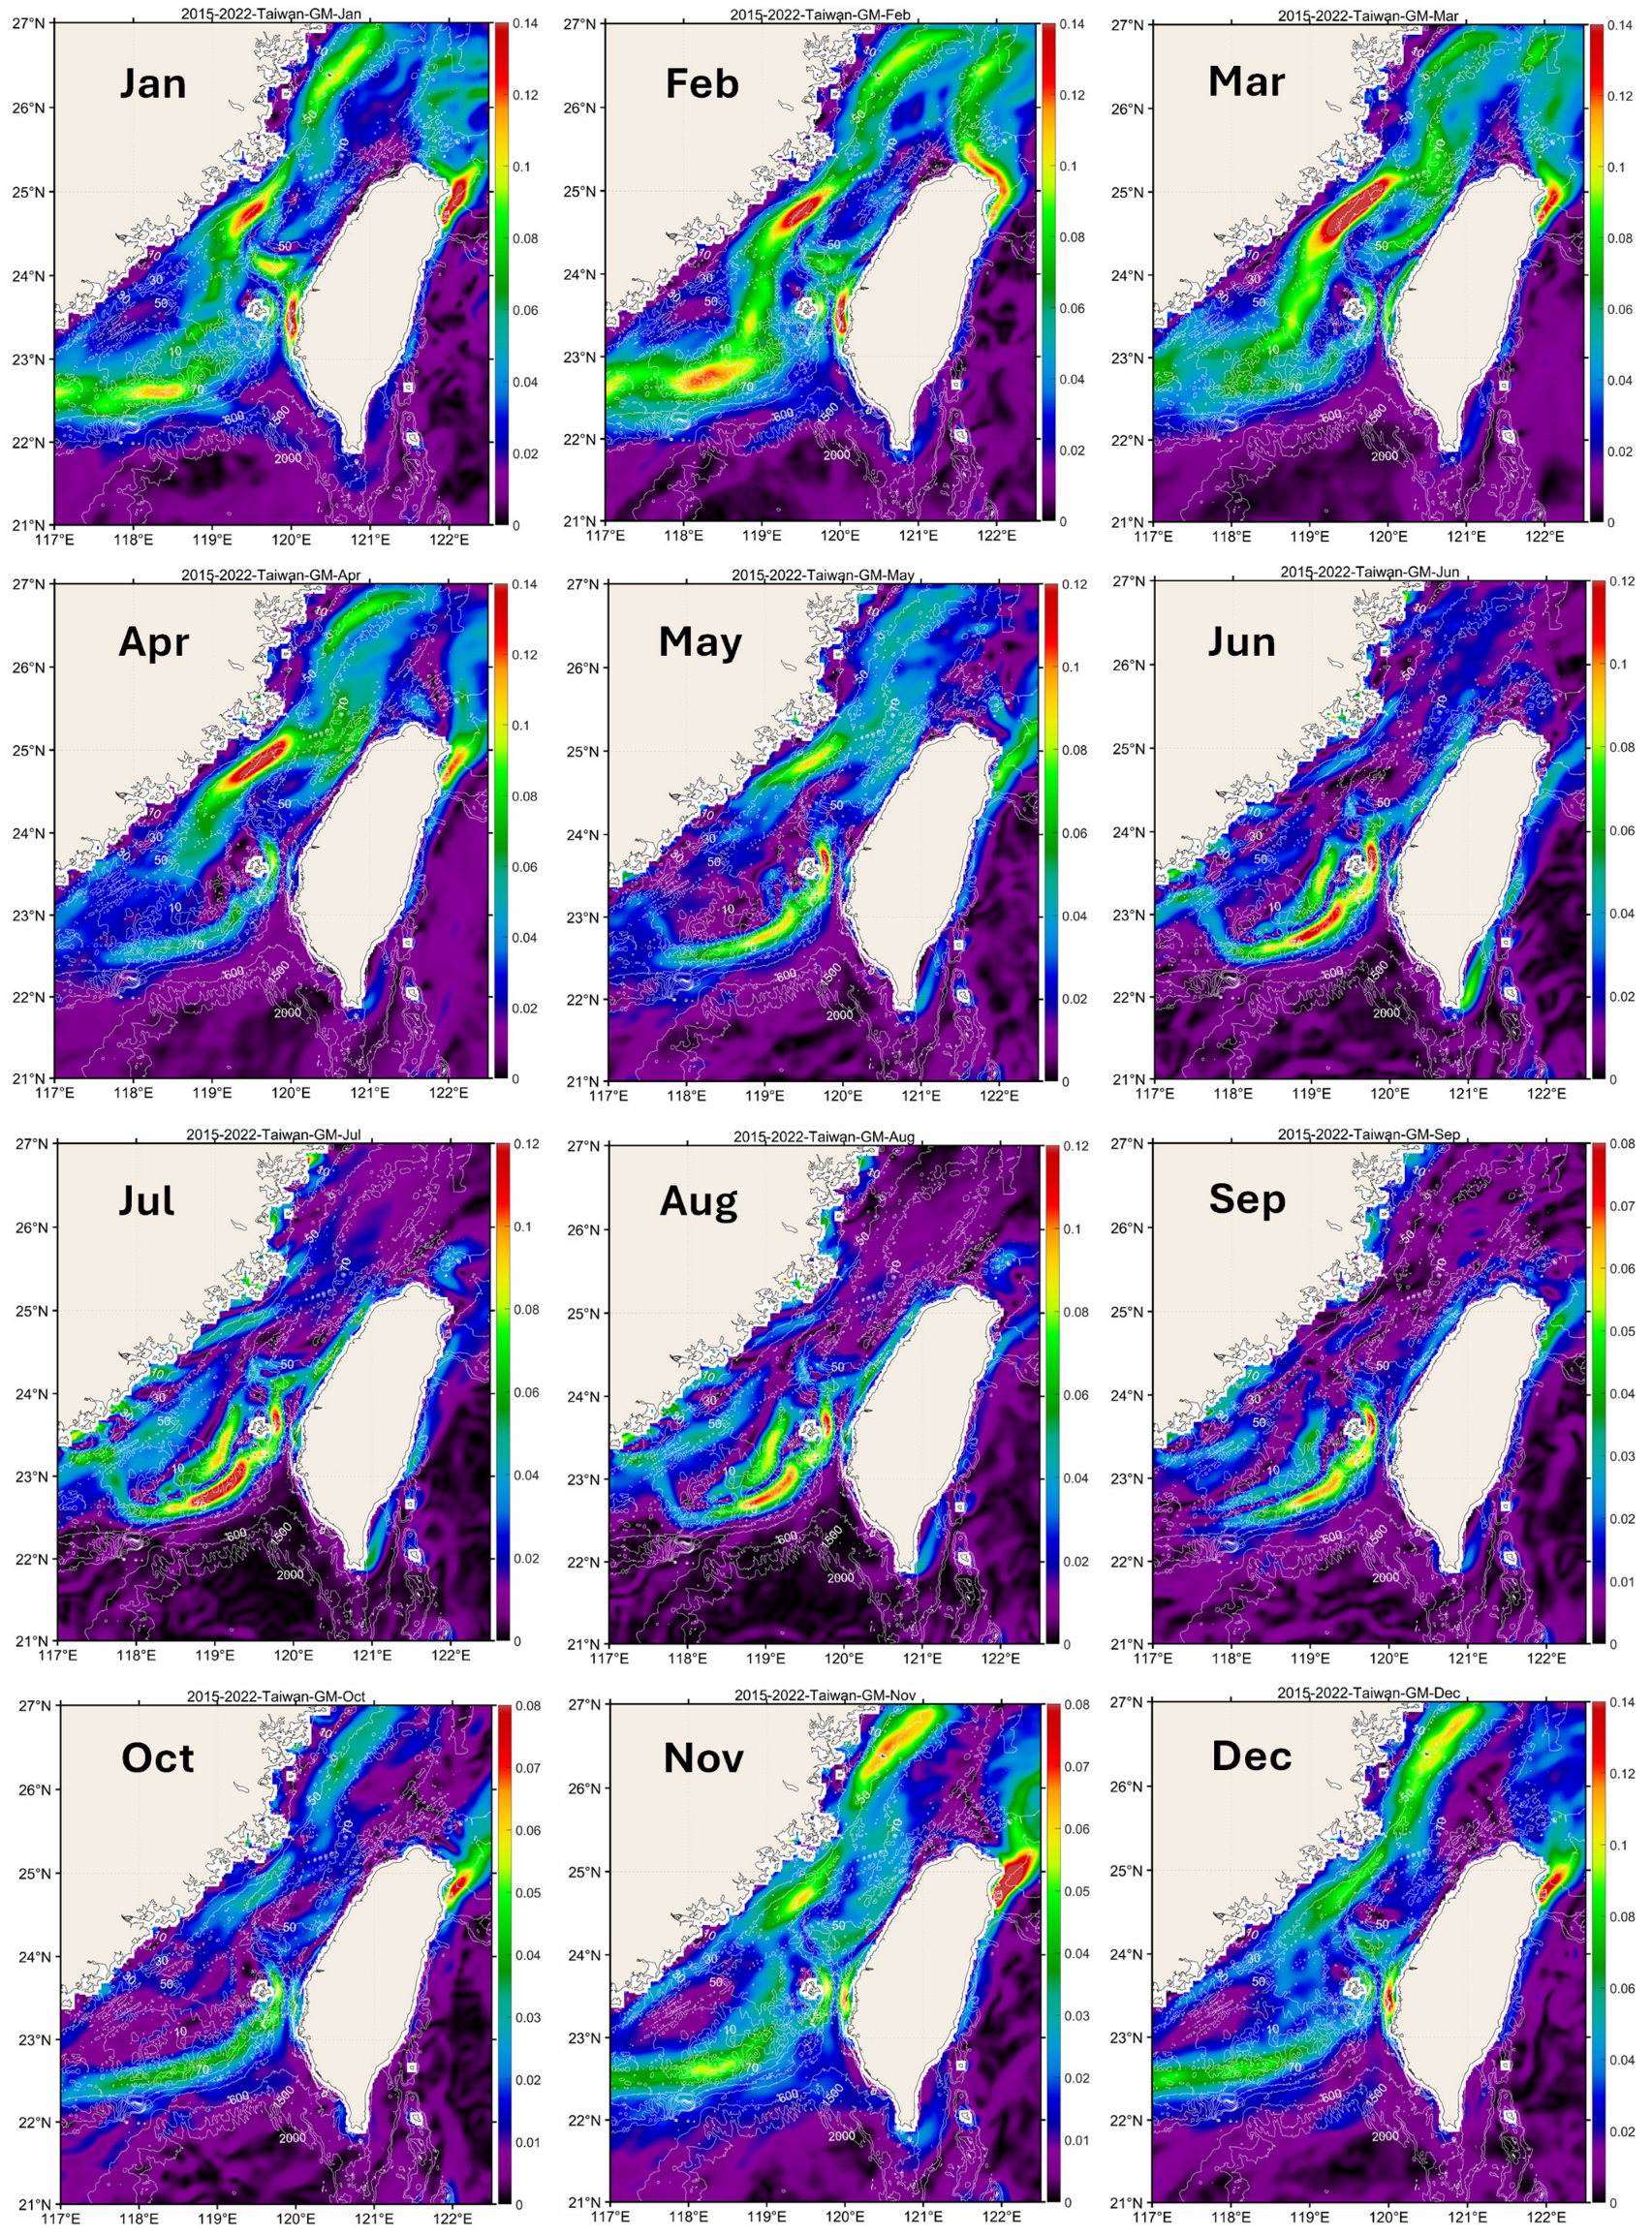
4.4. Region 1: Taiwan Strait

Figure 4 shows monthly maps of SST over bathymetry that plays a major role in this region by steering currents and fronts. The Taiwan Strait features strong and diverse fronts owing to the advection and confluence of contrasting water masses from the north and south and also owing to the monsoon wind-driven coastal upwelling. The frontal pattern here changes dramatically on the seasonal and monthly scales. During winter, the China Coastal Front (CCF) is at its maximum strength off the coast of Fujian, centered slightly south of 25°N, reaching its maximum intensity (up to 0.14 °C/km) in late winter/early spring (March–April). The CCF intensity is sharply reduced in May. The Taiwan Bank Front (TBF) located along the southern flank of the bank is present almost year-round except in March. The TBF is best developed in summer (June–September), reaching its maximum strength, intensity, and spatial extent in July. Other fronts in the Taiwan Strait are smaller than the CCF and TBF. Nonetheless, these fronts are ecologically important as they define habitats of fish, squid, etc. These mesoscale-to-submesoscale fronts are relatively stable as they are steered by the rugged bathymetry of the Taiwan Strait. The quasi-zonal front along the Changyun Ridge is distinct in December–February, best developed in January, centered at 119.7°E, slightly north of 24°N, across the Penghu Channel from the Penghu Islands. We predict this front’s intensity to peak along the SW flank of the Changyun Ridge, where the ridge’s slope is the steepest, and the bathymetric cross-slope gradient is at maximum. We called this feature the Changyun Ridge Front (CYRF). The local topography of the eastern Taiwan Strait steers a quasi-meridional front along 120°E off Taiwan’s west coast and over a steep submarine slope facing the Penghu Channel. This feature (we called it the East Penghu Channel Front, EPCF) is distinct in December–February, being best developed in January–February. The smallest front in this area is located east and NE of the Penghu Islands, over the steep submarine slope facing the Penghu Channel. This front is found at the same location year-round, being best developed in May–September. We called it the Eastern Penghu Islands Front (EPIF). Another front is located west of the Penghu Islands, distinct in June–September and best developed in July–August. We called it the Western Penghu Islands Front (WPIF). Thus, within a relatively small Region 1, we identified six seasonally persistent, quasi-stationary mesoscale/submesoscale fronts, namely CCF, TBF, CYRF, EPCF, EPIF, and WPIF. Transient fronts created by the Kuroshio intrusions into the SCS via the Luzon Strait are left outside the scope of this study.

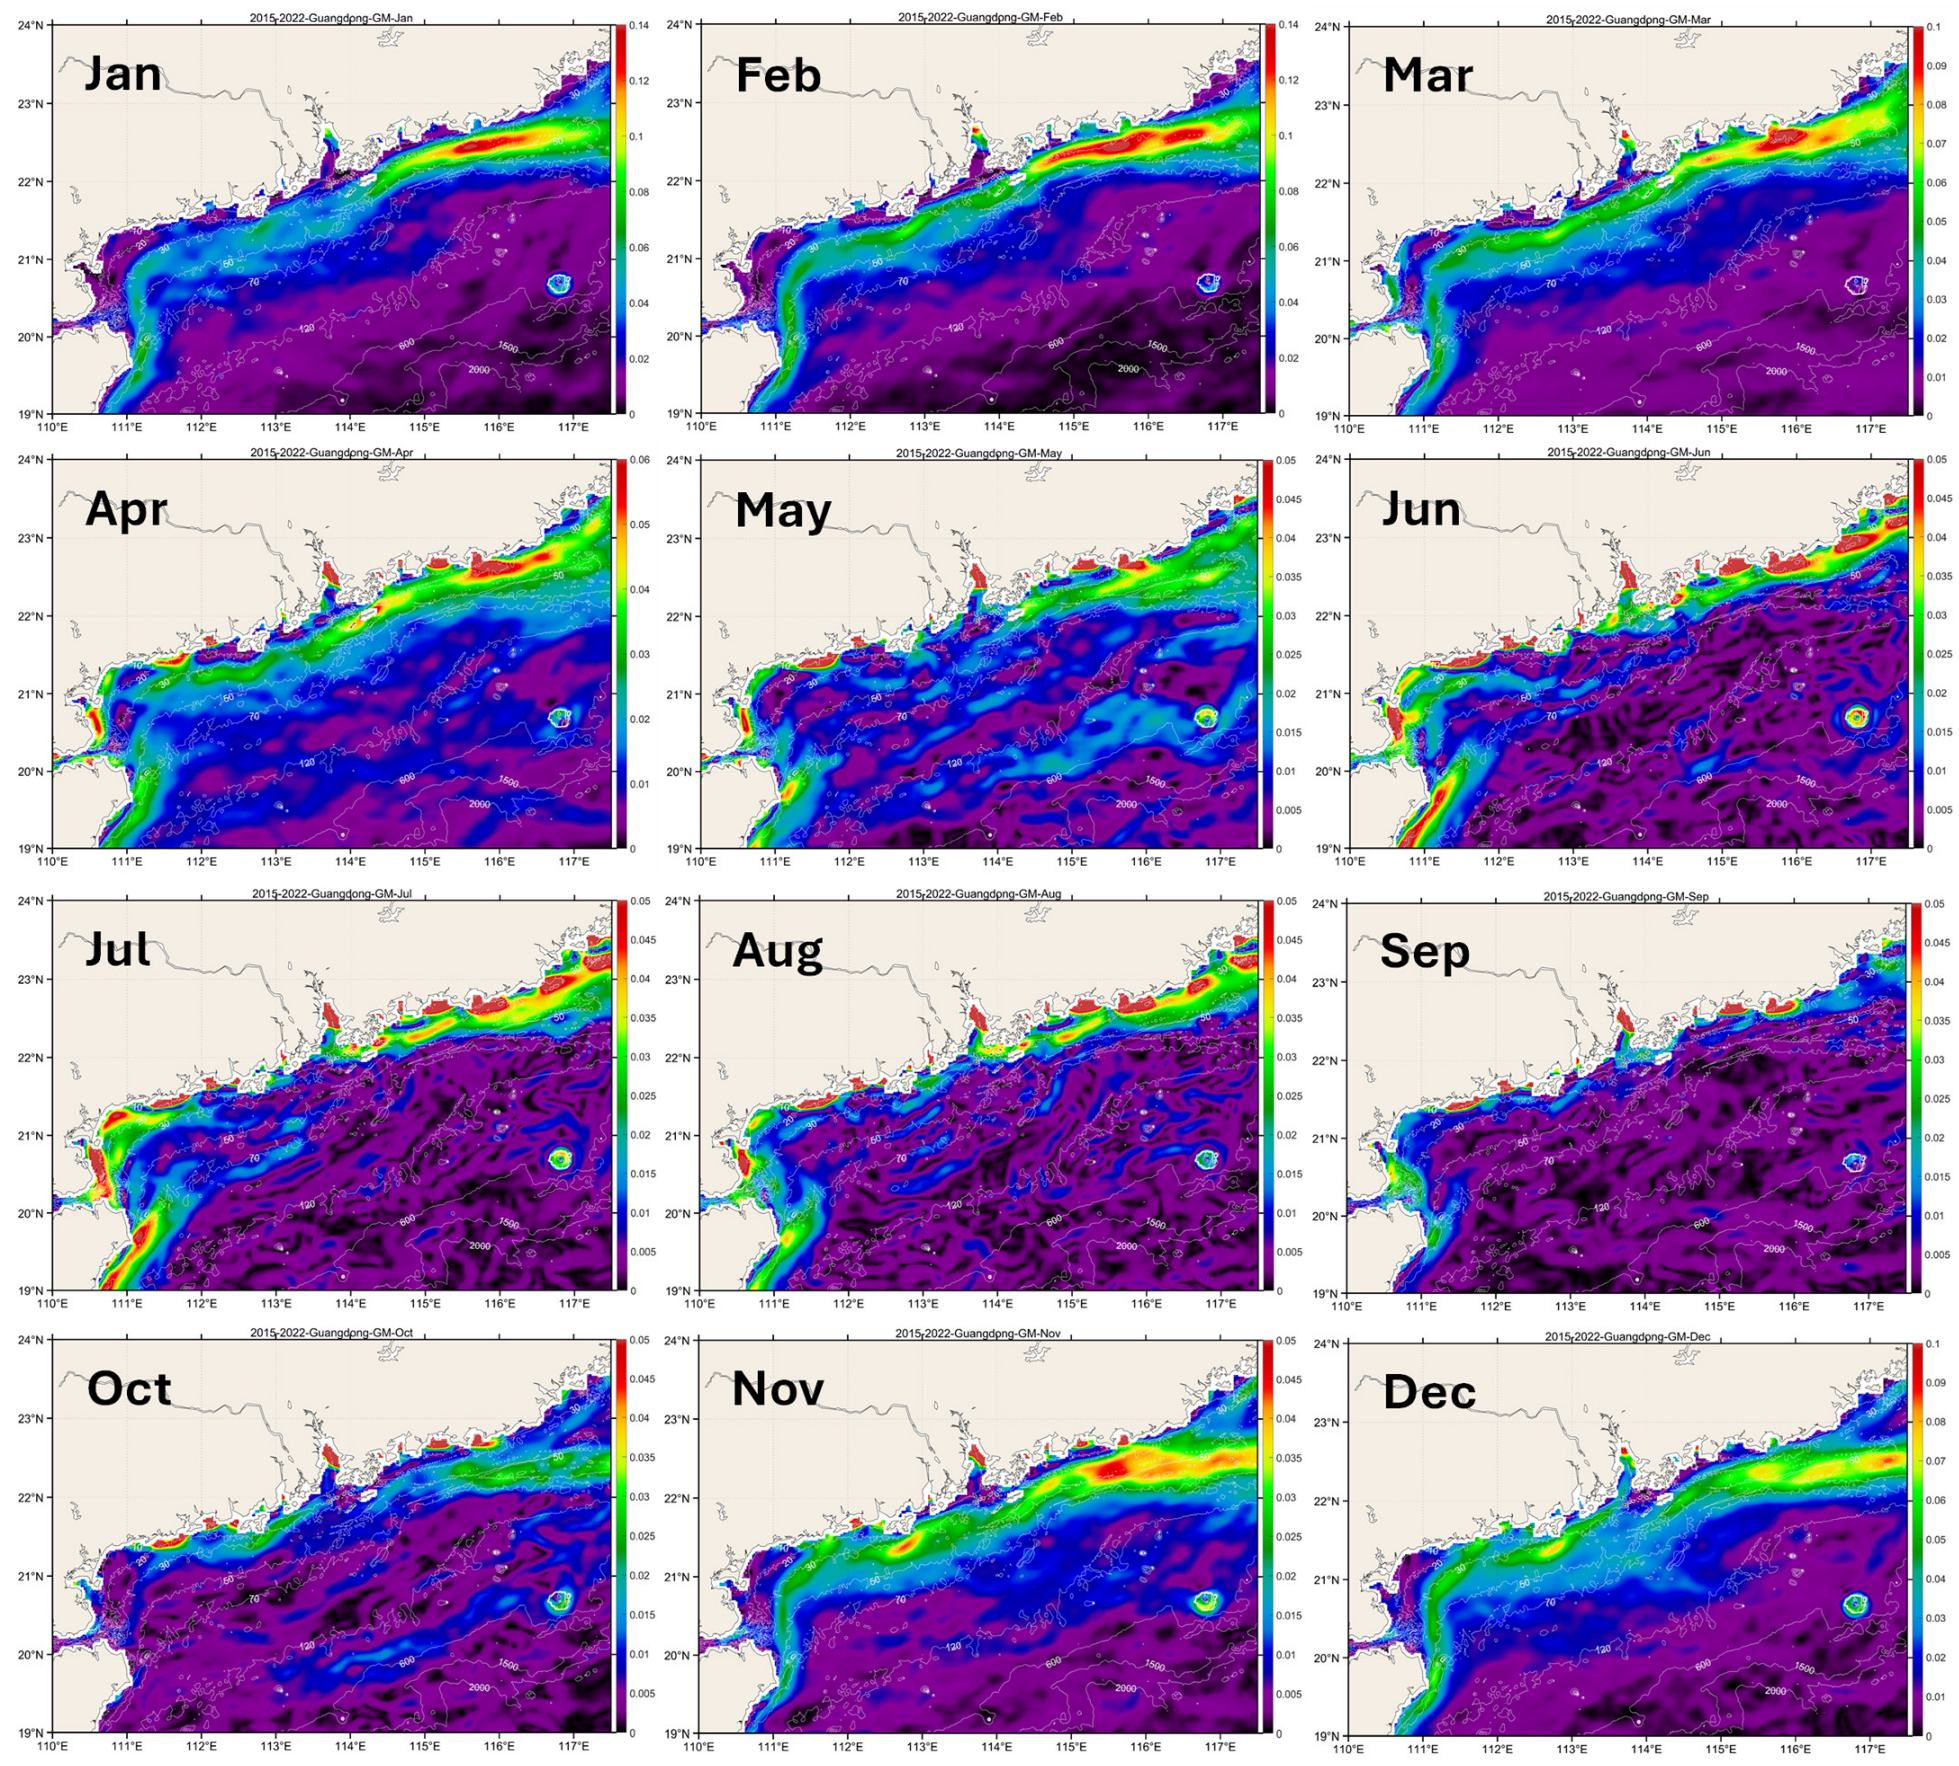
4.5. Region 2: Guangdong Shelf

Figure 5 shows monthly maps of SST in Region 2 Guangdong Shelf (GDS). The frontal pattern of GDS is dominated by the China Coastal Front (CCF). The spatial and seasonal variability of CCF in the northern SCS was documented by Belkin et al. (2024) [23]. In winter, when the CCF dominates the eastern GDS from October through April, the CCF is a water mass convergence front created by the advection of cold waters from the East China Sea with the China Coastal Current. The CCF is traced down to Hainan Island, with the CCF strength and intensity decreasing westward (Belkin et al., 2024) [23]. In summer, from May through September, the SW monsoon winds drive coastal upwelling off the Guangdong Coast, so the CCF becomes an upwelling front. In winter, the CCF is traced reliably across the entire GDS, whereas in summer the CCF is barely detectable in the west.

4.6. Region 3: Hainan Island and Beibu Gulf

Figure 6 shows monthly maps of GM that feature a variety of fronts around Hainan Island and Beibu Gulf (Gulf of Tonkin). The diverse population of fronts in this region is created by various processes such as the advection of water masses from the northern SCS via the Qiongzhou Strait, riverine water outflow (mostly by the Red River), monsoon wind-driven coastal upwelling, topographic upwelling, and tidal mixing. The diversity of physical mechanisms in this region explains why adjacent fronts are sometimes created by different mechanisms, e.g., fronts off NE and SE Hainan (see the discussion below and in Section 5 of this paper and a discussion in Belkin et al. (2024) [23]).
Fronts off NE and SE Hainan have different origins and different seasonalities. The NE Hainan Front emerges in winter, being best developed in February. The SE Hainan Front emerges in summer, being best developed in June–July. The submesoscale front off the East Cape (the easternmost point of Hainan) persists year-round except October. Fronts off the east coast of Hainan have been studied intensely. The west coast fronts were not studied in detail. Therefore, the summertime arc-shaped front that skirts the entire west coast seems to be a novel feature that has never been reported before. In June–September this front’s shape morphs into an asymmetrical horseshoe consisting of two fronts, a short coastal (nearshore) front and a much longer offshore front extending along a quarter of Hainan’s circumference, from Hainan’s westernmost point to its southernmost point. The dual-front pattern is best developed in July and especially in August, when two front centers (“cores”) with local maxima of GM are most apparent. The two cores are stacked up off the west coast at ~18.5–19°N, where these cores are collocated with giant submarine sand ridges (sand dunes; see Ma XC et al. (2024) [34] and references therein) that likely steer the fronts.
The Beibu Gulf features strong fronts in winter, while being devoid of fronts in summer. In winter, there are three fronts (in the north, west, and south) that are tenuously connected. The western front’s origin is likely related to the Red River outflow. The origin of the northern front (off the Guangxi Coast) is likely related to the winter cooling of the coastal water mass and formation of a tidal mixing front. The westward flow of colder waters from the western Guangdong Shelf via the Qiongzhou Strait into the Beibu Gulf contributes to the formation of the northern front off the Guangxi Coast. The Red River outflow extends southward along the Vietnam Coast, where the western front connects to the southern front, which continues farther south as the Vietnam Coastal Front. The southern front features a well-defined core of local maximum of GM off the 18°N promontory (cape). This submesoscale front (embedded in the large-scale Vietnam Coastal Front) is anchored by the local coastal and submarine topography. The 18°N front is best developed in winter, especially in January–February. In the middle of Beibu Gulf, an isolated local maximum of GM near 20°N, 108°E marks a submesoscale winter front, whose origin is unclear. The front has a short sub-seasonal life span as it peaks in March and quickly fades in April.

4.7. Region 4: Mekong River Outflow and Gulf of Thailand Entrance

Figure 7 shows monthly maps of GM in Region 4, which includes the area off SE Vietnam centered on the Mekong River outflow, an upwelling center at 11°N, and the Gulf of Thailand (GOT) entrance. In winter, the frontal pattern of this region includes the Vietnam Coastal Front, the broad quasi-meridional, high-gradient frontal zone associated with the cold tongue, a few submesoscale coastal/nearshore fronts associated with the Mekong River Outflow, the GOT Entrance Front (GOTF), and a high-gradient nearshore zone in the southeastern GOT. The GOTF persists in December–March and disappears in April. The Vietnam Coastal Front appears as a continuous feature in December–January. During the rest of the year, the Vietnam Coastal Front appears as a few disconnected (or tenuously connected) frontal segments. The local maximum of GM off the 13°N cape persists in January–September. This submesoscale front at times is embedded into the Vietnam Coastal Front. The location of this front is very close to the location of an upwelling center in the vicinity of the 13°N cape. Apparently, the local coastline and submarine bathymetry steer and anchor the front. Another major upwelling front is well developed in June–September near 11°N. This upwelling is the source of the summertime eastward jet (SEJ) (see Section 4.9). The Mekong River Outflow fronts are absent from June–October. These fronts emerge in November east of 107°E, spread westward along the coast in winter and fade in May.
The GOTF is extremely peculiar in that its strength and intensity peak right off Cape Camau and then sharply decrease alongfront over a short distance, then continue decreasing alongfront (first westward, then southward) as the front curves across the Gulf toward the Peninsular Malaysia. The unique peculiarity of the front is caused by the physiography of the area around Cape Camau. The rugged coastline and submarine topography of this area create conditions for the collision of two tidal systems coming from the Gulf and SCS (details are in Section 5 Discussion).

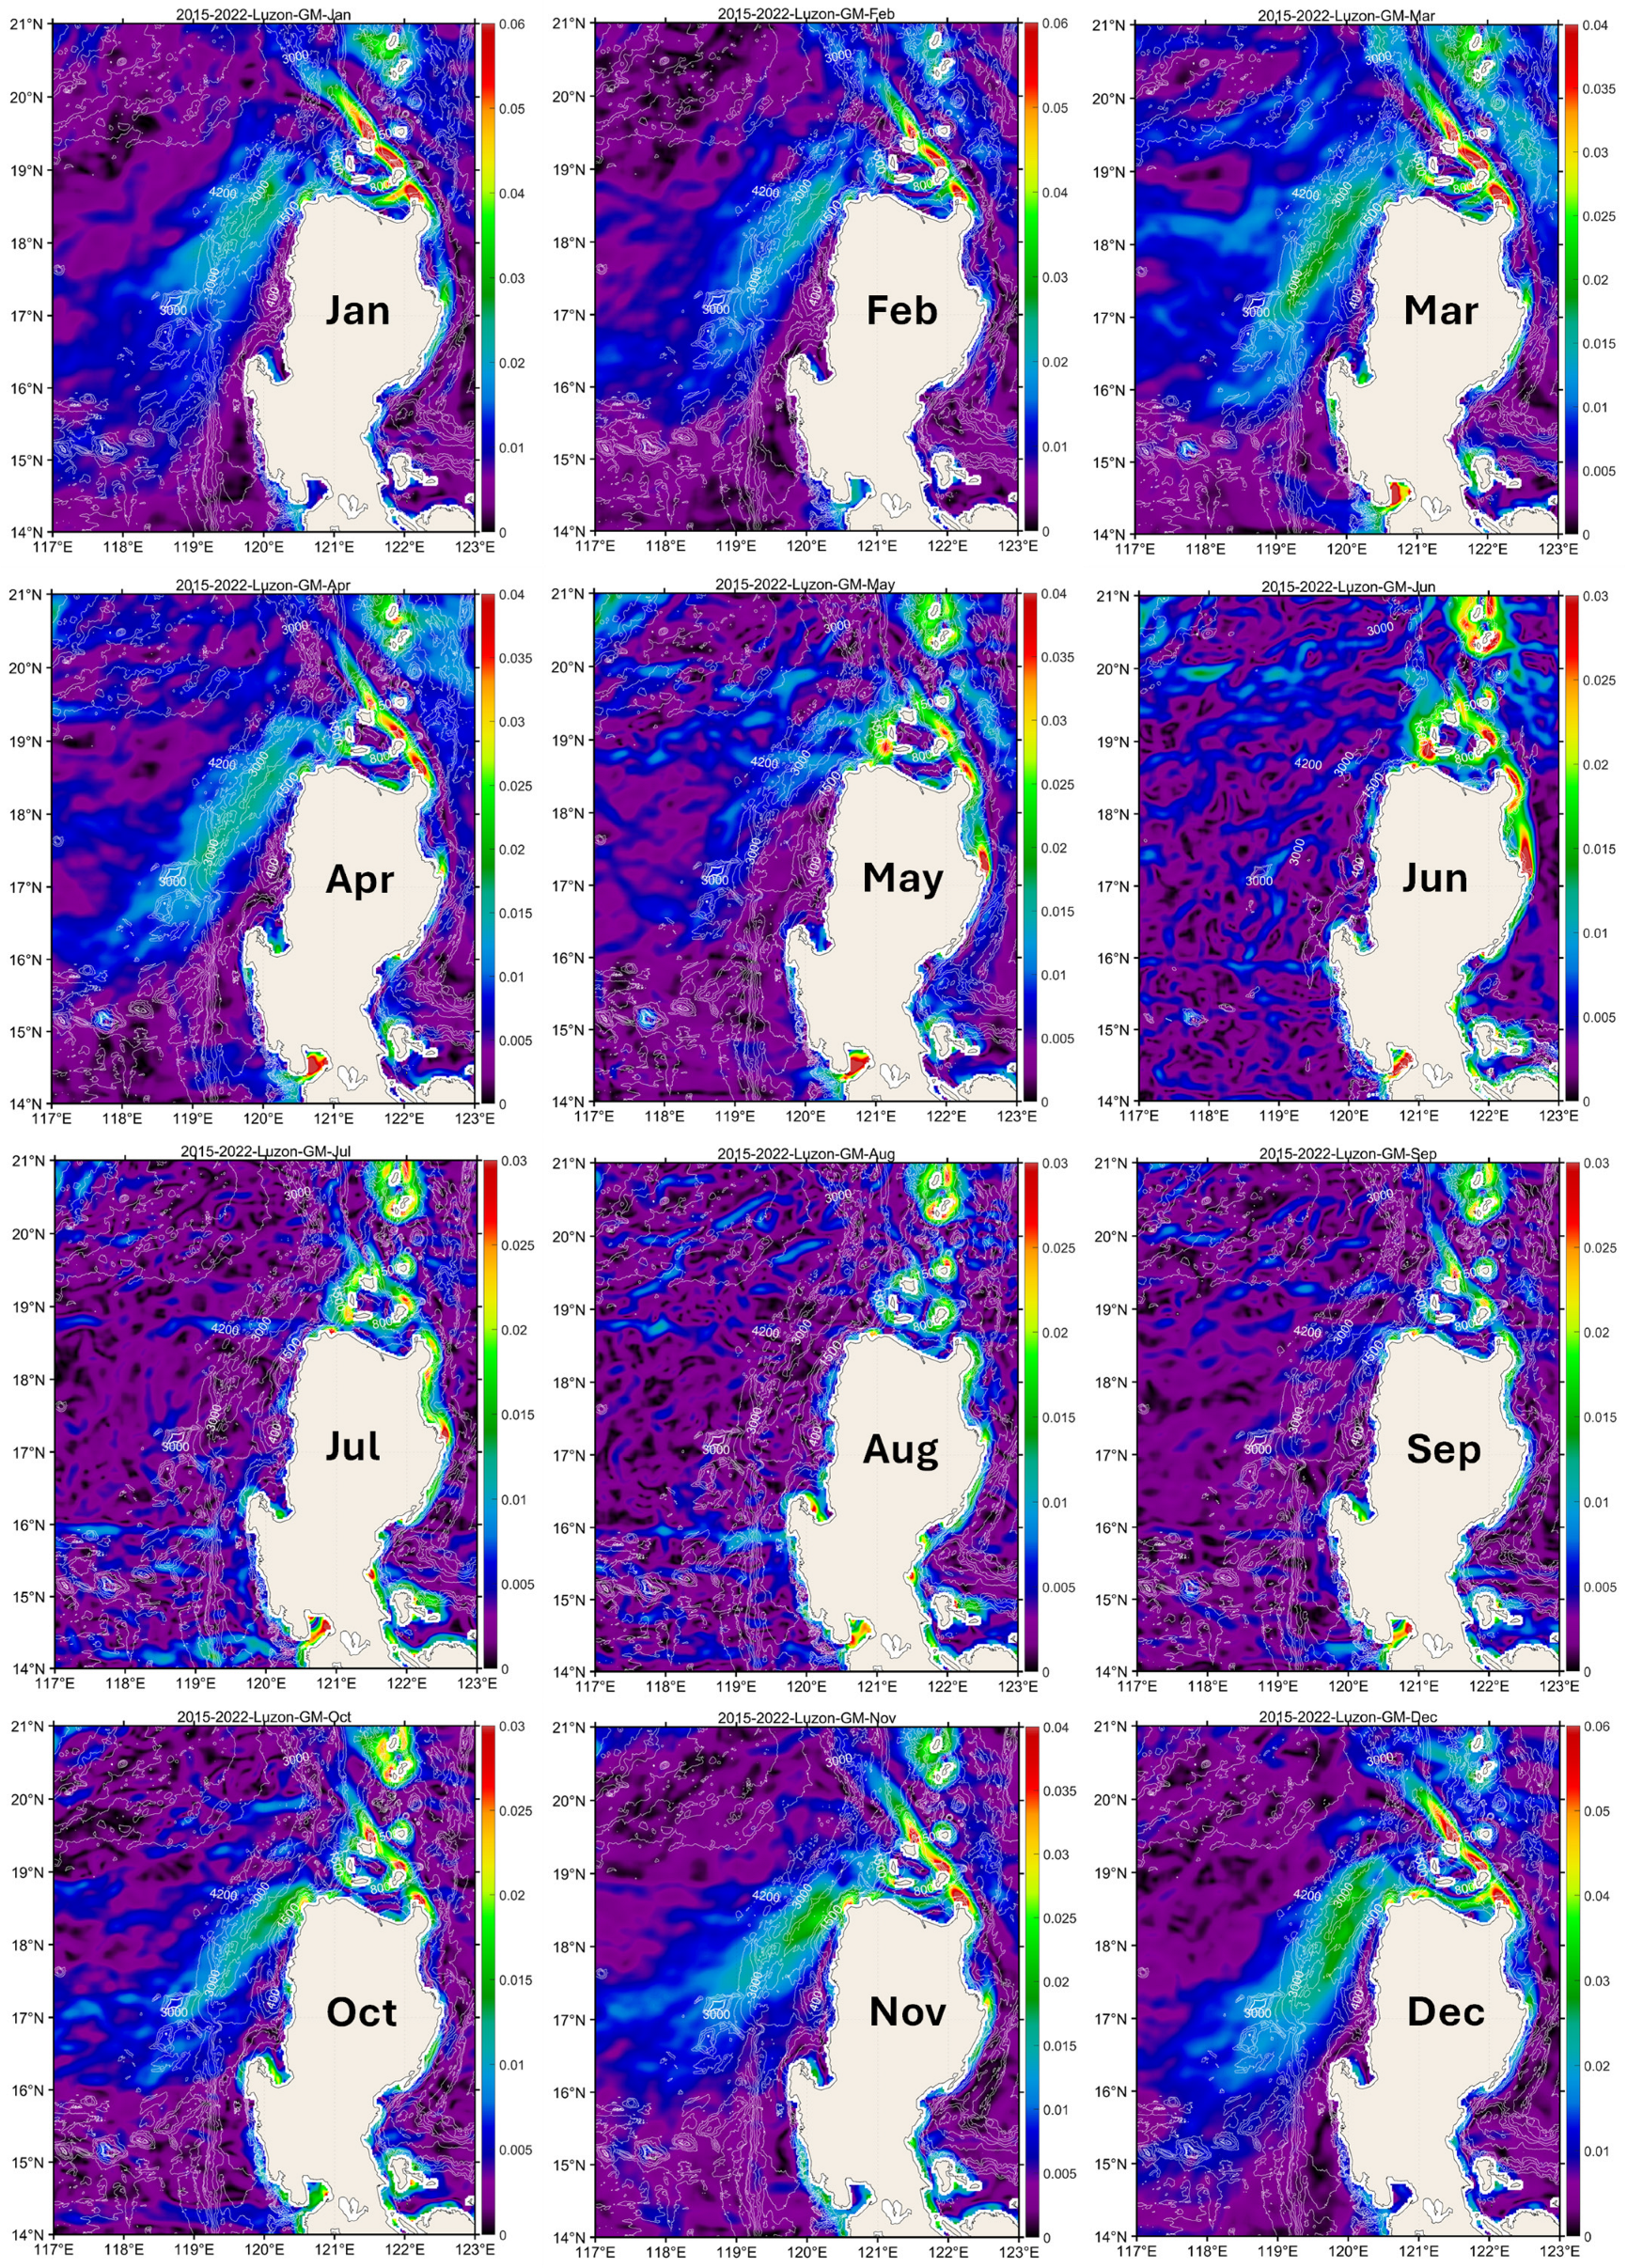
4.8. Region 5: Luzon Strait and West of Luzon

Figure 8 shows monthly maps of GM in Region 5, which covers the northeastern SCS, including the Luzon Strait. In winter, a chain of fronts in the Luzon Strait is observed from October through June, while being undetectable in July–September owing to the seasonally decreasing temperature contrast between the Philippine Sea and SCS in summer. This chain of fronts runs NNW from Cape Engaño (18°34′42″N, 122°08′28″E; the northern point of Palaui Island off the northeastern point of Luzon Island), extending between the Babuyan Islands, passing next to the islands of Camiguin (18°50′00″N, 121°51′36″E) and Calayan (19°19′37″N, 121°27′57″E). These fronts are segments of the Kuroshio Front. The Kuroshio skirts the islands very closely, creating an appearance of the Kuroshio Front being broken by the islands, which is probably not the case. High-resolution in situ oceanographic data are needed to confirm the chain pattern of the Kuroshio Fronts in the Luzon Strait.
The broad high-gradient frontal zone west of Luzon Island was identified by Belkin and Cornillon (2003) [35] and called the West Luzon Front (WLF). The WLF emerges fully developed in October, persists through winter, peaks in January–February, and disappears in May. Various physical mechanisms were proposed for the WLF generation and frontolysis (discussed in Section 5) such as the NE monsoon wind stress curl, topographically enhanced gap winds, intensified wind jet in the lee of Luzon Island’s mountains, and water mass exchange with the Sulu Sea.

4.9. Summertime Eastward Jet off SE Vietnam

Monthly maps of SST and GM presented in Section 4.1, Section 4.2, Section 4.3, Section 4.4, Section 4.5, Section 4.6, Section 4.7 and Section 4.8 reveal quasi-stationary fronts and document their seasonal variability. Such quasi-stationary fronts are steered by local bathymetry of the shelf and shelf break/upper slope. Fronts of the open deep SCS are not steered by deep-sea bathymetry and therefore are less stable. One of the most peculiar frontal features of the open deep SCS is an eastward jet that develops during summer off the SE Vietnam, hence termed the summertime eastward jet (SEJ) [32,36,37,38,39,40,41]. Typically, the SEJ emerges off the main upwelling center at 11°N. Occasionally, the SEJ originates off another upwelling center, north of 13°N. The SEJ path is quite variable while the time scale of the SEJ formation and disintegration is measured in weeks. The short time scale of the SEJ life cycle and high degree of spatial variability explain why the SEJ is not present in long-term mean monthly maps of SST (Figure 1) and GM (Figure 2 and Figure 3). Moreover, the SEJ is elusive even in individual monthly maps of SST and GM. In eight years (2015–2022), we found only five instances when monthly maps of SST and GM revealed the SEJ. Clearly, a fast-varying feature can only be studied with high-frequency data, whose frequency is commensurate with the feature’s duration. Therefore, we chose to analyze five-day maps of SST and GM. Such maps were made for each summer (June–September), 2015–2022. Visual analysis of these maps allowed us to detect the SEJ during each month. In July, August, and September, the SEJ originates off the main (southern) upwelling center near 11°N, while in June the SEJ originates off the secondary (northern) upwelling center located north of the 13°N cape. The 3D structure of these upwellings was recently reviewed and studied by Ngo and Hsin (2024) [42].
Figure 9 shows the most pronounced SEJs and illustrates different morphological types of SEJ. Three major morphological types are (1) straight SEJ, (2) anticyclonic arc, (3) cyclonic arc. The curved paths of SEJ (cyclonic and anticyclonic arcs) are caused by gyres that pull and entrain the SEJ. The most striking example of the SEJ interaction with two gyres of opposite sign occurred in July 2016, when the SEJ was sandwiched between two large (300 km in diameter) round-shaped gyres located symmetrically to the north and south of the SEJ (Figure 10). A detailed analysis of all SEJs observed during this study will be published shortly (Belkin IM, Zang YT, 2025, Summertime eastward jet in the South China Sea, 2015–2022, in preparation).

5. Discussion

5.1. China Coastal Front

This study extends our two-part study of the CCF [22,23] that confirmed the wintertime continuity of the CCF along the Mainland China coast from the Yangtze Bank to Hainan Island [5,9,12,43], documented the spatiotemporal variability of the CCF strength and intensity, and emphasized the fundamental difference between the CCF formation mechanisms in winter (water mass convergence by advection due to the southward China Coastal Current) and summer (wind-driven coastal upwelling).

5.2. Taiwan Strait and Taiwan Bank

The frontal pattern in the Taiwan Strait is very dynamic and changes month-to-month even within the same monsoon season (Figure 4). Principal frontal features were identified by Yi Chang and collaborators [7,8,9,10,44]. The thermohaline structure of Taiwan Bank fronts was investigated by Zhang F et al. (2014) [45]. Summer monsoon southwesterlies drive coastal upwelling off Fujian studied by Jianyu Hu and collaborators [46,47,48]. The Fujian upwelling stands out in our monthly maps of GM in June–September (Figure 4). As shown by Belkin et al. (2023) [22], the CCF dynamics change in winter, when the CCF becomes a water mass convergence front between the cold offshore water advected by the southward China Coastal Current and the warm inshore resident water.

5.3. Eastern Guangdong Shelf

The summertime monsoon wind-driven coastal upwelling front off eastern Guangdong was intensely studied by numerous researchers, largely by Jianyu Hu and collaborators [46,47,48]. In winter, the southward China Coastal Current brings cold water from the north, so this front becomes a water mass front, similar to the CCF off Fujian but less intense.

5.4. Pearl River Plume Front

In summer, the Pearl River discharge increases eight-fold relative to the winter minimum. Accordingly, the Pearl River plume swells and extends across the Guangdong Shelf beyond the 50 m isobath (Zhi HH et al., 2022, Figure 14) [49], thereby breaking the CCF into two fronts, the Eastern Guangdong Front (EGF) and Western Guangdong Front (WGF) (Belkin et al., 2024) [23]. The EGF is much stronger than the WGF year-round. In summer, both fronts are weakened, with the EGF being fragmented but clearly present, while the WGF is all but disappeared (Qiu CH et al., 2017 [50]; Belkin et al., 2024 [23]).

5.5. Western Guangdong Shelf

In winter, the China Coastal Current (CCC) and associated China Coastal Front (CCF) extend along the entire Guangdong coast up to the Leizhou Peninsula, the Qiongzhou Strait’s eastern entrance and Hainan Island’s east coast. The CCC branches off into the Qiongzhou Strait to flow to the Beibu Gulf (Gulf of Tonkin); this westward flow is the strongest in winter (Piton et al., 2021) [51]. On the largest (basin-wide) spatial scale, the intensity and strength of the CCF decrease westward (downstream) as reported by Belkin et al. (2024) [23]. This trend is not monotonous: The CCF intensity and strength peak off the eastern Guangdong at 116°E, then decrease off the Pearl River Estuary, then increase again to peak off the western Guangdong at 113°E. The wintertime local maximum of GM at 113°E (where GM exceeds 0.1 °C/km) is also apparent in long-term (1982–2022) mean monthly maps of GM in Zhou X et al. (2024, Figure 1) [52].

5.6. Hainan Island

Oceanic fronts around Hainan Island are diverse and dynamically different from one another. Moreover, different physical mechanisms were proposed for the same fronts, thereby creating a controversy with regard to the origin of some fronts, particularly the fronts west of Hainan discussed in Section 5.7. Wang DX et al. (2001) [5] studied SST fronts in the northern SCS, including SST fronts around Hainan, from satellite data. Wang DX et al. (2003) [53] studied SST fronts west of Hainan, in the Gulf of Tonkin (Beibu Gulf). Hu JY et al. (2003) [54] used satellite data and numerical models to study fronts around Hainan and predict locations of tidal mixing fronts west of Hainan and in the Qiongzhou Strait. Tong JQ et al. (2010) [55] calculated predicted locations of tidal mixing fronts around Hainan (using the Simpson–Hunter criterion) and compared these locations with satellite observations of CHL fronts. Zeng XZ et al. (2014) [56], Jing ZY et al. (2015) [57], and Jing ZY et al. (2016) [58] studied the upwelling front SE of Hainan. Lin PG et al. (2016) [59] and Li YN et al. (2020) [60] studied the dynamics of the northeastern front, while Bai P et al. (2020) [61] studied the impact of topography on the cold pool off the eastern entrance to the Qiongzhou Strait. Belkin et al. (2024) [23] have shown that the East Hainan Front’s strength dSST along 20°N peaks at 2.5 °C in winter and summer, even though the front’s dynamics are fundamentally different during these opposite seasons [57,58,59,60,62]. Using high-resolution (5 km station spacing) CTD data SE of Hainan, Xie LL et al. (2017) [63] diagnosed the front’s banded structure, with alternating bands of upwelling and downwelling in and around the frontal zone.

5.7. Beibu Gulf (Gulf of Tonkin)

While fronts off the east coast of Hainan received much attention, fronts off the west coast (in the Gulf of Tonkin/Beibu Gulf) have not been studied in detail, except for a few studies (e.g., Wang DX et al., 2003 [53]). Therefore, our results that document a front west of Hainan appear to be novel. Thanks to the availability of detailed geomorphological studies of this area (Ma XC et al., 2024 [34] and references therein), we were able to link this front to the local sea bed’s morphological features (giant sand ridges) that control the front’s location. Various physical mechanisms were proposed for the fronts off the west coast of Hainan. Hu JY et al. (2003) [54] and Tong JQ et al. (2010) [55] focused on tidal mixing and tidal mixing fronts, while Lü XG et al. (2008) [64] have shown that the upwelling west of Hainan was induced by a tidal mixing front. Zhu JY et al. (2023) [65] emphasized the importance of wind-driven coastal upwelling west of Hainan, which is suggestive of upwelling fronts. Conceivably, some mutually exclusive concepts can be reconciled if these fronts change their physical nature seasonally; for example, a tidal mixing front in summer can become an upwelling front in winter. The China Coastal Front (CCF) is an example of such seasonal transformation: The CCF is a water mass convergence front in winter and an upwelling front in summer as demonstrated in our previous study [22,23].
The western Beibu Gulf receives copious amounts of freshwater brought to the sea by the Red River and other, smaller rivers (Nguyen-Duy et al., 2021) [66]. The stream temperature of the Red River water varies widely from 15 °C in winter to >30 °C in summer (Nguyen-Duy et al., 2021, Figure 11) [66], while the offshore SST varies from 10 °C to >30 °C, respectively. During the wet season of 2000, the plume was 1–3 °C colder than the ambient seawater (van Maren, 2007) [67], which is a typical summer condition, whereas the temperature contrast in winter is much larger than in summer. Therefore, a thermal front can be expected between the Red River plume and offshore waters for most of the year, with the plume SST front being the strongest during the cold season. The seasonal variability of the Red River plume was studied by Nguyen-Duy et al. (2021) [66] who found that the plume extends almost exclusively southward along the Vietnam coast for most of the year; the plume reaches its maximum width and cross-shelf extent (up to 100 km offshore) in August–September after the peak discharge. Our results corroborate the main findings by Nguyen-Duy et al. (2021) [66] and the earliest results by Belkin and Cornillon (2003) [35]. The western SST front in the Beibu Gulf documented in this study is apparently the Red River plume front. The northern SST front in our results is tenuously connected to the western SST front (Red River plume front). This pattern is consistent with the modeling results by Nguyen-Duy et al. (2021) [66] who showed that the plume’s northward extent is limited by Ha Long Bay (21°N). The two-front pattern in the western Beibu Gulf is a novel result. Previous studies [5,12,16,20,53] identified a single continuous coastal front in the western Beibu Gulf, extending northward up to the Guangxi coast at ~21.7°N. The two-front pattern that emerged in this study is particularly important because the western and northern fronts are formed by different mechanisms. While the western front is a boundary of the Red River outflow, the northern front is a boundary of a cold-water mass, which forms in the northern Beibu Gulf off the Guangxi coast due to a massive heat loss in winter, when the sea water temperature drops down to 10–12 °C (Gao JS et al., 2024) [68].
The Red River plume area varies greatly, following the Red River discharge variations, with a maximum area of >40,000 km2 (or 27% of the total area of Beibu Gulf) and a minimum area of <2000 km2 (Nguyen-Duy et al., 2021) [66]. Accordingly, the location, strength, and intensity of the Western Beibu Gulf Front (Red River plume front) are expected to vary in sync with the plume area and discharge variations. Therefore, the profound changes of the Red River hydrological regime caused by climate change and human activities are bound to affect the Beibu Gulf oceanography. Following the construction of numerous dams and impoundment of reservoirs, the Red River sediment discharge plunged by 90% between 1958 and 2021, while water discharge decreased by 13% (Nguyen QH and Tran VN, 2024) [69]. The order of magnitude reduction of suspended sediment concentration (SSC) drastically affected the detectability of the Red River plume and attendant plume front in satellite ocean color imagery. Also, the sharply reduced SSC and turbidity of the river plume affected the plume dynamics and its mixing with ambient waters and spreading offshore and alongshore.

5.8. Central and SE Vietnam Shelf

The Vietnam Coastal Current (VCC) is a western boundary current that flows southward along the Vietnam Shelf (Wang DX et al., 2013) [70]. The VCC is fed by low-salinity waters of Red River from the Beibu Gulf and high-salinity waters from the northeastern SCS, the latter joining the VCC southwest of Hainan. The VCC is associated with an SST front (termed here the Vietnam Coastal Current Front or VCCF) that has been identified in several remote sensing studies [3,12,16,20,35]. Despite being associated with a major current (VCC), the VCCF off central Vietnam has not been studied in detail since most studies focused on fronts off SE Vietnam. The SW monsoon winds blowing along the Vietnam coast cause upwelling, which is especially pronounced off SE Vietnam (Xie SP et al., 2003 [32]; Yu Y et al., 2019 [11]), where the upwelling generates fronts studied by Yu Y et al. (2020) [71], Le and Fisher (2021) [72], and Ngo and Hsin (2024) [42]. Using MODIS SST data processed with the Cayula and Cornillon single image edge detection (SIED) algorithm, Le and Fisher (2021) [72] generated long-term (2003–2018) frontal frequency maps during the NE and SW monsoons and distinguished two types of fronts in the 10–13°N, 107–111°E area. Shelf fronts run over the 0–200 m depth range during the winter NE monsoon. Upwelling fronts emerge during the summer SW monsoon and often extend far offshore in a general eastward direction, hence called “summertime eastward jets” or SEJ discussed in Section 5.9. Yu Y et al. (2020) [71] used summertime (June–August) MODIS SST data (2002–2017) to map a coastal upwelling front (identified with enhanced SST gradients) off SE Vietnam. The front consists of two segments (ibid., Figure 1) [71], the southern one (10.5–12°N) with SST gradients up to 5 °C/100 km and the northern one (13–14°N) with much weaker SST gradients (<3 °C/100 km). This high-resolution local mapping result confirms the pattern obtained by Yu Y et al. (2019) [11], who mapped a nearly continuous front along the Vietnam coast (10.5–18.5°N) with a gap between 12 and 13°N. Zhao LH et al. (2022) [16] identified a coastal front off Vietnam but only up to 16°N, where this front (termed Vietnam Front) is clearly separated from the Bakbo Bay Front in the Beibu Gulf (Gulf of Tonkin). Conversely, Xing QW et al. (2023) [20] distinguished the East Vietnam Coastal Front as a continuous feature between 11 and 19°N, connected to the Beibu Gulf fronts (ibid., Figure 9) [20].

5.9. Summertime Eastward Jet Off SE Vietnam

In summer, the southwesterly monsoon winds drive the upper-layer circulation in the central SCS that features two gyres—an anticyclone in the south and a cyclone in the north—and an eastward jet in between [36,37,39]. Earlier studies of this jet were reviewed by Fang GH et al. (1998) [73], who called this jet the Southeast Vietnam Off-Shore Current (SEVOC). Different generation mechanisms of the summertime eastward jet (SEJ) have been proposed such as wind stress curl (Shaw and Chao, 1994 [36]; Xie SP et al., 2003 [32]), coastal current interaction with the SE Vietnam shelf topography (Gan and Qu, 2008) [40], and the convergence of two opposing along-shelf flows near 11–12°N (Chen CS et al., 2012) [41]. The advection by SEJ was invoked by Lin HY et al. (2017) [74] to explain the origin of a peculiar subsurface lens-shaped structure observed off SE Vietnam. Fang WD et al. (1998) [75] and Fang WD et al. (2002) [76] reported a subsurface zonal front between 11 and 12°N during the SW monsoon in September 1994. The front was aligned with a strong eastward jet (North Nansha Current) sandwiched between two gyres (cyclone in the north and anticyclone in the south). The front extended to 300–400 m (best developed at 200 m), with cross-frontal steps of temperature and salinity of 7–8 °C (Fang WD et al. (1998) [75]; up to 10 °C, according to Fang WD et al. (2002) [76]) and 1 psu, respectively. Fang WD et al. (2002, Figure 12) [76] reported a strong subsurface zonal front between SE Vietnam and 114°E with temperature at 50 m ranging from <20 °C to 28 °C across the front. This strong subsurface front does not manifest in the surface layer above 40 m (Fang WD et al., 2002, Figure 14) [76]. The subsurface R-type (“ramp”) ocean front is thus collocated with the surface-intensified SEJ featuring V-type (“valley”) transversal distribution of SST (Figure 10).
Li YL et al. (2014) [77] studied interannual variability of the SEJ using data from July to September 1992–2012 between 110°E and 113°E. The SEJ latitude varied between 10.7°N and 14.3°N (12°N on average). We showed that the SEJ often emerges in June following the commencement of summer upwelling off SE Vietnam. We also showed that the SEJ often extends up to 114°E and is occasionally traceable up to 116°E. Along the offshore extent of the SEJ, its lateral scale remains nearly constant at O(~50) km, which is significantly larger than the SEJ lateral scale of O(~10) km in the modeling study by Huang XL et al. (2020) [78]. We did not observe any widening of SEJ from west to east contrary to the findings by Sun Y and Lan J (2021) [79] who used the SODA data along four meridians between 110°E and 113°E and reported SEJ as having a wide north–south span of 330–407 km, with the current axis of SEJ located between 10.7°E and 11.7°N. The typical meridional dipole structure that drives the SEJ (cyclone in the north, anticyclone in the south) is occasionally flipped as shown by Yu ZT et al. (2023) [80] who found the Southeast Vietnam Offshore Current (SVOC) to be anomalous in 1995, 1998, 2007, 2010, and 2015 while extreme positive anomalies of SST off SE Vietnam were observed in 1995, 1998, 2010, an 2015 (ibid., Figure 16) [80].

5.10. Mekong Estuary and Shelf

The Mekong River outflow does not form a large, wide plume extending offshore across the shelf like many other great rivers, e.g., Yangtze (Changjiang). Nonetheless, the term “plume” is routinely applied to the Mekong River outflow (Feng YK et al., 2024) [81]. While the Mekong River plume was the subject of numerous observational and modeling studies, the spatial and temporal variability of the plume front has not been investigated. We documented the seasonal variability of the plume front (Figure 7). The location of the plume front is fairly stable year-round as the front is aligned with the local bathymetry, extending alongshore over a narrow depth range. The plume front’s locational stability (bathymetric fidelity) is consistent with the bimodal monsoon-driven spatiotemporal pattern of the Mekong River outflow, which is directed SW in winter and NE in summer, according to the dominant wind direction during the respective seasons.
The Mekong River discharge has been reduced over the last decades by the construction of multiple dams and reservoirs in the Mekong River basin (Ruiz-Barradas and Nigam, 2024) [82]. As a result, the Mekong River plume has shrunk dramatically (Feng YK et al., 2024) [81]. The dams and reservoirs also reduced the sediment load that the river delivers to the sea (Loisel et al., 2014) [83]. The planned construction of more dams and reservoirs will ensure the continuation of this trend. Thus, the location, intensity and strength of the plume front are expected to change over the next decades. Our study thus provides a useful benchmark for future investigations of the Mekong River plume and plume front.

5.11. Gulf of Thailand

The SST field inside the Gulf of Thailand (GOT) remains relatively uniform year-round (Figure 1) except for coastal embayments, especially those along the east coast of the GOT, that feature strong SST gradients (Figure 2). The only large-scale front in the Gulf is a thermohaline front across the GOT entrance, described by Belkin and Cornillon (2003) [35] based on hydrographic data from NAGA cruises in 1959–1960 presented by Yanagi and Takao (1998) [84]. Belkin and Cornillon (2003) [35] termed this feature the Gulf of Thailand Front (GTF). This front was originally reported from the NAGA data by Robinson (1974) [85] who wrote, “A sharp temperature and salinity front was observed north of Cape Camau” ibid., (p. 59, [85]), and noted an “intense temperature gradient entering the Gulf beyond Cape Camau” ibid., (p. 89, [85]), with a 2 °C temperature range from 25.4–26.2 to 27.5–28.0 °C.
Lin Zhang and collaborators (Zhang L et al., 2024) [86] studied the thermal GTF in winter 1982–2021 using the Optimal Interpolation SST (OISST) data set. The thermal GTF called “thermal front east of the Gulf of Thailand (TFEGT)” by Zhang L et al. (2024) [86] is best developed in January–February, which is consistent with our results. However, according to Zhang L et al. (2024) [86], the front’s intensity (GM) peaks at a mere 0.11 °C/10 km (ibid., Figure 4), which is a quarter of the maximum GM of 0.4 °C/10 km across the same front as documented by our maps (Figure 2). The low intensity obtained by Zhang L et al. (2024) [86] is most likely explained by the coarse spatial resolution of the OISST data (0.25° × 0.25°). The sharp local intensification of the GTF off Cape Camau, which is evident in our Figure 2 and also in Zhang L et al. (2024) [86], is likely constrained by the peculiar local inshore bathymetry. Indeed, the GM maximum in winter is found over a steep slope drop spanning the 5 to 15 m depth range (Figure 2) (for the inshore bathymetry see Liu JP et al. (2017, Figure 5) [87]). The front is collocated with the northern terminus of the distal depocenter of Mekong-derived sediments (see a map in Liu JP et al. (2017, Figure 16) [87]). This collocation is not coincidental. The causal links between oceanic fronts and sedimentation are well documented. Sharp changes in suspended sediment concentration (SSC) and ocean color are often congruent with oceanic fronts (see, e.g., Wang X et al. (2024, Figure 10) [88] featuring a sharp color front off Cape Camau; also see Loisel et al. (2014, Figure 8) [83] for monthly climatology of suspended particulate matter (SPM) featuring a sharp SPM front off Cape Camau). The GTF’s sharpness off Cape Camau is caused by the confluence of two tidal systems: A semidiurnal tide coming from the SCS and a diurnal tide coming from the Gulf (Zu et al., 2008 [89]; Unverricht et al., 2014 [90]; Wang X et al., 2024 [88]). This confluence is constrained by local bathymetry, which features an abrupt morphological change north of Cape Camau, at 8.8°N, where the inner shelf (depth < 10 m) suddenly narrows (see Loisel et al. (2014, Figure 1) [83] based on high-resolution bathymetric data by Becker et al. (2009) [91]).
The GTF formation mechanisms proposed by various authors include geostrophic advection by the southward western boundary current driven by the winter monsoon’s northeasterlies (Zhang L et al., 2024) [86] and buoyancy contribution by the southward coastal current driven by the Mekong River outflow (Belkin and Cornillon, 2003) [35]. The importance of buoyancy flux by the copious rainfall over the offshore Gulf was emphasized by Pokavanich et al. (2024) [92]. The buoyancy flux to the coastal belt by numerous small rivers around the Gulf is deemed less important since their cumulative discharge is likely dwarfed by the influx of the diluted Mekong River outflow and direct offshore rain (see, e.g., Pokavanich et al. (2024, Figure 3) [92]).

5.12. Peninsular Malaysia

In summer, the SW monsoon winds cause upwelling off the east coast of Peninsular Malaysia (ECPM) between 5°N and 6°N (Akhir et al., 2015 [93]; Kok et al., 2015 [94]). The upwelling creates a cold-water belt at some distance from the shore. This cold-water belt is bordered by thermal fronts from both sides, inshore and offshore, as reported by Malaysian oceanographers, largely by Poh Heng Kok and collaborators [33,94,95,96,97]. The V-shaped cross-frontal pattern of SST is evident along a fixed transect at 5.5°N during summertime upwelling (Daud et al., 2019) [96]. The intensity and strength of the upwelling front off ECPM vary seasonally and interannually. Based on AVHRR SST data from 2005 to 2015 along 5.5°N, an exceptionally strong and intense upwelling front was observed during the extremely hot summer of 2010, when the ECPM upwelling and attendant upwelling front persisted for eight months, lasting from April through November (Daud et al., 2019, Figure 9) [96]. The V-shaped (“valley”) transversal pattern of SST across the ECPM summertime upwelling is similar to the summertime transversal pattern of SST across the China Coastal Front in the East China Sea (Belkin et al., 2023) [22] and South China Sea (Belkin et al., 2024) [23].

5.13. Sunda Shelf

The temperature field of the Sunda Shelf is relatively uniform year-round. The Sunda Shelf is devoid of conspicuous quasi-stationary seasonally persistent SST fronts. The overwhelming majority of the World Ocean’s shelves feature oceanic fronts at the shelf break and over the upper slope. In that respect, the Sunda Shelf is a study in contrast. Unlike most shelves, the Sunda Shelf does not feature a large-scale water mass of its own, at least in the surface layer. Instead, waters from adjacent areas such as the northern SCS, Gulf of Thailand, and Indonesian seas are carried across the Sunda Shelf by currents driven by seasonally reversing monsoon winds (e.g., Daryabor et al., 2016 [98]). These currents are efficient in large-scale horizontal mixing of surface waters, creating a mélange of water masses (Roseli et al., 2015) [99]. Thus, the Sunda Shelf lacks a major frontogenetic mechanism, which is the convergence of large-scale water masses with distinct properties. Even the shelf break of the central and eastern Sunda Shelf does not feature a robust SST front—unlike the overwhelming majority of shelf breaks in the World Ocean. Only the western Sunda Shelf features a shelf break front along 108–110°E associated with the southward Vietnam Coastal Current and its extension, the Vietnam Current (alternatively termed the Sunda Slope Current by Liu QY et al. (2004) [27]). Farther east, over the eastern Sunda Shelf, satellite data on chlorophyll concentration (CHL) and phytoplankton primary production (PPP) reveal no sign of a front along the northern boundary of the Sunda Shelf (Wang TH et al., 2023 [100]; Deng L et al., 2024 [101]). Sunda Shelf’s shelf break does not manifest in CHL maps: The entire Sunda Shelf is flooded with oligotrophic waters typical of the open SCS (Wang TH et al., 2023) [100]. The same pattern transpires in the long-term distributions of PPP presented by Deng L et al. (2024) [101], where Sunda Shelf’s shelf break does not appear as a biogeographical boundary.
The southward advection of cold waters from the north toward the Sunda Shelf was proposed as a viable frontogenetic mechanism (e.g., Kok et al. (2015) [94]). As discussed in Section 4.1.1 (cold tongue in winter), the southward advection peaks in winter when the NE monsoon winds drive the Vietnam Coastal Current and its extension, the Vietnam Current (Sunda Slope Current). However, the wintertime southward advection of cold water is not strong enough to create a robust front along Sunda Shelf’s northern boundary, which is the shelf break.

5.14. Borneo Shelf

Belkin and Cornillon (2003) [35] identified the shelf–slope front (SSF) off the Borneo Island (north of 5°N) and off the Palawan Island. The 5°N limit is justified bathymetrically as the southernmost extent of the SCS deep basin. However, the frontal maps analyzed by Belkin and Cornillon (2003) [35] documented multiple instances of a NE-to-SW-trending front along Borneo’s NW coast, with the front extending southward well beyond 5°N, often down to 3°N, to continue over the Sunda Shelf. In an extreme case (August 1989) this front extended parallel to Borneo’s NW coast (50–100 km offshore) all the way between 7.5°N and 2.5°N, with the front’s northern part running along the shelf break off Palawan and the front’s southern part crossing over the Sunda Shelf off Borneo. A situation where a shelf–slope front leaves the shelf break and crosses onto the shelf is deemed highly unusual and incompatible with the physical nature of shelf–slope fronts.
Using the Simpson–Hunter criterion, Tong JQ et al. (2010) [55] mapped the predicted locations of tidal mixing fronts (TMFs) in the SCS. The majority of these TMFs are corroborated by in-situ or satellite data. The predicted TMF north of Borneo has been observed by Belkin and Cornillon (2003) [35] from satellite SST data.

5.15. West Luzon Front

Wang GH et al. (2012) [102] proposed a scenario for the formation of a large-scale wintertime front west of Luzon Island. The NE monsoon’s interaction with the Luzon Island’s mountains results in a positive wind stress curl and the formation of the cyclonic Luzon cold eddy (LCE), which facilitates the West Luzon Front (WLF) formation via differential advection of cold and warm waters. The interannual and seasonal variability of LCE and WLF were studied by Sun RL et al. (2015) [103] and Sun RL et al. (2023) [104], respectively. Sun RL et al. (2024) [105] found a poor spatial correspondence between LCE and WLF in 1993–2022 and suggested that the WLF is formed due to advection of warm water by a northward current west of Luzon Island.

5.16. Luzon Strait

Fronts in the Luzon Strait have been recently investigated by Chang Y et al. (2022) [106] and Lao QB et al. (2023) [107]. Processing 5 km monthly OSTIA SST data from 1985 to 2017 with the BOA algorithm, Chang Y et al. (2022) [106] mapped SST gradient magnitude GM and distinguished three morphological types of the Kuroshio path in winter (January–March), namely the leaking, leaping, and looping paths (ibid., Figure 2) [106], consistent with previous studies. In summer, the Kuroshio SST front in this area cannot be reliably detected because of the exceedingly small horizontal gradients of SST between the Kuroshio and SCS. Lao QB et al. (2023) [107] used the 0.05° × 0.05° resolution monthly OSTIA SST from 1982 to 2021 and the BOA algorithm to map SST GM (ibid., Figure 2) [107]. The Kuroshio SST front emerges in October, matures in November (with GM > 0.04 °C/km) and persists until February, being much stronger in the southern part of the Luzon Strait and tapering off northward. These results are similar to ours. Notably though, our maps clearly show a chain of three fronts aligned SE–NW, whereas maps in Lao QB et al. (2023, Figure 2) [107] portray this chain of fronts as a single continuous feature. This difference can be explained by the different spatial resolutions of the respective data sets: 2 km in our study vs. 5 km in Lao QB et al. (2023) [107]. The chain of fronts is aligned with two major islands of the Babuyan Islands, namely Calayan (19°19′37″N, 121°27′57″E) and Camiguin (18°50′00″N, 121°51′36″E). Thus, this frontal chain is located far west (20–30 km) of Babuyan (19°31′20″N, 121°57′13″E). This is an important regional detail and correction to the well-known schematic by Caruso et al. (2006, Figure 3) [108], in which the Kuroshio extends east of Babuyan via the Balintang Channel between the Babuyan and Batanes Islands.

6. Conclusions

Monthly climatology of surface temperature fronts in the South China Sea was generated and analyzed based on high-resolution (2 km), high-frequency (hourly) SST data of the Advanced Himawari Imager (AHI) flown onboard the Japanese Himawari-8 geostationary satellite. The Belkin and O’Reilly algorithm (BOA) was applied to the AHI SST data from 2015 to 2022 to generate monthly maps of SST gradient magnitude GM. The GM maps were log-transformed to enhance contrasts, thereby revealing a multitude of moderate and weak fronts. The seasonal and spatial variability of SST fronts was analyzed in five regions: the Taiwan Strait, Guangdong Shelf, Hainan Island/Beibu Gulf, Mekong Outflow/Gulf of Thailand entrance, and Luzon Strait/west of Luzon Island. In the Taiwan Strait, six fronts were identified: China Coastal Front, Taiwan Bank Front, Changyun Ridge Front, East Penghu Channel Front, and Eastern/Western Penghu Islands fronts. The Guangdong Shelf in winter is dominated by the strong and continuous China Coastal Front, which extends all the way down to SE Hainan Island, while in summer this front is maintained by the SW monsoon wind-driven coastal upwelling off the eastern Guangdong. Hainan Island is surrounded by various fronts formed by wind-driven coastal upwelling off SE Hainan; tides and topographic upwelling off NE Hainan; and tidal mixing and SW monsoon wind-driven upwelling off the west coast of Hainan, where fronts are anchored/steered by giant sand ridges (sand waves). In the western Beibu Gulf, the Red River Outflow Front extends southward and continues as the Vietnam Coastal Front. The northern Beibu Gulf features a tidal mixing front off the Guangxi Coast. Off SE Vietnam, the Mekong Outflow front extends seasonally toward Cape Camau, where the Mekong Outflow front tenuously connects to the Gulf of Thailand Entrance Front. The Kuroshio Front in the Luzon Strait manifests as a chain of three submesoscale fronts across the Babuyan Islands. West of Luzon Island, a broad NE–SW offshore frontal zone persists in winter. The summertime eastward jet (SEJ) off SE Vietnam emerges in June–September off the 11°N upwelling center. The SEJ extends from 109°E up to 114°E (at times, up to 116°E), persisting up to three weeks (as documented) and likely longer. The zonally oriented SEJ was observed between two large gyres, each about 300 km in diameter, located north and south of the SEJ.

Author Contributions

I.M.B.: Conceptualization, methodology, data analysis, and writing; Y.-T.Z.: Data curation, processing, visualization, discussions, and writing. All authors have read and agreed to the published version of the manuscript.

Funding

Yi-Tao Zang was funded by the Science and Technology Project of Zhoushan (Grant No. 2023C41020). Igor Belkin was supported by Zhejiang Ocean University.

Data Availability Statement

The original contributions presented in this study are included in the article. Further inquiries can be directed to the corresponding author.

Acknowledgments

The Japanese Space Exploration Agency (JAXA) is gratefully acknowledged for making the Himawari-8 AHI SST data freely available. The data were downloaded from a website (https://www.eorc.jaxa.jp/ptree; accessed on 14 January 2025) maintained by JAXA. We are thankful to Lei Lin of the Shandong University of Science and Technology for providing a MATLAB 2019a code of the BOA algorithm. Comments by Qinwang Xing, Yi Chang, Linhong Zhao and two anonymous reviewers helped us improve the original manuscript.

Conflicts of Interest

The authors declare no conflicts of interest.

References

  1. Cayula, J.F.; Cornillon, P. Edge detection algorithm for SST images. J. Atmos. Ocean. Technol. 1992, 9, 67–80. [Google Scholar] [CrossRef]
  2. Cayula, J.F.; Cornillon, P. Multi-image edge detection for SST images. J. Atmos. Ocean. Technol. 1995, 12, 821–829. [Google Scholar] [CrossRef]
  3. Belkin, I.M.; Cornillon, P.C.; Sherman, K. Fronts in Large Marine Ecosystems. Prog. Oceanogr. 2009, 81, 223–236. [Google Scholar] [CrossRef]
  4. Hickox, R.; Belkin, I.; Cornillon, P.; Shan, Z. Climatology and seasonal variability of ocean fronts in the East China, Yellow and Bohai Seas from satellite SST data. Geophys. Res. Lett. 2000, 27, 2945–2948. [Google Scholar] [CrossRef]
  5. Wang, D.X.; Liu, Y.; Qi, Y.Q.; Shi, P. Seasonal variability of thermal fronts in the Northern South China Sea from satellite data. Geophys. Res. Lett. 2001, 28, 3963–3966. [Google Scholar] [CrossRef]
  6. Shimada, T.; Sakaida, F.; Kawamura, H.; Okumura, T. Application of an edge detection method to satellite images for distinguishing sea surface temperature fronts near the Japanese coast. Remote Sens. Environ. 2005, 98, 21–34. [Google Scholar] [CrossRef]
  7. Chang, Y.; Shimada, T.; Lee, M.A.; Lu, H.J.; Sakaida, F.; Kawamura, H. Wintertime sea surface temperature fronts in the Taiwan Strait. Geophys. Res. Lett. 2006, 33, L23603. [Google Scholar] [CrossRef]
  8. Chang, Y.; Lee, M.A.; Shimada, T.; Sakaida, F.; Kawamura, H.; Chan, J.W.; Lu, H.J. Wintertime high-resolution features of sea surface temperature and chlorophyll-a fields associated with oceanic fronts in the southern East China Sea. Int. J. Remote Sens. 2008, 29, 6249–6261. [Google Scholar] [CrossRef]
  9. Chang, Y.; Shieh, W.J.; Lee, M.A.; Chan, J.W.; Lan, K.W.; Weng, J.S. Fine-scale sea surface temperature fronts in wintertime in the northern South China Sea. Int. J. Remote Sens. 2010, 31, 4807–4818. [Google Scholar] [CrossRef]
  10. Lee, M.A.; Chang, Y.; Shimada, T. Seasonal evolution of fine-scale sea surface temperature fronts in the East China Sea. Deep-Sea Res. Part II 2015, 119, 20–29. [Google Scholar] [CrossRef]
  11. Yu, Y.; Zhang, H.R.; Jin, J.B.; Wang, Y.T. Trends of sea surface temperature and sea surface temperature fronts in the South China Sea during 2003–2017. Acta Oceanol. Sin. 2019, 38, 106–115. [Google Scholar] [CrossRef]
  12. Wang, Y.T.; Yu, Y.; Zhang, Y.; Zhang, H.R.; Chai, F. Distribution and variability of sea surface temperature fronts in the South China Sea. Estuar. Coast. Shelf Sci. 2020, 240, 106793. [Google Scholar] [CrossRef]
  13. Canny, J. A computational approach to edge detection. IEEE Trans. Pattern Anal. Mach. Intell. 1986, 8, 679–698. [Google Scholar] [CrossRef] [PubMed]
  14. Castelao, R.M.; Wang, Y.T. Wind-driven variability in sea surface temperature front distribution in the California Current System. J. Geophys. Res. Ocean. 2014, 119, 1861–1875. [Google Scholar] [CrossRef]
  15. Wang, Y.T.; Castelao, R.M.; Yuan, Y.P. Seasonal variability of alongshore winds and sea surface temperature fronts in Eastern Boundary Current Systems. J. Geophys. Res. Ocean. 2015, 120, 2385–2400. [Google Scholar] [CrossRef]
  16. Zhao, L.H.; Yang, D.T.; Zhong, R.; Yin, X.Q. Interannual, seasonal, and monthly variability of sea surface temperature fronts in offshore China from 1982–2021. Remote Sens. 2022, 14, 5336. [Google Scholar] [CrossRef]
  17. Chen, J.Y.; Hu, Z.F. Seasonal variability in spatial patterns of sea surface cold- and warm fronts over the continental shelf of the northern South China Sea. Front. Mar. Sci. 2023, 9, 1100772. [Google Scholar] [CrossRef]
  18. Ullman, D.S.; Cornillon, P.C. Satellite-derived sea surface temperature fronts on the continental shelf off the northeast U.S. coast. J. Geophys. Res. Ocean. 1999, 104, 23459–23478. [Google Scholar] [CrossRef]
  19. Ullman, D.S.; Cornillon, P.C. Continental shelf surface thermal fronts in winter off the northeast US coast. Cont. Shelf Res. 2001, 21, 1139–1156. [Google Scholar] [CrossRef]
  20. Xing, Q.W.; Yu, H.Q.; Wang, H.; Ito, S.I. An improved algorithm for detecting mesoscale ocean fronts from satellite observations: Detailed mapping of persistent fronts around the China Seas and their long-term trends. Remote Sens. Environ. 2023, 294, 113627. [Google Scholar] [CrossRef]
  21. Xing, Q.W.; Yu, H.Q.; Wang, H. Global mapping and evolution of persistent fronts in Large Marine Ecosystems over the past 40 years. Nat. Commun. 2024, 15, 4090. [Google Scholar] [CrossRef] [PubMed]
  22. Belkin, I.M.; Lou, S.S.; Yin, W.B. The China Coastal Front from Himawari-8 AHI SST Data—Part 1: East China Sea. Remote Sens. 2023, 15, 2123. [Google Scholar] [CrossRef]
  23. Belkin, I.M.; Lou, S.S.; Zang, Y.T.; Yin, W.B. The China Coastal Front from Himawari-8 AHI SST Data—Part 2: South China Sea. Remote Sens. 2024, 16, 3415. [Google Scholar] [CrossRef]
  24. Bessho, K.; Date, K.; Hayashi, M.; Ikeda, A.; Imai, T.; Inoue, H.; Kumagai, Y.; Miyakawa, T.; Murata, H.; Ohno, T.; et al. An introduction to Himawari-8/9—Japan’s new-generation geostationary meteorological satellites. J. Meteorol. Soc. Jpn. 2016, 94, 151–183. [Google Scholar] [CrossRef]
  25. Belkin, I.M.; O’Reilly, J.E. An algorithm for oceanic front detection in chlorophyll and SST satellite imagery. J. Mar. Syst. 2009, 78, 317–326. [Google Scholar] [CrossRef]
  26. Belkin, I.M.; Shen, X.T. Salinity fronts in the South Atlantic. Remote Sens. 2024, 16, 1578. [Google Scholar] [CrossRef]
  27. Liu, Q.Y.; Jiang, X.; Xie, S.P.; Liu, W.T. A gap in the Indo-Pacific warm pool over the South China Sea in boreal winter: Seasonal development and interannual variability. J. Geophys. Res. Ocean. 2004, 109, C07012. [Google Scholar] [CrossRef]
  28. Varikoden, H.; Samah, A.A.; Babu, C.A. The cold tongue in the South China Sea during boreal winter and its interaction with the atmosphere. Adv. Atmos. Sci. 2010, 27, 265–273. [Google Scholar] [CrossRef]
  29. Tan, H.J.; Cai, R.S.; Wu, R.G. Summer marine heatwaves in the South China Sea: Trend, variability and possible causes. Adv. Clim. Change Res. 2022, 13, 323–332. [Google Scholar] [CrossRef]
  30. Qu, T.D. Role of ocean dynamics in determining the mean seasonal cycle of the South China Sea surface temperature. J. Geophys. Res. Ocean. 2001, 106, 6943–6955. [Google Scholar] [CrossRef]
  31. Wyrtki, K. Scientific Results of Marine Investigations of the South China Sea and the Gulf of Thailand 1959–1961; Naga Report; The University of California, Scripps Institution of Oceanography: La Jolla, CA, USA, 1961; Volume 2, 195p, Available online: https://escholarship.org/uc/item/49n9x3t4 (accessed on 14 November 2024).
  32. Xie, S.P.; Xie, Q.; Wang, D.X.; Liu, W.T. Summer upwelling in the South China Sea and its role in regional climate variations. J. Geophys. Res. Ocean. 2003, 108, 3261. [Google Scholar] [CrossRef]
  33. Kok, P.H.; Wijeratne, S.; Akhir, M.F.; Pattiaratchi, C.; Chung, J.X.; Roseli, N.H.; Daud, N.R. Modeling approaches in the investigation of upwelling along the east coast of Peninsular Malaysia: Its driven mechanisms. Reg. Stud. Mar. Sci. 2022, 55, 102562. [Google Scholar] [CrossRef]
  34. Ma, X.C.; He, Y.W.; Gao, M.; Gong, T. The morphology and formation of a binary sand ridge in the Beibu Gulf, northwestern South China Sea. Geomorphology 2024, 458, 109251. [Google Scholar] [CrossRef]
  35. Belkin, I.M.; Cornillon, P.C. SST fronts of the Pacific coastal and marginal seas. Pac. Oceanogr. 2003, 1, 90–113. Available online: http://ferhri.ru/images/stories/FERHRI/PacificOceanography/povol1n2.pdf (accessed on 15 November 2024).
  36. Shaw, P.T.; Chao, S.Y. Surface circulation in the South China Sea. Deep-Sea Res. Part I 1994, 41, 1663–1683. [Google Scholar] [CrossRef]
  37. Hu, J.Y.; Kawamura, H.; Hong, H.S.; Qi, Y.Q. A review on the currents in the South China Sea: Seasonal circulation, South China Sea warm current and Kuroshio intrusion. J. Oceanogr. 2000, 56, 607–624. [Google Scholar] [CrossRef]
  38. Sun, Y.; Lan, J. Interannual migration of the summertime eastward jet in the South China Sea associated with the upper layer thickness distribution. J. Geophys. Res. Ocean. 2023, 128, e2023JC019920. [Google Scholar] [CrossRef]
  39. Wang, G.H.; Chen, D.; Su, J.L. Generation and life cycle of the dipole in the South China Sea summer circulation. J. Geophys. Res. Ocean. 2006, 111, C06002. [Google Scholar] [CrossRef]
  40. Gan, J.P.; Qu, T.D. Coastal jet separation and associated flow variability in the Southwest South China Sea. Deep-Sea Res. Part I 2008, 55, 1–19. [Google Scholar] [CrossRef]
  41. Chen, C.S.; Lai, Z.G.; Beardsley, R.C.; Xu, Q.C.; Lin, H.C.; Viet, N.T. Current separation and upwelling over the southeast shelf of Vietnam in the South China Sea. J. Geophys. Res. Ocean. 2012, 117, C03033. [Google Scholar] [CrossRef]
  42. Ngo, M.H.; Hsin, Y.C. Three-dimensional structure of temperature, salinity, and velocity of the summertime Vietnamese upwelling system in the South China Sea on the interannual timescale. Prog. Oceanogr. 2024, 229, 103354. [Google Scholar] [CrossRef]
  43. Tan, K.Y.; Xie, L.L.; Li, M.M.; Li, M.; Li, J.Y. 3D structure and seasonal variation of temperature fronts in the shelf sea west of Guangdong. Haiyang Xuebao (Acta Oceanol. Sin. Chin. Ed.) 2023, 45, 42–55. [Google Scholar] [CrossRef]
  44. Lan, K.W.; Kawamura, H.; Lee, M.A.; Chang, Y.; Chan, J.W.; Liao, C.H. Summertime sea surface temperature fronts associated with upwelling around the Taiwan Bank. Cont. Shelf Res. 2009, 29, 903–910. [Google Scholar] [CrossRef]
  45. Zhang, F.; Li, X.F.; Hu, J.Y.; Sun, Z.Y.; Zhu, J.; Chen, Z.Z. Summertime sea surface temperature and salinity fronts in the southern Taiwan Strait. Int. J. Remote Sens. 2014, 35, 4452–4466. [Google Scholar] [CrossRef]
  46. Hu, J.Y.; Wang, X.H. Progress on upwelling studies in the China seas. Rev. Geophys. 2016, 54, 653–673. [Google Scholar] [CrossRef]
  47. Hu, J.Y.; San Liang, X.; Lin, H.Y. Coastal upwelling off the China coasts. In Coastal Environment, Disaster, and Infrastructure: A Case Study of China’s Coastline; San Liang, X., Zhang, Y., Eds.; IntechOpen: London, UK, 2018; pp. 3–25. [Google Scholar] [CrossRef]
  48. Shi, W.A.; Huang, Z.; Hu, J.Y. Using TPI to map spatial and temporal variations of significant coastal upwelling in the northern South China Sea. Remote Sens. 2021, 13, 1065. [Google Scholar] [CrossRef]
  49. Zhi, H.H.; Wu, H.; Wu, J.X.; Zhang, W.X.; Wang, Y.H. River plume rooted on the sea-floor: Seasonal and spring-neap variability of the Pearl River plume front. Front. Mar. Sci. 2022, 9, 791948. [Google Scholar] [CrossRef]
  50. Qiu, C.H.; Cui, Y.S.; Hu, S.Q.; Huo, D. Seasonal variation of Guangdong coastal thermal front based on merged satellite data. J. Trop. Oceanol. 2017, 36, 16–23, (In Chinese, with English abstract and captions). [Google Scholar] [CrossRef]
  51. Piton, V.; Herrmann, M.; Marsaleix, P.; Duhaut, T.; Ngoc, T.B.; Tran, M.C.; Shearman, K.; Ouillon, S. Influence of winds, geostrophy and typhoons on the seasonal variability of the circulation in the Gulf of Tonkin: A high-resolution 3D regional modeling study. Reg. Stud. Mar. Sci. 2021, 45, 101849. [Google Scholar] [CrossRef]
  52. Zhou, X.; Zhang, S.W.; Liu, S.H.; Chen, C.Q.; Lao, Q.B.; Chen, F.J. Thermal fronts in coastal waters regulate phytoplankton blooms via acting as barriers: A case study from western Guangdong, China. J. Hydrol. 2024, 636, 131350. [Google Scholar] [CrossRef]
  53. Wang, D.X.; Luo, L.; Liu, Y.; Li, S.Y. Seasonal and interannual variability of thermal fronts in the Tonkin Gulf. In Proceedings of the Third International Asia-Pacific Environmental Remote Sensing Remote Sensing of the Atmosphere, Ocean, Environment, and Space, Hangzhou, China, 23–27 October 2002; Ocean Remote Sensing and Applications; SPIE Proceedings 2003. SPIE: Bellingham, WA, USA, 2003; Volume 4892, pp. 415–425. [Google Scholar] [CrossRef]
  54. Hu, J.Y.; Kawamura, H.; Tang, D.L. Tidal front around the Hainan Island, northwest of the South China Sea. J. Geophys. Res. Ocean. 2003, 108, 3342. [Google Scholar] [CrossRef]
  55. Tong, J.Q.; Gan, Z.J.; Qi, Y.Q.; Mao, Q.W. Predicted positions of tidal fronts in continental shelf of South China Sea. J. Mar. Syst. 2010, 82, 145–153. [Google Scholar] [CrossRef]
  56. Zeng, X.Z.; Belkin, I.M.; Peng, S.Q.; Li, Y.N. East Hainan upwelling fronts detected by remote sensing and modelled in summer. Int. J. Remote Sens. 2014, 35, 4441–4451. [Google Scholar] [CrossRef]
  57. Jing, Z.Y.; Qi, Y.Q.; Du, Y.; Zhang, S.W.; Xie, L.L. Summer upwelling and thermal fronts in the northwestern South China Sea: Observational analysis of two mesoscale mapping surveys. J. Geophys. Res. Ocean. 2015, 120, 1993–2006. [Google Scholar] [CrossRef]
  58. Jing, Z.Y.; Qi, Y.Q.; Fox-Kemper, B.; Du, Y.; Lian, S.M. Seasonal thermal fronts on the northern South China Sea shelf: Satellite measurements and three repeated field surveys. J. Geophys. Res. Ocean. 2016, 121, 1914–1930. [Google Scholar] [CrossRef]
  59. Lin, P.G.; Cheng, P.; Gan, J.P.; Hu, J.Y. Dynamics of wind-driven upwelling off the northeastern coast of Hainan Island. J. Geophys. Res. Ocean. 2016, 121, 1160–1173. [Google Scholar] [CrossRef]
  60. Li, Y.N.; Curchitser, E.N.; Wang, J.; Peng, S.Q. Tidal effects on the surface water cooling northeast of Hainan Island, South China Sea. J. Geophys. Res. Ocean. 2020, 125, e2019JC016016. [Google Scholar] [CrossRef]
  61. Bai, P.; Yang, J.L.; Xie, L.L.; Zhang, S.W.; Ling, Z. Effect of topography on the cold water region in the east entrance area of Qiongzhou Strait. Estuar. Coast. Shelf Sci. 2020, 242, 106820. [Google Scholar] [CrossRef]
  62. Li, J.Y.; Li, M.; Wang, C.; Zheng, Q.A.; Xu, Y.; Zhang, T.Y.; Xie, L.L. Multiple mechanisms for chlorophyll a concentration variations in coastal upwelling regions: A case study east of Hainan Island in the South China Sea. Ocean Sci. 2023, 19, 469–484. [Google Scholar] [CrossRef]
  63. Xie, L.L.; Pallas-Sanz, E.; Zheng, Q.A.; Zhang, S.W.; Zong, X.L.; Yi, X.F.; Li, M.M. Diagnosis of 3D vertical circulation in the upwelling and frontal zones east of Hainan Island, China. J. Phys. Oceanogr. 2017, 47, 755–774. [Google Scholar] [CrossRef]
  64. Lü, X.G.; Qiao, F.L.; Wang, G.S.; Xia, C.S.; Yuan, Y.L. Upwelling off the west coast of Hainan Island in summer: Its detection and mechanisms. Geophys. Res. Lett. 2008, 35, L02604. [Google Scholar] [CrossRef]
  65. Zhu, J.Y.; Zhou, Q.Y.; Zhou, Q.Q.; Geng, X.X.; Shi, J.; Guo, X.Y.; Yu, Y.; Yang, Z.W.; Fan, R.F. Interannual variation of coastal upwelling around Hainan Island. Front. Mar. Sci. 2023, 10, 1054669. [Google Scholar] [CrossRef]
  66. Nguyen-Duy, T.; Ayoub, N.K.; Marsaleix, P.; Toublanc, F.; De Mey-Frémaux, P.; Piton, V.; Herrmann, M.; Duhaut, T.; Tran, M.C.; Ngo-Duc, T. Variability of the Red River plume in the Gulf of Tonkin as revealed by numerical modeling and clustering analysis. Front. Mar. Sci. 2021, 8, 772139. [Google Scholar] [CrossRef]
  67. van Maren, D.S. Water and sediment dynamics in the Red River mouth and adjacent coastal zone. J. Asian Earth Sci. 2007, 29, 508–522. [Google Scholar] [CrossRef]
  68. Gao, J.S.; Mo, L.Q.; Lu, H.F.; Meng, X.N.; Wu, G.D.; Wang, D.P.; Nguyen, K.C.; Hu, B.Q.; Tran, A.T. Spring circulation characteristics and formation mechanism in the Beibu Gulf. Front. Mar. Sci. 2024, 11, 1398702. [Google Scholar] [CrossRef]
  69. Nguyen, Q.H.; Tran, V.N. Temporal changes in water and sediment discharges: Impacts of climate change and human activities in the Red River basin (1958–2021) with projections up to 2100. Water 2024, 16, 1155. [Google Scholar] [CrossRef]
  70. Wang, D.X.; Liu, Q.Y.; Xie, Q.; He, Z.G.; Zhuang, W.; Shu, Y.Q.; Xiao, X.J.; Hong, B.; Wu, X.Y.; Sui, D.D. Progress of regional oceanography study associated with western boundary current in the South China Sea. Chin. Sci. Bull. 2013, 58, 1205–1215. [Google Scholar] [CrossRef]
  71. Yu, Y.; Wang, Y.T.; Cao, L.; Tang, R.; Chai, F. The ocean-atmosphere interaction over a summer upwelling system in the South China Sea. J. Mar. Syst. 2020, 208, 103360. [Google Scholar] [CrossRef]
  72. Le, P.T.D.; Fischer, A.M. Trends and patterns of SST and associated frontal frequency in the Vietnamese upwelling center. J. Mar. Syst. 2021, 222, 103600. [Google Scholar] [CrossRef]
  73. Fang, G.H.; Fang, W.D.; Fang, Y.; Wang, K. A survey of studies on the South China Sea upper ocean circulation. Acta Oceanogr. Taiwanica 1998, 37, 1–16. [Google Scholar]
  74. Lin, H.Y.; Hu, J.Y.; Liu, Z.Y.; Belkin, I.M.; Sun, Z.Y.; Zhu, J. A peculiar lens-shaped structure observed in the South China Sea. Sci. Rep. 2017, 7, 478. [Google Scholar] [CrossRef]
  75. Fang, W.D.; Guo, Z.X.; Huang, Y.T. Observational study of the circulation in the southern South China Sea. Chin. Sci. Bull. 1998, 43, 898–905. [Google Scholar] [CrossRef]
  76. Fang, W.D.; Fang, G.H.; Shi, P.; Huang, Q.Z.; Xie, Q. Seasonal structures of upper layer circulation in the southern South China Sea from in situ observations. J. Geophys. Res. Ocean. 2002, 107, 3202. [Google Scholar] [CrossRef]
  77. Li, Y.L.; Han, W.Q.; Wilkin, J.L.; Zhang, W.F.G.; Arango, H.; Zavala-Garay, J.; Levin, J.; Castruccio, F.S. Interannual variability of the surface summertime eastward jet in the South China Sea. J. Geophys. Res. Ocean. 2014, 119, 7205–7228. [Google Scholar] [CrossRef]
  78. Huang, X.L.; Jing, Z.Y.; Zheng, R.X.; Cao, H.J. Dynamical analysis of submesoscale fronts associated with wind-forced offshore jet in the western South China Sea. Acta Oceanol. Sin. 2020, 39, 1–12. [Google Scholar] [CrossRef]
  79. Sun, Y.; Lan, J. Summertime eastward jet and its relationship with western boundary current in the South China Sea on the interannual scale. Clim. Dyn. 2021, 56, 935–947. [Google Scholar] [CrossRef]
  80. Yu, Z.T.; Fan, Y.L.; Metzger, E.J. On the anomalous structure of the Southeast Vietnam Offshore Current during 1994 to 2015. Ocean Model. 2023, 183, 102199. [Google Scholar] [CrossRef]
  81. Feng, Y.K.; Park, E.; Wang, J.Y.; Feng, L.; Tran, D.D. Severe decline in extent and seasonality of the Mekong plume after 2000. J. Hydrol. 2024, 643, 132026. [Google Scholar] [CrossRef]
  82. Ruiz-Barradas, A.; Nigam, S. Hydroclimate variability and change over the Mekong River Basin. In The Mekong River Basin; Nguyen, H.Q., Apel, H., Le, Q.B., Nguy, M.T., Sridhar, V., Eds.; Elsevier: Amsterdam, The Netherlands, 2024; Chapter 1; pp. 3–52. [Google Scholar] [CrossRef]
  83. Loisel, H.; Mangin, A.; Vantrepotte, V.; Dessailly, D.; Dinh, D.N.; Garnesson, P.; Ouillon, S.; Lefebvre, J.P.; Mériaux, X.; Phan, T.M. Variability of suspended particulate matter concentration in coastal waters under the Mekong’s influence from ocean color (MERIS) remote sensing over the last decade. Remote Sens. Environ. 2014, 150, 218–230. [Google Scholar] [CrossRef]
  84. Yanagi, T.; Takao, T. Seasonal variation of three-dimensional circulations in the Gulf of Thailand. La Mer 1998, 36, 43–55. [Google Scholar]
  85. Robinson, M.K. The Physical Oceanography of the Gulf of Thailand, Naga Expedition; Naga Report; The University of California, Scripps Institution of Oceanography: La Jolla, CA, USA, 1974; Volume 3, Part 1; Available online: https://escholarship.org/uc/item/4mf3d0b7 (accessed on 8 December 2024).
  86. Zhang, L.; Sun, R.L.; Li, P.L.; Ye, G.Q. Seasonal and interannual variabilities of the thermal front east of Gulf of Thailand. Front. Mar. Sci. 2024, 11, 1398791. [Google Scholar] [CrossRef]
  87. Liu, J.P.; DeMaster, D.J.; Nittrouer, C.A.; Eidam, E.F.; Nguyen, T.T. A seismic study of the Mekong subaqueous delta: Proximal versus distal sediment accumulation. Cont. Shelf Res. 2017, 147, 197–212. [Google Scholar] [CrossRef]
  88. Wang, X.; Zhang, W.Y.; Xie, X.O.; Chen, H.; Chen, B.C. Holocene sedimentary distribution and morphological characteristics reworked by East Asian monsoon dynamics in the Mekong River shelf, South Vietnam. Estuar. Coast. Shelf Sci. 2024, 302, 108784. [Google Scholar] [CrossRef]
  89. Zu, T.T.; Gan, J.P.; Erofeeva, S.Y. Numerical study of the tide and tidal dynamics in the South China Sea. Deep-Sea Res. Part I 2008, 55, 137–154. [Google Scholar] [CrossRef]
  90. Unverricht, D.; Nguyen, T.C.; Heinrich, C.; Szczuciński, W.; Lahajnar, N.; Stattegger, K. Suspended sediment dynamics during the inter-monsoon season in the subaqueous Mekong Delta and adjacent shelf, southern Vietnam. J. Asian Earth Sci. 2014, 79, 509–519. [Google Scholar] [CrossRef]
  91. Becker, J.J.; Sandwell, D.T.; Smith, W.H.F.; Braud, J.; Binder, B.; Depner, J.; Fabre, D.; Factor, J.; Ingalls, S.; Kim, S.H.; et al. Global bathymetry and elevation data at 30 arc seconds resolution: SRTM30_PLUS. Mar. Geod. 2009, 32, 355–371. [Google Scholar] [CrossRef]
  92. Pokavanich, T.; Worrawatanathum, V.; Phattananuruch, K.; Koolkalya, S. Seasonal dynamics and three-dimensional hydrographic features of the eastern Gulf of Thailand: Insights from high-resolution modeling and field measurements. Water 2024, 16, 1962. [Google Scholar] [CrossRef]
  93. Akhir, M.F.; Daryabor, F.; Husain, M.L.; Tangang, F.; Qiao, F.L. Evidence of upwelling along Peninsular Malaysia during southwest monsoon. Open J. Mar. Sci. 2015, 5, 273–279. [Google Scholar] [CrossRef]
  94. Kok, P.H.; Akhir, M.F.; Tangang, F.T. Thermal frontal zone along the east coast of Peninsular Malaysia. Cont. Shelf Res. 2015, 110, 1–15. [Google Scholar] [CrossRef]
  95. Kok, P.H.; Akhir, M.F.M.; Tangang, F.; Husain, M.L. Spatiotemporal trends in the southwest monsoon wind-driven upwelling in the southwestern part of the South China Sea. PLoS ONE 2017, 12, e0171979. [Google Scholar] [CrossRef]
  96. Daud, N.R.; Akhir, M.F.; Muslim, A.M. Dynamic of ENSO towards upwelling and thermal front zone in the east coast of Peninsular Malaysia. Acta Oceanol. Sin. 2019, 38, 48–60. [Google Scholar] [CrossRef]
  97. Kok, P.H.; Akhir, M.F.; Qiao, F.L. Distinctive characteristics of upwelling along the Peninsular Malaysia’s east coast during 2009/10 and 2015/16 El Niños. Cont. Shelf Res. 2019, 184, 10–20. [Google Scholar] [CrossRef]
  98. Daryabor, F.; Ooi, S.H.; Samah, A.A.; Akbari, A. Dynamics of the water circulations in the southern South China Sea and its seasonal transports. PLoS ONE 2016, 11, e0158415. [Google Scholar] [CrossRef] [PubMed]
  99. Roseli, N.H.; Akhir, M.F.; Husain, M.L.; Tangang, F.; Ali, A. Water mass characteristics and stratification at the shallow Sunda Shelf of southern South China Sea. Open J. Mar. Sci. 2015, 5, 455–467. [Google Scholar] [CrossRef]
  100. Wang, T.H.; Sun, Y.; Su, H.; Lu, W.F. Declined trends of chlorophyll a in the South China Sea over 2005–2019 from remote sensing reconstruction. Acta Oceanol. Sin. 2023, 42, 12–24. [Google Scholar] [CrossRef]
  101. Deng, L.; Zhao, J.; Sun, S.J.; Ai, B.; Zhou, W.; Cao, W.X. Two-decade satellite observations reveal variability in size-fractionated phytoplankton primary production in the South China Sea. Deep-Sea Res. Part I 2024, 206, 104258. [Google Scholar] [CrossRef]
  102. Wang, G.H.; Li, J.X.; Wang, C.Z.; Yan, Y.W. Interactions among the winter monsoon, ocean eddy and ocean thermal front in the South China Sea. J. Geophys. Res. Ocean. 2012, 117, C08002. [Google Scholar] [CrossRef]
  103. Sun, R.L.; Ling, Z.; Chen, C.L.; Yan, Y.W. Interannual variability of thermal front west of Luzon Island in boreal winter. Acta Oceanol. Sin. 2015, 34, 102–108. [Google Scholar] [CrossRef]
  104. Sun, R.L.; Li, P.L.; Gu, Y.Z.; Zhou, C.J.; Liu, C.; Zhang, L. Seasonal variation of the shape and location of the Luzon cold eddy. Acta Oceanol. Sin. 2023, 42, 14–24. [Google Scholar] [CrossRef]
  105. Sun, R.L.; Li, P.L.; Zhai, F.G.; Gu, Y.Z.; Bai, P. New insight into the formation mechanism of wintertime thermal front west of Luzon Island. J. Geophys. Res. Ocean. 2024, 129, e2023JC020774. [Google Scholar] [CrossRef]
  106. Chang, Y.; Shih, Y.Y.; Tsai, Y.C.; Lu, Y.H.; Liu, J.T.; Hsu, T.Y.; Yang, J.H.; Wu, X.H.; Hung, C.C. Decreasing trend of Kuroshio intrusion and its effect on the chlorophyll-a concentration in the Luzon Strait, South China Sea. GISci. Remote Sens. 2022, 59, 633–647. [Google Scholar] [CrossRef]
  107. Lao, Q.B.; Liu, S.H.; Wang, C.; Chen, F.J. Global warming weakens the ocean front and phytoplankton blooms in the Luzon Strait over the past 40 years. J. Geophys. Res. Biogeosci. 2023, 128, e2023JG007726. [Google Scholar] [CrossRef]
  108. Caruso, M.J.; Gawarkiewicz, G.G.; Beardsley, R.C. Interannual Variability of the Kuroshio Intrusion in the South China Sea. J. Oceanogr. 2006, 62, 559–575. [Google Scholar] [CrossRef]
Figure 1. Long-term (2015–2022) mean monthly maps of SST (°C) (with custom color scales).
Remotesensing 17 00817 g001
Figure 2. Long-term (2015–2022) mean monthly maps of SST gradient magnitude GM (°C/km) (with custom color scales).
Remotesensing 17 00817 g002
Figure 3. Long-term (2015–2022) mean monthly maps of log-transformed SST gradient magnitude ln(GM) (with custom color scales).
Remotesensing 17 00817 g003
Figure 4. Long-term mean monthly maps of GM (°C/km) in Region 1 (with custom color scales). Bathymetry (meters) is shown with selected isobaths (thin white lines).
Remotesensing 17 00817 g004
Figure 5. Long-term mean monthly maps of GM (°C/km) in Region 2 (with custom color scales). Bathymetry (meters) is shown with selected isobaths (thin white lines).
Remotesensing 17 00817 g005
Figure 6. Long-term mean monthly maps of GM (°C/km) in Region 3 (with custom color scales). Bathymetry (meters) is shown with selected isobaths (thin white lines).
Remotesensing 17 00817 g006
Figure 7. Long-term mean monthly maps of GM (°C/km) in Region 4 (with custom color scales). Bathymetry (meters) is shown with selected isobaths (thin white lines).
Remotesensing 17 00817 g007
Figure 8. Long-term mean monthly maps of GM (°C/km) in Region 5 (with custom color scales). Bathymetry (meters) is shown with selected isobaths (thin white lines).
Remotesensing 17 00817 g008
Figure 9. Five-day mean maps of SST (°C) showing the most pronounced summertime eastward jets in June–September 2015–2022 (with custom color scales).
Remotesensing 17 00817 g009
Figure 10. Summertime eastward jet in five-day mean maps of SST (top left) and GM (top right) during 16–20 June 2016. Vertical lines along 111.5°E mark the location of cross-jet distributions of SST and GM (bottom). The cross-jet distribution of SST is symmetrical and V-shaped, which is typical of most cases when a well-developed SEJ was observed (38 cases in 2015–2022).
Remotesensing 17 00817 g010
Table 1. Monthly SST and magnitude of summer cooling (July SST minus May SST) in three regions, where the summer cooling appears most pronounced.
RegionMay SST
(°C)
June SST
(°C)
July SST
(°C)
Cooling Magnitude
(July SST–May SST)
West of Luzon30.709330.382030.00980.70
Central SCS30.523429.953629.46601.07
Gulf of Thailand30.665129.813829.59001.08
Disclaimer/Publisher’s Note: The statements, opinions and data contained in all publications are solely those of the individual author(s) and contributor(s) and not of MDPI and/or the editor(s). MDPI and/or the editor(s) disclaim responsibility for any injury to people or property resulting from any ideas, methods, instructions or products referred to in the content.

