Technical Note

A Novel Method for PolISAR Interpretation of Space Target Structure Based on Component Decomposition and Coherent Feature Extraction

College of Electronic Science and Technology, National University of Defense Technology, Changsha 410073, China
*
Author to whom correspondence should be addressed.
Remote Sens. 2025, 17(6), 1079; https://doi.org/10.3390/rs17061079
Submission received: 11 February 2025 / Revised: 16 March 2025 / Accepted: 17 March 2025 / Published: 19 March 2025

Abstract

:
Inverse Synthetic Aperture Radar (ISAR) serves as a valuable instrument for surveillance of space targets. There has been a great deal of research on space target identification using ISAR. However, the polarization characteristics of space target components are rarely studied. Polarimetric Inverse Synthetic Aperture Radar (PolISAR) comprises two information dimensions, namely, polarization and image, enabling a more comprehensive understanding of target structures. This paper proposes a space target structure polarization interpretation method based on component decomposition and PolISAR feature extraction. The proposed method divides the target into components at the stage of modeling. Subsequently, electromagnetic calculations are performed for each component. The names of these components are used to label the dataset. Multiple polarization decomposition techniques are applied and many polarization features are obtained. The mapping correlations between the interpreted results and authentic target structures are improved through preferential selection of polarization features. Ultimately, the method is validated through analysis of simulation and anechoic chamber measurement data. The results show that the proposed method exhibits a more intuitive correlation with the authentic target structures compared to traditional polarized interpretation methods based on Cameron decomposition.

1. Introduction

As an increasing number of nations develop the capability to launch extensive satellite constellations, space target surveillance has emerged as a critical method for countries to compete for advantageous positions in outer space. ISAR is an essential element of space target observation systems. It is distinguished by its capability to operate in all weather conditions and its strong wide-area monitoring attributes [1]. Identifying the structure of a space target is important for space target surveillance. Some target components have a distinct correlation to the type of targets, and can be used to evaluate the function of non-cooperative space targets.
Research on space targets has attained significant achievements in ISAR imaging and processing. High-resolution imaging is important for space target analysis. An advanced scheme based on blind source separation to separate and suppress clutter from the range ambiguity region was put forward by [2]. ISAR image semantic segmentation divides the space target into non-overlapping regions, and can be viewed as a method of recognizing component structures [3,4,5,6,7]. On the basis of a deep feature aggregation network (DFANet), [8] fused features of various resolutions and scales, with the result outperforming other segmentation algorithms. In addition, ISAR images contain 3D information of component structures. ISAR three-dimensional geometry reconstruction technology overcomes the lack of height–direction information and visualizes the 3D components structures of targets [9,10,11,12]. What is more, it has the potential to identify component structures in ISAR images based on advanced scattering center models and parameter extraction [13,14,15]. In [16], the sparsity of ISAR images was utilized to convert radar images into a set of scatter points by employing the Random Sample Consensus (RANSAC) algorithm for scattering point matching. Yun et al. [17] applied semantic segmentation to the extraction of scatter centers. However, most of these methods primarily utilize the amplitude information of ISAR images, and it is difficult to effectively identify small components that occupy a small number of pixel units.
To solve this problem, it is necessary to expand the dimensionality of information and use deep learning methods to obtain deeper feature extraction. Computer vision has been extensively utilized for target recognition and classification in recent years. Convolutional Neural Networks (CNNs) are commonly employed in remote sensing tasks such as target detection and image recognition, leading to the development of models such as YOLOv8 [18], PT-CCNN [19], P-DCNN [20], IITR-Net [21], and SDRnet [22]. In [23,24], the authors discussed the joint processing of ISAR images and optical images, while in [25,26,27] the focus was on the fusion of multiple ISAR images. Additionally, [28] presented a target recognition technique for ISAR images based on polar coordinates and shape matrix descriptions. These methods have significantly advanced classification and recognition techniques for space targets. In addition, advanced deep learning models in remote sensing, such as the Mamba model [29,30], Memory-Augmented Auto-Encoder (MAAE) with adaptive reconstruction [31], and two-stream isolation forest [32] have the potential to be applied to space target structure identification.
As an intrinsic property of electromagnetic waves, polarization is highly sensitive to the physical attributes of a target, including its dielectric constant, geometrical shape, and space orientation [33]. Zhang et al. optimized the phase gradient autofocus algorithm by utilizing the Cloude–Pottier decomposition method parameters H and α , resulting in significantly elevated image quality [34]. In [35,36], the authors employed polarization correlation patterns for the interpretation of ISAR images. To achieve pixel-level interpretation, Wu [37] integrated features from three polarization target decomposition methods during the analysis of target structures. Furthermore, [38] introduced a target structure interpretation method based on null-polarization features. However, the aforementioned methods interpret strong scattering points in ISAR images as canonical structures (i.e., dihedral corner reflector, trihedral corner reflector, and plate), as shown in Figure 1.
These canonical scatterers differ from the actual structure of the target, and have limited significance for target recognition. To solve this problem, we propose a novel algorithm to identify the physical structure of space targets on the basis of the component decomposition and polarimetric decomposition methods. The advantages of the proposed methodology are as follows:
  • A novel component decomposition method for electromagnetic simulation of space target components.
  • Direct pixel-by-pixel identification of the components of space targets.
The rest of this paper is organized as follows: Section 1 presents the state of current research on ISAR image target interpretation and outlines the structure of the article; Section 2 presents the methods for component decomposition, then introduces relevant work on polarization target decomposition and feature selection; Section 3 describes the series of experiments we conducted on simulated and real data to validate the performance of the proposed methodology; Section 4 presents the results, demonstrates the limitations of the study, and suggests possible solutions to these limitations; finally, conclusions and an outline for future work are provided in Section 5.

2. Materials and Methods

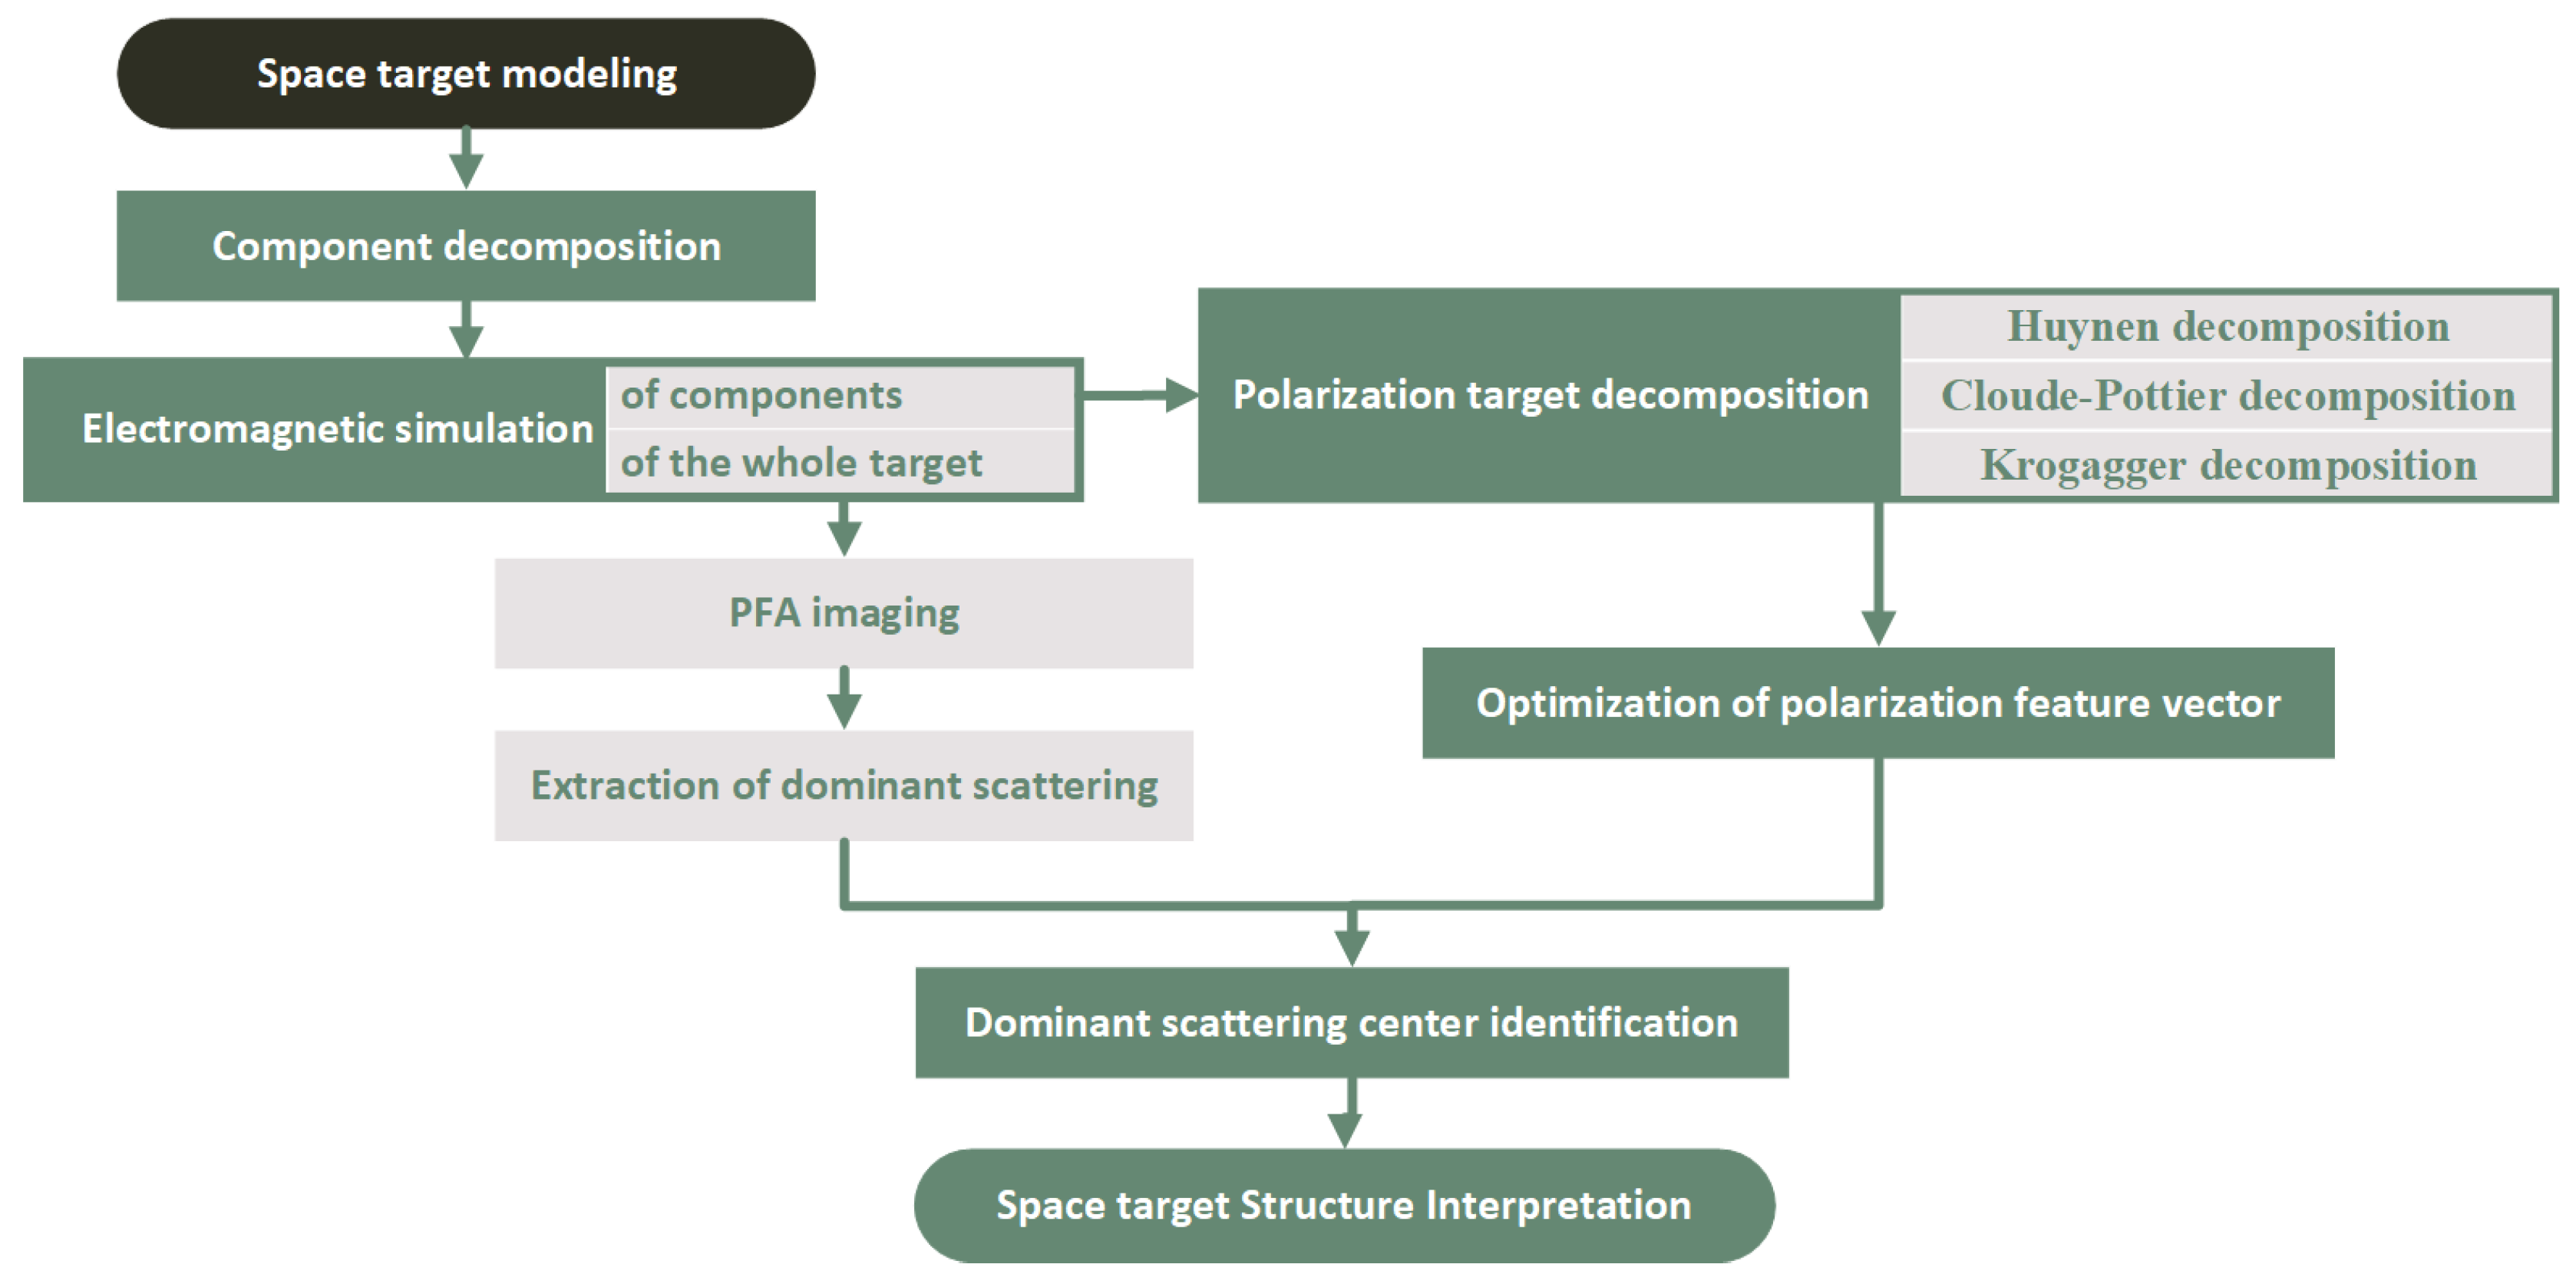
The proposed method interprets the target structure by labeling the components of space targets. First, a new component decomposition method is used to decompose space targets into components, with electromagnetic calculations performed for both the individual components and the overall target. Simulation echo datasets are obtained, then three representative polarimetric target decomposition methods (Huynen decomposition [39], Cloude–Pottier decomposition [40], and Krogager decomposition [41]) are selected to construct new polarimetric feature vectors through feature selection. After this, the scattering centers of the target are extracted and support vector machines are employed for scattering center identification and visualization, ultimately achieving structural identification of the target. The basic process is illustrated as shown in Figure 2.

2.1. Component Decomposition

The component decomposition method is commonly employed to achieve precise interpretation. This method decomposes complex space targets into simple geometries, performs electric field calculations on each component, and finally obtains the scattering characteristics of the entire target by vector synthesis.
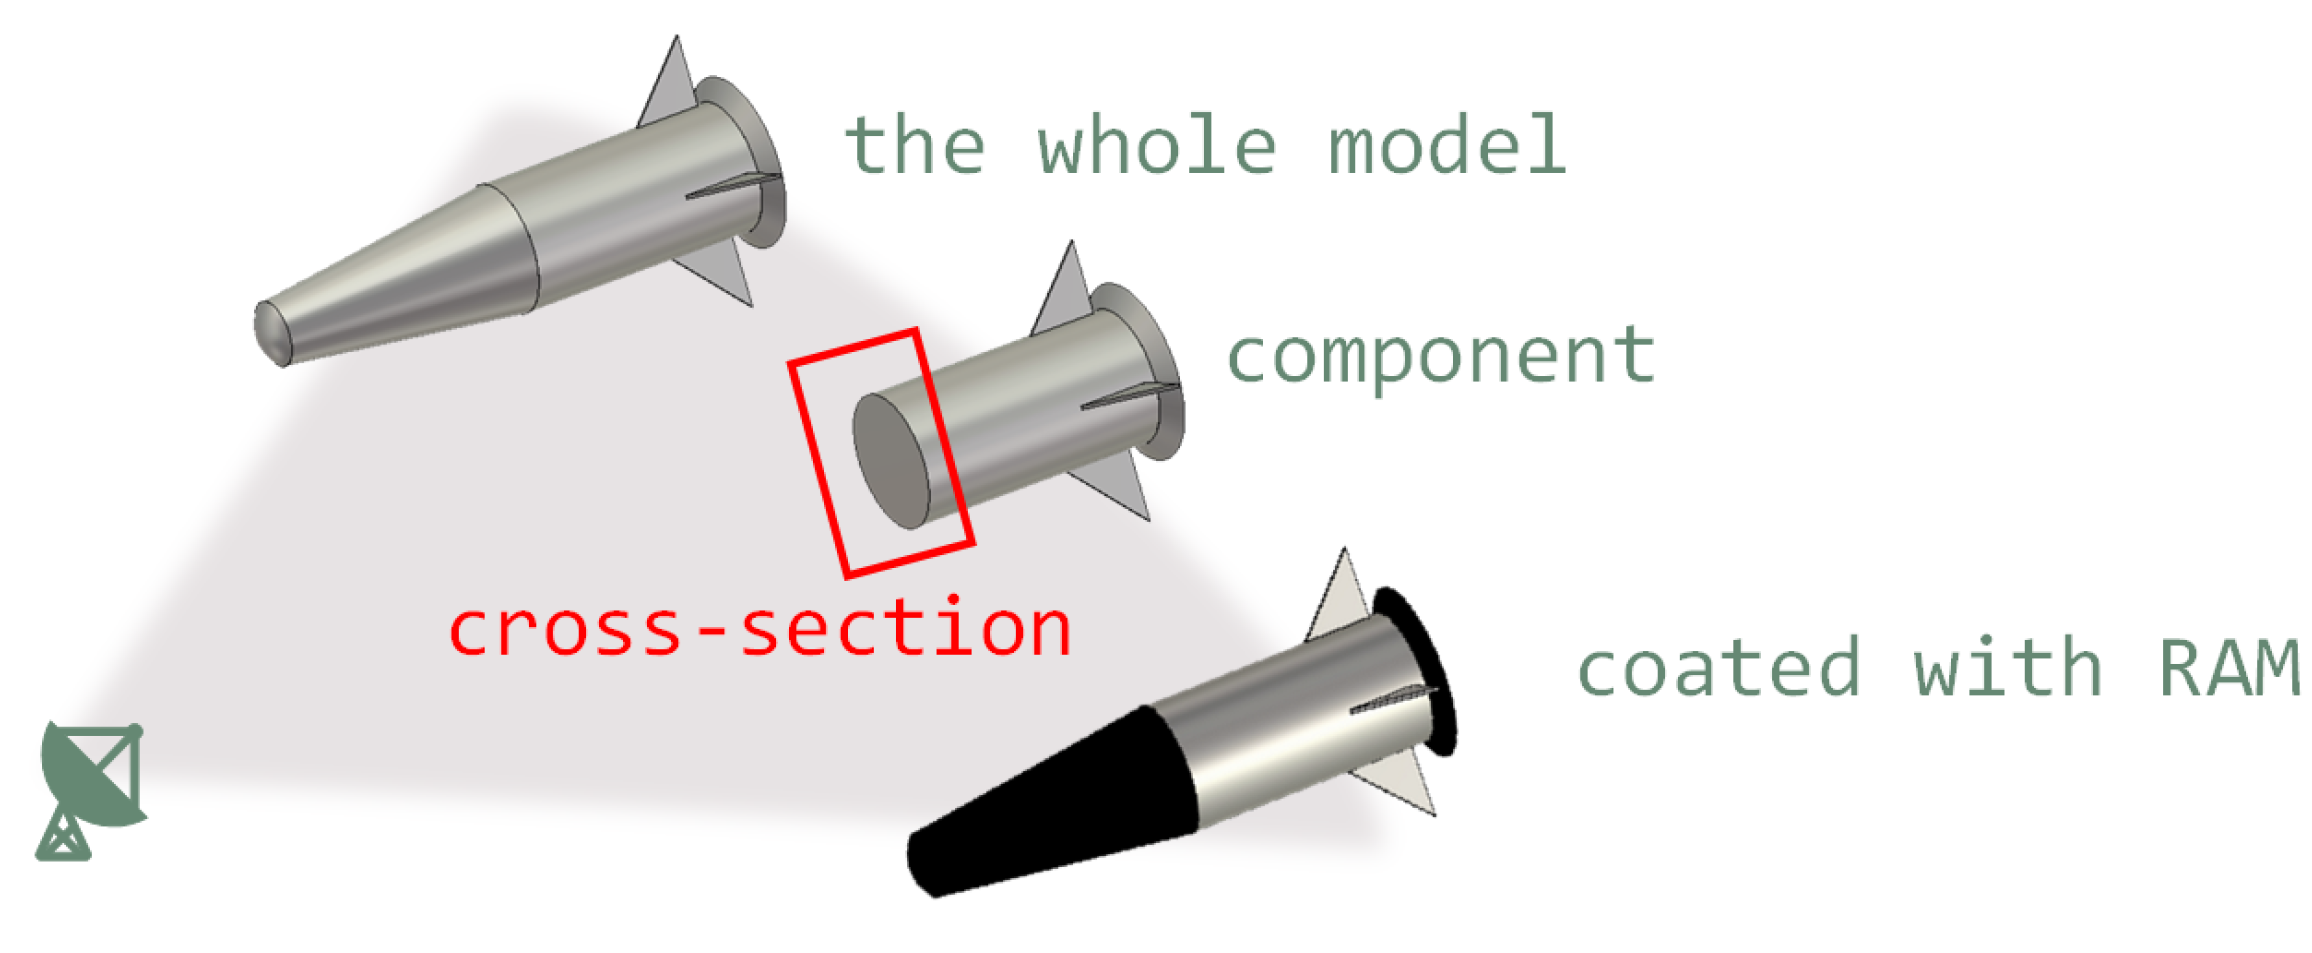
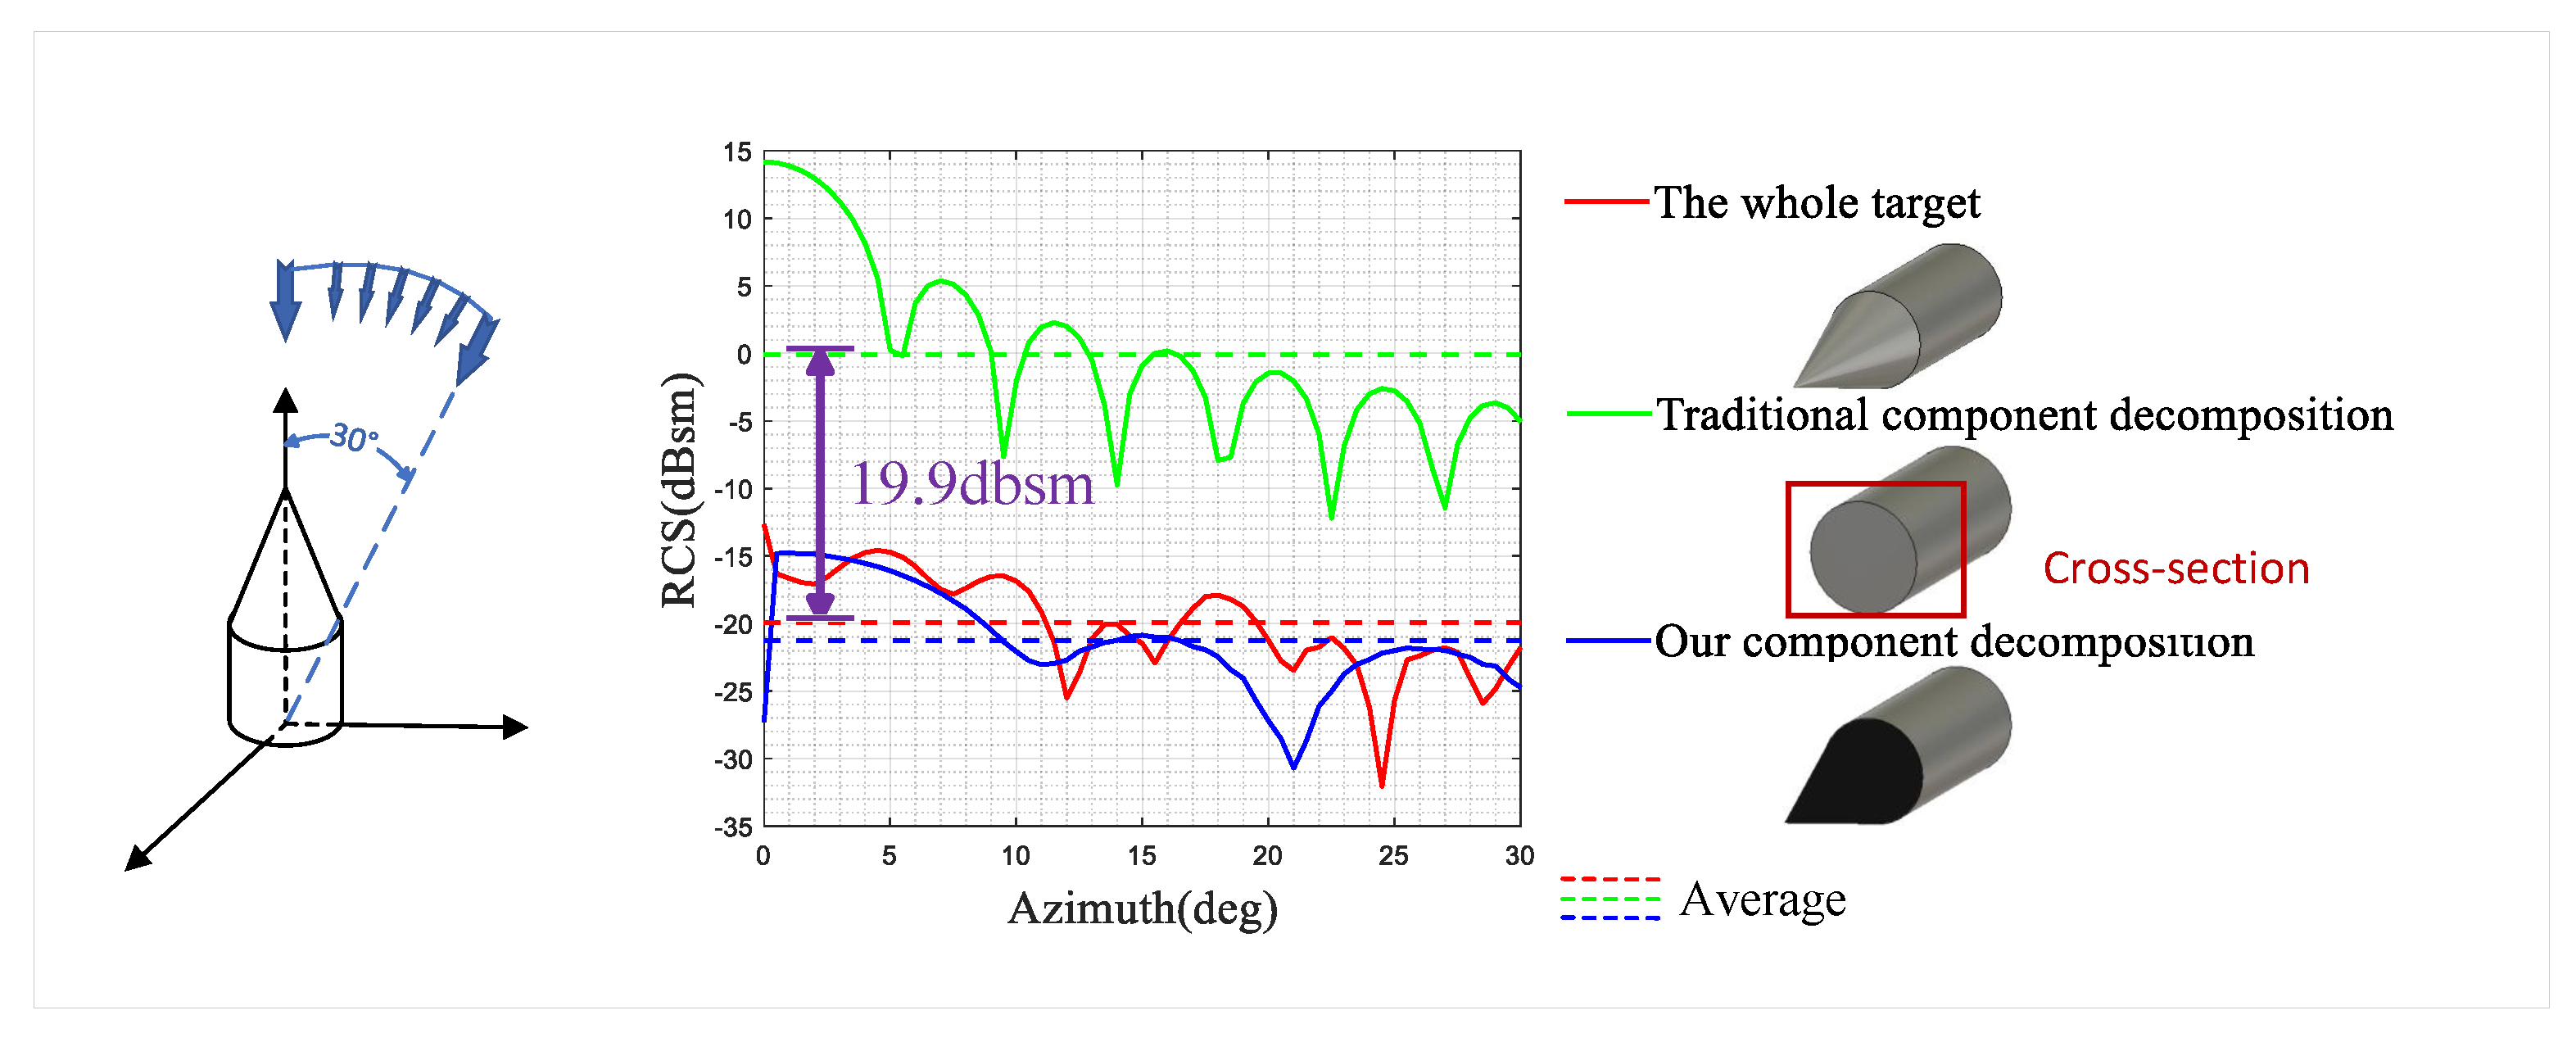
However, modeling and performing electromagnetic simulations on individual components may insert scattering mechanisms that are not present in the overall target, such as the cross-section illustrated in Figure 3. As shown in Figure 4, the conventional component decomposition method leads to a significant increase of 19.9 dbsm in the average RCS, as cusp bypassing is replaced by specular scattering. In contrast, our proposed component decomposition method allows the scattering mechanism of the components to be largely maintained.
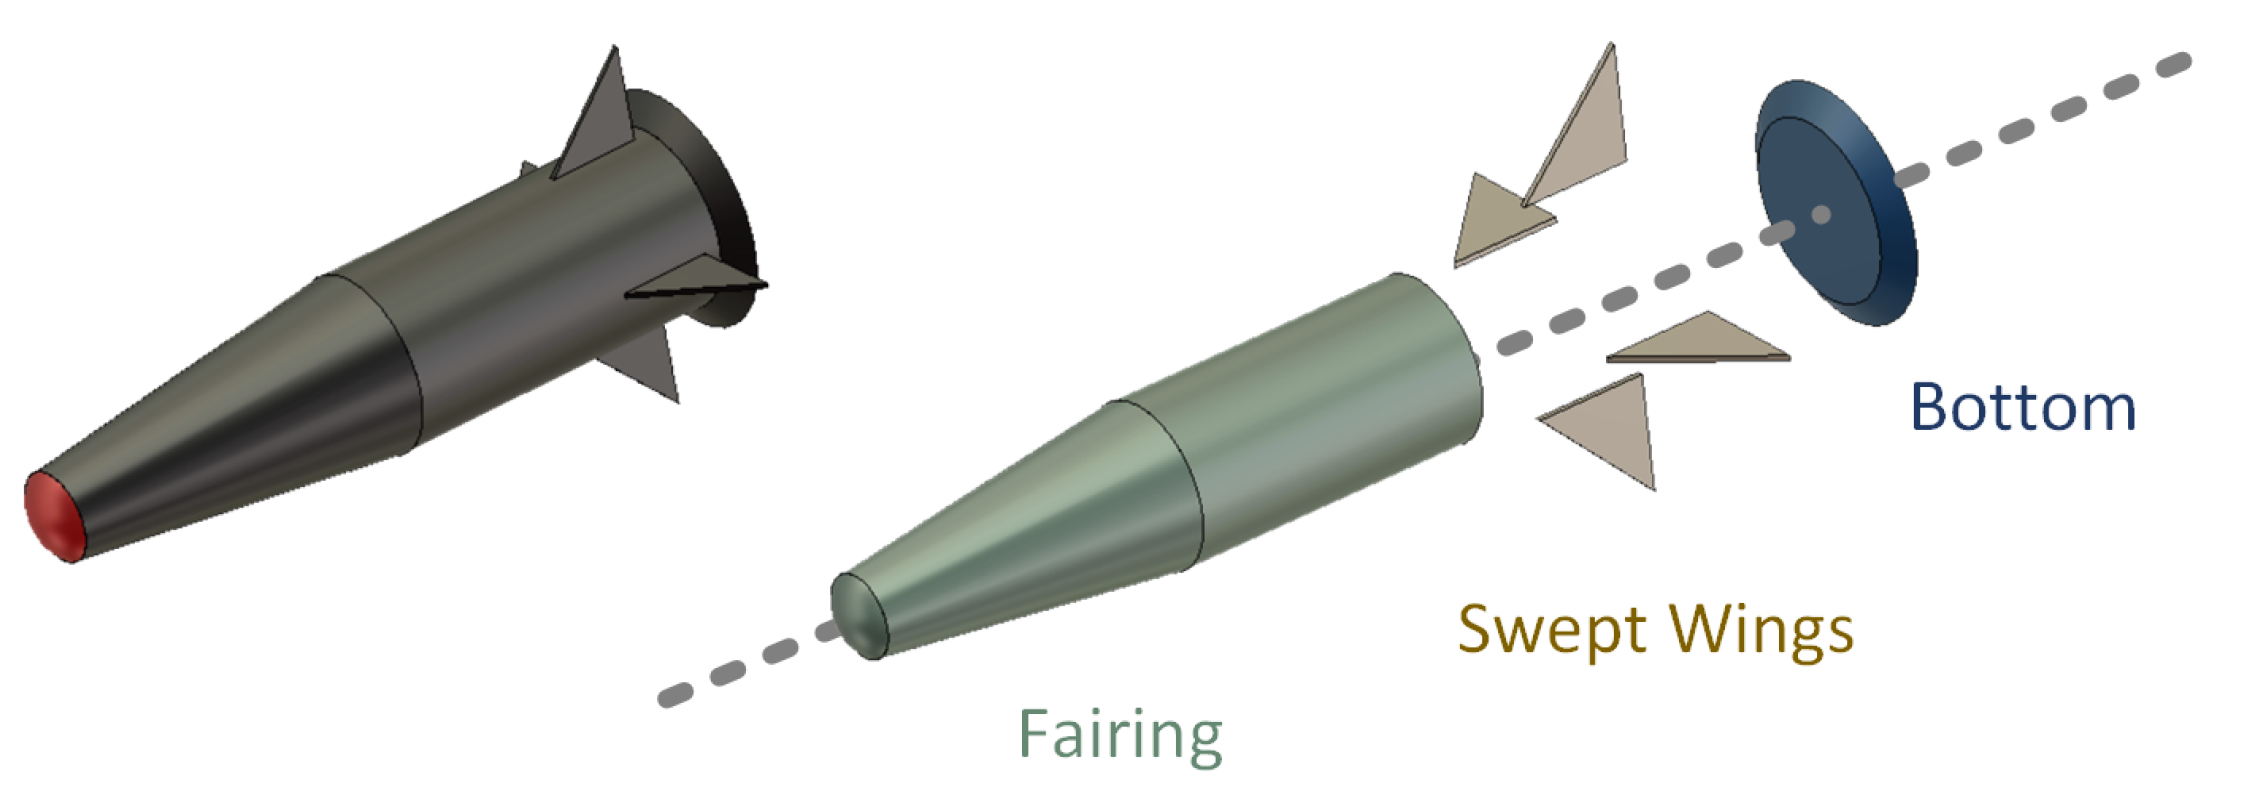
Consequently, this study does not model the components independently. Instead, it applies ideal absorptive materials to structures that do not participate in electromagnetic calculations. The black portion depicted in Figure 3 symbolizes a perfect black body that exclusively absorbs electromagnetic waves. This method not only avoids adding scattering mechanisms that are absent in the whole target, but also avoids exploring the transmission characteristics of local-to-global scattering. In this way, the purpose of decomposing the target structures is achieved. As shown in Figure 5, the target is divided into three sections: fairing, swept wings, and bottom base. Selection and division of these components are primarily based on their physical and engineering principles. For example, swept wings are critical for aerodynamic performance, and are typically characterized by their planar geometry. Similarly, fairing is often associated with specific shapes and orientations that influence the interaction with electromagnetic waves. By focusing on the electromagnetic behavior of these physically meaningful components, the space target can be identified directly even without imaging.

2.2. Polarization Feature Extraction

The structural characteristics of the target can be obtained effectively by polarimetric decomposition. Among such techniques, Cloude–Pottier decomposition, Krogager decomposition, and Huynen decomposition have been widely used. Huynen decomposition is mainly used to distinguish between different scattering mechanisms such as surface scattering, body scattering, etc. Krogager decomposition is based on sphere, dihedral corner reflector, and helical components, and is suitable for analyzing symmetric structures. Cloude–Pottier decomposition quantifies the scattering randomness, anisotropy, and dominant scattering mechanism, and is suitable for asymmetric and complex scattering environments. Taking into account the complementary nature of these three polarization decomposition methods and the characteristics of the target data, this paper focuses on the three typical decomposition methods of Huynen decomposition, Cloude–Pottier decomposition, and Krogager decomposition.
Assuming that the polarization state of the radar transmission antenna is P E and that the polarization state of the receiving antenna is P R , the polarization state of the target scattering field is represented as follows:
P R = S · P E
where S denotes the Sinclair scattering matrix:
S = S h h S h v S v h S v v .
In Equation (2), h denotes the horizontal polarization for receiving and v signifies the vertical polarization for transmitting. Other parameters use the same definition.

2.2.1. Huynen Decomposition

When the absolute phase, amplitude, and backscatter conditions are ignored, the Huynen target parameters can indicate the polarization capabilities of the target. These parameters are closely linked to the structural characteristics of the target. According to matrix decomposition theory, an asymmetric matrix can be diagonalized through singular value decomposition:
S d = U S T · S · U E
where the column vectors of U S and U E correspond to the eigenvectors of the Hermitian matrices S S + and S + S .
Equation (2) can be further expressed as follows:
S = U S · S d · U E +
S = μ e i k e i θ s σ 3 e i τ s σ 2 e i ϑ σ 1 1 0 0 tan 2 γ e i ϑ σ 1 e i τ i σ 2 e i θ 1 σ 3
where σ 1 , σ 2 , and σ 3 are in the Pauli basis, while μ and k relate to the absolute magnitude and absolute phase, which are independent of the target’s electromagnetic scattering mechanisms and as such are not considered further. The parameters θ s , θ i , τ s , τ i , v, and γ represent the Huynen parameters for bistatic radar targets. For monostatic radar targets, the Huynen parameters are transformed into four parameters: θ , τ , v, and γ .
In [39], the authors utilized the Huynen target parameters to construct a four-dimensional feature vector [ | τ i τ s | , | τ i + τ s | , | v | , γ ] for target classification. This feature vector has demonstrated superior robustness and a clearer physical interpretation. Therefore, in this study we also employ this polarization feature vector.

2.2.2. Cloude–Pottier Decomposition

Under conditions of backscattering, the coherence matrix for media exhibiting scattering symmetry characteristics can be parameterized in terms that incorporate the parameters λ , α , β , δ , and γ :
T = U 3 λ 1 0 0 0 λ 2 0 0 0 λ 3 U 3 T
U 3 = cos α 1 cos α 2 cos α 3 sin α 1 cos β 1 e i δ 1 sin α 2 cos β 2 e i δ 2 sin α 3 cos β 3 e i δ 3 sin α 1 sin β 1 e i γ 1 sin α 2 sin β 2 c i γ 2 sin α 3 sin β 3 e i γ 3
where λ = ( λ 1 , λ 2 , λ 3 ) is the eigenvector, α = ( α 1 , α 2 , α 3 ) indicates the decomposition coefficient of the scattering mechanism, β = ( β 1 , β 2 , β 3 ) is the referenced orientation angle, δ = ( δ 1 , δ 2 , δ 3 ) represents the phase difference between S h h S v v and S h h + S v v , γ = γ 1 , γ 2 , γ 3 represents the phase difference between S h h + S v v and S h v , and U 3 represents the dominant matrix, which is determined by the maximum eigenvector of the coherence matrix and exhibits a certain level of randomness. This randomness is characterized by entropy:
H = i = 1 3 P i log 3 P i ,
P i = λ i j = 1 3 λ j .
According to Equation (9), it is easy to find that P 1 + P 2 + P 3 = 1 . The P i parameter can be considered as a kind of probability. According to the theory of optimal estimation, the α parameter can be defined as follows:
α = P 1 α 1 + P 2 α 2 + P 3 α 3 .
For random media, the α parameter is generally employed to assess the main scattering mechanism of the object under measurement.
Furthermore, the A parameter is defined to represent the anisotropy of the target, expressed as follows:
A = P 2 P 3 P 2 + P 3 .
The polarization entropy H, polarization scattering angle α , and anisotropy A constitute the three most widely utilized polarization feature parameters in Cloude–Pottier decomposition.

2.2.3. Krogager Decomposition

We can decompose the symmetric Sinclair matrix into a sum of three matrix components representing spherical scattering, dihedral scattering, and helical scattering:
S = e j ϕ + k H e j 2 θ e j ϕ S k S 1 0 0 1 + k D cos 2 θ sin 2 θ sin 2 θ cos 2 θ + k H e j 2 θ 1 ± j ± j 1
where K S , K D , and K H respectively denote the contributions from the sphere, dihedral corner reflector, and helical components, while θ indicates the orientation angle. By calculating the relative magnitudes of these three components within the target scattering mechanism, we can determine that
K o = k S k S + k D + k H ,
K e = k D k S + k D + k H ,
K h = 1 K o K e .
The parameters K o , K e , and K h are the polarization characteristics of Krogager decomposition, and respectively represent the contributions of the odd-order scattering, even-order scattering, and helical scattering mechanisms to the overall scattering mechanism.

2.3. Feature Selection

Traditional target structure interpretation typically categorizes complex target scattering mechanisms into canonical structures such as sphere, plate, trihedral corner, dipole, and dihedral corner reflectors, as illustrated in Figure 6a. All of these are strongly differentiated in terms of their scattering properties. The clustered scatter plot presented in Figure 6b provides visual evidence of this phenomenon.
The scattering mechanism of the components is the coupling of the aforementioned canonical structure scattering mechanisms. Therefore, the separability of the components is reduced. Additionally, the three polarization decomposition methods discussed earlier collectively yield thirteen polarization features, which poses a risk of dimensionality collapse. To enhance the representational capability of the feature vectors and reduce the training complexity of the classification network, this study employs the electromagnetic computation data of the aforementioned canonical structures as the training samples for feature selection.
Several feature selection methods are employed to ensure that the optimal feature subset is chosen, including ReliefF, Least Absolute Shrinkage and Selection Operator (LASSO), Random Forest Feature Importance (RFFI), Principal Component Analysis (PCA), and Maximum Relevance Minimum Redundancy (MRMR). The resulting feature vectors and their corresponding classification performance results are presented in Table 1 and Figure 7 below. SVM classifiers were used to obtain these results. The Radial Basis Function (RBF) was selected as the kernel function type, and its kernel scale was 0.61. The regularization parameter C was 1. The validation method used to examine the predictive accuracy of the SVM classifier was five-fold cross-validation.
According to Table 1 and Figure 7, it can be seen that the feature vector obtained by the ReliefF algorithm achieved the best classification performance. The results show that the feature vector selected by ReliefF achieves better TPR among all candidates, indicating its strong ability to correctly identify positive samples. In addition, the corresponding FPR is lower than alternative feature sets. These results validate the ability of the optimization strategy to effectively suppress false alarms while maintaining sensitivity.
Based on these results, the ReliefF algorithm was chosen to analyze the polarization features of canonical structures’ electromagnetic simulation data. The ReliefF algorithm is an efficient method for feature selection when solving multiclass classification problems [42]. It can evaluate the relevance of both features and classes. Assuming that there exists a training set D, the algorithm randomly selects a sample R from D, searches for the nearest-neighbor sample H from the samples of the same class as R, and finds the nearest-neighbor sample M from the samples of a different class than R. The algorithm then updates the weights of each feature according to the following rules. If the distance between R and H on a feature is smaller than the distance between R and M, then this feature is useful for distinguishing the nearest neighbors between the same class and different classes and the algorithm increases the weight of this feature. Conversely, if the distance between R and H on a feature is greater than the distance between R and M, then the weight of this feature is decreased. The above process is repeated m times, finally obtaining the average weights of each feature. We selected features based on their weight values to construct a feature vector | τ i τ s | , | τ i + τ s | , | v | , γ , K e , K h .
The terms | τ i τ s | and | τ i + τ s | characterize the symmetry and reciprocity of a target, respectively. The | v | parameter quantifies whether the scattering mechanism of the target corresponds to odd-bounce or even-bounce scattering. Additionally, the γ parameter distinguishes between polarized and non-polarized targets based on their depolarization properties, K e and K h respectively represent the contributions of the even-order scattering and helical scattering mechanisms to the overall scattering mechanism, K e represents the contributions of even-order scattering to the overall scattering mechanism, and K h represents the target’s rotational symmetry. For targets that exhibit a high degree of symmetry and smooth surfaces, the scattering properties are predominantly influenced by even-order reflections. The targets analyzed in this paper possess exact symmetry and rotational symmetry. The physical meaning of the selected features can correspond to the structure of the space target. This feature vector is subsequently utilized for interpreting space target structures.

3. Results

3.1. Experiments with Electromagnetic Simulation Data

Our simulation experiments utilized electromagnetic simulation data of a space target model. The model was a Perfect Electric Conductor (PEC). Figure 8 illustrates the dimensions of this model. During the electromagnetic calculations, we established a frequency sweep range of 8–12 GHz with a step size of 0.04 GHz. The electromagnetic simulation parameters of the components are shown in Table 2.
To present the results of the structures identification more intuitively, in this paper we perform ISAR imaging on the electromagnetic simulation data. Figure 9 shows the Pauli images at imaging angles of 30°, 45°, and 90°. The results of different interpretation methods are marked on these images.
As shown in Figure 10, the structure interpretation method based on Cameron decomposition mainly identifies the scattering centers as trihedral corner reflectors or plates. Even though these scattering centers indeed represent scattering mechanisms of trihedral/plate types, it is difficult to relate the results to the actual geometric structure of the target. Figure 11 shows the results of the proposed method, in which the data are labeled with the component names. The proposed method can identify components effectively when labeling data with component names. Thus, the locations of the fairings are marked as “Fairing” and the locations of the swept wings are designated as “Swept Wings”. These identification results have a better match with the actual structure of the target.
In contrast to Cameron decomposition, Krogager decomposition and Cloude–Pottier decomposition are not limited to the decomposition of the target structure into canonical structures, and as such can be used to characterize the scattering mechanisms of more complex structures. However, according to Figure 12, Cloude–Pottier decomposition identifies all the scattering centers of the target as fairings. This is clearly contrary to the actual situation. Cloude–Pottier decomposition is suitable for asymmetric and complex scattering environments, and is widely used in SAR-based complex feature recognition. Therefore, it is less discriminative for man-made target structures. Comparing Figure 11, Figure 12 and Figure 13, the results of Krogager decomposition are better than Cloude–Pottier decomposition, although the target’s wing is still incorrectly recognized as a fairing. Although Krogager decomposition applies to man-made targets, Krogager decomposition coefficients do not differentiate the parts better than the selected features in this experiment.
Overall, these results show that the proposed method has good performance on the simulation data.

3.2. Experiments with Anechoic Chamber Measurement Data

Measurement data were collected from the echo data of space targets in a microwave anechoic chamber. The dimensions of the solid model were the same as the dimensions of the 3D model shown in Figure 8. The sweep frequency ranged from 8.75 GHz to 10.75 GHz, while the step size was 0.02 GHz. Similarly, to provide a clearer display of the interpretation results, ISAR imaging was performed on the anechoic chamber measurement data. Figure 14 displays the Pauli images at imaging angles of 45°, 90°, and 120°. The interpretation results obtained from different methods are also marked on the ISAR images.
The structure interpretation method based on Cameron decomposition faces the same problem encountered during the previous simulation experiments. The results in Figure 15 show a considerable degree of confusion, particularly in the location of the target’s tail. This interpretation result deviates significantly from the actual structure of the target. The classifier identifies scattering centers as different types of canonical structures, such as “Trihedral/Plate”, “Dipole”, and “Quarter-Wave” (as illustrated in Figure 15a–c). There is no practical information that would allow us to recognize the target from Figure 15. In contrast, the interpretation results of the method presented in this paper align more closely with the actual structure of the target when the labels are composed of canonical structures. Figure 16 shows the results of the proposed method when the data are labeled with the component names. Except for some scattering centers on the target’s fairing, the proposed method can interpret the data relatively accurately.
Krogager decomposition and Cloude–Pottier decomposition were also applied to the measured data. Compared with single-polarization decomposition methods, the proposed method integrates multiple polarization scattering mechanisms. Therefore, the proposed method is theoretically more capable of characterizing components. Figure 16, Figure 17 and Figure 18 testify to this point. According to Figure 17, Cloude–Pottier decomposition still incorrectly identifies all scattering centers of the target as fairings, which shows that the Cloude–Pottier decomposition coefficients are less discriminative for the target components.
Although the overall accuracy results of the two methods are 91.6% and 82.0%, respectively, comparing Figure 16 and Figure 18 seems to indicate that there is no significant performance advantage between the Krogager method and the proposed method. However, the actual performance gap may be narrower due to material property mismatch. There are differences between the Pauli images in Figure 9 and Figure 14 due to the influence of surface roughness, material properties, and other factors on the physical model. Sporadic scattering centers appear in areas where there were none before, especially at an imaging angle of 90 degrees (Figure 9b). The benefit of this is that the shape of the target is better displayed. However, these changes somewhat interfere with the interpretation of the target components. In addition, multi-path effects were introduced during the anechoic chamber measurement experiments, whereas the electromagnetic simulations did not include these effects. In real-world scenarios, scattering phase distortion degrades the fidelity of polarization decomposition.

4. Discussion

In this study, we have tried to solve the problem of weak correspondence between actual structures and the results of traditional recognition methods by proposing a space target structure polarization interpretation method based on component decomposition and feature extraction. We modified the target polarization domain decomposition process in order to enhance the correlation between the identification results and the actual structure of the target. Validation experiments were conducted using simulation data and anechoic chamber measurement data. The results indicate that the feature vector which integrates parameters from various polarization target decomposition methods can effectively represent the differences among components. Thus, the proposed method can establish a stronger correlation between the recognition results and the actual structures.
Although our method can directly point out the components of the target, there are also limitations. First, there is less differentiation between components compared to canonical scatterers, and the mechanisms of the different components are made up of the mechanisms of several canonical scatterers. This could be improved by incorporating a more effective neural network algorithm. Second, The acquisition efficiency of polarimetric data is low. In subsequent work, we plan to explore solutions such as data augmentation and data generation to address this challenge. Finally, the proposed method still needs further experimental validation for targets with complex structures and different materials.

5. Conclusions and Future Outline

In recent years, there has been a boom in techniques for understanding spatial targets from the image domain; however, little research has been done on the electromagnetic and polarization properties of their components. In this paper, the polarization characteristics of three components are analyzed based on the electromagnetic data of a relatively simple structural space target. A novel method for interpreting the structure of space targets using polarization information obtained from PolISAR data is proposed. This algorithm presents a potential solution for analyzing the structures of space targets by utilizing echo data rather than relying on imaging and computer vision techniques. Compared to methods that use canonical scatterers as labels, the interpretation results of our method exhibit a superior mapping relationship with the actual structure of the target.
In future studies, we will utilize additional kinds of complex space target structures, such as satellites, to further prove the effectiveness of our proposed methodology. In addition, modeling simulations for rough surfaces will be enhanced during the target modeling process. Optimization strategies such as parallel processing will be applied to decrease the electromagnetic calculation costs. A comprehensive dataset of component types suitable for deep learning will be established. To address the inefficiency of polarimetric data acquisition, solutions such as Generative Adversarial Networks (GANs) will be explored to achieve data augmentation, interpolation, and advanced data generation. Additionally, alternative classification methods such as transformer-based architectures or Graph Neural Networks (GNNs) will be investigated, as GNNs may offer better performance in handling complex spatial relationships and high-dimensional polarization data.

Author Contributions

Conceptualization, J.C.; methodology, Z.C. and Z.X.; software, Z.C. and Q.W.; validation, Z.C. and X.A.; formal analysis, Z.C. and X.L.; writing—original draft preparation, Z.C.; writing—review and editing, Z.X., Z.C. and J.C. All authors have read and agreed to the published version of the manuscript.

Funding

This work was supported by the National Natural Science Foundation of China under Grant 62401580 and by the Scientific Research Program of National University of Defense Technology under Grant ZK24-13.

Data Availability Statement

No new data were created or analyzed in this study. Data sharing is not applicable to this article.

Conflicts of Interest

The authors declare no conflicts of interest.

References

  1. Zhang, J.; Liu, Z.; Jiang, W.; Liu, Y.; Zhou, X.; Li, X. Application of deep generative networks for SAR/ISAR: A review. Artif. Intell. Rev. 2023, 56, 11905–11983. [Google Scholar] [CrossRef]
  2. Chang, S.; Deng, Y.; Zhang, Y.; Zhao, Q.; Wang, R.; Zhang, K. An Advanced Scheme for Range Ambiguity Suppression of Spaceborne SAR Based on Blind Source Separation. IEEE Trans. Geosci. Remote Sens. 2022, 60, 5230112. [Google Scholar] [CrossRef]
  3. Ju, Y.; Zhang, Y.; Guo, F. ISAR Images Segmentation Based on Spatially Variant Mixture Multiscale Autoregressive Model. In Proceedings of the 2018 IEEE 3rd Advanced Information Technology, Electronic and Automation Control Conference (IAEAC), Chongqing, China, 12–14 October 2018; pp. 2170–2174. [Google Scholar] [CrossRef]
  4. Wang, Z.H.; Wang, Z.; Jiang, L.B. Components segmentation algorithm for space target isar image based on clean. In Proceedings of the 2017 International Conference on Wavelet Analysis and Pattern Recognition (ICWAPR), Ningbo, China, 9–12 July 2017; pp. 143–148. [Google Scholar] [CrossRef]
  5. Ni, P.; Liu, Y.; Pei, H.; Du, H.; Li, H.; Xu, G. CLISAR-Net: A Deformation-Robust ISAR Image Classification Network Using Contrastive Learning. Remote Sens. 2023, 15, 33. [Google Scholar] [CrossRef]
  6. Wang, J.; Du, L.; Li, Y.; Lyu, G.; Chen, B. Attitude and Size Estimation of Satellite Targets Based on ISAR Image Interpretation. IEEE Trans. Geosci. Remote Sens. 2022, 60, 5109015. [Google Scholar] [CrossRef]
  7. Kou, P.; Qiu, X.; Liu, Y.; Zhao, D.; Li, W.; Zhang, S. ISAR Image Segmentation for Space Target Based on Contrastive Learning and NL-Unet. IEEE Geosci. Remote Sens. Lett. 2023, 20, 3506105. [Google Scholar] [CrossRef]
  8. Wang, Z.; Guo, J.; Huang, W.; Zhang, S. High-resolution remote sensing image semantic segmentation based on a deep feature aggregation network. Meas. Sci. Technol. 2021, 32, 095002. [Google Scholar] [CrossRef]
  9. Liu, L.; Zhou, Z.; Zhou, F.; Shi, X. A New 3-D Geometry Reconstruction Method of Space Target Utilizing the Scatterer Energy Accumulation of ISAR Image Sequence. IEEE Trans. Geosci. Remote Sens. 2020, 58, 8345–8357. [Google Scholar] [CrossRef]
  10. Liu, A.; Zhang, S.; Zhang, C.; Zhi, S.; Li, X. RaNeRF: Neural 3-D Reconstruction of Space Targets From ISAR Image Sequences. IEEE Trans. Geosci. Remote Sens. 2023, 61, 5107215. [Google Scholar] [CrossRef]
  11. Wang, F.; Xu, F.; Jin, Y.Q. Three-Dimensional Reconstruction From a Multiview Sequence of Sparse ISAR Imaging of a Space Target. IEEE Trans. Geosci. Remote Sens. 2018, 56, 611–620. [Google Scholar] [CrossRef]
  12. Zhou, Z.; Liu, L.; Du, R.; Zhou, F. Three-Dimensional Geometry Reconstruction Method for Slowly Rotating Space Targets Utilizing ISAR Image Sequence. Remote Sens. 2022, 14, 1144. [Google Scholar] [CrossRef]
  13. Zhang, J.; Xing, M.; Sun, G.C.; Bao, Z. Integrating the Reconstructed Scattering Center Feature Maps with Deep CNN Feature Maps for Automatic SAR Target Recognition. IEEE Geosci. Remote Sens. Lett. 2022, 19, 4009605. [Google Scholar] [CrossRef]
  14. Liu, J.; He, S.; Zhang, L.; Zhang, Y.; Zhu, G.; Yin, H.; Yan, H. An Automatic and Forward Method to Establish 3-D Parametric Scattering Center Models of Complex Targets for Target Recognition. IEEE Trans. Geosci. Remote Sens. 2020, 58, 8701–8716. [Google Scholar] [CrossRef]
  15. He, Y.; He, S.Y.; Zhang, Y.H.; Wen, G.J.; Yu, D.F.; Zhu, G.Q. A Forward Approach to Establish Parametric Scattering Center Models for Known Complex Radar Targets Applied to SAR ATR. IEEE Trans. Antennas Propag. 2014, 62, 6192–6205. [Google Scholar] [CrossRef]
  16. Xu, D.; Bie, B.; Sun, G.C.; Xing, M.; Pascazio, V. ISAR Image Matching and Three-Dimensional Scattering Imaging Based on Extracted Dominant Scatterers. Remote Sens. 2020, 12, 2699. [Google Scholar] [CrossRef]
  17. Yun, D.J.; Jung, H.; Kang, H.; Kim, J.; Park, I.Y.; Lee, H.R.; Kim, Y.D. Scattering Center Extraction for ISAR Image using Deep Neural Network. In Proceedings of the 2023 20th European Radar Conference (EuRAD), Berlin, Germany, 20–22 September 2023; pp. 177–180. [Google Scholar] [CrossRef]
  18. Zhou, Y.; Zhu, W.; He, Y.; Li, Y. YOLOv8-based Spatial Target Part Recognition. In Proceedings of the 2023 IEEE 3rd International Conference on Information Technology, Big Data and Artificial Intelligence (ICIBA), Chongqing, China, 26–28 May 2023; Volume 3, pp. 1684–1687. [Google Scholar] [CrossRef]
  19. Lu, W.; Zhang, Y.; Yin, C.; Lin, C.; Xu, C.; Zhang, X. A Deformation Robust ISAR Image Satellite Target Recognition Method Based on PT-CCNN. IEEE Access 2021, 9, 23432–23453. [Google Scholar] [CrossRef]
  20. Yang, H.; Zhang, Y.; Ding, W. Multiple Heterogeneous P-DCNNs Ensemble with Stacking Algorithm: A Novel Recognition Method of Space Target ISAR Images Under the Condition of Small Sample Set. IEEE Access 2020, 8, 75543–75570. [Google Scholar] [CrossRef]
  21. Du, H.; Ni, P.; Chen, J.; Ma, S.; Zhang, H.; Xu, G. Integrated Convolution Network for ISAR Imaging and Target Recognition. IEEE J. Miniaturization Air Space Syst. 2023, 4, 431–437. [Google Scholar] [CrossRef]
  22. Deng, J.; Su, F. SDRnet: A Deep Fusion Network for ISAR Ship Target Recognition Based on Feature Separation and Weighted Decision. Remote Sens. 2024, 16, 1920. [Google Scholar] [CrossRef]
  23. Tan, Q.; Li, X.; Liu, Z.; Liu, S.; Shen, Q. A-CGAN based transformation from ISAR to optical image. In Proceedings of the 2022 7th International Conference on Communication, Image and Signal Processing (CCISP), Chengdu, China, 18–20 November 2022; pp. 265–270. [Google Scholar] [CrossRef]
  24. Li, G.; Sun, Z.; Zhang, Y. ISAR Target Recognition Using Pix2pix Network Derived from cGAN. In Proceedings of the 2019 International Radar Conference (RADAR), Toulon, France, 23–27 September 2019; pp. 1–4. [Google Scholar] [CrossRef]
  25. Wen, Y.; Wei, S.; Zhang, H.; Shi, J.; Zhang, X. Joint Target Recognition for Multi-Station ISAR via MIIR Network. In Proceedings of the IGARSS 2023—2023 IEEE International Geoscience and Remote Sensing Symposium, Pasadena, CA, USA, 16–21 July 2023; pp. 7074–7077. [Google Scholar] [CrossRef]
  26. Lin, W.; Gao, X.; Shen, Q. A Novel Recognition Method of ISAR Image Fusion Based on Botnet and Embracenet. In Proceedings of the 2021 IEEE 6th International Conference on Signal and Image Processing (ICSIP), Nanjing, China, 22–24 October 2021; pp. 841–845. [Google Scholar] [CrossRef]
  27. Yuan, H.; Li, H.; Zhang, Y.; Wei, C.; Gao, R. Complex-Valued Multiscale Vision Transformer on Space Target Recognition by ISAR Image Sequence. IEEE Geosci. Remote Sens. Lett. 2024, 21, 4008305. [Google Scholar] [CrossRef]
  28. Cexus, J.C.; Toumi, A.; Riahi, M. Target recognition from ISAR image using polar mapping and shape matrix. In Proceedings of the 2020 5th International Conference on Advanced Technologies for Signal and Image Processing (ATSIP), Sousse, Tunisia, 2–5 September 2020; pp. 1–6. [Google Scholar] [CrossRef]
  29. Liu, F.; Wen, Y.; Sun, J.; Zhu, P.; Mao, L.; Niu, G.; Li, J. Iterative Mamba Diffusion Change-Detection Model for Remote Sensing. Remote Sens. 2024, 16, 3651. [Google Scholar] [CrossRef]
  30. Li, Y.; Luo, Y.; Zhang, L.; Wang, Z.; Du, B. MambaHSI: Spatial-Spectral Mamba for Hyperspectral Image Classification. IEEE Trans. Geosci. Remote Sens. 2024, 62, 5524216. [Google Scholar] [CrossRef]
  31. Huo, Y.; Cheng, X.; Lin, S.; Zhang, M.; Wang, H. Memory-Augmented Autoencoder with Adaptive Reconstruction and Sample Attribution Mining for Hyperspectral Anomaly Detection. IEEE Trans. Geosci. Remote Sens. 2024, 62, 5518118. [Google Scholar] [CrossRef]
  32. Cheng, X.; Zhang, M.; Lin, S.; Zhou, K.; Zhao, S.; Wang, H. Two-Stream Isolation Forest Based on Deep Features for Hyperspectral Anomaly Detection. IEEE Geosci. Remote Sens. Lett. 2023, 20, 5504205. [Google Scholar] [CrossRef]
  33. Lee, J.S. Polarimetric Radar Imaging: From Basics to Applications; CRC Press: Boca Raton, FL, USA, 2009; p. 422. [Google Scholar]
  34. Zhang, Y.; Wang, W.; Guo, Z.; Li, N. Enhanced PGA for Dual-Polarized ISAR Imaging by Exploiting Cloude-Pottier Decomposition. IEEE Geosci. Remote Sens. Lett. 2024, 21, 4000505. [Google Scholar] [CrossRef]
  35. Li, H.L.; Li, M.D.; Chen, S.W. Man-Made Targets Characterization with Polarimetric Correlation Pattern Interpretation Tool. In Proceedings of the 2021 IEEE International Geoscience and Remote Sensing Symposium IGARSS, Brussels, Belgium, 11–16 July 2021; pp. 3057–3060. [Google Scholar] [CrossRef]
  36. Cui, X.C.; Li, H.L.; Chen, S.W. Polarimetric ISAR Image Interpretation Based on Polarimetric Correlation Pattern. In Proceedings of the 2021 CIE International Conference on Radar (Radar), Haikou, China, 15–19 December 2021; pp. 615–618. [Google Scholar] [CrossRef]
  37. Wu, H.; Pang, B.; Dai, D.; Wu, J.; Wang, X. Unmanned Aerial Vehicle Recognition Based on Clustering by Fast Search and Find of Density Peaks (CFSFDP) with Polarimetric Decomposition. Electronics 2018, 7, 364. [Google Scholar] [CrossRef]
  38. Wu, G.Q.; Chen, S.W.; Li, Y.Z.; Wang, X.S. Null-Pol Response Pattern in Polarimetric Rotation Domain: Characterization and Application. IEEE Geosci. Remote Sens. Lett. 2022, 19, 4503105. [Google Scholar] [CrossRef]
  39. Xu, Z.; Ai, X.; Zhao, F.; Xiao, S. A New Bistatic Huynen Target Parameters Extraction Algorithm: Experimental Validation and Data Analysis. IEEE Trans. Antennas Propag. 2022, 70, 9694–9705. [Google Scholar] [CrossRef]
  40. Cloude, S.; Pottier, E. An entropy based classification scheme for land applications of polarimetric SAR. IEEE Trans. Geosci. Remote Sens. 1997, 35, 68–78. [Google Scholar] [CrossRef]
  41. Gaglione, D.; Clemente, C.; Pallotta, L.; Proudler, I.; De Maio, A.; Soraghan, J.J. Krogager decomposition and Pseudo-Zernike moments for polarimetric distributed ATR. In Proceedings of the 2014 Sensor Signal Processing for Defence (SSPD), Edinburgh, UK, 8–9 September 2014; pp. 1–5. [Google Scholar] [CrossRef]
  42. Wang, Z.; Zhang, Y.; Chen, Z.; Yang, H.; Sun, Y.; Kang, J.; Yang, Y.; Liang, X. Application of ReliefF algorithm to selecting feature sets for classification of high resolution remote sensing image. In Proceedings of the 2016 IEEE International Geoscience and Remote Sensing Symposium (IGARSS), Beijing, China, 10–15 July 2016; pp. 755–758. [Google Scholar] [CrossRef]
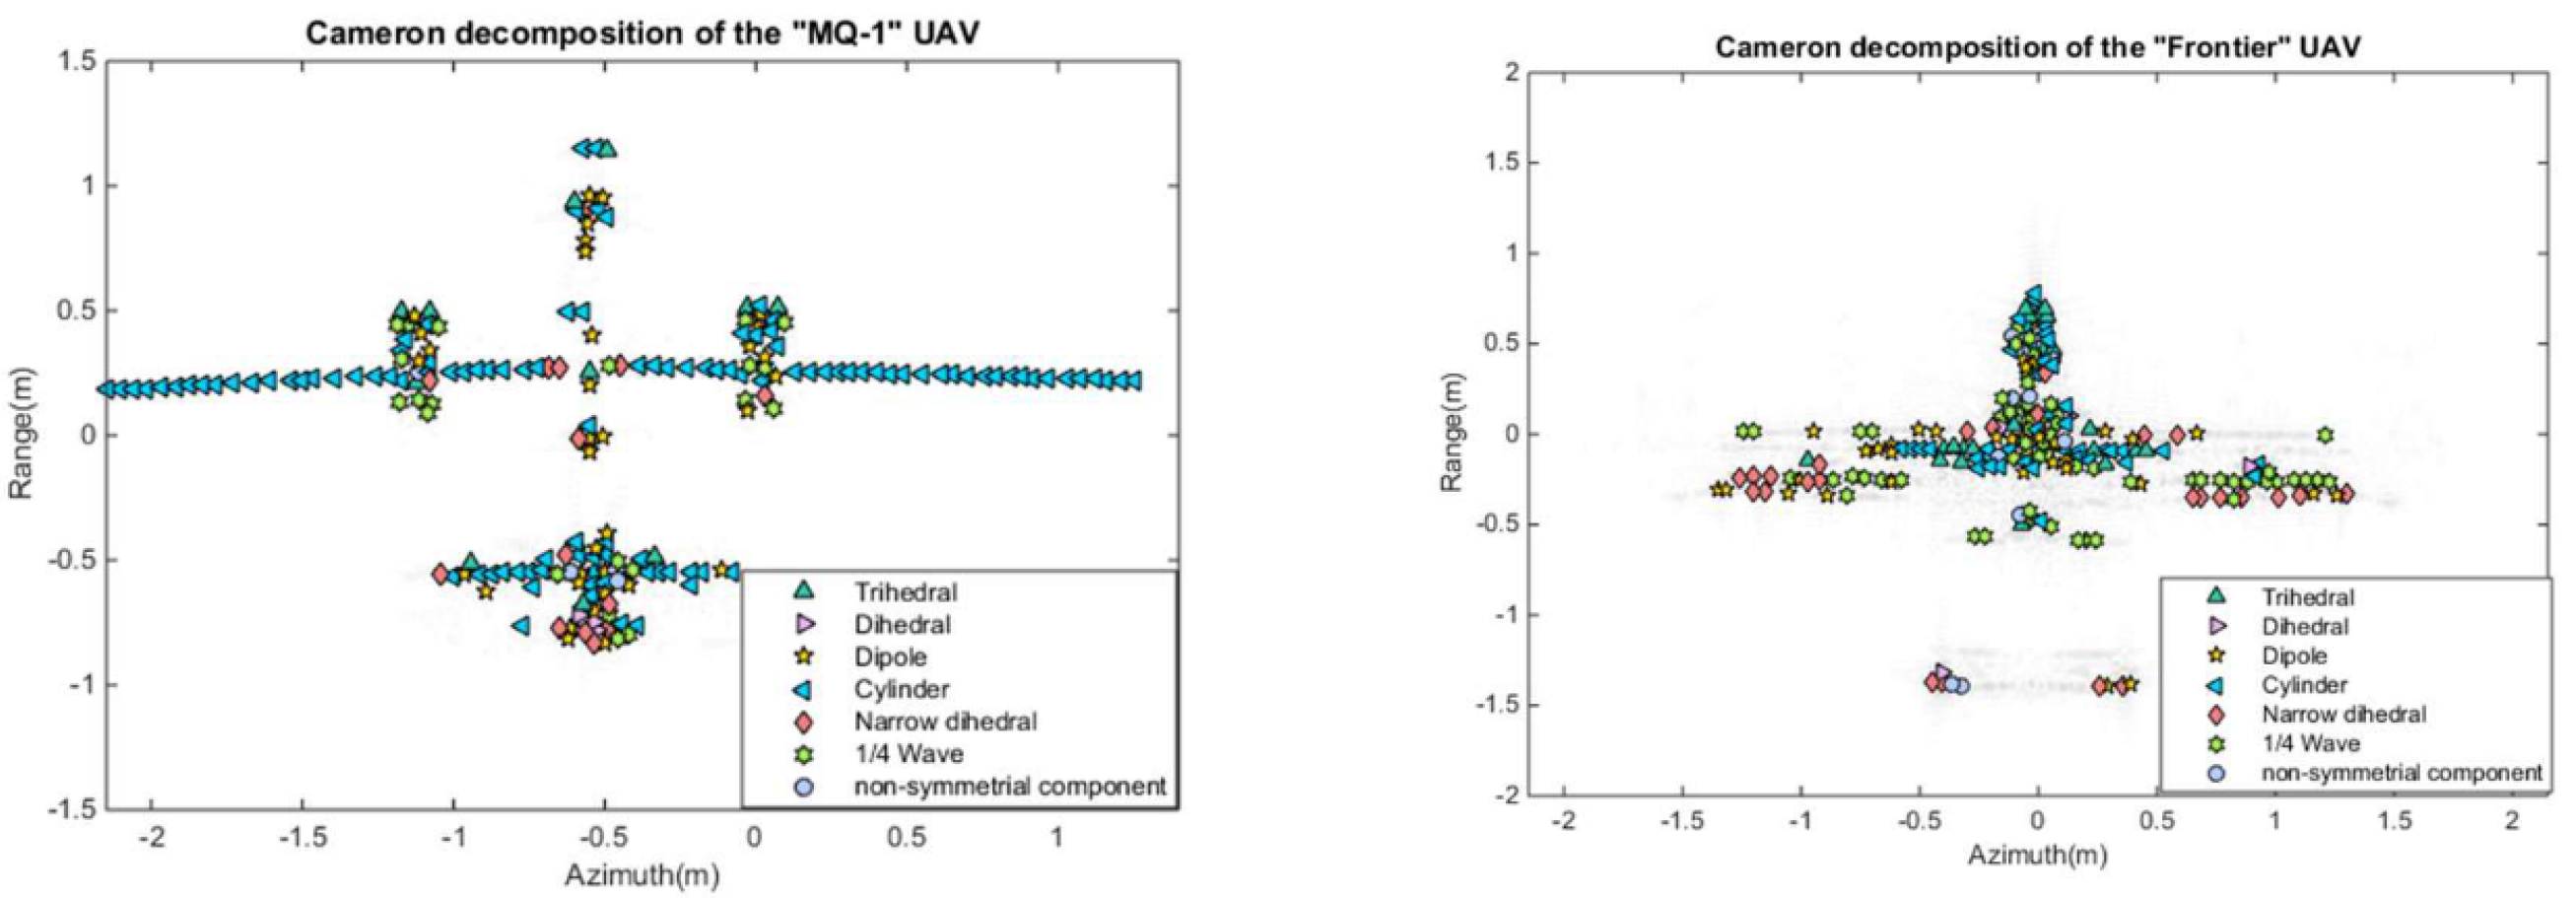
Figure 1. Traditional method recognition results of the “MQ−1” and “Frontier” UAVs [37].
Remotesensing 17 01079 g001
Figure 2. Flowchart for component recognition.
Remotesensing 17 01079 g002
Figure 3. Independently modeled component electromagnetic simulation scenario.
Remotesensing 17 01079 g003
Figure 4. Modeling components independently adds other mechanisms that are absent in the whole target.
Remotesensing 17 01079 g004
Figure 5. Component decomposition.
Remotesensing 17 01079 g005
Figure 6. (a) Canonical structures and (b) cluster scattering plots of canonical structures.
Remotesensing 17 01079 g006
Figure 7. Quantitative classification metrics based on the feature vectors obtained by alternative feature selection methods.
Remotesensing 17 01079 g007
Figure 8. Simulation model of the space target.
Remotesensing 17 01079 g008
Figure 9. Pauli images of the simulation data at imaging angles of 30° (a), 45° (b), and 90° (c).
Remotesensing 17 01079 g009
Figure 10. Interpretation results of the method based on Cameron decomposition at imaging angles of 30° (a), 45° (b), and 90° (c).
Remotesensing 17 01079 g010
Figure 11. Interpretation results of the proposed method at imaging angles of 30° (a), 45° (b), and 90° (c) when the simulation data were labeled with the components names.
Remotesensing 17 01079 g011
Figure 12. Interpretation results of the method based on Cloude–Pottier decomposition at imaging angles of 30° (a), 45° (b), and 90° (c) when the data were labeled with the component names.
Remotesensing 17 01079 g012
Figure 13. Interpretation results of the method based on Krogager decomposition at imaging angles of 30° (a), 45° (b), and 90° (c) when the data were labeled with the component names.
Remotesensing 17 01079 g013
Figure 14. Pauli images of the anechoic chamber measurement data at imaging angles of 45° (a), 90° (b), and 120° (c).
Remotesensing 17 01079 g014
Figure 15. Interpretation results of the method based on Cameron decomposition at imaging angles of 45° (a), 90° (b), and 120° (c).
Remotesensing 17 01079 g015
Figure 16. Interpretation results of the proposed method at imaging angles of 45° (a), 90° (b), and 120° (c) when the data were labeled with the component names.
Remotesensing 17 01079 g016
Figure 17. Interpretation results of the method based on Cloude–Pottier decomposition at imaging angles of 45° (a), 90° (b), and 120° (c) when the data were labeled with the component names.
Remotesensing 17 01079 g017
Figure 18. Interpretation results of the method based on Krogager decomposition at imaging angles of 45° (a), 90° (b), and 120° (c) when the data were labeled with the components names.
Remotesensing 17 01079 g018
Table 1. Comparison of alternatives.
AlternativesFeature VectorsAccuracies
ReliefF [ | τ i τ s | , | τ i + τ s | , | v | , γ , K e , K h ] 91.6%
LASSO [ | τ i τ s | , | τ i + τ s | , | v | , γ , K e , K h , H , γ ] 89.3%
RFFI [ K h , | τ i τ s | , | τ i + τ s | , H , | v | , K o ] 89.4%
PCA [ | τ i τ s | , | τ i + τ s | , | v | , γ , K o ] 84.9%
MRMR [ K h , | v | , H , | τ i + τ s | , | τ i τ s | , K o d ] 89.3%
Table 2. Electromagetic simulation parameters of the components.
ComponentsFrequency Range and Step (GHz)Theta Range and Step (Deg)Phi Range and Step (Deg)
Fairing 40 to 85, 0.5−15 to 15, 1
Bottom8 to 12, 0.0445 to 135, 1−15 to 15, 1
Swept Wings 45 to 90, 0.530 to 60, 1
Disclaimer/Publisher’s Note: The statements, opinions and data contained in all publications are solely those of the individual author(s) and contributor(s) and not of MDPI and/or the editor(s). MDPI and/or the editor(s) disclaim responsibility for any injury to people or property resulting from any ideas, methods, instructions or products referred to in the content.