Article

Evaluating the Performance of Irrigation Using Remote Sensing Data and the Budyko Hypothesis: A Case Study in Northwest China

1
State Key Laboratory of Remote Sensing and Digital Earth, Aerospace Information Research Institute, Chinese Academy of Sciences, Beijing 100101, China
2
University of Chinese Academy of Sciences, Beijing 100049, China
3
Faculty of Civil Engineering and Geosciences, Delft University of Technology, 2825 CN Delft, The Netherlands
4
Institute of Tibetan Plateau Research, Chinese Academy of Sciences, Beijing 100101, China
*
Author to whom correspondence should be addressed.
Remote Sens. 2025, 17(6), 1085; https://doi.org/10.3390/rs17061085
Submission received: 13 February 2025 / Revised: 10 March 2025 / Accepted: 18 March 2025 / Published: 19 March 2025

Abstract

:
Evaluating the performance of irrigation water use is essential for efficient and sustainable water resource management. However, existing approaches often lack systematic quantification of irrigation water consumption and fail to differentiate between the use of precipitation and anthropogenic appropriation of water flows. Building on the green–blue water concept, consumptive water use, assumed equal to actual evapotranspiration (ETa), was partitioned into green ET (GET) and blue ET (BET) using remote sensing data and the Budyko hypothesis. A novel BET metric of consumptive irrigation water use was developed and applied to the irrigated lands in northwest China to evaluate the performance of irrigation from 2001 to 2021. The results showed that in terms of total available water resources (precipitation + gross irrigation water (GIW)) compared to irrigation water demand, estimated as reference evapotranspiration (ET0), Ningxia has sufficient water supply to meet irrigation demand, while the Hexi Corridor faces increasing risks of unsustainable water use. The Hetao irrigation scheme has shifted from a fragile supply–demand balance to a situation where water demand far exceeds availability. In Xinjiang, the balance between water supply and demand is tight. Furthermore, when considering the available water (GIW) relative to the net irrigation water demand (ET0-GET), the Hexi Corridor faces significant water deficits, and Ningxia and Xinjiang are close to meeting local irrigation water demands by relying on current water availability and efficient irrigation practices. It is noteworthy that the BET remains lower than the GIW in northwest China (excluding the Hexi Corridor in recent years). The ratio of the BET to GIW is an estimate of the scheme irrigation efficiency, which was equal to 0.54 for all irrigation schemes taken together. In addition, the irrigation water use efficiency, estimated as the ratio of BET to net irrigation water, was evaluated in detail, and it was found that in the last 10 years the irrigation water use efficiency improved in Ningxia, the Hetao irrigation scheme, and Xinjiang. However, the Hexi Corridor continues to face severe net irrigation water deficits, suggesting the likelihood of groundwater use to sustain irrigated agriculture. BET innovatively separates consumptive use of precipitation (green water) and consumptive use of irrigation (blue water), a critical advancement beyond conventional approaches’ estimates that merge these distinct hydrological components to help quantifying water use efficiency.

Graphical Abstract

1. Introduction

Irrigation plays a crucial role in crop growth and agricultural yield. Globally, 70% of the freshwater withdrawals and 90% of freshwater consumptions are used for the irrigation of agricultural land. In particular, in arid and semi-arid regions of northwest (NW) China, irrigation accounts for about 91% of the freshwater withdrawals [1]. Reducing water use by irrigated agriculture is essential to ensure the sustainability of water resources, particularly in arid and semi-arid regions.
Official data on irrigation water use are published yearly, as part of governmental statistical data, by national or local authorities. These data provide information on agricultural irrigation water use at different levels, e.g., national, provincial, or river basin. Although the statistical data are often criticized for their limited sampling method, possible manipulations, and a lack of spatially explicit irrigation water information, they remain the most reliable and comprehensive source of information for understanding the overall trends and patterns in irrigation water use at different levels. The modeling-based approaches simulate the irrigation water demand, rather than actual irrigation water use, using an irrigation process model to interpret data on either soil moisture deficit or evapotranspiration deficit [2,3]. These hydrological models are generally subject to uncertainties, particularly regarding parameterizations, assumptions, and input data, which can lead to unreliable estimates of irrigation water use. There is a growing consensus on the integration of hydrological models and remote sensing data, e.g., actual evapotranspiration (ETa) or soil moisture, being the most effective and promising approach to estimate irrigation water use [4,5,6,7,8,9,10]. This methodology assumes that a hydrological model does not account for irrigation without input data on applied irrigation water, while the remotely sensed ETa or soil moisture retrievals do contain an irrigation signal. The ETa or soil moisture under a no-irrigation scenario can be simulated using hydrological models, while ETa or soil moisture can be retrieved from remote sensing observations. Hence, the irrigation water amount can be estimated on the basis of the difference between hydrological model simulations and remotely sensed ETa or soil moisture [4,11,12]. For example, Jalilvand et al. (2019) [13] used the SM2RAIN algorithm to estimate irrigation water use at the catchment scale based on satellite soil moisture data at 25 km resolution. However, the coarse spatial resolution of global soil moisture products limited the ability to derive irrigation water use at the finer spatial resolution, which is required for detailed analyses to be useful for water management. The remotely sensed ETa data, generally with higher resolution than the global soil moisture data, offer a strong potential to support the estimation of irrigation water use at higher spatial resolution [14].
While quantifying irrigation water use is crucial, comprehensive evaluation of irrigation performance is equally vital to identify inefficiencies and optimize water allocation. Traditional evaluation methods rely on indicators like irrigation efficiency, i.e., the ratio of crop water use to total supply [15,16], which require multi-source data including discharge measurements, crop water requirements, effective rainfall, and ETa [17]. However, such datasets are seldom systematically collected at the required spatial scales, i.e., farm fields or river basins, and, when available, often suffer from reliability or accessibility issues. Satellite remote sensing offers a solution by enabling continuous monitoring of agricultural hydrology. Early studies by Menenti et al. (1989) [18], Menenti et al. (1990) [19], Bastiaanssen et al. (1996) [20], and Roerink et al. (1997) [21] pioneered remote sensing applications in irrigation performance assessment, while subsequent research developed performance indicators addressing adequacy, equity, reliability, productivity, and sustainability [22,23,24,25,26]. Nevertheless, these approaches often oversimplify the interplay of precipitation and irrigation, leading to incomplete performance diagnostics.
The concept of blue and green water has gained attention in water resources management. Blue water refers to surface and groundwater resources directly managed for human use, e.g., irrigation via canals or pipelines, while green water refers to precipitation stored in the soil, sustaining rainfed ecosystems [27]. Accordingly, ET can be partitioned into green ET (GET) and blue ET (BET). GET represents the portion of ET derived solely from naturally available green water. It is a natural process driven by vegetation use of soil water stored after precipitation events. BET quantifies ET sustained by anthropogenic blue water inputs, e.g., irrigation. BET reflects human intervention in the water cycle. This distinction enables precise attribution of water cycle components to human activities or natural processes. Building upon this framework, we propose a novel BET metric to evaluate irrigation performance using remote sensing data and the Budyko hypothesis.
This study aims to integrate hydrological models with satellite data for evaluating the performance of irrigation use in NW China, a region characterized by arid conditions and limited water resources. The main objectives of this study are to answer the following questions: (1) Is there a significant water deficit in the irrigated lands of NW China? (2) Can available irrigation water resources effectively alleviate this deficit? (3) What is the actual efficiency of current irrigation water use?

2. Study Area and Data
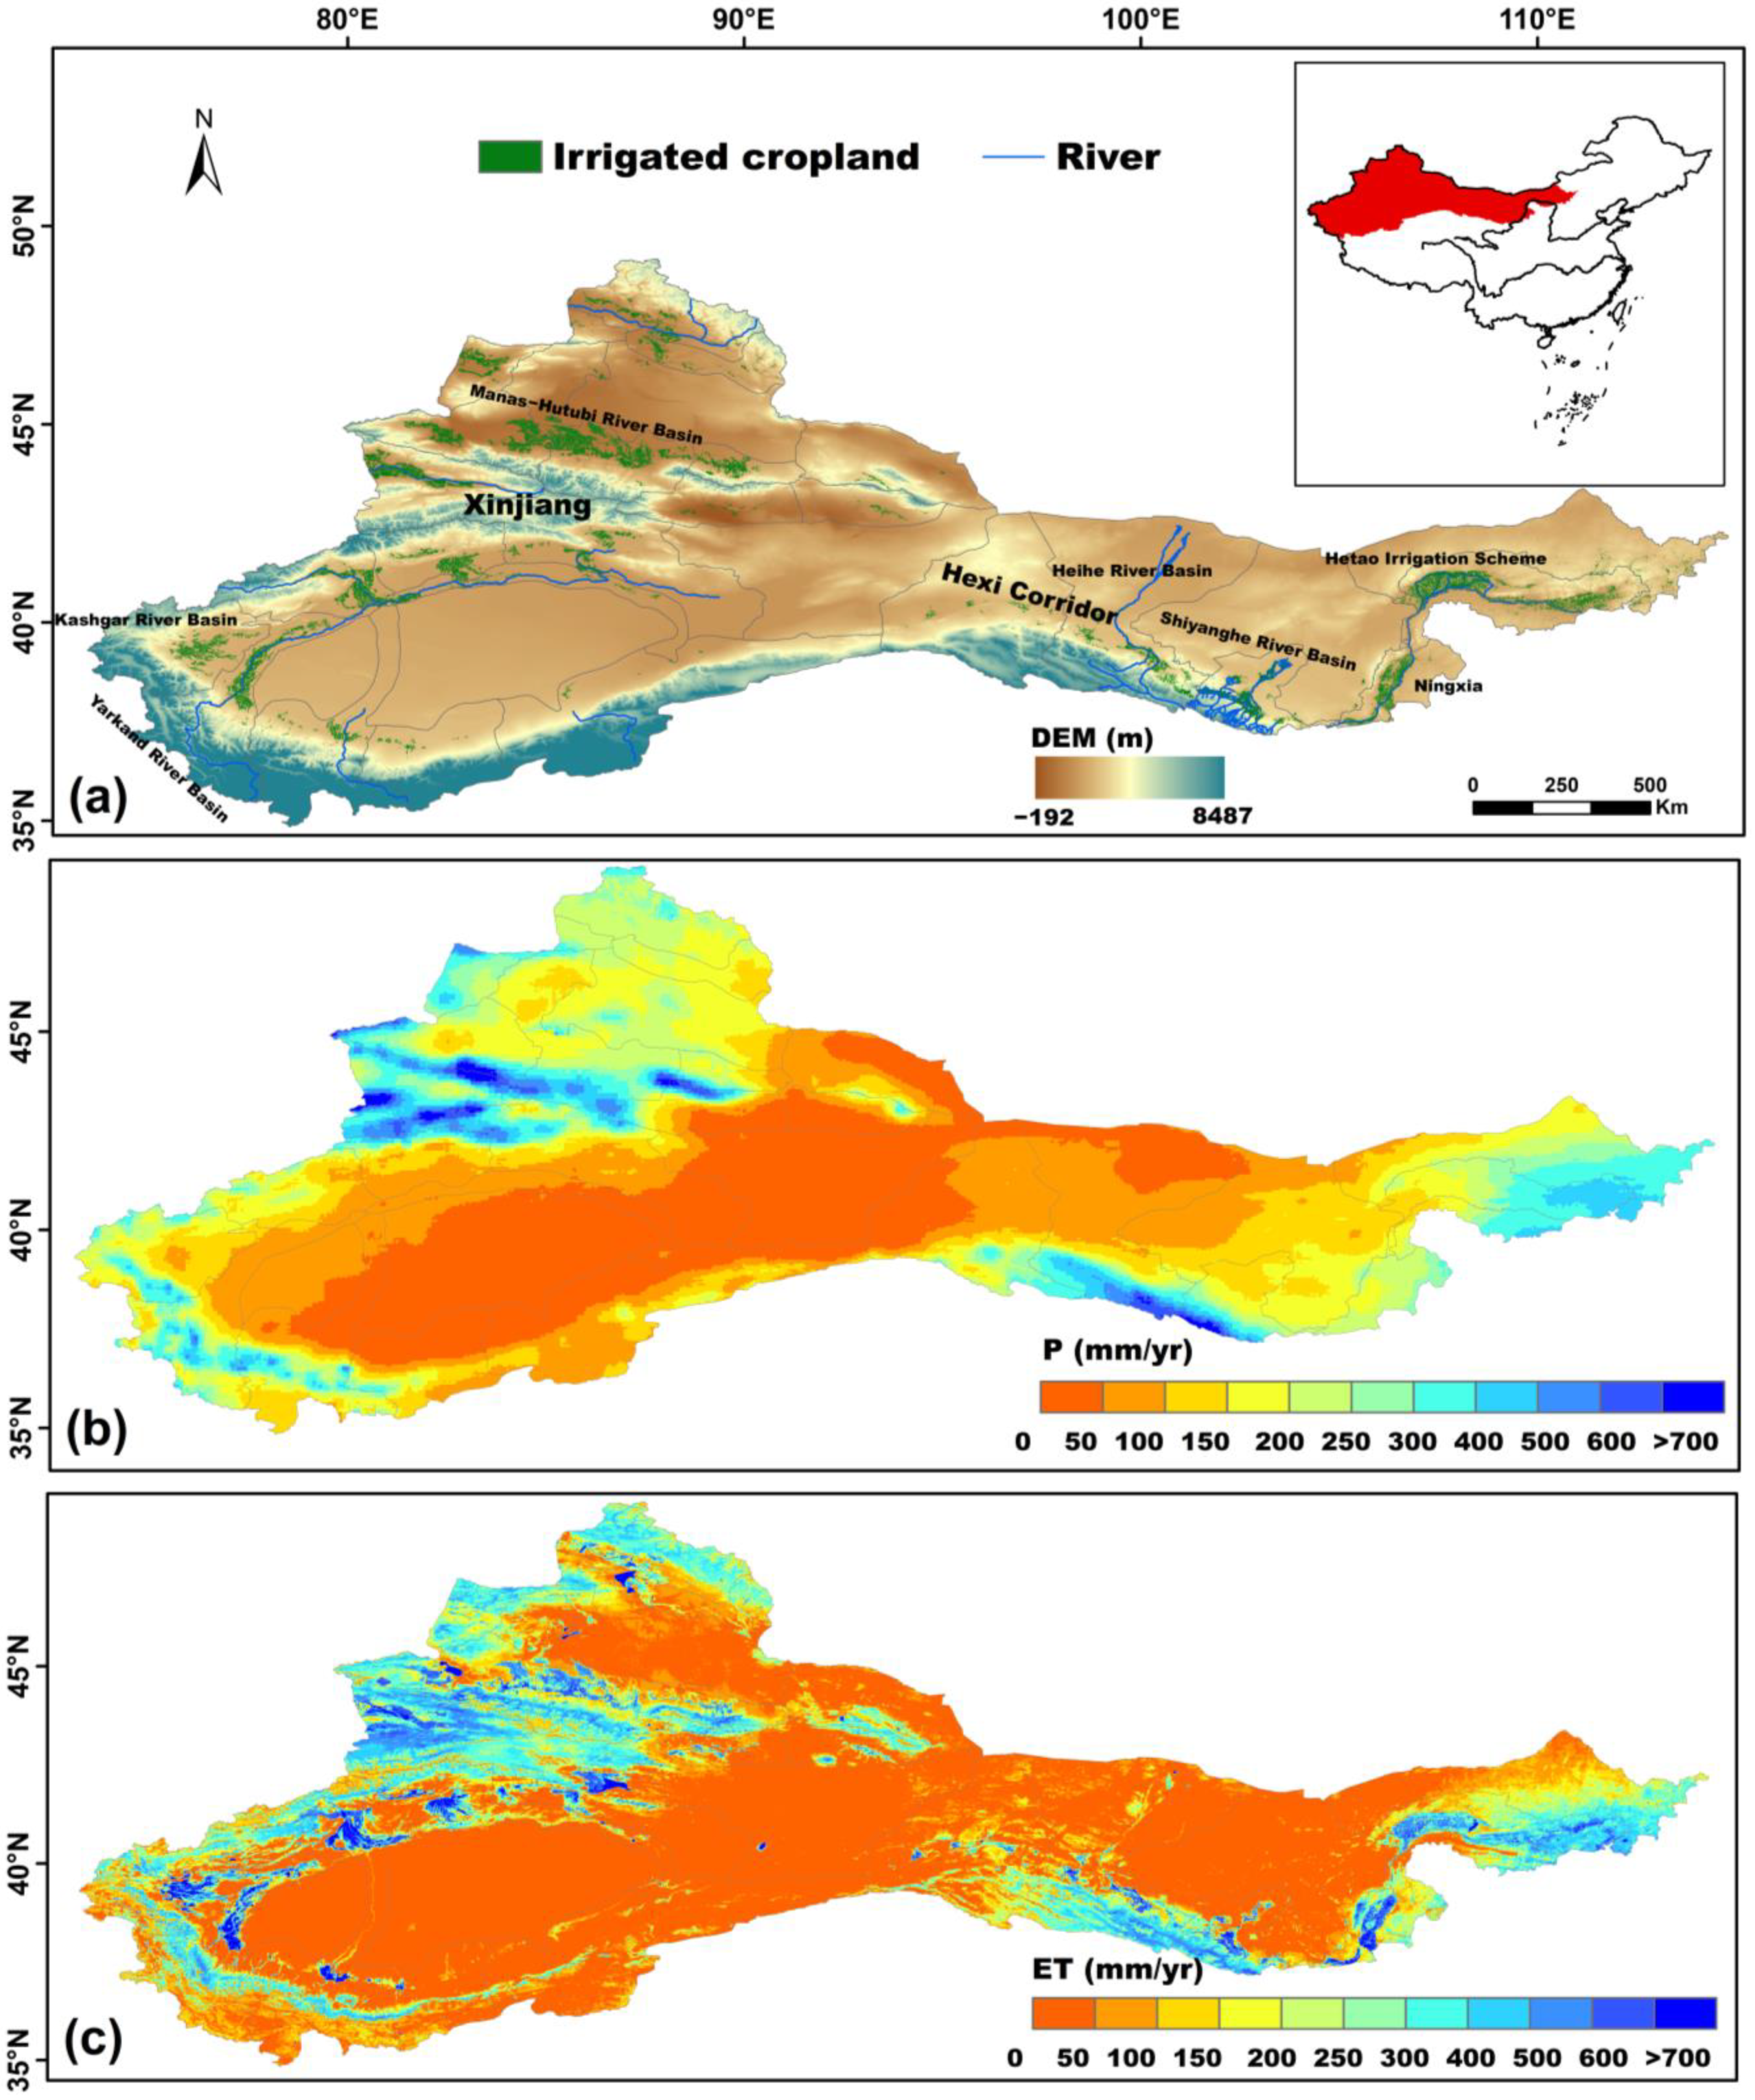
2.1. Study Area

The study regions are the irrigated lands in NW China (Figure 1a), characterized by a dry climate with low precipitation (Figure 1b) and high ET (Figure 1c), making them among the most water-scarce areas in the country. These regions are crucial for China’s agricultural production, contributing significantly to grain and cash-crop output despite their arid conditions. The region includes multiple provinces, with irrigation schemes primarily concentrated in four key areas: the Hetao irrigation scheme in Inner Mongolia, the Yellow River irrigated lands in Ningxia Hui Autonomous Region (the term “Ningxia” is employed in this study to refer to the Yellow River irrigated lands), the inland river basins of the Hexi Corridor in Gansu (the term “Hexi Corridor” is used to refer to these inland river basins), and the Xinjiang Uygur Autonomous Region (Xinjiang) (Figure 1a). These regions share the challenge of water scarcity but differ in hydrological characteristics and water sources.
The Hetao irrigation scheme, located in Bayannur City, is Asia’s largest single water inlet irrigation scheme, covering approximately 7.69 × 10⁵ ha. Alongside it, the Ningxia spans about 6.55 × 10⁵ ha, leveraging Yellow River water diversions. The Hexi Corridor inland river basins in Gansu Province include irrigated lands covering 7.72 × 10⁵ ha. Xinjiang has the most irrigated land among the four, at 4.11 × 10⁶ ha, relying primarily on snowmelt and glacier-fed water sources sensitive to climate change. The Hetao irrigation scheme and Ningxia, situated in the Yellow River Basin, are known for their flat terrain and fertile soil, playing a crucial role in the region’s agricultural development. In contrast, other irrigation schemes are mainly found in inland river basins characterized by mountain–oasis–desert ecosystem sequences. Mountainous areas receive significant precipitation and host large glaciers, contributing 2% to 48% of the total surface runoff via glacial meltwater [28]. The plains, predominantly deserts with an arid and semi-arid climate, have sparse vegetation and a fragile ecosystem. Artificial oases, though less than 10% of the region, consume most water generated from mountainous areas, intensifying water competition between oases and desert ecosystems [29]. Typical inland river basins include the Shiyang River Basin and the Heihe River Basin in the Hexi Corridor, the Manas-Hutubi River Basin and the Kashgar-Yarkand River Basin in Xinjiang.

2.2. Data and Pre-Processing

2.2.1. Remote Sensing Data

The remote sensing data used in this study include precipitation, actual ET (ETa), potential ET (ETp), reference ET (ET0), and irrigated cropland from 2001 to 2021 at a resolution of 1 km. Gridded yearly precipitation and ETp data were used as the input to the Budyko method to estimate the GET [30]. The BET was estimated utilizing yearly ETa and the GET.
The ETa data were obtained from the published ETMonitor product which provides global daily ETa at a 1 km spatial resolution from 2001 to 2021 (https://doi.org/10.12237/casearth.6253cddc819aec49731a4bc2, accessed on 10 December 2024) [31,32]. The ET0 is estimated according to FAO56 [33], and ETp is estimated using the Penman–Monteith equation with zero bulk surface resistance.
The precipitation data were obtained from the Climate Hazards Group Infrared Precipitation with Stations (CHIRPS) dataset, which provides daily time steps and a 0.05° spatial resolution (https://data.chc.ucsb.edu/products/CHIRPS-2.0/, accessed on 10 December 2024) [34]. The CHIRPS precipitation data were resampled to a spatial resolution of 1 km using the bilinear interpolation method.
The maps of irrigated lands in NW China were extracted from IrriMap_CN for 2000–2019 (https://doi.org/10.6084/m9.figshare.20363115.v1, accessed on 10 December 2024), which were produced using satellite imagery and a machine-learning method [35]. The spatial resolution of the original dataset is 500 m, which was aggregated to a resolution of 1 km using the majority method. As the dataset only extends to 2019, the 2019 data were used as a proxy for both 2020 and 2021.

2.2.2. Statistical Data

The annual volumes of gross irrigation water (GIW) and net irrigation water (NIW) were extracted from the Water Resources Bulletin series, which is published yearly. Detailed information on the GIW and NIW data can be found in Feng et al. (2020) [17]. In principle, the GIW is based on the irrigation scheme as the fundamental statistical unit in the bulletin. For large irrigation schemes, i.e., if irrigable area (A) ≥ 2 × 10⁴ ha, the GIW is based on actual water flow measurements at the primary water inlet for all large irrigation schemes. For medium-sized (666.7 ≤ A < 2 × 10⁴ ha) and small-sized irrigation (A < 666.7 ha) schemes, a sampling approach is used to estimate the GIW. For medium-sized irrigation schemes, they are divided into three categories (categories are defined in mu with 1 ha = 15 mu) based on the irrigable area, namely 666.7 ≤ A < 3333.3 ha, 3333.3 ≤ A < 104 ha, 104 ≤ A < 2 × 10⁴ ha. For each category, the number of irrigation schemes in a sample should not be less than 5% of the total number of irrigation schemes in the corresponding category in the province. For small-sized irrigation schemes, the area of a selected small-sized irrigation scheme should not be less than 6.7 ha. The number of irrigation schemes in a sample should not be less than 0.5% of the total number of small-sized irrigation schemes in the whole province, generally not more than 100, and at least not less than 10. The GIW is based on actual water flow measurements at the primary water inlet for all irrigation schemes.
The NIW is obtained by collecting soil samples to measure soil water content at different depths before and after irrigation. A set of representative irrigation schemes and field plots is selected to consider crop type, irrigation technique, soil type, and irrigation schedule. The observed NIW volume of field plots within an irrigation scheme are then converted to the total NIW by an area-weighted calculation for the irrigation scheme. The NIW is calculated by observing the soil moisture in representative field plots before and after each irrigation event:
N I W f i e l d , i = γ γ w a t e r H ( θ 2 ,   i θ 1 ,   i )
where N I W f i e l d , i applies to a soil column with a 1 cm2 section, and it is the NIW for a specific irrigation event i in a field plot (cm). H is the depth of the wetting soil layer in the field plot during the irrigation period (cm). γ represents the dry bulk density of the soil (g/cm³). γ w a t e r is the bulk density of water, which is assumed to be 1 (g/cm³), θ 1 ,   i is the soil moisture prior to a specific irrigation event i (gwater g−1 soil), and θ 2 ,   i is the soil moisture following a specific irrigation event i.
All publicly available data on GIW and NIW for the period from 2001 to 2021 were collected (Table 1). The Hetao irrigation scheme is located in Bayannur City, and the GIW and NIW data were extracted from the Bayannur Water Resources Bulletin. The GIW and NIW data for the Yellow River Irrigation scheme were extracted from the Ningxia Water Resources Bulletin. The Hexi Corridor GIW and NIW data were extracted from the Gansu Water Resources Bulletin.

3. Methods

In this study, we simultaneously estimated the GET and BET at a spatial resolution of 1 km for the irrigated lands of NW China from 2001 to 2021. The GET, which represents the portion of ET derived solely from naturally available green water, is estimated using a calibrated Budyko equation based on precipitation data from satellite observation. The BET, which represents the ET sustained by anthropogenic blue water inputs (i.e., irrigation), is calculated by subtracting the GET from the total ETa derived from satellite remote sensing [30].
ETa is equal to the sum of GET and BET. In this study, we used remote sensing estimates of ETa. Therefore, BET can be estimated by subtracting GET from total ETa as follows:
BET = ETaGET
where ETa represents total actual ET (mm/yr), and GET is green ET (mm/yr).
GET is estimated using a modified Budyko hypothesis (BH) method based on a new vegetation-specific parameter (ωv), which was optimized for different vegetation types [30]. GET is estimated as follows:
G E T v , i P v , i = 1 + E T p v , i P v , i 1 + E T p v , i P v , i ω v 1 ω v
where P v , i , E T p v , i , and G E T v , i are pixel-wise values of annual precipitation, annual ETp, and annual GET, all expressed in mm in pixel i covered by vegetation type “ v ”, respectively, based on remote sensing data products.
The vegetation-specific parameter ω v is estimated by applying the least squares method using Equation (4) to the yearly precipitation, ETp, and ETa averages for each year and each vegetation type. The objective function Obj ( ω v ) then reads as follows:
O b j ( ω v ) = min k = Y 0 Y n E T v , k P v , k 1 + E T p v , k P v , k 1 + E T p v , k P v , k ω v 1 ω v 2  
where k is the year number, and Y 0 and Y n represent the start and end year of the analysis, respectively (from 2001 to 2021 in this study); P v , k , E T p v , k , and E T v , k are the annual precipitation, ETp and ETa, respectively, averaged over all pixels covered by vegetation type “ v ” in year “ k ” (unit: mm). For a given vegetation type ( v ) that occupies N pixels, the following equations apply to mean annual precipitation, ETp, and ETa:
P v , k = ( i = 1 N P v , k ( i ) ) / N
E T p v , k = ( v = 1 N E T p v , k ( i ) ) / N
E T v , k = ( i = 1 N G E T v , k ( i ) ) / N
The variables ET0, ETp, ETa, GET, and BET will be used later in this study as indicators of irrigation water use.

4. Results

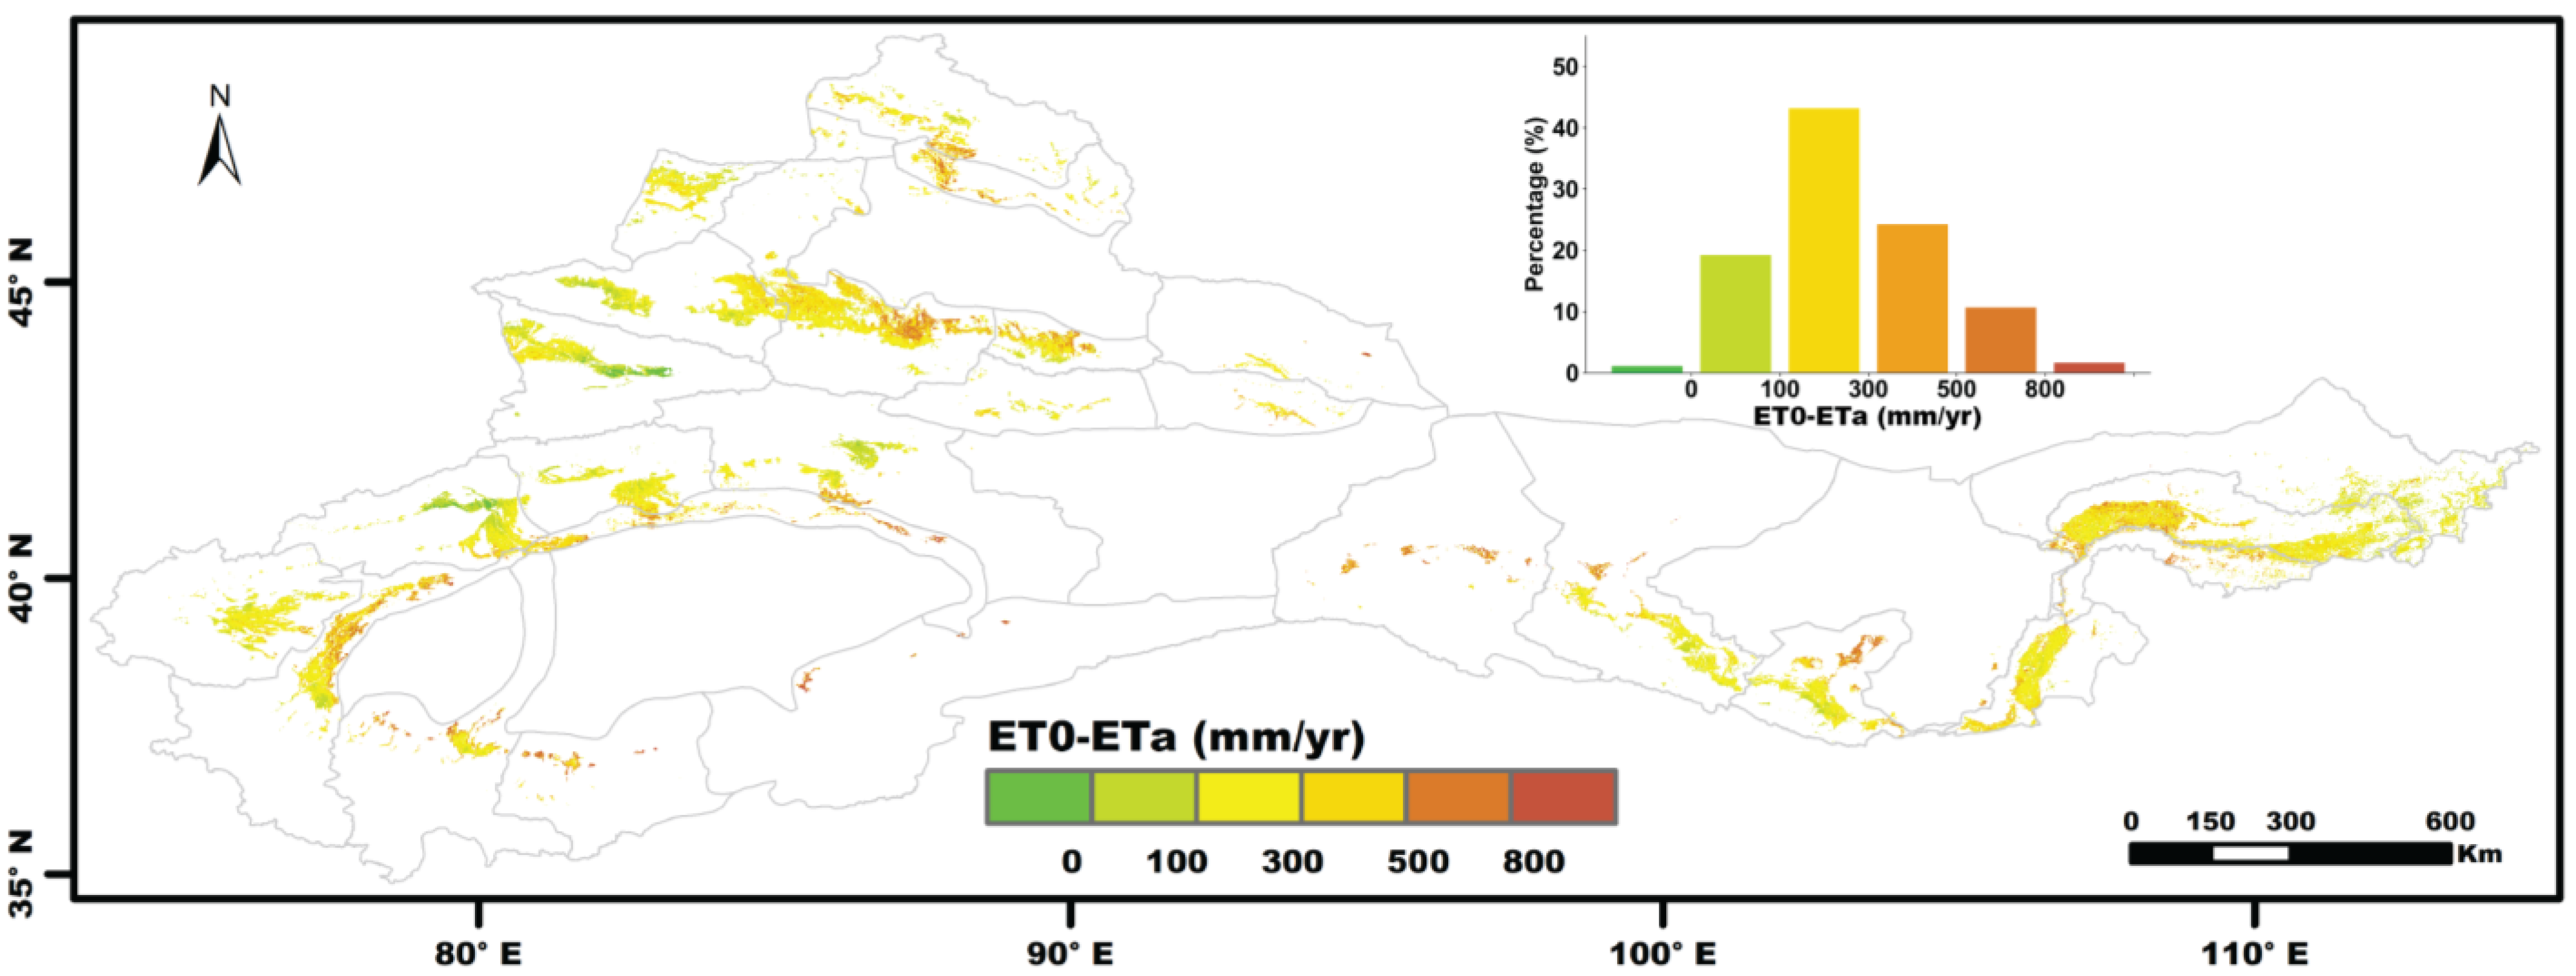
4.1. Assessment of Crop Water Stress

Reference (ET0) is defined as the amount of ET applying to an idealized reference crop, i.e., short grass or alfalfa, with full vegetation cover, adequate water supply, and prescribed albedo, height, and aerodynamic roughness. ET0 is commonly used as a benchmark of theoretical water requirements of crops. The difference between ET0 and ETa is often used as an indicator of water stress (Figure 2). When ETa is close to ET0, it indicates sufficient water supply. When ETa is significantly lower than ET0, it may suggest soil water deficiency. However, actual field conditions often deviate from the ideal assumptions of ET0. In particular, during the early stages of crop growth, when vegetation cover is low (e.g., <30%), soil evaporation dominates, and plant transpiration is minimal. Even if the soil is moist, ETa may still be much lower than ET0, but this discrepancy is primarily due to incomplete canopy development rather than water stress. Therefore, relying solely on the difference between ET0 and ETa to assess water stress may overestimate its severity and does not accurately reflect whether crops are experiencing water stress. The correct interpretation of Figure 2 requires a further analysis of the evolution of ET0 and ETa during the year.
The monthly averages of ET0 and ETa over 2001 to 2021 show that the discrepancy between ET0 and ETa primarily originates in the early growing season (March to June) (Figure 3). During this period, ET0 substantially exceeds ETa across all study regions. This discrepancy can be attributed to the fundamental difference in vegetation cover applied in the calculation of ET0 and in the retrieval of ETa. ET0 is calculated for the standard grass at full vegetation cover (FVC = 1). ETa includes the impact of fractional vegetation cover (FVC) [32]. In NW China, crops such as barley and wheat emerge in early April, reaching full canopy cover (FVC ≈ 1) by July/August [36,37]. As canopy cover approaches “complete vegetation cover”, ETa reaches its peak (Figure 3). Conversely, ET consistently remains lower than ET0 whenever FVC < 1, which is particularly evident during the early growing season when vegetation is still developing.
To account for the impact of FVC, the annual ET0 was also calculated using FVC-adjusted monthly ET0. Monthly ET0 values were adjusted by multiplying ET0 by the corresponding monthly FVC for each year (2001–2021). These adjusted ET0 values were averaged across all years for each month and aggregated annually. The results show that after FVC-based adjustment, ET0 is either less than or close to ETa in most regions (Figure 4), suggesting that water scarcity in the irrigated lands of NW China may be overestimated when comparing ETa with unadjusted ET0.

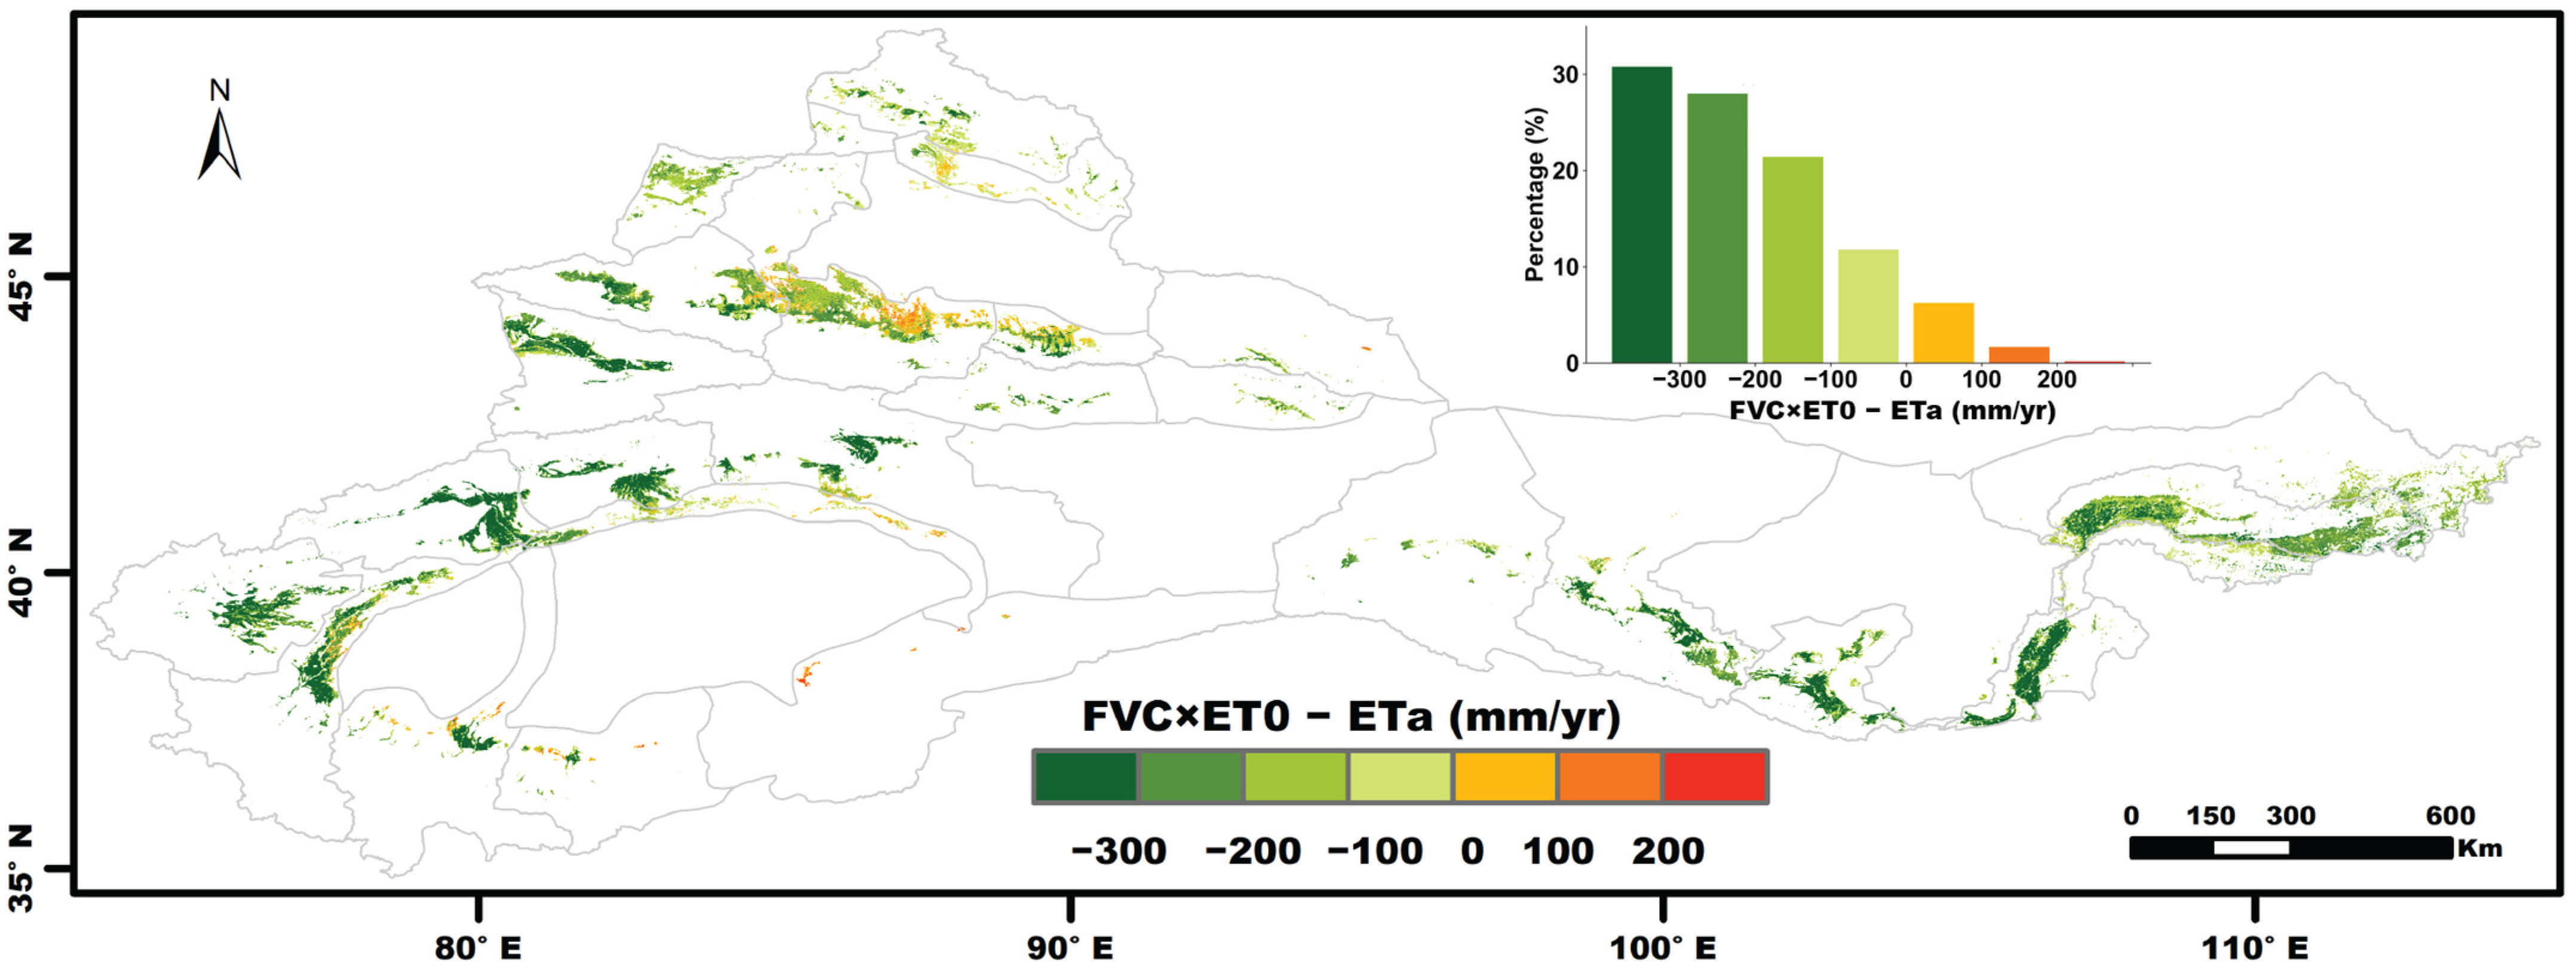
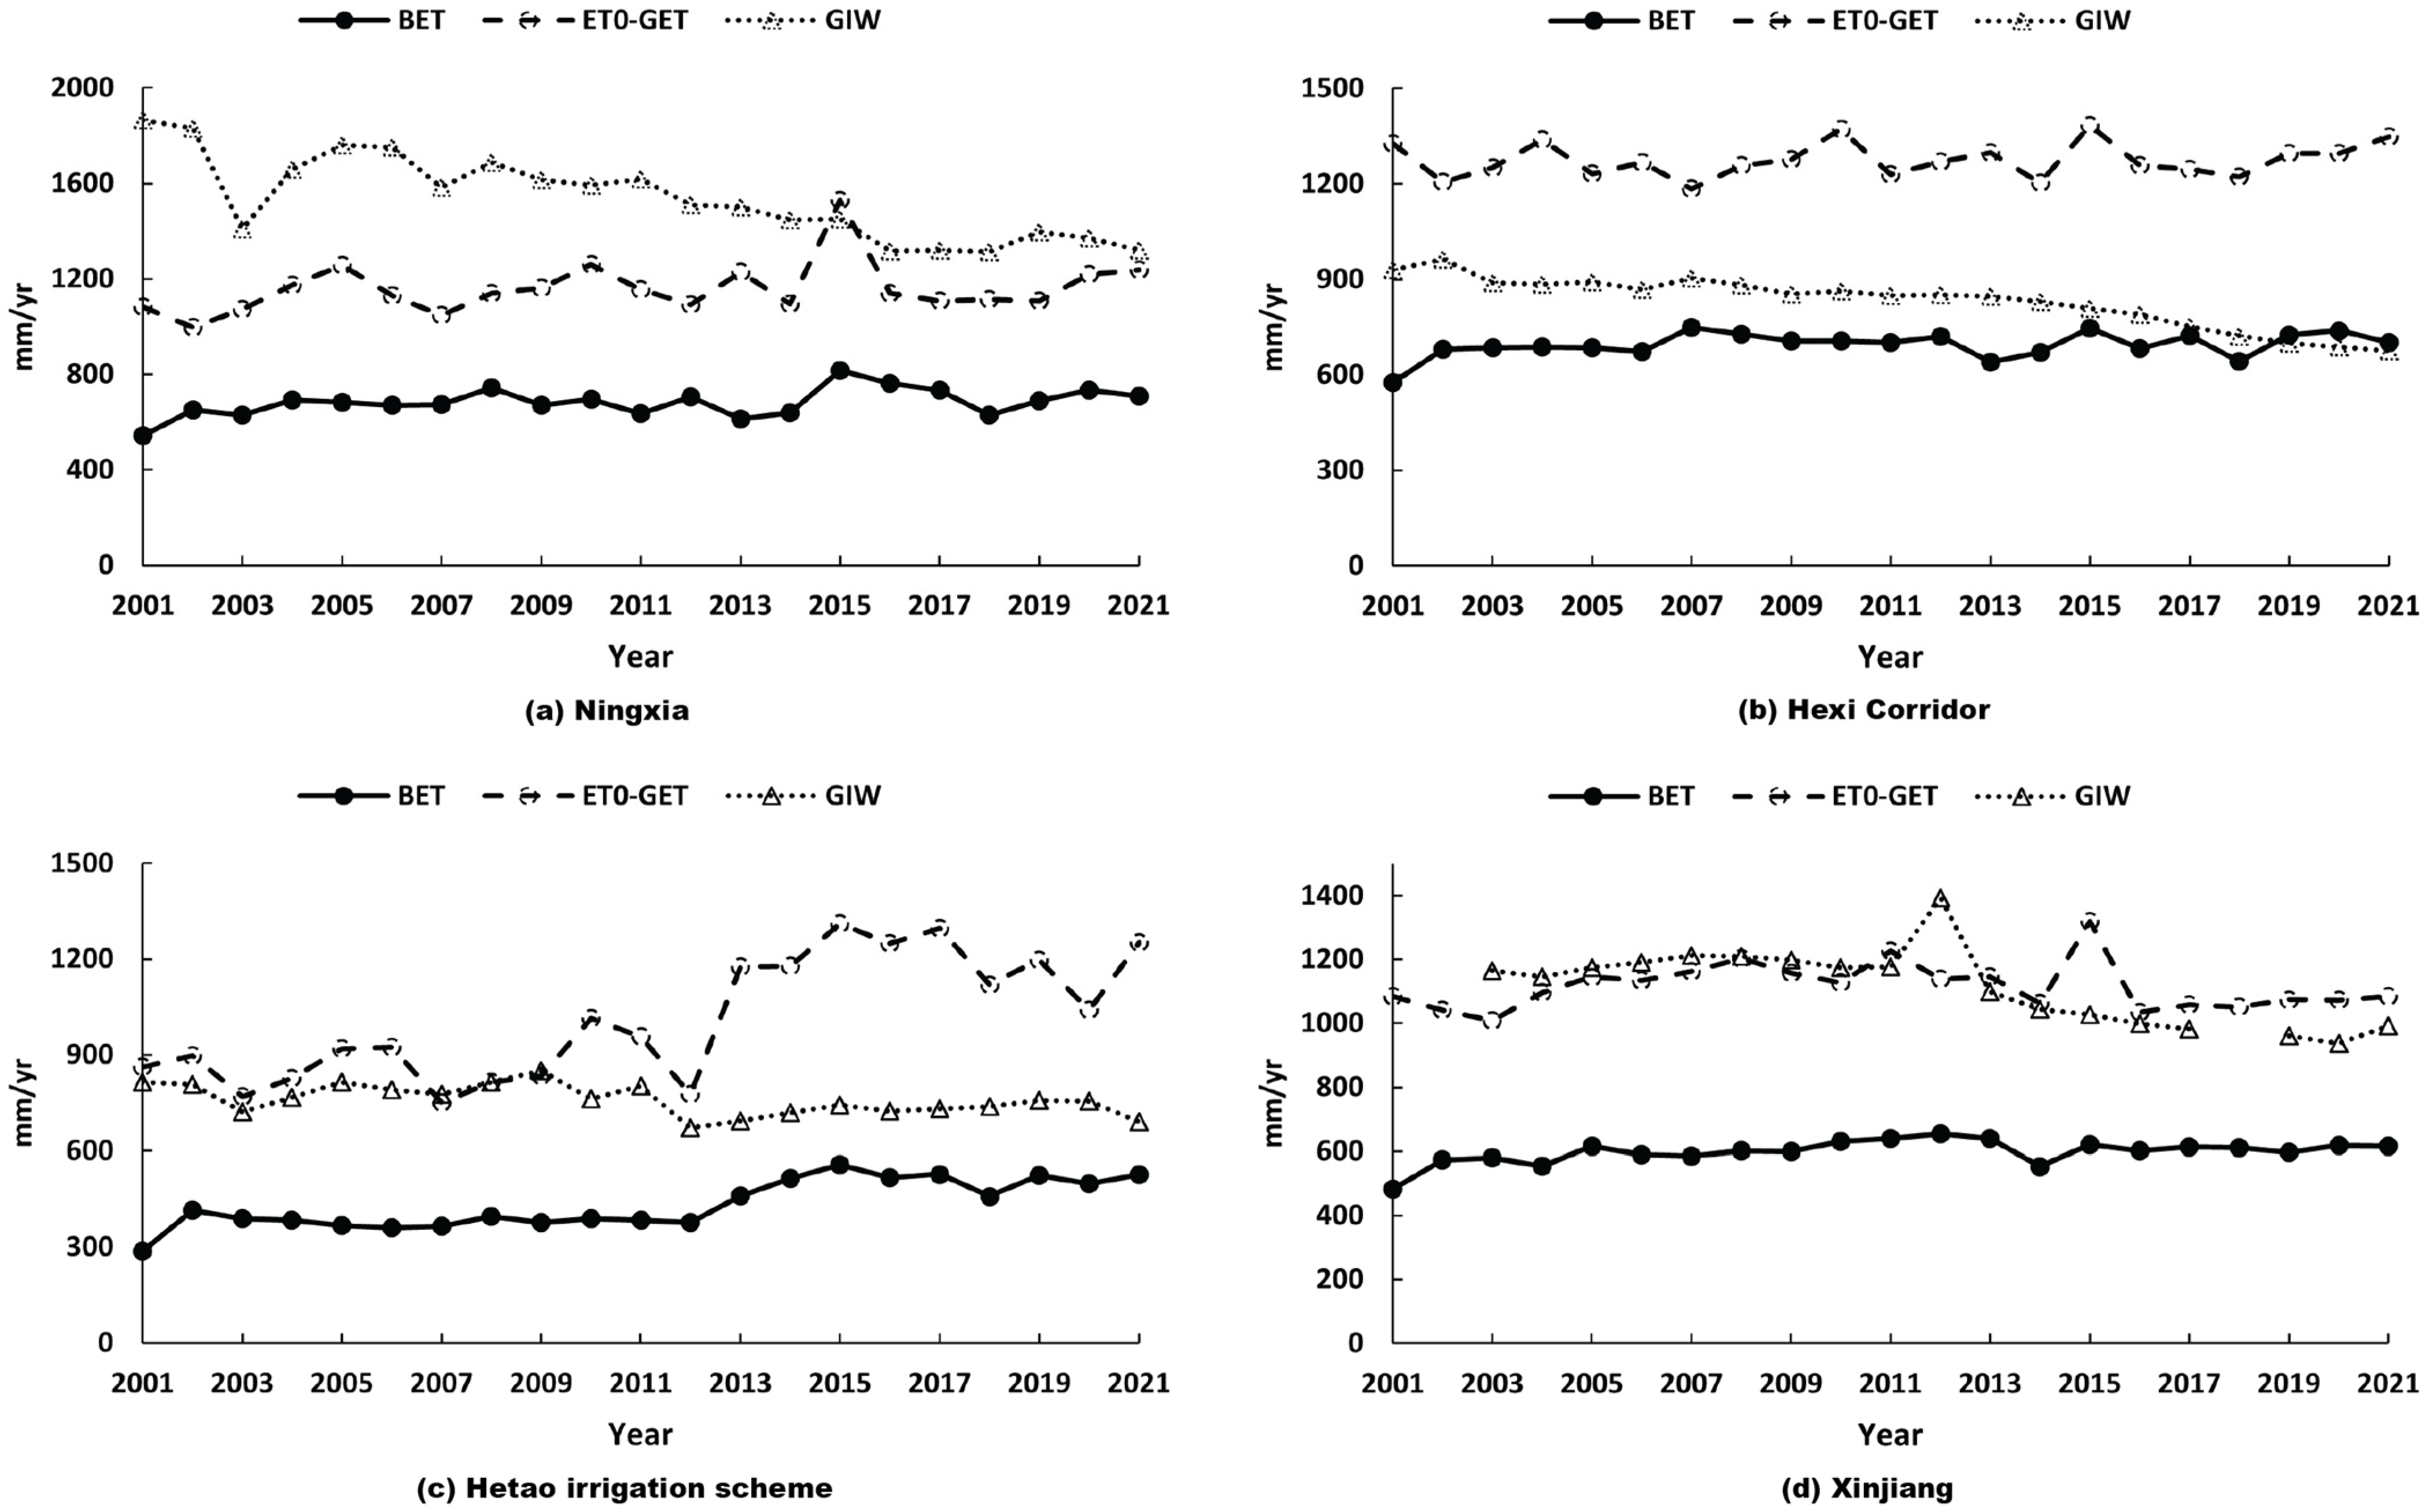
4.2. Is There Enough Water to Overcome the Water Deficit?

Given the availability of actual yearly data on available irrigation water (see Section 2), we assessed possible water deficits by comparing the total blue (irrigation) and green (precipitation) water with ET0 and ETa. As regards irrigation, we used the data on annual GIW described in Section 2. In Ningxia (Figure 5a), the available water resources (precipitation + GIW) consistently exceed the atmospheric water demand (i.e., ET0) across all years. This indicates a sufficient water supply. Consumptive water use (ETa) is much lower than available water, clearly indicating sustainable water use for irrigation. In contrast, in the Hexi Corridor region (Figure 5b), annual atmospheric water demand (ET0) consistently exceeds the total available water. Notably, annual water availability has been declining, and consumptive water use (ETa) has been increasing slightly in the last few years, getting close to available water. The risk of unsustainable use of available water resources is increasing and should be addressed in a timely manner. In the Hetao irrigation scheme, a fragile supply–demand equilibrium in water resources has been maintained prior to 2012 (Figure 5c). Since 2013, however, increasing water demand coupled with stable water supply has led to water demand far exceeding water availability in the region. In Xinjiang, a tight balance between supply and demand over the years has been maintained (Figure 5d). When comparing GIW with either ET0 or ETa, we should take into account that the irrigation water actually delivered to fields is significantly less than GIW, once the scheme irrigation efficiency is taken into account. As a result, water stress may still occur in certain regions of Xinjiang.

4.3. Is Irrigation Water Sufficient to Overcome the Deficit?

To gain further insights into the relation between irrigation water demand and available water, we compared the atmospheric water demand (ET0) minus the GET, estimated by the Budyko method, with the GIW.
Irrigation water seems to be largely sufficient in Ningxia (Figure 6a), where the GIW consistently exceeds both the irrigation water demand (ET0-GET) and the BET (ET-GET), indicating sufficient water to supply irrigation water demand and consumptive use of irrigation water (i.e., BET). In contrast, the Hexi Corridor shows an inverse pattern, with the GIW consistently falling below irrigation water demand and displaying a continuous decline (Figure 6b). Since 2015, the GIW has been very close to the BET, which is a clear sign of insufficient irrigation once we take irrigation efficiency into account, suggesting increasing use of groundwater to sustain irrigated agriculture. This finding confirms the occurrence of a water deficit in the Hexi Corridor. In the Hetao irrigation scheme (Figure 6c), the demand and supply of irrigation water were relatively balanced prior to 2012, with occasional surpluses. Past 2012, however, the stable GIW, combined with increasing demand, transformed this area into a zone characterized by a water deficit. Xinjiang has maintained a close and adaptable equilibrium between irrigation water demand and supply across most years, with exceptions occurring during periods of high demand, thereby demonstrating relatively stable water resource conditions. The GIW has remained rather close to water demand (i.e., ET0-GET) and clearly higher than consumptive water use, a difference sufficient to accommodate water losses between water diversion and water application to fields (Figure 6d).
In summary, while the Hexi Corridor faces significant water deficits, Ningxia and Xinjiang are close to meeting local irrigation water demands by relying on current water availability and efficient irrigation practices. It is noteworthy that the actual consumption of blue water (BET) remains lower than total irrigation water in NW China (excluding the Hexi Corridor in recent years), particularly in Ningxia. The difference between the GIW and BET is considerable in some instances but is inevitable in order to accommodate water losses due to the scheme’s irrigation efficiency being lower than 1.

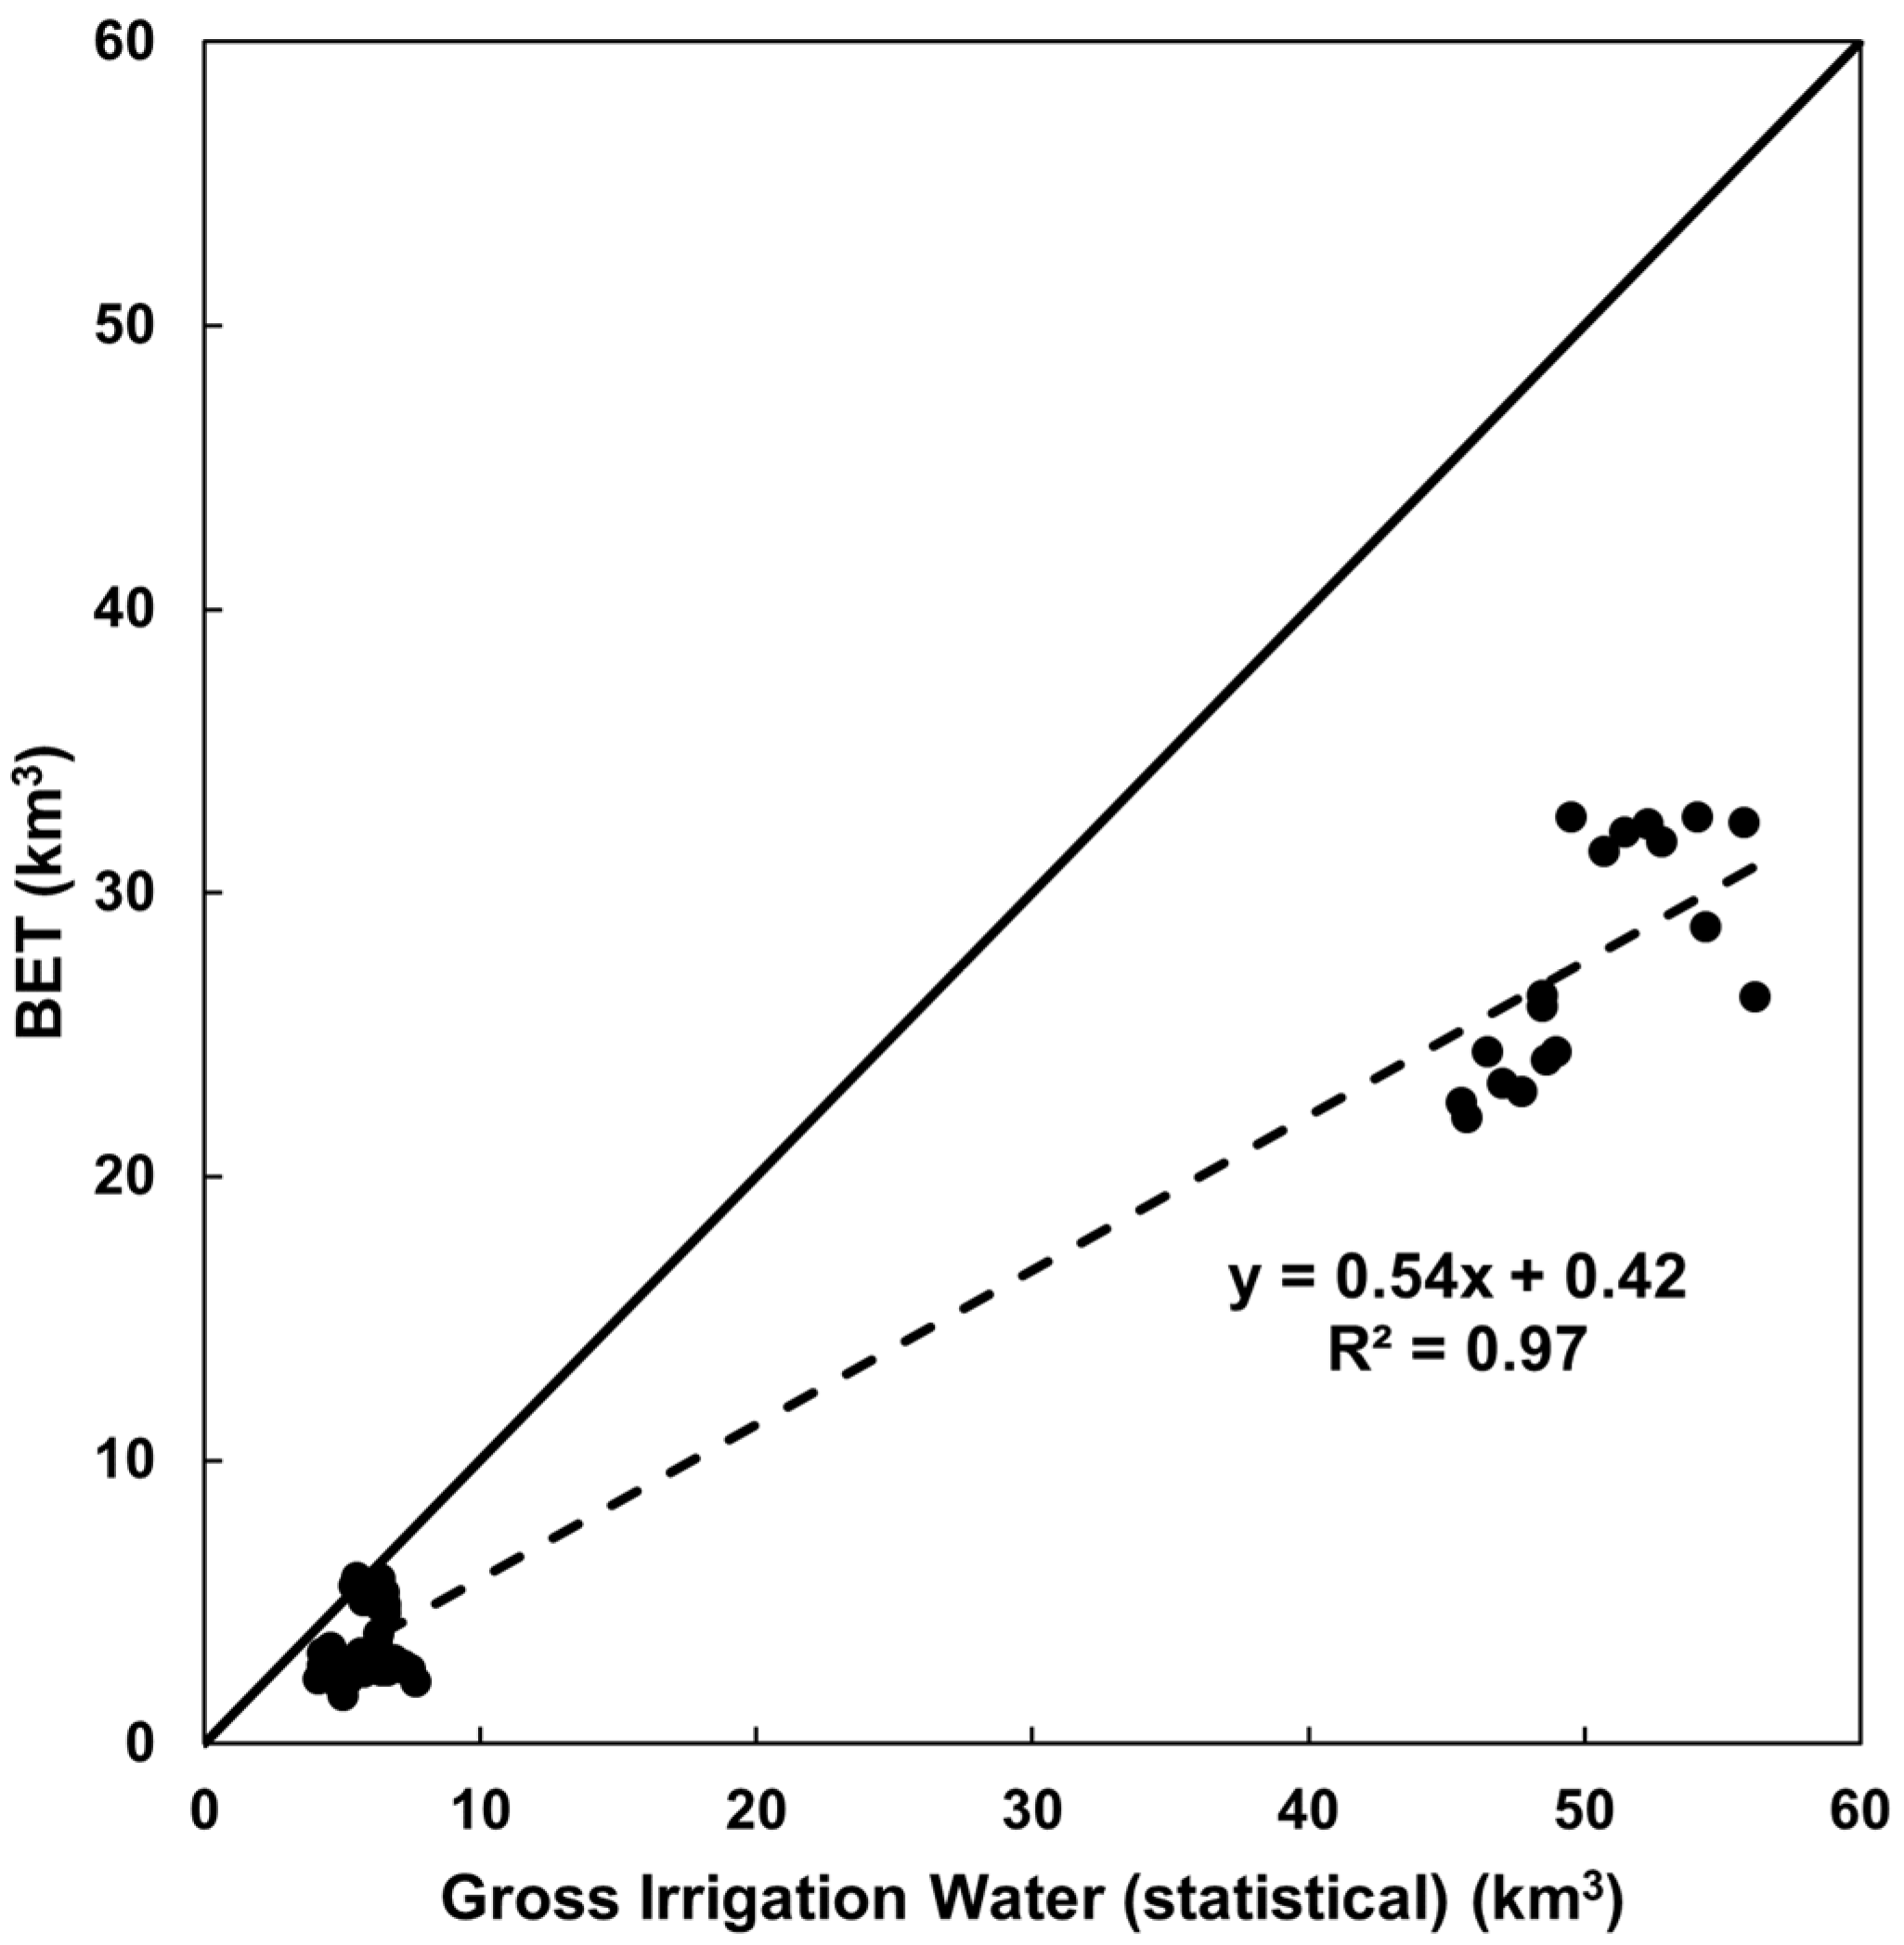
4.4. How Efficient Is the Distribution and Use of Irrigation Water

A strong linear correlation (R² = 0.97) was observed between the GIW and BET (Figure 7). The scheme irrigation efficiency, i.e., the ratio of BET to GIW, has been determined to be 0.54, which includes both conveyance efficiency and water use efficiency. This value is consistent with the irrigation efficiency reported for the Xinjiang (0.57, 2020) [38], Gansu (0.57, 2021) [39], Ningxia (0.561, 2021) [40], and Hetao irrigation scheme (0.568, 2021) [41]. According to the FAO (1989) [33], a scheme irrigation efficiency in the range of 50% to 60% is considered good. This indicates that the scheme irrigation efficiency in the study area adheres to the FAO established standards for effective irrigation, suggesting that the current irrigation in the region is relatively efficient. However, it should be noted that a 50% scheme irrigation efficiency indicates that half the water diverted into an irrigation scheme is lost during the irrigation process. This significant loss of water is the primary factor of insufficient on-farm irrigation water, which may lead to insufficient water supply to irrigated crops.

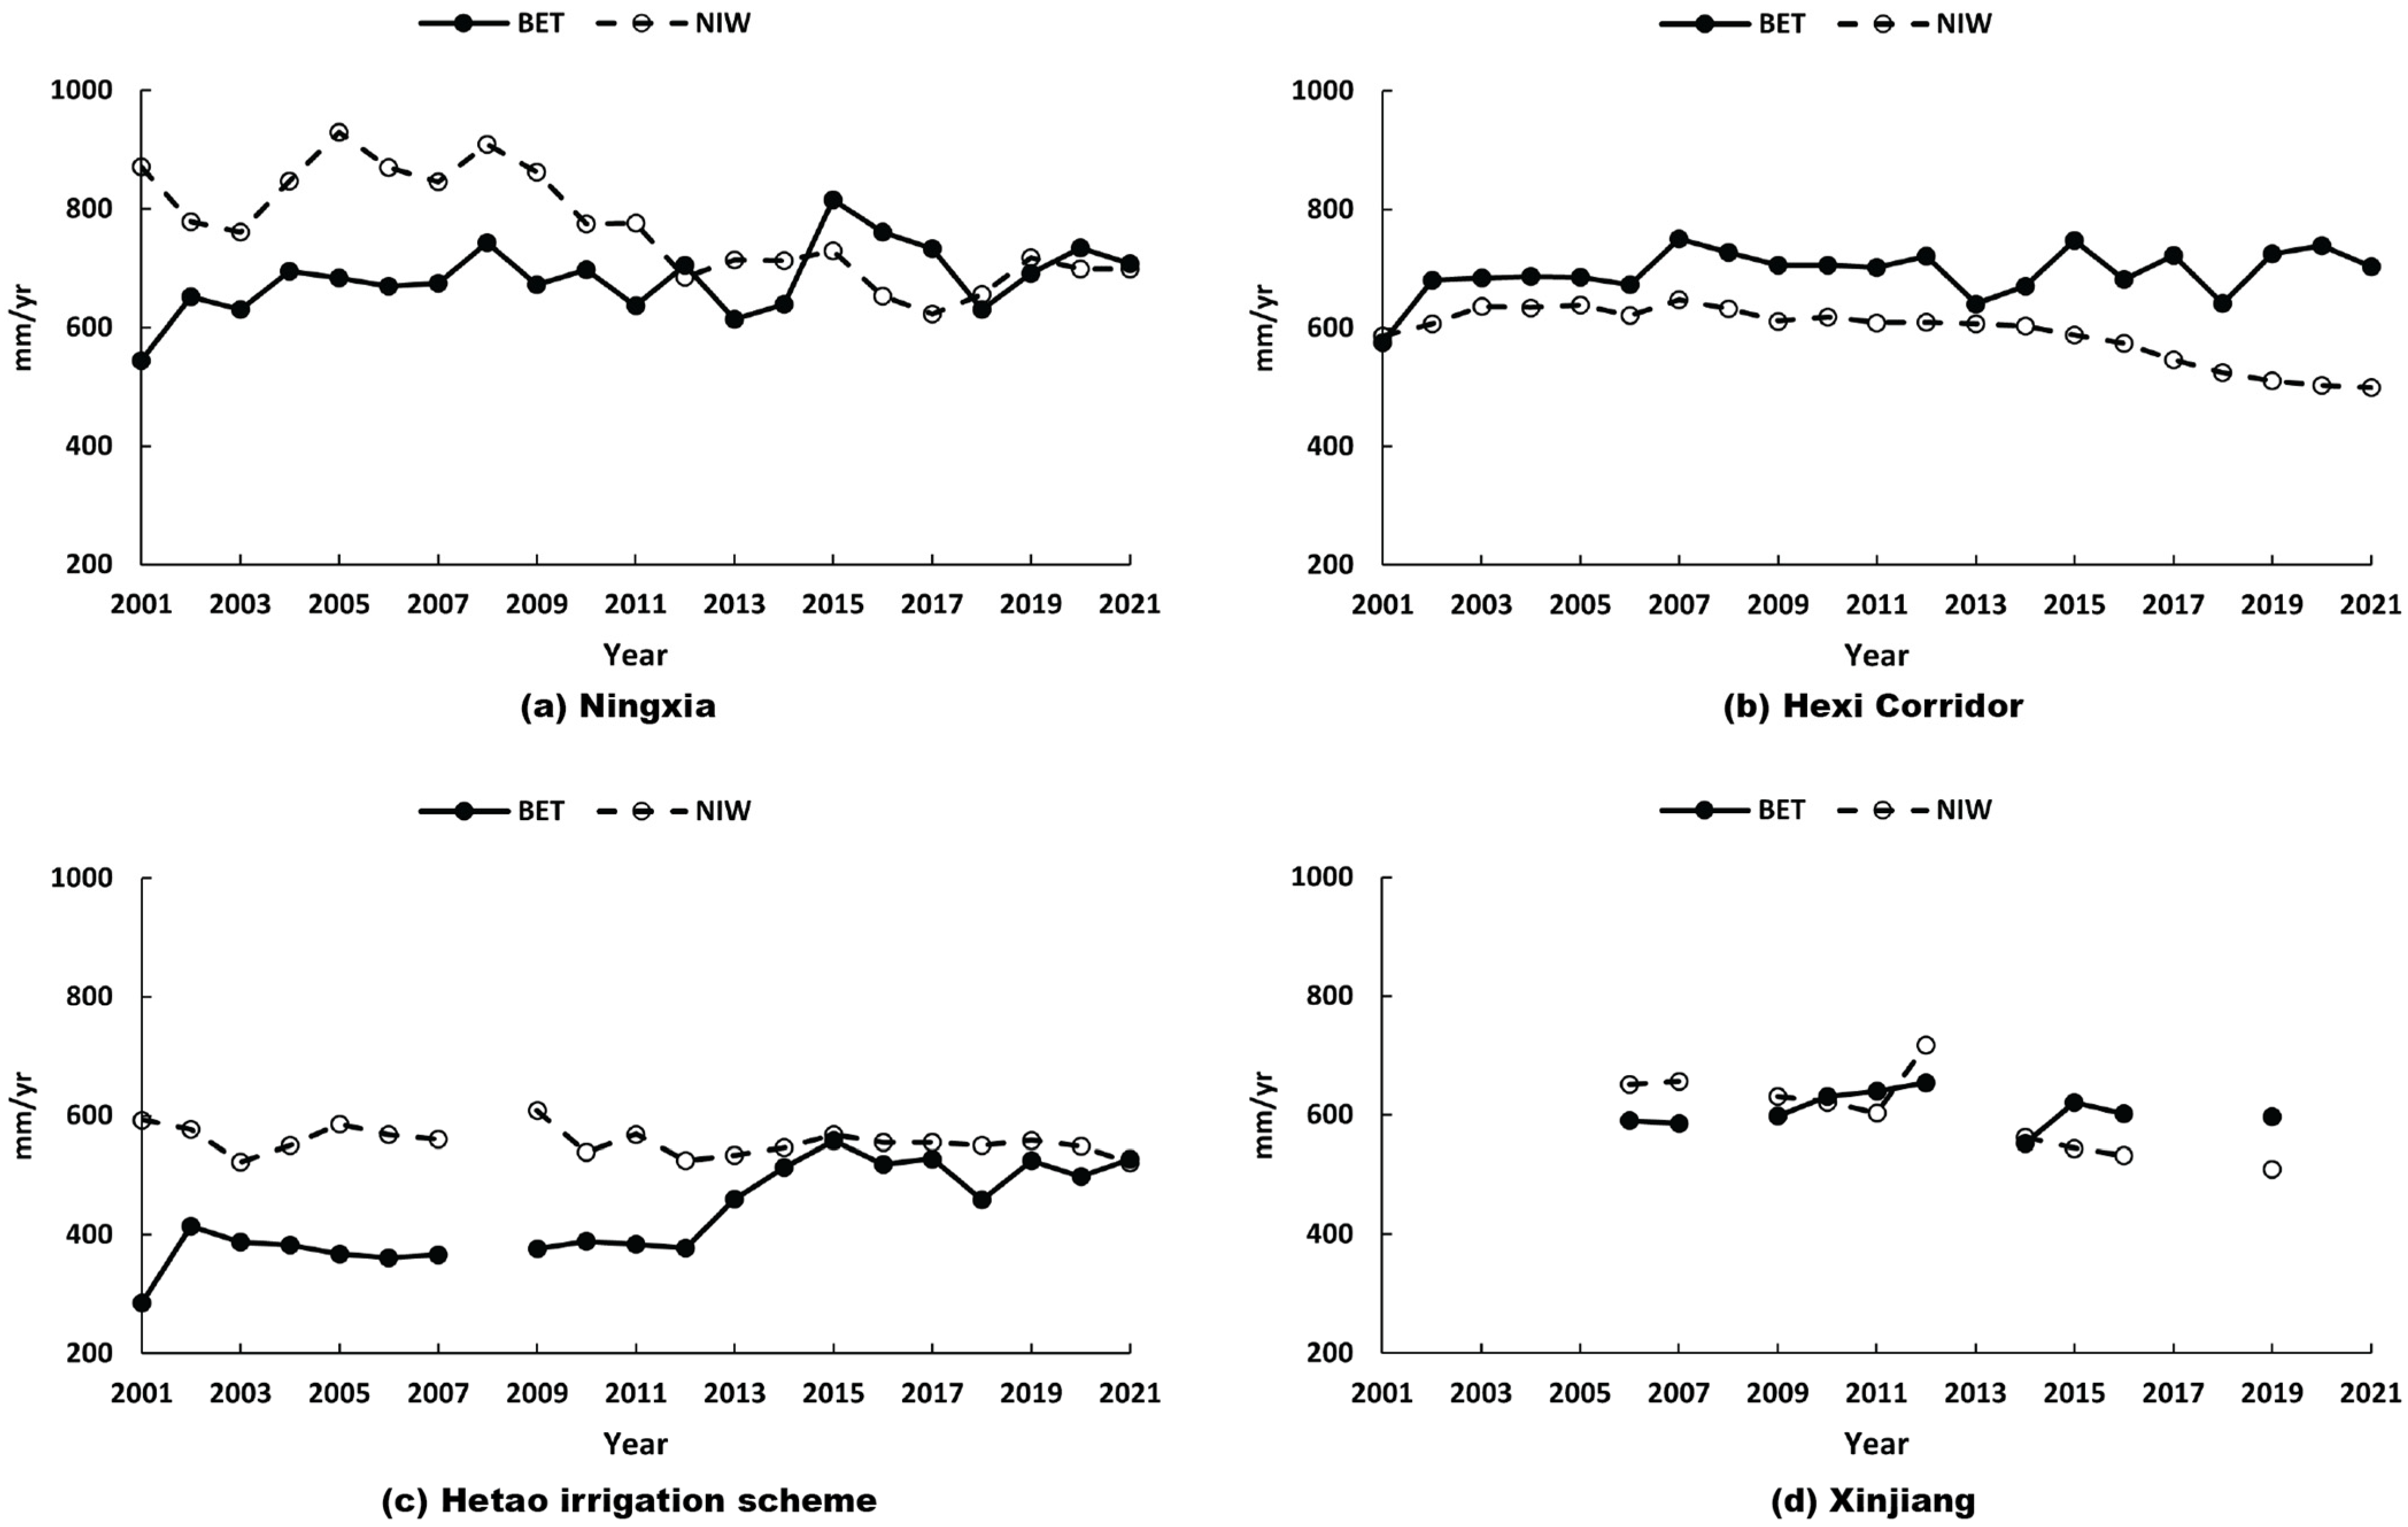
4.5. Is Irrigation Water Used Efficiently by Crops?

The scheme irrigation efficiency in the arid and semi-arid regions of NW China is generally good. Further, we evaluated in some detail the water use efficiency. For this purpose, the relationship between the BET and NIW, i.e., the irrigation water stored in the soil, was examined (Figure 8).
In Ningxia, the NIW far exceeded the BET but subsequently declined annually, gradually converging to the BET (Figure 8a). This transition indicates improved water use efficiency in Ningxia, shifting from excessive field irrigation, when partial irrigation water retained in the soil was partly used by crops, to near-complete utilization of retained irrigation water by crops. In contrast, in the Hexi Corridor (Figure 8b), the deficit in NIW compared to BET was persistent, with an expanding gap over time, revealing chronic NIW deficits to meet consumptive water use by crops. This discrepancy implies the use of additional water resources, specifically groundwater. When combined with the GIW deficit in the Hexi Corridor, this further indicates that this region is experiencing a severe water deficit. In the Hetao irrigation scheme, despite the initial NIW surpassing the BET, the growth in the BET since 2012 has narrowed this gap (Figure 8c). This suggests that water use efficiency has been improving in this region. Xinjiang shows a transition from a state where the NIW exceeds the BET to an equilibrium condition and eventually to a state where the BET exceeds NIW (Figure 8d). The shift from a positive to a negative gap between the NIW and BET not only reflects improved water use efficiency but also suggests that the groundwater extraction meets the unmet BET demand, similar to the situation in the Heihe River Basin.
The BET serves as a novel metric for evaluating water use efficiency. Through a comparative analysis of net irrigation water and the BET, the water use efficiency can be assessed, and opportunities for further improvements can be identified. In regions where the NIW exceeds the BET, there exists a potential for water savings through the implementation of more efficient irrigation management. Conversely, in areas where the BET exceeds the NIW, it is indicative that the NIW alone is inadequate to meet crop water demands. In such cases, the utilization of additional water sources, typically groundwater, is necessary. Given the groundwater recharge by irrigation water losses, the extraction of additional groundwater is not necessarily a driver of risks. This analysis reveals the challenges facing the region in terms of water resources to support sustainable development.

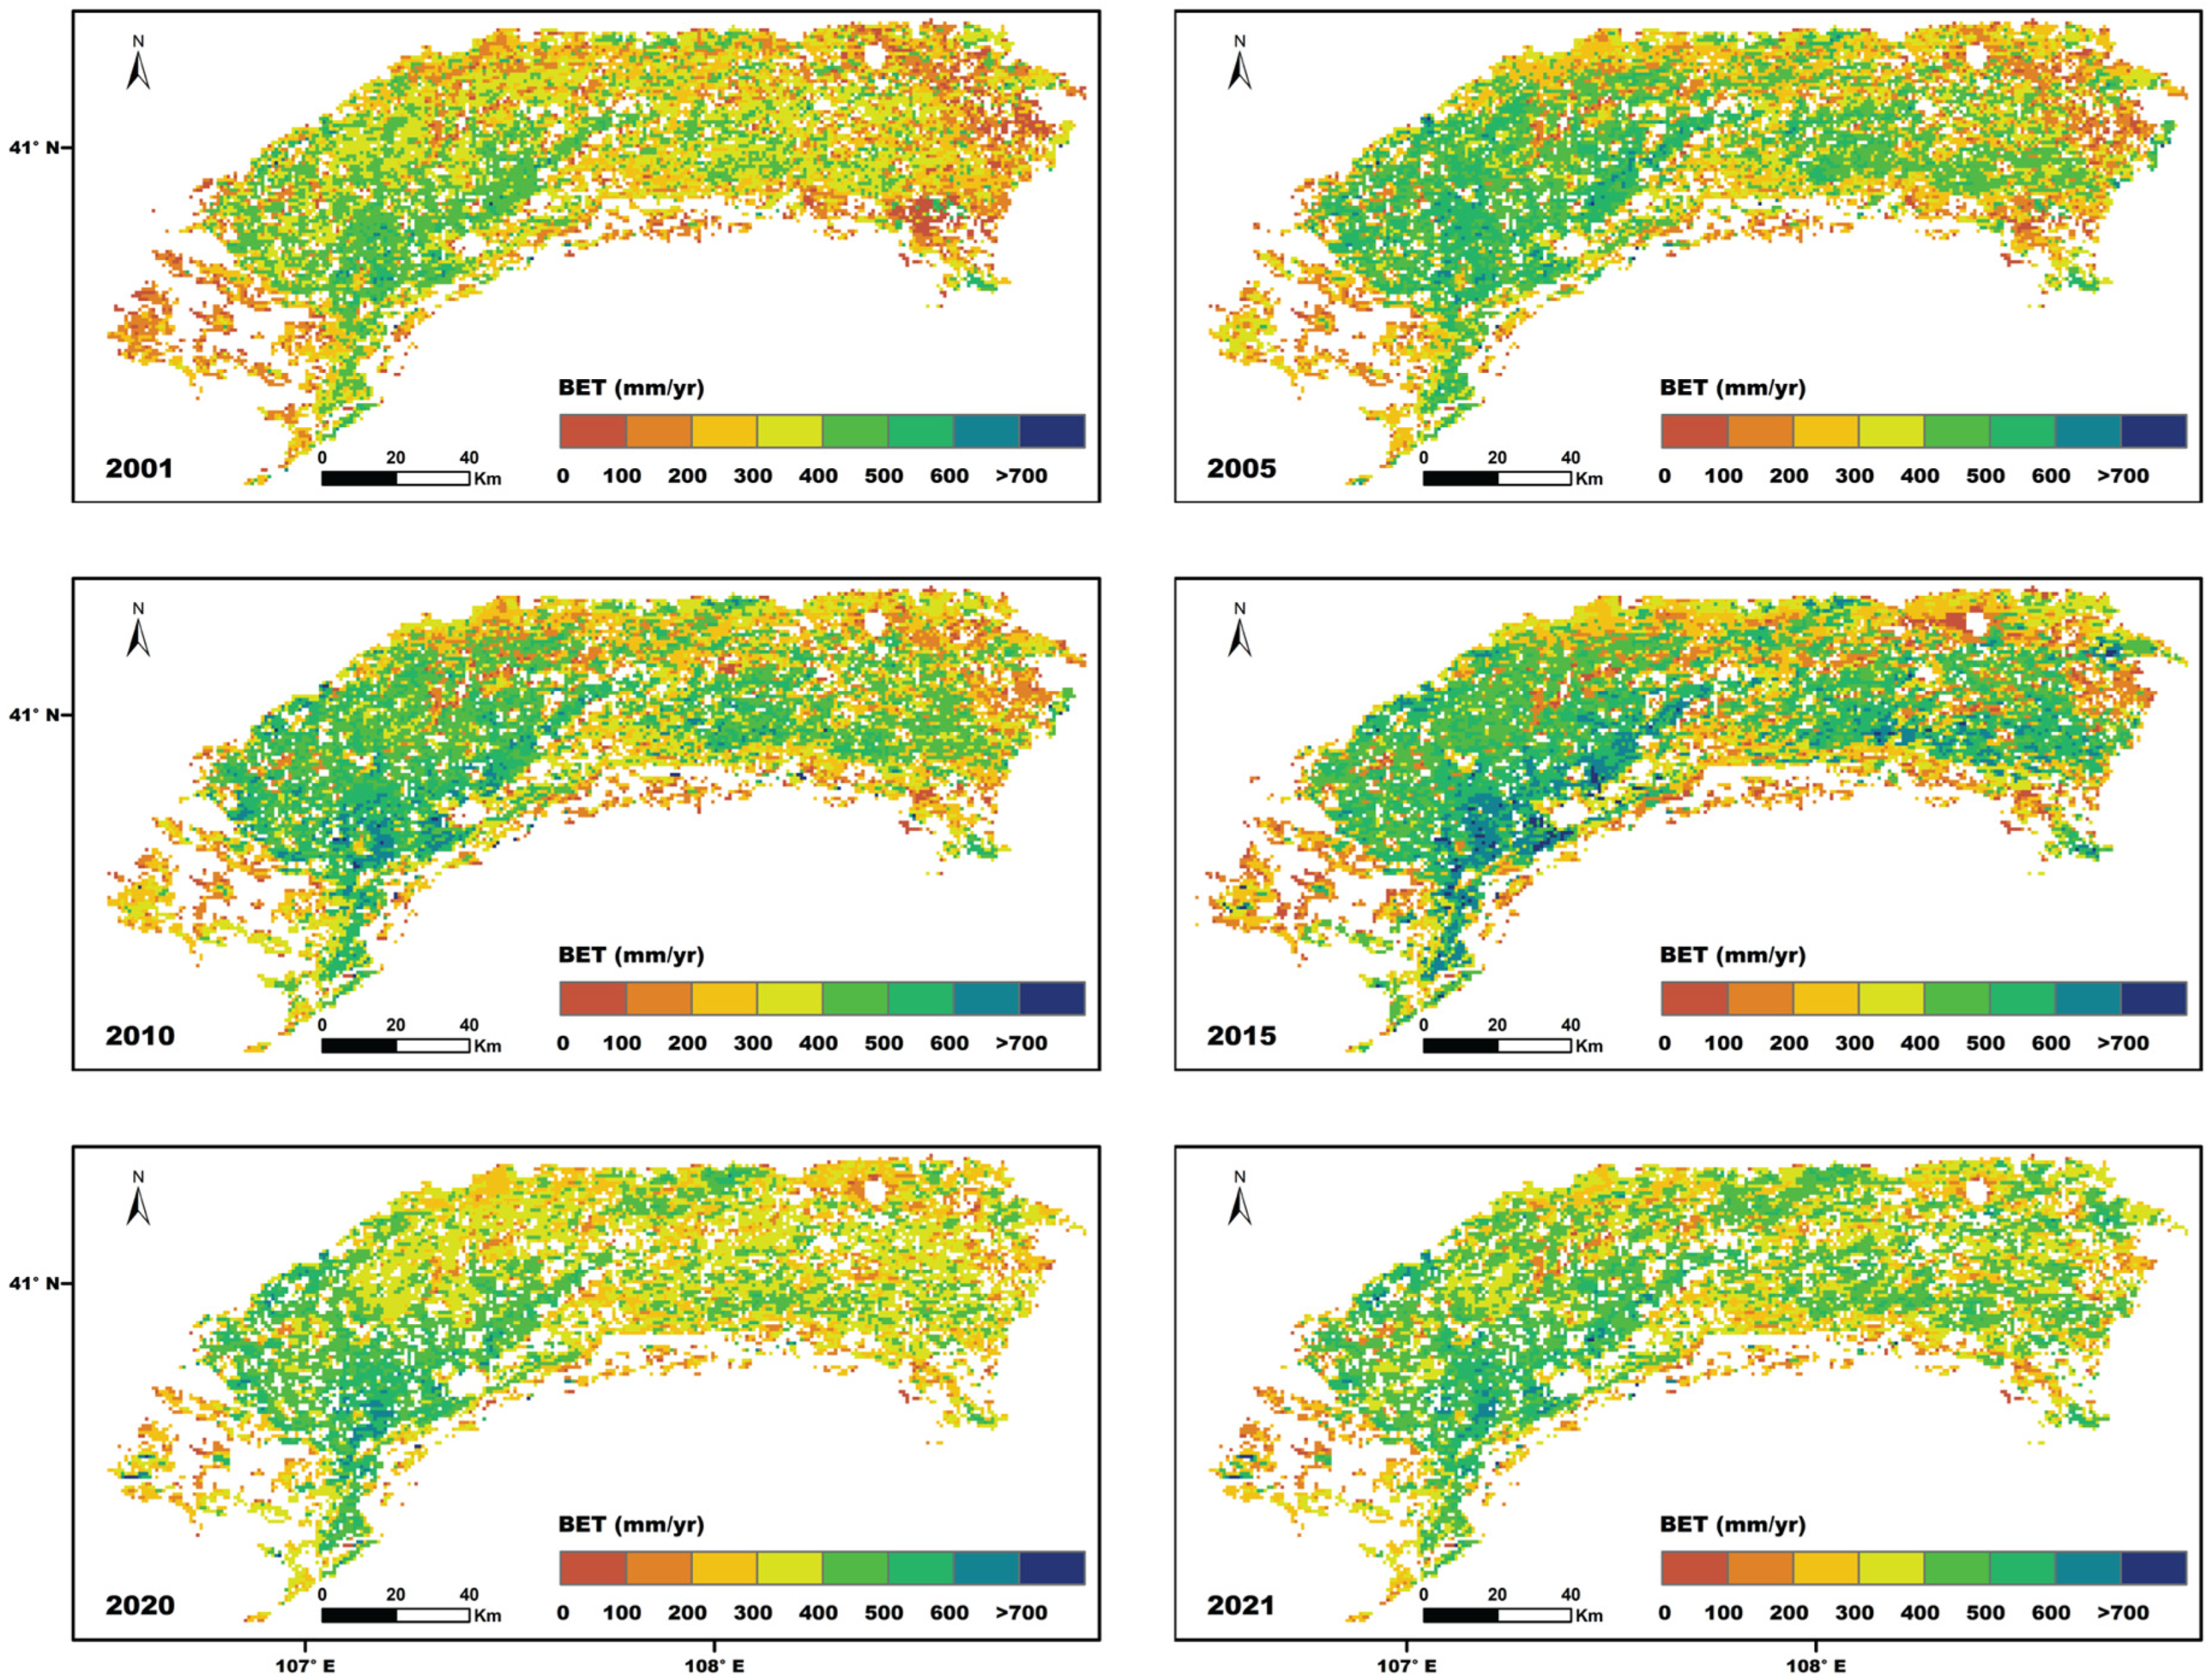
4.6. Trend of Blue Water Evapotranspiration

The results of the evaluation of irrigation performance presented in Section 4.1, Section 4.2, Section 4.3, Section 4.4 and Section 4.5 were aggregated to large areas to allow for a comparison with the official data on the GIW and NIW. In this section, Section 4.6, and the next section, Section 4.7, the temporal and spatial variability of irrigation water use is illustrated by making direct use of our pixelwise estimates of ETa, GET, and BET. A trend analysis of spatial data reveals that the BET in the irrigated lands of NW China generally exhibited an increasing trend from 2001 to 2021 (Figure 9), with 91.07% of the areas experiencing significant increases in the BET. This trend may be closely associated with increasing use of the irrigation water. Research findings by Han et al. (2020) [42] indicate that NW China shows the most significant increasing trend in agricultural water use from 2003 to 2013. This increase in irrigation water may have led to an increase in the BET in the region.
Further examination shows that the irrigated lands of NW China initially experienced an increase in the BET, subsequently followed by a decrease. To illustrate this point, the spatially averaged BET and its standard deviation in the Hetao irrigation scheme were presented (Figure 10). The results showed that the BET in 2001 was 282.9 ± 123.7 mm/yr, reaching a maximum of 394.7 ± 171.9 mm/yr in 2015 before decreasing to 377.5 ± 116.5 mm/yr by 2021.

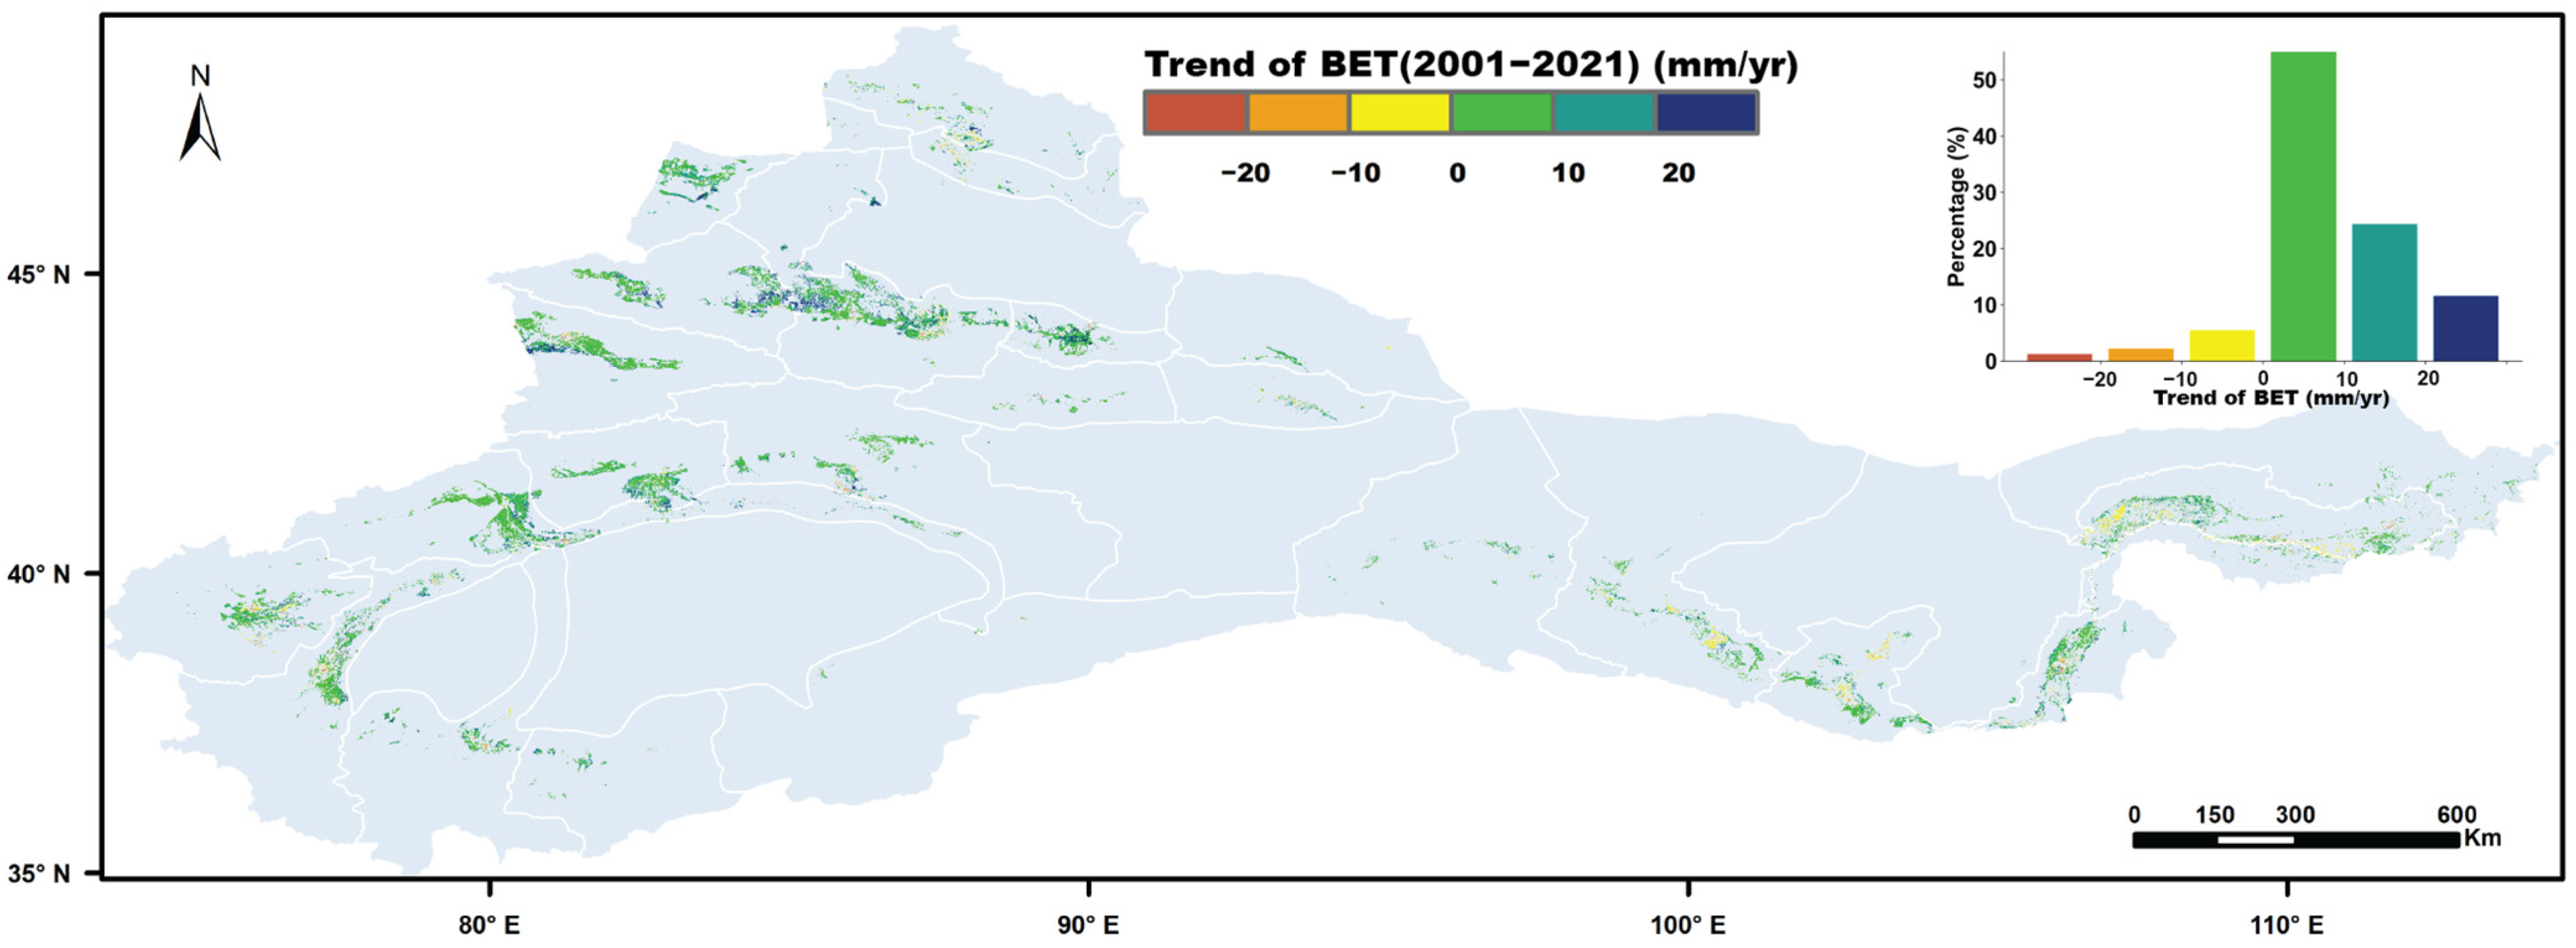
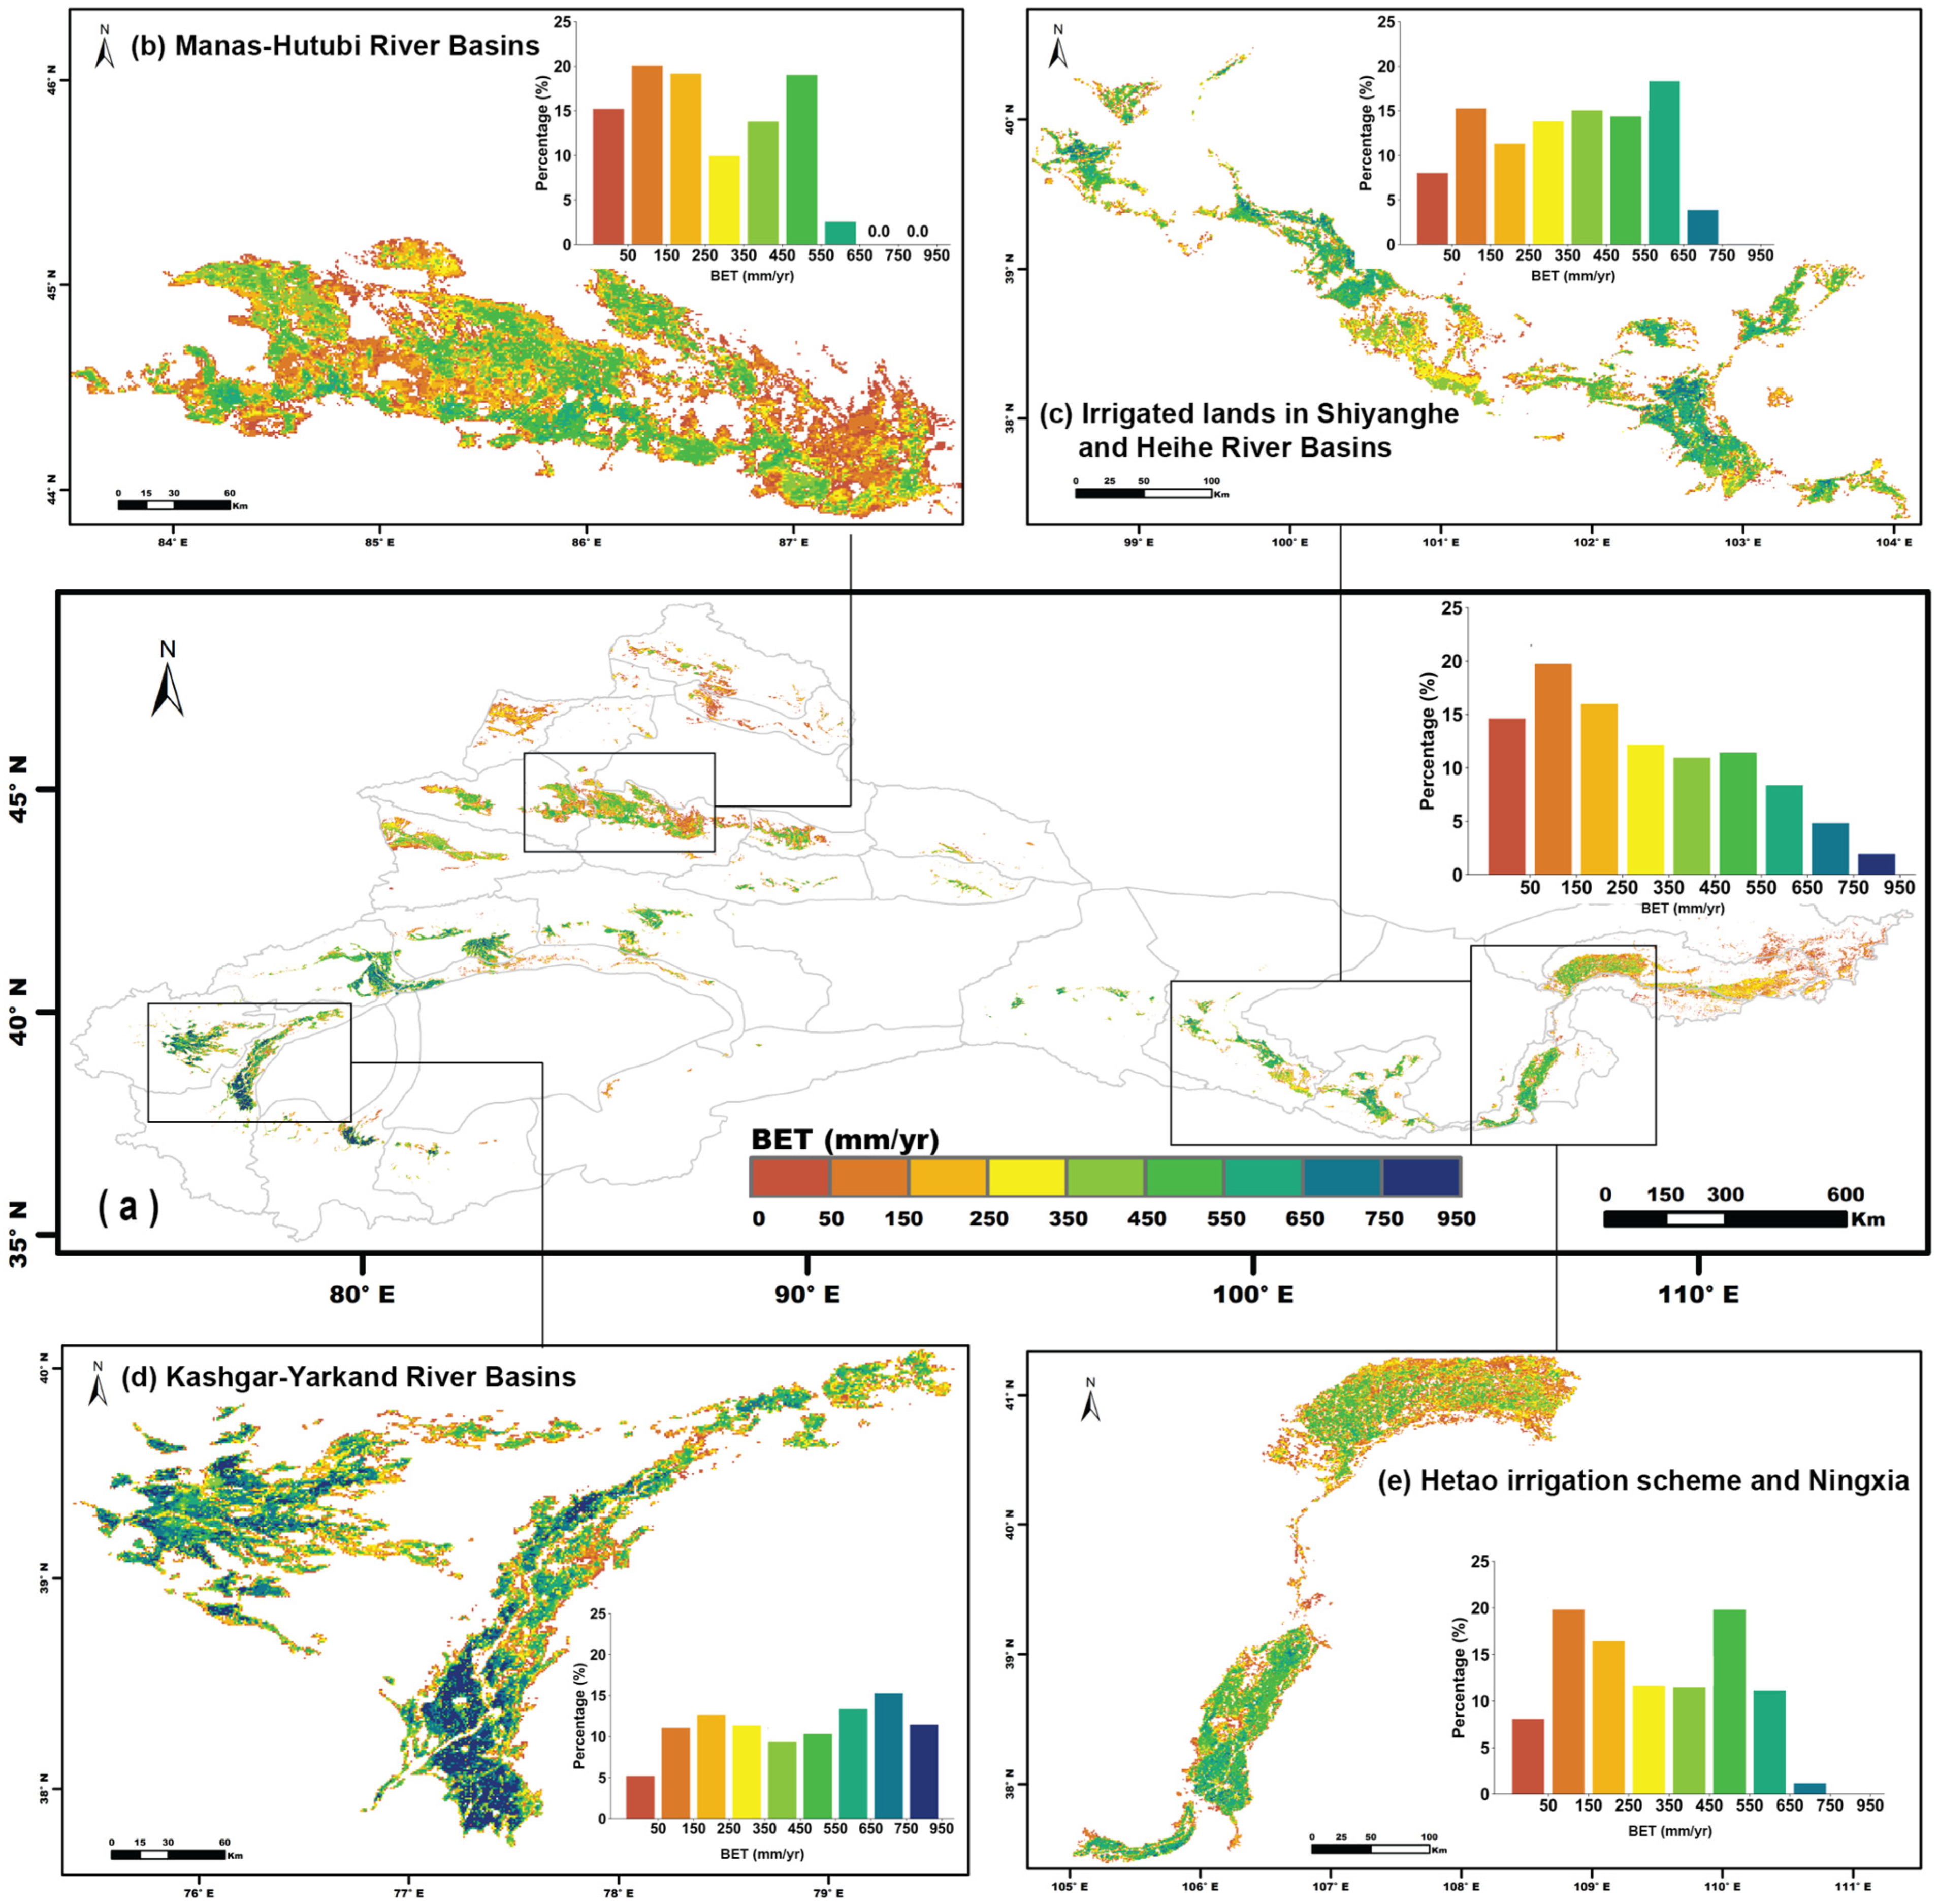
4.7. The Spatial Distribution of Blue Evapotranspiration

To understand the spatial distribution of irrigation water use in the irrigated lands of NW China, we analyzed the spatial distribution of the BET (Figure 11). The results show significant variations across the region, with a spatial mean value of 288.1 ± 216.7 mm/yr. Furthermore, the spatial frequency distribution of the BET shown in Figure 11a also highlights the considerable variability in the BET across the region.
The Ningxia and Hetao irrigation scheme are heavily reliant on the Yellow River water for irrigation purposes (Figure 11e). However, it is clear that the relatively upstream Ningxia area shows a higher BET in comparison to the Hetao irrigation scheme, with a spatial mean BET of 392.7 ± 198.7 mm/yr in Ningxia and 254.6 ± 162.5 mm/yr in the Hetao irrigation scheme.
The irrigation areas in the Hexi Corridor are primarily located in the Shiyang and Heihe River basins (Figure 11c), with a spatial mean BET of 336.9 ± 195.1 mm/yr. It is worth noting that the central area, which is the confluence of the Shiyang and Heihe River basins, is characterized by a higher elevation. This higher elevation results in lower temperatures and greater precipitation in the central region, thereby reducing the irrigation demand. Consequently, the BET in the central area (150–350 mm/yr) is significantly lower than the range of 450–750 mm/yr observed in the Shiyang and Heihe River basins.
Xinjiang is divided into two distinct regions by the Tianshan Mountains, with marked climatic differences between the two regions. The northern region is distinguished by cooler temperatures and higher precipitation, while the southern region is characterized by warmer temperatures and drier conditions. This climatic divide results in significant variations in the BET in the region. As illustrated, the Manas-Hutubi River Basin in the north is among the regions with the lowest BET in the irrigated lands of NW China, with a spatial average of 255.9 ± 177.5 mm/yr (Figure 11b). In contrast, the Kashgar-Yarkand River Basin in the south shows the highest BET in the region, with a spatial average of 437.5 ± 247.1 mm/yr (Figure 11d).

5. Discussion

5.1. Indicators of Irrigation Water Use

A key aspect of efficient irrigation management is the timely availability of accurate information about crop water demand. As indicated in Section 4.1, using only the difference between ET0 and ETa to evaluate water stress can lead to an overestimation of severity and fails to precisely determine whether crops are actually under water stress (Figure 2). The reason for this inconsistency is the essential difference in the vegetation cover (FVC) that is applied when calculating ET0 and when estimating ETa. ET0 represents the theoretical ET of a hypothetical reference crop, fully watered and covering the soil [33]. As a fundamental indicator in agricultural hydrology, ET0 serves as a baseline for estimating crop water demands. However, the idealized assumptions underlying ET0 calculations—including optimal growth conditions and unlimited water availability—may lead to overestimation of the water requirements in the assessment of irrigation water deficits.
To address this limitation, the single crop coefficient (kc) was introduced to adjust ET0 according to specific crop characteristics and growth stages. The single crop coefficient (kc) integrates differences in the soil evaporation and crop transpiration rate between the crop and the grass reference surface [33]. The approach is used to compute crop water requirements for weekly or longer time periods. When values for kc are needed for specific applications, e.g., drip irrigation, a separate transpiration and evaporation dual crop coefficient (kcb + ke) can be applied [33]. The dual coefficient approach requires more numerical calculations than the procedure using the single time-averaged kc coefficient. The crop water demands are estimated as ETc = kc × ET0 or (kcb + ke) × ET0 to improve the estimation of water demand by accounting for soil evaporation and crop transpiration rate, i.e., a way applicable to partial vegetation cover. Nevertheless, significant spatial and temporal variations in the single or dual crop coefficient emerge due to regional differences in crop type, crop growth stages, and climate and soil properties.
Recent advances in remote sensing have enabled temporally and spatially continuous monitoring of crop biophysical parameters, including fractional vegetation cover, normalized difference vegetation index, and leaf area index [43,44,45,46]. The temporal patterns of these parameters exhibit strong correlations with crop coefficients. Satellite-derived vegetation indices (VI) have thus been applied to estimate kc and kcb, with subsequent improvements in ETc assessment [47,48,49,50,51]. These VI-based approaches enhance spatial representativeness by integrating real-time crop growth conditions from open-access satellite data, enabling multi-scale crop water demand monitoring from field to continental levels while reducing reliance on ground measurements. On the other hand, this study was constrained by the data on irrigation water, i.e., GIW and NIW, which were available as annual totals only. This made it difficult to reconcile our analysis with a detailed characterization of the evolution of crop water requirements during the growing season. The use of FVC-corrected ET0, although a very rough proxy of the crop coefficients, did show that the difference between ET0 and ETa during the vegetative growth stage can be explained by foliage development.
The BET metric developed in this study establishes an analytical framework to estimate actual consumptive use of irrigation water and to track managed water flows. The approach overcomes the inherent limitations of the Budyko hypothesis, which neglects differences in vegetation type and soil conditions, by using the ETa retrievals from the ETMonitor system, which fully accounts for local vegetation and soil properties. The Budyko hypothesis is only applied to partition ETa into GET and BET, accounting for the dependence on vegetation type through the optimized parameter ωv. Building upon the green–blue water conceptual framework, the BET innovatively isolates precipitation-derived green water and irrigation-sourced blue water—a critical advancement beyond conventional ETa estimates that merge these distinct hydrological components. By partitioning ETa into the GET and BET, the latter quantifies the actual appropriation of managed water resources, while eliminating systemic biases in traditional water assessments caused by undifferentiated treatment of natural and human-induced water flows. The evaluation of the BET in the irrigated lands of NW China provided multiple insights on NIW deficits and helped to quantify water use efficiency. Regional BET patterns reveal water use hotspots at risk where the BET exceeds locally available blue water. This metric advances sustainable water management by decoupling natural and anthropogenic water flows and quantifying water use efficiency.

5.2. Availability of Irrigation Water in the Hexi Corridor

The BET demonstrates superior performance in identifying NIW deficits and quantifying agricultural water use efficiency. The BET analysis (Figure 8b) revealed a persistent and widening disparity between NIW supply and crop water use in the Hexi Corridor region, with the NIW consistently falling below the BET in multiple years. The increase in consumptive water use is consistent with the sustained expansion of the cultivated area, which, in the case of the Heihe River Basin, has undergone a significant transformation. From 2001 to 2021, the fractional abundance of bare soil in the middle reach decreased from 78.52% to 72.50% at an annual rate of 0.30% (R² = 0.87), while the cultivated land increased from 17.50% to 21.61%, representing a net increase of 23.49% over the two decades. This escalating gap indicates systemic inadequacies in surface water allocation to meet crop water demands and suggests the need for additional water resources, specifically groundwater. The utilization of groundwater may serve as a solution to this issue. As highlighted by Li et al. (2018) [52], groundwater withdrawals in the Heihe River Basin increased approximately 36% from 2001 to 2012. To compensate for the increase in water demand, many illegal wells were drilled, and the pumping of groundwater increased sharply, approaching 0.6 × 10⁹ m3 in 2010. This pumping lowered the groundwater table in most regions in the midstream area, particularly in areas where groundwater was the dominant source of water for irrigation.
The BET provides critical insights for water governance reform. Since 2015, the GIW has been very close to the BET, which is a clear sign of insufficient irrigation (Figure 6b). The BET also reveals NIW deficits (Figure 8b). That is to say, the NIW is insufficient to meet the BET, which most likely reveals the illegal exploitation of groundwater. It underscores the necessity for comprehensive water management strategies that integrate economic, hydrological, and policy dimensions to address the NIW deficit and ensure sustainable agricultural production. This includes the adoption of more efficient irrigation technologies and the implementation of water-saving practices. By integrating these measures, regions like the Hexi Corridor can enhance their water use efficiency and mitigate the impacts of water deficit on agricultural productivity.

6. Conclusions

Building on the green–blue water concept, ET was partitioned into the GET and BET using remote sensing data and the Budyko hypothesis. A novel BET metric was developed and applied to irrigated lands in NW China to evaluate irrigation performance from 2001 to 2021. The main conclusions are as follows:
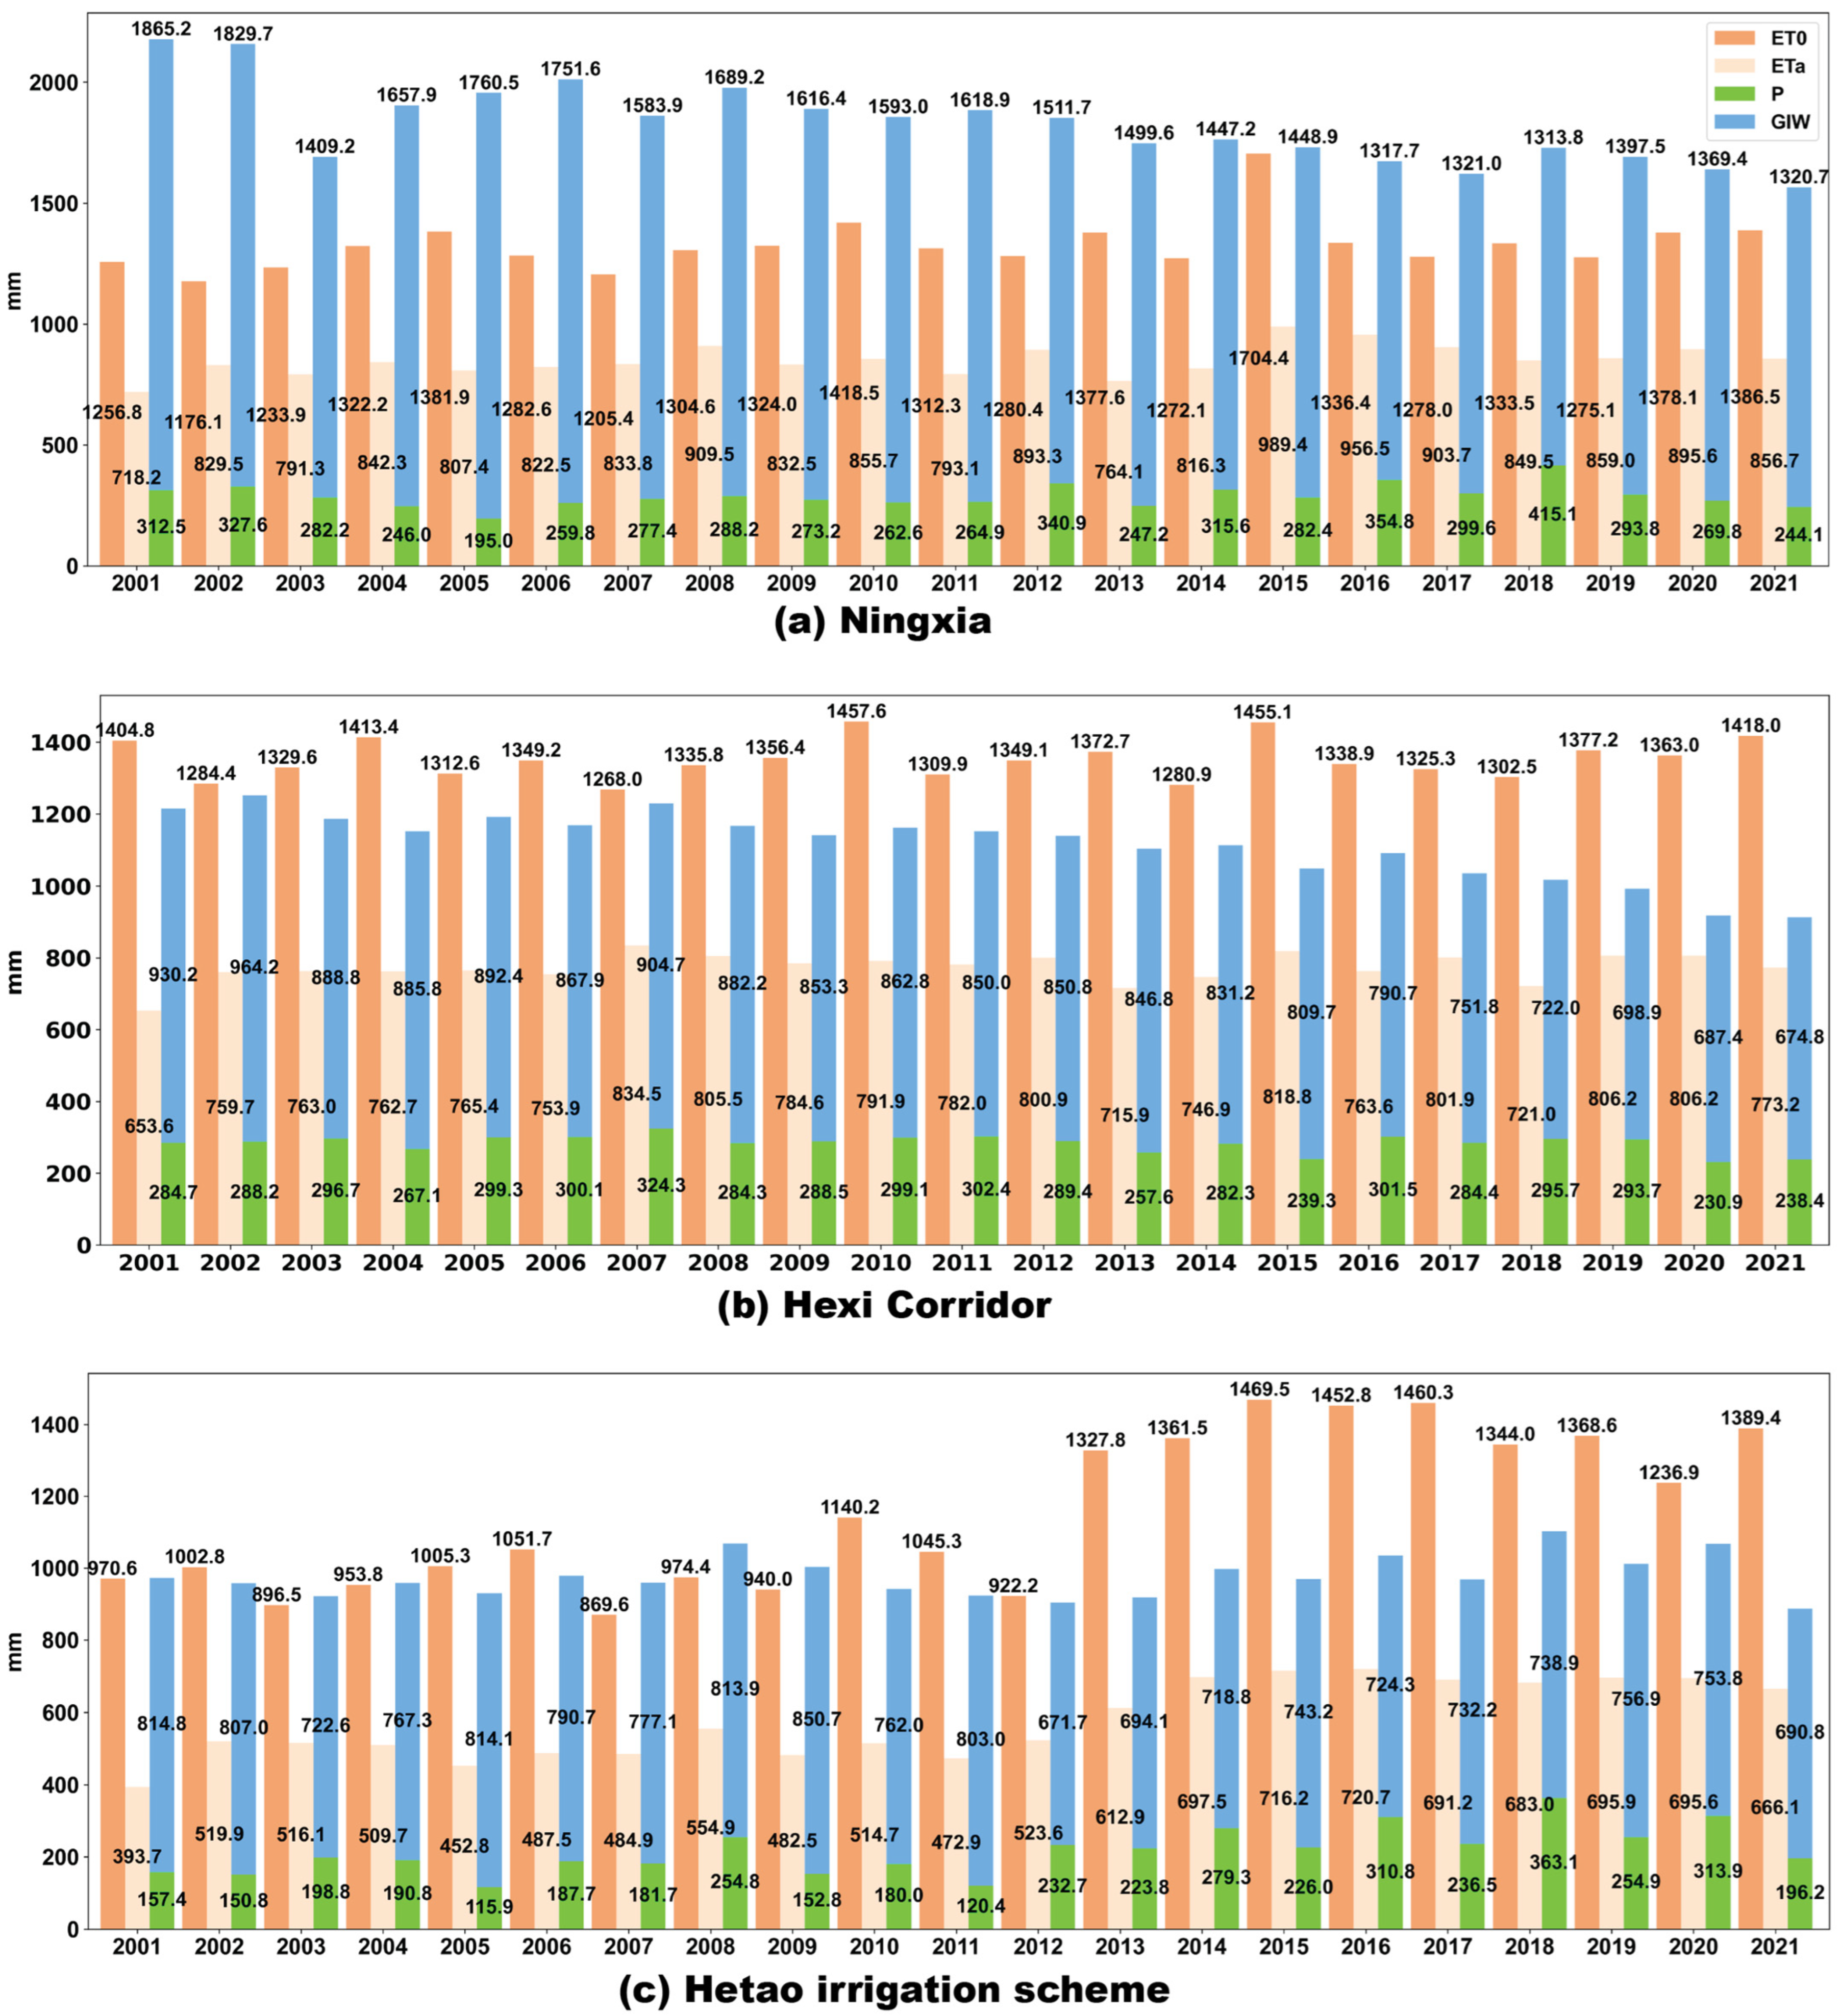
  • In Ningxia, the total available water resources (precipitation + GIW) were sufficient to meet irrigation demand. Conversely, the Hexi Corridor faced increasing risks of unsustainable water use. The Hetao irrigation scheme shifted from a fragile supply–demand balance to a situation where water demand far exceeded availability. In Xinjiang, the balance between water supply and demand was tight, with irrigation water demand and supply in balance most years;
  • The scheme irrigation efficiency, defined as the ratio of the BET to the GIW, was determined to be 0.54. Additionally, the water use efficiency, estimated as the ratio of the BET to the NIW, showed improvements in Ningxia, the Hetao irrigation scheme, and Xinjiang over the last 10 years. However, the Hexi Corridor continued to face severe NIW deficits.
The development of the BET metric represents a critical advancement beyond conventional approaches that merge distinct hydrological components. By innovatively separating consumptive use of precipitation (green water) and irrigation (blue water), the BET provides an accurate and easier-to-understand assessment of water use efficiency. This study highlights the potential of the BET metric to enhance the evaluation of irrigation performance and support sustainable water management practices in water-scarce regions.

Author Contributions

Conceptualization, D.Z., C.Z., L.J. and M.M.; methodology, D.Z., C.Z., L.J. and M.M.; software, D.Z.; validation, D.Z.; formal analysis, D.Z.; investigation, D.Z., C.Z., M.M. and L.J.; resources, L.J., D.Z. and C.Z.; data curation, D.Z.; writing—original draft preparation, D.Z.; writing—review and editing, D.Z., C.Z., L.J., M.M., J.L. and Q.C.; visualization, D.Z., C.Z., L.J. and M.M.; supervision, L.J., C.Z. and M.M.; project administration, L.J. and C.Z.; funding acquisition, L.J., C.Z. and J.L. All authors have read and agreed to the published version of the manuscript.

Funding

This research was funded by the National Natural Science Foundation of China (NSFC) [Grant No. 42171039]; the National Key Research and Development Program of China [Grant No. 2024YFF0808301]; the Open Research Program of the International Research Center of Big Data for Sustainable Development Goals [Grant No. CBAS2023ORP05]; the Chinese Academy of Sciences President’s International Fellowship Initiative [Grant Nos. 2025PVA0200, 2020VTA0001]; and the MOST High Level Foreign Expert program [Grant No. G2022055010L].

Data Availability Statement

The data in this study are available from the corresponding author upon reasonable request.

Conflicts of Interest

The authors declare no conflicts of interest.

References

  1. Chen, Y.; Li, Z.; Xu, J.; Yan, Y.; Xing, X.; Xie, T.; Li, Z.; Yang, L.; Xi, H.; Zhu, C.; et al. Changes and Protection Suggestions in Water Resources and Ecological Environment in Arid Region of Northwest China. Bull. Chin. Acad. Sci. 2023, 38, 385–393. [Google Scholar]
  2. Hoogeveen, J.; Faurès, J.-M.; Peiser, L.; Burke, J.; van de Giesen, N. GlobWat—A Global Water Balance Model to Assess Water Use in Irrigated Agriculture. Hydrol. Earth Syst. Sci. 2015, 19, 3829–3844. [Google Scholar] [CrossRef]
  3. Siebert, S.; Döll, P. Quantifying Blue and Green Virtual Water Contents in Global Crop Production as Well as Potential Production Losses without Irrigation. J. Hydrol. 2010, 384, 198–217. [Google Scholar] [CrossRef]
  4. Velpuri, N.M.; Senay, G.B. Partitioning Evapotranspiration into Green and Blue Water Sources in the Conterminous United States. Sci. Rep. 2017, 7, 6191. [Google Scholar] [CrossRef]
  5. Zaussinger, F.; Dorigo, W.; Gruber, A.; Tarpanelli, A.; Filippucci, P.; Brocca, L. Estimating Irrigation Water Use over the Contiguous United States by Combining Satellite and Reanalysis Soil Moisture Data. Hydrol. Earth Syst. Sci. 2019, 23, 897–923. [Google Scholar] [CrossRef]
  6. Zhang, C.; Long, D. Estimating Spatially Explicit Irrigation Water Use Based on Remotely Sensed Evapotranspiration and Modeled Root Zone Soil Moisture. Water Resour. Res. 2021, 57, e2021WR031382. [Google Scholar] [CrossRef]
  7. Zhang, K.; Li, X.; Zheng, D.; Zhang, L.; Zhu, G. Estimation of Global Irrigation Water Use by the Integration of Multiple Satellite Observations. Water Resour. Res. 2022, 58, e2021WR030031. [Google Scholar] [CrossRef]
  8. Zappa, L.; Schlaffer, S.; Brocca, L.; Vreugdenhil, M.; Nendel, C.; Dorigo, W. How Accurately Can We Retrieve Irrigation Timing and Water Amounts from (Satellite) Soil Moisture? Int. J. Appl. Earth Obs. Geoinf. 2022, 113, 102979. [Google Scholar] [CrossRef]
  9. Kragh, S.J.; Dari, J.; Modanesi, S.; Massari, C.; Brocca, L.; Fensholt, R.; Stisen, S.; Koch, J. An Inter-Comparison of Approaches and Frameworks to Quantify Irrigation from Satellite Data. Hydrol. Earth Syst. Sci. 2024, 28, 441–457. [Google Scholar] [CrossRef]
  10. Zheng, C.; Jia, L.; Menenti, M.; Hu, G.; Lu, J.; Chen, Q.; Jiang, M.; Mancini, M.; Corbari, C. Integrating Hydrologic Modeling and Satellite Remote Sensing to Assess the Performance of Sprinkler Irrigation. Geo-Spat. Inf. Sci. 2024, 27, 934–952. [Google Scholar] [CrossRef]
  11. Lawston, P.M.; Santanello, J.A., Jr.; Kumar, S.V. Irrigation Signals Detected from SMAP Soil Moisture Retrievals. Geophys. Res. Lett. 2017, 44, 11860–11867. [Google Scholar] [CrossRef]
  12. Boser, A.; Caylor, K.; Larsen, A.; Pascolini-Campbell, M.; Reager, J.T.; Carleton, T. Field-Scale Crop Water Consumption Estimates Reveal Potential Water Savings in California Agriculture. Nat. Commun. 2024, 15, 2366. [Google Scholar] [CrossRef] [PubMed]
  13. Jalilvand, E.; Tajrishy, M.; Ghazi Zadeh Hashemi, S.A.; Brocca, L. Quantification of Irrigation Water Using Remote Sensing of Soil Moisture in a Semi-Arid Region. Remote Sens. Environ. 2019, 231, 111226. [Google Scholar] [CrossRef]
  14. Kragh, S.J.; Fensholt, R.; Stisen, S.; Koch, J. The Precision of Satellite-Based Net Irrigation Quantification in the Indus and Ganges Basins. Hydrol. Earth Syst. Sci. 2023, 27, 2463–2478. [Google Scholar] [CrossRef]
  15. Reinders, F.B.; van der Stoep, I.; Backeberg, G.R. Improved Efficiency of Irrigation Water Use: A South African Framework. Irrig. Drain. 2013, 62, 262–272. [Google Scholar] [CrossRef]
  16. Bos, M.G.; Nugteren, J. On Irrigation Efficiencies, 4th ed.; ILRI: Wageningen, The Netherlands, 1990; ISBN 978-90-70260-87-3. [Google Scholar]
  17. Feng, B.; Cui, J.; Wu, Q.; Han, Z. Application of a Monitoring and Evaluation Method in Irrigation Water Efficiency. Irrig. Drain. 2020, 69, 161–170. [Google Scholar] [CrossRef]
  18. Menenti, M.; Visser, T.N.M.; Morabito, J.A.; Drovandi, A. Appraisal of Irrigation Performance with Satellite Data and Georeferenced Information. In Irrigation Theory and Practice; Pentech Press: London, UK, 1989; pp. 785–801. [Google Scholar]
  19. Menenti, M.; Visser, T.; Chambouleyron, J.L. The Role of Remote Sensing in Irrigation Management: A Case Study on Allocation of Irrigation Water; World Bank: Washington, DC, USA, 1990; pp. 67–81. [Google Scholar]
  20. Bastiaanssen, W.G.M.; Van der Wal, T.; Visser, T.N.M. Diagnosis of Regional Evaporation by Remote Sensing to Support Irrigation Performance Assessment. Irrig. Drain. Syst. 1996, 10, 1–23. [Google Scholar] [CrossRef]
  21. Roerink, G.J.; Bastiaanssen, W.G.M.; Chambouleyron, J.; Menenti, M. Relating Crop Water Consumption to Irrigation Water Supply by Remote Sensing. Water Resour. Manag. 1997, 11, 445–465. [Google Scholar] [CrossRef]
  22. Bos, M.G. Performance Indicators for Irrigation and Drainage. Irrig. Drain. Syst. 1997, 11, 119–137. [Google Scholar] [CrossRef]
  23. Bastiaanssen, W.G.M.; Bos, M.G. Irrigation Performance Indicators Based on Remotely Sensed Data: A Review of Literature. Irrig. Drain. Syst. 1999, 13, 291–311. [Google Scholar] [CrossRef]
  24. Akbari, M.; Toomanian, N.; Droogers, P.; Bastiaanssen, W.; Gieske, A. Monitoring Irrigation Performance in Esfahan, Iran, Using NOAA Satellite Imagery. Agric. Water Manag. 2007, 88, 99–109. [Google Scholar] [CrossRef]
  25. Ahmad, M.D.; Turral, H.; Nazeer, A. Diagnosing Irrigation Performance and Water Productivity through Satellite Remote Sensing and Secondary Data in a Large Irrigation System of Pakistan. Agric. Water Manag. 2009, 96, 551–564. [Google Scholar] [CrossRef]
  26. Poudel, U.; Stephen, H.; Ahmad, S. Evaluating Irrigation Performance and Water Productivity Using EEFlux ET and NDVI. Sustainability 2021, 13, 7967. [Google Scholar] [CrossRef]
  27. Rockström, J.; Falkenmark, M.; Karlberg, L.; Hoff, H.; Rost, S.; Gerten, D. Future Water Availability for Global Food Production: The Potential of Green Water for Increasing Resilience to Global Change. Water Resour. Res. 2009, 45, W00A12. [Google Scholar] [CrossRef]
  28. Zhang, L.; Su, F.; Yang, D.; Hao, Z.; Tong, K. Discharge Regime and Simulation for the Upstream of Major Rivers over Tibetan Plateau. J. Geophys. Res. Atmos. 2013, 118, 8500–8518. [Google Scholar] [CrossRef]
  29. Jia, L.; Shang, H.; Hu, G.; Menenti, M. Phenological Response of Vegetation to Upstream River Flow in the Heihe Rive Basin by Time Series Analysis of MODIS Data. Hydrol. Earth Syst. Sci. 2011, 15, 1047–1064. [Google Scholar] [CrossRef]
  30. Zhou, D.; Zheng, C.; Jia, L.; Menenti, M. Partitioning Green and Blue Evapotranspiration by Improving Budyko Equation Using Remote Sensing Observations in an Arid/Semi-Arid Inland River Basin in China. Remote Sens. 2025, 17, 612. [Google Scholar] [CrossRef]
  31. Hu, G.; Jia, L. Monitoring of Evapotranspiration in a Semi-Arid Inland River Basin by Combining Microwave and Optical Remote Sensing Observations. Remote Sens. 2015, 7, 3056–3087. [Google Scholar] [CrossRef]
  32. Zheng, C.; Jia, L.; Hu, G. Global Land Surface Evapotranspiration Monitoring by ETMonitor Model Driven by Multi-Source Satellite Earth Observations. J. Hydrol. 2022, 613, 128444. [Google Scholar] [CrossRef]
  33. Allen, R.G.; Pereira, L.S.; Raes, D.; Smith, M. Crop Evapotranspiration—Guidelines for Computing Crop Water Requirements—FAO Irrigation and Drainage Paper 56; FAO: Rome, Italy, 1998; Volume 300. [Google Scholar]
  34. Funk, C.C.; Peterson, P.J.; Landsfeld, M.F.; Pedreros, D.H.; Verdin, J.P.; Rowland, J.D.; Romero, B.E.; Husak, G.J.; Michaelsen, J.C.; Verdin, A.P. A Quasi-Global Precipitation Time Series for Drought Monitoring; U.S. Geological Survey Data Series 832; U.S. Geological Survey: Reston, VA, USA, 2014; p. 4.
  35. Zhang, C.; Dong, J.; Ge, Q. IrriMap_CN: Annual Irrigation Maps across China in 2000–2019 Based on Satellite Observations, Environmental Variables, and Machine Learning. Remote Sens. Environ. 2022, 280, 113184. [Google Scholar] [CrossRef]
  36. Yang, Y.; Tian, J.; Rong, Y.; Long, A. Monitoring Spatial Patterns of Vegetation Phenology in Heihe River Basin based on Remote Sensing. Remote Sens. Technol. Appl. 2012, 27, 282–288. [Google Scholar]
  37. Han, D.; Yan, D.; Xu, X.; Gao, Y. Effects of Climate Change on Spring Wheat Phenophase and Water Requirement in Heihe River Basin, China. J. Earth Syst. Sci. 2017, 126, 16. [Google Scholar] [CrossRef]
  38. Li, Y.; Fan, J.; Guan, X.; Liu, H.; Yin, F. Status and Countermeasures of Agricultural Water Saving Development in Irrigation Areas of Xinjiang. J. Huazhong Agric. Univ. 2024, 43, 93–98. [Google Scholar] [CrossRef]
  39. Wu, M.; Li, D.; Han, Y.; Qiu, Y.; Qu, Z. Thresholds of Irrigated Farmland Area in the Hexi Corridor Region. Arid. Arid. Arid. Land Geogr. 2024, 47, 1165–1174. [Google Scholar] [CrossRef]
  40. Ningxia Water Conservancy. Ningxia Water Resources Bulletin (2021); Ningxia Hui Autonomous Region Water Conservancy Bureau: Yinchuan, China, 2022. [Google Scholar]
  41. Bayannur Water Conservancy. Bayannur Water Resources Bulletin (2021); Bayannur Water Conservancy Bureau: Bayannur, China, 2022.
  42. Han, S.; Tian, F.; Gao, L. Current Status and Recent Trend of Irrigation Water Use in China. Irrig. Drain. 2020, 69, 25–35. [Google Scholar] [CrossRef]
  43. Calera, A.; Campos, I.; Osann, A.; D’Urso, G.; Menenti, M. Remote Sensing for Crop Water Management: From ET Modelling to Services for the End Users. Sensors 2017, 17, 1104. [Google Scholar] [CrossRef]
  44. D’Urso, G.; Menenti, M.; Santini, A. Regional Application of One-Dimensional Water Flow Models for Irrigation Management. Agric. Water Manag. 1999, 40, 291–302. [Google Scholar] [CrossRef]
  45. French, A.N.; Hunsaker, D.J.; Sanchez, C.A.; Saber, M.; Gonzalez, J.R.; Anderson, R. Satellite-Based NDVI Crop Coefficients and Evapotranspiration with Eddy Covariance Validation for Multiple Durum Wheat Fields in the US Southwest. Agric. Water Manag. 2020, 239, 106266. [Google Scholar] [CrossRef]
  46. Pôças, I.; Calera, A.; Campos, I.; Cunha, M. Remote Sensing for Estimating and Mapping Single and Basal Crop Coefficientes: A Review on Spectral Vegetation Indices Approaches. Agric. Water Manag. 2020, 233, 106081. [Google Scholar] [CrossRef]
  47. Azzali, S.; Menenti, M.; Meuwissen, I.J.M.; Visser, T.N.M. Mapping Crop Coefficients in an Argentinian Irrigation Scheme. In Proceedings of the Remote Sensing in Evaluation and Management of Irrigation, Mendoza, Argentina, 20–25 November 1989; pp. 79–102. [Google Scholar]
  48. Hunsaker, D.J.; Pinter, P.J.; Kimball, B.A. Wheat Basal Crop Coefficients Determined by Normalized Difference Vegetation Index. Irrig. Sci. 2005, 24, 1–14. [Google Scholar] [CrossRef]
  49. Duchemin, B.; Hadria, R.; Erraki, S.; Boulet, G.; Maisongrande, P.; Chehbouni, A.; Escadafal, R.; Ezzahar, J.; Hoedjes, J.C.B.; Kharrou, M.H.; et al. Monitoring Wheat Phenology and Irrigation in Central Morocco: On the Use of Relationships between Evapotranspiration, Crops Coefficients, Leaf Area Index and Remotely-Sensed Vegetation Indices. Agric. Water Manag. 2006, 79, 1–27. [Google Scholar] [CrossRef]
  50. Jayanthi, H.; Neale, C.M.U.; Wright, J.L. Development and Validation of Canopy Reflectance-Based Crop Coefficient for Potato. Agric. Water Manag. 2007, 88, 235–246. [Google Scholar] [CrossRef]
  51. Mateos, L.; González-Dugo, M.P.; Testi, L.; Villalobos, F.J. Monitoring Evapotranspiration of Irrigated Crops Using Crop Coefficients Derived from Time Series of Satellite Images. I. Method Validation. Agric. Water Manag. 2013, 125, 81–91. [Google Scholar] [CrossRef]
  52. Li, X.; Cheng, G.; Ge, Y.; Li, H.; Han, F.; Hu, X.; Tian, W.; Tian, Y.; Pan, X.; Nian, Y.; et al. Hydrological Cycle in the Heihe River Basin and Its Implication for Water Resource Management in Endorheic Basins. J. Geophys. Res. Atmos. 2018, 123, 890–914. [Google Scholar] [CrossRef]
Figure 1. Irrigation lands, precipitation, and ETa in NW China: (a) irrigated cropland in NW China in 2021; (b) average precipitation from 2001 to 2021; (c) average ETa from 2001 to 2021. In panel (a), solid lines delineate the river basins wherein the irrigated lands targeted by the study are located, with labels indicating river basins and these irrigated lands.
Remotesensing 17 01085 g001
Figure 2. Mean annual difference (ET0-ETa) in the irrigated lands of NW China from 2001 to 2021.
Remotesensing 17 01085 g002
Figure 3. Monthly averages (2001–2021) for ET0, ETa, and fractional vegetation cover in the irrigated lands of NW China.
Remotesensing 17 01085 g003
Figure 4. Mean annual difference between FVC ×ET0 and ETa in the irrigated lands of NW China from 2001 to 2021.
Remotesensing 17 01085 g004
Figure 5. Water demand (ET0), consumptive water use (ETa), and available water (GIW + precipitation) in the irrigated lands in NW China (2001–2021).
Remotesensing 17 01085 g005aRemotesensing 17 01085 g005b
Figure 6. BET, ET0-GET, and GIW in the irrigated lands of NW China (2001–2021).
Remotesensing 17 01085 g006
Figure 7. BET vs. GIW from the Water Resources Bulletin for the irrigated lands in NW China (2001–2021).
Remotesensing 17 01085 g007
Figure 8. Comparison of BET with NIW for the irrigated lands in NW China (2001–2021).
Remotesensing 17 01085 g008
Figure 9. Trends in the BET from 2001 to 2021 in the irrigated lands of NW China. Subplots show the frequency distribution of trends of irrigation water (x-axis: trend of irrigation water; y-axis: fractional area age).
Remotesensing 17 01085 g009
Figure 10. Spatial variability and temporal evolution of the BET in the Hetao irrigation scheme every five years from 2001 to 2021.
Remotesensing 17 01085 g010
Figure 11. Average BET from 2001 to 2021 (a) in the irrigated lands of NW China; (b) Manas-Hutubi River Basins in northern Xinjiang; (c) irrigated lands in Shiyanghe and Heihe River Basins in Hexi Corridor; (d) Kashgar-Yarkand River Basins in southern Xinjiang; (e) Hetao irrigation scheme and Ningxia in the Yellow River Basin. Subplots show the frequency distribution of the BET (x-axis: BET; y-axis: frequency percentage).
Remotesensing 17 01085 g011
Table 1. Detailed information on gross and net irrigation water.
RegionsYears of GIW CollectedYears of NIW CollectedSource
Hetao irrigation scheme2001–2007, 2009–20212001–2021Bayannur Water Resources Bulletin
Ningxia2001–20212001–2021Ningxia Water Resources Bulletin
Hexi Corridor2001–20212001–2021Gansu Water Resources Bulletin
Xinjiang2006–2012, 2014–2016, 20192003–2017, 2018–2021Xinjiang Water Resources Bulletin
Disclaimer/Publisher’s Note: The statements, opinions and data contained in all publications are solely those of the individual author(s) and contributor(s) and not of MDPI and/or the editor(s). MDPI and/or the editor(s) disclaim responsibility for any injury to people or property resulting from any ideas, methods, instructions or products referred to in the content.

