Technical Note

Geodetic Observations and Seismogenic Structures of the 2025 Mw 7.0 Dingri Earthquake: The Largest Normal Faulting Event in the Southern Tibet Rift

1
State Key Laboratory of Earthquake Dynamics and Forecasting, Institute of Geology, China Earthquake Administration, Beijing 100029, China
2
Key Laboratory of Intraplate Volcanoes and Earthquakes, China University of Geosciences (Beijing), Ministry of Education, Beijing 100083, China
3
School of Earth and Ocean Sciences, The University of Victoria, Victoria, BC V8W 2Y2, Canada
4
College of Oceanography and Space Informatics, China University of Petroleum (East China), Qingdao 266580, China
5
Institute of Disaster Prevention, Sanhe 065201, China
6
Urumqi Institute of Central Asia Earthquake, China Earthquake Administration, Urumqi 830000, China
*
Author to whom correspondence should be addressed.
Remote Sens. 2025, 17(6), 1096; https://doi.org/10.3390/rs17061096
Submission received: 8 February 2025 / Revised: 13 March 2025 / Accepted: 17 March 2025 / Published: 20 March 2025

Abstract

:
The Mw 7.0 Dingri earthquake, which occurred on 7 January 2025, occurred at the southern end of the Xainza-Dinggyê Fault Zone within the South Tibet Rift (STR) system, in the Dengmecuo graben. It is the largest normal-faulting event in the region recorded by modern instruments. Using Sentinel-1A and Lutan SAR data combined with strong-motion records, we derived the coseismic surface deformation and slip distribution. InSAR interferograms and displacement vectors confirm a typical normal-faulting pattern. The slip model, based on an elastic half-space assumption, identifies the Dengmecuo Fault as the source fault, with an average strike of ~187° and a dip of ~55°. The rupture was concentrated within the upper 10 km, with a maximum slip of 4–5 m at ~5 km depth, extending to the surface with ~3 m vertical displacement. Partial rupture (≤2 m) in the southern segment (5–10 km depth) did not reach the surface, likely due to lacustrine deposits or possible post-seismic stress release. The rupture bottom intersects the fault plane of the South Tibet Detachment System (STDS), suggesting a restraining effect on coseismic rupture propagation. Considering stress transfer along the Main Himalayan Thrust (MHT), we propose that the 2025 Dingri earthquake is closely associated with stress transfer following the 2015 Gorkha earthquake in the lower Himalayas.

1. Introduction

On 7 January 2025, a Mw 7.0 earthquake (epicenter located at 28.5°N, 87.45°E) ruptured the Xainza-Dinggyê Fault (XDF) of the South Tibet Rift (STR) system. The focal mechanism solution indicates that this earthquake is a typical normal-faulting event (Table 1) and is the largest one after the 2008 Mw 7.0 Yutian earthquake in northwest Tibetan Plateau. Therefore, this earthquake will certainly provide much new insight on the tectonics of the STR system and even the evolution of the Tibetan Plateau.
The epicenter aligns with a high dilatation strain rate concentration at the southern end of the XDF [1], directly above the northern extension of the Main Himalayan Thrust (MHT), where the 2015 Mw 7.8 Gorkha earthquake ruptured (Figure 1b). The earthquake frequency in this place has been rapidly increased since the 2015 earthquake, and therefore was suspected to be related to its postseismic relaxation process [2,3]. In the area surrounding the epicenter of the 2025 Tibet Dingri Earthquake, five earthquakes with magnitudes > Mw 5.0 were recorded and all of them were normal-fault earthquakes (Figure 1b). Therefore, studying this earthquake to investigate its connections with previous seismic events and its role in the XDF is of critical significance for understanding the internal stress development, tectonic fault activity, and seismogenic environment within the southern Tibet region.
To the south of the epicenter, another important active fault system is the South Tibet Detachment System (STDS), where the peak of the Himalayas is located [6,7]. With the limited modern observations, the interaction between the STDS and the STR system is still puzzling. The 2025 Dingri Earthquake is located right at the junction between the STDS and the STR system. The most ever-abundant modern observations will undoubtedly provide many clues on the relations and interactions between those activate faults, for example, the STR system, STDS, and MHT.
In this study, we obtained the InSAR coseismic deformation of the 2025 Dingri earthquake by integrating the Sentinel-1A SAR images from both ascending and descending tracks and ascending Lutan-1 SAR data. In addition, we also mapped the horizontal displacement vectors by processing strong local motion records. Furthermore, we figured out the coseismic slip details by inverting these deformation data under the half-space elastic dislocation model. At last, we tried to discuss the seismogenic structures of the 2025 Dingri earthquake, and the suggestions on the fault system interactions between the STR system, STDS, and MHT.

2. Materials and Methods

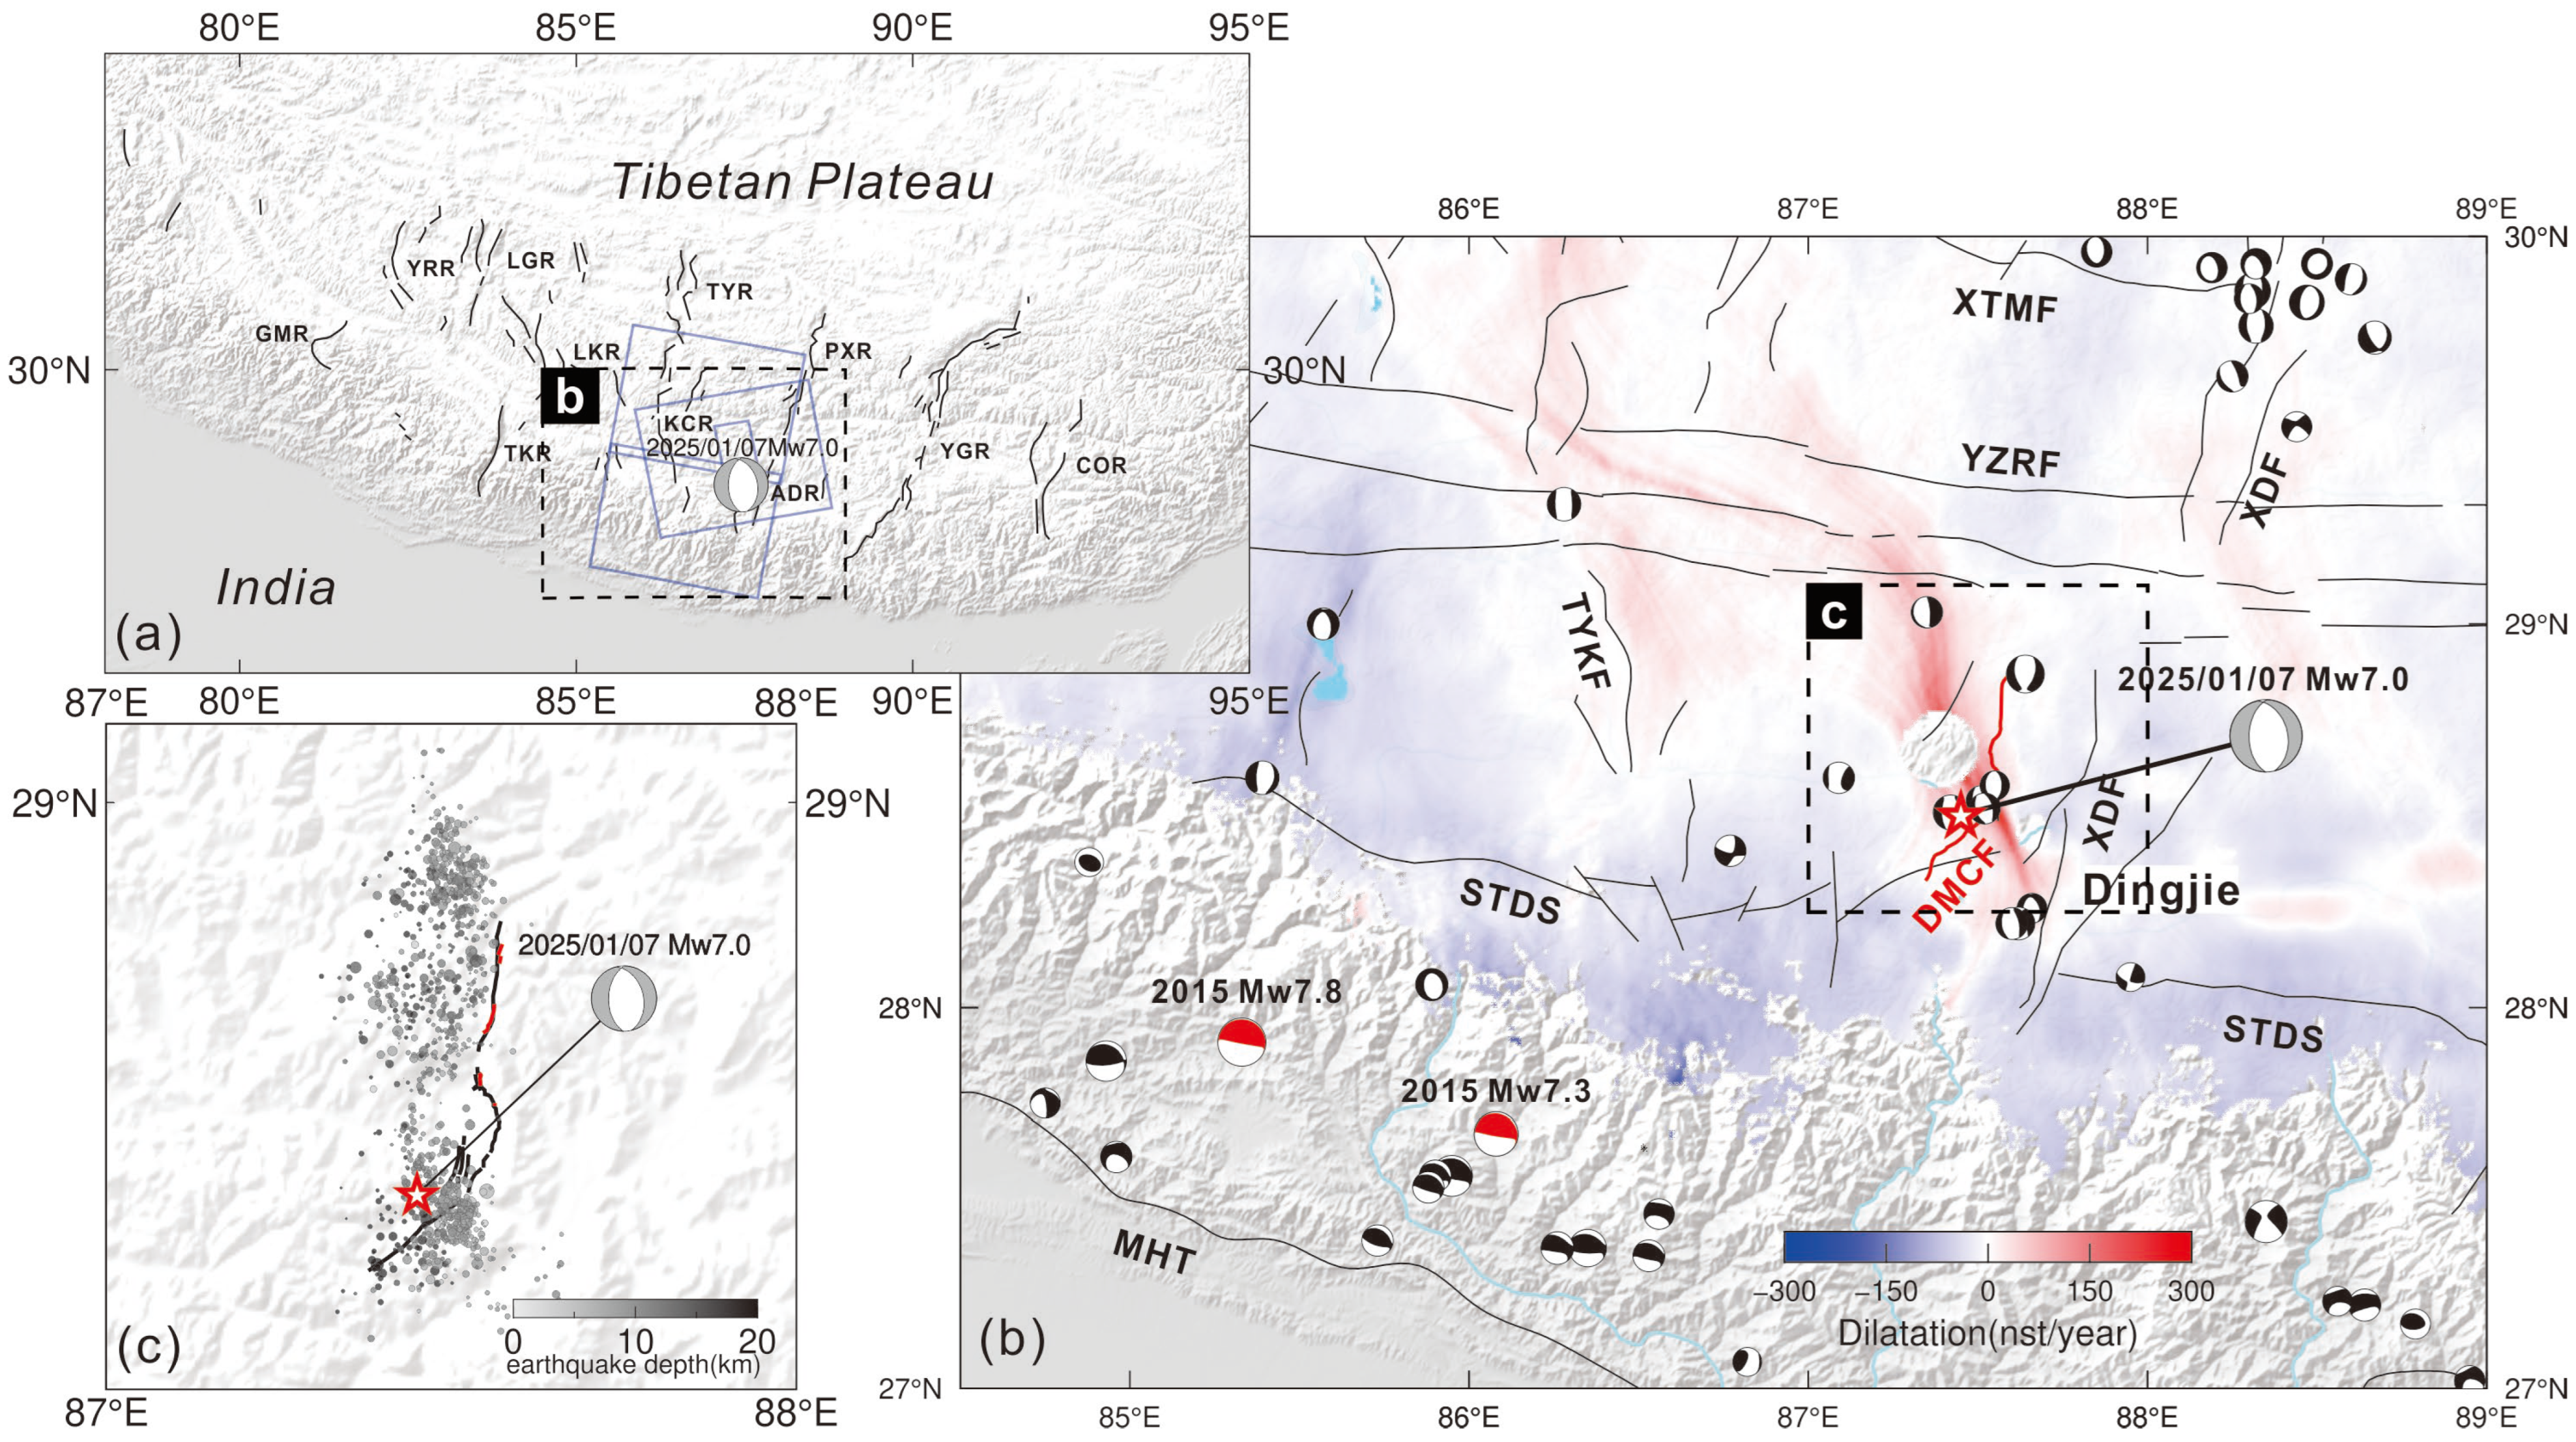
2.1. Tectonic Setting

The southern Tibet region to the Himalayan mountain belt exhibits prominent east–west extension characteristics due to its normal faulting seismicity [8,9,10,11,12] and active north–south trending graben systems [13,14,15]. Larson et al. [16] observed ~11 ± 3 mm/yr east–west extension across southern Tibet between northwestern Nepal and Lhasa, based on six years of GPS data from Nepal and southern Tibet. Meanwhile, the presence of normal faults and east–west extension in Tibet has long been associated with the high elevation of the plateau [17,18,19]. Southern Tibet is characterized by several long, ~NS-trending active rifts that are approximately equidistant [11,17], spaced ~200 km apart in the east and narrowing to ~150 km spacing in the west [13]. These rifts primarily occur along seven nearly N-S trending fault zones: Yari Rift (YRR), Lunggar Rift (LGR), Lopu Kangri Rift (LKR), Tangra Yum Co Rift (TYR), Pumqu-Xainza Rift (PXR), Yadong-Gulu Rift (YGR), and Cona-Oiga Rift (COR) (Figure 1a). The total extension rate of these rifts is 18.4 ± 1.7 mm/yr, with the extension rate of the PXR being 2.2 ± 0.6 mm/yr [1]. In the central to eastern parts of the southern plateau (located between longitudes 86°E to 92°E), significant transverse extension is observed, with typical strain rates reaching approximately 15–25 nstrain/yr [20]. Seismic activity occurs at the intersection of the southern part of the PXR with the XDF and the South Tibet Detachment System.
The XDF is a typical N-S trending extensional normal fault, extending from the eastern part of the XTMF in the north to the vicinity of Dingjie County in the south, cutting through the South Tibet Detachment System and extending into the High Himalayas, forming a complex active tectonic belt more than 350 km long [4,21,22]. Its expansion rate is 3.3 ± 0.8 mm/yr [20]. This fault is a fault system composed of multiple segments with different characteristics, and it is divided into the Xainza–Xietongmen segment and the Xietongmen–Dingjie segment by the YZRF [23]. The Xietongmen–Dingjie section exhibits a smooth, linear distribution along the fault strike [24]. This section from the YZRF to the South Tibet Detachment System consists of a northwest-dipping normal fault with a moderate dip angle, with fault planes striking approximately 30–45° and dipping at 40–50° [25].
The South Tibet Detachment System is generally parallel to the orogenic belt, and has a northward-dipping low-angle thrust, extending over 2000 km in the east–west direction, making it the largest detachment fault system in the world [26,27].
The 2025 Dingri earthquake ruptured the Dengmecuo Graben, and the main boundary fault on the eastern side of the Dengmecuo Graben is inferred to be the source fault of this event. Spatially, Dengmecuo Graben is only tens of kilometers to the north of the junction of the XDF and the South Tibet Detachment System [28].

2.2. D-InSAR Data Processing and Coseismic Deformation Field

Table 2 contains information regarding three sets of mainshock pairs. As these pairs complement each other, a more comprehensive understanding of the Dingri earthquake sequence can be attained.
All three interferometric pairs were processed under a standard differential InSAR working flow [29]. We utilized the 90 m Shuttle Radar Topographic Mission (SRTM) Digital Elevation Model (DEM) [30] to remove the topographic phase from the ascending and descending Sentinel-1 pairs, and the ascending Lutan pair. The Sentinel and Lutan pairs were multi-looked by a factor of 20 × 4, 10 × 10 (range × azimuth), respectively. The pixels with a coherence value under 0.6 were masked before phase unwrapping. The Minimum Cost Flow algorithm [31] was used to obtain a reliable unwrapped phase. Additionally, a second-order polynomial was then applied to the unwrapped interferograms to model and mitigate the large spatial-scale artifacts.
The near-field deformation of the C-band (with a wavelength of ~5.6 cm) Sentinel-1 pairs is seriously contaminated by unwrapping errors due to the large deformation gradient in the graben. In contrast, the Lutan InSAR shows fewer unwrapping errors thanks to its longer wavelength of L-band radar (~24 cm). To help mitigate the unwrapping errors, we used prior deformation gradient information to assist with the unwrapping process. In detail, we first modeled the coseismic displacements in LOS under the geometry of the ascending and descending Sentinel-1 pairs based on the Lutan-InSAR-based slip models (see Section 3 for the details of the slip model inversion). Then, we removed the modeled displacements from the Sentinel-1 coseismic-wrapped phase. Next, we re-unwrapped the available wrapped phase by applying the Minimum Cost Flow algorithm. Finally, we added a simulated unwrapped phase from Lutan data to the re-unwrapped phase. This process can provide better near-filed unwrapping interferograms (Figure 2).

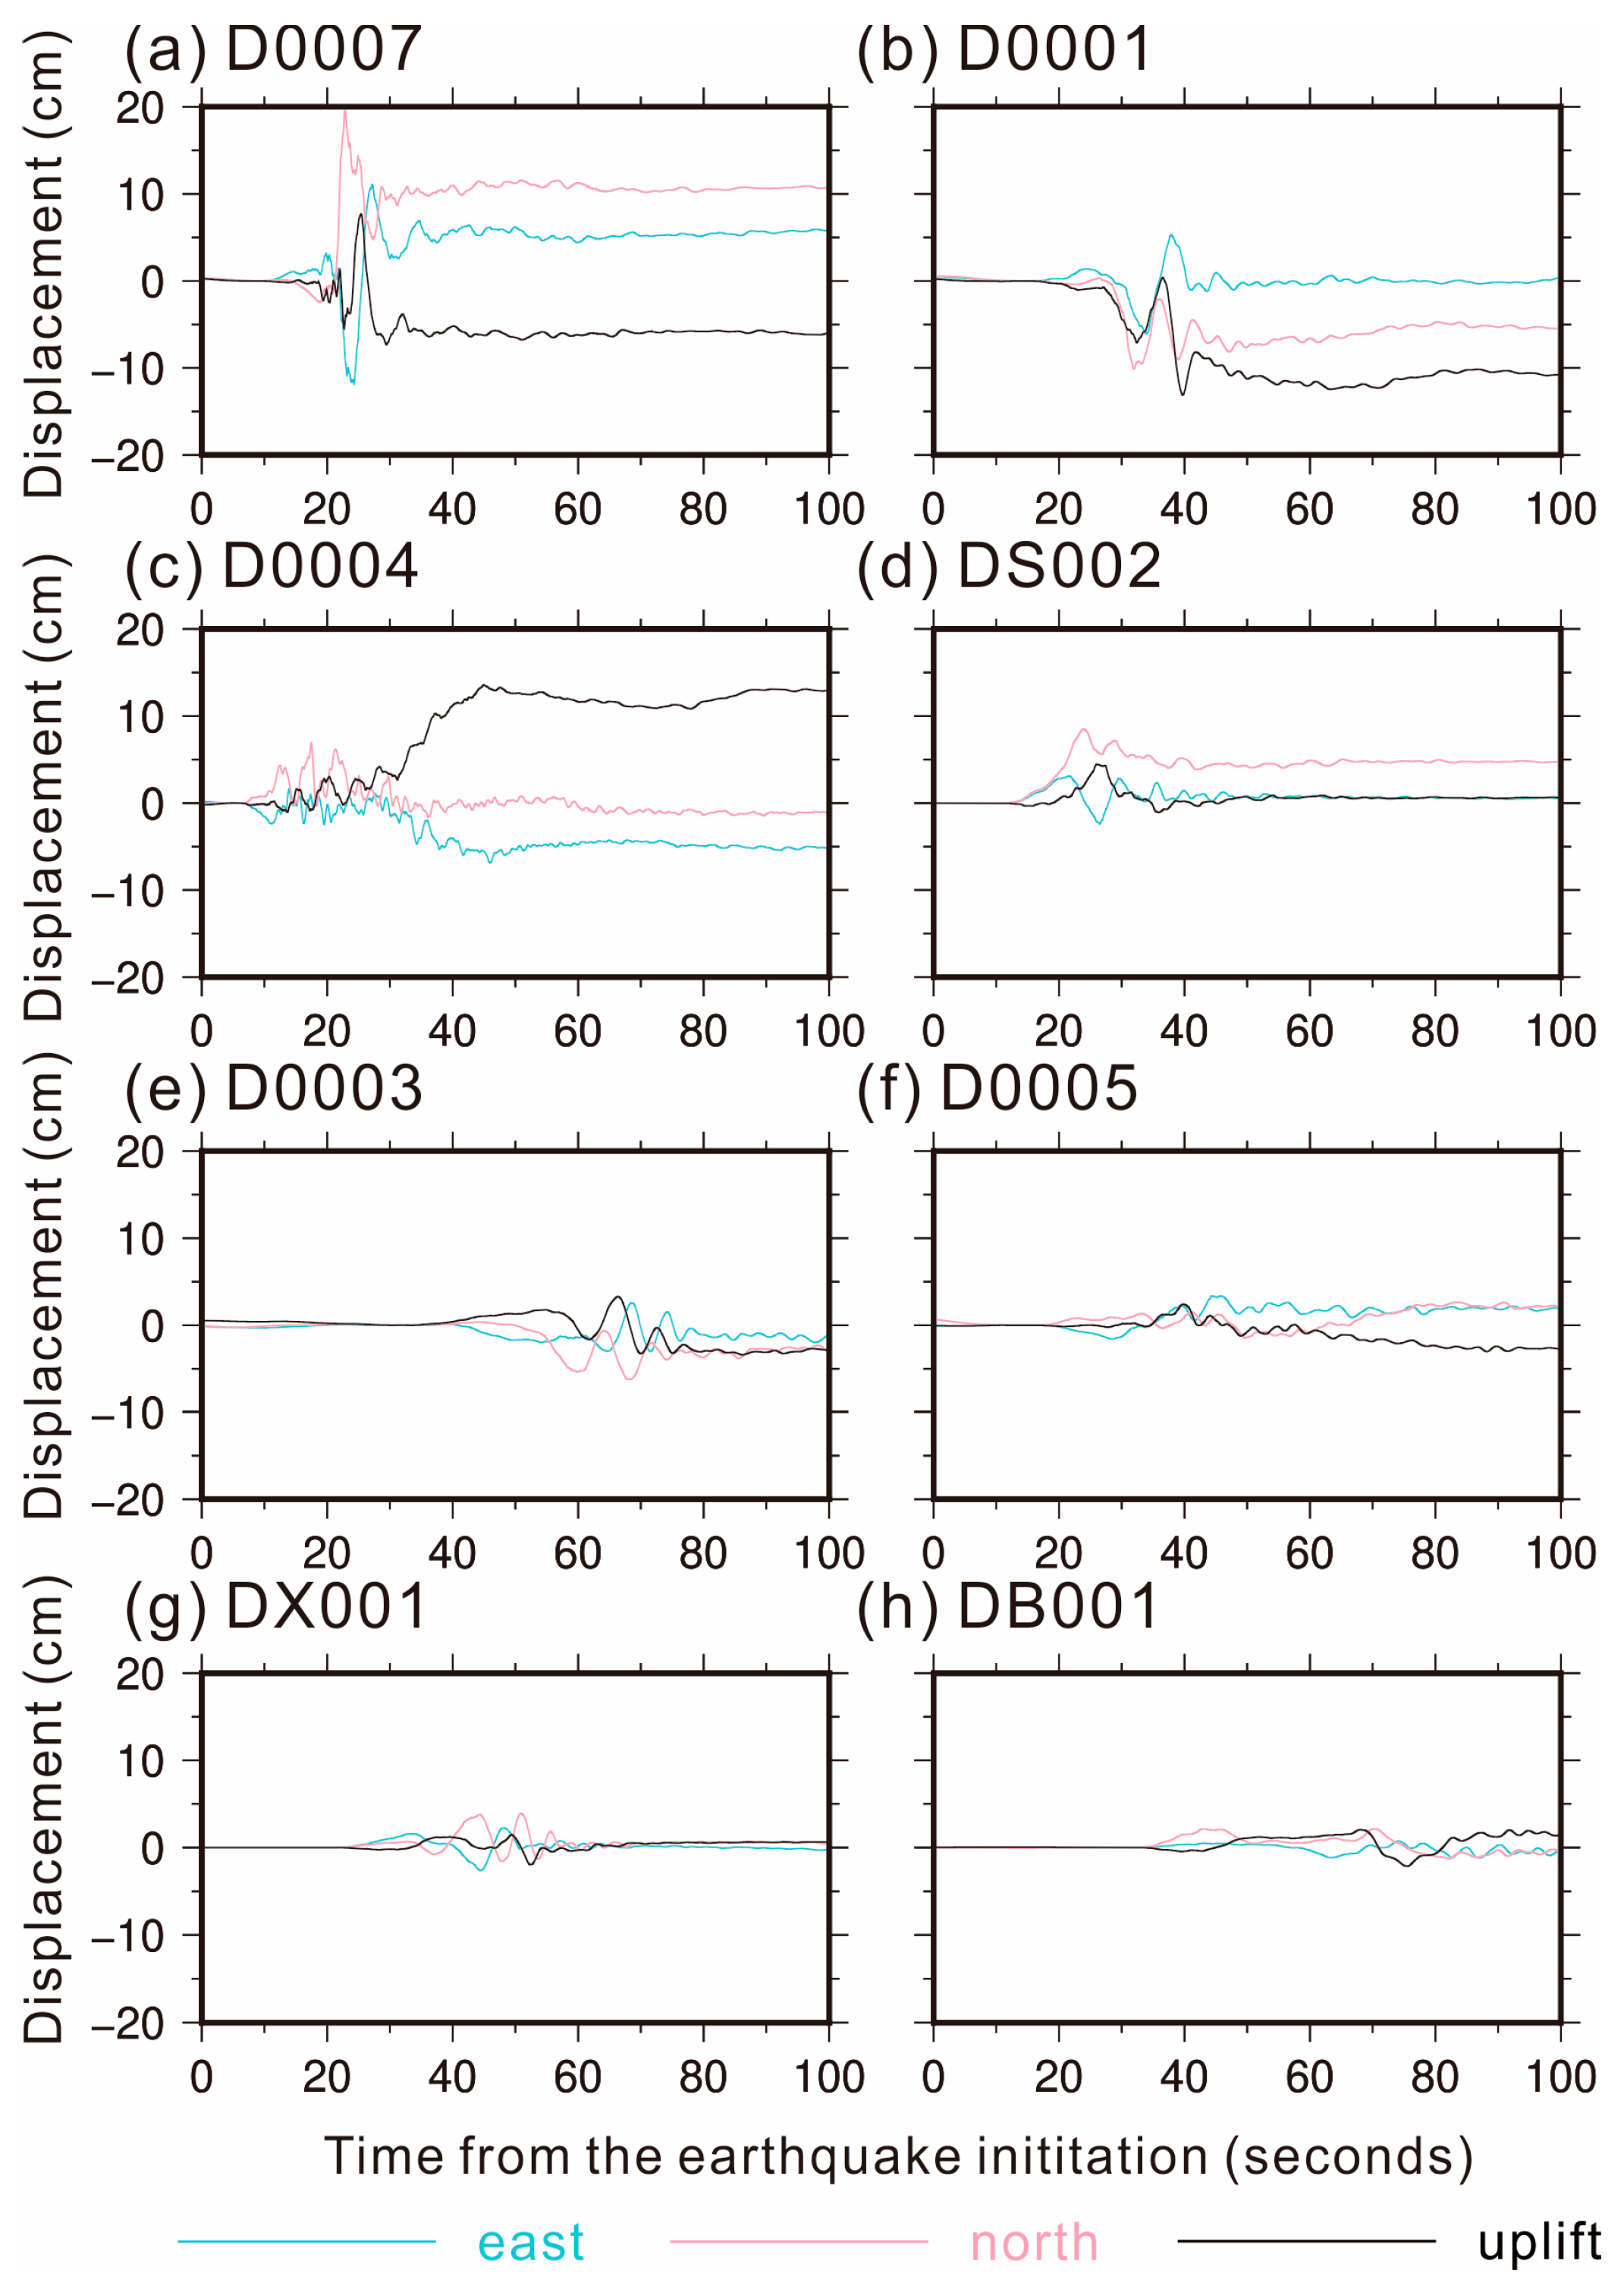
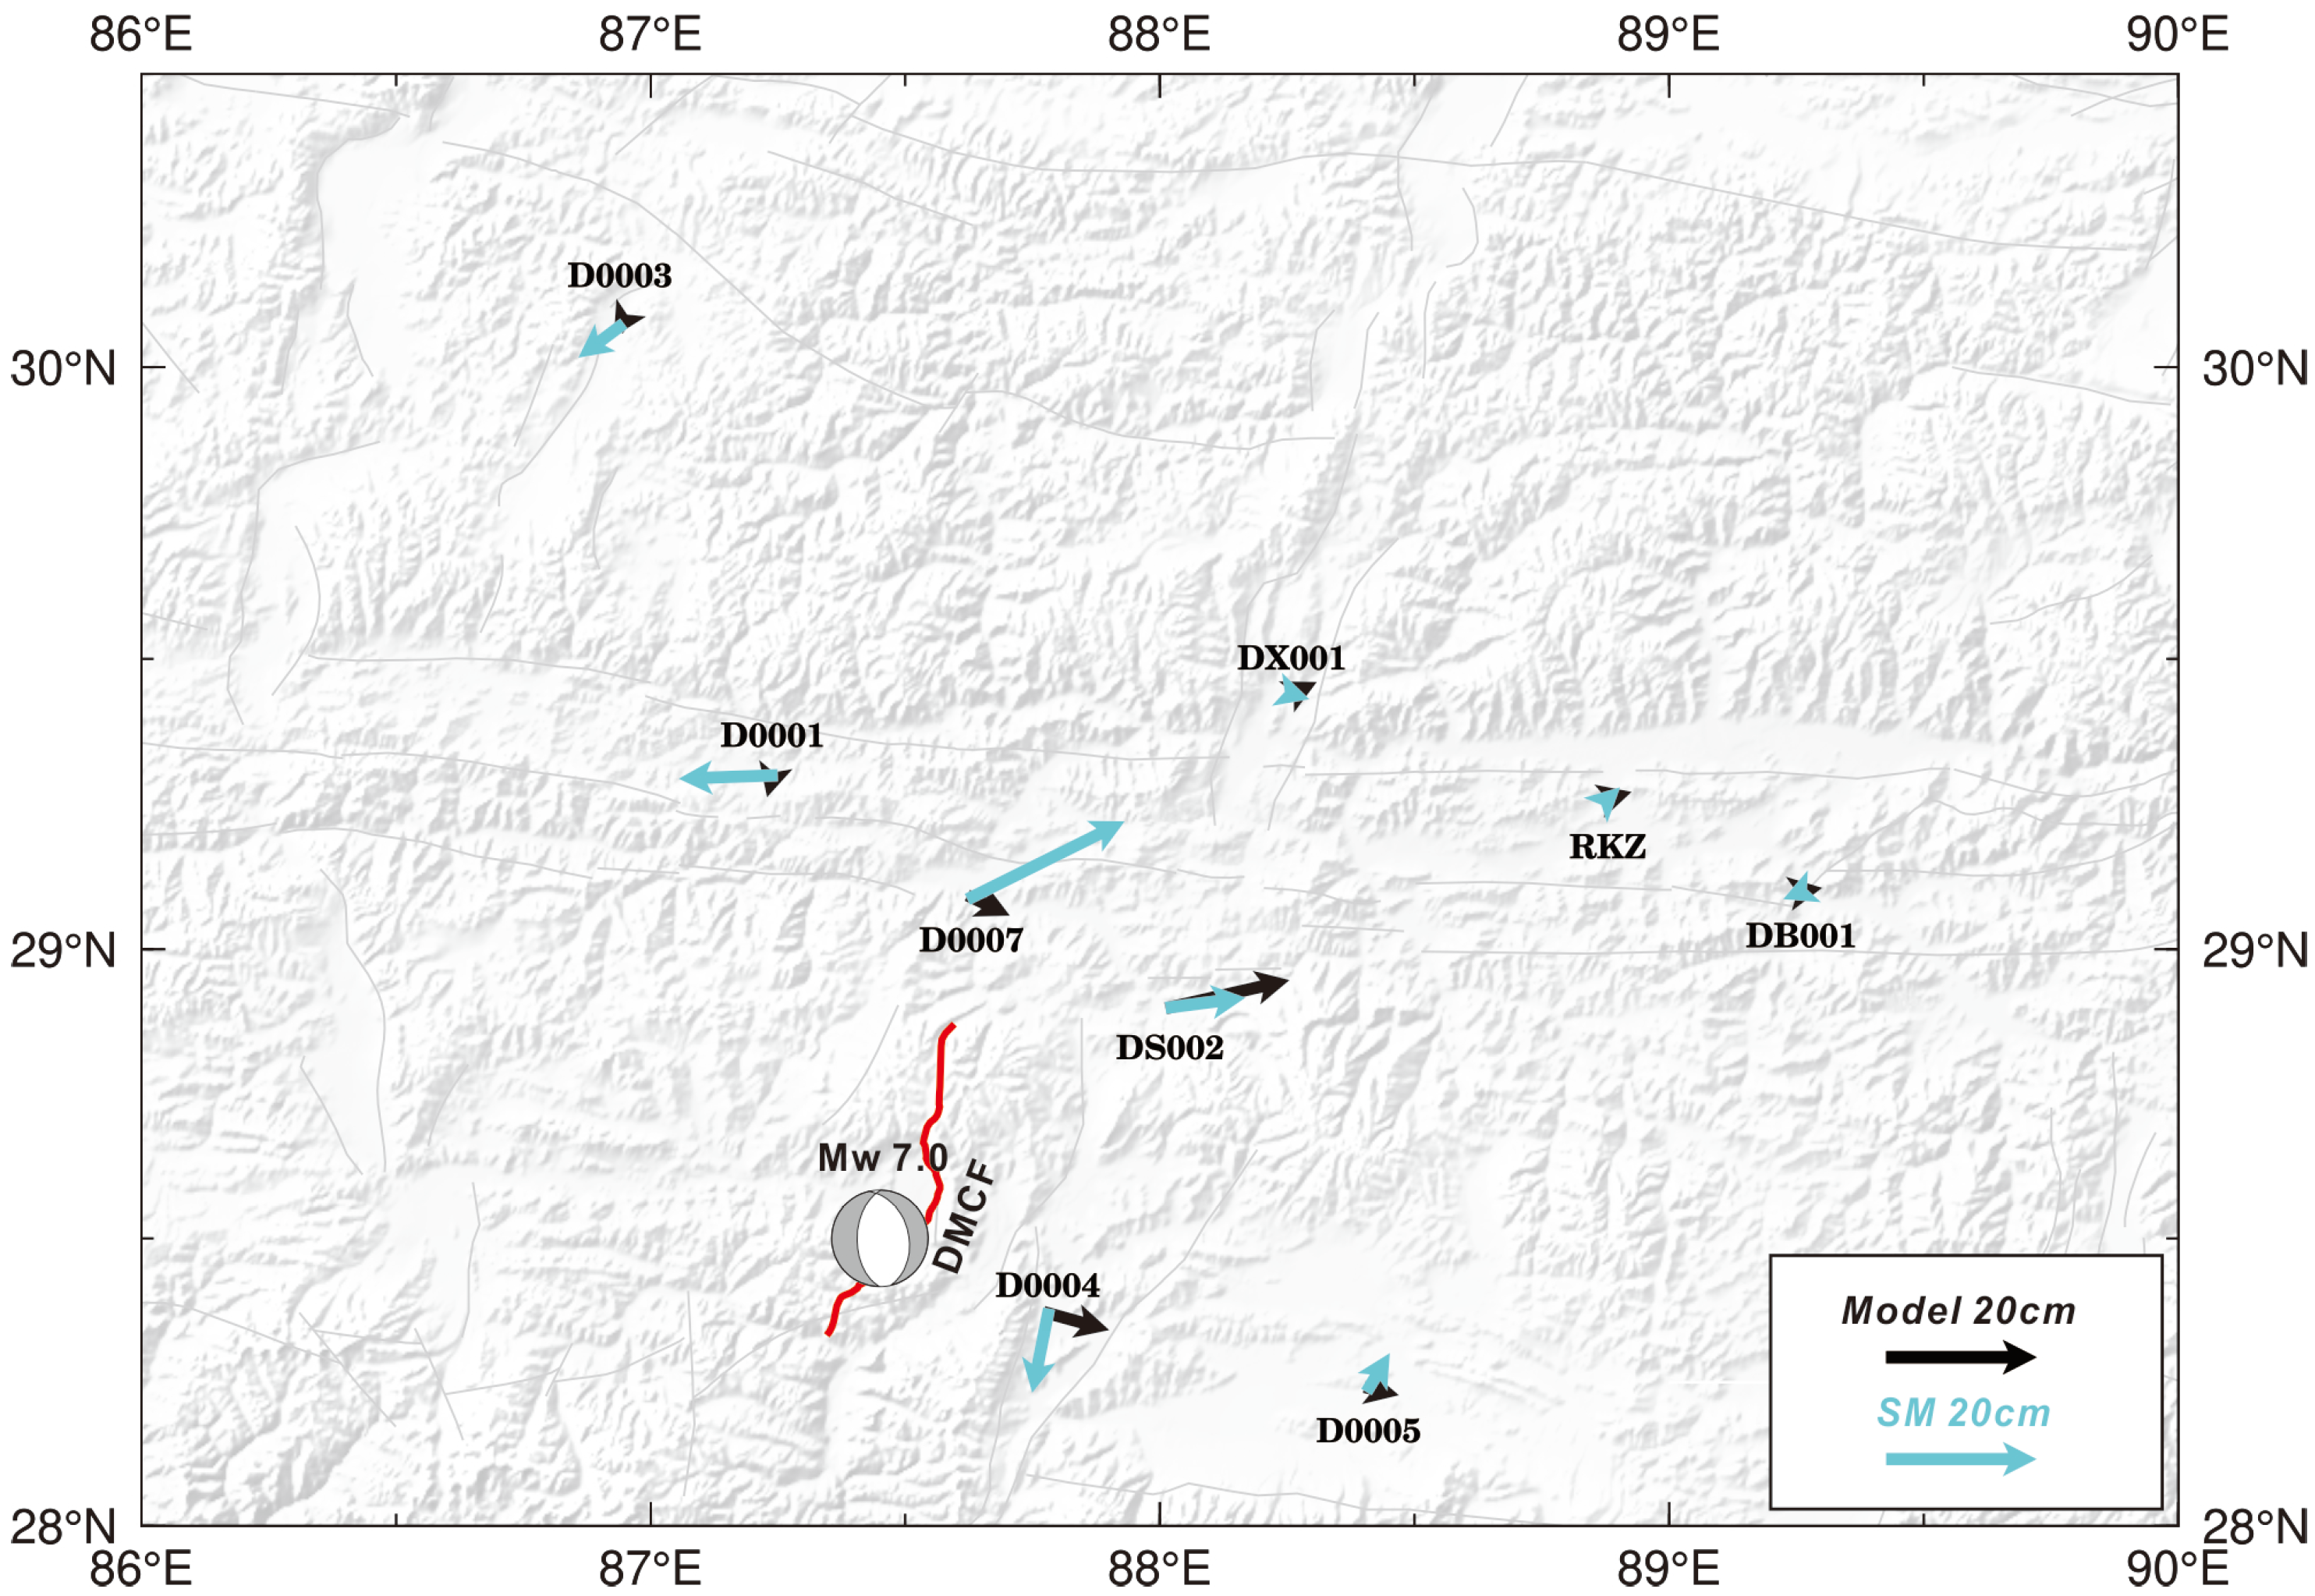
2.3. Horizontal Deformation Field

We accessed strong motion (SM) records from the Strong Motion Observation Center, Institute of Engineering Mechanics, China Earthquake Administration. The SM records in the near field were carefully reviewed, retaining only those stations with clearly identifiable P-wave arrival times. For each station, the P-wave was initially identified using an artificial method, and the trends of the raw SM records for each component were determined by applying linear fitting to the records preceding the P-wave arrival (Figure 3). After removing these trends from all raw SM records, displacements can be retrieved by integrating the corrected SM records twice. However, due to the tilting or rotation of the instruments during the earthquake, the directly integrated displacements exhibited significant baseline errors, which could be accurately estimated if co-located GNSS observations were available [32]. In this study, we employed the method proposed by Wang et al. [33] to retrieve displacements, where the baseline error was identified and corrected automatically using only the corrected SM records. After the baseline error correction, we collected data from nine stations that exhibited clear static displacements in the horizontal component, with epicenter distances less than 200 km (Figure 4). For the vertical component, the baseline error was not adequately corrected, and the retrieved displacements were not adopted in the fault modeling.

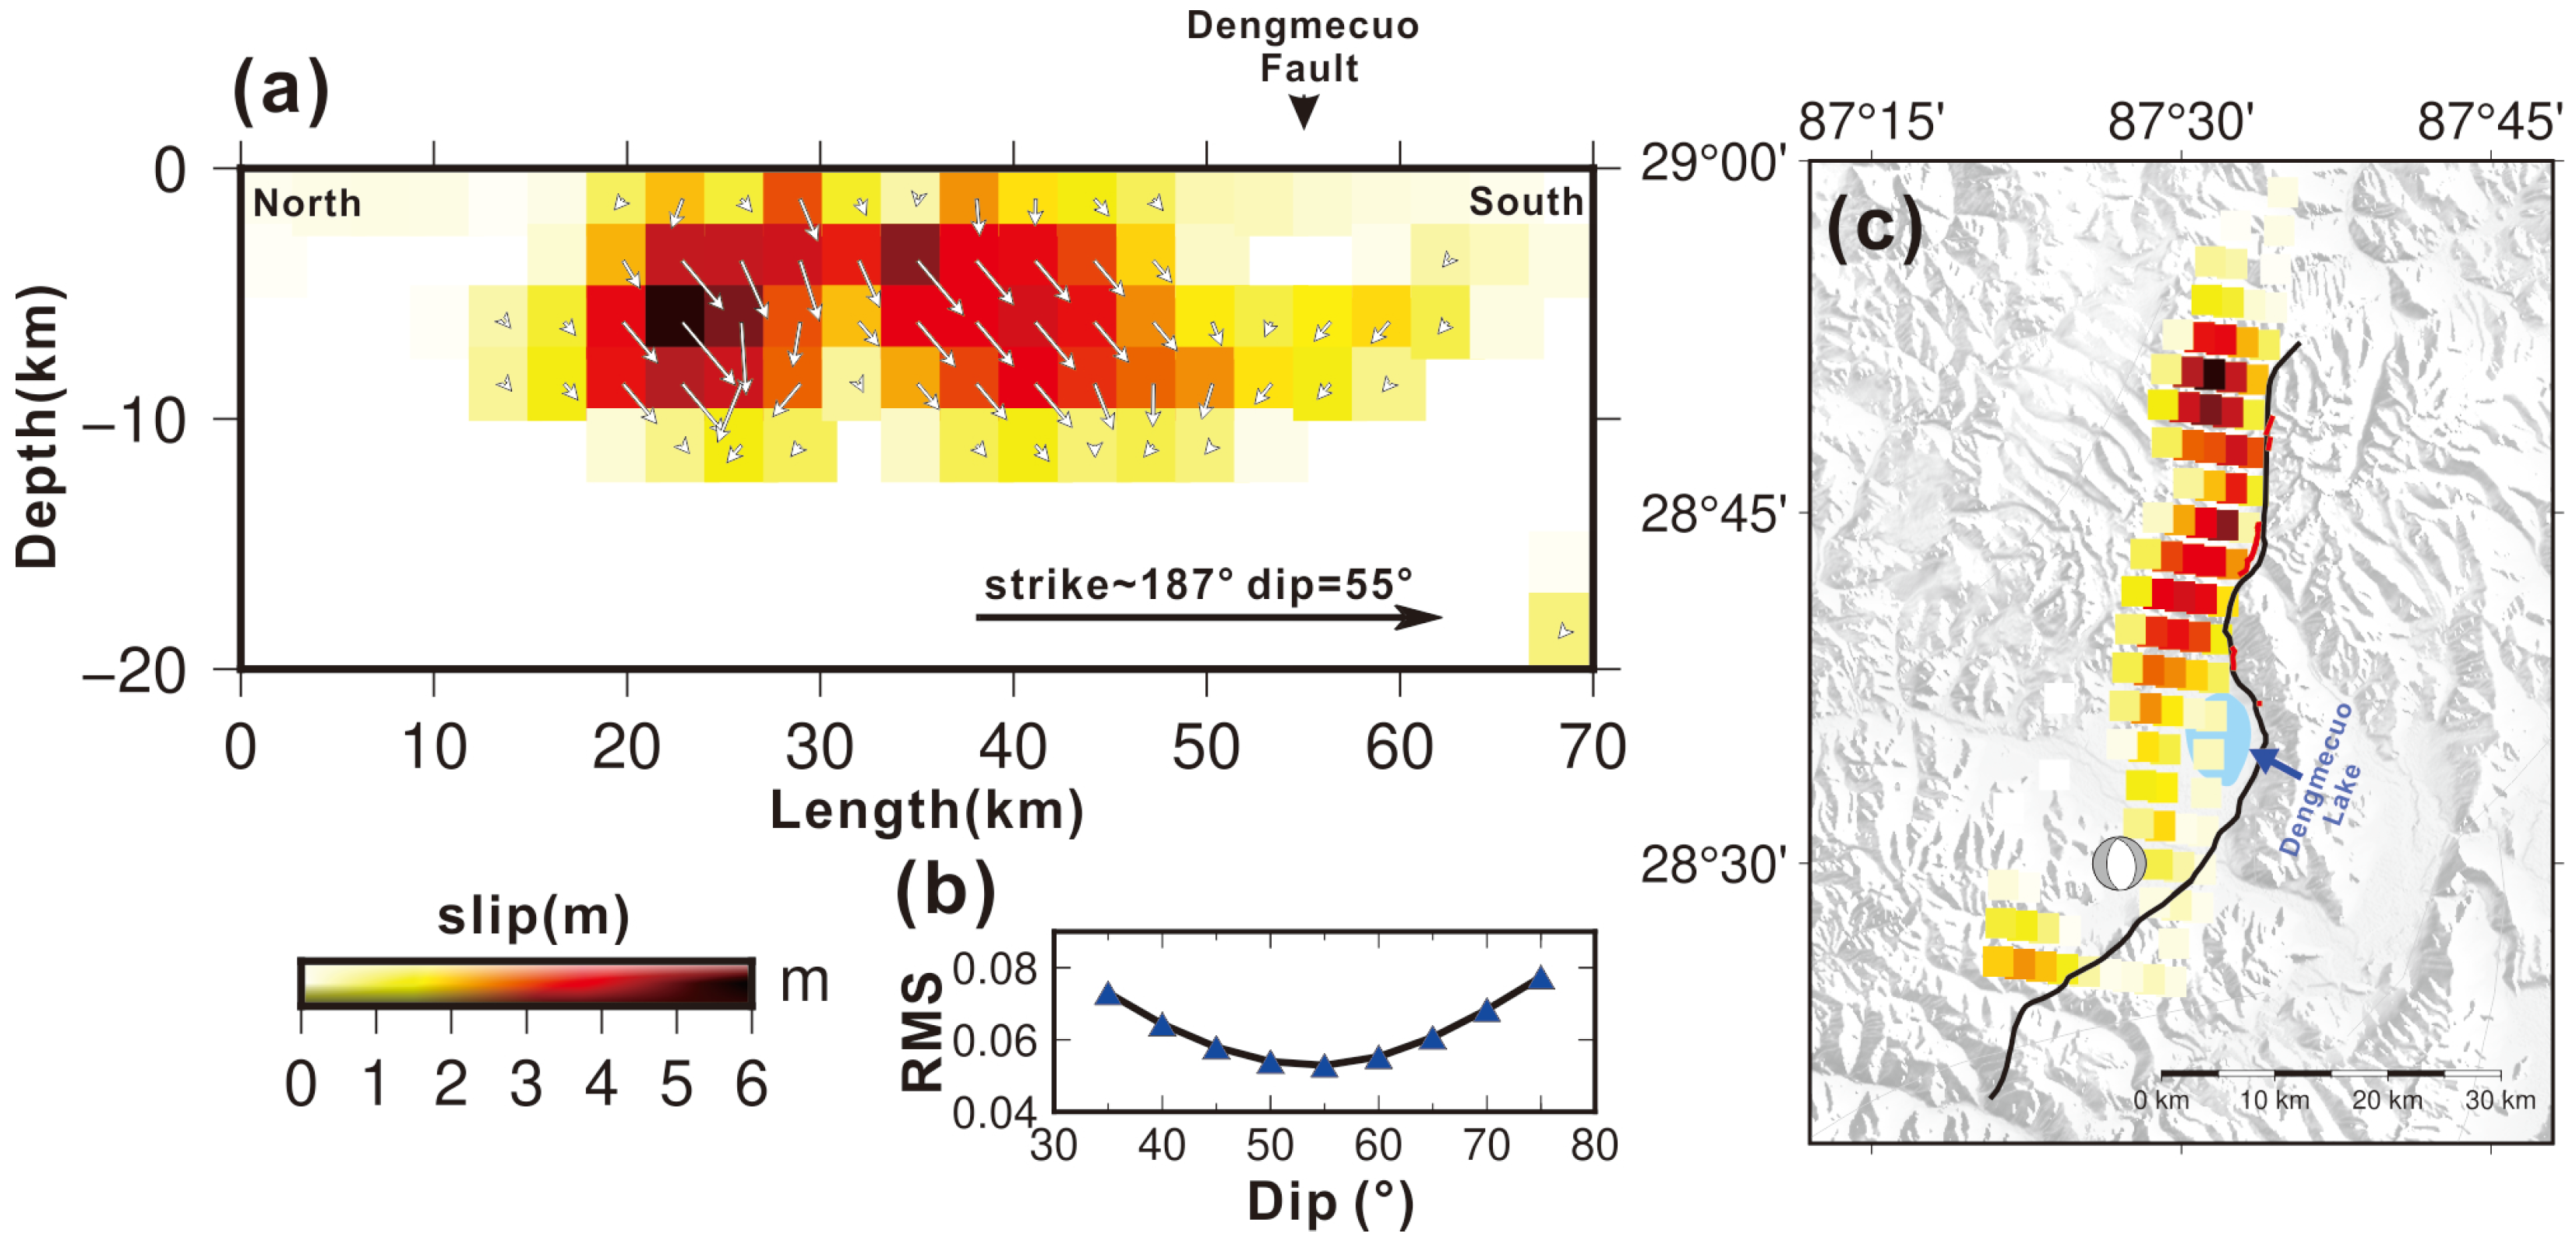
3. Finite-Fault Slip Modeling

We assumed that all coseismic deformation can be explained by brittle slip ruptures on a fault planer under the half-space elastic dislocation model. We constrained the coseismic slip model by using the Sentinel-1A/Lutan InSAR coseismic deformation field and the SM displacement vectors. To balance the calculation efficiency and coseismic information intensity, a uniform sampling method was applied to resample the InSAR deformation data, resulting in 9504 data points for the ascending Sentinel-1A, 9567 data points for the descending Sentinel-1A, and 5196 data points for the ascending Lutan, respectively.
We utilized the SDM inversion program [34], which is built upon the assumption of the homogeneous elastic half-space model [35], to retrieve the slip distribution under the constraints of the coseismic deformation. The incoherent pixels of the Lutan InSAR delineated the traces of the source fault well, which is consistent with the field-investigated surface ruptures. The source fault is dipping to the west, as evidenced by the surface rupture investigation and the regional topography (Figure 1c; [5]). We determined the best-fitting dip angles by testing different ones from 35°to 75°. We measured the root mean-square (RMS) between InSAR observations and model calculations; the RMS equation is shown below:
R M S = i = 1 n D o b s i D m o d e l i 2 n
where D o b s represents the observed values, D m o d e l represents the model calculations, and n represents the number of data points. The final fault model was determined (Figure 5).
The results indicate that the fault plane associated with this earthquake has a strike of approximately 187°, with a westward dip and a relatively steep dip angle of about 55°. From the fault strike and characteristics, the source fault is identified as a normal fault. The slip distribution of the source fault is concentrated within a depth of 10 km, with the maximum rupture occurring around 5 km depth, approximately 4–5 m. The rupture reaches the surface, with a maximum surface displacement of around 3 m. To validate the fault model, we simulated the deformation field (Figure 6) using the derived fault model and calculated the residuals between the observed and simulated results. The residuals on the west side might be the influence of possible branch ruptures. Due to their small scale and unknown fault geometry, they were not taken into account in the inversion. However, this does not affect our study of the main fault, nor does it influence the conclusion. As for the residuals in the near field, they are all caused by the unwrapping error resulting from the large displacement gradient. Although we have made efforts with corresponding technical methods and largely restored the near-field data, which is better than complete decorrelation, there are still some errors that cannot be eliminated and remain in the residuals. Additionally, the simulated deformation field was compared with the horizontal displacement field derived from strong motion data. The results show that the fault model can effectively explain the observed results.

4. Discussion

4.1. Causes of Near-Field Decorrelation and Unwrapping Issues

When processing the coseismic deformation field of Sentinel-1A data, large areas of decorrelation were observed in the near-field region for both ascending and descending tracks [36]. Furthermore, field investigation found significant surface ruptures as high as 3 m, suggesting large-scale subsidence in this area. Therefore, we inferred the large deformation gradient in the near-field region is the primary cause of the near-field decorrelation in Sentinel-1 data. Typically, large surface displacements resulting in excessive deformation can lead to phase unwrapping failure, causing the phase difference between two observations to exceed half the radar wavelength. It makes it impossible to obtain stable interferometric relationships from being established between images acquired at different times, which in turn causes InSAR to fail in correctly performing phase unwrapping, resulting in near-field decorrelation. In contrast, the Lutan data exhibits clear and continuous differential interference fringes due to its use of L-band SAR, which has a much longer wavelength (~24.0 cm) than the C-band (~5.6 cm) Sentinel-1A. As a result, Lutan data are capable of measuring regions with significant deformation. For the near-field deformation data from Sentinel-1A, directly performing phase unwrapping could lead to erroneous unwrapping results [37]. Moreover, near-field deformation could be the result of deep-slip motion. To address this, we need to process the Sentinel-1 data to accurately recover the near-field deformation. Since Lutan data provides clear interferometric phase data in the near-field, it can be used to simulate the missing phase data in the Sentinel-1A near-field (see Section 2.1 for details)

4.2. Reconciling the Slip Distribution, Aftershocks, and the Field Surface Ruptures

The slip distribution results indicate that the slip is primarily concentrated in the middle and northern sections of the DMCF. Although some deep rupture exists in the southern section, the rupture did not reach the surface (Figure 5c). This may be due to the presence of Dengmecuo Lake at the southern end of the fault, which could suggest that the tectonic regime in this area is characterized by lacustrine sedimentary structures. A large number of aftershocks are distributed to the south of the lake, surrounding the main slip asperity. This aftershock distribution pattern suggested that the aftershocks are driven by the coseismic stress, as seen in other earthquake cases [38,39,40,41]. Yu et al. [36] calculated the Coulomb failure stress change (ΔCFS) [42] at a depth of 10 km in this region and found positive ΔCFS values at both the northern and southern ends along the fault strike, indicating that the mainshock altered the surrounding stress state and subsequently triggered these aftershocks.
The InSAR interferograms show dense interference fringes in the northern section of the DMCF, indicating significant deformation in this area. In contrast, the field investigations found no significant surface rupture along the northern section. We explained that this contrasts with either distributed deformations on the ground surface or slip partitioning between fault branches shallower than 3 km (the fault patch size of the slip model), or both. The distributed deformation indicates that the slip is still dominated by the main fault plane, but that the related surface deformation is diffused in a wide zone, which strongly depends on the shallow material properties, fault plane rupture speed, and fault maturity [43,44,45]. The slip partitioning is not related to the deformation diffusion, but refers to the shallow strain release via rupturing multiple fault branches, which means that the total slip of the multiple branches could be as large as that of the middle segment, but each of them is small. We actually cannot recognize the real mechanism by only using InSAR data, as the larger the spatial resolution (90 m for one pixel in this study), the less information there is on the local rock property and sub-surface structures.

4.3. Seismogenic Structure of the Mw 7.0 Dingri Earthquake

The surface deformation observed in different satellite datasets shows strong consistency along the cross-fault profile (Figure 7a). The InSAR-inferred fault location closely aligns with the active fault identified by fault scarps (Figure 7b) [29], further confirming the high reliability of the InSAR results. In addition to the significant subsidence caused by the rupture of the DMCF, we identify another localized subsidence approximately 20 km to the west, which appears to be associated with branch ruptures on the opposite side of the Dengmecuo graben. This branch rupture extends close to the surface, as evidenced by the interruption of interferograms in Sentinel-1A InSAR data. However, its length is limited to less than 5 km and outside of the Dengmecuo graben. Despite this branch rupture, we propose that the Dengmecuo graben is a half-graben, given its relatively narrow width of only 10 km. Consequently, the bottom rupture of the 2025 Dingri earthquake is located directly beneath the western boundary of the Dengmecuo graben.
The bottom of the main coseismic slip asperity intersects with the fault plane of the STDS, suggesting that deep fault interaction plays a critical role in coseismic rupture propagation and may have constrained the rupture during the 2025 Dingri earthquake (Figure 7b). This raises the question of whether the DMCF is terminated by the STDS or instead cuts through it, extending into the middle or even lower crust. If the latter is true, it is crucial to monitor strain accumulation in its lower segment—whether it undergoes ductile creep or leads to brittle failure in future seismic events. We infer that the likelihood of a destructive earthquake occurring on the lower segment is low, as the seismogenic thickness in the high Tibetan Plateau is generally less than 15 km.
The northern extension of the MHT fault plane lies at a greater depth beneath the STDS and exhibits characteristics of ductile creeping or a ductile shear zone. At this depth in the southern Tibetan Plateau, seismic activity is unlikely to occur. This segment of the MHT, located below the STDS, primarily undergoes stress relaxation following the 2015 Gorkha earthquake and plays a crucial role in adjusting coseismic stress disturbances induced by destructive earthquakes—whether on the shallower MHT, the STDS, or the STR system (e.g., the DMCF). Therefore, the deep MHT shear zone significantly contributes to stress transfer between the Himalayas and the high Tibetan Plateau. Consistent with previous findings [3], we propose that the 2025 event is strongly linked to stress transition following the 2015 Gorkha earthquake in the lower Himalayas.

5. Conclusions

We obtained the coseismic deformation of the 2025 Mw 7.0 Dingri earthquake by using Sentinel-1A and Lutan-1 SAR data as well as strong motion records. Constrained by the coseismic deformation, we inverted a fault model based on a homogeneous elastic half-space assumption. The results indicate that the earthquake was a normal faulting event with an average strike of ~187° and a dip of 55°. The slip was primarily concentrated within the upper 10 km, with a maximum rupture of 4–5 m occurring at ~5 km depth and extending to the surface. The causative fault is identified as the DMCF, with coseismic deformation mainly concentrated in its northern and middle segments. In contrast, the southern segment experienced less slip, potentially due to the presence of lacustrine sediments that inhibited strain accumulation during the interseismic period or due to possible following post-seismic stress release through afterslip or aftershocks. Our findings suggest that the 2025 Dingri earthquake is strongly associated with the coseismic and post-seismic stress transfer from the 2015 Gorkha earthquake. Additionally, the interaction between the source fault and the STDS plays a crucial role in coseismic rupture propagation.

Author Contributions

Conceptualization, Q.L., J.H. and Y.Z.; methodology, Q.L., Y.Z. and J.H.; validation, G.Z., H.L. and Y.Z.; formal analysis, Q.L., W.G. and J.H.; investigation, Q.L and Y.Z.; data curation, Q.L., J.Z., J.H. and Y.Z.; writing—original draft preparation, Q.L.; writing—review and editing, Q.L., Y.Z. and J.H.; visualization, Q.L; supervision, G.Z.; project administration, G.Z.; funding acquisition, G.Z. All authors have read and agreed to the published version of the manuscript.

Funding

This research was co-funded by the Basic Scientific Funding of Institute of Geology, China Earthquake Administration (Grant No. IGCEA2005) and the National Natural Science Foundation of China (Grant No. 42274046).

Data Availability Statement

The Sentinel-1 images were freely available through the Alaska Satellite Facility (https://www.asf.alaska.edu/#/; accessed on 1 February 2025). The data used in this study are available on Zenodo (https://zenodo.org/records/14836721, accessed on 1 February 2025).

Acknowledgments

The authors thank Fang Lihua for providing precise relocation of aftershock sequences of the Dingri earthquake, thank Li Yongsheng of the National Institute of Natural Hazards for providing the original Lutan SAR data. Maps were generated using Generic Mapping Tools (GMT) version 6 [46].

Conflicts of Interest

The authors declare no conflicts of interest.

References

  1. Chen, H.; Qu, C.; Zhao, D.; Shan, X.; Li, C.; Dal Zilio, L. Large-Scale Extensional Strain in Southern Tibet From Sentinel-1 InSAR and GNSS Data. Geophys. Res. Lett. 2024, 51, e2024GL110512. [Google Scholar] [CrossRef]
  2. Elliott, J.R.; Jolivet, R.; González, P.J.; Avouac, J.-P.; Hollingsworth, J.; Searle, M.P.; Stevens, V.L. Himalayan Megathrust Geometry and Relation to Topography Revealed by the Gorkha Earthquake. Nat. Geosci. 2016, 9, 174–180. [Google Scholar] [CrossRef]
  3. Yue, C.; Qu, C.Y.; Li, X.F.; Meng, L.Y.; Jiang, X.H.; Wu, D.L. Co- and Postseismic Stress Transfer on Different Types of Faults in Southern Tibet by the 2015 Mw7.8 Gorkha Earthquake. J. Struct. Geol. 2025, 191, 105336. [Google Scholar] [CrossRef]
  4. Li, Q.; Li, C.T.; Zhao, B.; Huang, Y.; Wan, Y.G.; Tan, K.; Dong, Q. Estimated Seismic Source Parameters for 2020 Dingri Mw5.6 Earthquake in Xizang and Study on the Stress Triggering. Chin. J. Geophys. 2024, 67, 172–188. [Google Scholar] [CrossRef]
  5. Shi, F.; Liang, M.-J.; Luo, Q.-X.; Qiao, J.-X.; Zhang, D.; Wang, X.; Yi, W.-X.; Zhang, J.-W.; Zhang, Y.-F.; Zhang, H.-P.; et al. Seismogenic Fault and Coseismic Surface Deformation of the Dingri Ms 6.8 Earthquake in Tibet, China. Seismol. Geol. 2025, 47, 1–15. [Google Scholar] [CrossRef]
  6. Burchfiel, B.C.; Zhiliang, C.; Hodges, K.V.; Yuping, L.; Royden, L.H.; Changrong, D.; Jiene, X. The South Tibetan Detachment System, Himalayan Orogen: Extension Contemporaneous with and Parallel to Shortening in a Collisional Mountain Belt; Burchfiel, B.C., Chen, Z., Hodges, K.V., Liu, Y., Royden, L.H., Deng, C., Xu, J., Eds.; Geological Society of America: Boulder, CO, USA, 1992; Volume 269, ISBN 978-0-8137-2269-6. [Google Scholar]
  7. Kellett Dawn, A.; Cottle John, M.; Larson Kyle, P. The South Tibetan Detachment System: History, Advances, Definition and Future Directions. Geol. Soc. Lond. Spec. Publ. 2019, 483, 377–400. [Google Scholar] [CrossRef]
  8. Chen, W.-P.; Yang, Z. Earthquakes Beneath the Himalayas and Tibet: Evidence for Strong Lithospheric Mantle. Science 2004, 304, 1949–1952. [Google Scholar] [CrossRef]
  9. Molnar, P.; Chen, W.-P. Focal Depths and Fault Plane Solutions of Earthquakes under the Tibetan Plateau. J. Geophys. Res. Solid Earth 1983, 88, 1180–1196. [Google Scholar] [CrossRef]
  10. Liang, X.; Zhou, S.; Chen, Y.J.; Jin, G.; Xiao, L.; Liu, P.; Fu, Y.; Tang, Y.; Lou, X.; Ning, J. Earthquake Distribution in Southern Tibet and Its Tectonic Implications. J. Geophys. Res. Solid Earth 2008, 113, B12409. [Google Scholar] [CrossRef]
  11. Molnar, P.; Lyon-Caent, H. Fault Plane Solutions of Earthquakes and Active Tectonics of the Tibetan Plateau and Its Margins. Geophys. J. Int. 1989, 99, 123–153. [Google Scholar] [CrossRef]
  12. Ni, J.; Barazangi, M. Seismotectonics of the Himalayan Collision Zone: Geometry of the Underthrusting Indian Plate beneath the Himalaya. J. Geophys. Res. Solid Earth 1984, 89, 1147–1163. [Google Scholar] [CrossRef]
  13. Armijo, R.; Tapponnier, P.; Mercier, J.L.; Han, T.-L. Quaternary Extension in Southern Tibet: Field Observations and Tectonic Implications. J. Geophys. Res. Solid Earth 1986, 91, 13803–13872. [Google Scholar] [CrossRef]
  14. Sundell, K.E.; Taylor, M.H.; Styron, R.H.; Stockli, D.F.; Kapp, P.; Hager, C.; Liu, D.; Ding, L. Evidence for Constriction and Pliocene Acceleration of East-West Extension in the North Lunggar Rift Region of West Central Tibet. Tectonics 2013, 32, 1454–1479. [Google Scholar] [CrossRef]
  15. Chen, Q.; Freymueller, J.T.; Yang, Z.; Xu, C.; Jiang, W.; Wang, Q.; Liu, J. Spatially Variable Extension in Southern Tibet Based on GPS Measurements. J. Geophys. Res. Solid Earth 2004, 109, B09401. [Google Scholar] [CrossRef]
  16. Larson, K.M.; Bürgmann, R.; Bilham, R.; Freymueller, J.T. Kinematics of the India-Eurasia Collision Zone from GPS Measurements. J. Geophys. Res. Solid Earth 1999, 104, 1077–1093. [Google Scholar] [CrossRef]
  17. Molnar, P.; Tapponnier, P. Active Tectonics of Tibet. J. Geophys. Res. Solid Earth 1978, 83, 5361–5375. [Google Scholar] [CrossRef]
  18. Chevalier, M.-L.; Tapponnier, P.; van der Woerd, J.; Leloup, P.H.; Wang, S.; Pan, J.; Bai, M.; Kali, E.; Liu, X.; Li, H. Late Quaternary Extension Rates Across the Northern Half of the Yadong-Gulu Rift: Implication for East-West Extension in Southern Tibet. J. Geophys. Res. Solid Earth 2020, 125, e2019JB019106. [Google Scholar] [CrossRef]
  19. Chen, Q.; Freymueller, J.T.; Wang, Q.; Yang, Z.; Xu, C.; Liu, J. A Deforming Block Model for the Present-Day Tectonics of Tibet. J. Geophys. Res. Solid Earth 2004, 109, B01403. [Google Scholar] [CrossRef]
  20. Gan, W.; Zhang, P.; Shen, Z.-K.; Niu, Z.; Wang, M.; Wan, Y.; Zhou, D.; Cheng, J. Present-Day Crustal Motion within the Tibetan Plateau Inferred from GPS Measurements. J. Geophys. Res. Solid Earth 2007, 112, B08416. [Google Scholar] [CrossRef]
  21. Zhang, X.; Li, Z.; Peng, C.; He, S.; Zhang, Y. A Research Framework for Seismic Slip Distribution Inversion Considering Atmospheric Effects and Deformation Field Downsampling. Int. J. Digit. Earth 2024, 17, 2434654. [Google Scholar] [CrossRef]
  22. Hager, C.; Stockli, D.F.; Dewane, T.J.; Gehrels, G.; Ding, L. Anatomy and crustal evolution of the central Lhasa terrane (S-Tibet) revealed by investigations in the Xainza rift. In Proceedings of the EGU General Assembly 2009, Vienna, Austria, 19–24 April 2009; p. 11346. [Google Scholar]
  23. Olen, S.M.; Bookhagen, B.; Hoffmann, B.; Sachse, D.; Adhikari, D.P.; Strecker, M.R. Understanding Erosion Rates in the Himalayan Orogen: A Case Study from the Arun Valley. J. Geophys. Res. Earth Surf. 2015, 120, 2080–2102. [Google Scholar] [CrossRef]
  24. Kali, E.; Leloup, P.H.; Arnaud, N.; Mahéo, G.; Liu, D.; Boutonnet, E.; Van der Woerd, J.; Liu, X.; Liu-Zeng, J.; Li, H. Exhumation History of the Deepest Central Himalayan Rocks, Ama Drime Range: Key Pressure-Temperature-Deformation-Time Constraints on Orogenic Models. Tectonics 2010, 29, TC2014. [Google Scholar] [CrossRef]
  25. Hou, L.; Shan, X.; Gong, W.; Zhang, Y.; Luo, H.; Zhao, D. Characterizing Seismogenic Fault of 2016 Dingjie Earthquake Based on Multitemporal DInSAR. Chin. J. Geophysics 2020, 63, 1357–1369. [Google Scholar] [CrossRef]
  26. Kellett, D.A.; Grujic, D. New Insight into the South Tibetan Detachment System: Not a Single Progressive Deformation. Tectonics 2012, 31, TC2007. [Google Scholar] [CrossRef]
  27. Carosi, R.; Lombardo, B.; Molli, G.; Musumeci, G.; Pertusati, P.C. The South Tibetan Detachment System in the Rongbuk Valley, Everest Region. Deformation Features and Geological Implications. J. Asian Earth Sci. 1998, 16, 299–311. [Google Scholar] [CrossRef]
  28. Tingting, T.; Zhonghai, W. Recent Prehistoric Major Earthquake Event of Dingmucuo Normal Fault in the Southern Segment of Shenzha-Dingjie Rift and Its Seismic Geological Significance. Geol. Rev. 2023, 69, 53–55. [Google Scholar] [CrossRef]
  29. Rosen, P.A.; Hensley, S.; Joughin, I.R.; Li, F.K.; Madsen, S.N.; Rodriguez, E.; Goldstein, R.M. Synthetic Aperture Radar Interferometry. Proc. IEEE 2000, 88, 333–382. [Google Scholar] [CrossRef]
  30. Rodriguez, E.; Morris, C.S.; Belz, J.E.; Chapin, E.; Martin, J.; Daffer, W.; Hensley, S. An Assessment of the SRTM Topographic Products; Technical Report JPL D-31639; Jet Propulsion Laboratory: Pasadena, CA, USA, 2005.
  31. Werner, C.; Wegmüller, U.; Strozzi, T.; Wiesmann, A. Processing strategies for phase unwrapping for INSAR applications. In Proceedings of the European Conference on Synthetic Aperture Radar EUSAR 2002, Cologne, Germany, 4–6 June 2002; Gamma Remote Sensing AG: Muri bei Bern, Switzerland, 2002; Volume 1, pp. 353–356. [Google Scholar]
  32. Zang, J.; Xu, C.; Chen, G.; Wen, Q.; Fan, S. Real-Time Coseismic Deformations from Adaptively Tight Integration of High-Rate GNSS and Strong Motion Records. Geophys. J. Int. 2019, 219, 1757–1772. [Google Scholar] [CrossRef]
  33. Wang, R.; Schurr, B.; Milkereit, C.; Shao, Z.; Jin, M. An Improved Automatic Scheme for Empirical Baseline Correction of Digital Strong-Motion Records. Bull. Seismol. Soc. Am. 2011, 101, 2029–2044. [Google Scholar] [CrossRef]
  34. Wang, R.; Motagh, M.; Walter, T. Inversion of Slip Distribution from Coseismic Deformation Data by a Sensitivity-Based Iterative Fitting (SBIF) Method. EGU Gen. Assem. 2008, 10, EGU2008-A-07971. [Google Scholar]
  35. Okada, Y. Surface Deformation Due to Shear and Tensile Faults in a Half-Space. Bull. Seismol. Soc. Am. 1985, 75, 1135–1154. [Google Scholar] [CrossRef]
  36. Yu, C.; Li, Z.; Hu, X.; Song, C.; Li, S.; Liu, H.; Li, J.; Han, B.; Liu, Z.; Liu, M.; et al. Source Parameters and Induced Hazards of the 2025 Mw 7.1 Dingri Earthquake on the Southern Tibetan Plateau (Xizhang), China, as Revealed by Imaging Geodesy. J. Earth Sci. 2025. [Google Scholar] [CrossRef]
  37. Zhao, C.; Qu, F.; Zhang, Q.; Zhu, W. A Combined Multi-Interferogram Algorithm for High Resolution DEM Reconstruction over Deformed Regions with TerraSAR-X Data. J. Geodyn. 2012, 61, 148–153. [Google Scholar] [CrossRef]
  38. Das, S.; Henry, C. Spatial Relation between Main Earthquake Slip and Its Aftershock Distribution. Rev. Geophys. 2003, 41, 1013. [Google Scholar] [CrossRef]
  39. Gallovič, F.; Zahradník, J.; Plicka, V.; Sokos, E.; Evangelidis, C.; Fountoulakis, I.; Turhan, F. Complex Rupture Dynamics on an Immature Fault during the 2020 Mw 6.8 Elazığ Earthquake, Turkey. Commun. Earth Environ. 2020, 1, 40. [Google Scholar] [CrossRef]
  40. Rietbrock, A.; Ryder, I.; Hayes, G.; Haberland, C.; Comte, D.; Roecker, S.; Lyon-Caen, H. Aftershock Seismicity of the 2010 Maule Mw=8.8, Chile, Earthquake: Correlation between Co-Seismic Slip Models and Aftershock Distribution? Geophys. Res. Lett. 2012, 39, L08310. [Google Scholar] [CrossRef]
  41. Toda, S.; Stein, R.S. Central Shutdown and Surrounding Activation of Aftershocks from Megathrust Earthquake Stress Transfer. Nat. Geosci. 2022, 15, 494–500. [Google Scholar] [CrossRef]
  42. Toda, S.; Stein, R.S.; Sevilgen, V.; Lin, J. Coulomb 3.3 Graphic-Rich Deformation and Stress-Change Software for Earthquake, Tectonic, and Volcano Research and Teaching-User Guide; USGS: Reston, VA, USA, 2011.
  43. Li, C.; Li, T.; Shan, X.; Zhang, G. Extremely Large Off-Fault Deformation during the 2021 Mw 7.4 Maduo, Tibetan Plateau, Earthquake. Seismol. Res. Lett. 2022, 94, 39–51. [Google Scholar] [CrossRef]
  44. Oskin, M.E.; Arrowsmith, J.R.; Corona, A.H.; Elliott, A.J.; Fletcher, J.M.; Fielding, E.J.; Gold, P.O.; Garcia, J.J.G.; Hudnut, K.W.; Liu-Zeng, J.; et al. Near-Field Deformation from the El Mayor–Cucapah Earthquake Revealed by Differential LIDAR. Science 2012, 335, 702–705. [Google Scholar] [CrossRef]
  45. Bird, P. Long-Term Fault Slip Rates, Distributed Deformation Rates, and Forecast of Seismicity in the Western United States from Joint Fitting of Community Geologic, Geodetic, and Stress Direction Data Sets. J. Geophys. Res. Solid Earth 2009, 114, B11403. [Google Scholar] [CrossRef]
  46. Wessel, P.; Luis, J.F.; Uieda, L.; Scharroo, R.; Wobbe, F.; Smith, W.H.F.; Tian, D. The Generic Mapping Tools Version 6. Geochem. Geophys. Geosyst. 2019, 20, 5556–5564. [Google Scholar] [CrossRef]
Figure 1. Tectonic map of the Dingri earthquake region. (a) Distribution map of the STR System, with data sourced from [1], where the blue rectangle represents the coverage area of the Sentinel-1A and Lutan satellites on the ground. (b) Regional geological overview map. The focal mechanisms were obtained from GCMT, comprising earthquakes with magnitudes Mw >4.5 from January 1976 to January 2025. The red star marks the epicenter of the 2025 Dingri Earthquake, and the background color map represents the dilatational strain rate [1]. MHT: Main Himalayan Thrust; STDS: South Tibet Detachment system; XDF: Xainza-Dinggyê Fault; YZRF: Yarlung Zangbo River Fault; TYKF: Tangra Yumco-Kongco Fault; XTMF: Xietongmen rift; DMCF: Dengmecuo Fault. Refer to [3,4]. (c) Aftershock sequence of the 2025 Dingri Earthquake, the black lines represent the seismogenic faults, while the red lines indicate surface ruptures [5], the focal mechanism sourced from GCMT.
Remotesensing 17 01096 g001
Figure 2. The LOS deformation of InSAR observations. (ac) represent the coseismic interferograms recorded by Lutan, Sentinel-1A track 12, and track 121, respectively. The beach ball symbol represents the focal mechanism solution from USGS. (df) represent the unwrapped coseismic deformation. The black lines are active faults, and the red line represents DMCF.
Remotesensing 17 01096 g002
Figure 3. Displacement time series integrated from strong motion records. See Figure 4 for the locations of strong motion stations.
Remotesensing 17 01096 g003
Figure 4. The horizontal coseismic displacement vector derived from strong motion records. The blue arrow represents the real horizontal deformation, and the black arrow represents the model horizontal deformation.
Remotesensing 17 01096 g004
Figure 5. Rupture model of the 2025 Dingri earthquake. (a) Coseismic slip distribution for the seismogenic fault of the Mw 7.0 Dingri earthquake. Arrows show the coseismic slip vectors. (b) The rest results at different dip angles. (c) Surface projection of the slip distribution. The black line represents the DMCF.
Remotesensing 17 01096 g005
Figure 6. Observed and modeled coseismic InSAR deformation of the 2025 Mw 7.0 Dingri earthquake, and the residuals after subtracting the modeled deformation from the observed interferograms. The black dashed lines delineate the location of the fault trace used in the inversion.
Remotesensing 17 01096 g006
Figure 7. (a) Cross-fault profile of coseismic deformation fields from different InSAR data, where the red line represents the rupture location. (b) Shallow structure and aftershock profile, with the gray lines indicating the active fault locations, the fault data is referred to (https://mp.weixin.qq.com/s/yjtrUKrfsm-RFAnPExwHkQ, accessed on 1 February 2025). (c) Seismogenic structure diagram for the 2025 Mw 7.0 Dingri earthquake.
Remotesensing 17 01096 g007
Table 1. Focal mechanism provided by different institutions.
SchemeLongitude (◦)Latitude (◦)Depth (km)Strike (◦)Dip (◦)Rake (◦)Mw
GCMT87.4728.5612356/17342/48−88/−927.1
USGS87.36128.63911.5349/18742/49−103/−787.05
GFZ87.4128.5714164/141/50−103/−797.07
IPGP87.36128.63914341/19651/44−113/−647.16
CENC87.4528.510348/18140/51−100/−817.1
GCMT—the Global Centroid-Moment-Tensor (CMT). USGS—U.S. Geological Survey. GFZ—GFZ German Research Centre for Geosciences. IPGP—Institut de physique du globe de Paris. CENC—China Earthquake Network Center.
Table 2. SAR data parameters.
SensorAcquisition TimeOrbital DirectionPath
Sentinel-1A2025/1/5–2025/1/17Ascending12
2025/1/1–2025/1/13Descending121
Lutan2024/12/6–2025/1/7Ascending-
Disclaimer/Publisher’s Note: The statements, opinions and data contained in all publications are solely those of the individual author(s) and contributor(s) and not of MDPI and/or the editor(s). MDPI and/or the editor(s) disclaim responsibility for any injury to people or property resulting from any ideas, methods, instructions or products referred to in the content.

