Article

SMEP-DETR: Transformer-Based Ship Detection for SAR Imagery with Multi-Edge Enhancement and Parallel Dilated Convolutions

School of Electronic Engineering, Soongsil University, Seoul 06978, Republic of Korea
*
Author to whom correspondence should be addressed.
Remote Sens. 2025, 17(6), 953; https://doi.org/10.3390/rs17060953
Submission received: 20 January 2025 / Revised: 27 February 2025 / Accepted: 6 March 2025 / Published: 7 March 2025
(This article belongs to the Special Issue Remote Sensing Image Thorough Analysis by Advanced Machine Learning)

Abstract

:
Synthetic aperture radar (SAR) serves as a pivotal remote sensing technology, offering critical support for ship monitoring, environmental observation, and national defense. Although optical detection methods have achieved good performance, SAR imagery still faces challenges, including speckle, complex backgrounds, and small, dense targets. Reducing false alarms and missed detections while improving detection performance remains a key objective in the field. To address these issues, we propose SMEP-DETR, a transformer-based model with multi-edge enhancement and parallel dilated convolutions. This model integrates a speckle denoising module, a multi-edge information enhancement module, and a parallel dilated convolution and attention pyramid network. Experimental results demonstrate that SMEP-DETR achieves the high m A P 98.6% on SSDD, 93.2% in HRSID, and 80.0% in LS-SSDD-v1.0, surpassing several state-of-the-art algorithms. Visualization results validate the model’s capability to effectively mitigate the impact of speckle noise while preserving valuable information in both inshore and offshore scenarios.

Graphical Abstract

1. Introduction

Remote sensing technology enables the collection of information about distant objects or phenomena, utilizing electromagnetic signals reflected from the Earth’s surface [1]. These data can be collected via platforms like satellites, aircraft, and unmanned aerial vehicles (UAVs), using sensors such as synthetic aperture radar (SAR) and optical and multispectral sensors [2]. SAR offers several advantages, including continuous operation, all-weather capability, interference resistance, long-range detection, and strong concealment. Due to these characteristics, SAR is widely applied in military reconnaissance, scientific research, and environmental protection [3]. In particular, ship detection in SAR imagery has attracted significant attention.
The rapid advancement of deep learning (DL) has driven progress in computer vision (CV) and natural language processing, but these models pose challenges due to their lack of transparency and interpretability. Convolutional neural networks (CNNs), fundamental to DL, have been instrumental in advancing object detection techniques [4,5]. In image processing, traditional detection methods are classified into one-stage and two-stage approaches. One-stage algorithms simultaneously regress bounding boxes’ coordinates and category probabilities. Notable examples encompass you only look once (YOLO) series [6,7], RetinaNet [8], and the fully convolutional one-stage object detector (FCOS) [9]. Two-stage algorithms generate region proposals before classifying the bounding boxes like faster region-based CNN (Faster R-CNN) [10], Cascade R-CNN [11], etc.
Transformers have recently shown great promise in vision tasks, owing to their ability to establish global relationships between image pixels [12,13]. The attention mechanism [14] in transformers facilitates the preservation of spatial information, crucial for accurate target detection. This feature, combined with the introduction of positional embeddings, has allowed transformers to attain cutting-edge results in multiple fields. In 2020, Carion et al. [15] introduced the detection transformer (DETR), which replaces traditional region proposal-based methods with a fully end-to-end trainable architecture based on a transformer encoder–decoder network for object detection. The real-time detection transformer (RT-DETR) [16] is an optimized version of DETR [15] that enhances efficiency by using a hybrid encoder and a strategy to minimize uncertainty in query selection, eliminating non-maximum suppression (NMS) delay and ensuring real-time performance.
Popular SAR datasets, including the SAR ship detection dataset (SSDD) [17], high-resolution SAR image dataset (HRSID) [18], and large-scale SAR ship detection dataset-v1.0 (LS-SSDD-v1.0) [19], have proven valuable for ship detection tasks in previous works. Although remote sensing and DL-based technologies hold great promise, several challenges persist. Ship detection in SAR imagery is complicated by factors such as lighting variations, motion trajectories, occlusions, and weather conditions, which introduce significant uncertainty and impair real-time accuracy. These difficulties arise from the intrinsic properties of SAR imaging, including speckle noise, cluttered backgrounds, and multi-scale objects.
Target detection in SAR data is often hindered by speckle noise, which can obscure crucial details. Although various denoising techniques exist to improve SAR image quality for subsequent tasks, such as target recognition and classification, existing approaches suffer from disjoint despeckling and detection pipelines. Unlike optical images, where SAR data is often simply expanded into three channels for traditional CNN-based detectors, we integrate a speckle filtering module into the initial stages of our proposed framework. Common denoising methods include spatial domain filtering, transform domain filtering, statistical filtering, and deep learning approaches. Gaussian filtering suppresses noise through isotropic smoothing based on spatial proximity but may blur object edges, whereas bilateral filtering preserves edges by considering both spatial distance and intensity differences between pixels. By leveraging their complementary properties, we incorporate Gaussian and bilateral filtering within a jointly optimized module rather than treating denoising as an isolated preprocessing step. Object localization heavily relies on edge information, but traditional methods often struggle with background noise and insufficient edge preservation. Moreover, while CNNs and transformers can learn edge patterns, they lack dedicated mechanisms to amplify such discriminative edge information. After denoising, edge detection algorithms (such as Sobel [20], Canny [21], etc.) can be used to extract edges in the image. These methods help restore the boundaries of objects and are important features for identifying targets, especially in complex backgrounds. Furthermore, transformer-based detectors [15,16] suffer from contextual loss due to fixed sampling strategies. This limitation results in inadequate preservation of multi-resolution features, leading to missed detections and inaccurate bounding boxes in heterogeneous maritime environments. Another important consideration is the balance between model complexity, effectiveness, and real-time performance. Building upon the aforementioned analysis, we propose SMEP-DETR, a transformer-based detector for SAR imagery with multi-edge enhancement and parallel dilated convolutions. This study presents the following key contributions:
1.
A denoising module is designed with consideration of the speckle noise characteristics in SAR images and seamlessly integrated into the detection framework, ensuring joint optimization of speckle suppression and feature extraction.
2.
We introduce the multi-edge information enhancement (MEIE) module, which integrates the Sobel operator and max pooling to extract edge information, followed by flexible feature extraction via edge information fusion (EIFusion).
3.
We propose a novel parallel dilated convolution and attention pyramid network (PDC-APN) for feature fusion, replacing traditional sampling operations to ensure the preservation of objects’ contextual information.
4.
Through quantitative and qualitative analyses, extensive experiments on SSDD, HRSID, and LS-SSDD-v1.0 demonstrate substantial improvements, validating the robustness of our scheme in inshore and offshore scenarios.
The structure of this study is outlined as follows: Section 2 surveys existing research on optical images and SAR object detectors. We describe the architecture and mechanisms of SMEP-DETR in Section 3. Section 4 provides experiments and performance analysis, comparing our method with baseline approaches using SAR datasets. In Section 5, we explore the implications of our approach and suggest further directions. Finally, Section 6 summarizes the key findings.

2. Related Work

2.1. DL-Based General Object Detection

Object detection is the core task in CV, involving identification, localization, and classification of objects in visual data. State-of-the-art detectors are commonly classified into one-stage and two-stage methods, each with distinct advantages. One-stage models like YOLO [6] emphasize speed, though they may underperform when dealing with small or complex objects. In contrast, two-stage models such as Faster R-CNN [10] and Cascade R-CNN [11] prioritize accuracy by using region proposal mechanisms, resulting in higher precision but slower inference. An object detector typically comprises three main components: backbone, neck, and detection head. Common backbones include the visual geometry group (VGG) [22], residual network (ResNet) [23], DenseNet [24], MobileNets [25] and others. ResNet introduces connections to address the vanishing gradient problem and performs well at extracting features [23]. Feature pyramid networks (FPNs) [26] and similar structures are key components of the neck, responsible for fusing multi-scale features. The path aggregation network (PANet) [27] and NAS-FPN [28] are advanced approaches, PANet focuses on path aggregation for better multi-scale fusion, while NAS-FPN employs neural architecture search to intelligently optimize FPN structure. Detection heads convert extracted and fused features into predictions, with their design influenced by the specific task. The authors in [29] propose a dynamic head framework that unifies detection heads with attention mechanisms, improving performance without excessive computational cost.
Meanwhile, advancements have driven innovation by researchers in feature extraction, neck designs, and detection heads to accommodate diverse object characteristics. From the perspective of loss function, authors in [30] proposed generalized focal loss (GFL), which handles continuous labels by integrating quality estimation into the predicted class vector and representing box location distribution flexibly. YOLOX [31], an anchor-free YOLO-based detector, obtains great accuracy with a decoupled head and dynamic label assignment. A task-aligned one-stage object detection (TOOD) [32] was introduced to address the spatial misalignment between localization and classification using the learning-based alignment approach. With the introduction of DETR [15], transformer-based [33,34,35,36] methods have attracted wide attention. The work of [33] presented the vision transformer (ViT) for image recognition tasks by partitioning images into patches as a sequence and leveraging self-attention mechanisms to capture global dependencies. Deformable DETR introduces deformable attention modules and performs particularly well on small targets [34]. DETR with improved denoising anchor boxes (DINO) [35] employs contrastive denoising and mixed query selection for box prediction, thereby enhancing previous DETR-based methods. Researchers proposed dense distinct queries (DDQ) and used them in DETR for better end-to-end object detection [36]. The real-time models for object detection (RTMDet) [37] introduces soft labels and offers a versatile architecture for detection and segmentation tasks with the best parameter-accuracy trade-off across different model sizes.

2.2. SAR Ship Detection Algorithms

Compared with conventional optical images, detection in SAR imagery still faces unique challenges. The SAR imaging principle inevitably leads to a wide range of target scales, extremely small objects, and dense arrangements, which limits the extractable features. Researchers have focused on addressing these challenges through sub-modifications, including feature extraction, feature fusion methods, loss optimization methods, attention mechanisms, and so on. The Quad-FPN [38] introduced four unique FPNs to detect multi-scale ships based on the original Faster-RCNN. BiFA-YOLO [39] proposed a bi-directional feature fusion module (Bi-DFFM) to aggregate features at different levels and integrated angle classification to detect objects at different orientations. The authors in [40] pointed out four unperceived imbalance problems and introduced a balanced learning network (BL-Net) consisting of four effective solutions. The adaptive sample assignment strategy based on a feature enhancement (ASAFE) [41] method selects high-quality positive samples and suppresses noise interference in complex environments. Li et al. [42] presented a novel attention-guided balanced FPN (A-BFPN) to exploit complementary features. Yang et al. [43] introduced an anchor-free network called GFECSI-Net, improving performance with multi-scale adaptive FPN and selective efficient channel attention module (SECAM). Huang et al. [44] proposed a CViTF-Net method, which combines the level synchronized attention mechanism with a Gaussian prior discrepancy assigner. Real-time processing is as important as accuracy, and YOLO-based models are well-suited for the immediate detection of targets. In [45], a multi-frequency coordinated (MFC) module addressed dense multi-target detection by refining different frequency feature maps along the channel dimension and discrete cosine transform. A weighted bidirectional FPN (BiFPN) [46] was integrated into YOLOv5 [47] to address ship scale variation in SAR imagery [48]. The YOLOv8-based [49] method named YOLO-SRBD in [50] introduces shuffle reparametrized blocks with a dynamic head to reuse features and enrich information flow between channels. Without compromising accuracy, the authors proposed and verified a lightweight model based on YOLOv8 for tracking ships in SAR images [51].

3. Proposed Method

3.1. Overall Framework

As shown in Figure 1, the SMEP-DETR integrates four synergistic components into an end-to-end SAR detection framework. This architecture comprises four key modules: a backbone, an encoder, a decoder, and a prediction head. The processing flow begins with a modified backbone combining Gaussian and bilateral filters to mitigate speckle noise while retaining structural edges. These preprocessed features pass through a multi-edge information enhancement (MEIE) module, which integrates a Sobel operator to extract critical edge information and generate multi-scale feature maps across layers ( P 3 , P 4 , P 5 ). These feature maps are then fed into an enhanced encoder designed with parallel dilated convolution and attention pyramid network (PDC-APN) for feature fusion, where dilated convolutions capture multi-scale ship contexts while attention pyramids dynamically weight features based on channel significance and edge coherence. Once feature fusion is complete, an uncertainty-based query selection mechanism identifies a fixed number of key features to serve as initial inputs to the decoder. Supported by the auxiliary prediction head, the decoder iteratively refines inputs to produce final bounding boxes and corresponding confidence scores. The primary innovations of this approach include speckle noise suppression tailored for SAR images, improved edge feature extraction through multi-scale enhancement, the use of parallel dilated convolution combined with attention-based sampling, and an efficient query selection mechanism.

3.2. Speckle Denoising Module

Most SAR object detection models directly convert single-channel images into the RGB format to align with conventional detection frameworks designed for optical images. However, this approach fails to introduce any additional useful information. Since speckle noise is an inherent characteristic of SAR imaging, we suggest implementing a speckle denoising module at the network’s input stage to mitigate its effects. Two filtering techniques are employed for this purpose: Gaussian filtering attenuates uniformly distributed noise through convolution with a Gaussian kernel. This method is favored for its simplicity and computational efficiency, contributing to its suitability for real-time processing. On the other hand, bilateral filtering preserves edge information while suppressing speckle noise. It achieves this by considering both the spatial proximity of pixels and the similarity in their intensities, making it ideal for SAR images where maintaining edge structure is crucial. By combining these two filtering techniques, the proposed denoising strategy helps suppress noise while retaining essential features, ultimately enhancing the reliability of the subsequent procedure. The corresponding operations are outlined as follows.
G a = G a u s s i a n F i l t e r ( x , k G ) ,
B i = B i l a t e r a l F i l t e r ( x , k B ) ,
O u t p u t = s t a c k ( x , G a , B i , d i m = 1 ) ,
where x R B × C × H × W represents the input, B indicates the batch size, C refers to channels, and H and W denote the height and width of the input, respectively. k G and k B represent filer kernels, d i m = 1 denotes stacking along the channel dimension.

3.3. Multi-Edge Information Enhancement Module

Object localization with bounding boxes plays a fundamental role in object detection tasks. Current detectors struggle to effectively capture and emphasize edge features due to the abundant background noise in images, which can significantly degrade performance in complex scenarios. While shallow convolutional layers aim to encode foundational spatial patterns (e.g., edges) [22], their inherent operations (e.g., strided convolution) tend to suppress high-frequency structural details, a trade-off that propagates erroneous boundary localization cues to subsequent detection stages. To address this limitation, we propose a multi-edge information enhancement (MEIE) module. Our method is designed to integrate edge information at multiple scales into feature maps, elevating the model’s proficiency in detecting and localizing objects. By emphasizing edge features while minimizing the impact of background noise with speckle, our approach significantly improves the robustness and precision of object localization.
Firstly, we use the Sobel operator to compute the image gradients along the horizontal ( G x ) and vertical ( G y ) directions with two 3 × 3 convolution kernels. The Sobel filters are defined as follows.
G x = + 1 0 1 + 2 0 2 + 1 0 1 I , G y = + 1 + 2 + 1 0 0 0 1 2 1 I ,
where I represents the input image, and ⊗ denotes the convolution operation.
The gradient magnitude G and direction θ are calculated as follows.
G = G x 2 + G y 2 , θ = arctan ( G y G x ) ,
where G and θ represent the gradient magnitude and the gradient direction, respectively.
To preserve sharp edge details, we use max pooling instead of average pooling, as the latter may smooth out critical features. Max pooling selects the maximum value within each pooling window R i , j as
y i , j = max ( m , n ) R i , j x m , n ,
where R i , j is the pooling window in the input feature map, x m , n is the pixel value in the input, and y i , j is the pooled output.
Additionally, we propose edge information fusion (EIFusion), a novel technique designed to integrate edge features with those extracted through standard convolutions. EIFusion combines edge information from several spatial scales, utilizing both 1 × 1 and 3 × 3 convolution operations to refine the final feature maps, as illustrated in Figure 2.
The process is outlined as follows.
F c o n c a t = C o n c a t ( F B a s i c B l o c k , F p r o c e s s e d ) ,
F p r o c e s s e d = C o n v 1 × 1 ( M a x P o o l ( F S o b e l ) ) ,
O u t p u t = C o n v 1 × 1 ( C o n v 3 × 3 ( C o n v 1 × 1 ( F c o n c a t ) ) ) ,
where F B a s i c B l o c k is the feature map from the backbone network, F S o b e l is the edge-detected feature map, F p r o c e s s e d is the refined edge map after 1 × 1 convolution, and F c o n c a t is the concatenated feature map from both the backbone and the processed edge features, O u t p u t is the final feature map after EIFusion block.

3.4. Parallel Dilated Convolution–Attention Pyramid Network

The extracted features are processed by the modified encoder, which incorporates both the backbone and the MEIE module. Building upon an attention-based intra-scale feature interaction (AIFI) [16], we introduce a novel network architecture consisting of two primary components: the parallel dilated convolution (PDC) block and the attention pyramid network (APN), as illustrated in Figure 3.
PDC blocks utilize parallel dilated convolutions [52] across three layers with dilation rates of 1, 2, and 3 to gather features on various scales. Each convolution layer handles a distinct receptive field size, and the resulting feature maps are concatenated along the channel dimension. Then, a 1 × 1 convolution is applied to reduce the channel count back to its original size. Features are efficiently extracted by this architecture at varying scales while maintaining a compact model size, improving performance for tasks requiring both detailed and contextual information.
The attention pyramid network comprises two main components: attention-based upsampling and attention-based downsampling, as shown in Figure 3b,c. The different sampling branches enable the extraction of diverse feature representations, enhancing the overall feature variety. By utilizing a gating mechanism, the network selectively amplifies important features while suppressing irrelevant ones, thereby improving the feature representation. During attention-based upsampling, global average pooling (or adaptive average pooling) is used for the input, followed by a channel gating mechanism. This mechanism is implemented through a 1 × 1 convolution with the hard sigmoid activation to generate channel weights. The feature map is then upsampled through transposed convolution [53] and upsampling with the convolution layer. These processed features are multiplied by the gating signal and passed through another convolution to generate the final results. In the attention-based downsampling process, a similar approach is applied, but here, the feature map is downsampled, applying a convolution with stride 2 and max pooling to reduce spatial dimensions. The gating signal then multiplies this, and it is transferred to the final convolution layer.
The following equations represent the overall process of the proposed encoder in the SMEP-DETR model.
Q = K = V = F l a t t e n ( P 5 ) ,
F 5 = R e s h a p e ( A I F I ( Q , K , V ) ) ,
O u t p u t = P D C A P N ( P 3 , P 4 , F 5 ) ,
where R e s h a p e refers to recovering flattened features to match P 5 ’s shape, P D C A P N represents the parallel dilated convolution and attention pyramid network.

3.5. Uncertainty in Minimal Query Selection and Predict Head

In object detection, accurate target localization depends on the quality of queries given to the decoder for bounding box prediction. However, existing query selection schemes often introduce considerable uncertainty in feature selection, leading to suboptimal initialization of the decoder and a subsequent decline in detection performance. To address this issue, a query selection strategy that minimizes uncertainty was proposed by [16]. This approach explicitly models and reduces epistemic uncertainty by representing the joint latent variables of encoder features, thereby enhancing the quality of the queries provided to the decoder. Feature uncertainty, denoted as U, is quantified in Equation (13) to capture the divergence between the predicted location distribution P and category distribution C. This uncertainty measure plays a pivotal role in characterizing the inherent ambiguity present in the extracted features. This uncertainty measure is incorporated into the optimization function as detailed below.
U ( X ^ ) = P ( X ^ ) C ( X ^ ) ,
L ( X ^ , Y ^ , Y ) = L b b o x ( b ^ , b ) + L c l s ( U ( X ^ ) , c ^ , c ) ,
where X ^ R D and X ^ denote the feature output by the encoder. Y ^ and Y denote predicted values and ground truths. Y ^ = { c ^ , b ^ } and y = { c , b } , where b and c represent bounding boxes and categories.
To address the difficulties posed by varying ship scales in SAR images and the complexity of dense scenes, we adopt the original head of the RT-DETR model and retain features across three different scales. This approach has been shown to improve the detection performance in recognizing objects of various scales, categories, and shapes, as illustrated in Figure 1. By combining multiple scale features from the extractor with semantic information, we effectively capture the diverse attributes of objects. Additionally, the integration of speckle-denoised and edge information-enhanced feature maps further reinforces the ability of our model to detect objects with varying properties.

4. Experiments and Results

4.1. Data and Implementation Details

We evaluate the performance of our proposed SMEP-DETR model using three publicly available datasets: SSDD [17], HRSID [18], and LS-SSDD-v1.0 [19]. The detailed summary is organized in Table 1. As the first open-source dataset for SAR ship detection, SSDD is widely used to research state-of-the-art technology based on DL and contains 1160 images with 2456 ships. Designed for both ship detection and instance segmentation, the HRSID comprises 5604 cropped SAR images with 16,951 annotated ships. It contains high-resolution images with small, densely packed ships, making it ideal for assessing performance on small object detection. These data were sourced from Sentinel-1 and TerraSAR-X sensors, with resolutions of 0.5, 1.0, and 3.0 m. The LS-SSDD-v1.0 dataset consists of 15 large-scale Sentinel-1 images acquired in interferometric wide-swath mode, each having a resolution of 24,000 × 16,000 pixels. For our experiments, we cropped these large images into smaller patches of 800 × 800 pixels, resulting in 6000 samples for training and 3000 for testing.
The SMEP-DETR model was implemented using PyTorch 2.1.0, with input resized to 640 × 640 pixels. We trained ours for 300 epochs using the AdamW optimizer (weight decay = 0.0001 , momentum = 0.9 ) with a batch size of 4. The learning rate was set to 0.0001 . SAR imagery data were partitioned into training, validation, and testing sets following the protocols outlined in the original papers [17,18,19]. State-of-the-art object detectors were trained and assessed under the same conditions as in the original works, utilizing MMDetection [54].

4.2. Evaluation Metrics

The precision (P) measures the proportion of true positive predictions among all identified instances, and recall (R) calculates the proportion of true positive targets relative to all actual ship instances in the image. Higher precision and recall values indicate better performance in both ship detection and localization. Mean average precision ( m A P ) value averages precision across different IoU thresholds, offering a comprehensive measure of detection accuracy. The F 1 score, the harmonic mean of P and R, evaluates their balance with values ranging from 0 to 1, where 1 denotes optimal performance. The definitions are as follows:
P r e c i s i o n ( P ) = T P T P + F P ,
R e c a l l ( R ) = T P T P + F N ,
F 1 = 2 × P r e c i s i o n × R e c a l l P r e c i s i o n + R e c a l l ,
where T P refers to the true positives, F P to the false positives, and F N to the false negatives.
Here are the definitions of A P and m A P :
A P = 0 1 P ( R ) d R ,
m A P = 1 N n = 1 N A P n ,
where A P n denotes the AP of class n, and N represents the categories number.
The frames per second ( F P S ) metric evaluates the algorithm’s speed, defined as:
F P S = s T ,
where s denotes the sample number, and T represents the computation time.

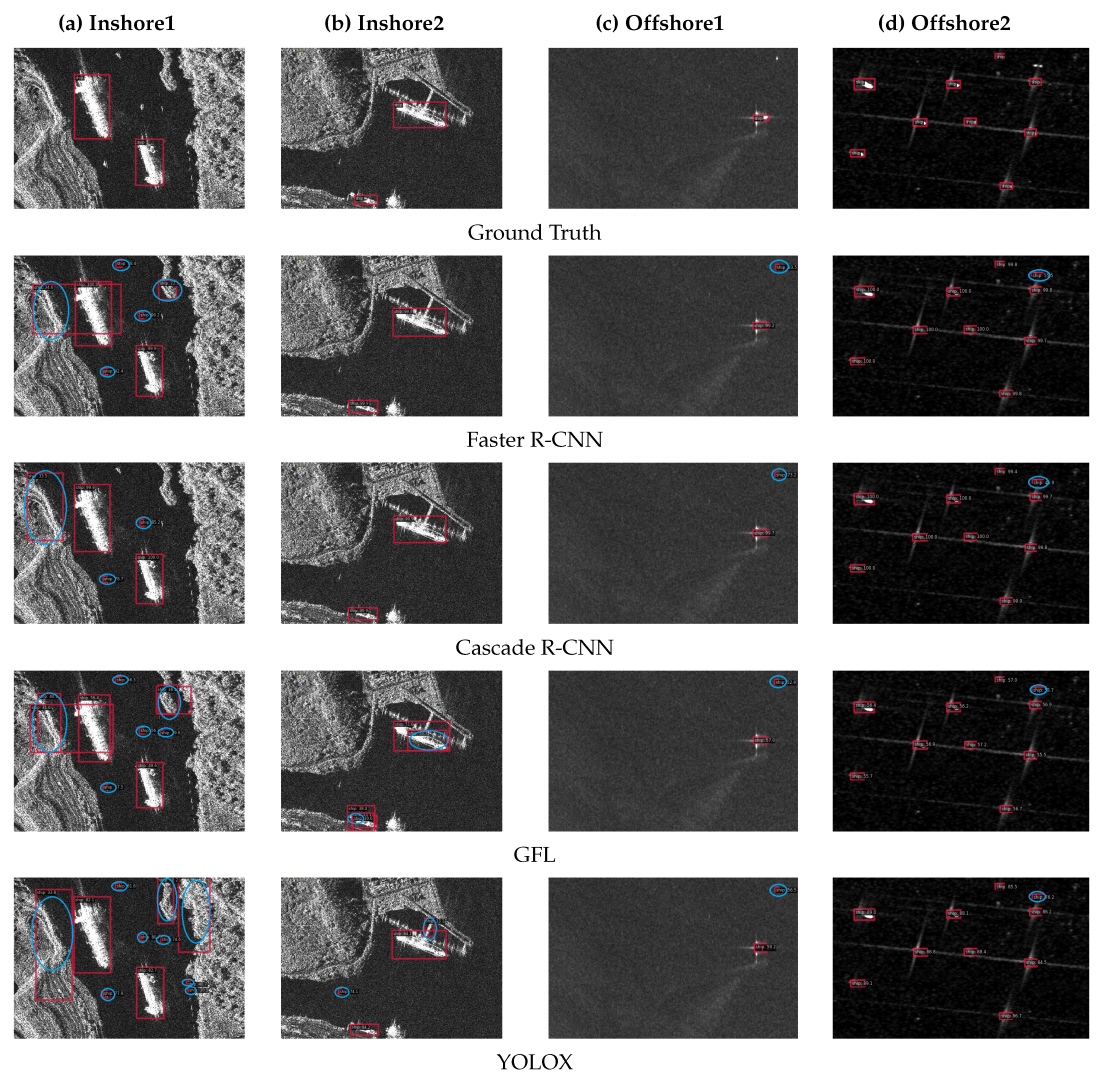
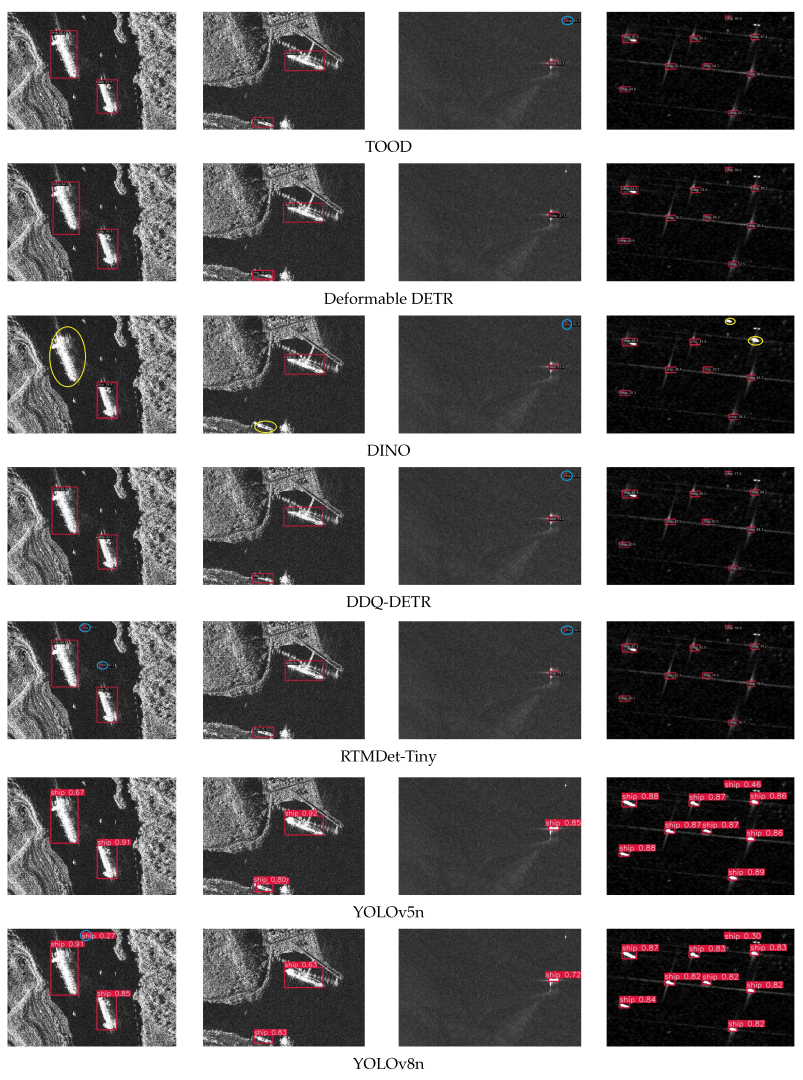
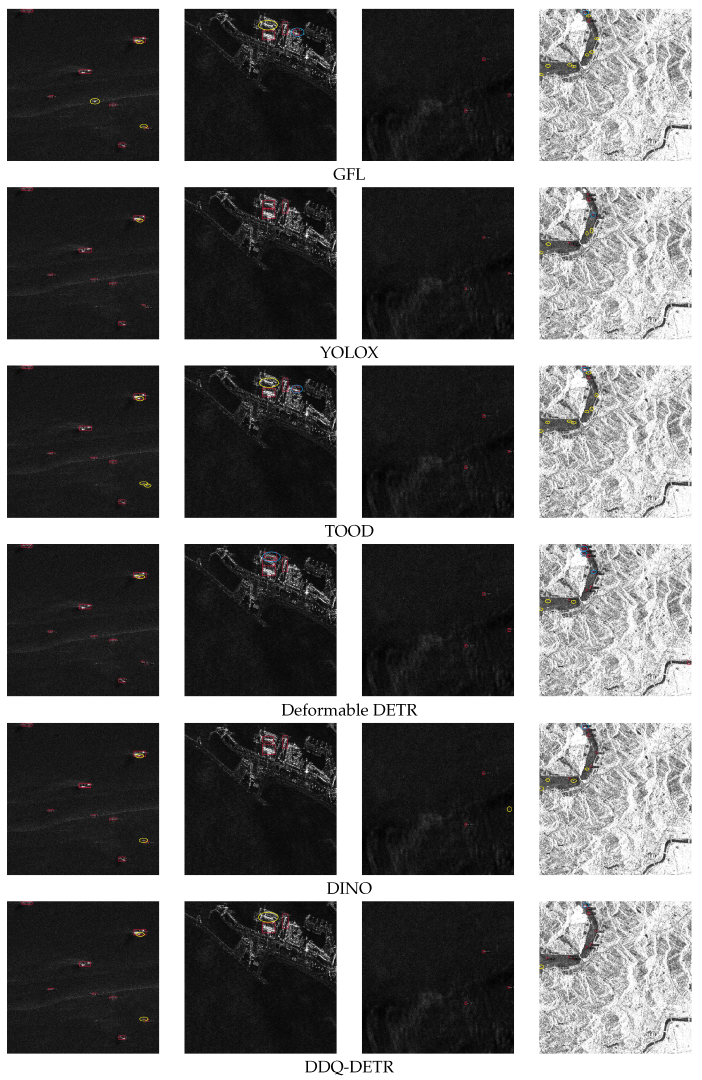
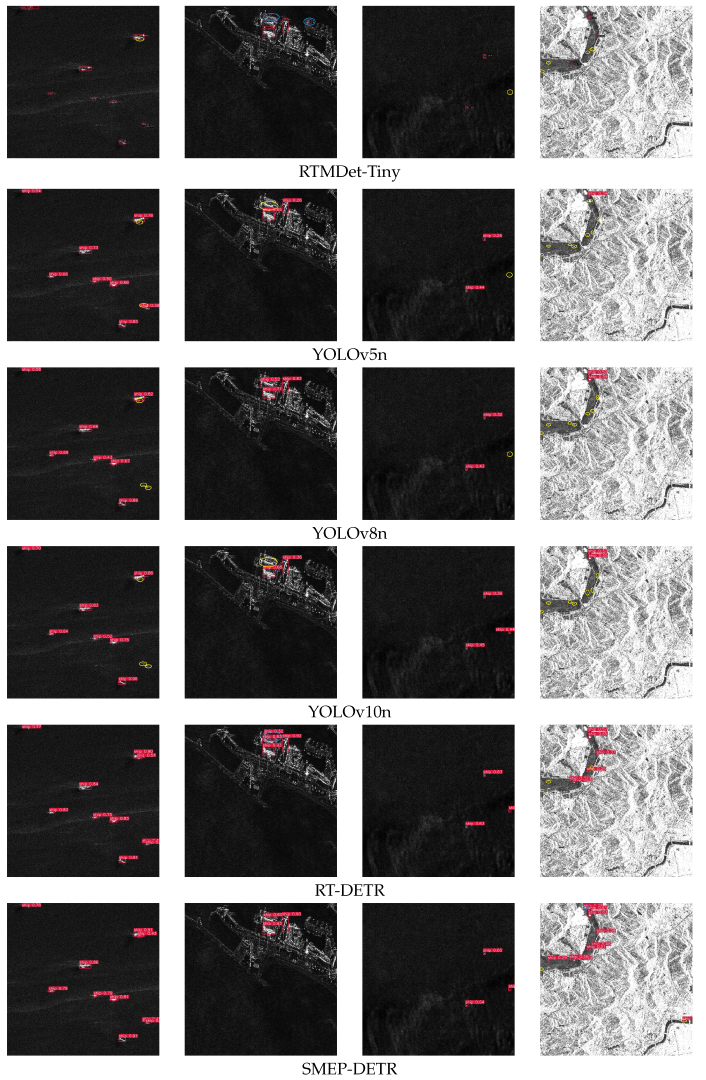
4.3. Comparisons of Performance

We evaluated the proposed SMEP-DETR on the aforementioned data sets (SSDD, HRSID, LS-SSDD-v1.0) with several state-of-the-art target detectors, including Faster R-CNN [10], Cascade R-CNN [11], GFL [30], YOLOX [31], TOOD [32], Deformable DETR [34], DINO [35], DDQ-DETR [36], RTMDet-tiny [37], YOLOv5 [47], YOLOv8 [49], YOLOv10 [55], and RT-DETR [16]. The results in Table 2, Table 3 and Table 4 demonstrated that our SMEP-DETR method outperforms comparison models in multiple detection scenarios.
As presented in Table 2, SMEP-DETR achieves the highest P (96.5%), R (95.6%), m A P (98.6%), and F 1 score (96.0%) in entire scenarios. Notably, it surpasses most methods in all shore scenes, increasing recall by 1.3% over YOLOv5 and 1.8% over RT-DETR. Moreover, SMEP-DETR increases inshore m A P by 3.8% compared to RT-DETR-r18, reaching 96.4%. For offshore detection, it achieves a leading m A P of 99.4%, outperforming Deformable DETR (92.1%) and DDQ-DETR(95.0%). Given the relatively small size of the SSDD dataset, we conducted additional experiments on HRSID and LS-SSDD-v1.0 to further assess our approach.
On HRSID, SMEP-DETR demonstrates superior performance in Table 3, achieving an R of 86.5%, m A P of 93.2%, and F 1 score of 89.5%. Although its P (92.7%) is slightly lower than RT-DETR (92.9%), SMEP-DETR leads in recall, surpassing RT-DETR by 1.9 percentage points. Compared to YOLOX (82.6%) and GFL (74.4%), ours shows significant improvements in recall (up by 3.9% and 12.1%, respectively). In inshore scenes, SMEP-DETR achieves 84.1%, outperforming YOLOv10n by 8.7%, Faster R-CNN by 6.3%, and Cascade R-CNN by 8.4%. This highlights its robustness in reducing false positives and accurately detecting targets. With a R of 77.5%, SMEP-DETR performs better than RT-DETR (by 4.2%) and YOLOX (by 6.4%), indicating a lower rate of false negatives and an enhanced ability to detect targets. Additionally, SMEP-DETR achieves an m A P of 83.7%, exceeding RT-DETR by 2.4% and YOLOX by 4.7%, reflecting superior detection accuracy in complex inshore environments. In offshore scenes, SMEP-DETR attains a precision of 98.3%, close to YOLOX’s 98.7% with a recall of 97.3% that surpasses YOLOv10n by 4.2 percentage points. Its m A P of 99.2% is comparable to RT-DETR and outperforms YOLOX by 0.2% and RTMDet-Tiny by 1.7%.
On the LS-SSDD-v1.0 dataset, SMEP-DETR achieves the highest P of 88.2% and surpasses RT-DETR by 2.9 percentage points. While its R value (72.9%) is slightly behind YOLOX and RT-DETR, it still outperforms other methods. In entire scenes, SMEP-DETR delivers a strong performance, with an m A P of 80.0% and F 1 of 80.1%, nearly matching Cascade R-CNN’s m A P of 80.6%. The model exhibits notable performance in both inshore and offshore scenarios, with exceptional results in inshore scenes, achieving P (71.9%), m A P (56.8%), and F 1 (58.2%). Additionally, SMEP-DETR’s computational efficiency is demonstrated by its lower FLOPs (60.7 G) in comparison with Faster R-CNN (134.0 G) and Cascade R-CNN (162.0 G), making it more efficient in terms of processing power. While its parameter size of 21.11 M is larger than those of YOLO-based models like YOLOX (5.03 M) and YOLOv5n (2.50 M), this trade-off is compensated by significant improvements in detection accuracy. As shown in Table 2, Table 3 and Table 4, our model consistently outperforms both CNN-based methods (e.g., Faster R-CNN, Cascade R-CNN) and transformer-based detectors (Deformable DETR, DINO, DDQ-DETR) across all three datasets.
Moreover, we list a qualitative analysis using visualized samples to further validate the proposed model’s superiority. Figures and showcase the detection performance of SMEP-DETR and several advanced detectors in various complex scenarios.
These visualization results highlight SMEP-DETR’s robustness and precision under challenging conditions, such as inshore and offshore scenes, complex backgrounds with speckle noise, extremely small targets, large and small ships with different scales, and densely multiple targets. Detailed information for each sample is provided in captions of Figure 4 and Figure 5 to facilitate understanding. In order to ensure adequate clarity and detail, the qualitative results are presented across multiple pages, with the corresponding detector names labeled below each row of images. Upon examining these results, we observed that SMEP-DETR consistently outperforms other detectors under diverse conditions.
In Figure 4, ours can recognize large-scale and extremely small objects accurately. The Figure 5a proves that SMEP-DETR distinguishes tightly clustered ship targets when many comparison methods fail to accomplish. SMEP-DETR not only identifies all targets but also achieves higher localization precision, reducing false negatives and enhancing overall detection performance in scenarios with extremely small targets or significant speckle noise interference, as depicted in Figure 4c and Figure 5c,d.
In summary, our model achieves the highest detection accuracy on SSDD, which can be attributed to its relatively simple background and well-separated ship targets. On HRSID, performance is slightly lower due to the presence of small and densely packed ships, which increases the difficulty of precise localization. On LS-SSDD-v1.0, the model demonstrates robust performance across varying resolutions and ship sizes, including extremely small ships.

4.4. Ablation Experiments

This section presents an ablation study on SSDD under various scenarios. The results in Table 5 indicate that each modification incrementally improves the model’s performance, and the final version SMEP-DETR obtained the best results across multiple metrics.
The baseline model achieved a P of 95.2%, R of 93.8%, and m A P of 97.2%. Incorporating speckle noise reduction methods, GaBiFilter and LeeFilter, improved performance further. The approach balances noise suppression and feature retention, improving detection accuracy rather than solely minimizing speckle noise. GaBiFilter excelled in precision (94.9%) and m A P (96.2%) in inshore scenes. Although its m A P slightly decreased in offshore scenes, it remained stable in inshore environments, proving the effectiveness of denoising in specific contexts. In contrast, LeeFilter showed a superior R value in the entire and offshore scenes with values of 94.1% and 98.0%. We compared the effects of using average pooling and max pooling in the proposed MEIE module. AveragePool led to a slight improvement in m A P and R, with the highest P (97.4%) observed in the entire scene. However, MaxPool provided the best results in P (99.0%) and m A P 50 :95 (74.3%), making it more suitable for handling offshore scenes. Considering the feature fusion method, the RepC3 and PDC modules with attention-based upsampling and downsampling improved precision and recall, especially in inshore and offshore scenes. RepC3 increased R to 91.5%, while PDC provided stability in m A P and R in inshore environments. Finally, the SMEP-DETR method, combining all the improvements, achieved the best performance overall. It outperformed other methods in key metrics, such as m A P (98.6%) and m A P 50 :95 (74.5%), and showed advantages in precision (96.5%) and recall (95.6%), reflecting its robustness and reliability across different environments.

5. Discussion

In Section 3, we proposed the SMEP-DETR model to detect ships efficiently, particularly in scenarios involving complex backgrounds, speckle noise, and multi-scale targets. The experimental results show that the proposed model enhances the effect of target recognition and localization in Section 4. At the same time, the benefits of each improvement are also presented through ablation experiments. The superior performance of SMEP-DETR can be attributed to its optimized multi-scale feature extraction and robust noise suppression techniques. Instead of aiming for complete noise removal, the denoising module is designed to enhance feature extraction for object detection in SAR imagery. GaBiFilter showed better performance, especially in detecting small targets and maintaining boundary details, thus avoiding the loss of subtle features in target detection. The MEIE module combines the Sobel operator with max pooling in order to extract and strengthen edge information from the image. This module outperforms traditional detectors, particularly in challenging backgrounds with tightly clustered or small-scale targets. The PDC-APN utilizes dilated convolutions and attention mechanisms, especially in offshore scenarios, where it enhances contextual information preservation, resulting in more accurate and stable detection in complex environments.
Two-stage detectors (e.g., Faster R-CNN, Cascade R-CNN) rely on predefined anchor boxes, which struggle to accommodate targets with extreme aspect ratios or scale variations, despite their high accuracy. YOLO models demonstrate unrivaled real-time performance, but their precision still requires improvement. Transformer-based models are sensitive to training data, which may explain their relatively lower performance on SAR datasets. SMEP-DETR addresses these limitations by synergizing the advantages of RT-DETR with the characteristics of SAR. This strategic integration allows our model to better handle complex environmental conditions while maintaining computational efficiency. For instance, on SSDD, our model achieves an m A P of 96.4% in inshore scenes, surpassing models such as YOLOv10n (90.5%) and RT-DETR (92.6%). SMEP-DETR has 21.11 M parameters, requires 60.7 GFLOPs, and achieves 50.6 FPS, while models like YOLO (e.g., YOLOv10n) have around 2.27 M parameters. Although these lightweight models have fewer parameters, which help speed up inference, our model achieves a 5.9% higher m A P , particularly in reducing missed detections and false alarms, especially in SAR imagery with challenging environments. Future work will focus on optimizing SMEP-DETR using techniques like pruning, distillation, and quantization to reduce the model size and inference latency while maintaining detection accuracy, making it more suitable for real-time or resource-constrained applications.
Both qualitative and quantitative evaluations confirm that SMEP-DETR performs consistently well in various environments. This indicates its strong potential for real-world deployment, providing a novel and effective approach for addressing complex object detection tasks in more extreme conditions. These advancements extend the potential of ship detection while offering valuable insights into the trade-offs among detection accuracy, model complexity, and computational efficiency.

6. Conclusions

In this study, we propose SMEP-DETR, a novel framework for ship detection in SAR imagery, designed to address challenges of speckle interference, complex backgrounds, and diverse scale objects. Our approach effectively considers speckle noise, enhances edge information, and improves multi-scale feature extraction, tackling critical challenges in SAR-based object detection. The proposed GaBiFilter module optimizes the joint performance of speckle suppression and feature extraction. By integrating the Sobel operator into the backbone, our MEIE architecture simultaneously enhances gradient information in both horizontal and vertical directions through backpropagation, enabling edge reinforcement for varying target shapes. The PDC-APN facilitates contextual feature fusion across multiple layers. Experimental evaluations on public datasets (SSDD, HRSID, LS-SSDD-v1.0) confirm the model’s superior performance, particularly in detecting small objects and maintaining high localization accuracy under complex background conditions. The model’s adaptability across diverse scenarios underscores its potential for real-world deployment in maritime surveillance and related applications. Future work will focus on further optimizing computational efficiency and broadening its applicability to other remote sensing tasks.

Author Contributions

Conceptualization, C.Y. and Y.S.; methodology, C.Y.; software, C.Y.; validation, C.Y.; formal analysis, C.Y.; investigation, C.Y. and Y.S.; resources, Y.S.; writing—original draft preparation, C.Y.; writing—review and editing, C.Y. and Y.S. All authors have read and agreed to the published version of the manuscript.

Funding

This research was supported by the MSIT, Korea, under the ITRC support program (IITP-2025-RS-2023-00258639) supervised by the IITP.

Data Availability Statement

Data are contained within the article.

Conflicts of Interest

The authors declare no conflicts of interest.

References

  1. Campbell, J.B. Introduction to Remote Sensing, 4th ed.; Guilford Press: New York, NY, USA, 2007. [Google Scholar]
  2. Toth, C.; Jóźków, G. Remote sensing platforms and sensors: A survey. ISPRS J. Photogramm. Remote Sens. 2016, 115, 22–36. [Google Scholar] [CrossRef]
  3. Li, J.; Xu, C.; Su, H.; Gao, L.; Wang, T. Deep learning for SAR ship detection: Past, present and future. Remote Sens. 2022, 14, 2712. [Google Scholar] [CrossRef]
  4. LeCun, Y.; Bengio, Y.; Hinton, G. Deep learning. Nature 2015, 521, 436–444. [Google Scholar] [CrossRef] [PubMed]
  5. Zhang, L.; Zhang, L.; Du, B. Deep learning for remote sensing data: A technical tutorial on the state of the art. IEEE Geosci. Remote Sens. Mag. 2016, 4, 22–40. [Google Scholar] [CrossRef]
  6. Redmon, J.; Divvala, S.; Girshick, R.; Farhadi, A. You only look once: Unified, real-time object detection. In Proceedings of the IEEE Conference on Computer Vision and Pattern Recognition, Las Vegas, NV, USA, 27–30 June 2016; pp. 779–788. [Google Scholar]
  7. Terven, J.; Cordova-Esparza, D. A comprehensive review of YOLO architectures in computer vision: From YOLOv1 to YOLOv8 and YOLO-NAS. arXiv 2023, arXiv:2304.00501. [Google Scholar] [CrossRef]
  8. Lin, T.-Y.; Goyal, P.; Girshick, R.; He, K.; Dollár, P. Focal loss for dense object detection. In Proceedings of the IEEE International Conference on Computer Vision, Venice, Italy, 22–29 October 2017; pp. 2980–2988. [Google Scholar]
  9. Tian, Z.; Shen, C.; Chen, H.; He, T. FCOS: Fully convolutional one-stage object detection. arXiv 2019, arXiv:1904.01355. [Google Scholar]
  10. Ren, S.; He, K.; Girshick, R.; Sun, J. Faster R-CNN: Towards real-time object detection with region proposal networks. IEEE Trans. Pattern Anal. Mach. Intell. 2017, 39, 1137–1149. [Google Scholar] [CrossRef]
  11. Cai, Z.; Vasconcelos, N. Cascade r-cnn: Delving into high quality object detection. In Proceedings of the IEEE Conference on Computer Vision and Pattern Recognition, Salt Lake City, UT, USA, 18–22 June 2018; pp. 6154–6162. [Google Scholar]
  12. Khan, S.; Naseer, M.; Hayat, M.; Zamir, S.W.; Khan, F.S.; Shah:, M. Transformers in vision: A survey. arXiv 2021, arXiv:2101.01169. [Google Scholar] [CrossRef]
  13. Aleissaee, A.A.; Kumar, A.; Anwer, R.M.; Khan, S.; Cholakkal, H.; Xia, G.-S.; Khan, F.S. Transformers in remote sensing: A survey. Remote Sens. 2023, 15, 1860. [Google Scholar] [CrossRef]
  14. Vaswani, A.; Shazeer, N.; Parmar, N.; Uszkoreit, J.; Jones, L.; Gomez, A.N.; Kaiser, L.; Polosukhin, I. Attention is all you need. arXiv 2017, arXiv:1706.03762. [Google Scholar]
  15. Carion, N.; Massa, F.; Synnaeve, G.; Usunier, N.; Kirillov, A.; Zagoruyko, S. End-to-end object detection with transformers. In Proceedings of the European Conference on Computer Vision, Glasgow, UK, 23–28 August 2020; pp. 213–229. [Google Scholar]
  16. Zhao, Y.; Lv, W.; Xu, S.; Wei, J.; Wang, G.; Dang, Q.; Liu, Y.; Chen, J. DETRs beat YOLOs on real-time object detection. arXiv 2023, arXiv:2304.08069. [Google Scholar]
  17. Zhang, T.; Zhang, X.; Li, J.; Xu, X.; Wang, B.; Zhan, X.; Xu, Y.; Ke, X.; Zeng, T.; Su, H.; et al. SAR ship detection dataset (SSDD): Official release and comprehensive data analysis. Remote Sens. 2021, 13, 3690. [Google Scholar] [CrossRef]
  18. Wei, S.; Zeng, X.; Qu, Q.; Wang, M.; Su, H.; Shi, J. HRSID: A high-resolution SAR images dataset for ship detection and instance segmentation. IEEE Access 2020, 8, 120234–120254. [Google Scholar] [CrossRef]
  19. Zhang, T.; Zhang, X.; Ke, X.; Zhan, X.; Shi, J.; Wei, S.; Pan, D.; Li, J.; Su, H.; Zhou, Y.; et al. LS-SSDD-v1.0: A deep learning dataset dedicated to small ship detection from large-scale Sentinel-1 SAR images. Remote Sens. 2020, 12, 2997. [Google Scholar] [CrossRef]
  20. Kanopoulos, N.; Vasanthavada, N.; Baker, R.L. Design of an image edge detection filter using the Sobel operator. IEEE J. Solid-State Circuits 1988, 23, 358–367. [Google Scholar] [CrossRef]
  21. Liu, H.; Jezek, K.C. Automated extraction of coastline from satellite imagery by integrating Canny edge detection and locally adaptive thresholding methods. Int. J. Remote Sens. 2004, 25, 937–958. [Google Scholar] [CrossRef]
  22. Simonyan, K.; Zisserman, A. Very deep convolutional networks for large-scale image recognition. arXiv 2014, arXiv:1409.1556. [Google Scholar]
  23. He, K.; Zhang, X.; Ren, S.; Sun, J. Deep residual learning for image recognition. In Proceedings of the IEEE Conference on Computer Vision and Pattern Recognition, Las Vegas, NV, USA, 26–30 June 2016; pp. 770–778. [Google Scholar]
  24. Huang, G.; Liu, Z.; Van Der Maaten, L.; Weinberger, K.Q. Densely connected convolutional networks. arXiv 2016, arXiv:1608.06993. [Google Scholar]
  25. Howard, A.G.; Zhu, M.; Chen, B.; Kalenichenko, D.; Wang, W.; Weyand, T.; Andreetto, M.; Adam, H. MobileNets: Efficient convolutional neural networks for mobile vision applications. arXiv 2017, arXiv:1704.04861. [Google Scholar]
  26. Lin, T.Y.; Dollár, P.; Girshick, R.; He, K.; Hariharan, B.; Belongie, S. Feature pyramid networks for object detection. In Proceedings of the IEEE Conference on Computer Vision and Pattern Recognition, Honolulu, HI, USA, 21–26 July 2017; pp. 2117–2125. [Google Scholar]
  27. Liu, S.; Qi, L.; Qin, H.; Shi, J.; Jia, J. Path aggregation network for instance segmentation. In Proceedings of the IEEE Conference on Computer Vision and Pattern Recognition, Salt Lake City, UT, USA, 18–22 June 2018; pp. 8759–8768. [Google Scholar]
  28. Ghiasi, G.; Lin, T.Y.; Le, Q.V. NAS-FPN: Learning scalable feature pyramid architecture for object detection. In Proceedings of the IEEE/CVF Conference on Computer Vision and Pattern Recognition, Long Beach, CA, USA, 15–20 June 2019; pp. 7036–7045. [Google Scholar]
  29. Dai, X.; Chen, Y.; Xiao, B.; Chen, D.; Liu, M.; Yuan, L.; Zhang, L. Dynamic head: Unifying object detection heads with attentions. In Proceedings of the IEEE/CVF Conference on Computer Vision and Pattern Recognition (CVPR), Nashville, TN, USA, 20–25 June 2021; pp. 7373–7382. [Google Scholar]
  30. Li, X.; Wang, W.; Wu, L.; Chen, S.; Hu, X.; Li, j.; Tang, J.; Yang, J. Generalized focal loss: Learning qualified and distributed bounding boxes for dense object detection. Adv. Neural Info Process. Syst. 2020, 33, 21002–21012. [Google Scholar]
  31. Ge, Z.; Liu, S.; Wang, F.; Li, Z.; Sun, J. YOLOX: Exceeding YOLO series in 2021. arXiv 2021, arXiv:2107.08430. [Google Scholar]
  32. Feng, C.; Zhong, Y.; Gao, Y.; Scott, M.R.; Huang, W. TOOD: Task-aligned one-stage object detection. In Proceedings of the 2021 IEEE/CVF International Conference on Computer Vision (ICCV), Montreal, QC, Canada, 10–17 October 2021; pp. 3490–3499. [Google Scholar]
  33. Dosovitskiy, A.; Beyer, L.; Kolesnikov, A.; Weissenborn, D.; Zhai, X.; Unterthiner, T.; Dehghani, M.; Minderer, M.; Heigold, G.; Gelly, S.; et al. An image is worth 16×16 words: Transformers for image recognition at scale. arXiv 2020, arXiv:2010.11929. [Google Scholar]
  34. Zhu, X.; Su, W.; Lu, L.; Li, B.; Wang, X.; Dai, J. Deformable DETR: Deformable transformers for end-to-end object detection. arXiv 2020, arXiv:2010.04159. [Google Scholar]
  35. Zhang, H.; Li, F.; Liu, S.; Zhang, L.; Su, H.; Zhu, J.; Ni, L.M.; Shum, H.Y. DINO: Detr with improved denoising anchor boxes for end-to-end object detection. arXiv 2022, arXiv:2203.03605. [Google Scholar]
  36. Zhang, S.; Wang, X.; Wang, J.; Pang, J.; Lyu, C.; Zhang, W.; Luo, P.; Chen, K. Dense distinct query for end-to-end object detection. In Proceedings of the IEEE/CVF Conference on Computer Vision and Pattern Recognition (CVPR), Vancouver, BC, Canada, 17–24 June 2023; pp. 7329–7338. [Google Scholar]
  37. Lyu, C.; Zhang, W.; Huang, H.; Zhou, Y.; Wang, Y.; Liu, Y.; Zhang, S.; Chen, K. RTMDet: An empirical study of designing real-time object detectors. arXiv 2022, arXiv:2212.07784. [Google Scholar]
  38. Zhang, T.; Zhang, X.; Ke, X. Quad-FPN: A novel quad feature pyramid network for SAR ship detection. Remote Sens. 2021, 13, 2771. [Google Scholar] [CrossRef]
  39. Sun, Z.; Leng, X.; Lei, Y.; Xiong, B.; Ji, K.; Kuang, G. BiFA-YOLO: A novel YOLO-based method for arbitrary-oriented ship detection in high-resolution SAR images. Remote Sens. 2021, 13, 4209. [Google Scholar] [CrossRef]
  40. Zhang, T.; Zhang, X.; Liu, C.; Shi, J.; Wei, S.; Ahmad, I.; Zhan, X.; Zhou, Y.; Pan, D.; Li, J.; et al. Balance learning for ship detection from synthetic aperture radar remote sensing imagery. ISPRS J. Photogramm. Remote Sens. 2021, 182, 190–207. [Google Scholar] [CrossRef]
  41. Shi, H.; Fang, Z.; Wang, Y.; Chen, L. An adaptive sample assignment strategy based on feature enhancement for ship detection in SAR images. Remote Sens. 2022, 14, 2238. [Google Scholar] [CrossRef]
  42. Li, X.; Li, D.; Liu, H.; Wan, J.; Chen, Z.; Liu, Q. A-BFPN: An attention-guided balanced feature pyramid network for SAR ship detection. Remote Sens. 2022, 14, 3829. [Google Scholar] [CrossRef]
  43. Yang, S.; An, W.; Li, S.; Zhang, S.; Zou, B. An inshore SAR ship detection method based on ghost feature extraction and cross-scale interaction. IEEE Geosci. Remote Sens. Lett. 2023, 20, 1–5. [Google Scholar] [CrossRef]
  44. Huang, M.; Liu, T.; Chen, Y. CViTF-Net: A convolutional and visual transformer fusion network for small ship target detection in synthetic aperture radar images. Remote Sens. 2023, 15, 4373. [Google Scholar] [CrossRef]
  45. Qiao, C.; Shen, F.; Wang, X.; Wang, R.; Cao, F.; Zhao, S.; Li, C. A novel multi-frequency coordinated module for SAR ship detection. In Proceedings of the 2022 IEEE 34th International Conference on Tools with Artificial Intelligence (ICTAI), Macao, China, 31 October–2 November 2022; pp. 804–811. [Google Scholar]
  46. Tan, M.; Pang, R.; Le, Q.V. Efficientdet: Scalable and efficient object detection. In Proceedings of the IEEE/CVF Conference on Computer Vision and Pattern Recognition, Seattle, WA, USA, 13–19 June 2020; pp. 10781–10790. [Google Scholar]
  47. Jocher, G. YOLOv5 by Ultralytics; Version 7.0; Ultralytics: Frederick, MD, USA, 2020. [Google Scholar] [CrossRef]
  48. Yu, C.S.; Shin, Y. SAR ship detection based on improved YOLOv5 and BiFPN. ICT Express 2024, 10, 28–33. [Google Scholar] [CrossRef]
  49. Solawetz, J. What Is YOLOv8? The Ultimate Guide. 2023. Available online: https://blog.roboflow.com/whats-new-in-yolov8/ (accessed on 18 December 2023).
  50. Yu, C.; Shin, Y. An efficient YOLO for ship detection in SAR images via channel shuffled reparameterized convolution blocks and dynamic head. ICT Express 2024, 10, 673–679. [Google Scholar] [CrossRef]
  51. Yasir, M.; Liu, S.; Pirasteh, S.; Xu, M.; Sheng, H.; Wan, J.; de Figueiredo, F.A.; Aguilar, F.J.; Li, J. YOLOShipTracker: Tracking ships in SAR images using lightweight YOLOv8. Int. J. Appl. Earth Obs. Geoinf. 2024, 134, 104137. [Google Scholar] [CrossRef]
  52. Yu, F.; Koltun, V. Multi-scale context aggregation by dilated convolutions. arXiv 2015, arXiv:1511.07122. [Google Scholar]
  53. Dumoulin, V.; Visin, F. A guide to convolution arithmetic for deep learning. arXiv 2016, arXiv:1603.07285. [Google Scholar]
  54. Chen, K.; Wang, J.; Pang, J.; Cao, Y.; Xiong, Y.; Li, X.; Sun, S.; Feng, W.; Liu, Z.; Xu, J.; et al. Mmdetection: Open mmlab detection toolbox and benchmark. arXiv 2019, arXiv:1906.07155. [Google Scholar]
  55. Wang, A.; Chen, H.; Liu, L.; Chen, K.; Lin, Z.; Han, J.; Ding, G. YOLOv10: Real-time end-to-end object detection. arXiv 2024, arXiv:2405.14458. [Google Scholar]
Figure 1. The architecture of the proposed SMEP-DETR. Ⓒ denotes the concatenate operation and ⊕ denotes the element-wise add operation.
Remotesensing 17 00953 g001
Figure 2. The structure of the multi-edge information enhancement module.
Remotesensing 17 00953 g002
Figure 3. Diagram of the parallel dilated convolution and attention pyramid network.
Remotesensing 17 00953 g003
Figure 4. Visualization of SMEP-DETR and comparison detectors on SSDD: (a) inshore scene with large-scale ship targets, (b) inshore scene with both large and small ships, (c) offshore scene with significant speckle interference, (d) offshore scene with multiple targets. Red bounding boxes represent predicted ships, yellow ellipses indicate missing detections, and blue ellipses denote false alarms.
Remotesensing 17 00953 g004aRemotesensing 17 00953 g004bRemotesensing 17 00953 g004c
Figure 5. Visualization of SMEP-DETR and comparison detectors on HRSID and LS-SSDD-v1.0. (a,b) Samples from HRSID, (c,d) samples of LS-SSDD-v1.0. (a) Offshore scene with closely spaced targets, (b) inshore scene with docked objects near the shoreline, (c) offshore scene containing extremely small targets, (d) inshore scene with extensive background information. Red bounding boxes represent predicted ships, yellow ellipses indicate missing detections, and blue ellipses denote false alarms.
Remotesensing 17 00953 g005aRemotesensing 17 00953 g005bRemotesensing 17 00953 g005c
Table 1. Details of the public SSDD, HRSID, LS-SSDD-v1.0.
DetailsSSDDHRSIDLS-SSDD-v1.0
SourcesRadarSat-2, TerraSAR-X,
Sentinel-1
Sentinel-1, TerraSAR-X,
TanDem
Sentinel-1
PolarizationHH, HV, VV, VHHH, HV, VVVV, VH
Resolution (m)1∼150.5, 1, 35 × 20
Image Size217 × 214∼526 × 646800 × 80024,000 × 16,000
Image Numbers1160560415
Ships245616,9616015
Table 2. Performance comparison of SAR ship detection on SSDD in different scenarios (%).
MethodEntire ScenesInshore ScenesOffshore ScenesParam
(M)
FLOPs
(G)
FPS
PRmAPF1PRmAPF1PRmAPF1
Faster R-CNN [10]94.887.793.891.188.271.580.879.097.095.798.196.341.35179.022.8
Cascade R-CNN [11]95.588.894.992.086.973.082.279.398.496.798.897.569.15207.016.5
GFL [30]88.380.585.184.270.257.060.662.993.592.494.492.932.26176.021.7
YOLOX [31]89.087.290.588.173.572.772.473.196.094.797.395.35.037.684.2
TOOD [32]92.092.595.092.282.283.185.282.697.196.898.296.932.02170.017.5
Deformable DETR [34]83.180.885.981.972.067.470.169.685.489.692.187.440.10167.025.3
DINO [35]88.670.584.678.568.057.666.762.489.382.591.685.847.54238.011.2
DDQ-DETR [36]91.182.689.886.681.462.874.470.995.191.495.093.248.27203.418.4
RTMDet-Tiny [37]94.988.993.391.891.974.483.582.297.495.597.596.44.878.074.3
YOLOv5n [47]93.794.397.294.089.786.292.687.996.698.498.897.52.507.1330.3
YOLOv8n [49]94.893.298.194.085.984.993.485.498.198.299.398.13.018.1340.9
YOLOv10n [55]92.192.396.892.286.581.790.584.094.396.798.695.52.276.5261.5
RT-DETR [16]95.293.897.294.590.386.092.688.198.097.698.497.819.8756.9174.3
SMEP-DETR96.595.698.696.091.690.796.491.197.997.999.497.921.1160.750.6
Table 3. Performance comparison of SAR ship detection on HRSID in different scenarios (%).
MethodEntire ScenesInshore ScenesOffshore ScenesParam
(M)
FLOPs
(G)
FPS
PRmAPF1PRmAPF1PRmAPF1
Faster R-CNN [10]90.076.585.882.777.857.366.466.097.895.798.396.741.35134.027.1
Cascade R-CNN [11]91.777.687.584.175.763.170.368.897.996.698.797.269.15162.023.0
GFL [30]89.174.483.281.169.957.361.863.098.295.598.696.832.26128.031.7
YOLOX [31]92.382.690.887.281.371.179.075.898.797.099.097.85.037.681.1
TOOD [32]89.777.285.583.074.661.067.367.198.195.598.396.832.02123.021.8
Deformable DETR [34]90.174.582.281.677.256.963.665.597.195.998.396.540.10158.543.5
DINO [35]90.874.986.482.173.059.568.665.697.695.298.396.447.54179.018.1
DDQ-DETR [36]91.479.287.884.978.665.273.771.397.996.598.697.248.27203.427.8
RTMDet-Tiny [37]90.177.985.583.576.663.470.269.498.094.797.596.34.878.061.7
YOLOv5n [47]89.878.587.683.877.663.071.669.597.693.998.295.72.507.1537.5
YOLOv8n [49]89.580.689.084.875.868.774.172.196.695.398.695.93.018.1595.8
YOLOv10n [55]89.976.387.582.575.460.871.167.397.193.198.095.02.276.5417.8
RT-DETR [16]92.984.692.288.583.873.381.378.298.596.899.297.619.8756.9174.8
SMEP-DETR92.786.593.289.584.177.583.780.798.397.399.297.821.1160.749.9
Table 4. Performance comparison of SAR ship detection on LS-SSDD-v1.0 in different scenarios (%).
MethodEntire ScenesInshore ScenesOffshore ScenesParam
(M)
FLOPs
(G)
FPS
PRmAPF1PRmAPF1PRmAPF1
Faster R-CNN [10]86.063.875.573.360.937.447.146.389.482.988.986.041.35134.024.2
Cascade R-CNN [11]84.071.480.677.267.443.954.553.290.887.492.189.169.15162.019.0
GFL [30]83.768.774.475.562.141.343.949.689.486.789.388.032.26128.050.9
YOLOX [31]84.074.079.178.766.251.755.158.189.089.291.289.15.037.6230.3
TOOD [32]84.065.370.573.557.340.341.247.389.083.686.086.232.02123.022.6
Deformable DETR [34]80.266.771.272.858.540.739.948.089.082.687.385.740.10158.547.8
DINO [35]75.163.267.568.654.439.638.045.882.078.482.880.147.54179.017.5
DDQ-DETR [36]83.670.375.876.460.045.647.951.890.086.990.188.448.27203.427.7
RTMDet-Tiny [37]80.162.372.570.162.445.249.552.487.876.386.181.64.878.0167.7
YOLOv5n [47]83.967.875.175.059.544.347.050.888.185.689.986.82.507.1296.7
YOLOv8n [49]83.967.075.474.566.843.550.552.788.684.589.486.53.018.1306.0
YOLOv10n [55]78.865.773.771.760.544.747.551.484.779.687.282.12.276.5250.3
RT-DETR [16]85.373.079.278.766.449.855.656.988.788.990.488.819.8756.9174.8
SMEP-DETR88.272.980.080.171.948.956.858.292.088.491.190.221.1160.748.7
Table 5. Results of ablation experiment on SSDD in different scenes (%).
MethodEntire ScenesInshore ScenesOffshore Scenes
PRmAPmAP50:95PRmAPmAP50:95PRmAPmAP50:95
RT-DETR (Baseline)95.293.897.268.390.386.092.659.898.097.698.471.7
Speckle
Denoising
+GaBiFilter95.593.998.371.994.985.896.268.098.196.398.674.0
+LeeFilter96.094.197.669.487.388.393.460.598.798.099.072.9
MEIE
Module
+AveragePool97.494.098.469.395.584.394.460.398.498.799.373.0
+MaxPool95.293.898.472.186.488.894.766.599.097.399.274.3
Feature
Fusion
+RepC3-APN96.193.497.972.986.391.593.867.997.298.799.374.6
+PDC-APN96.394.198.271.291.589.595.166.197.498.699.273.4
SMEP-DETR (Ours)96.595.698.672.291.690.796.468.697.997.999.474.5
Disclaimer/Publisher’s Note: The statements, opinions and data contained in all publications are solely those of the individual author(s) and contributor(s) and not of MDPI and/or the editor(s). MDPI and/or the editor(s) disclaim responsibility for any injury to people or property resulting from any ideas, methods, instructions or products referred to in the content.

