Article

Spatiotemporal Dynamics and Potential Distribution Prediction of Spartina alterniflora Invasion in Bohai Bay Based on Sentinel Time-Series Data and MaxEnt Modeling

by
Qi Wang
1,2,
Guoli Cui
1,2,
Haojie Liu
1,
Xiao Huang
3,
Xiangming Xiao
4,
Ming Wang
5,
Mingming Jia
2,
Dehua Mao
2,
Xiaoyan Li
6,
Yihua Xiao
1,7 and
Huiying Li
1,2,*
1
School of Environmental and Municipal Engineering, Qingdao University of Technology, Qingdao 266520, China
2
State Key Laboratory of Black Soils Conservation and Utilization, Northeast Institute of Geography and Agroecology, Chinese Academy of Sciences, Changchun 130102, China
3
Department of Environmental Sciences, Emory University, Atlanta, GA 30322, USA
4
Department of Microbiology and Plant Biology, Center for Earth Observation and Modeling, University of Oklahoma, Norman, OK 73019, USA
5
College of Resources and Environment, Anhui Agricultural University, Hefei 230036, China
6
College of Earth Sciences, Jilin University, Changchun 130061, China
7
National and Local & Joint Engineering Research Center for Urban Sewage Treatment and Resource Recycling, Qingdao University of Technology, Qingdao 266520, China
*
Author to whom correspondence should be addressed.
Remote Sens. 2025, 17(6), 975; https://doi.org/10.3390/rs17060975
Submission received: 9 January 2025 / Revised: 3 March 2025 / Accepted: 8 March 2025 / Published: 10 March 2025
(This article belongs to the Special Issue GIS and Remote Sensing in Ocean and Coastal Ecology)

Abstract

:
The northward expansion of Spartina alterniflora (S. alterniflora) poses a profound ecological threat to coastal ecosystems and biodiversity along China’s coastline. This invasive species exhibits strong adaptability to colder climates, facilitating its potential spread into northern regions and underscoring the urgent need for a nuanced understanding of its spatial distribution and invasion risks to inform evidence-based ecosystem management strategies. This study employed multi-temporal Sentinel-1/2 imagery (2016–2022) to map and predict the spread of S. alterniflora in Bohai Bay. An object-based random forest classification achieved an overall accuracy above 92% (κ = 0.978). Over the six-year period, the S. alterniflora distribution decreased from 46.60 km2 in 2016 to 12.56 km2 in 2022, reflecting an annual reduction of approximately 5.67 km2. This decline primarily resulted from targeted eradication efforts, including physical removal, chemical treatments, and biological competition strategies. Despite this local reduction, MaxEnt modeling suggests that climate trends and habitat suitability continue to support potential northward expansion, particularly in high-risk areas such as the Binhai New District, the Shandong Yellow River Delta, and the Laizhou Bay tributary estuary. Key environmental drivers of S. alterniflora distribution include the maximum temperature of the warmest month, mean temperature of the wettest quarter, isothermality, sea surface temperature, mean temperature of the warmest quarter, and soil type. High-risk invasion zones, covering about 95.65 km2. These findings illuminate the spatial dynamics of S. alterniflora and offer scientific guidance for evidence-based restoration and management strategies, ensuring the protection of coastal ecosystems and fostering sustainable development.

1. Introduction

Invasive plant species can severely disrupt native ecosystems and diminish biodiversity, especially in vulnerable island and coastal environments [1,2]. S. alterniflora, a perennial grass, was introduced into China from North America in the late 1970s [3,4] to stabilize shorelines, reclaim tidal flats [5], and improve soil fertility [6]. However, its vigorous reproduction and high salt tolerance have turned it into a serious ecological threat to China’s coastal wetlands [7,8]. This invasive plant quickly colonizes tidal zones, outcompeting native vegetation and establishing dominance [9]. Its rapid spread lowers plant diversity, alters bird habitats, and triggers a chain of ecological disturbances, culminating in notable economic losses [10]. Climate change and the species’ adaptability to colder temperatures have facilitated its northward migration to higher-latitude regions such as the Bohai Sea [11]. Bohai Bay, as a key economic and ecological region, is particularly vulnerable to S. alterniflora invasion. The bay hosts major port cities (e.g., Tianjin, Tangshan), extensive fisheries, and aquaculture industries, making it an economically vital area where wetland degradation could have direct financial consequences. Ecologically, Bohai Bay supports critical wetland habitats for migratory birds and native salt marsh species, which are highly sensitive to habitat alterations caused by S. alterniflora encroachment. Despite these risks, research on S. alterniflora invasion in Bohai Bay remains limited compared to extensively studied regions such as the Yangtze and Pearl River estuaries. This knowledge gap underscores the urgency of monitoring its spatiotemporal spread and assessing potential threats to northern coastal ecosystems. In response to these escalating concerns, the Chinese government released the Special Action Plan for the Prevention and Control of S. alterniflora (2022–2025), aiming to reduce S. alterniflora’s expansion and bolster the resilience of coastal ecosystems. Effective management hinges on up-to-date information about S. alterniflora’s distribution and preferred habitats. Consequently, timely and precise actions are critical to protect coastal wetlands and ensure sustainable development in the affected areas.
Remote sensing technologies offer a faster, more accurate, and cost-effective solution for monitoring invasive vegetation, particularly in remote coastal landscapes. By integrating satellite imagery, geographic information systems (GIS), and cloud computing, these methods enable efficient detection and tracking of invasive species. Previous studies employing Landsat imagery have successfully delineated the nationwide distribution of S. alterniflora in China’s coastal regions [12,13,14]. Nevertheless, the 30 m spatial resolution of Landsat data constrains detailed analysis of smaller infestations, which may lead to the underestimation of invasion-prone areas, particularly in fragmented or early-stage invasion zones. Although high-resolution commercial satellite images are effective for regional assessments, their high cost and limited temporal coverage pose significant barriers, making it difficult to track invasion dynamics over time. Open-access Sentinel imagery, offering 10 m resolution and frequent revisits, has gained popularity for coastal wetland mapping [15]. While S. alterniflora mapping with Sentinel-2 has been explored [16,17], most studies have relied on single-time observations, lacking multi-temporal analyses to document long-term invasion trajectories. Moreover, persistent cloud cover can undermine continuous optical data acquisition, which may have resulted in data gaps, particularly in regions with frequent cloud obstruction. This challenge can be mitigated by merging Sentinel-1 Synthetic Aperture Radar (SAR) data with Sentinel-2 optical imagery, capitalizing on SAR’s all-weather capabilities and optical sensors’ rich spectral information—an approach that significantly improves classification accuracy. Furthermore, research utilizing multitemporal Sentinel-1 and Sentinel-2 datasets has demonstrated their utility in monitoring S. alterniflora at local scales [1,18]. However, few studies have systematically applied these integrated datasets across a broader spatial and temporal scale to capture invasion dynamics and predict future risk areas. This study integrates Sentinel-1 SAR and Sentinel-2 optical imagery to enhance classification accuracy, leveraging SAR’s all-weather capabilities and optical sensors’ spectral richness. The proposed multi-temporal analysis (2016–2022) using object-based random forest classification systematically tracks the spatiotemporal dynamics of S. alterniflora, addressing gaps in previous studies that relied on single-time observations. Furthermore, MaxEnt modeling identifies key environmental drivers and delineates high-risk invasion zones, offering predictive insights beyond static distribution mapping. These advancements establish a comprehensive, data-driven monitoring framework to inform targeted management strategies for mitigating S. alterniflora invasions.
Recent work has indicated that incorporating phenological features derived from multi-temporal Sentinel imagery markedly enhances the spectral differentiation of various plant species [19,20]. Tian et al. (2020) presented the Ppf-CM method, which uses spectral indices from green-up and senescence phases to reliably distinguish S. alterniflora from neighboring vegetation [21]. Nevertheless, creating composite images for these phenological periods by aggregating all available pixels over a predefined time window can introduce inaccuracies due to variability in vegetation growth patterns and human observation errors. This issue is particularly pronounced during the early stages of growth or senescence, where unstable reflectance characteristics inject significant noise into the final products. Identifying the specific month when S. alterniflora exhibits the strongest spectral contrast from other plant species—based on vegetation indices—can substantially reduce these complications. This targeted strategy sharpens S. alterniflora’s spectral profile, thereby improving classification accuracy. Google Earth Engine (GEE) offers an advanced platform for pixel-level phenological analysis [22], providing large-scale, cloud-based access to diverse satellite datasets. Its capabilities support efficient processing and analysis of extensive time-series data, yielding powerful tools to track vegetation phenology and its changing dynamics. Leveraging time-series Sentinel imagery to detect phenological patterns and monitor the spatial-temporal evolution of S. alterniflora is fundamental for sound ecological management and conservation strategies.
With its formidable invasive capacity, S. alterniflora now occupies a wide range of China’s coastal regions [23], and once established, it proves extremely difficult to eradicate [24]. Consequently, integrating species-specific traits with environmental variables is crucial to forecasting S. alterniflora’s spatial distribution and enabling prompt interventions [25]. Ecological niche models are widely used to predict species distributions. Notable examples include the genetic algorithm for rule-set production (GARP) [26], ecological niche factor analysis (EnFA) [27], bioclimatic model (BIOCLIM) [28], DOMAIN [29], and maximum entropy modeling (MaxEnt) [30]. By combining spatial distribution data and environmental variables, these models simulate ecological requirements and forecast species distributions across diverse temporal and geographical scales to pinpoint potential invasion zones [25]. MaxEnt, known for its low sensitivity to sample bias, strong robustness, and high predictive accuracy, is widely applied in invasive species habitat analysis and ecological niche modeling [28]. Its ability to effectively integrate presence-only data with environmental variables [31] enables the identification of key drivers and high-risk invasion zones, providing predictive insights beyond static distribution mapping. Multiple studies have highlighted MaxEnt’s value in modeling species distributions: for instance, Blanco-Sacristán et al. used MaxEnt to map potential mangrove habitats in the Red Sea [32], while Charrua et al. employed it to identify suitable mangrove locations in Mozambique [33]. In China, Zhang et al. utilized MaxEnt to predict S. alterniflora’s likely distribution along the nation’s coastline, revealing its northward expansion, especially in Bohai Bay [34]. Nonetheless, no study has specifically examined S. alterniflora’s invasion status in Bohai Bay, making timely identification of its current extent and prediction of future spread vital for managing ecological risks.
As S. alterniflora continues to migrate northward in China, its invasion poses a greater threat to Bohai Bay’s fragile coastal ecosystems due to harsher climatic conditions, unique tidal regimes, and critical migratory bird habitats. Unlike southern estuaries, northern wetlands have lower resilience to invasion, making ecosystem disruptions more severe. Previous studies have primarily focused on southern regions, often relying on single-source optical imagery and pixel-based classification, which struggle with cloud cover and complex wetland landscapes. Research on northern expansion trends, invasion drivers, and human impact in Bohai Bay remains limited. Therefore, understanding its invasion trends and potential distribution is paramount. This study integrates Sentinel-2 imagery and phenological analysis to derive optimal vegetation spectral features, complemented by polarization data from Sentinel-1. By applying an object-based random forest classification approach and MaxEnt, we monitored S. alterniflora’s spread and predicted its future invasion zones in Bohai Bay between 2016 and 2022. The key objectives are (1) quantifying the progression and spatial heterogeneity of S. alterniflora’s invasion from 2016 to 2022; (2) forecasting potential distribution regions and high-risk invasion zones; and (3) pinpointing the environmental variables driving S. alterniflora dynamics, with particular emphasis on the impact of human activities.

2. Materials and Methods

2.1. Study Area

Bohai Bay, located in northern China (117°25′–123°45′E, 35°03′–41°06′N), spans the provinces of Liaoning, Hebei, and Shandong, as well as the municipality of Tianjin. The region experiences a warm temperate continental monsoon climate, with an average annual temperature of 10.7 °C and precipitation ranging between 500 and 600 mm. The study area, extending 10 km inland and offshore along the Bohai Bay coastline, is depicted in Figure 1. It encompasses 11 National Wetland Nature Reserves, including the Yellow River Delta (YRD) and the Changli Gold Coast (CGC). The elevation across the region is generally below 10 m, apart from man-made structures such as roads and dikes. The flat topography and high groundwater table contribute to the prevalence of wet and saline soils, predominantly derived from sedimentary and loess parent materials [35]. Typical wetland plant communities include reeds (Phragmites australis), S. alterniflora, Suaeda spp., and Tamarix spp. The region’s favorable natural conditions support diverse coastal wetland resources, serving as breeding grounds for waterfowl and critical stopover points for migratory birds. These ecosystems play an essential role in maintaining biodiversity and ecological stability, highlighting the urgent need to address invasive species threats.

2.2. Data and Processing

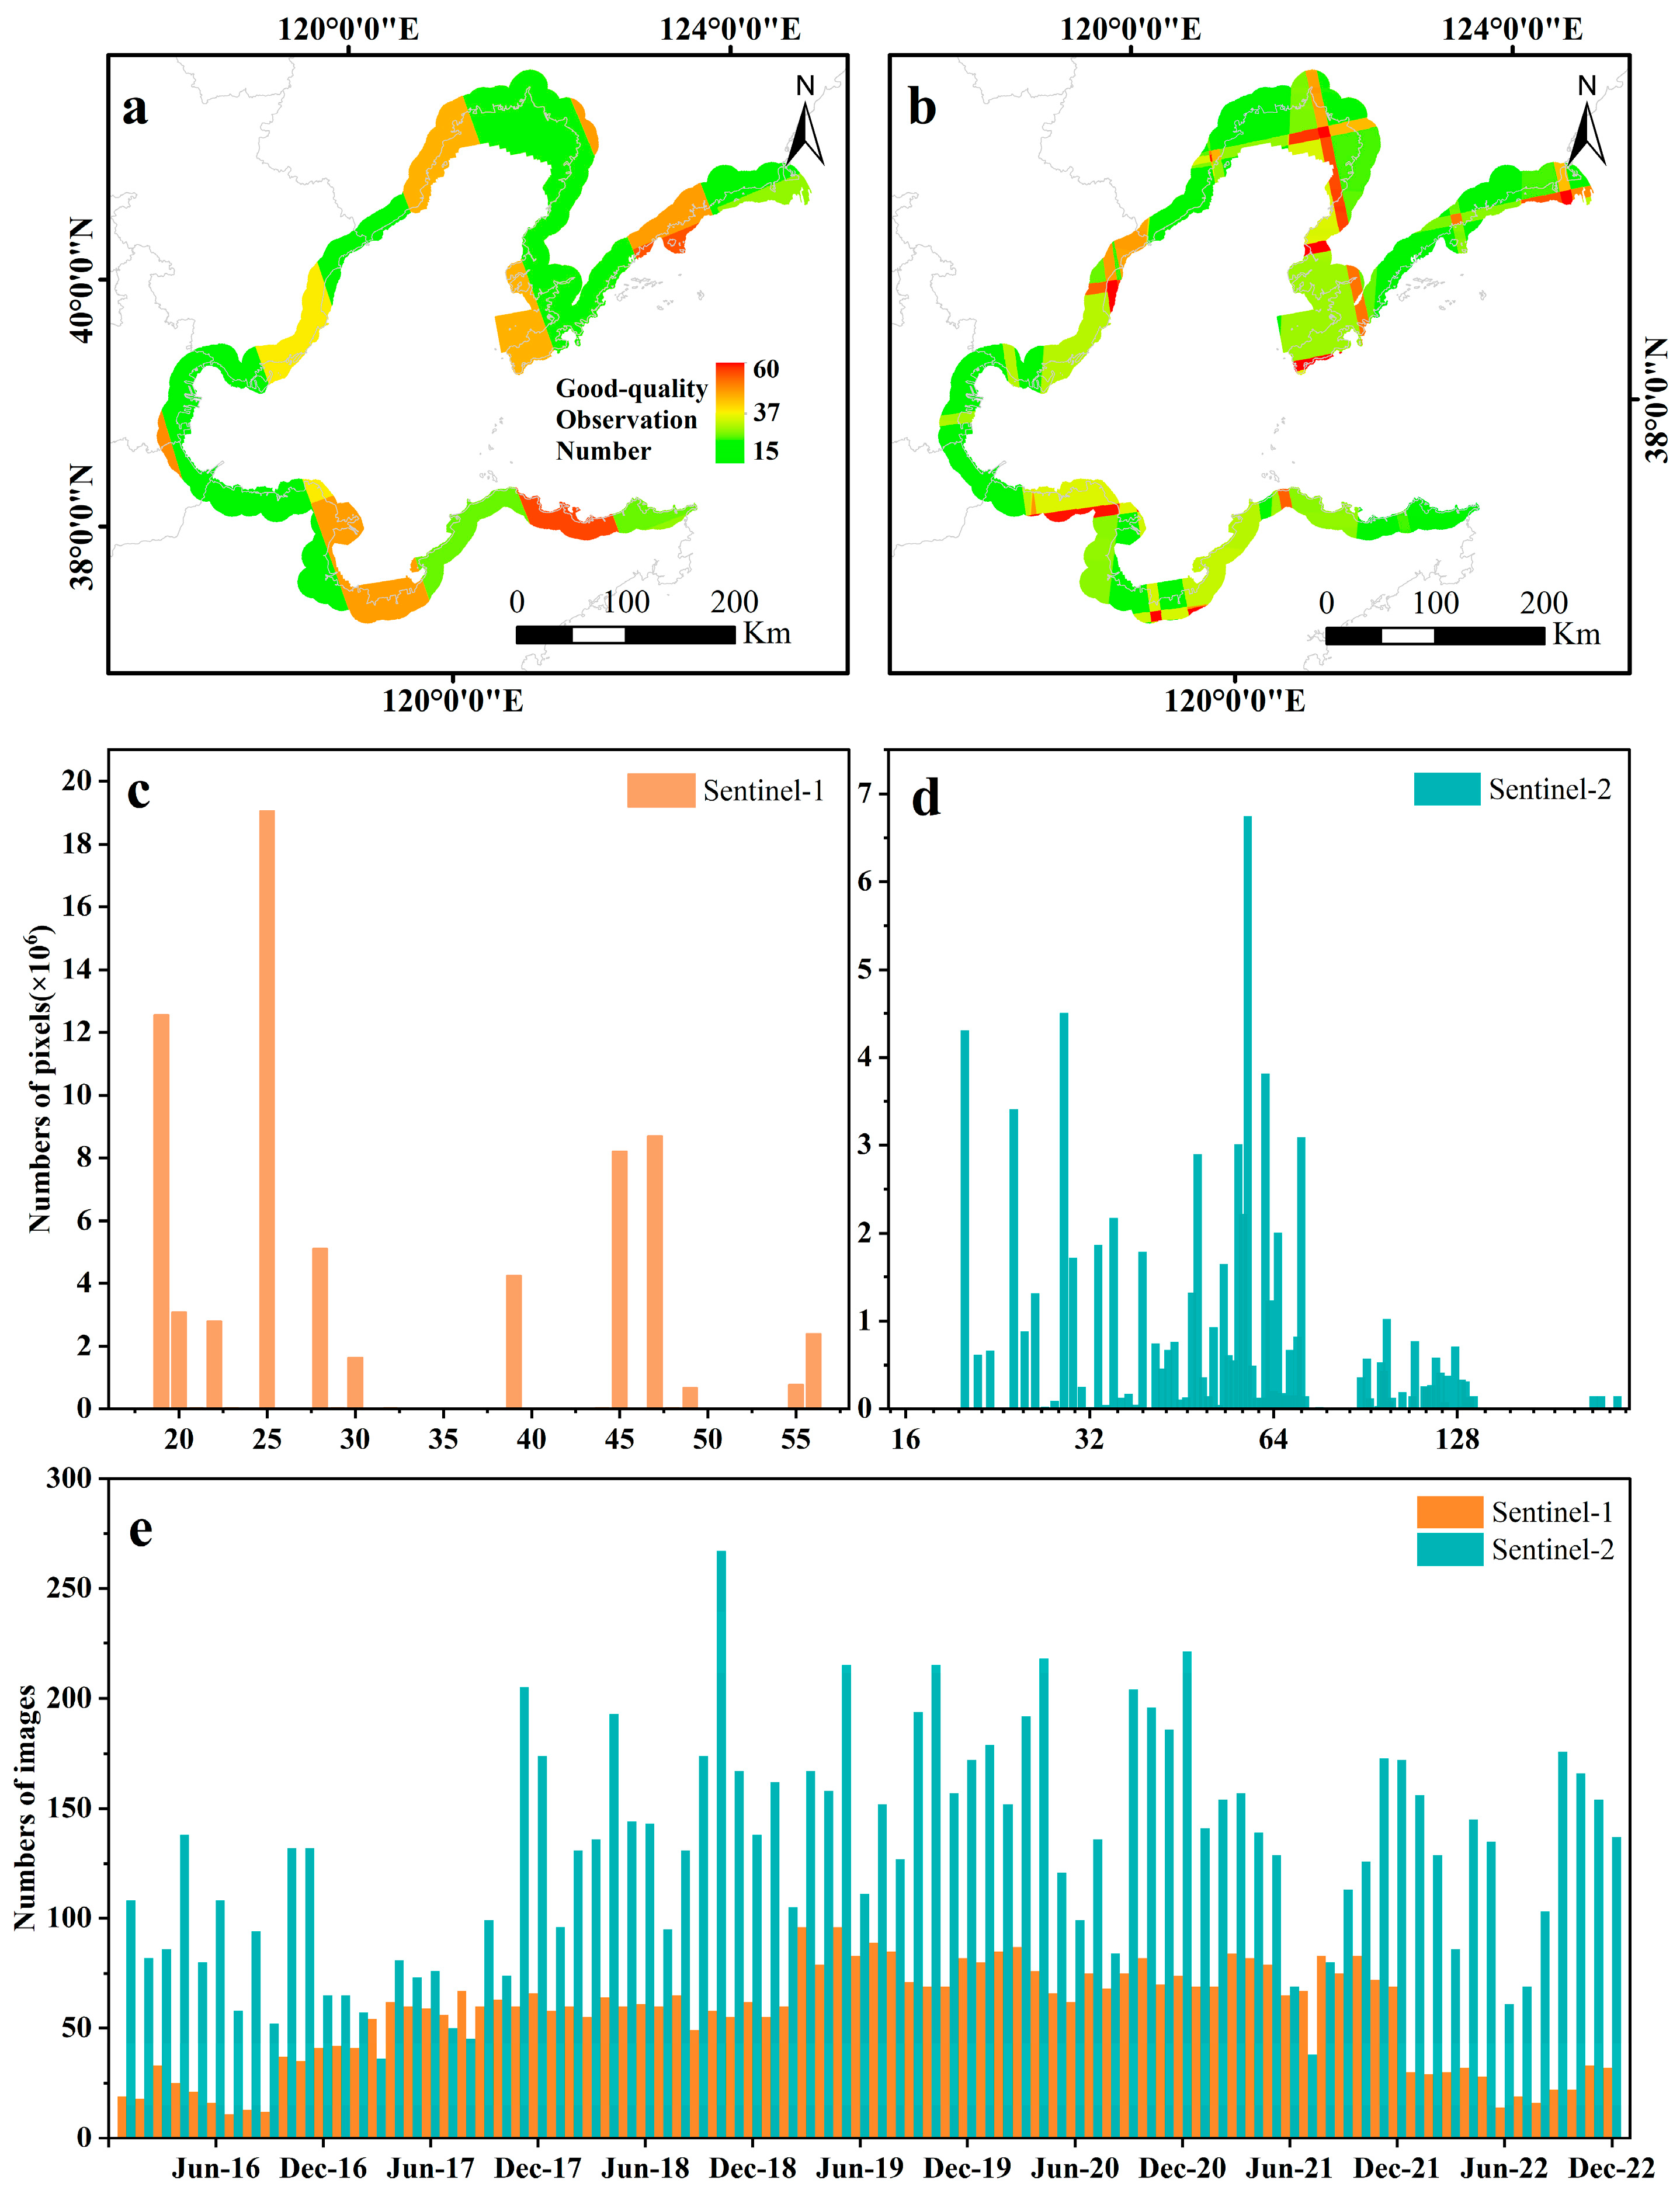
2.2.1. Satellite Data

A total of 15,630 Sentinel-2 Level-2A image products spanning 2016 to 2022 were acquired via GEE platform. To ensure consistency, all bands were resampled to a spatial resolution of 10 m, encompassing the seven required spectral bands (B2, B3, B4, B5, B6, B7, and B8). Bad-quality observations caused by cloud cover were masked using the QA60-bit mask band of each Sentinel-2 image.
Additionally, 4716 Sentinel-1 C-band ground range-detected (GRD) SAR images were obtained from the GEE platform. To suppress the speckle noise inherent in SAR imagery, each Sentinel-1 image underwent processing with a refined Lee filter. Dual-polarization bands—vertical transmit and vertical receive (VV) and vertical transmit and horizontal receive (VH)—were employed for wetland classification. All Sentinel-1 images were preprocessed on the GEE platform, which involved the following steps: updating orbital metadata using precise orbit files, removing boundary and thermal noise from GRD images, performing radiometric calibration, and applying terrain correction.
The spatial and temporal distribution of Sentinel-1/2 images covering the study area is illustrated in Figure 2. Approximately 85.8% of independent pixels recorded over 25 high-quality observations, as shown in Figure 2c,d. The spatial distribution and histograms of valid observations for each pixel are presented in Figure 2a–d, further underscoring the comprehensive coverage and data quality.

2.2.2. Sample Data

Field Survey Data: From 2021 to 2023, three field surveys were conducted to investigate the distribution of S. alterniflora in representative areas along the Bohai Bay coast, including Tianjin and the YRD. These surveys identified the primary coastal wetland species as S. alterniflora, reeds (Phragmites australis), Suaeda spp., and Tamarix spp. Based on these findings and the national salt marsh classification dataset, coastal wetland vegetation was categorized into two main groups: S. alterniflora and non-S. alterniflora. The latter encompassed reeds, Suaeda spp., and Tamarix spp. The research team utilized handheld GPS devices(The GPS data were collected using a Garmin Etrex 221x (Garmin Ltd., Olathe, KS, USA), unmanned aerial vehicles (A DJI Mavic 3M UAV (DJI Innovation, Shenzhen, China) was used for aerial data collection.), and ground vegetation grids (Vegetation coordinates were recorded using the GVG mobile software, a scientific data collection application custom-developed and operated by the Global Agricultural Remote Sensing Monitoring Team at the Chinese Academy of Sciences (CAS), Beijing, China.) for sample collection, supplemented by onsite investigations. Drone photography facilitated the simultaneous acquisition of diverse vegetation samples at high spatial resolutions.
Visual Interpretation of Google Earth Images: To ensure comprehensive spatial-temporal coverage, 2400 additional sample points were collected through visual interpretation of high-resolution Google Earth images. These sample points were integrated into the GEE platform to extract vegetation-specific information. Samples corresponding to distinct phenological periods were selected to enhance accuracy. For instance, S. alterniflora samples were collected during their key phenological period (green period). Samples deemed ineffective or redundant—particularly those from 2022—were excluded, resulting in a refined reference dataset. The final dataset comprised 1550 field samples, including 456 S. alterniflora, 300 Suaeda spp., 288 reeds, 276 Tamarix spp., and 230 tidal flat samples. The remaining 850 samples represented forests, cultivated land, and artificial surfaces.
Historical Sample Data Reconstruction: Field samples from 2016 to 2020 were unavailable due to temporal constraints. These data were reconstructed through manual interpretation of high-resolution imagery on the GEE platform and corroborated with the existing research literature. Vegetation and land cover sample points for these years were iteratively updated via monthly manual visual modifications, then validated against 2023 field survey images.
All sample points adhered to strict criteria, ensuring that each quadrat (0.001 km × 0.001 km) contained a single vegetation type, thereby minimizing classification errors from mixed pixels. To maintain diversity and richness, approximately 400 samples were collected annually. Ultimately, a stratified random sampling approach was employed, allocating 70% of samples as training data and 30% for validation.

2.2.3. Environmental Data

Building on prior research and the ecological characteristics of S. alterniflora, 33 environmental variables were selected for analysis (Table 1). To meet the requirements of MaxEnt, all environmental variables were standardized to a unified coordinate system (WGS1984) and resampled to a 30 m resolution. The processed data were then converted into ASCII format for subsequent analysis.

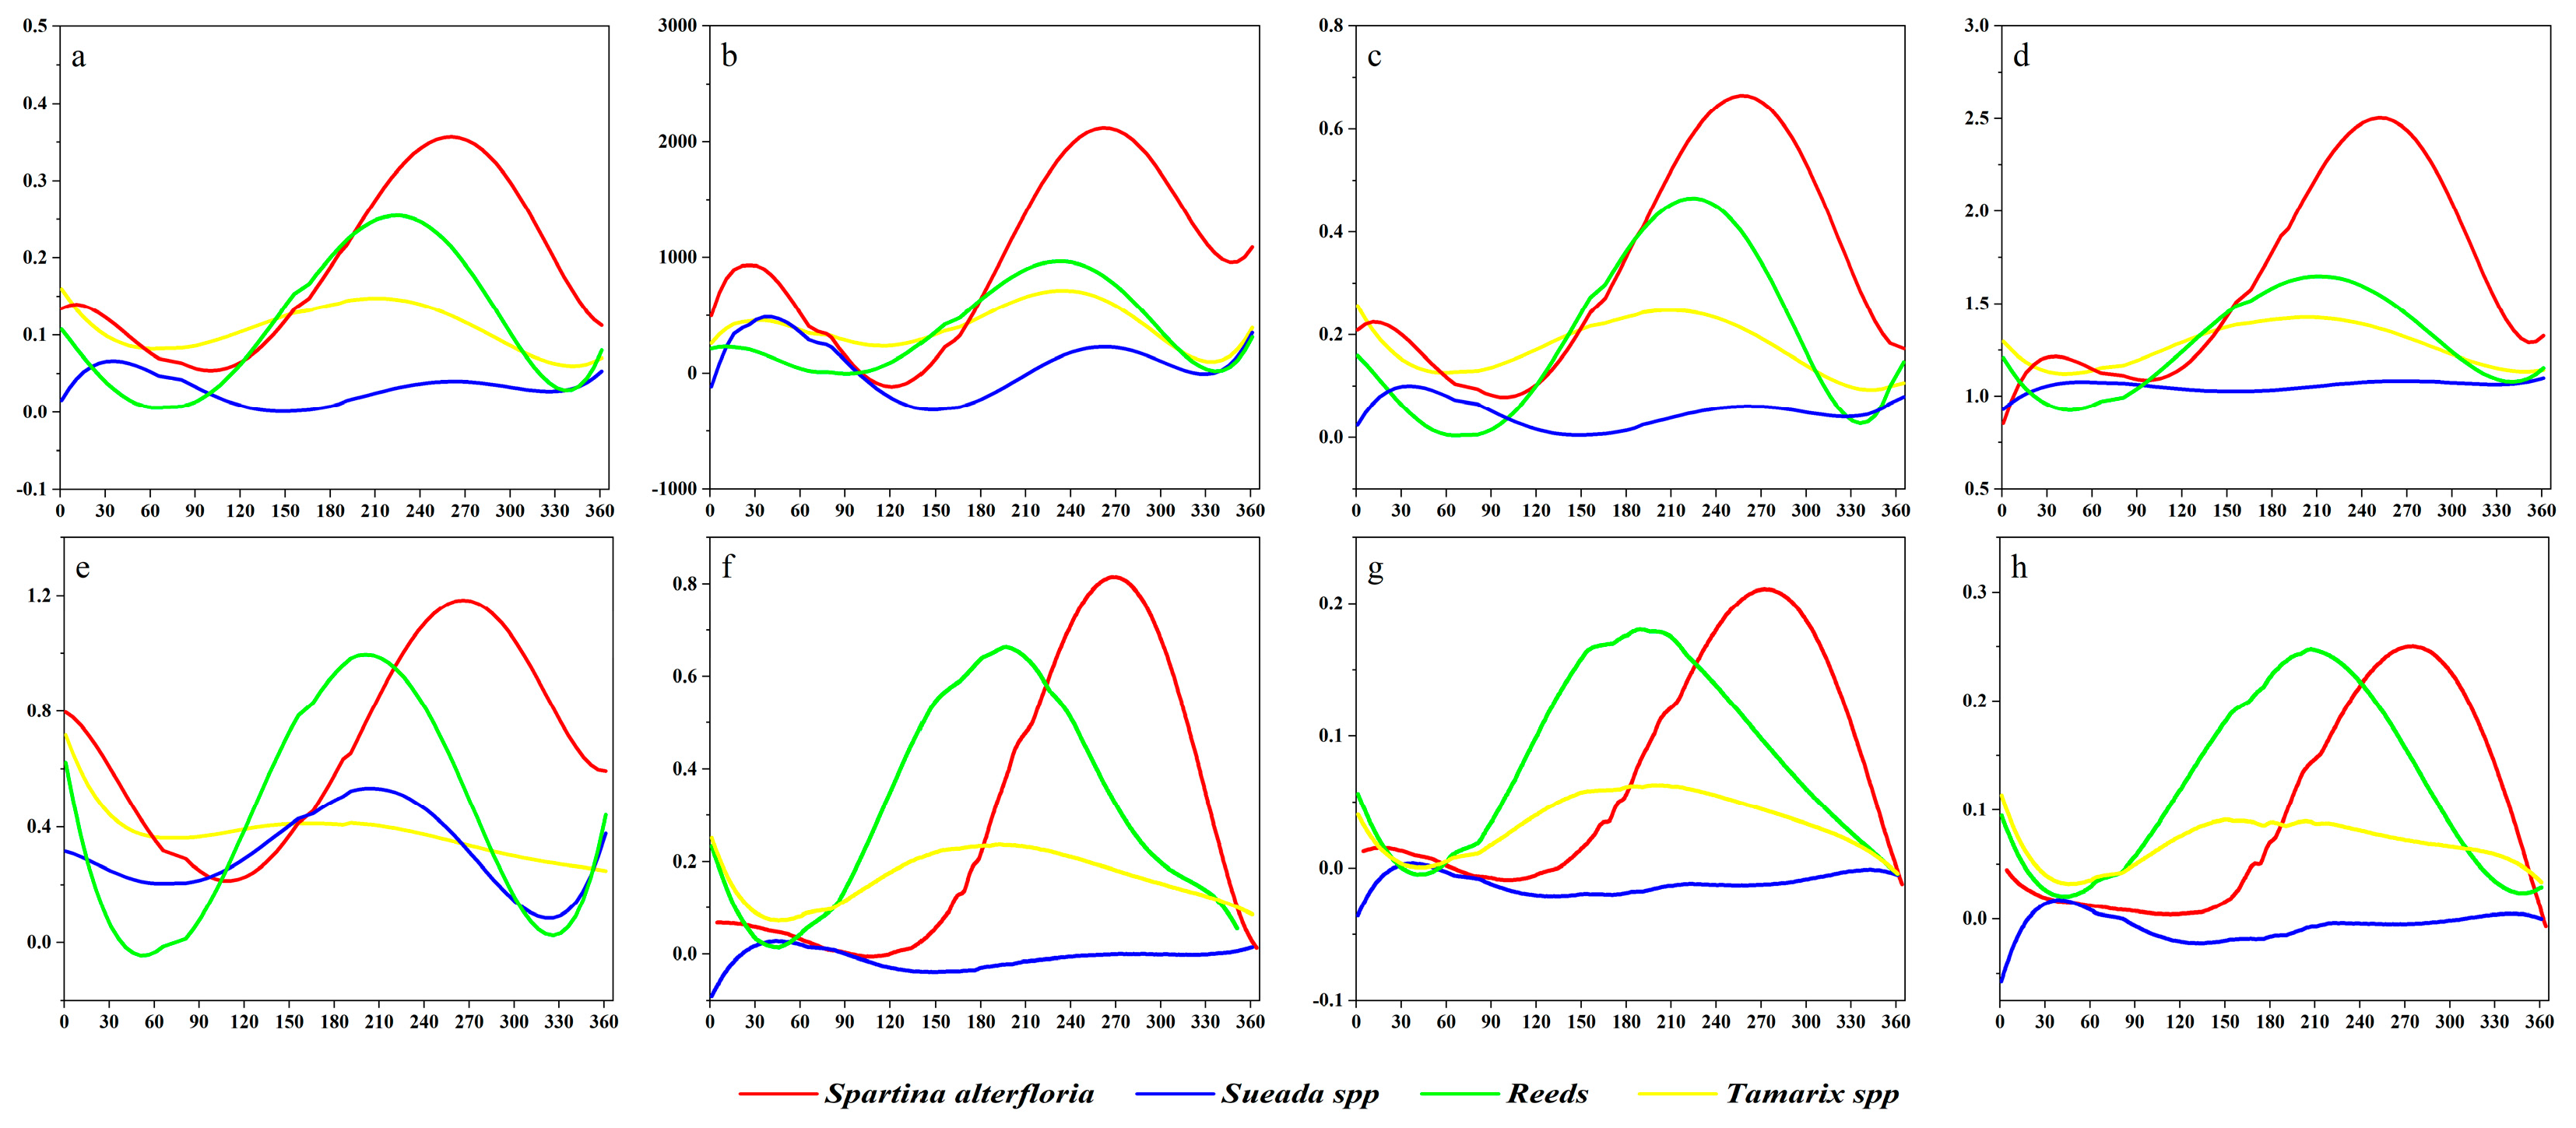
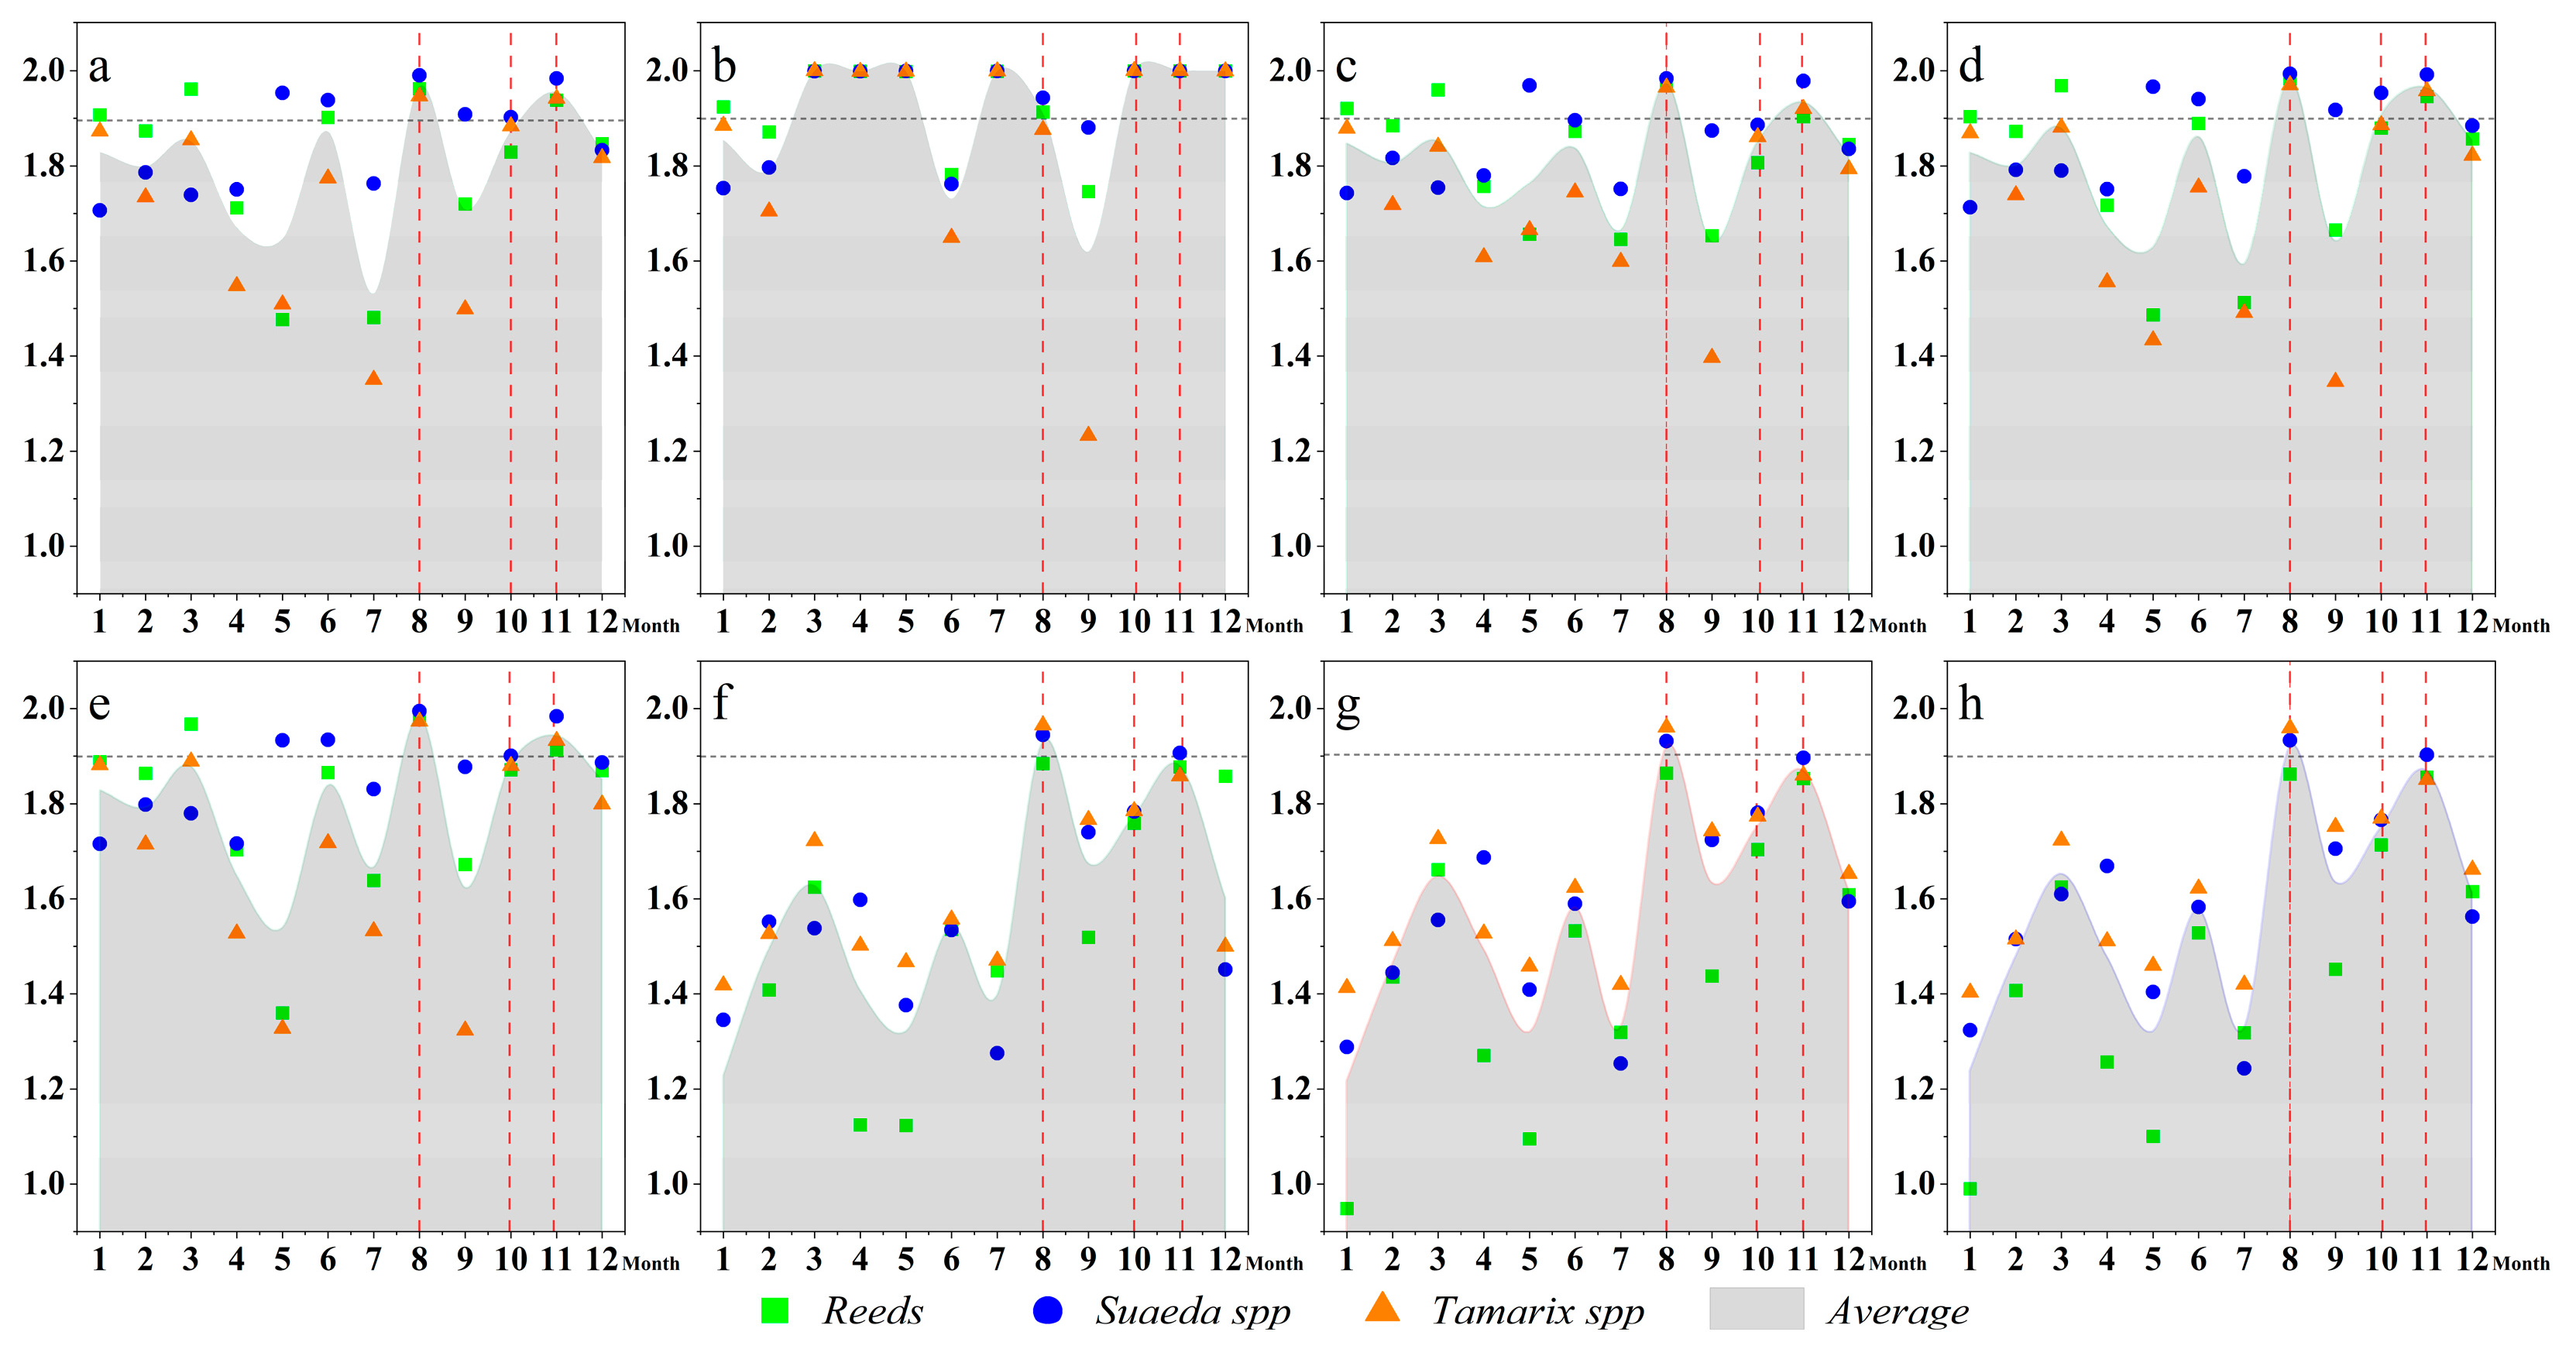
2.3. Generation of Feature Set

A combination of remote sensing indices, such as the normalized difference vegetation index (NDVI), the difference vegetation index (DVI), the difference vegetation index (EVI), the green chlorophyll index (GCI), and the ratio vegetation index (RVI), which are effective at identifying water bodies and flooded vegetation, can be used. Additionally, the red-edge bands of Sentinel-2 satellites are crucial for extracting S. alterniflora due to their sensitivity to chlorophyll content, vegetation structure, and biomass, allowing for more accurate differentiation in complex wetland ecosystems. Three red-edge band indices, including chlorophyll index using red edge (CIre), normalized difference red edge (NDre1), and normalized difference red edge 2 (NDre2) were also considered.
Time-series curves of nine vegetation indices were calculated for four vegetation types in the study area, spanning the period from 1 January to 31 December 2022 (Figure 3). Notably, the vegetation indices of S. alterniflora exhibited clear separability from those of other vegetation types. To quantitatively evaluate this separability across different months, the Jeffries–Matusita (JM) distance [15] was applied (Figure 4). Previous studies have suggested that a JM distance exceeding 1.9 indicates superior class separability. Based on our analysis, the months of August, October, and November were identified as the optimal time periods for accurately extracting S. alterniflora.
The feature set utilized for S. alterniflora classification in this study comprises three parameters derived from the polarization characteristics of Sentinel-1 SAR data, eight spectral-derived indices from Sentinel-2 imagery, and the seven original spectral bands of Sentinel-2, as detailed in Table 2.

2.4. S. alterniflora Detection and Prediction

2.4.1. Object-Based Random Forest Algorithm

The object-based random forest algorithm represents an advanced adaptation of the traditional random forest classifier, as it is specifically tailored for remote sensing image analysis tasks [36,37]; integrating object-based analysis, this method effectively incorporates spatial and contextual information, facilitating the classification of complex image datasets [9,38]. Initially, the simple non-iterative clustering (SNIC) algorithm was applied to generate superpixel segmentations. Key parameters for segmentation were carefully calibrated, including compactness, connectivity, and split scale, which were set as follows: compactness = (10), connectivity = (8), and split scale = (40).
Following segmentation, the random forest classifier was employed to perform image classification. The feature set was used as the inputs. The random forest classifier parameters were configured with 100 trees, and the number of variables per split was set to the square root of the total number of input features. The sample data were randomly divided into 70% training data and 30% validation data. Subsequently, visual interpretation corrections were implemented to refine the classification by addressing misclassified objects, thereby enhancing the accuracy of the results. Confusion matrices were generated for each temporal period to validate the resulting S. alterniflora distribution maps from 2016 to 2022.

2.4.2. Accuracy Assessment

To evaluate the performance of the object-based random forest algorithm, four standard metrics were employed: producer’s accuracy (PA), user’s accuracy (UA), overall accuracy (OA), and the kappa coefficient. These metrics provided a comprehensive assessment of classification performance. The formulas for the evaluation metrics are outlined below:
PA = X ij X i * ,
UA = X ij X i * ,
OA = S d n ,
Kappa = OA ( X i * × X * j ) n 2 1 ( X i * × X * j ) n 2 ,
where X ij represents the count of samples classified as land cover type i that actually belong to land cover type j; X i * signifies the total count of samples classified as land cover type i; X * j represents the accurate count of samples correctly classified as the true land cover type j.

2.4.3. Detecting Potential Areas of S. alterniflora Using MaxEnt

The objective of the MaxEnt model is to find a conditional probability distribution P y x , where x is the input, and y is the predicted class. This is performed by maximizing the entropy under the given constraints, leading to the following formula:
P y x = 1 Z x exp ( i = 1 n λ i   f x , y ) ,
where
  • P y x : The probability of class y given input x ;
  • Z x = Σ y exp Σ = 1 n λ i   f x , y : The partition function, ensuring the probabilities sum to 1;
  • λ i : Model parameters or weights for each feature function, learned during training;
  • f x , y : Feature functions that capture relationships between input x and output y;
  • n : Number of feature functions.
(1)
Model Operation
The predictive accuracy of MaxEnt is heavily influenced by the quality and quantity of the input species distribution data. In this study, the distribution points of S. alterniflora were derived from GEE image segmentation results for 2022, encompassing a total of 79 sample points. A zonal prediction model for S. alterniflora was constructed using these distribution points alongside environmental variables extracted through remote sensing. Input data were formatted as CSV and ASC files for integration into the MaxEnt framework.
To mitigate overfitting due to multicollinearity among the 33 environmental variables, a two-step refinement process was undertaken. Initially, the contribution of each factor was assessed using the jackknife method in MaxEnt, and variables with negligible contributions were excluded. Subsequently, Pearson correlation analysis was applied to the remaining variables, with highly correlated factors (r > 0.8) eliminated if their individual contributions were low. This iterative approach resulted in the selection of nine key environmental variables (Table 3) that exhibited significant influence on the suitability predictions for S. alterniflora.
Prior to running the model, the maximum number of iterations was set to 500, and the convergence threshold was adjusted to 10−5. To train and validate the model, 75% of the dataset was randomly allocated for training, while the remaining 25% served as a test subset [39,40]. The jackknife test was employed to identify the environmental variables contributing most to predictive accuracy. Additionally, the model’s performance was evaluated using the area under the receiver operating characteristic (ROC) curve (AUC). An AUC score, ranging from 0 to 1, serves as an indicator of model precision, with higher values reflecting superior predictive capability.
(2)
Suitability Zone Classification
The suitability index (SI) for S. alterniflora was categorized into four distinct zones using the natural break-point method [30]. These zones were defined as follows: non-suitable zone (SI < 0.05), low suitability zone (0.05 ≤ SI < 0.2), moderate suitability zone (0.2 ≤ SI < 0.6), and high suitability zone (0.6 ≤ SI < 1). This classification framework enhances the precision of suitability predictions by systematically refining the environmental variables contributing to MaxEnt. Moreover, it provides a robust basis for delineating the spatial distribution of S. alterniflora, thereby improving the practical applicability of the model in ecological management and conservation efforts.

3. Results

3.1. Accuracy Assessment of S. alterniflora Wetland Maps

The classification accuracy of S. alterniflora maps in the Bohai Sea region from 2016 to 2022 was evaluated using field survey data and validation samples obtained through manual visual interpretation (Table 4). The validation dataset included 2325 points, comprising 664 S. alterniflora samples and 1661 non-S. alterniflora samples. The confusion matrix results demonstrated that the overall accuracy of the object-based random forest classification exceeded 92.1%, integrating multiple parameters. Notably, the producer’s accuracy and user’s accuracy for S. alterniflora were both above 86.6% and 92.1%, respectively. These findings underscore the effectiveness of combining Sentinel-1 and Sentinel-2 imagery, phenological analysis, and joint feature indices in significantly enhancing the classification performance of S. alterniflora.

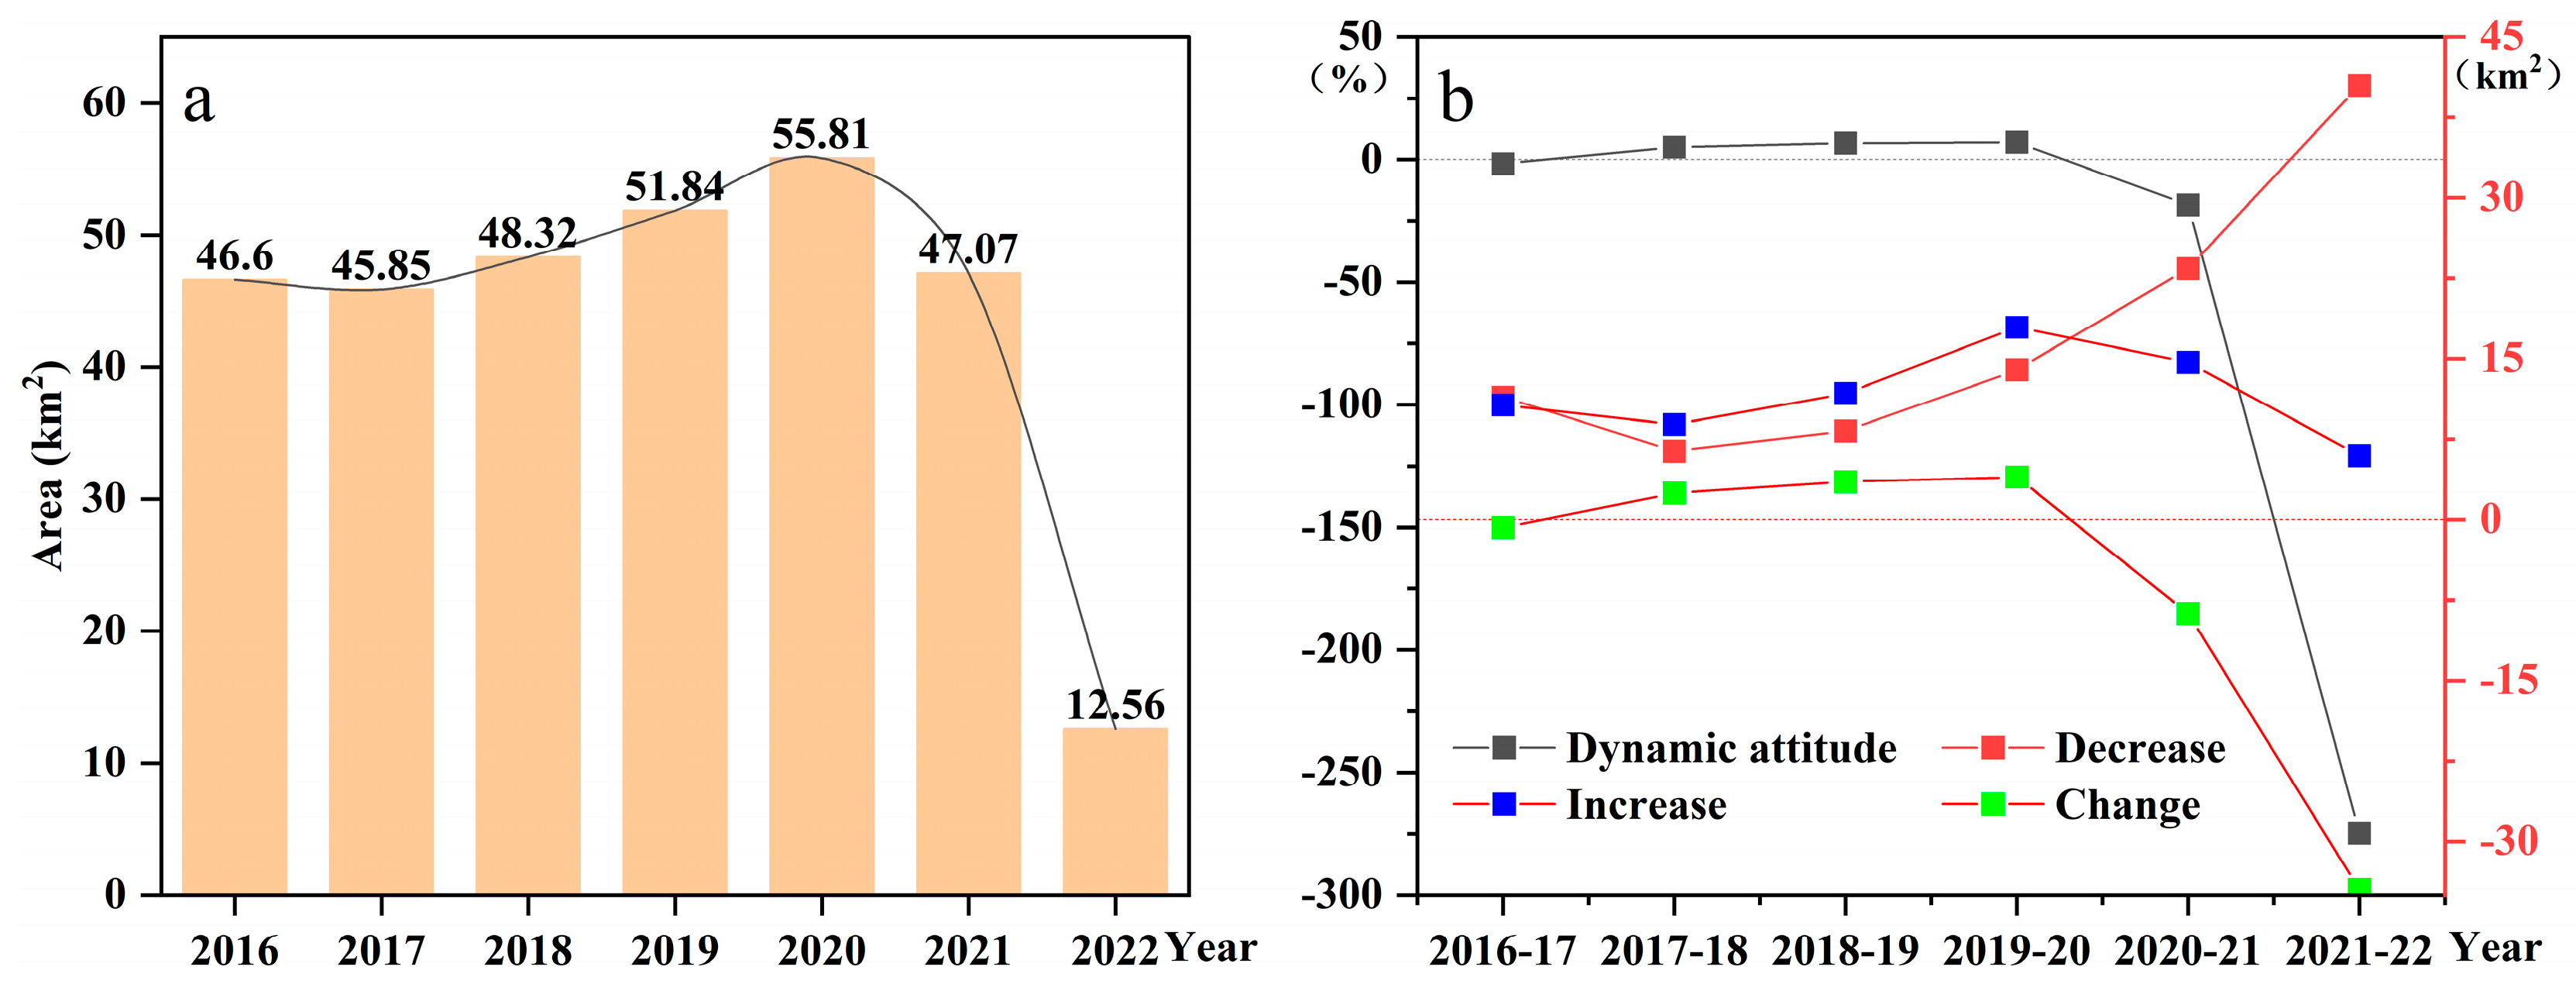
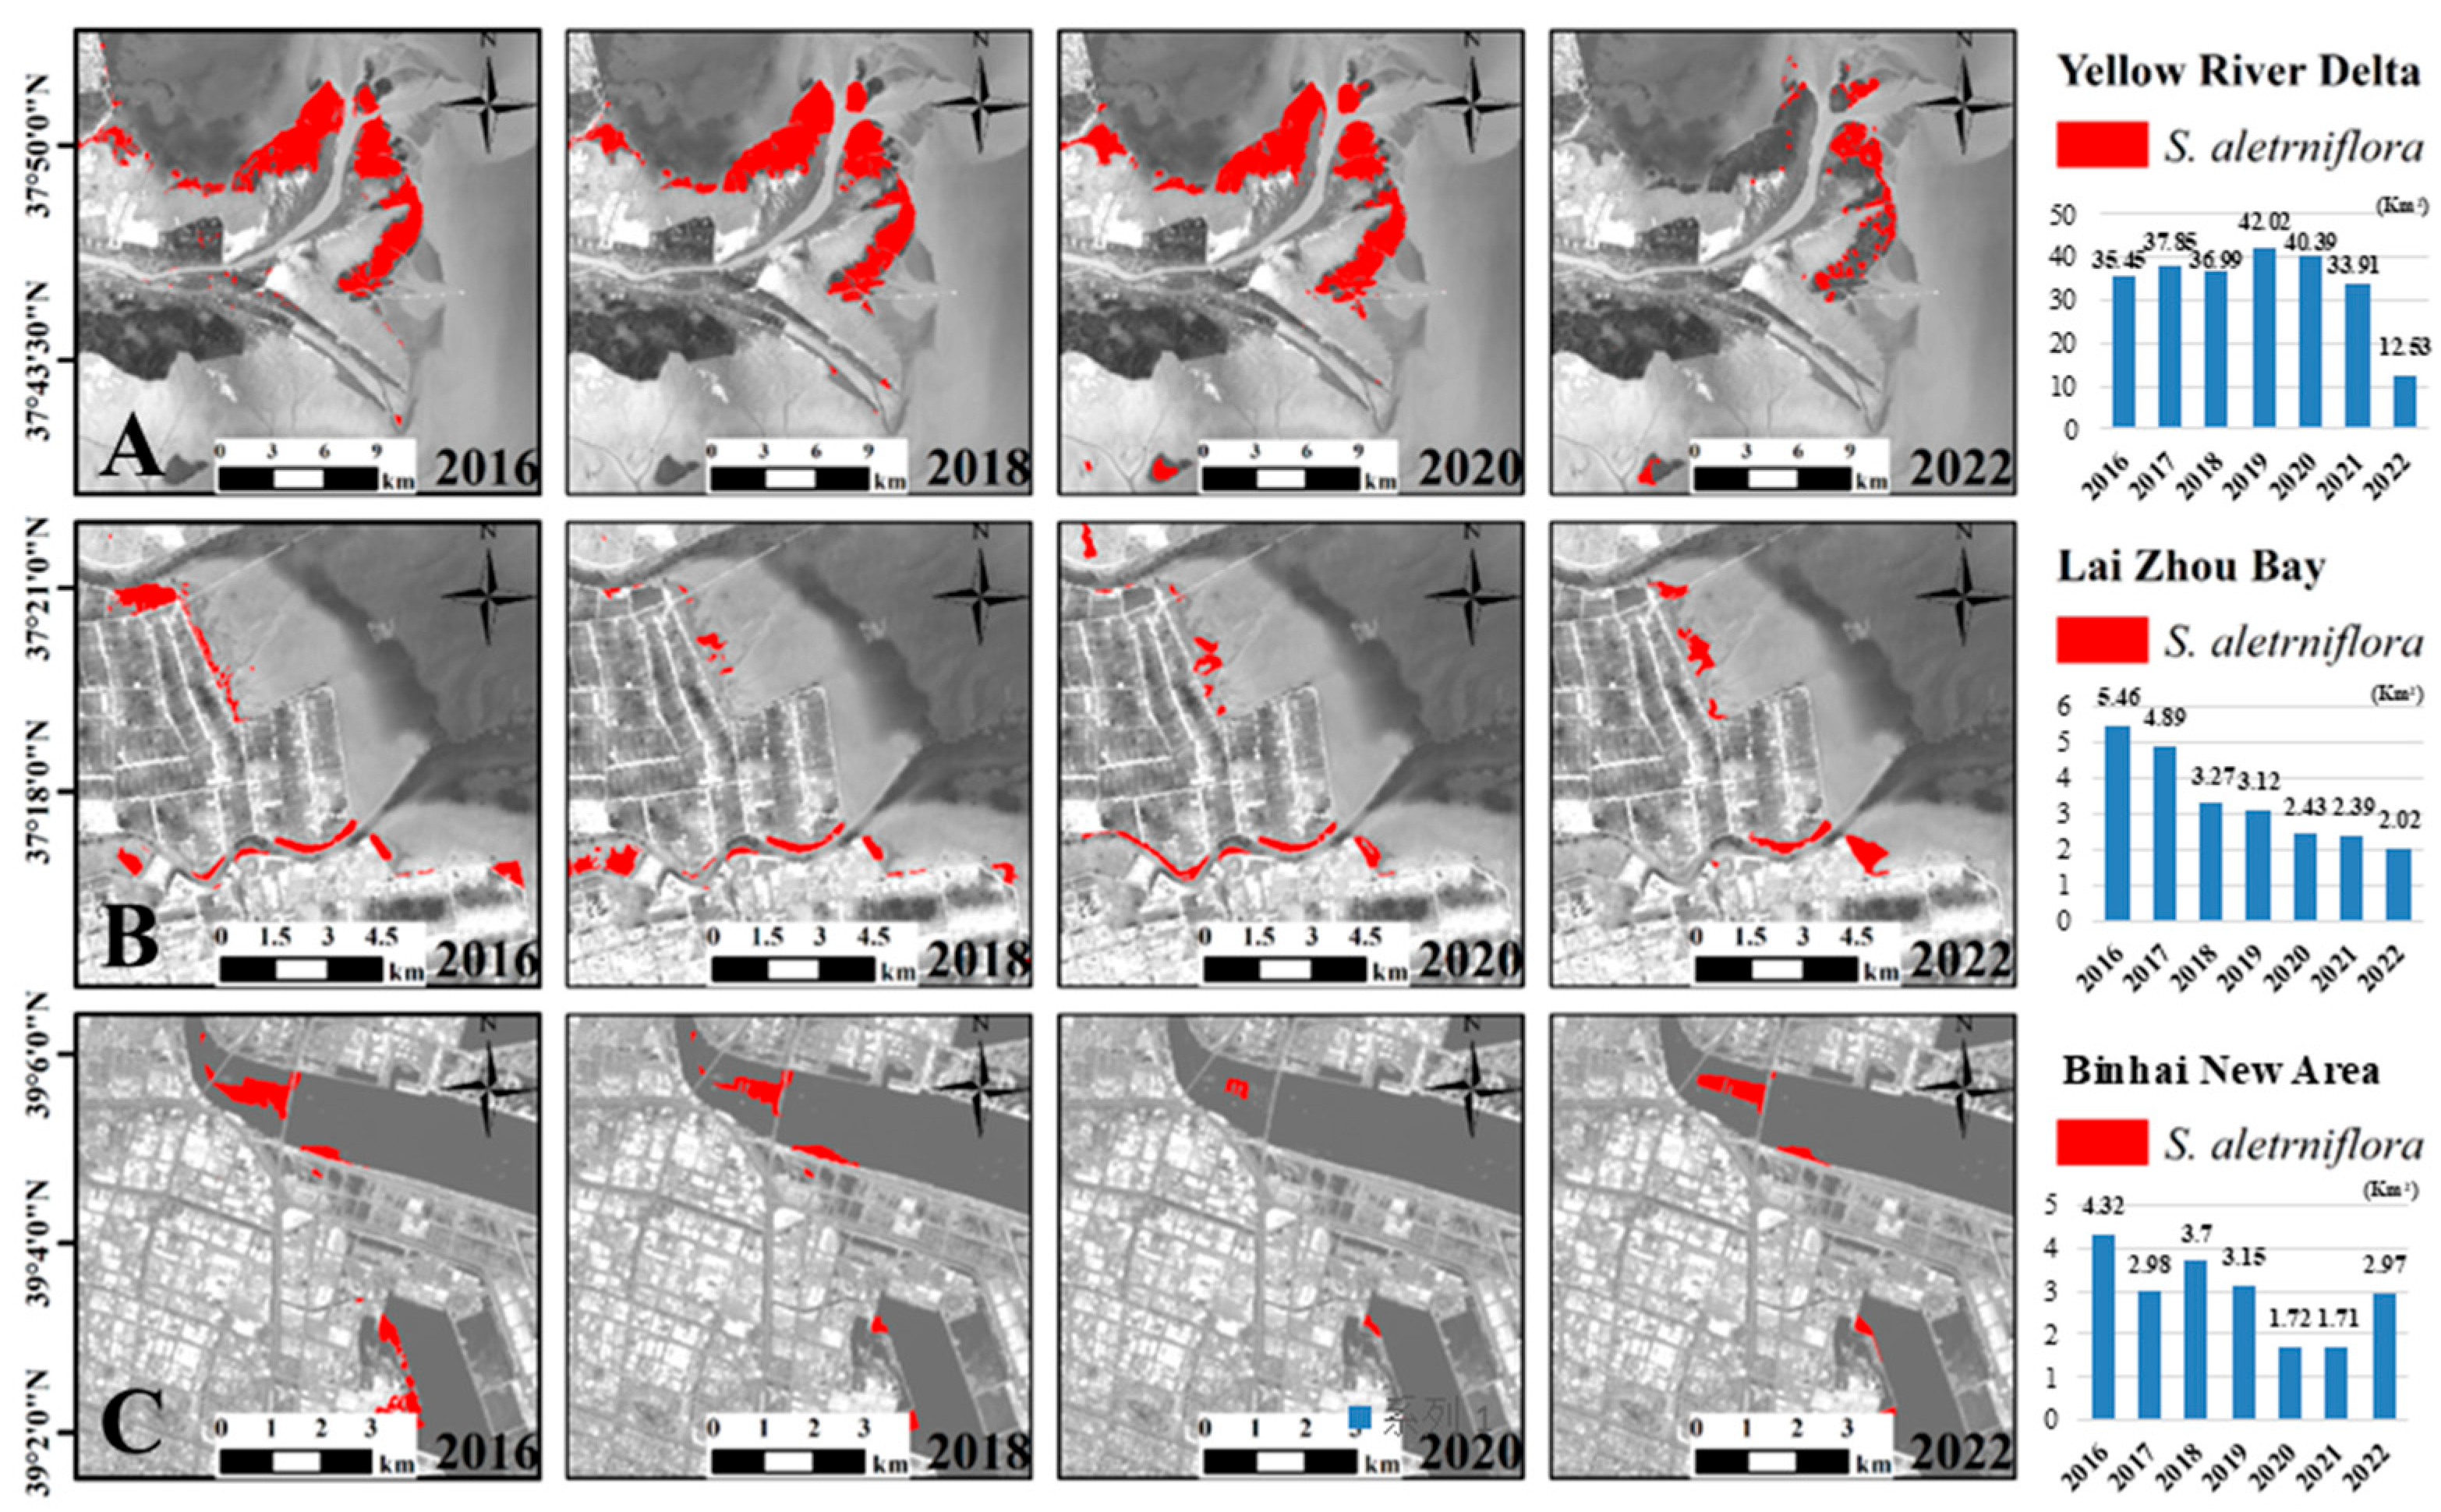
3.2. The Temporal and Spatial Dynamics of S. alterniflora Wetlands from 2016 to 2022

Figure 5 shows that the inter-annual changes of S. alterniflora wetland area has two phases: (1) a small gain from 2016 to 2020 and (2) a large loss from 2020 to 2022.
In 2016, the area covered by S. alterniflora was approximately 46.6 km2, primarily concentrated along both sides of the Yellow River estuary. Extensive patches were observed on the eastern tidal flats of Laizhou Bay and Taiping Bay. Additionally, strip-like patches appeared near the Yongdingxin River Bridge in Tianjin, the estuaries of Ziya Xinhe, and the Duliu River mouth, exhibiting fragmented distributions that gradually aggregated into larger, more contiguous patches. As shown in Figure 5, the spatial extent of S. alterniflora displayed a dynamic trend of expansion over the four-year period. Between 2016 and 2020, the area experienced steady growth, reaching a peak of 55.81 km2 in 2020, with the most significant annual increase (3.97 km2) occurring between 2019 and 2020. This period exhibited an average annual growth rate of 2.80 km2. From 2016 to 2018, clustered patches emerged near the YRD. By 2018, new small patches of S. alterniflora appeared south of the YRD, resulting in a modest increase of 0.87 km2. In 2019, S. alterniflora experienced further expansion, reaching 51.84 km2, with substantial growth in the YRD, increasing from 37.06 km2 in 2018 to 42.07 km2 in 2019—a net growth of 5.01 km2. Sparse patches in the YRD coalesced into stable clusters, encroaching on other wetland vegetation such as reeds and alkali grasses. Additional growth of approximately 1.26 km2 occurred near the southern Yellow River estuary.
However, from 2020 to 2022, a pronounced decline was observed, with the area plummeting to 12.56 km2. The most substantial reduction occurred between 2021 and 2022, amounting to 34.51 km2—a decrease approximately 2.74 times greater than the area in 2022 (see Figure 5b; dynamic attitude = 274%). The YRD saw a marked decline in S. alterniflora, dropping from 40.77 km2 to 11.44 km2, accounting for over 70% of the total reduction. The decline from 2021 to 2022 was particularly striking, representing the largest single-year reduction (34.51 km2) during the study period. The significant decline in S. alterniflora over the past two years can be largely attributed to intensified human activities, particularly targeted management and eradication efforts. Measures such as mechanical removal, chemical treatments, and habitat restoration initiatives have been implemented extensively to control its spread, especially in ecologically sensitive areas. These interventions, driven by growing awareness of the invasive species’ ecological impact, have played a pivotal role in accelerating its reduction.

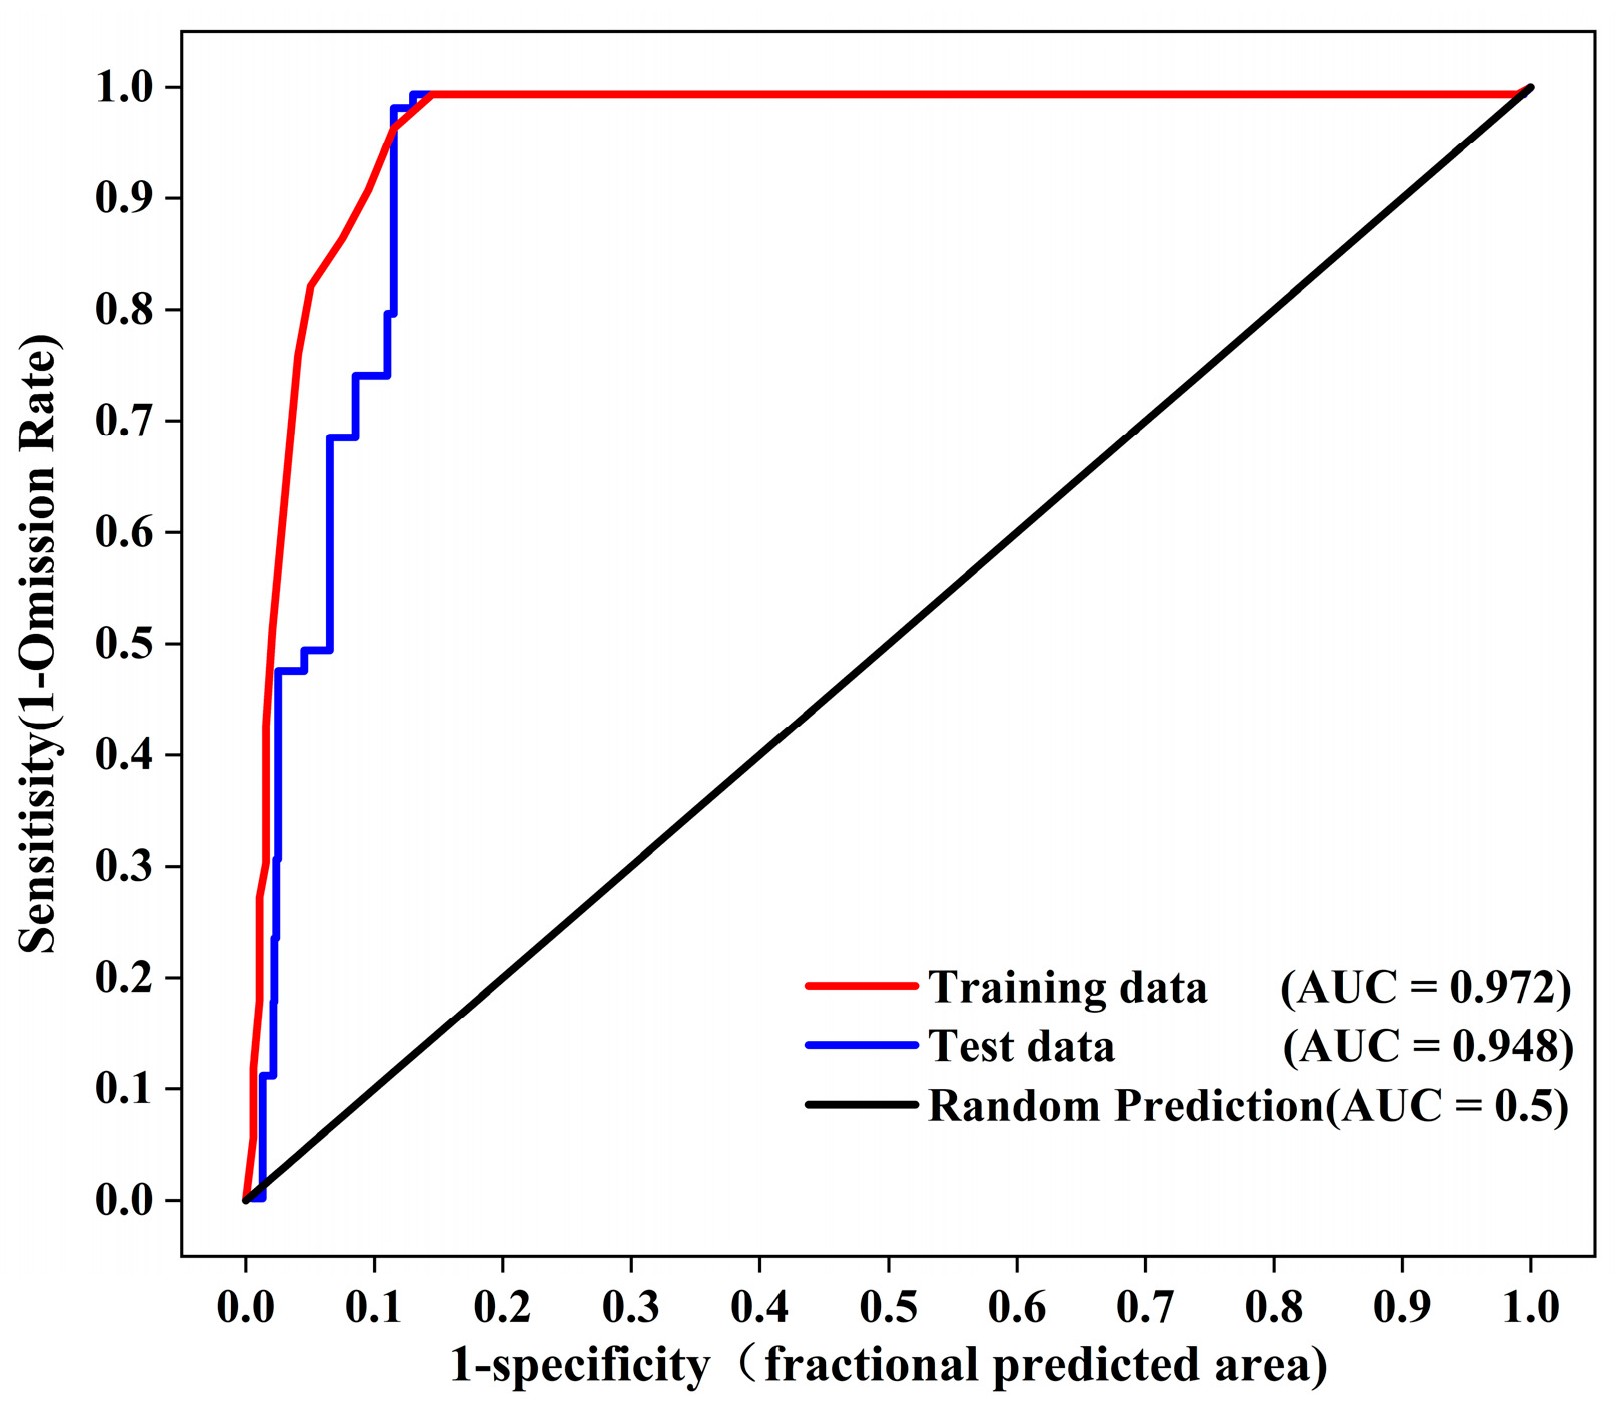
3.3. The Potential Distribution Prediction of S. alterniflora

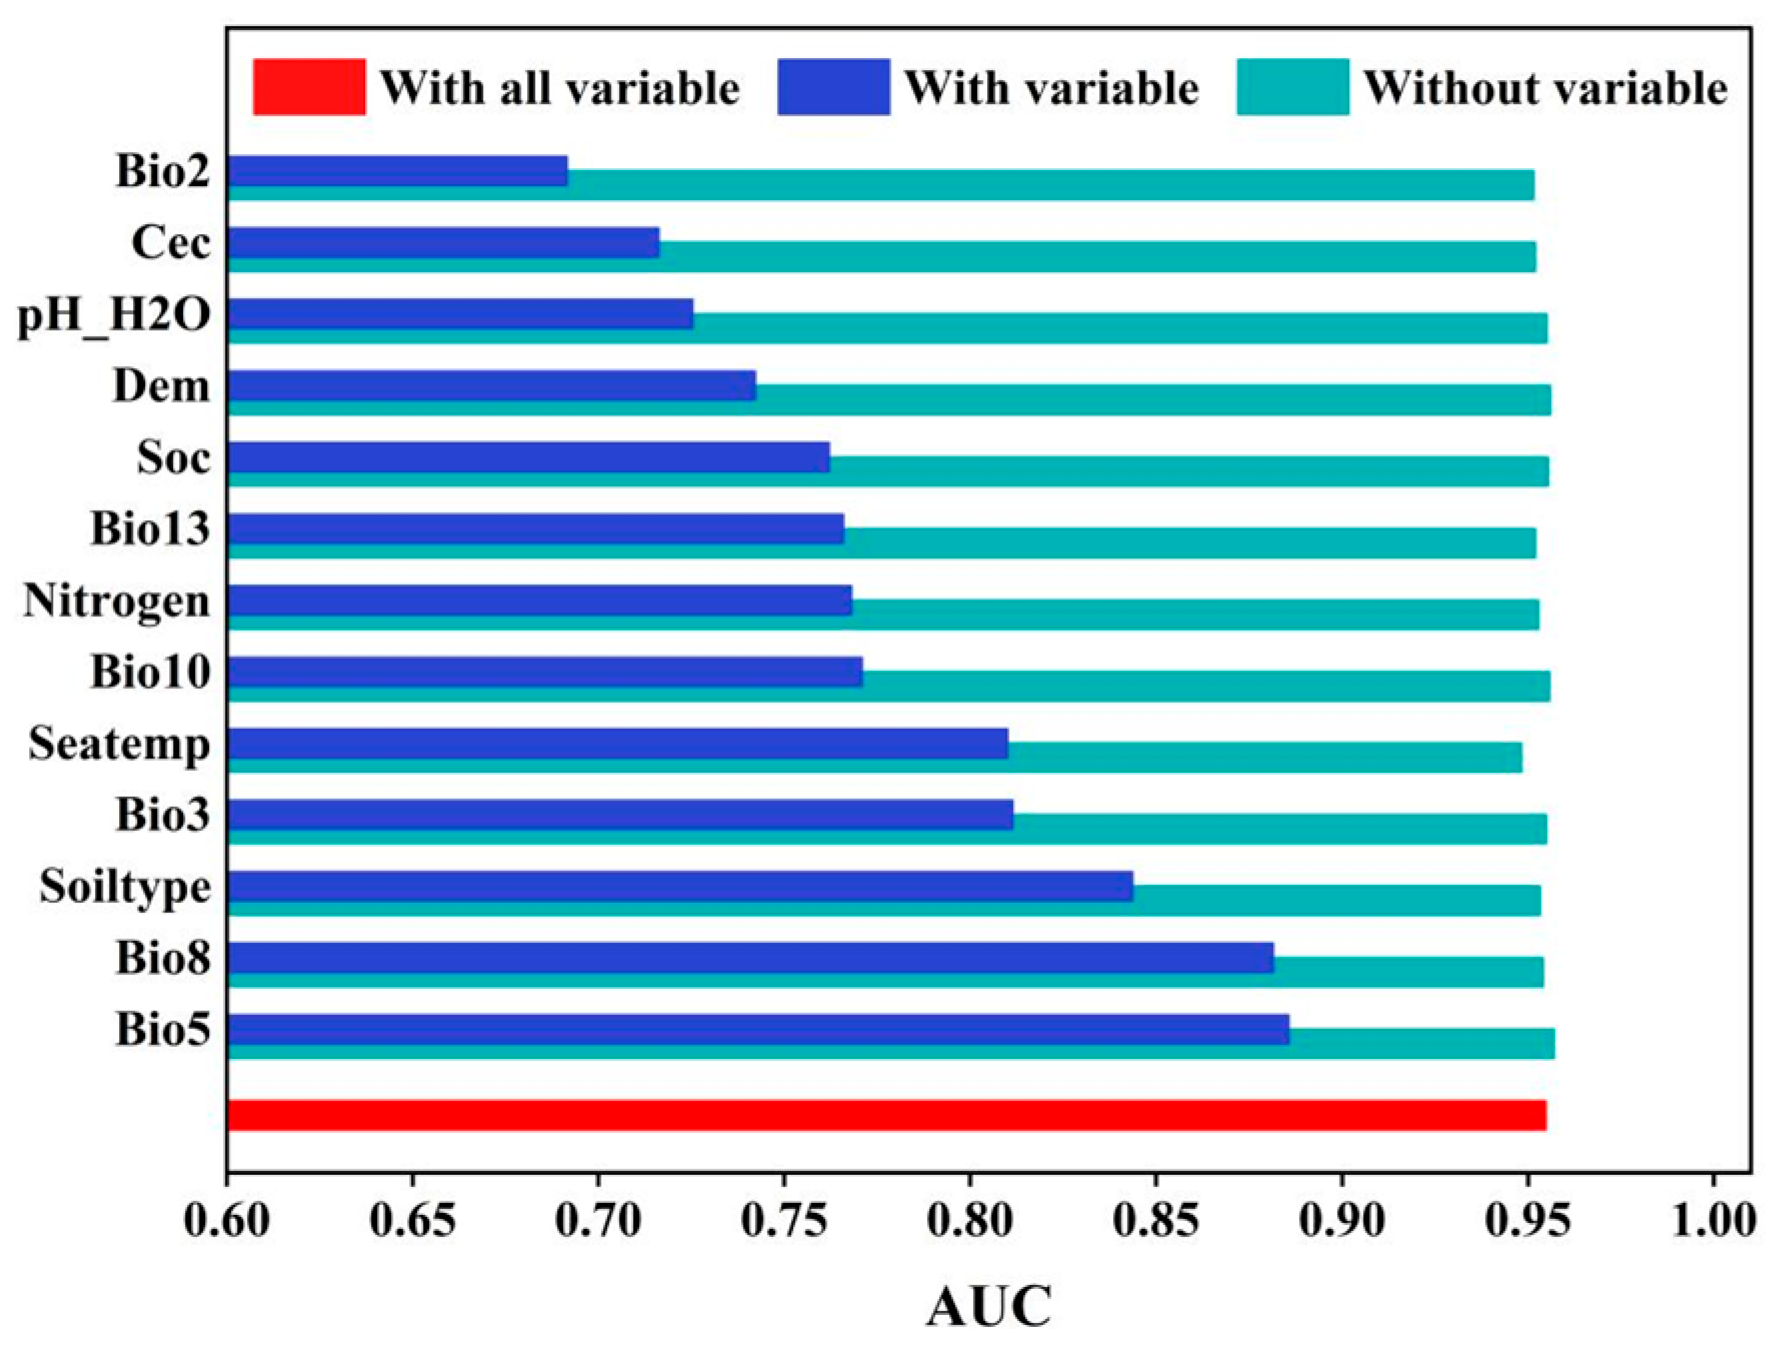
3.3.1. Dominant Factors for the Spatial–Temporal Dynamics of S. alterniflora Wetlands

The ROC curve and AUC value are critical for evaluating the performance of MaxEnt in predicting vegetation suitability [40]. The ROC curve, i.e., changes in the AUC value, can assess the contribution of environmental variables and optimize the model. It aids in selecting optimal thresholds, with varying thresholds affecting the delineation of suitable and unsuitable habitats [41]. A curve closer to the upper-left corner indicates superior predictive performance. The AUC, ranging from 0 to 1, quantifies predictive accuracy, with values closer to 1 reflecting higher model performance. An AUC between 0.9 and 1.0 signifies excellent model evaluation results. In this study, the AUC values for the training and test sets of the optimal model were 0.972 and 0.948 in Figure 6, respectively, indicating high model accuracy. This result effectively reflects the distribution characteristics of S. alterniflora along the coastal areas of the Bohai Rim in China and reliably predicts its potential distribution [42].
MaxEnt employs the jackknife method to assess the contribution of environmental variables to the analysis results, as shown in the regularized training gain (RTG) plot below [43]. In this plot, the blue rectangles represent the regularization gain when only the respective variable is used for computation, while cyan rectangles indicate the regularization gain when the model is computed excluding that variable [44]. When constructing single-variable models, variables such as Seatemp, Bio3, Soiltype, Bio8, and Bio5 showed relatively high AUC values, all exceeding 0.8 (Figure 7). Of these, Bio5 exhibited the strongest association with the potential habitat of S. alterniflora, having the greatest influence among the environmental variables. Other variables, such as Bio10, Nitrogen, Bio13, and Soc, had AUC scores greater than 0.75, indicating their notable impact on the distribution of S. alterniflora. In contrast, variables like Bio2, Cec, Dem, pH_H2O, and other variables scored below 0.75, suggesting they have a relatively minor influence on the distribution of S. alterniflora. According to the RTG jackknife plot results, the most influential environmental variables are identified as the temperature of Bio5, Bio8, Soiltype, and Bio3, and Seatemp, Bio10, Bio13, and Soc are considered to have relatively strong importance.

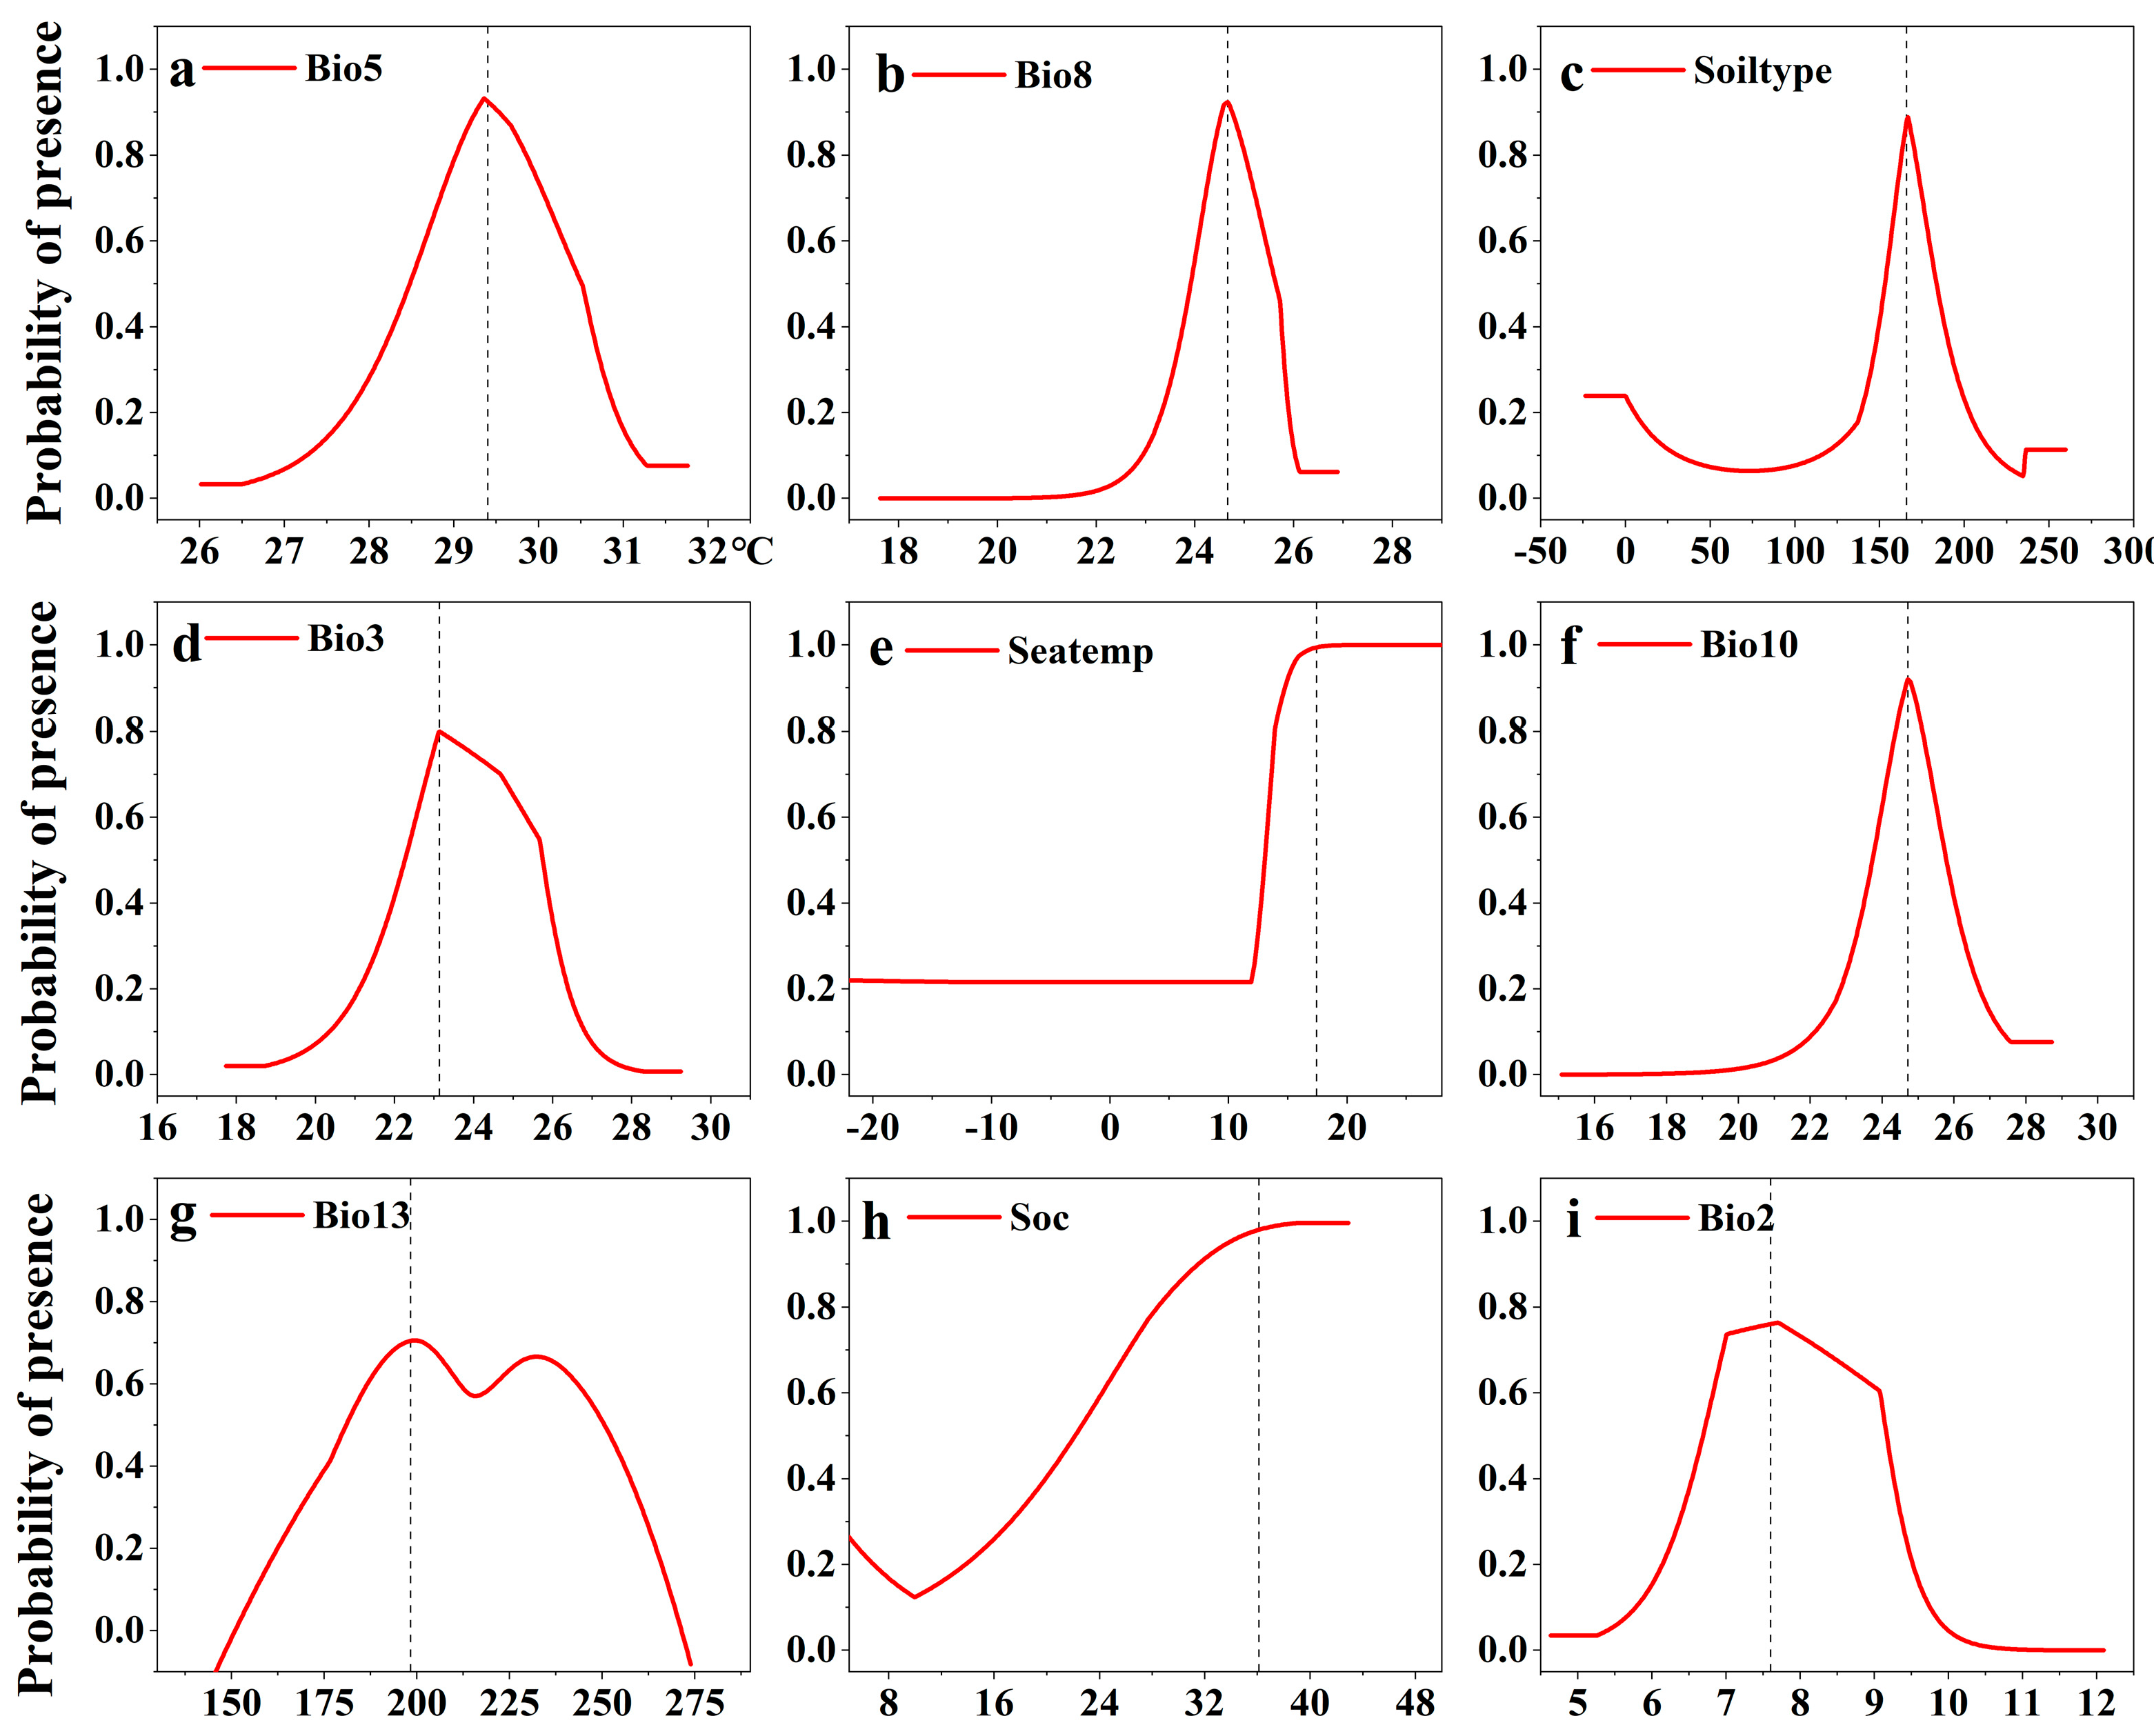
3.3.2. The Response of Potential S. alterniflora Distribution to Environmental Variables

To assess the impact of environmental factors on the potential distribution of S. alterniflora, we applied the jackknife method to evaluate the importance of each environmental variable [45]. Based on this analysis, nine dominant environmental factors were selected to construct the response curve for the probability of S. alterniflora presence (Figure 8).
Under the influence of variations in temperature during Bio5, Bio8, Bio3, Seatemp, Bio10, and Bio13, the probability of S. alterniflora presence generally increased before decreasing. Specifically, as Bio5 increased, the probability rose sharply, peaking at 29.3 °C, followed by a gradual then rapid decline (Figure 8a). A similar pattern was observed for Bio8, where the maximum probability occurred at 24.2 °C, after which it gradually decreased with increasing temperature (Figure 8b). The soil type response curve indicated that S. alterniflora exhibited the highest probability of occurrence at soil type value of 165, corresponding to coastal saline soil (Figure 8c). Additionally, when Bio3 was below 20 °C or above 26.5 °C, the probability of S. alterniflora presence dropped to less than 20% (Figure 8d). For sea surface temperatures between 15 and 25 °C, the probability of S. alterniflora presence exceeded 80% (Figure 8e). Bio10 showed a rapid increase in probability from 22 °C, peaking at 24.8 °C and then sharply decreasing and approaching 0% at 27 °C (Figure 8f). Similarly, as Bio13 increased, the probability of S. alterniflora presence initially rose and then fell, nearing 0% as precipitation approached 260 mm. This decline may be attributed to excessive rainfall causing inundation and soil hypoxia, which restricts S. alterniflora growth (Figure 8g). The response curve for soil organic carbon content followed an upward trend, peaking and stabilizing when the soil organic carbon content reached 360 g/kg, indicating the highest probability of S. alterniflora occurrence at this level (Figure 8h). Bio2 in the range of 7.5–8.5 °C was identified as an optimal thermal regime for S. alterniflora, supporting enhanced organic nutrient accumulation. This range likely balances photosynthetic efficiency and respiratory energy demands, fostering robust growth and nutrient storage under moderate diurnal thermal oscillations. Stable temperatures may reduce stress on plant metabolic processes, supporting steady growth (Figure 8i).
Therefore, the most optimal and suitable growth environment for S. alterniflora comprises coastal saline soil, along with the following conditions: a hottest monthly temperature ranging from 28.5 to 30 °C, a mean temperature of the wettest quarter between 24 and 25.5 °C, Bio3 between 23 and 26, a mean temperature of the warmest quarter between 24 and 26 °C, precipitation in the wettest quarter ranging from 180 to 250 mm, and low-lying coastal tidal flats.

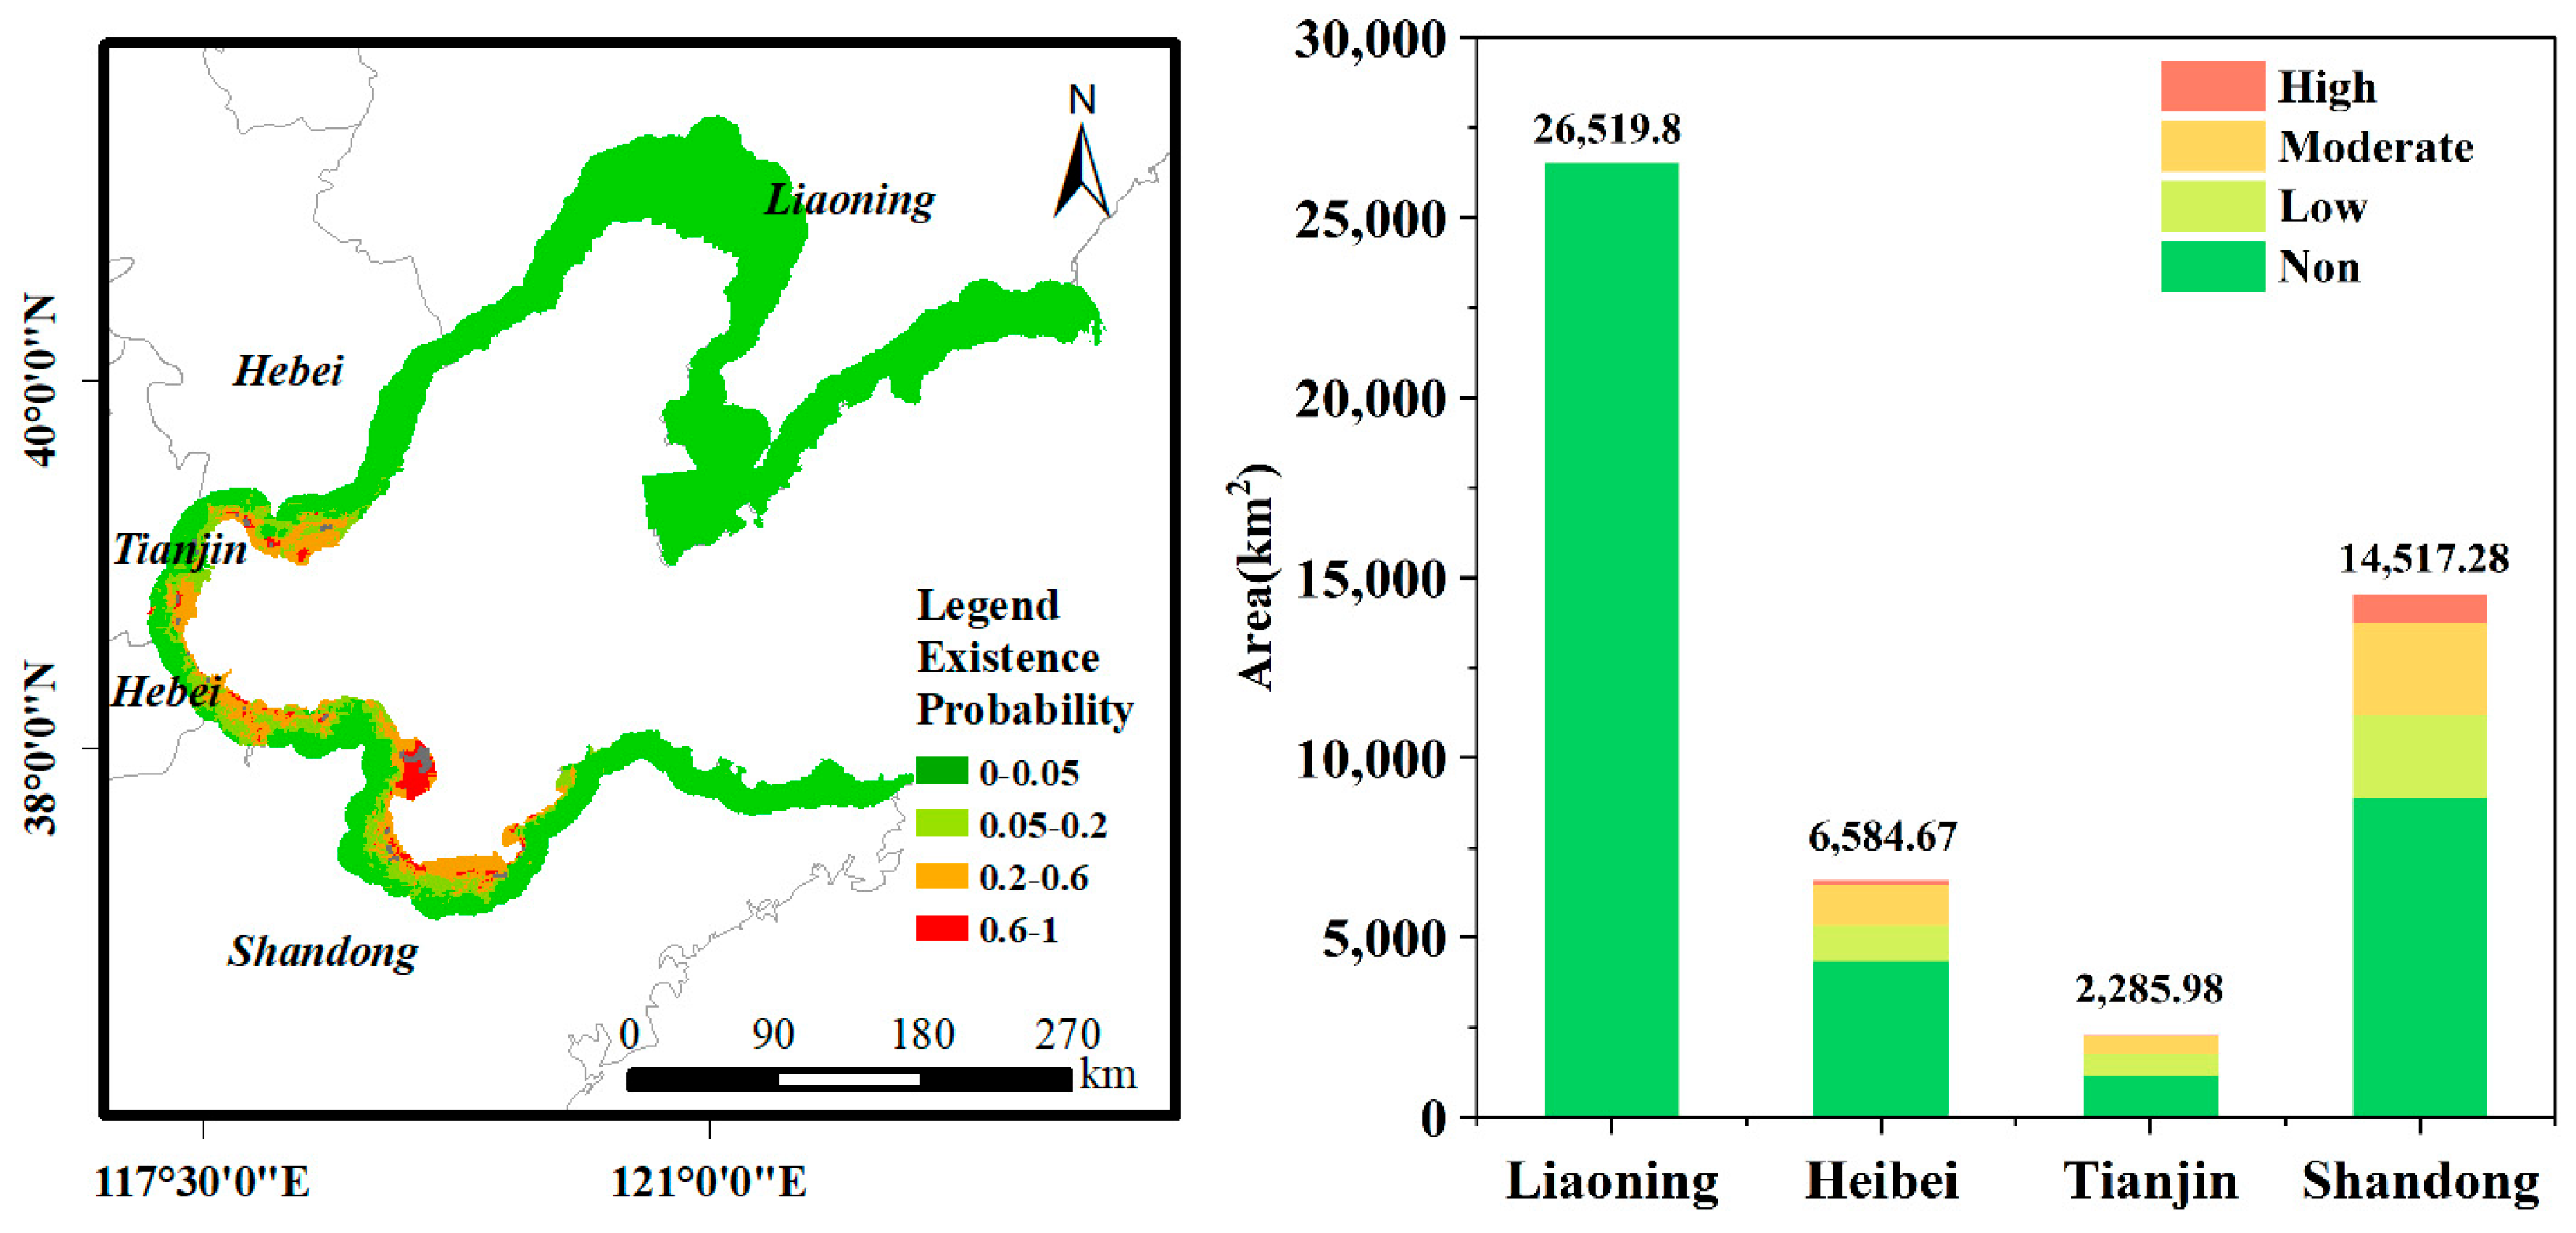
3.3.3. Potential Suitable Areas and Suitability Assessment of S. alterniflora in the Study Area

The potential habitat suitability of S. alterniflora within the study area was categorized into four classes (Figure 9). The distribution probability of highly suitable areas for S. alterniflora covered an area of 956.46 km2, which accounted for 1.92% of the total study area. Moderately suitable areas encompassed an area of 4163.13 km2, constituting 8.34% of the total study area. Low-suitability areas covered an area of 3902.87 km2, accounting for 7.82% of the total study area. Non-suitable areas spanned an area of 40,885.2 km2, representing 81.92% of the total study area.
Based on the analysis results of MaxEnt, it can be concluded that the coastal areas of Liaoning Province within the Bohai Sea study area are highly unsuitable for the growth and spread of S. alterniflora, falling into the non-suitable category. The high latitude and unfavorable climatic conditions of Liaoning Province significantly hinder the growth of S. alterniflora. Specifically, the relatively low average annual temperature and prolonged frost periods present substantial challenges for the establishment and spread of this invasive species [46]. In contrast, highly suitable areas are mainly distributed in Cao Feidian District, Hebei Province, near Nanpu Village on the coastal tidal flats, Tianjin Binhai New Area, Wudi County, Binzhou City, Kenli District, Dongying City, around Laizhou Bay, and near the mouth of the Taiping Bay. Moderate- and low-suitable areas are primarily found in the southern part of Hebei Province, Tianjin Municipality, and the coastal tidal flat areas of Shandong Province.
Further analysis of the potential suitable habitats for S. alterniflora revealed that the majority of highly suitable areas are located in Shandong Province, which accounts for 82.4% of this category. Meanwhile, Hebei Province and Tianjin Municipality account for 13% and 4.5%, respectively. The predictive results also indicate that the high-incidence areas of S. alterniflora invasion include Nanpu Village and South Beach Village in Cao Feidian District, Hebei Province as well as Tuhai River, the YRD region, Laizhou Bay, and near the mouth of Taiping Bay in Shandong Province. In Tianjin Municipality, high-incidence areas include coastal waters near Hangucheng Salt Factory, near Duliujian River (around Tianjin Binhai Shrimp Farm), and at the mouth of the Beidagang Reservoir and Ziyaxin River.

4. Discussion

4.1. Uncertainty Analysis

4.1.1. Characterization and Monitoring of S. alterniflora Wetlands from Satellite Data Analyses

The feasibility and reliability of depicting the spread and growth of S. alterniflora in the Bohai Sea region using phenological and Polarization features were validated using Sentinel-1/2 remote sensing imagery and GEE processing platform. Sentinel-1, with its polarization modes (VV and VH) and sensitivity to hydrological information [9], along with Sentinel-2 time-series analysis, allowed for more effective identification of vegetation phenological features [47,48], achieving good classification results in mapping coastal salt marshes. However, certain uncertainties in this study still require further analysis and mitigation.
Sentinel data improve Spartina alterniflora classification accuracy due to several advantages over Landsat. Sentinel-2’s higher spatial resolution (10 m vs. 30 m) enables precise vegetation delineation, while its frequent revisit cycle (5 days vs. 16 days) enhances phenological monitoring. The integration of Sentinel-1 SAR provides all-weather imaging and structural vegetation information, improving classification robustness in coastal wetlands. Additionally, Sentinel-2’s extended spectral range, including red edge bands, enhances vegetation differentiation. These factors, combined with the ability to perform high-resolution change detection, make Sentinel data superior for long-term S. alterniflora monitoring and invasion risk assessment. However, Sentinel series data could not detect small, fragmented patches of S. alterniflora smaller than 10 m × 10 m due to their maximum spatial resolution of 10 m [16]. This species, with its extensive root system, salt and flood tolerance, strong reproductive capacity, and rapid population dispersal, could experience widespread expansion if such small patches are not promptly addressed [1]. Therefore, further research is needed to develop a more refined method for classifying and monitoring S. alterniflora.
In this study, object-based random forest and SNIC segmentation algorithms were used for vegetation classification in salt marsh wetlands. The combination of these two methods effectively improves classification efficiency. Object-oriented classification integrates spectral, spatial, and contextual feature information for classification. For classification using the RF model, multiple experiments and adjustments are required for various algorithm parameters, such as “snic_size” and “snic_compactness”, which affect the granularity and shape of segmentation. In this study, conservative values based on previous research were used, resulting in fine yet irregular segmentation and slow processing speed. Future research will address these issues to improve both classification accuracy and the integrity of vegetation area delineation.

4.1.2. Prediction of S. alterniflora Wetland Distribution from MaxEnt

MaxEnt was used to predict the suitability of invasive plants, determining the distribution of S. alterniflora based on environmental variables and avoiding subjectivity. In selecting environmental variables, this study considered the species’ growth characteristics and geographical environment, analyzing 33 environmental variables, including ocean, climate, and soil types. Due to multicollinearity, the initial MaxEnt was overfitted, but after screening, analysis focused on the nine most important environmental variables [32,45]. Full coverage of the study area was achieved by applying Kriging interpolation to fill gaps in the environmental data, with a uniform data resolution of 1 km. However, applying marine data to land data through Kriging could lead to accuracy errors, data mismatches, and the misclassification or omission of small areas of suitable habitats for S. alterniflora, resulting in coarse-grained imagery with jagged edges [39,45,49]. Hence, obtaining high-precision, well-matched environmental data remains critical for producing more refined predictions. To improve prediction accuracy, obtaining accurate distribution points of S. alterniflora while avoiding spatial autocorrelation is essential [50]. In this study, distribution points were visually interpreted based on GEE classification results, the literature, and field survey data, but strong subjectivity was present, and the prior knowledge of the researcher also influenced the determination of distribution points.

4.1.3. Comparison with Previous Studies and Classification Accuracy

The classification accuracy achieved in this study aligned well with previous research on S. alterniflora mapping in Bohai Bay. The object-based RF classification demonstrated high accuracy, with an overall accuracy exceeding 92% and a kappa coefficient of 0.978, which is comparable to recent studies employing similar methodologies. This suggests that the combination of Sentinel-1 and Sentinel-2 imagery, along with object-based classification techniques, provides reliable results for large-scale monitoring of S. alterniflora.
Regarding distribution and area estimation, the results indicated a decline in S. alterniflora coverage from 46.60 km2 in 2016 to 12.56 km2 in 2022, an annual reduction of approximately 5.67 km2. This trend is consistent with recent studies reporting contraction in S. alterniflora extent due to intensified management efforts. However, some discrepancies remain between predicted and observed distributions, likely due to differences in data sources, spatial resolution limitations, and environmental variable selection. While the Sentinel-based approach effectively captures large contiguous patches, fragmented stands below the 10 m detection threshold may be underestimated. Future studies should explore the integration of higher-resolution commercial satellite imagery and UAV-based field validation to refine classification accuracy and enhance small-scale invasion detection.

4.2. Current Status and Management Recommendations for S. alterniflora Control

S. alterniflora was introduced to Bohai Bay between 1997 and 2000, making this region the northernmost distribution area of the species in China. Since its introduction, S. alterniflora has spread extensively across seven coastal cities in Shandong Province, notably in the YRD, Laizhou Bay, Jiaozhou Bay, and other tidal flat ecosystems. Current control measures in Bohai Bay primarily comprise mechanical removal, chemical treatments, and biological interventions. Mechanical or physical control methods generally involve mowing, plowing, and burying invasive stands. For example, a physical control initiative in the Weihe River region of Weifang City successfully treated 280.44 ha of S. alterniflora, achieving a removal rate exceeding 85%. Between 2016 and 2019, similar mechanical approaches (mowing and manual uprooting) were implemented in the Tianjin Binhai New Area along the Yongding New River tide gate, from Yiou Park to the central fishing port, and at Dagang Li Erwan coastal beaches, covering an additional 380 ha. Chemical control typically involves the application of herbicides in intertidal zones [51]. In the north side of the Yellow River estuary, short-term toxic effects on benthic organisms have been reported, yet certain herbicides (e.g., H-aloxyfop-R-methyl) achieved over 95% eradication effectiveness for up to three years, demonstrating substantial efficacy in areas such as the YRD [52]. Similarly, the Beidagang Wetland Nature Reserve successfully employed a specialized S. alterniflora-control agent with minimal environmental impact, while Yaohe District utilized selective chemical agents across 389.3 ha, resulting in a mortality rate above 90% [53]. Biological control strategies are typically categorized as either biocontrol technologies (introduction of S. alterniflora natural enemies such as marsh periwinkles, fungi, or planthoppers) [54] or biotic replacement (e.g., competitive planting with native wetland species such as reeds or mangroves) [55]. Although some experiments with natural enemies have shown limited success [56], native vegetation competition has demonstrated the potential to reduce S. alterniflora expansion [57]. Additionally, S. alterniflora confers certain ecological benefits, including the absorption of heavy metal ions, which should be factored into any integrated management approach tailored to local conditions [58].
Spurred by the urgency of S. alterniflora control, multiple jurisdictions surrounding Bohai Bay enacted special policies and allocated funding to support eradication programs [56]. In 2020, Shandong Province issued a comprehensive prevention and control plan; by August 2022, the removal rate in Qingdao exceeded 99.9%. Public records from the Chinese government procurement website (https://www.ccgp.gov.cn/) indicate that from 2020 to 2023, Shandong Province allocated CNY 16.73 billion for S. alterniflora management, while Tianjin earmarked CNY 5.73 million in 2018 and CNY 5.09 million in 2020. In 2023, Cangzhou City (Hebei Province) launched a marine ecological protection and restoration project, dedicating CNY 1.35 million explicitly to S. alterniflora control, including site-specific vegetation selection and planting techniques. Spatiotemporal analyses indicate that, since 2020, S. alterniflora invasions have declined markedly throughout Bohai Bay, reflecting the collective effectiveness of existing measures. Nevertheless, persistent monitoring and rigorous follow-up strategies remain essential to prevent re-establishment, particularly in ecologically sensitive areas. Further efforts to refine integrated management—combining mechanical, chemical, and biological controls with targeted ecological restoration—will be critical for the long-term suppression of S. alterniflora and the protection of coastal wetland ecosystems in Bohai Bay.

4.3. Potential Suitable Areas and Key Regions of Concern for S. alterniflora

An analysis of S. alterniflora habitats highlighted Shandong Province as the most vulnerable area, representing 82.4% of the highly suitable regions, followed by Hebei (13%) and Tianjin (4.5%). High-risk zones, including the YRD, Laizhou Bay, and Taiping Bay, owe their susceptibility to nutrient-rich sediments from the Yellow River, flat terrain, and low elevation, which promote the species’ proliferation [41,50,56,57]. These areas are critical for targeted management efforts to curb its spread. In the YRD, a combination of physical (e.g., mowing, deep plowing, and burial) and chemical methods has resulted in eradication rates exceeding 90% [58], with a reduction in coverage area from 42.02 km2 in 2019 to 12.56 km2 by 2022 (see Figure 10A).
The management of S. alterniflora in Laizhou Bay delivered outstanding results, with the infested area declining from 5.46 km2 in 2017 to 2.02 km2 in 2022 (see Figure 10B). This success underscores the effectiveness of a coordinated and adaptive management model, where a combination of seasonal interventions—including winter mowing, plowing, chemical treatments, and environmental toxicity assessments—has significantly refined regional control strategies [57]. The bay-level approach, which prioritizes local responsibility and fosters collaborative action, has played a crucial role in halting the spread of S. alterniflora. Moreover, the continuous monitoring and evaluation of pilot projects emphasize the importance of evidence-based decision making in effective management [59,60].
Similarly, in Tianjin Binhai New Area, the application of specialized, eco-friendly herbicides in tidal flats has proven to be highly effective, minimizing non-target impacts while achieving substantial mortality rates in S. alterniflora. Complementary efforts, such as the reintroduction of native plant species like reed, have been pivotal in restoring the Tianjin coastal wetland ecosystem and curbing further spread of the invasive species [61]. These combined efforts have expedited the removal of S. alterniflora, reducing the infested area from 4.32 km2 in 2016 to 1.71 km2 in 2021, a reduction of 60.4% (see Figure 10C). This highlights the critical value of integrating ecological restoration with invasive species management for long-term success. Despite these significant achievements, challenges remain. The resurgence of S. alterniflora in Tianjin, where the infested area rebounded to 2.97 km2 by 2022, reveals the ongoing need for improvement. Notably, the resurgence is concentrated in the coastal tidal flats of Beitang Port and along the stretch between Ji Yun Fourth Road and Beigang Road in the Tianjin Free Trade Zone, where the area increased by approximately 0.514 km2, accounting for 40.8% of the total re-expansion. A key limitation impeding continued progress is the absence of continuous, high-resolution monitoring systems [9,60]. To address this, the establishment of a comprehensive monitoring framework—leveraging advanced technologies such as drones and remote sensing for early detection and precise tracking—is essential for ensuring the sustained effectiveness of control efforts.
In conclusion, while the efforts to manage S. alterniflora in both Laizhou Bay and Tianjin Binhai New Area have shown substantial success, the persistence of challenges, particularly related to long-term surveillance, calls for further refinement of monitoring strategies and the continued integration of innovative technologies to ensure sustained control and restoration of coastal ecosystems. Another area for improvement lies in the limited scope and intensity of eradication efforts in some regions. Small-scale pilot projects have demonstrated success but lack scalability [62]. Expanding these initiatives through inter-regional cooperation and concentrated eradication campaigns is essential to eliminate residual populations and prevent reinvasion. Additionally, reliance on single-method approaches, particularly chemical control, poses risks to non-target organisms and ecosystems. Developing integrated strategies that combine physical, chemical, and biological techniques alongside the use of native vegetation competition and hydrological restoration will enhance long-term efficacy [63].
By learning from successful practices in the Bohai Sea region and addressing identified gaps, a more holistic, sustainable, and effective framework for S. alterniflora management can be developed. This approach will not only curb the invasive species but also restore and protect the ecological integrity of the region’s valuable coastal wetlands [55,57,64].

5. Conclusions

Accurately monitoring and predicting S. alterniflora invasions in China’s higher-latitude coastal zones are vital for safeguarding biodiversity, restoring ecosystem resilience, and mitigating ecological threats. This study harnessed the GEE platform alongside multi-year Sentinel-1 and Sentinel-2 imagery to map S. alterniflora in Bohai Bay via an object-based random forest classification. Between 2016 and 2022, the temporal dynamics of S. alterniflora coverage showed a two-phase dynamic: (1) a moderate gain from 46.60 km2 in 2016 to 55.81 km2 in 2020 and (2) a substantial loss from 2020 to 12.56 km2 in 2022. Notably, nearly 60% of S. alterniflora was concentrated in Shandong Province’s YRD. To forecast potential invasion zones, we employed MaxEnt, which incorporated climatic (Bio5, Bio8, Bio3, Sea Surface Temperature, and Bio10), soil, topographic, and marine environmental variables. The results pinpointed average temperatures of 24–30 °C during warm and humid seasons, precipitation ranging from 180 to 250 mm in the wettest quarter, and low-lying coastal saline soils as optimal conditions. These findings elucidate S. alterniflora’s ecological preferences and highlight the critical environmental determinants shaping its distribution in Bohai Bay. By providing a nuanced understanding of S. alterniflora’s spatial patterns and temporal dynamics, this study offers a foundation for informed ecological management and targeted eradication strategies. Future investigations could refine detection accuracy by integrating higher-resolution satellite data, multi-source information, and UAV-based LiDAR, thereby enhancing mapping precision and facilitating effective monitoring of eradication initiatives. Additionally, coupling remote sensing datasets with crowdsourced or policy-related information could offer deeper insights into the socio-economic and ecological ramifications of S. alterniflora invasions. Such an interdisciplinary approach could pave the way for rapid, evidence-based solutions to prevent the recurrence and reinvasion of this high-impact invasive species.
This study addresses a critical research gap by delivering a high-resolution, multi-temporal analysis of S. alterniflora dynamics in Bohai Bay, a previously underrepresented region, achieving a 92% classification accuracy through the integration of MaxEnt modeling and remote sensing data. Future research could enhance precision by incorporating higher-resolution satellite data (e.g., WorldView and GaoFen), UAV-based LiDAR, and hyperspectral imagery, while interdisciplinary approaches integrating socio-economic and policy data could provide deeper insights into invasion impacts and management efficacy. By advancing the understanding of S. alterniflora’s spatial-temporal dynamics and ecological drivers, this study lays the groundwork for evidence-based conservation strategies, leveraging cutting-edge technologies to address invasive species challenges and ensure sustainable ecosystem recovery in coastal regions.

Author Contributions

Conceptualization, Q.W. and H.L. (Huiying Li); methodology, Q.W. and G.C.; software, Q.W. and H.L. (Haojie Liu); validation, Q.W., H.L. (Haojie Liu) and G.C.; formal analysis, Q.W. and X.L.; investigation, H.L. (Huiying Li), Q.W., G.C. and H.L. (Haojie Liu); resources, M.J., D.M. and M.W.; data curation, H.L. (Huiying Li) and X.L.; writing—original draft preparation, Q.W.; writing—review and editing, H.L. (Huiying Li), X.X., X.H. and M.W.; visualization, X.H. and H.L. (Haojie Liu); supervision, M.J., H.L. (Huiying Li), D.M. and X.X.; project administration, Y.X., M.J. and H.L. (Huiying Li); funding acquisition, Y.X., M.J. and H.L. (Huiying Li). All authors have read and agreed to the published version of the manuscript.

Funding

This study was funded by the National Key Research and Development Program (No. 2021YFC3201004), the National Natural Science Foundation of China (42330109, 42103029, 42001383), the Natural Science Foundation of Jilin Province, China (20240101016JJ), and the Natural Science Foundation of Shandong province (No. ZR2020QD020).

Data Availability Statement

The original contributions presented in this study are included in the article. Further inquiries can be directed to the corresponding author(s).

Conflicts of Interest

The authors declare no conflicts of interest.

Abbreviations

The following abbreviations are used in this manuscript:
S. alternifloraSpartina alterniflora
YRDYellow River Delta
CGCChangli Gold Coast
GISGeographic information systems
SARSynthetic aperture radar
GEEGoogle Earth Engine
GARPGenetic algorithm for rule-set production
EnFAEcological niche factor analysis
BIOCLIMBioclimatic model
MaxEntMaximum entropy modeling
GRDGround range-detected
VVVertical transmit and vertical receive
VHVertical transmit and horizontal receive
UAVsUnmanned aerial vehicles
GVGGround vegetation grids
NDVINormalized difference vegetation index
DVIDifference vegetation index
EVIDifference vegetation index
GCIGreen chlorophyll index
RVIRatio vegetation index
CIreChlorophyll index using red edge
NDre1Normalized difference red edge 1
NDre2Normalized difference red edge 2
JMJeffries–Matusita
SNICSimple non-iterative clustering
PAProducer’s accuracy
UAUser’s accuracy
OAOverall accuracy

Appendix A

Table A1. Environmental variables for model analysis.
CodeEnvironmental VariablesUnitDatasetSource
Bio1Annual mean temperature°CClimate factorBIOCLIM WorldClim
2.1 dataset within the WorldClim database (https://worldclim.org/, accessed on 15 April 2024)
Bio2Mean diurnal range (mean of monthly (max temp–min temp))°C
Bio3Isothermality (Bio2/Bio7) (×100)
Bio4Temperature seasonality (standard deviation ×100)
Bio5Max temperature of warmest month°C
Bio6Min temperature of coldest month°C
Bio7Temperature annual range (Bio5–Bio6)°C
fBio8Mean temperature of wettest quarter°C
Bio9Mean temperature of driest quarter°C
Bio10Mean temperature of warmest quarter°C
Bio11Mean temperature of coldest quarter°C
Bio12Annual precipitationmm
Bio13Precipitation of wettest monthmm
Bio14Precipitation of driest monthmm
Bio15Precipitation seasonality (coefficient of variation)
Bio16Precipitation of wettest quartermm
Bio17Precipitation of driest quartermm
Bio18Precipitation of warmest quarter
Bio19Precipitation of coldest quartermm
DemElevationmTerrain factorASTER GDEM digital elevation data (https://www.gscloud.cn/, accessed on 18 April 2024)
SlopeSlope°
CecCation exchange capacity of the soilcmol©/kgSoil factorSoilGrids global soil dataset (https://soilgrids.org/, accessed on 26 April 2024)
pH_H2OSoil pHpH
NitrogenTotal nitrogen (N)g/kg
OcdOrganic carbon densitykg/dm3
OcsOrganic carbon stockskg/m2
ClayProportion of clay particles (<0.002 mm) in the fine earth fractiong/100 g (%)
SandProportion of sand particles (>0.05 mm) in the fine earth fractiong/100 g (%)
SocSoil organic carbon content in the fine earth fractiong/kg
SiltProportion of silt particles (≥0.002 mm and ≤0.05 mm) in the fine earth fractiong/100 g (%)
SoiltypeSoil type
SeatempSea surface temperatures°CMarine factorSentinel-3 SLSTR (https://earthengine.google.com/, accessed on 26 April 2024) ImageCollection (“COPERNICUS/S3/OLCI”)
SeasaltSeawater salinity%the Global Ocean Data Assimilation Experiment

References

  1. Ke, N.; Lu, X.; Fei, W. Spatiotemporal evolution of a tidal channel under Spartina alterniflora invasion and expansion in a coastal Wetland, Jiangsu, China. Remote Sens. Lett. 2024, 15, 389–400. [Google Scholar] [CrossRef]
  2. Mack, R.N.; Simberloff, D.; Mark Lonsdale, W.; Evans, H.; Clout, M.; Bazzaz, F.A. Biotic Invasions: Causes, Epidemiology, Global Consequences, and Control. Ecol. Appl. 2000, 10, 689–710. [Google Scholar] [CrossRef]
  3. Tian, J.; Wang, L.; Yin, D.; Li, X.; Diao, C.; Gong, H.; Shi, C.; Menenti, M.; Ge, Y.; Nie, S.; et al. Development of spectral-phenological features for deep learning to understand Spartina alterniflora invasion. Remote Sens. Environ. 2020, 242, 111745. [Google Scholar] [CrossRef]
  4. Yuan, Y.; Tang, X.; Liu, M.; Liu, X.; Tao, J. Species Distribution Models of the Spartina alterniflora Loisel in Its Origin and Invasive Country Reveal an Ecological Niche Shift. Front. Plant Sci. 2021, 12, 738769. [Google Scholar] [CrossRef]
  5. Liu, J.; Wang, J.; Zhao, S.; Engel, B.A.; Zhang, M.; Zhang, Z. Can We Protect China’s Northern Coast Wetlands from Tidal Dynamics by Restoring Native Species After Spartina alterniflora Is Eradicated? A Model-Based Analysis. Land Degrad. Dev. 2024, 35, 5439–5451. [Google Scholar] [CrossRef]
  6. Li, H.; Zhang, L. An experimental study on physical controls of an exotic plant Spartina alterniflora in Shanghai, China. Ecol. Eng. 2008, 32, 11–21. [Google Scholar] [CrossRef]
  7. Xu, R.; Zhao, S.; Ke, Y. A Simple Phenology-Based Vegetation Index for Mapping Invasive Spartina Alterniflora Using Google Earth Engine. IEEE J. Sel. Top. Appl. Earth Obs. Remote Sens. 2021, 14, 190–201. [Google Scholar] [CrossRef]
  8. Liu, M.; Mao, D.; Wang, Z.; Li, L.; Man, W.; Jia, M.; Ren, C.; Zhang, Y. Rapid Invasion of Spartina alterniflora in the Coastal Zone of Mainland China: New Observations from Landsat OLI Images. Remote Sens. 2018, 10, 1933. [Google Scholar] [CrossRef]
  9. Qiu, Z.; Mao, D.; Feng, K.; Wang, M.; Xiang, H.; Wang, Z. High-Resolution Mapping Changes in the Invasion of Spartina Alterniflora in the Yellow River Delta. IEEE J. Sel. Top. Appl. Earth Obs. Remote Sens. 2022, 15, 6445–6455. [Google Scholar] [CrossRef]
  10. Li, B.; Liao, C.-h.; Zhang, X.-d.; Chen, H.-l.; Wang, Q.; Chen, Z.-y.; Gan, X.-j.; Wu, J.-h.; Zhao, B.; Ma, Z.-j.; et al. Spartina alterniflora invasions in the Yangtze River estuary, China: An overview of current status and ecosystem effects. Ecol. Eng. 2009, 35, 511–520. [Google Scholar] [CrossRef]
  11. Liu, W.; Strong, D.R.; Pennings, S.C.; Zhang, Y. Provenance-by-environment interaction of reproductive traits in the invasion of Spartina alterniflora in China. Ecology 2017, 98, 1591–1599. [Google Scholar] [CrossRef] [PubMed]
  12. Li, H.; Mao, D.; Wang, Z.; Huang, X.; Li, L.; Jia, M. Invasion of Spartina alterniflora in the coastal zone of mainland China: Control achievements from 2015 to 2020 towards the Sustainable Development Goals. J. Environ. Manag. 2022, 323, 116242. [Google Scholar] [CrossRef] [PubMed]
  13. Chao, S.; Jialin, L.; Yongchao, L. Tracking annual changes in the distribution and composition of saltmarsh vegetation on the Jiangsu coast of China using Landsat time series–based phenological parameters. Remote Sens. Environ. 2023, 284, 113370. [Google Scholar] [CrossRef]
  14. Zhou, X.; Zuo, Y.; Zheng, K. Monitoring the Invasion of S. alterniflora on the Yangtze River Delta, China, Using Time Series Landsat Images during 1990–2022. Remote Sens. 2024, 16, 1377. [Google Scholar] [CrossRef]
  15. Marpu, P.R.; Gamba, P.; Niemeyer, I. Hyperspectral data classification using an ensemble of class-dependent neural networks. In Proceedings of the 2009 First Workshop on Hyperspectral Image and Signal Processing: Evolution in Remote Sensing, Grenoble, France, 26–28 August 2009; pp. 1–4. [Google Scholar] [CrossRef]
  16. Tian, Y.; Jia, M.; Wang, Z.; Mao, D.; Du, B.; Wang, C. Monitoring Invasion Process of Spartina alterniflora by Seasonal Sentinel-2 Imagery and an Object-Based Random Forest Classification. Remote Sens. 2020, 12, 1383. [Google Scholar] [CrossRef]
  17. Ma, Y.; Zhuo, L.; Cao, J. Mapping Invasive Spartina alterniflora Using Phenological Information and Red-Edge Bands of Sentinel-2 Time-Series Data. IEEE J. Sel. Top. Appl. Earth Obs. Remote Sens. 2025, 18, 13–24. [Google Scholar] [CrossRef]
  18. Zhao, B.; Zhang, M.; Wang, J.; Song, X.; Gui, Y.; Zhang, Y.; Li, W. Multiple attention network for spartina alterniflora segmentation using multitemporal remote sensing images. IEEE Trans. Geosci. Remote Sens. 2023, 61, 1–15. [Google Scholar] [CrossRef]
  19. Chen, W.; Shi, C. Fine-scale mapping of Spartina alterniflora-invaded mangrove forests with multi-temporal WorldView-Sentinel-2 data fusion. Remote Sens. Environ. 2023, 295, 113690. [Google Scholar] [CrossRef]
  20. Sun, C.; Li, J.; Liu, Y.; Liu, Y.; Liu, R. Plant species classification in salt marshes using phenological parameters derived from Sentinel-2 pixel-differential time-series. Remote Sens. Environ. 2021, 256, 112320. [Google Scholar] [CrossRef]
  21. Drusch, M.; Bello, U.D.; Carlier, S.; Colin, O.; Fernandez, V.; Gascon, F.; Hoersch, B.; Isola, C.; Laberinti, P.; Martimort, P.; et al. Sentinel-2: ESA’s Optical High-Resolution Mission for GMES Operational Services. Remote Sens. Environ. 2012, 120, 25–36. [Google Scholar] [CrossRef]
  22. Zhang, X.; Xiao, X.; Wang, X.; Xu, X.; Qiu, S.; Pan, L.; Ma, J.; Ju, R.; Wu, J.; Li, B. Continual expansion of Spartina alterniflora in the temperate and subtropical coastal zones of China during 1985–2020. Int. J. Appl. Earth Obs. Geoinf. 2023, 117, 103192. [Google Scholar] [CrossRef]
  23. Li, X.; Tian, J.; Li, X.; Yu, Y.; Ou, Y.; Zhu, L.; Zhu, X.; Zhou, B.; Gong, H. Annual mapping of Spartina alterniflora with deep learning and spectral-phenological features from 2017 to 2021 in the mainland of China. Int. J. Remote Sens. 2024, 45, 3172–3199. [Google Scholar] [CrossRef]
  24. Ayres, D.R.; Smith, D.L.; Zaremba, K.; Klohr, S.; Strong, D.R. Spread of Exotic Cordgrasses and Hybrids (Spartina sp.) in the Tidal Marshes of San Francisco Bay, California, USA. Biol. Invasions 2004, 6, 221–231. [Google Scholar] [CrossRef]
  25. Cui, L.; Berger, U.; Cao, M.; Zhang, Y.; He, J.; Pan, L.; Jiang, J. Conservation and Restoration of Mangroves in Response to Invasion of Spartina alterniflora Based on the MaxEnt Model: A Case Study in China. Forests 2023, 14, 1220. [Google Scholar] [CrossRef]
  26. Drake, J.M.; Lodge, D.M. Forecasting Potential Distributions of Nonindigenous Species with a Genetic Algorithm. Fisheries 2006, 31, 9–16. [Google Scholar] [CrossRef]
  27. Thameur, B.H.; Soufiène, S.; Ammar, H.H.; Hammami, S. Spatial distribution and habitat selection of culicoides imicola: The potential vector of bluetongue virus in Tunisia. Onderstepoort J. Vet. Res. 2021, 88, e1–e9. [Google Scholar] [CrossRef]
  28. Hu, A.L.; Yang, J.; Liu, B.L.; Zou, Y. Prediction on the changes in potential suitable areas for mangroves along the coast of Guangxi and the threat from Spartina alterniflora invasion. Ying Yong Sheng Tai Xue Bao = J. Appl. Ecol. 2024, 35, 669–677. [Google Scholar]
  29. Carpenter, G.; Gillison, A.N.; Winter, J. DOMAIN: A flexible modelling procedure for mapping potential distributions of plants and animals. Biodivers. Conserv. 1993, 2, 667–680. [Google Scholar] [CrossRef]
  30. Zhang, H.; Song, J.; Zhao, H.; Li, M.; Han, W. Predicting the Distribution of the Invasive Species Leptocybe invasa: Combining MaxEnt and Geodetector Models. Insects 2021, 12, 92. [Google Scholar] [CrossRef]
  31. Amindin, A.; Pourghasemi, H.R.; Safaeian, R.; Rahmanian, S.; Tiefenbacher, J.P.; Naimi, B. Predicting Current and Future Habitat Suitability of an Endemic Species Using Data-Fusion Approach: Responses to Climate Change. Rangel. Ecol. Manag. 2024, 94, 149–162. [Google Scholar] [CrossRef]
  32. Blanco-Sacristán, J.; Johansen, K.; Duarte, C.M.; Daffonchio, D.; Hoteit, I.; McCabe, M.F. Mangrove distribution and afforestation potential in the Red Sea. Sci. Total Environ. 2022, 843, 157098. [Google Scholar] [CrossRef] [PubMed]
  33. Charrua, A.B.; Bandeira, S.O.; Catarino, S.; Cabral, P.; Romeiras, M.M. Assessment of the vulnerability of coastal mangrove ecosystems in Mozambique. Ocean Coast. Manag. 2020, 189, 105145. [Google Scholar] [CrossRef]
  34. Min, Y.; Ke, Y.; Han, Y.; Yin, X.; Zhou, D. Dynamic monitoring of invasive Spartina alterniflora clearance via fusion of Sentinel-2 and GF-1 time series images. Natl. Remote Sens. Bull. 2023, 27, 1467–1479. [Google Scholar] [CrossRef]
  35. Chen, P.; Xia, J.; Ma, H.; Gao, F.; Dong, M.; Xing, X.; Li, C. Analysis of spatial distribution pattern and its influencing factors of the Tamarix chinensis population on the beach of the muddy coastal zone of Bohai Bay. Ecol. Indic. 2022, 140, 109016. [Google Scholar] [CrossRef]
  36. Wang, M.; Mao, D.; Wang, Y.; Xiao, X.; Xiang, H.; Feng, K.; Luo, L.; Jia, M.; Song, K.; Wang, Z. Wetland mapping in East Asia by two-stage object-based Random Forest and hierarchical decision tree algorithms on Sentinel-1/2 images. Remote Sens. Environ. 2023, 297, 113793. [Google Scholar] [CrossRef]
  37. Pouyan, S.; Rahmanian, S.; Amindin, A.; Pourghasemi, H.R. Chapter 15—Spatial and seasonal modeling of the land surface temperature using random forest. In Computers in Earth and Environmental Sciences; Pourghasemi, H.R., Ed.; Elsevier: Amsterdam, The Netherlands, 2022; pp. 221–234. [Google Scholar] [CrossRef]
  38. Yan, D.; Li, J.; Yao, X.; Luan, Z. Quantifying the Long-Term Expansion and Dieback of Spartina Alterniflora Using Google Earth Engine and Object-Based Hierarchical Random Forest Classification. IEEE J. Sel. Top. Appl. Earth Obs. Remote Sens. 2021, 14, 9781–9793. [Google Scholar] [CrossRef]
  39. Cho, K.H.; Park, J.-S.; Kim, J.H.; Kwon, Y.S.; Lee, D.-H. Modeling the distribution of invasive species (Ambrosia spp.) using regression kriging and Maxent. Front. Ecol. Evol. 2022, 10, 1036816. [Google Scholar] [CrossRef]
  40. Zhang, Y.; Tang, J.; Ren, G.; Zhao, K.; Wang, X. Global potential distribution prediction of Xanthium italicum based on Maxent model. Sci. Rep. 2021, 11, 16545. [Google Scholar] [CrossRef]
  41. Fan, Y.; Yu, S.; Wang, J.; Li, P.; Chen, S.; Ji, H.; Li, P.; Dou, S. Changes of Inundation Frequency in the Yellow River Delta and Its Response to Wetland Vegetation. Land 2022, 11, 1647. [Google Scholar] [CrossRef]
  42. Dai, G.; Yang, B.; Huang, Y. Current situation investigation and invasion process analysis of Spartina alterniflora in marine reserve. Mar. Environ. Sci. 2022, 41, 697–704. [Google Scholar]
  43. Tesfamariam, B.G.; Gessesse, B.; Melgani, F. MaxEnt-based modeling of suitable habitat for rehabilitation of Podocarpus forest at landscape-scale. Environ. Syst. Res. 2022, 11, 4. [Google Scholar] [CrossRef]
  44. Alexandre, M.J.C.W.; Mercedes Román, D.; Wartini, N.; Alex, B.M. Spatial evaluation of the soils capacity and condition to store carbon across Australia. Geoderma 2024, 442, 116805. [Google Scholar] [CrossRef]
  45. Esfanjani, J.; Ghorbani, A.; Zare Chahouki, M.A. MaxEnt Modeling for Predicting Impacts of Environmental Factors on the Potential Distribution of Artemisia aucheri and Bromus tomentellus-Festuca ovina in Iran. Pol. J. Environ. Stud. 2018, 27, 1041–1047. [Google Scholar] [CrossRef]
  46. Zhao, X.; Tian, B.; Niu, Y.; Chen, C.; Zhou, Y. Classification of coastal salt marsh based on Sentinel-1 time series backscattering characteristics:The case of the Yangtze River delta. Natl. Remote Sens. Bull. 2022, 26, 672–682. [Google Scholar] [CrossRef]
  47. Dai, J.; Luo, F.; Chen, Z.; Zhou, G.; Zeng, J. Pixel-based unique phenological feature composite method: Tackle the challenges of Spartina alterniflora identification and salt marsh classification in mixed vegetations area. J. Appl. Remote Sens. 2023, 17, 024510. [Google Scholar] [CrossRef]
  48. Dong, D.; Huang, H.; Gao, Q. Tracking the Dynamics of Spartina alterniflora with WorldView-2/3 and Sentinel-1/2 Imagery in Zhangjiang Estuary, China. Water 2024, 16, 1780. [Google Scholar] [CrossRef]
  49. Vitharana, U.W.A.; Nora, J.C.; Darshani, K.; Umakant, M.; Karl, F.-H. Factors controlling the spatial heterogeneity of soil organic carbon concentrations and stocks in a boreal forest. Geoderma Reg. 2024, 36, e00749. [Google Scholar] [CrossRef]
  50. Chen, C.; Ma, Y.; Ren, G.; Wang, J. Aboveground biomass of salt-marsh vegetation in coastal wetlands: Sample expansion of in situ hyperspectral and Sentinel-2 data using a generative adversarial network. Remote Sens. Environ. 2022, 270, 112885. [Google Scholar] [CrossRef]
  51. Peng, H.-B.; Shi, J.; Gan, X.; Zhang, J.; Ma, C.; Piersma, T.; Melville, D.S. Efficient removal of Spartina alterniflora with low negative environmental impacts using imazapyr. Front. Mar. Sci. 2022, 9, 1054402. [Google Scholar] [CrossRef]
  52. Wang, Z.; Li, Z.; Liu, X.; Song, H.; Liu, S.; Qi, J.; Jing, F.; Gao, Z. Ecological analysis and multi-scenario simulation of Yellow River Delta wetland under clearing of Spartina alterniflora. Glob. Ecol. Conserv. 2024, 56, e03287. [Google Scholar] [CrossRef]
  53. Sha, C.; Wang, Z.; Cao, J.; Chen, J.; Shen, C.; Zhang, J.; Wang, Q.; Wang, M. Management of Spartina alterniflora: Assessing the Efficacy of Plant Growth Regulators on Ecological and Microbial Dynamics. Sustainability 2024, 16, 7848. [Google Scholar] [CrossRef]
  54. Song, Z.; Huang, Y.; Liu, Q.; Hu, X. Discovering the Characteristics of Community Structures and Functional Properties of Epiphytic Bacteria on Spartina alterniflora in the Coastal Salt Marsh Area. J. Mar. Sci. Eng. 2022, 10, 1981. [Google Scholar] [CrossRef]
  55. Dong, Q.; Zhang, Q.; Liao, A.; Xu, C.; Liu, M. Plant Adaptability and Vegetation Differentiation in the Coastal Beaches of Yellow–Bohai Sea in China. Int. J. Environ. Res. Public Health 2022, 19, 2225. [Google Scholar] [CrossRef] [PubMed]
  56. Ba, Q.; Wu, Z.; Zhang, S.; Wu, X.; Wang, H.; Bi, N. Temporal and Spatial Variation of Wetland Vegetation in the Yellow River(Huanghe)Mouth and Its Influencing Factors. Period. Ocean Univ. China 2022, 52, 81–94. [Google Scholar]
  57. Duan, H.; Yang, C.; Yu, X. Evaluation of historical and future coastal wetland change in the Yellow and Bohai Seas using satellite images and a land use model. J. Environ. Manag. 2024, 351, 119986. [Google Scholar] [CrossRef]
  58. Xie, B.; Han, G.; Qiao, P.; Mei, B.; Wang, Q.; Zhou, Y.; Zhang, A.; Song, W.; Guan, B. Effects of mechanical and chemical control on invasive Spartina alterniflora in the Yellow River Delta, China. PeerJ 2019, 7, e7655. [Google Scholar] [CrossRef]
  59. Yao, H.; Chen, M.; Huang, Z.; Huang, Y.; Wang, M.; Liu, Y. Remote sensing monitoring and potential distribution analysis of Spartina alterniflora in coastal zone of Guangxi. Ecol. Evol. 2024, 14, e11469. [Google Scholar] [CrossRef]
  60. Dong, D.; Chen, L.; Zou, Z.; Jiang, H.; Huang, H.; Wei, Z.; Xu, Y.; Zeng, J.; Tian, S. Monitoring coastal salt marsh area changes based on high-resolution satellite and unmanned aerial vehicle imagery in Guangxi. J. Appl. Oceanogr. 2024, 43, 84–94. [Google Scholar]
  61. Huang, Y.; Liu, Z.; Zheng, G.; Zhao, C. Identification of Spartina alterniflora habitat expansion in a Suaeda salsa dominated coastal wetlands. Ecol. Indic. 2022, 145, 109704. [Google Scholar] [CrossRef]
  62. Sun, W.; Liu, W.; Wang, Y.; Zhao, R.; Huang, M.; Wang, Y.; Yang, G.; Meng, X. Research progress and prospects of hyperspectral remote sensing for global wetland from 2010 to 2022. Natl. Remote Sens. Bull. 2023, 27, 1281–1299. [Google Scholar]
  63. Nie, M.; Liu, W.; Pennings, S.C.; Li, B. Lessons from the invasion of in coastal China. Ecology 2023, 104, e3874. [Google Scholar] [CrossRef] [PubMed]
  64. Li, X.; Liu, G. Study on the change monitoring of typical estuarine wetland and its effect on ecological factors in Bohai Rim region, China. Front. Ecol. Evol. 2022, 10, 967593. [Google Scholar] [CrossRef]
Figure 1. Locations of study area.
Remotesensing 17 00975 g001
Figure 2. Quantity and quality of images covering the Bohai Bay. (a,b) Spatial distribution of mass observations of Sentinel-1 and Sentinel-2 in 2022. (c,d) Histogram of the number good observations in 2022. (e) Number of images from Sentinel-1 and Sentinel-2 per month from 2016 to 2022.
Remotesensing 17 00975 g002
Figure 3. Spectral indices of four salt marsh vegetation types of the study area in 2022. (ah) NDVI, DVI, EVI, RVI, GCI, CIre, NDre1, and NDre2.
Remotesensing 17 00975 g003
Figure 4. JM distance values between S. alterniflora, reeds, Suaeda spp., and Tamarix spp. under the following characteristic indices: (ah) NDVI, DVI, EVI, RVI, GCI, Cire, NDre1, and NDre2, respectively.
Remotesensing 17 00975 g004
Figure 5. The changes in area of S. alterniflora from 2016 to 2022. (a) shows the annual total area changes of S. alterniflora in the study region, (b) illustrates the dynamic trend of its area changes.
Remotesensing 17 00975 g005
Figure 6. ROC Curve of the Predicted Results of S. alterniflora Potential Habitat Area.
Remotesensing 17 00975 g006
Figure 7. Jackknife Test AUC Scores of Various Environmental Variables.
Remotesensing 17 00975 g007
Figure 8. Response curve of existence probability to main environmental variables. (ai) represent the response curves of existence probability for Bio5, Bio8, Soiltype, Bio3, Seatemp, Bio10, Bio13, Soc and Bio2, respectively. (The dashed lines in the figure indicate the X-values corresponding to the maximum existence probability).
Remotesensing 17 00975 g008
Figure 9. Potential Suitability Grade of S. alterniflora.
Remotesensing 17 00975 g009
Figure 10. Annual changes in the typical regions of S. alterniflora. (AC) in the figure represent the area changes of S. alterniflora from 2016 to 2022 in the YRD, Laizhou Bay and Binhai New Area, respectively.
Remotesensing 17 00975 g010
Table 1. Environmental Variables for Model Analysis.
VariablesDatasetSourceCount
Bio1–19Climate factorBIOCLIM WorldClim 2.1 dataset within the WorldClim database (https://worldclim.org/, accessed on 15 April 2024)19
Dem
Slope
Terrain factorASTER GDEM digital elevation data (https://www.gscloud.cn/, accessed on 18 April 2024)2
Cec/pH_H2O/Nitrogen/Ocd/Ocs/Clay/Sand/Soc/Silt/SoiltypeSoil factorSoilGrids global soil dataset (https://soilgrids.org/, accessed on 26 April 2024)9
SeatempMarine factorSentinel-3 SLSTR (https://earthengine.google.com/, accessed on 26 April 2024) ImageCollection (“COPERNICUS/S3/OLCI”)2
SeasaltGlobal Ocean Data Assimilation Experiment (GODAE) ImageCollectio (“HYCOM/sea_temp_salinity”)
Refer to Appendix A for a complete list of variable names.
Table 2. S. alterniflora classification feature set.
IndexAbbreviationEquationSource
Spectral BandsBB2, B3, B4, B5, B6, B7, B8Sentinel-2
SAR Difference IndexSAR_DVV − VHSentinel-1
SAR Sum IndexSAR_SVV + VH
SAR Nominalized Difference Vegetation IndexSAR_N(VV − VH)/(VV + VH)
Nominalized Difference Vegetation IndexNDVI B 8 B 4 B 8 + B 4 Sentinel-2
Difference Vegetation IndexDVI B 8 B 4
Enhanced Vegetation IndexEVI 2.5 × ( B 8 B 4 ) B 8 + 6 × B 4 7.5 × B 2 + 10000
Ratio Vegetation IndexRVI B 8 / B 4
Green Chlorophyll Vegetation IndexGCI B 8 B 3 1
Red Edge IndexCIre B 7 B 5 1
NDre1 B 6 B 5 B 6 + B 5
NDre2 B 7 B 5 B 7 + B 5
Table 3. Modeling parameter.
VariablesEnvironmental VariablesDatasetUnit
Bio3Isothermality (Bio2/Bio7) (×100)Climate factor
Bio5Max temperature of warmest monthClimate factor°C
Bio8Mean temperature of wettest quarterClimate factor°C
Bio10Mean temperature of warmest quarterClimate factor°C
Bio13Precipitation of wettest monthClimate factormm
Bio2Mean diurnal rangeClimate factor
SocSoil organic carbon content in the fine earth fractionSoil factorg/kg
SoiltypeSoil typeSoil factor
SeatempSea surface temperaturesMarine factor°C
Table 4. Accuracy assessment of the classification results for S. alterniflora.
YearClassNon-SASATotalUAKappaOA
2016Non-SA26922710.9930.9330.975
SA785920.924
Total27687363-
PA0.9750.977--
2017Non-SA22342270.9820.9780.947
SA390930.968
Total22694320-
PA0.9870.957--
2018SA24852530.980.8790.952
Non-SA12881000.88
Total26093353-
PA0.9540.946--
2019SA184131970.9340.820.921
Non-SA1083930.892
Total19496290-
PA0.9480.866--
2020SA23182390.9660.8540.942
Non-SA1180910.879
Total24188330-
PA0.9550.909--
2021SA220112310.9520.8850.951
Non-SA592970.948
Total225103328-
PA0.9780.893--
2022SA231122430.9510.8880.953
Non-SA494980.959
Total235106341-
PA0.9830.887--
Disclaimer/Publisher’s Note: The statements, opinions and data contained in all publications are solely those of the individual author(s) and contributor(s) and not of MDPI and/or the editor(s). MDPI and/or the editor(s) disclaim responsibility for any injury to people or property resulting from any ideas, methods, instructions or products referred to in the content.

