
Comparison of the Reflectivities from Precipitation Measurement Radar Onboard the FY-3G Satellite and Ground-Based S-Band Dual-Polarization Radars


Abstract
1. Introduction
2. Materials and Methods
2.1. FY-3G PMR
2.2. Ground-Based Radar
2.3. Volume Matching Methods for Comparison
2.4. Methods of Statistics and Analysis
3. Results
3.1. Comparison of FY-3G PMR and GR for Two Typical Precipitation Events
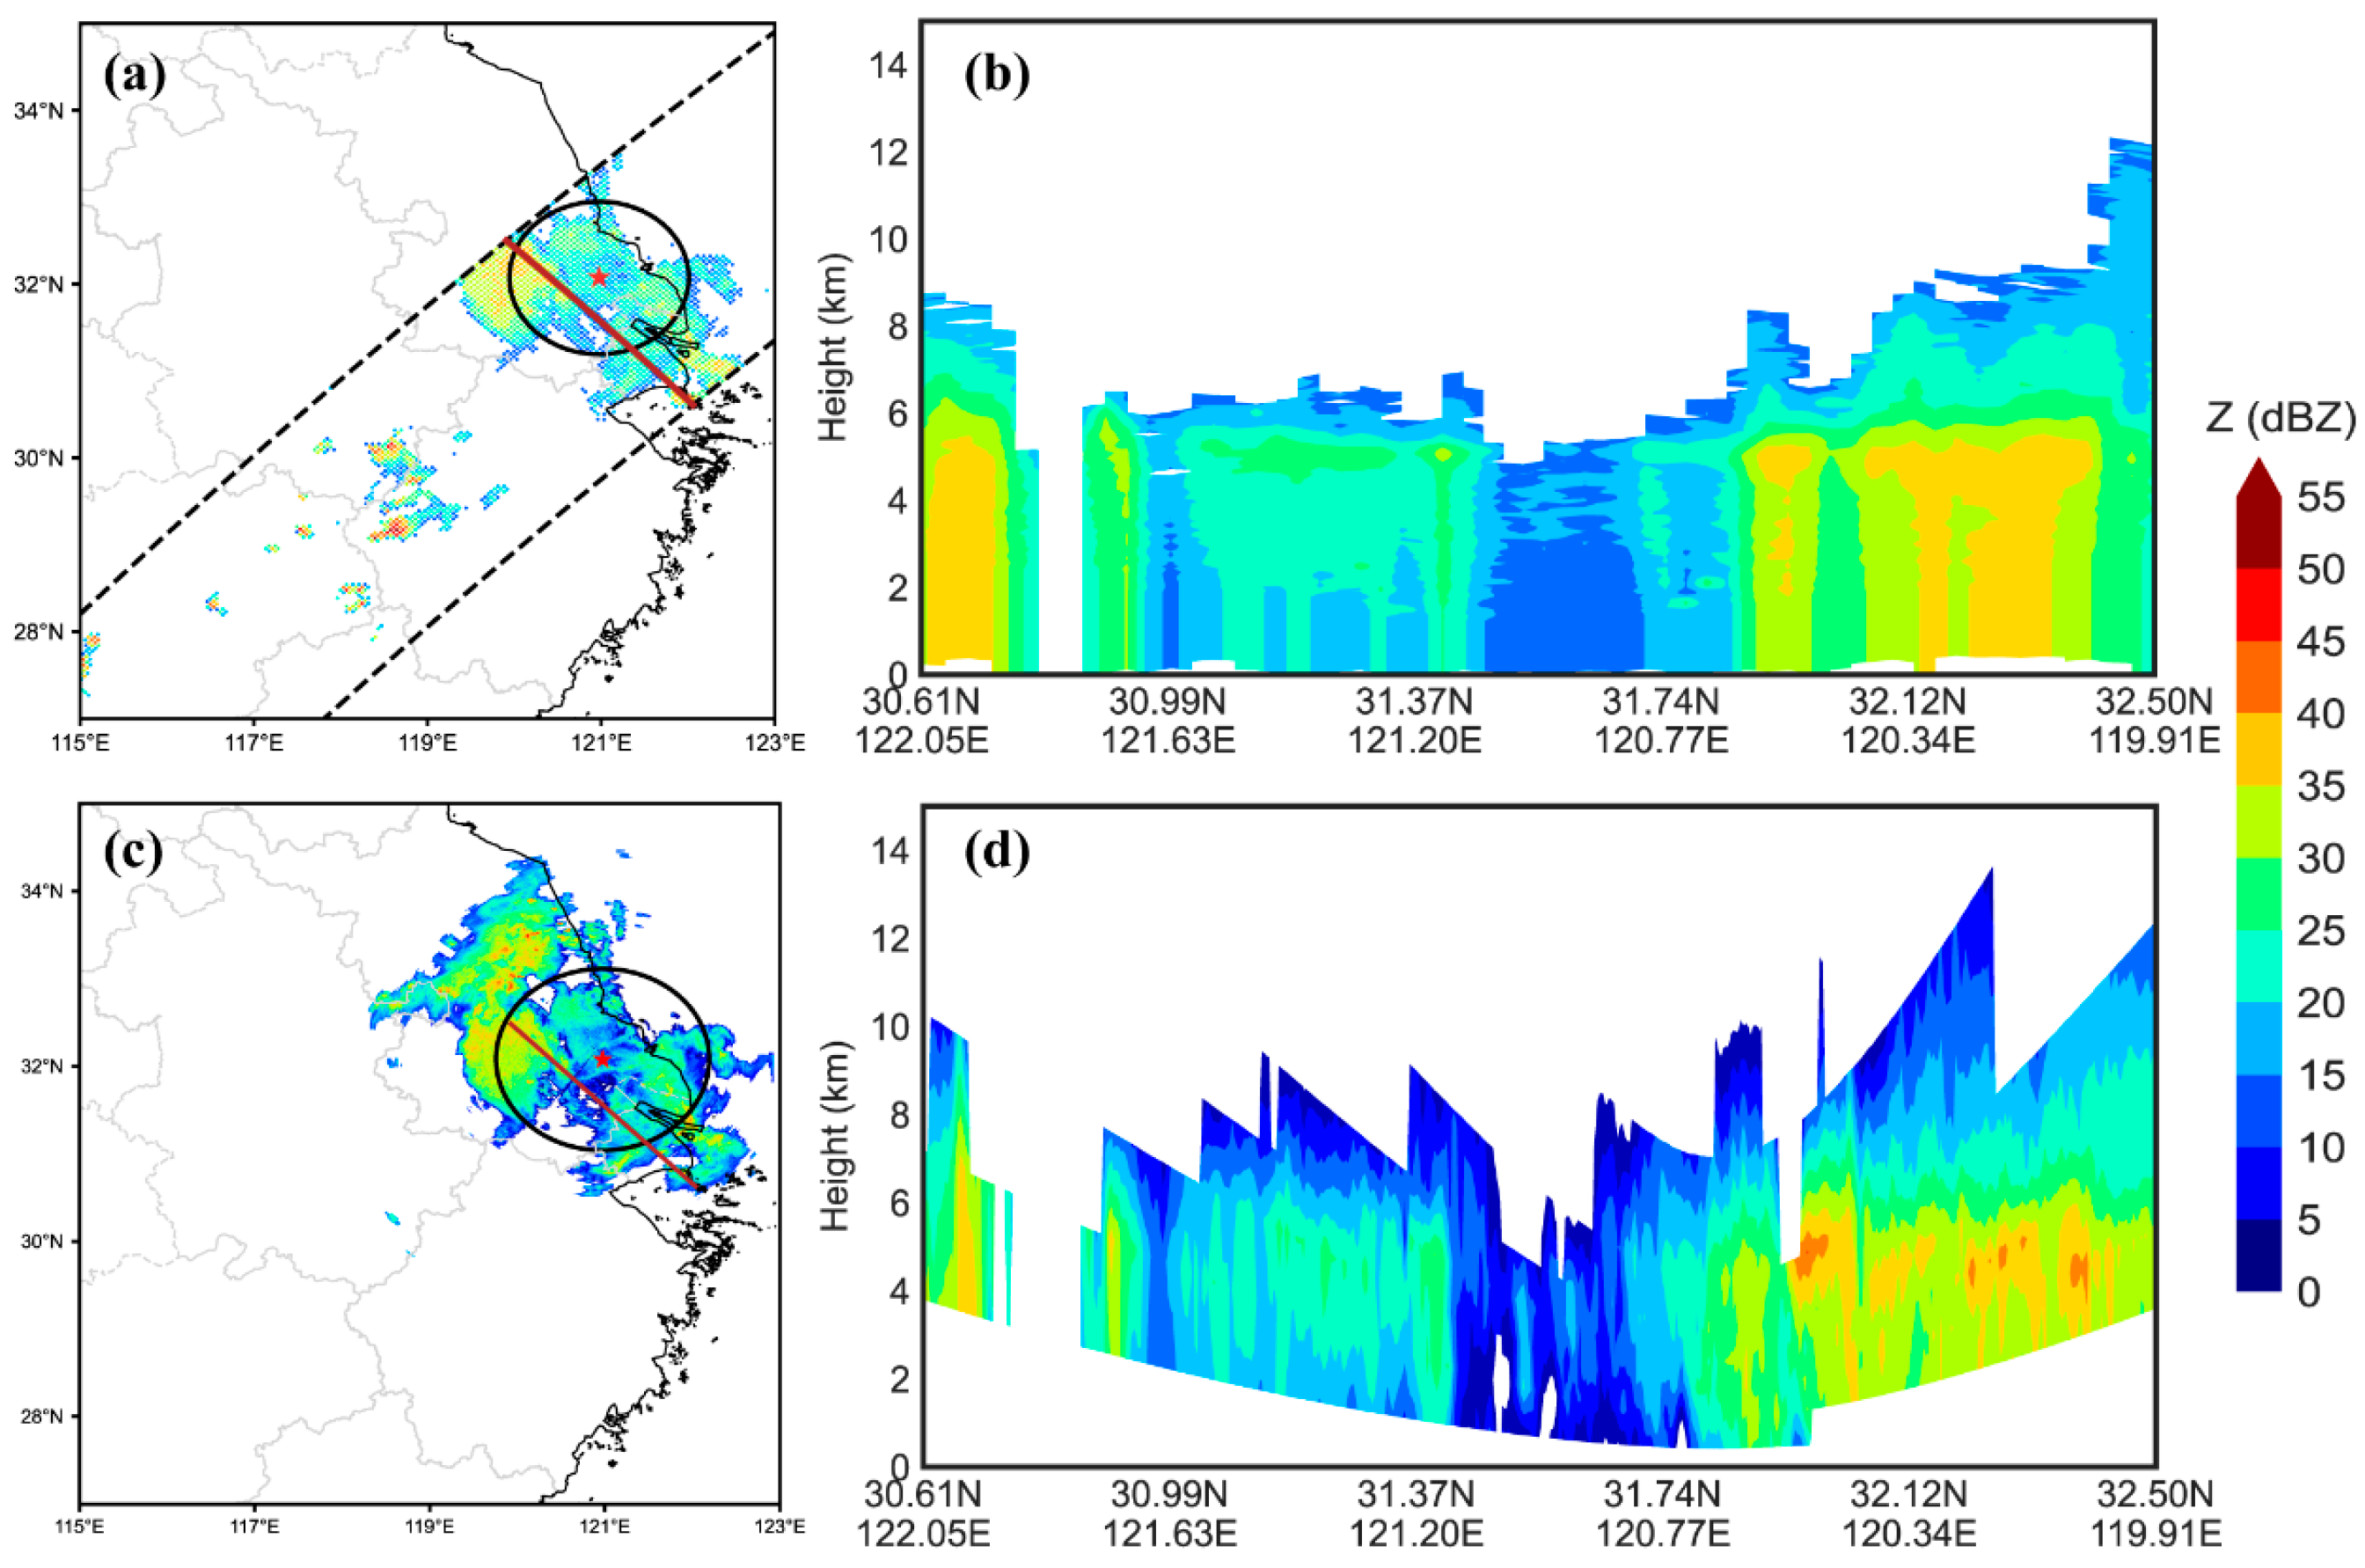
3.1.1. Mei-Yu Case

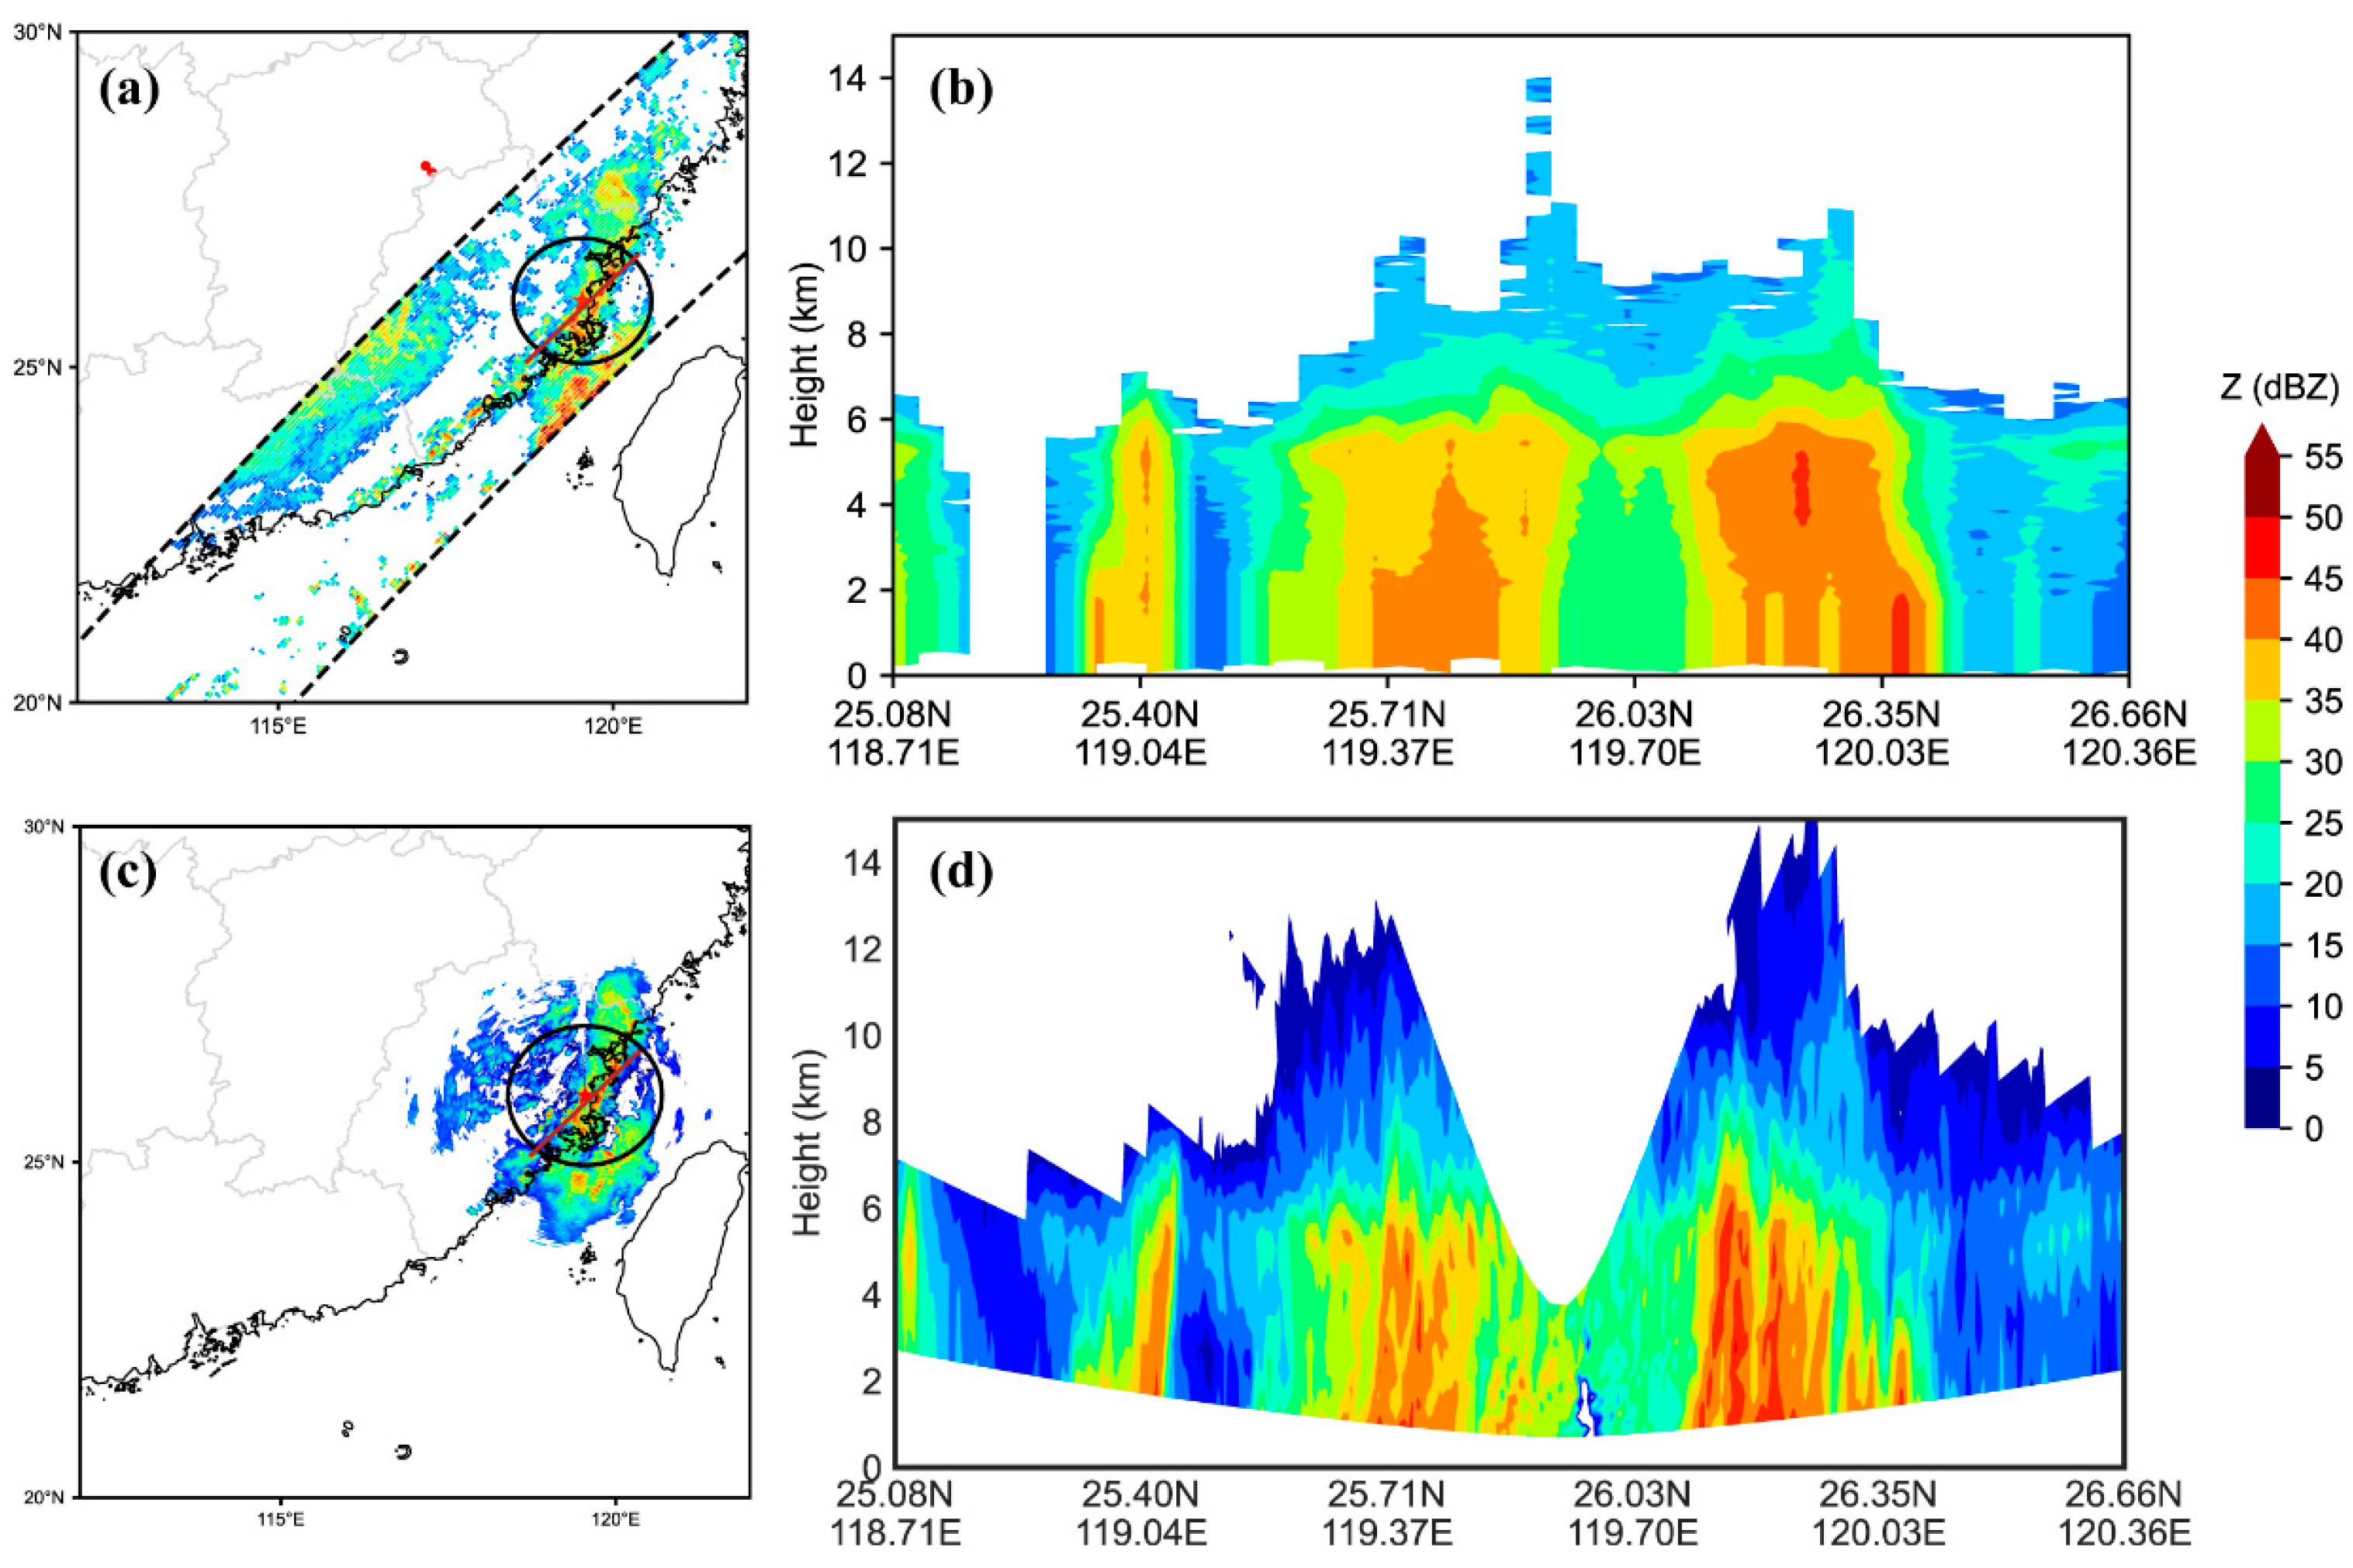
3.1.2. Typhoon Case
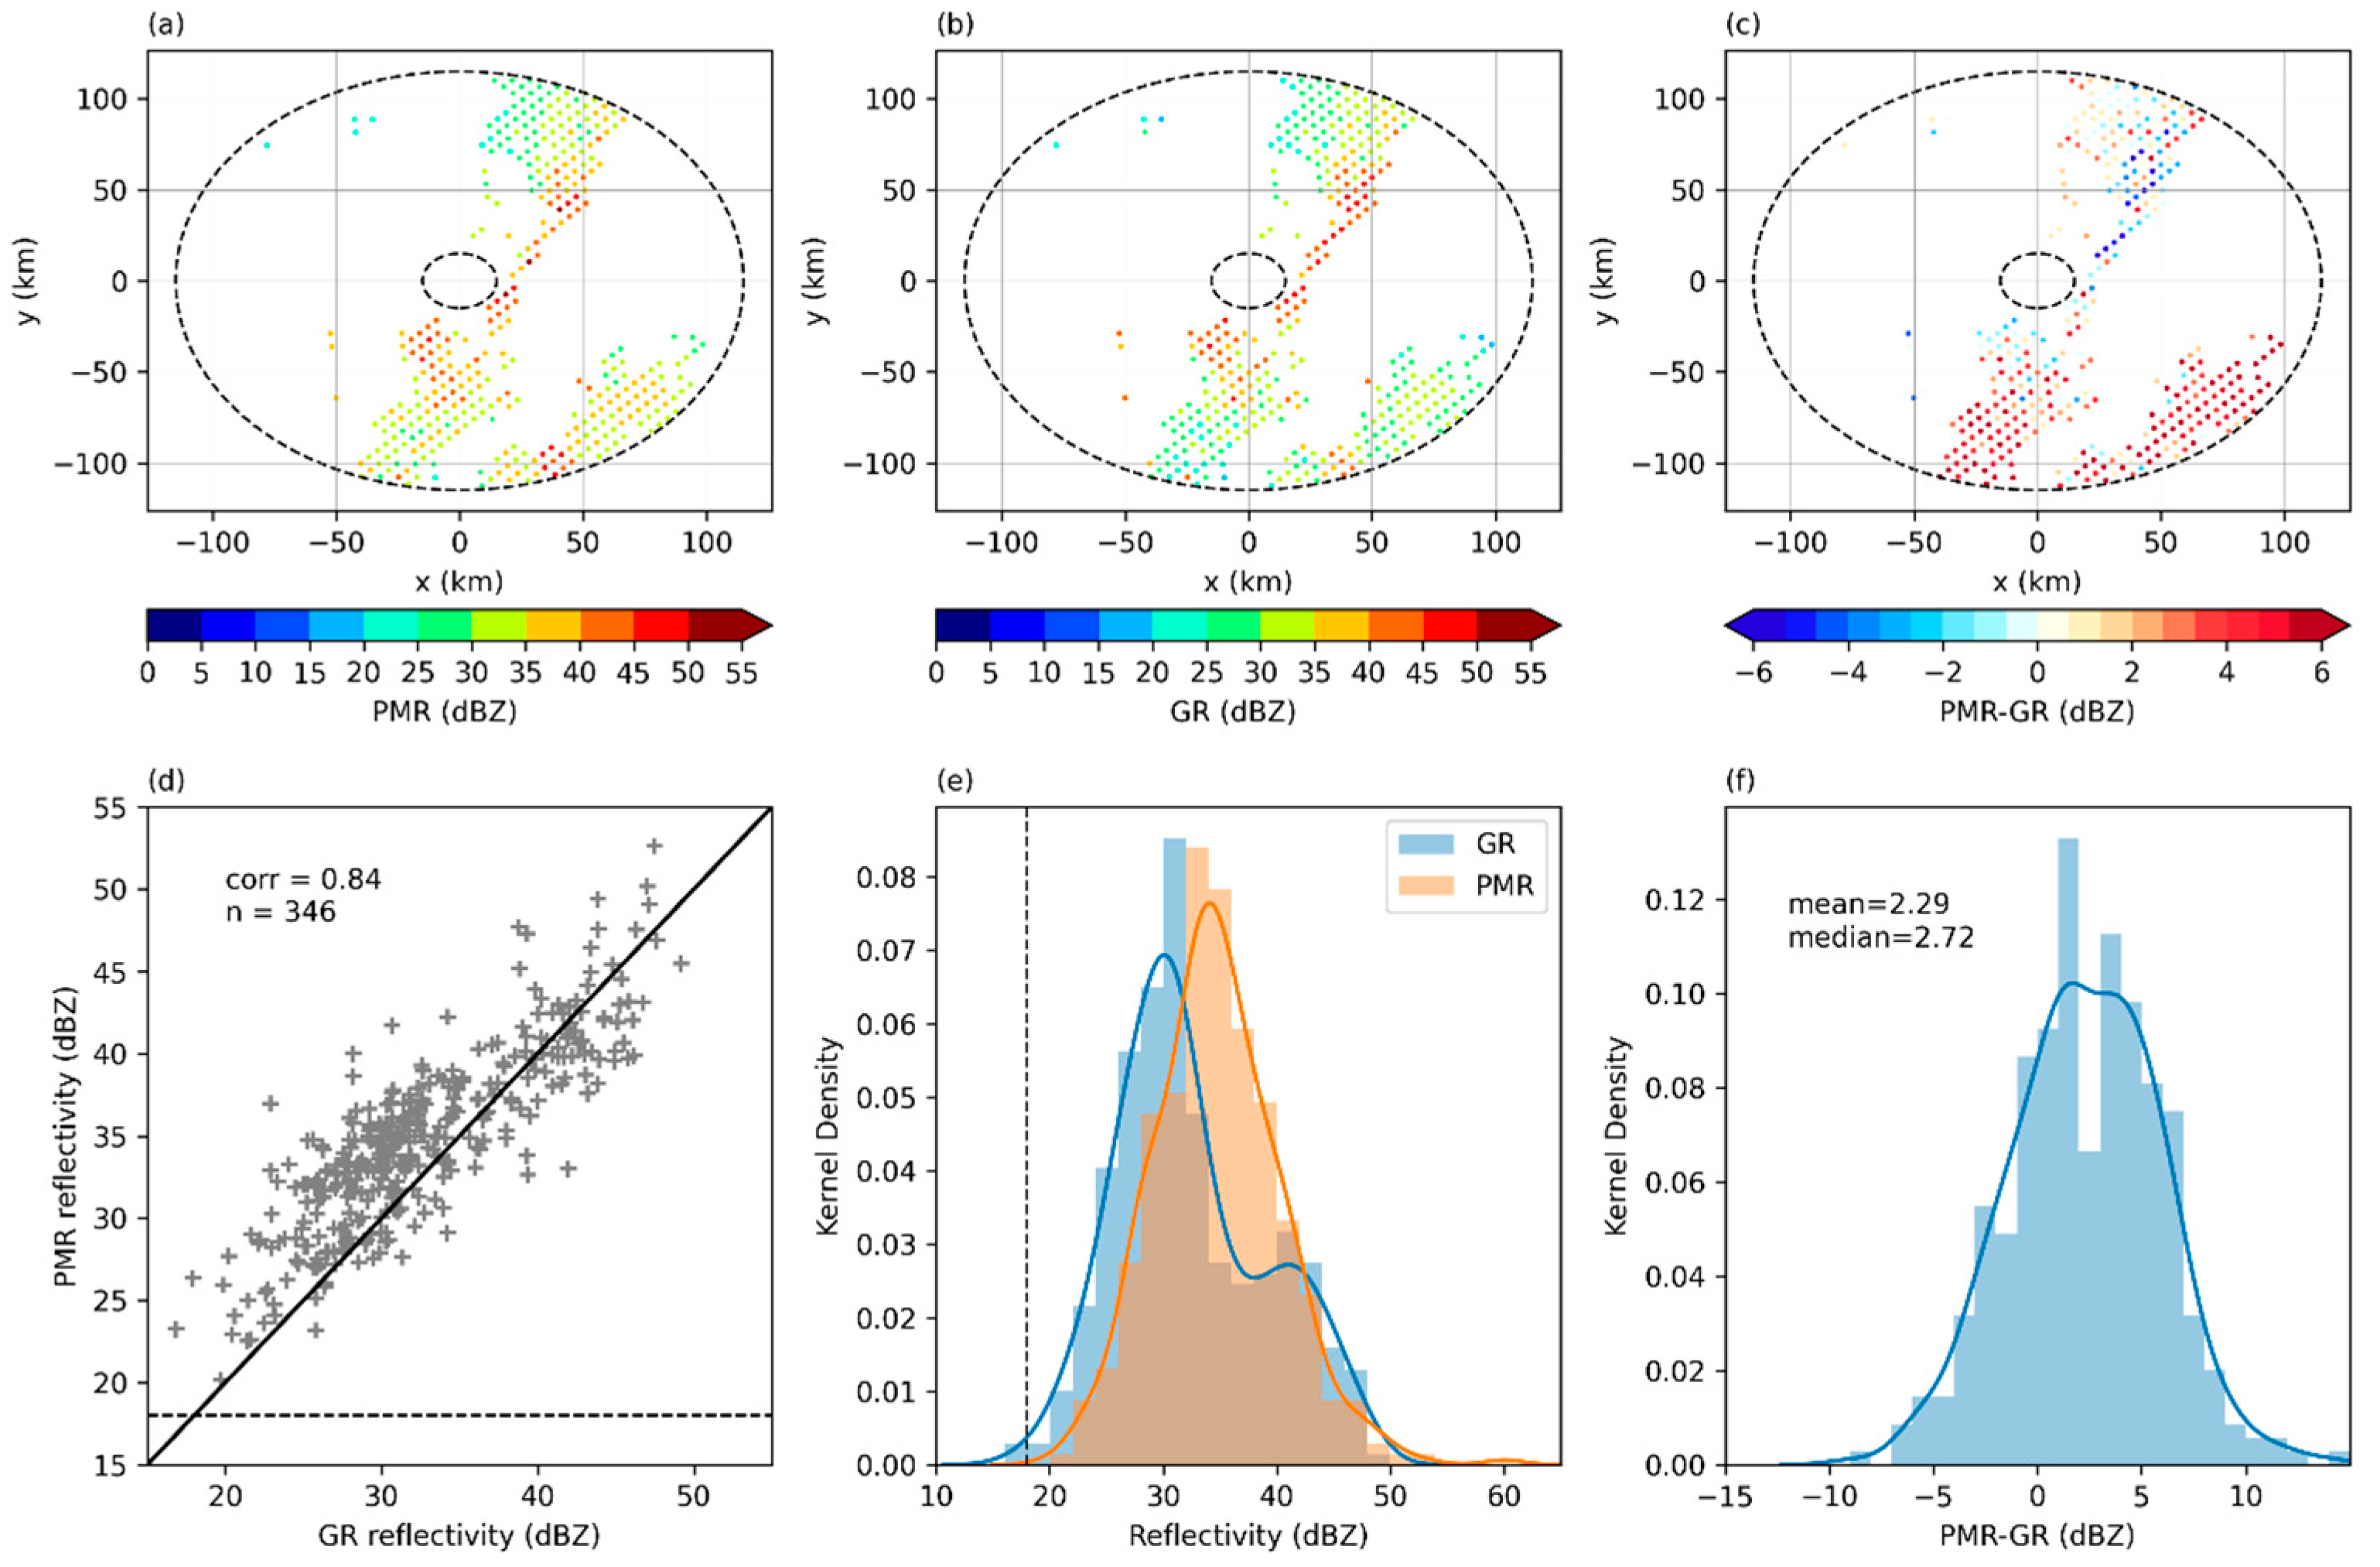
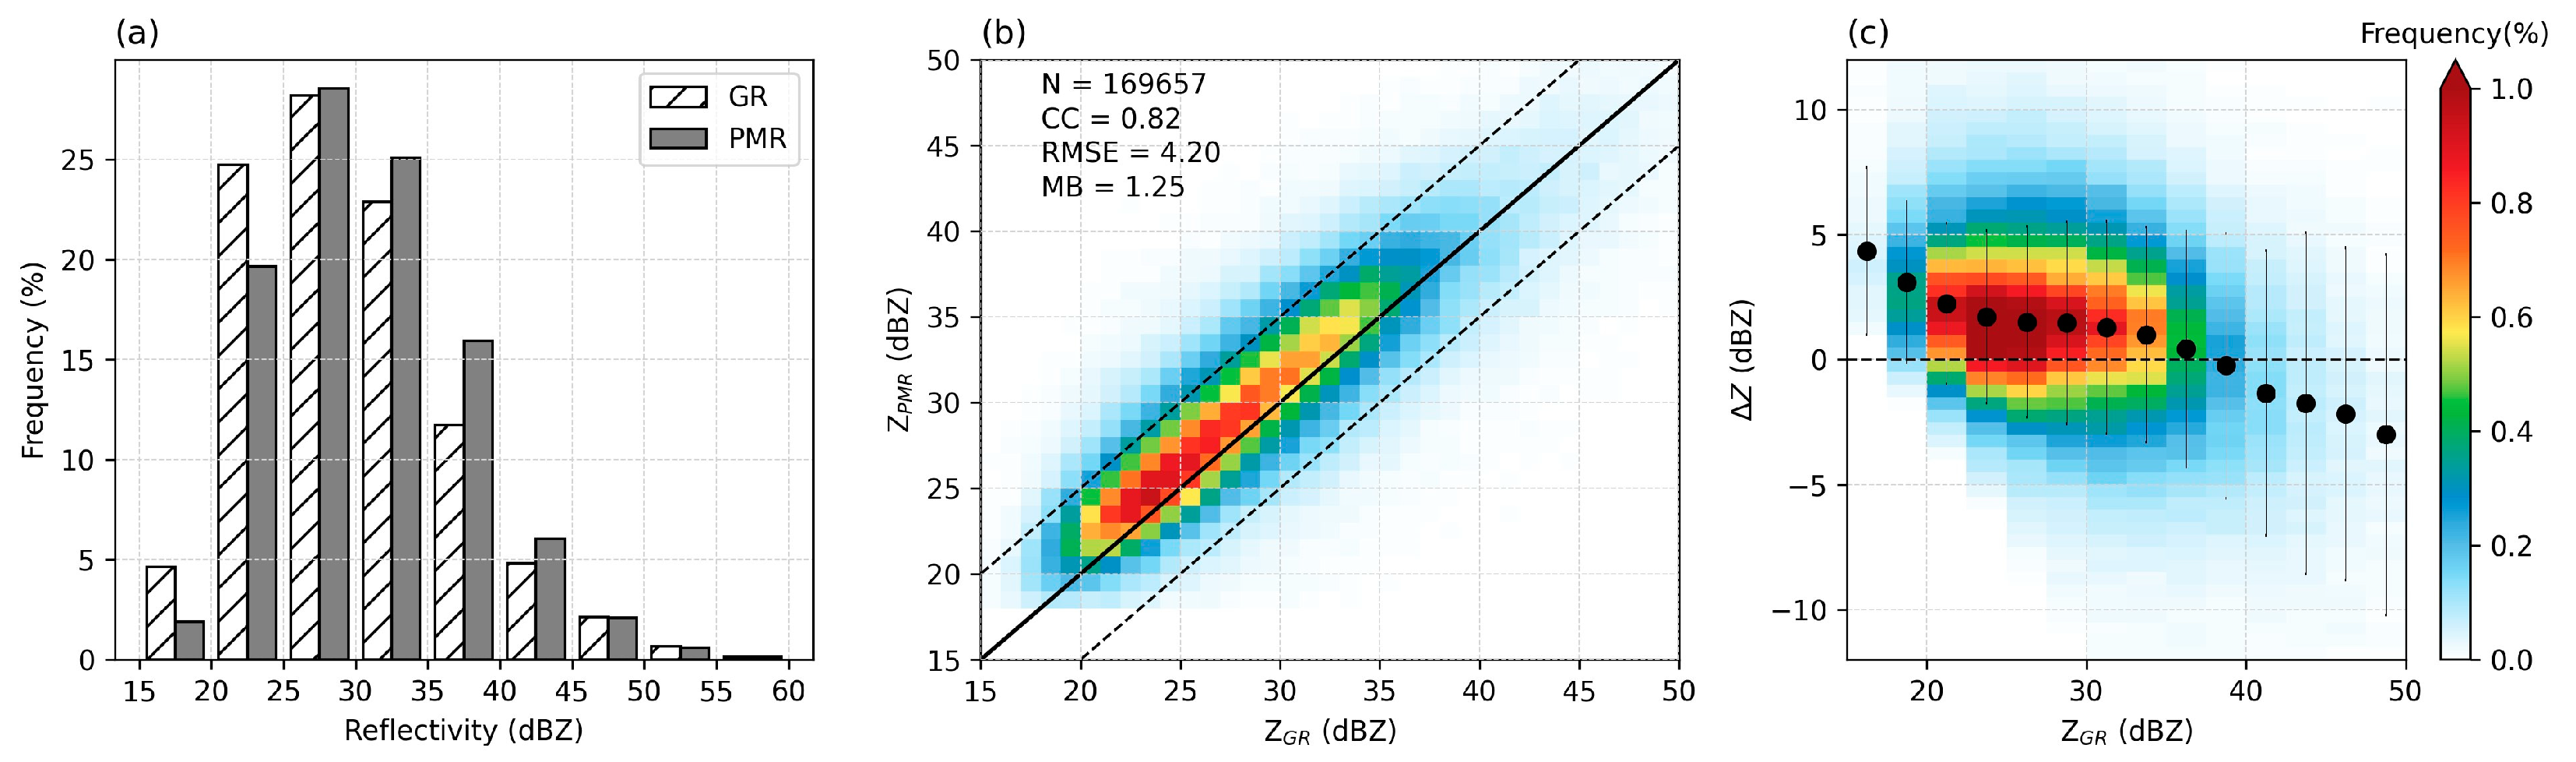
3.2. Characteristics of All Matching Samples
3.3. Sensitivity Analysis
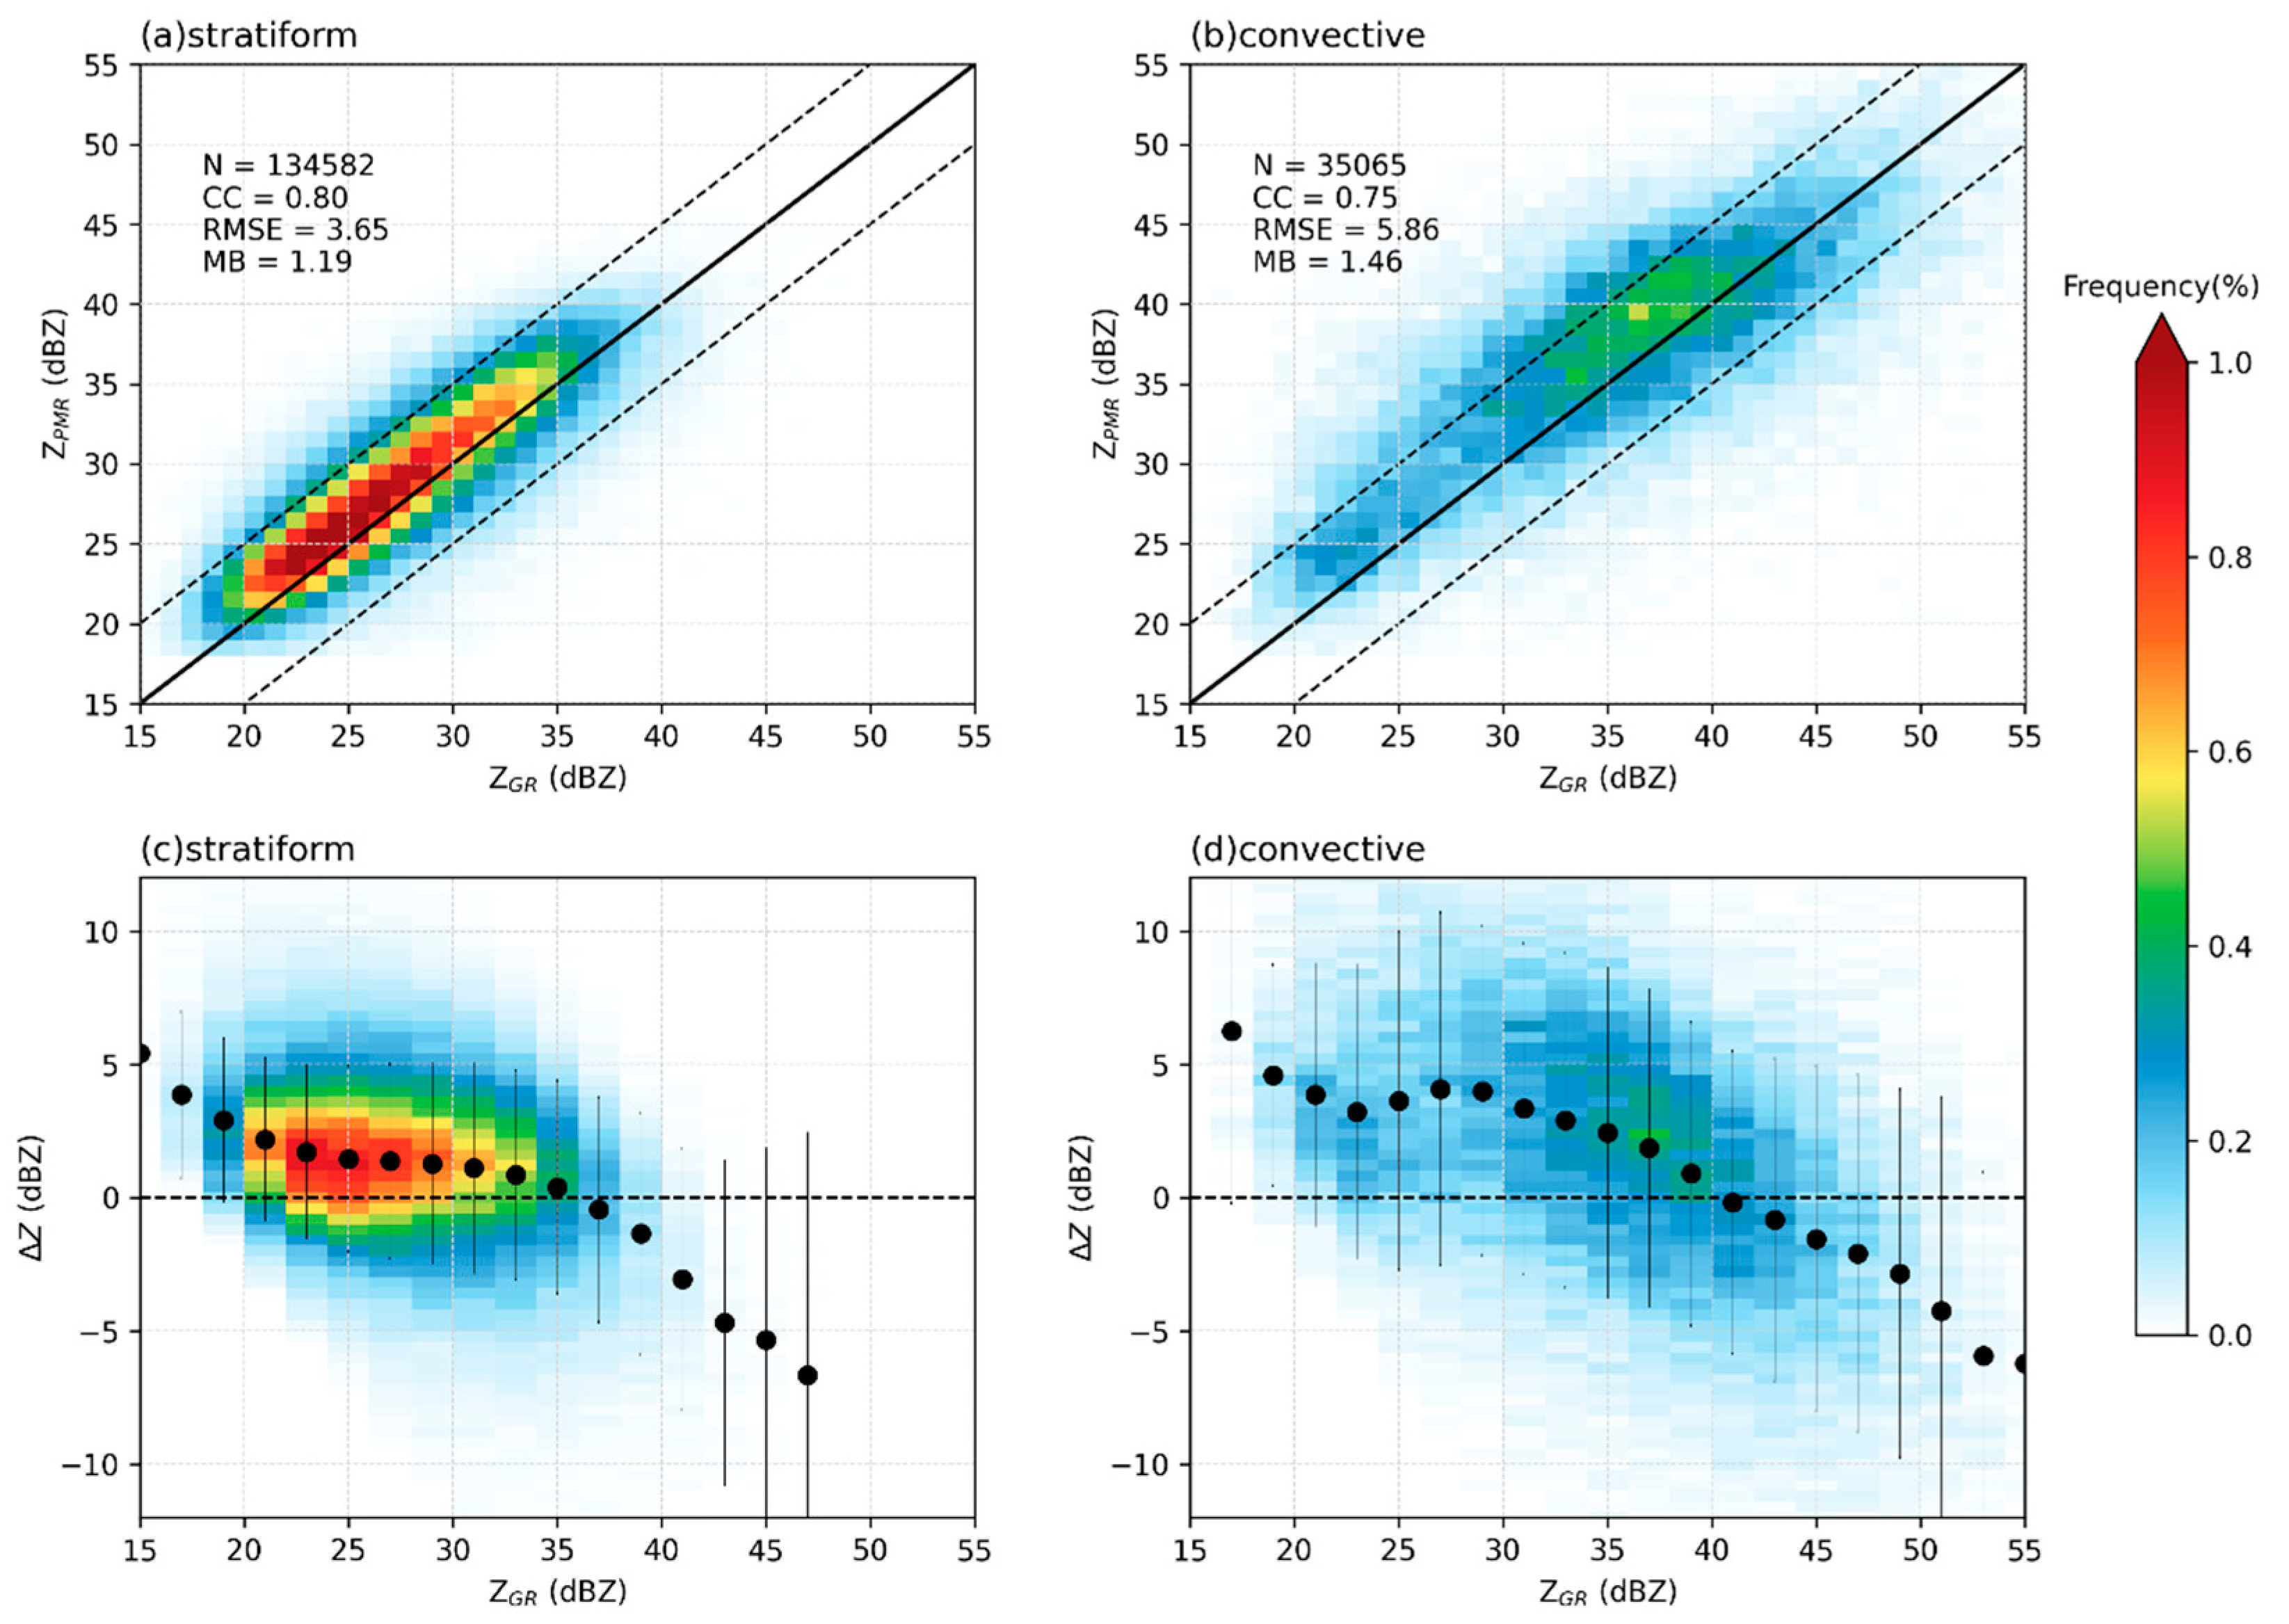
3.3.1. Rain Type
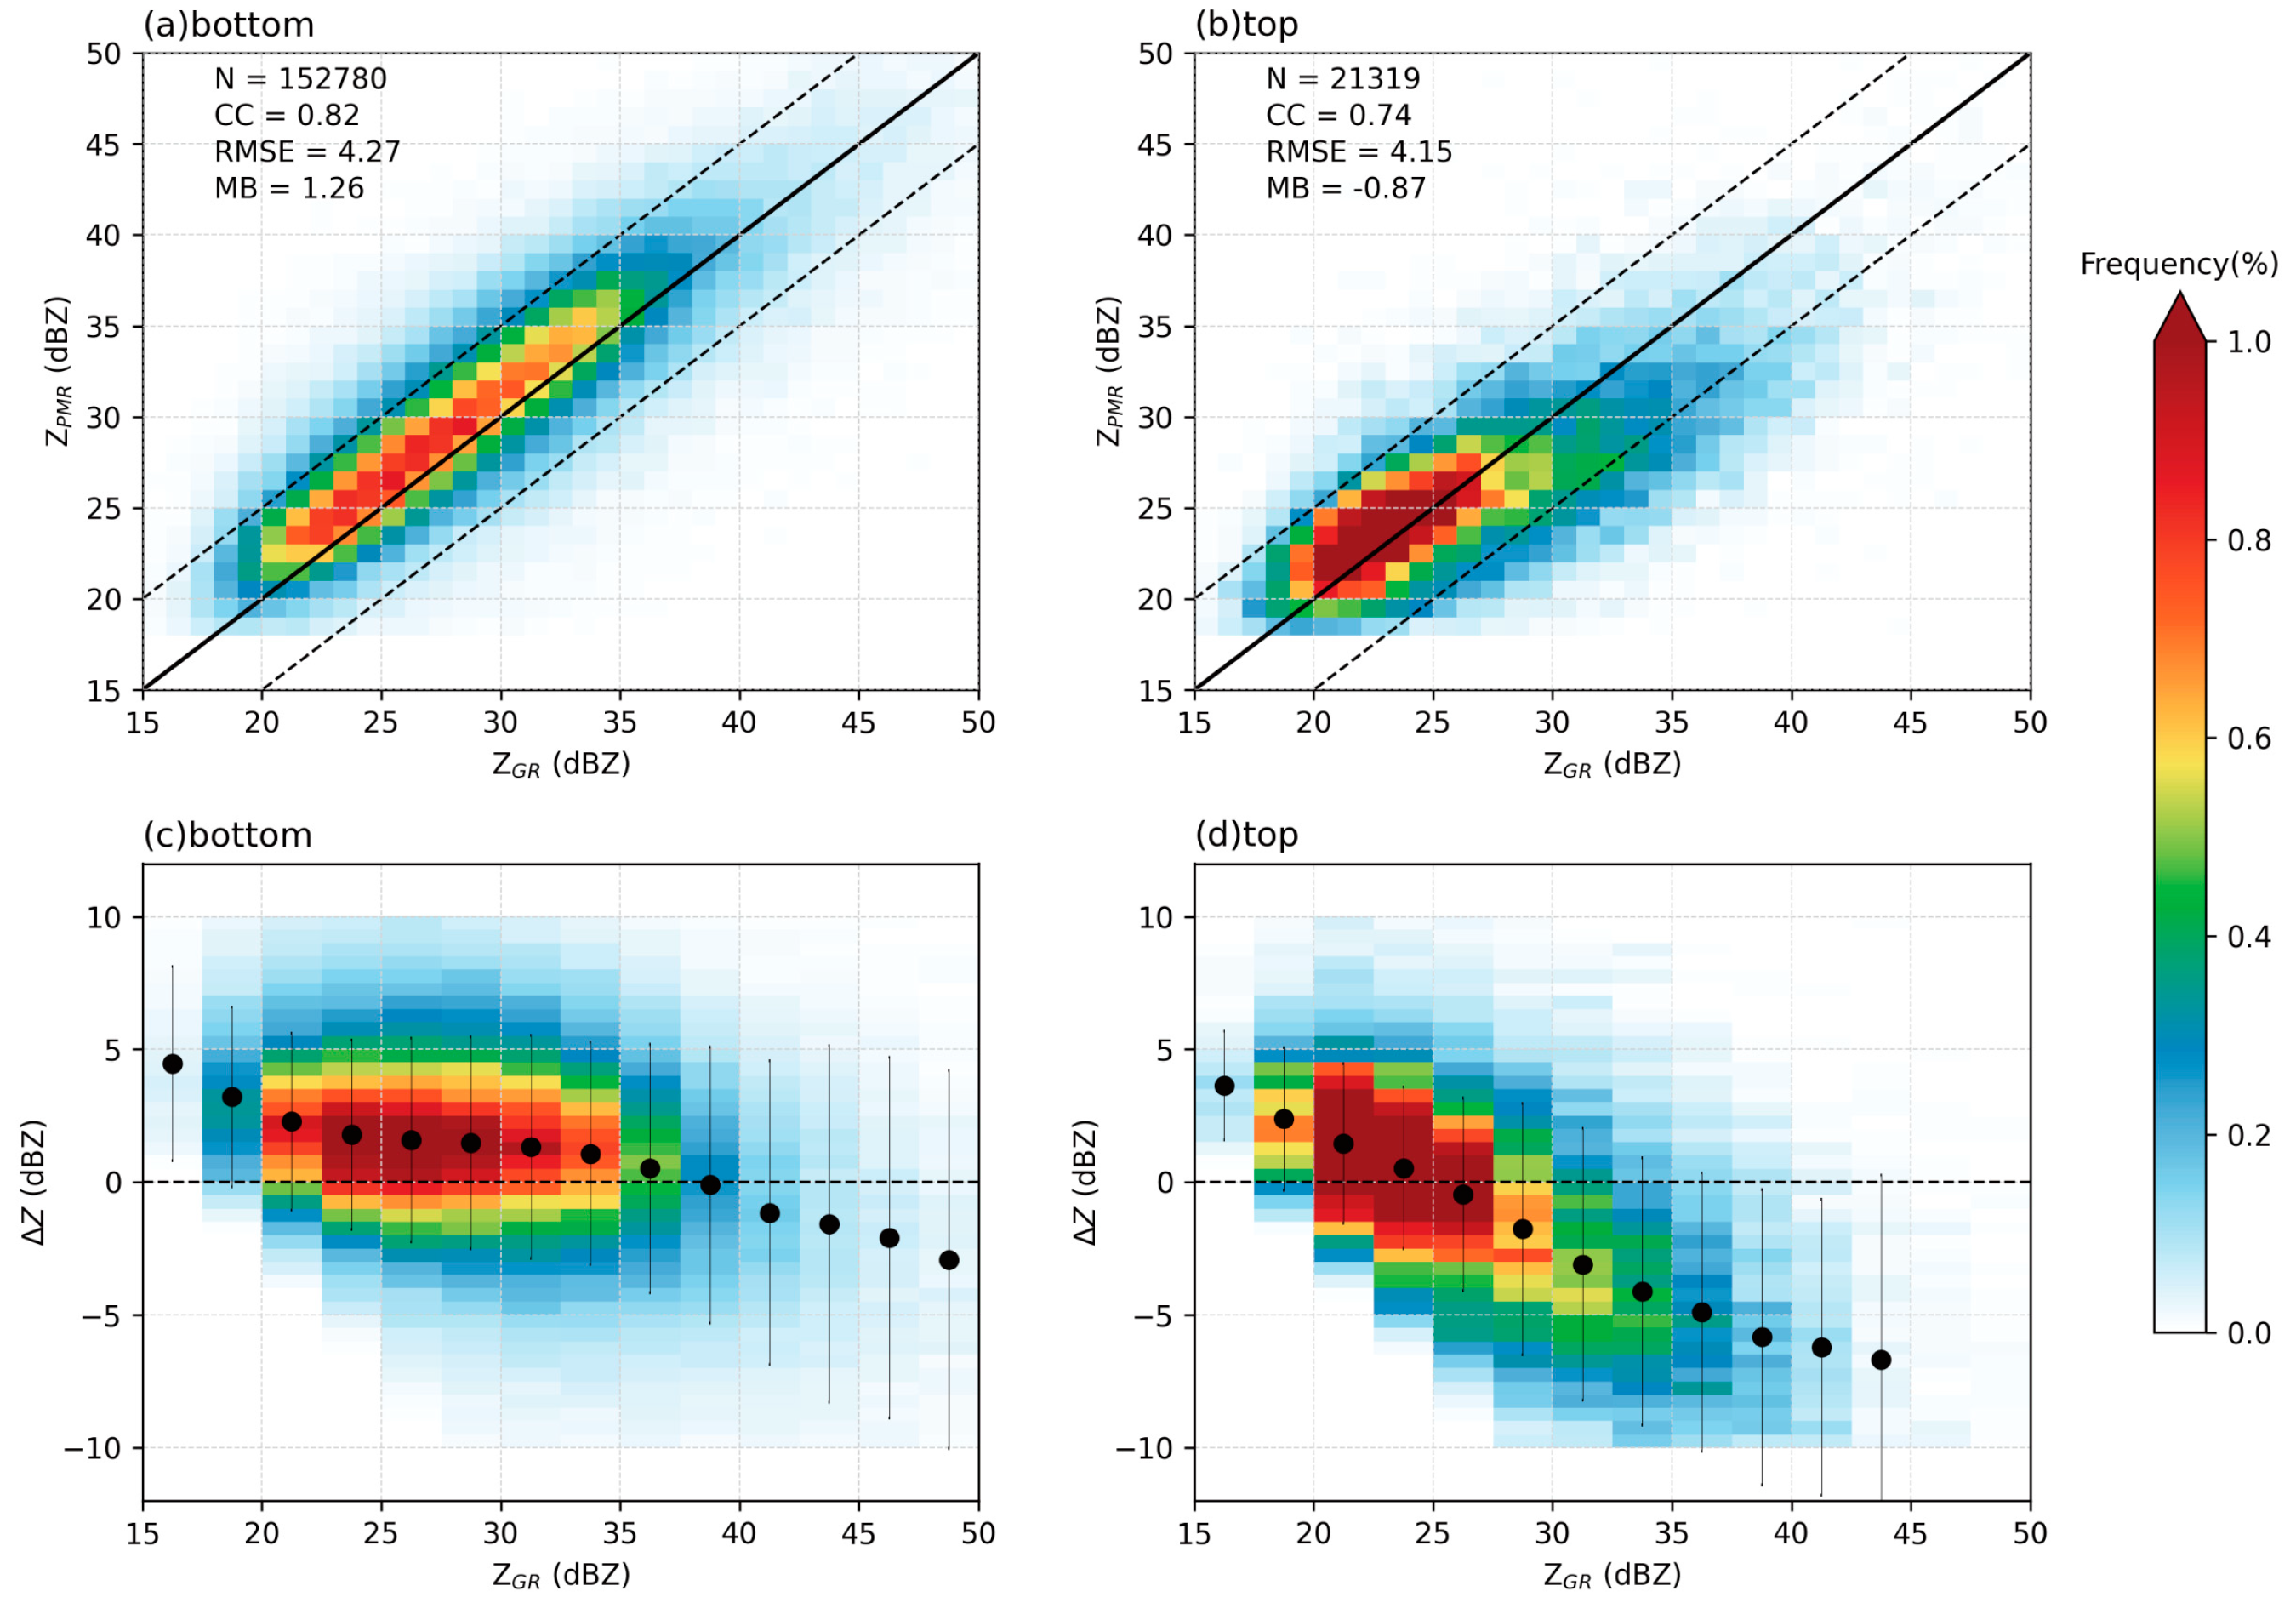
3.3.2. Droplet Phases
4. Discussion
5. Conclusions
- (1)
- Whether the study is based on two individual cases (Mei-yu and Typhoon) or entire samples, the reflectivity of FY-3G PMR and GR shows a strong positive correlation, with an overall correlation coefficient of 0.82. For moderate precipitation (e.g., during the Mei-yu season in 2024), the two radars show good consistency, with FY-3G PMR successfully detecting a strong echo location, and with the same echo pattern and intensity distribution compared to GR. However, there is general overestimation of reflectivity for FY-3G PMR compared to GR, with an average deviation of 1 to 3 dBZ. As for heavy precipitation events, FY-3G PMR shows slight underestimation.
- (2)
- The analysis of stratiform versus convective precipitation shows that FY-3G PMR performs better in stratiform precipitation, especially at moderate precipitation, in which measurement biases are small. In contrast, the performance of FY-3G PMR in convective precipitation is less stable with relatively larger uncertainty. However, the CC of 0.75 in convective precipitation still remains a relatively high level.
- (3)
- FY-3G PMR demonstrates high accuracy in detecting liquid precipitation below the bright band, with a strong correlation to GR and small errors. However, in ice-phase precipitation above the bright band, FY-3G PMR shows a tendency to underestimate reflectivity, particularly in regions with intense ice-phase precipitation. Nevertheless, FY-3G PMR still provides valuable information for ice-phase precipitation (CC = 0.74).
Author Contributions
Funding
Data Availability Statement
Conflicts of Interest
References
- Huang, X.; Wu, Z.; Xie, Y.; Zhang, Y.; Zhang, L.; Zheng, H.; Xiao, W. Precipitation Microphysics of Locally-Originated Typhoons in the South China Sea Based on GPM Satellite Observations. Remote Sens. 2023, 15, 2657. [Google Scholar] [CrossRef]
- Battaglia, A.; Kollias, P.; Dhillon, R.; Roy, R.; Tanelli, S.; Lamer, K.; Grecu, M.; Lebsock, M.; Watters, D.; Mroz, K. Spaceborne Cloud and Precipitation Radars: Status, Challenges, and Ways Forward. Rev. Geophys. 2020, 58, e2019RG000686. [Google Scholar] [CrossRef]
- Hamada, A.; Takayabu, Y. Improvements in Detection of Light Precipitation with the Global Precipitation Measurement Dual-Frequency Precipitation Radar (GPM DPR). J. Atmos. Ocean. Technol. 2016, 33, 653–667. [Google Scholar] [CrossRef]
- Zhang, P.; Gu, S.; Chen, L.; Shang, J.; Lin, M.; Zhu, A.; Yin, H.; Wu, Q.; Shou, Y.; Sun, F.; et al. FY-3G Satellite Instruments and Precipitation Products: First Report of China’s Fengyun Rainfall Mission In-Orbit. J. Remote Sens. 2023, 3, 97. [Google Scholar] [CrossRef]
- Gu, Y.; Lu, N.; Wu, Q.; Yin, H.; Shang, J.; Sun, F.; Chen, L.; Zhang, P. Analysis and prospect of precipitation detection capability of FY-3 meteorological satellites. J. Mar. Meteorol. 2022, 42, 1–10. [Google Scholar] [CrossRef]
- Seela, B.K.; Janapati, J.; Lin, P.L.; Lan, C.; Huang, M. Evaluation of GPM DPR rain parameters with north Taiwan disdrometers. J. Hydrol. 2024, 25, 47–64. [Google Scholar] [CrossRef]
- Liao, L.; Meneghini, R. Validation of TRMM Precipitation Radar through Comparison of Its Multiyear Measurements with Ground-Based Radar. J. Appl. Meteorol. Climatol. 2009, 48, 804–817. [Google Scholar] [CrossRef]
- Seto, S. Evaluation of DPR Products with Ground-Based Radar Network Over Japan. In Proceedings of the IGARSS 2024—2024 IEEE International Geoscience and Remote Sensing Symposium, Athens, Greece, 7–12 July 2024. [Google Scholar] [CrossRef]
- Schwaller, M.R.; Morris, K.R. A Ground Validation Network for the Global Precipitation Measurement Mission. J. Atmos. Ocean. Technol. 2011, 28, 301–319. [Google Scholar] [CrossRef]
- Warren, R.A.; Protat, A.; Siems, S.T.; Ramsay, H.A.; Louf, V.; Manton, M.J.; Kane, T.A. Calibrating Ground-Based Radars against TRMM and GPM. J. Atmos. Ocean. Technol. 2018, 35, 323–346. [Google Scholar] [CrossRef]
- Huang, H.; Zhao, K.; Fu, P.; Chen, H.; Chen, G.; Zhang, Y. Validation of Precipitation Measurements from the Dual-Frequency Precipitation Radar Onboard the GPM Core Observatory Using a Polarimetric Radar in South China. IEEE Trans. Geosci. Remote Sens. 2022, 15, 2657. [Google Scholar] [CrossRef]
- Liu, X.; Li, H.; He, P.; Li, D.; Zheng, Y. Comparison on the Precipitation Measurement Between GPM/DPR and CINRAD Radars. J. Appl. Meteorol. Sci. 2018, 29, 667–679. [Google Scholar] [CrossRef]
- Yang, Z.; Kou, L.; Jiang, Y. Comparative Study Between GPM Dual-frequency Precipitation Radar and C-band Radar. Mod. Radar 2022, 42, 19–24. [Google Scholar] [CrossRef]
- Chen, P.; Chen, L.; Wang, G.; Wu, Q.; Wang, H.; Zhang, P. Comparison of reflectivity consistency between space-borne precipitation radar and ground-based weather radar in China and the United States. Adv. Atmos. Sci. 2025, in press. [CrossRef]
- Fy-3g Pmr Level-2 Product Instructions Document. Available online: https://img.nsmc.org.cn/PORTAL/NSMC/DATASERVICE/OperatingGuide/FY3G/%E9%A3%8E%E4%BA%91%E4%B8%89%E5%8F%B7G%E6%98%9FPMR%E9%99%8D%E6%B0%B4%E4%BA%A7%E5%93%81%E4%BD%BF%E7%94%A8%E8%AF%B4%E6%98%8E.pdf (accessed on 9 December 2023). (In Chinese).
- Wu, Q.; Yang, M.; Chen, L.; Yin, H.; Shang, J.; Gu, S. A frequency correction algorithm for spaceborne precipitation measurement radar and ground-based weather radar. Acta Meteorol. Sin. 2023, 81, 353–360. (In Chinese) [Google Scholar] [CrossRef]
- Richards, M.A.; Scheer, J.A.; Holm, W.A. Principles of Modern Radar: Basic Principles; SciTech Publishing: Edison, NJ, USA, 2010. [Google Scholar]
- Wen, L.; Zhao, K.; Chen, G.; Wang, M.; Zhou, B.; Huang, H.; Hu, D.; Lee, W.; Hu, H. Drop Size Distribution Characteristics of Seven Typhoons in China. J. Geophys. Res. Atmos. 2018, 123, 6529–6548. [Google Scholar] [CrossRef]
- Cao, Q.; Yeary, M.B.; Zhang, G. Efficient ways to learn weather radar polarimetry. IEEE Trans. Educ. 2012, 55, 58–68. [Google Scholar] [CrossRef]
- Huang, H.; Zhao, K.; Zhang, G.; Hu, D.; Yang, Z. Optimized raindrop size distribution retrieval and quantitative rainfall estimation from polarimetric radar. J. Hydrol. 2020, 580, 124–248. [Google Scholar] [CrossRef]
- Cao, Q.; Hong, Y.; Qi, Y.; Wen, Y.; Zhang, J.; Gourley, J.J.; Liao, L. Empirical conversion of the vertical profile of reflectivity from Ku-band to S-band frequency. J. Geophys. Res. Atmos. 2013, 118, 1814–1825. [Google Scholar] [CrossRef]
- Keem, M.; Seo, B.C.; Krajewski, W.F.; Morris, K.R. Inter-comparison of reflectivity measurements between GPM DPR and NEXRAD radars. Atmos. Res. 2019, 226, 49–65. [Google Scholar] [CrossRef]
- Ding, Y.; Liu, J.; Sun, Y.; Liu, Y.; He, J.; Song, Y. A Study of the Synoptic-Climatology of the Meiyu System in East Asia. Chin. J. Atmos. Sci. 2007, 31, 1082–1101. [Google Scholar] [CrossRef]
- Li, Z.; Wen, Y.; Liao, L.; Wolff, D.; Meneghini, R.; Schuur, T. Joint collaboration on comparing NOAA’s ground-based weather radar and NASA-JAXA’s spaceborne radar. Bull. Am. Meteorol. Soc. 2023, 104, 1435–1451. [Google Scholar] [CrossRef]


| Radar Systems | FY-3G PMR | GPM-DPR | TRMM PR |
|---|---|---|---|
| Frequency band | Ku (13.6 GHz), Ka (35.5 GHz) | Ku (13.6 GHz) | |
| Vertical resolution (m) | 250 | 250 (Ku), 250/500 (Ka) | 250 |
| Horizontal resolution (km) | 5 | 5 | 5 |
| Orbital periods (min) | 93 | 91 | 91.3 |
| Swath width (km) | 303 | 245 (Ku), 115 (Ka) | 215 |
| Vertical detectable range (km) | 18~−5 ASL | 18~−5 ASL(Ku), 18~−3 ASL (Ka) | 15~−5 ASL |
| Minimum detectable precipitation rate (mm/h) | 0.5 (18 dBZ, Ku), 0.2 (12 dBZ, Ka) | 0.5 (18 dBZ, Ku), 0.2 (12 dBZ, Ka) | 0.7 |
| Coverage | 50°N–50°S | 65°N–65°S | 35°N~35°S |
| Antenna peak sidelobe (dB) | ≤−30 | ≤−25 | ≤−25 |
| Radar Systems | FY-3G PMR | GR |
|---|---|---|
| Frequency band | Ku (13.6 GHz), Ka (35.5 GHz) | S (3 GHz) |
| Resolution (km) | 5 (Horizontal), 0.25 (Vertical) | 0.25 |
| Cycle for one track (min) | 93 min | 6 min |
| Scan mode | Vertical scan | Cone scan |
| Minimum detectable precipitation rate (mm/h) | 0.5 mm/h (18 dBZ, Ku), 0.2 mm/h (12 dBZ, Ka) | N/A |
| Coverage | 50°N–50°S | 460 km |
| Beam width () | 0.7 | ≈1.0 |
| Elevation | 1.5° | 2.4° | 3.4° | 4.3° | 6.0° | 10.0° | Total | |
|---|---|---|---|---|---|---|---|---|
| Stratiform | N | 46,916 | 35,704 | 26,881 | 16,932 | 6887 | 1262 | 134,582 |
| CC | 0.80 | 0.77 | 0.79 | 0.80 | 0.79 | 0.76 | 0.80 | |
| MB | 1.60 | 0.93 | 0.96 | 1.05 | 1.063 | 0.93 | 1.19 | |
| RMSE | 3.66 | 3.70 | 3.61 | 3.59 | 3.65 | 3.61 | 3.65 | |
| Convective | N | 10,127 | 8692 | 7377 | 5617 | 2555 | 697 | 35,065 |
| CC | 0.68 | 0.68 | 0.77 | 0.77 | 0.76 | 0.76 | 0.75 | |
| MB | 1.57 | 1.17 | 1.47 | 1.66 | 1.72 | 0.79 | 1.46 | |
| RMSE | 5.73 | 5.83 | 5.86 | 5.98 | 6.22 | 6.01 | 5.86 | |
| All | N | 57,043 | 44,396 | 34,268 | 22,548 | 9443 | 1959 | 169,657 |
| CC | 0.83 | 0.81 | 0.82 | 0.82 | 0.81 | 0.80 | 0.82 | |
| MB | 1.59 | 0.98 | 1.07 | 1.20 | 1.24 | 0.88 | 1.25 | |
| RMSE | 4.10 | 4.20 | 4.19 | 4.31 | 4.49 | 4.61 | 4.20 | |
Disclaimer/Publisher’s Note: The statements, opinions and data contained in all publications are solely those of the individual author(s) and contributor(s) and not of MDPI and/or the editor(s). MDPI and/or the editor(s) disclaim responsibility for any injury to people or property resulting from any ideas, methods, instructions or products referred to in the content. |
© 2025 by the authors. Licensee MDPI, Basel, Switzerland. This article is an open access article distributed under the terms and conditions of the Creative Commons Attribution (CC BY) license (https://creativecommons.org/licenses/by/4.0/).
Share and Cite
He, R.; Li, H.; Luo, J.; Huang, H.; Zhu, Y. Comparison of the Reflectivities from Precipitation Measurement Radar Onboard the FY-3G Satellite and Ground-Based S-Band Dual-Polarization Radars. Remote Sens. 2025, 17, 1117. https://doi.org/10.3390/rs17071117
He R, Li H, Luo J, Huang H, Zhu Y. Comparison of the Reflectivities from Precipitation Measurement Radar Onboard the FY-3G Satellite and Ground-Based S-Band Dual-Polarization Radars. Remote Sensing. 2025; 17(7):1117. https://doi.org/10.3390/rs17071117
Chicago/Turabian StyleHe, Rui, Hong Li, Jingyao Luo, Hao Huang, and Yijie Zhu. 2025. "Comparison of the Reflectivities from Precipitation Measurement Radar Onboard the FY-3G Satellite and Ground-Based S-Band Dual-Polarization Radars" Remote Sensing 17, no. 7: 1117. https://doi.org/10.3390/rs17071117
APA StyleHe, R., Li, H., Luo, J., Huang, H., & Zhu, Y. (2025). Comparison of the Reflectivities from Precipitation Measurement Radar Onboard the FY-3G Satellite and Ground-Based S-Band Dual-Polarization Radars. Remote Sensing, 17(7), 1117. https://doi.org/10.3390/rs17071117