Article

Selection of Landing Sites for the Chang’E-7 Mission Using Multi-Source Remote Sensing Data

1
National Key Laboratory of Microwave Imaging, Aerospace Information Research Institute, Chinese Academy of Sciences, Beijing 100190, China
2
School of Electronic, Electrical and Communication Engineering, University of Chinese Academy of Sciences, Beijing 100049, China
3
Planetary Remote Sensing Laboratory, Department of Land Surveying and Geo-Informatics, The Hong Kong Polytechnic University, Hong Kong, China
*
Author to whom correspondence should be addressed.
Remote Sens. 2025, 17(7), 1121; https://doi.org/10.3390/rs17071121
Submission received: 9 February 2025 / Revised: 17 March 2025 / Accepted: 18 March 2025 / Published: 21 March 2025
(This article belongs to the Special Issue Remote Sensing and Photogrammetry Applied to Deep Space Exploration)

Abstract

:
The Chinese Chang’E-7 (CE-7) mission is planned to land in the lunar south polar region, and then deploy a mini-flying probe to fly into the cold trap to detect the water ice. The selection of a landing site is crucial for ensuring both a safe landing and the successful achievement of its scientific objectives. This study presents a method for landing site selection in the challenging environment of the lunar south pole, utilizing multi-source remote sensing data. First, the likelihood of water ice in all cold traps within 85°S is assessed and prioritized using neutron spectrometer and hyperspectral data, with the most promising cold traps selected for sampling by CE-7’s mini-flying probe. Slope and illumination data are then used to screen feasible landing sites in the south polar region. Feasible landing sites near cold traps are aggregated into larger landing regions. Finally, high-resolution illumination maps, along with optical and radar images, are employed to refine the selection and identify the optimal landing sites. Six potential landing sites around the de Gerlache crater, an unnamed cold trap at (167.10°E, 88.71°S), Faustini crater, and Shackleton crater are proposed. It would be beneficial for CE-7 to prioritize mapping these sites post-launch using its high-resolution optical camera and radar for further detailed landing site investigation and evaluation.

1. Introduction

One of humanity’s most significant aspirations is to venture beyond Earth and establish a sustained presence on another planet or moon [1]. The Moon, as our closest celestial neighbor, serves as a promising initial target for this endeavor. In addition to its proximity facilitating easier access, the potential presence of water ice at its poles further intensifies interest among researchers and space agencies [2]. Water ice is a vital resource for sustaining human life and an essential material for producing rocket fuel, enabling further exploration, such as missions to Mars. Consequently, the existence and distribution of water ice at the Moon’s poles have become a focal point in contemporary lunar exploration [3,4].
Assessments of the occurrence and state of water ice on the Moon based on theoretical prediction [2,5] and remote sensing observations [6,7,8,9,10,11,12,13] have been conducted and ongoing since the last century. However, these observations only provide indirect evidence or become flawed due to confusing interpretation [7,14], coarse spatial resolution [10], and/or low signal-to-noise ratio (SNR) [9]. As seeing is believing, a thorough confirmation of the distribution of water ice at the poles of the Moon requires in situ measurements after a landing mission.
To this end, many space agencies and private companies are preparing their missions to land at the poles of the Moon [15,16,17,18,19,20,21,22]. The Chang’E-7 (CE-7) mission [17], led by the China National Space Administration (CNSA), plans to land at the south pole (>85°S) [23] of the Moon in 2026, with a high priority on the exploration of water ice. To accomplish its scientific goal of finding the “distribution and origins of lunar water ice and volatile components”, its main probe consists of an orbiter, lander, rover, and a mini-flying probe [17]. Such a wealthy configuration makes it a flagship mission of China’s lunar exploration project to date. As the same for the previous successful soft-landing missions on the Moon, landing site selection is crucial for CE-7 to satisfy its engineering constraints and maximize the achievability of scientific objectives.
Since landing site selection plays a key role in soft-landing missions, extensive research has been conducted on this topic [15,18,20,24,25,26,27,28,29,30,31,32,33,34,35,36,37,38,39,40,41,42,43]. Generally, the landing site selection operation is firstly driven by the science goals of the considered mission and later carefully finalized under engineering constraints. In the classical landing sites selection paradigm, various source data (e.g., optical images and topography data) covering the scientific interest regions are incorporated in a geographic information system (GIS) and inspected manually by engineering experts, accompanied by iterative communication with scientists [37]. This process can be tedious, time-consuming, and may miss optimal landing sites. Benefiting from the increasing lunar remote sensing data, screening methods on an overlay of multifactor datasets (e.g., slope, roughness, rock abundance, illumination, Earth visibility, etc.) have been broadly used to generate landing site proposals [20,24,28,29,30,32,34,36,39,42]. Thresholds for each factor and specific decision criteria should often be quantitatively preselected according to experience and the performance of the lander and/or rover [37]. Human operators can further fine-tune this screening process’s filtered landing site candidates. This automated screening process can save a lot of time. Machine learning methods have also recently been used in lunar landing site selection [30,42]. These methods can provide end-to-end results without knowing the exact decision thresholds for each factor. However, they largely depend on previous successful or human-curated landing sites, and migrating the application to other landing missions can be difficult. The decision-making process of this kind of intelligent method is also difficult to give intuitive interpretations, and therefore, their results require further postprocess to meet the strict engineering requirements. To summarize, screening methods can provide the most generable and reliable landing site recommendations.
Landing site selection based on screening multi-source data has been widely applied to missions to the south pole of the Moon (e.g., the Artemis program [21,22,27,44] and CE-7 [40,45]). Lemelin et al. [34] identified 12 optimal landing sites at the poles (>80°N/S) for volatile exploration missions by an equally weighted stack of datasets of slope, temperature, hydrogen abundance, and the distance to the permanently shadowed regions (PSRs). Amitabh and Srinivasan [46] used topography slope data and a shadow distribution map derived from optical images to propose candidate landing ellipses for the Changdrayaan-2 lander. Cannon and Britt [28] calculated an accessibility dataset for large cold traps at the south pole, which can be a significant reference for landing site selection. Hu et al. [20] used slope, temperature, illumination, PSR map, hydrogen abundance, and Moon Mineralogy Mapper (M3) water ice detections [9] to select possible sites for the International Lunar Research Station (ILRS) in the lunar south polar region. Zhang et al. [43] conducted a synthesized analysis of temperature, topography, and Earth visibility data of the south pole. They manually selected four large craters as the sampling targets of CE-7, while Rao et al. [40] and Liu et al. [45] screened the slope and illumination map of the south pole to obtain safe landing points for CE-7. Once the preliminary candidate landing sites are determined, detailed high-resolution illumination conditions, crater/bounder distribution, geological context, and the geomorphology of these sites are further investigated [16,18,22,26,27,41,47,48,49,50]. These studies only consider the engineering constraints (i.e., slope, illumination, and Earth visibility) for safe landing sites and/or the trafficability of rover-type vehicles into cold traps. As for CE-7, in addition to the landing site for its lander in the sunlit region, another sampling site with a different location in a water-ice-bearing cold trap is needed for its mini-flying probe [17,51]. The mini-flying probe will fly from the landing site to the sampling site. Therefore, the existence of a reasonable flying, not a rolling (wheel) route between the landing and sampling sites, should also be considered.
CE-7 is scheduled to launch in 2026 [17], but few studies [32,38] have been conducted to propose and evaluate both candidate landing sites (lander) and sampling sites (mini-flying probe) that can meet the specific requirements of CE-7 mission design. Liu and Jin [38] first account for the sampling points that will be prospected by the mini-flying probe of CE-7. They focused on the trafficability of the flying routes from the nearby landing points to the sampling point in the Shackelton, Shoemaker, de Gerlache, and Slater craters. They also used Mini-RF radar images to identify small craters around sampling regions in the PSRs. Jia et al. [32] constructed a multifactor (the distance to PSRs, slope, rock abundance, illumination, and temperature) fuzzy cognitive model to score several landing points near the Shackleton, Amundsen, and de Gerlache craters. They also analyzed the trafficability of the flying routes into the de Gerlache crater. These studies preliminarily demonstrate the feasibility of planning the landing and sampling sites for CE-7 using multi-source remote sensing data, yet not systematically and comprehensively.
This article aims to screen the south pole region of the Moon to propose feasible landing and sampling site pairs that can simultaneously satisfy the engineering constraints and scientific objectives of CE-7. Building upon previous work, the contributions of this study are as follows:
1.
All potential safe landing sites within the southern polar region (≥85°S) for the CE-7 lander, characterized by flat topography and adequate illumination, are proposed. The accessibility of these sites to cold traps is further evaluated. Flying routes between each landing site (lander) in the illuminated region and sampling site (mini-flying probe) in the cold trap are also investigated;
2.
For these reasonable landing sites, high-resolution illumination conditions (i.e., average illumination, longest duration of daylight, and darkness) are analyzed;
3.
A combination of optical and radar images is employed to identify small-scale hazards within the landing and sampling sites that are not resolvable on topography data. Finally, six potential landing sites and corresponding sampling sites for CE-7 are proposed.
In the following sections, the geological environment of the Moon’s south pole and the concept of the CE-7 mission are first introduced as the research background (Section 2). Then, Section 3 details the CE-7 landing and sampling site selection framework. Section 4 gives the landing and sampling site selection results and comprehensively evaluates these sites. Section 5 presents a discussion of the selected landing sites and the implications of this study for the CE-7 mission. Section 6 concludes this article.

2. Backgrounds

The lunar south pole’s physical environment (e.g., topography and illumination) directly constrains the feasible landing regions. Additionally, the scientific objectives and operational plans of the CE-7 mission further specify the landing site selection strategy. Therefore, this section provides a general overview of both the south pole environment and the mission concept of CE-7 before the selection of landing sites.

2.1. Geological and Environmental Context of the Lunar South Pole

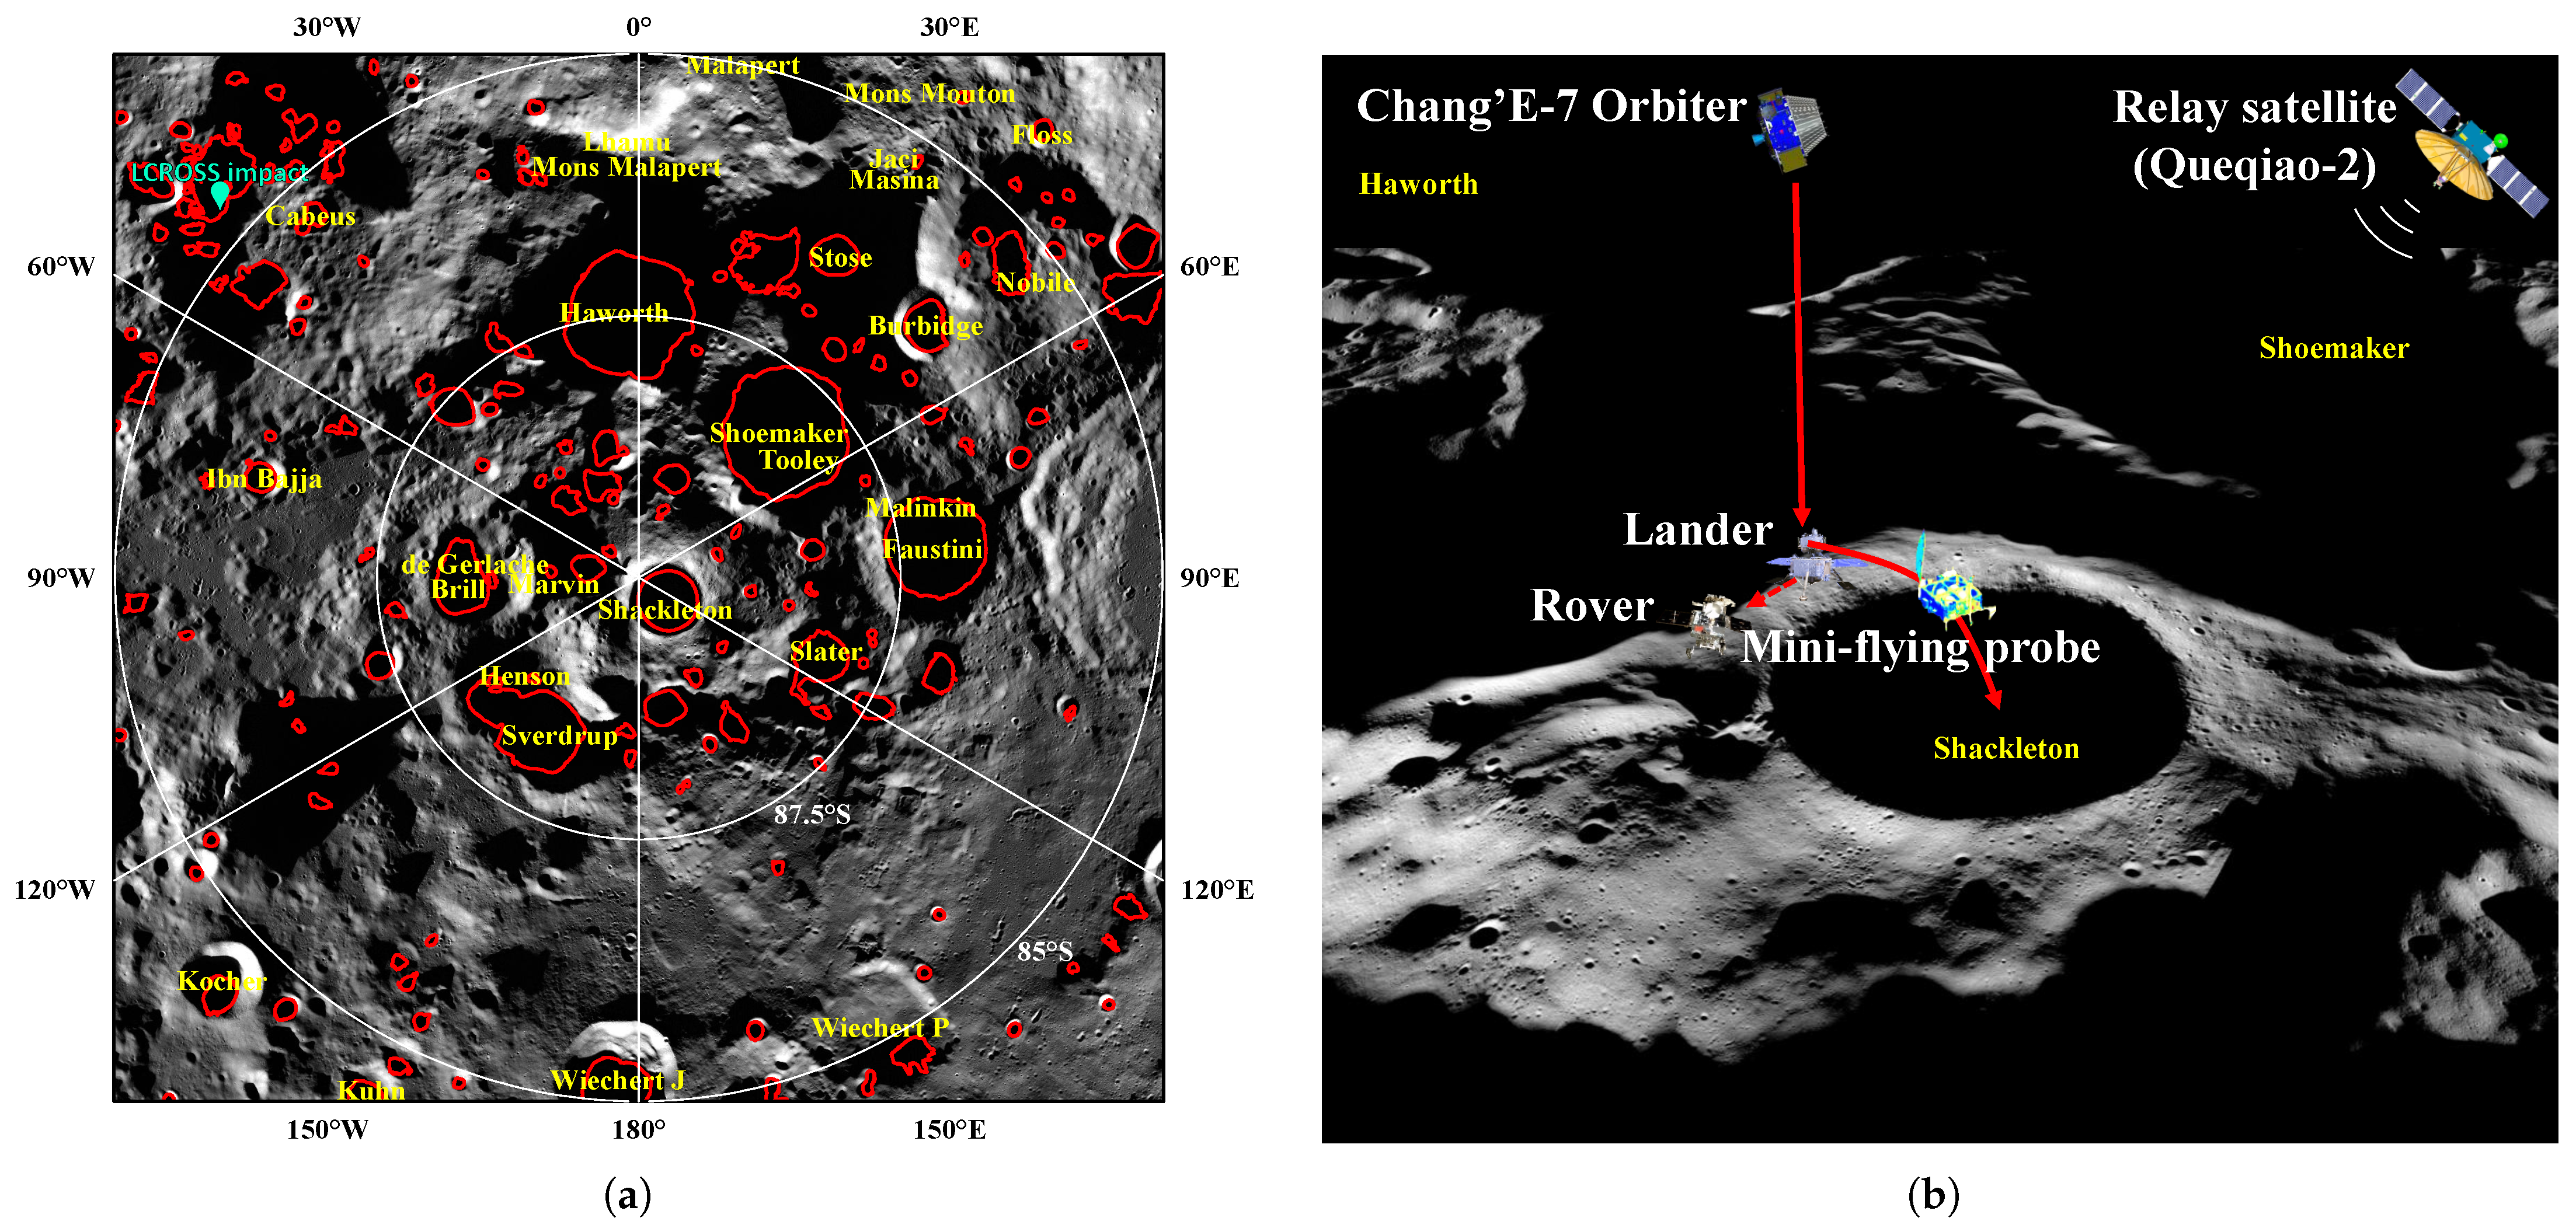
The CNSA has officially announced that the landing site for CE-7 will be located within 85°S in the lunar south circumpolar region [23]. Consequently, a 300 km × 300 km square area centered at the lunar south pole (red box in Figure 1), fully encompassing the region of ≥85°S, was selected as the study area (red box outlined in Figure 1). In the following sections, we will use the terms “study area” and “south pole” interchangeably without distinction, provided that there is no ambiguity.
Large-scale topography within the study area exhibits a gradual increase from southwest to northeast (Figure 1) and is primarily shaped by the largest (2400 km × 2050 km) and oldest (ca. 4.26 Ga [54], 4.33 Ga [55]) South Pole–Aitken (SPA) basin (centered at 53°S, 191°E) [53]. This basin may have been excavated by an oblique impact after the solidification of the lunar magma ocean [56]. Additionally, the terrain of the study area (especially the southeastern portion) is influenced by the ejecta from the ∼378 km diameter Amundsen–Ganswindt basin [53,57]. Upon the products of these two basins, craters of various ages (e.g., from the ancient pre-Nectarian craters Haworth, Shoemaker, Faustini, Slater, Sverdrup, Ibn Bajja, Cabeus, and Nobile to Nectarian crater de Gerlache and Upper Imbrian crater Shackleton [53,58,59]) further contribute to the roughness of this area on the scale of meters to tens of kilometers. The elevation of the study area ranges from 5.5 to 7.0 km (mean value: 1.1 km), with prominent high locations generally occurring along the rim crests of large craters, on the massifs of a remnant SPA rim [53] (e.g., the Mons Malapert), and atop the continuous ejecta of the Amundsen–Ganswindt basin (Figure 1). Though rugged, most of the study area (46%, e.g., crater floors and intercrater plains) exhibits lower slopes (<8° over a 20 m baseline) resulting from significant aging (e.g., topographic degradation) and the deposition of smooth ejecta plains. Large slopes (15–30°) generally dominate the walls of craters and the edges of massifs, while the steepest slopes (>30°) are primarily found on the inner wall of the Shackleton crater. Therefore, the slopes would impose less stringent constraints on landing site selection for the CE-7 mission in the south pole region than illumination (addressed in the next part); however, the CE-7 mini-flying probe must have sufficient capability to make a leap over the steep crater walls.
Fluctuations in topography and the unique position of the south pole itself create extreme illumination conditions [60] in the study area (Figure 2a). High elevations near the equator can receive approximately 50% illumination due to the diurnal rotation, while certain elevated regions at the lunar south pole can receive over 80% illumination [60,61]. However, due to the Moon’s low inclination angle (∼1.54°) relative to the ecliptic plane [62], much of the topography in the study area receives less illumination, with 78.0% of the area experiencing illumination of less than 35%. Furthermore, 21.7% of the area receives between 35% and 50% illumination, and only 0.3% of points exceed 50% illumination. Some depressions in this area may receive no direct sunlight at all, resulting in PSRs (Figure 2a). These challenging illumination conditions present significant obstacles for the site selection of the CE-7 mission, which relies on solar energy to ensure the long-term operation of its lander and rover.
Sunlight illumination largely governs the thermal environment at the lunar south pole [64,65], as the heat flow from the Moon’s interior is minimal. Depressions like crater floors that receive minimal illumination maintain extremely low temperatures (e.g., ≤110 K) and function as cold traps [66] where water ice can accumulate. These harsh low temperatures pose significant challenges to the survival of the probe; however, these cold traps are the primary targets for the mini-flying probe of the CE-7 mission.

2.2. The Mission Concept of Chang’E-7

CE-7 is a pivotal mission of the fourth phase of the Chinese Lunar Exploration Program (CLEP) [17,67], aimed at comprehensively exploring the environment and resources at the lunar south pole, focusing on water ice. Together with CE-8, it will constitute the fundamental framework of the ILRS [20]. Among CE-7’s six primary scientific objectives [17], two high-priority goals are the exploration of water ice and the investigation of lunar deep materials (those might have been excavated by the SPA basin) and internal structure.
The CE-7 mission comprises a relay satellite, Queqiao-2 (meaning “the bridge composed of magpies” in Chinese), and the main probe, which includes an orbiter, lander, rover, and a mini-flying probe (Figure 2b) [17,51]. Queqiao-2, launched in March 2024 [17], facilitates relay communication between the lunar surface probes and Earth-based stations. Consequently, the CE-7 landing site does not need to have direct communication with Earth, allowing the Earth visibility constraint to be disregarded in the landing site preselection process. The main probe of CE-7 is currently scheduled for launch in the second half of 2026. Following the launch, the orbiter’s scientific payload will conduct a detailed two-month survey of the preselected landing sites to finalize the landing location [51]. The high-resolution stereo camera, synthetic aperture radar, and Lyman neutron spectrometer will assess site safety and evaluate the potential presence of water ice at nearby sampling cold traps [17].
In the landing process, the lander’s landing camera will capture images in real-time to match those taken by the orbiter, enabling it to determine its position and ultimately achieve landing accuracy within one hundred meters [51]. Upon landing, the rover will be deployed, and the mini-flying probe will perform a test hop to a nearby location, after which they will take a joint “family photo” with the lander. The rover will then chase the sunlight and collaborate with the lander and orbiter on an eight-year mission in illuminated regions, while the mini-flying probe will ultimately fly into a nearby cold trap after conducting several investigations in these areas (Figure 2b) [49]. The probe is designed for multiple flights, with each flight covering a distance of at least 10 km, potentially reaching up to >15 km [49]. Once in the cold trap, the mini-flying probe will move away from areas affected by the landing plume in walking mode and use the lunar soil water molecule analyzer to drill and extract water ice, methane, and other volatiles for mass spectrometric analysis [68]. After completing its tasks, the probe can either perform another flight or walk to illuminated areas to extend its mission using solar energy. Simultaneously, the rover is equipped with an in situ measuring system of volatiles and lunar penetrating radar to detect surface volatiles and subsurface water ice [17].
Based on the aforementioned CE-7 mission operation plan, the constraints for selecting landing and sampling sites are as follows:
1.
Landing site for the lander: The landing site must be flat, positioned away from steep small crater walls, and free of boulders to ensure landing safety. It should provide sufficient illumination to support energy requirements for the eight-year mission. Most critically, a viable flight path must exist between the landing and sampling sites;
2.
Sampling site for the mini-flying probe: The sampling site should have a high probability of bearing water ice and must be flat and free of rocks.

3. Materials and Methods

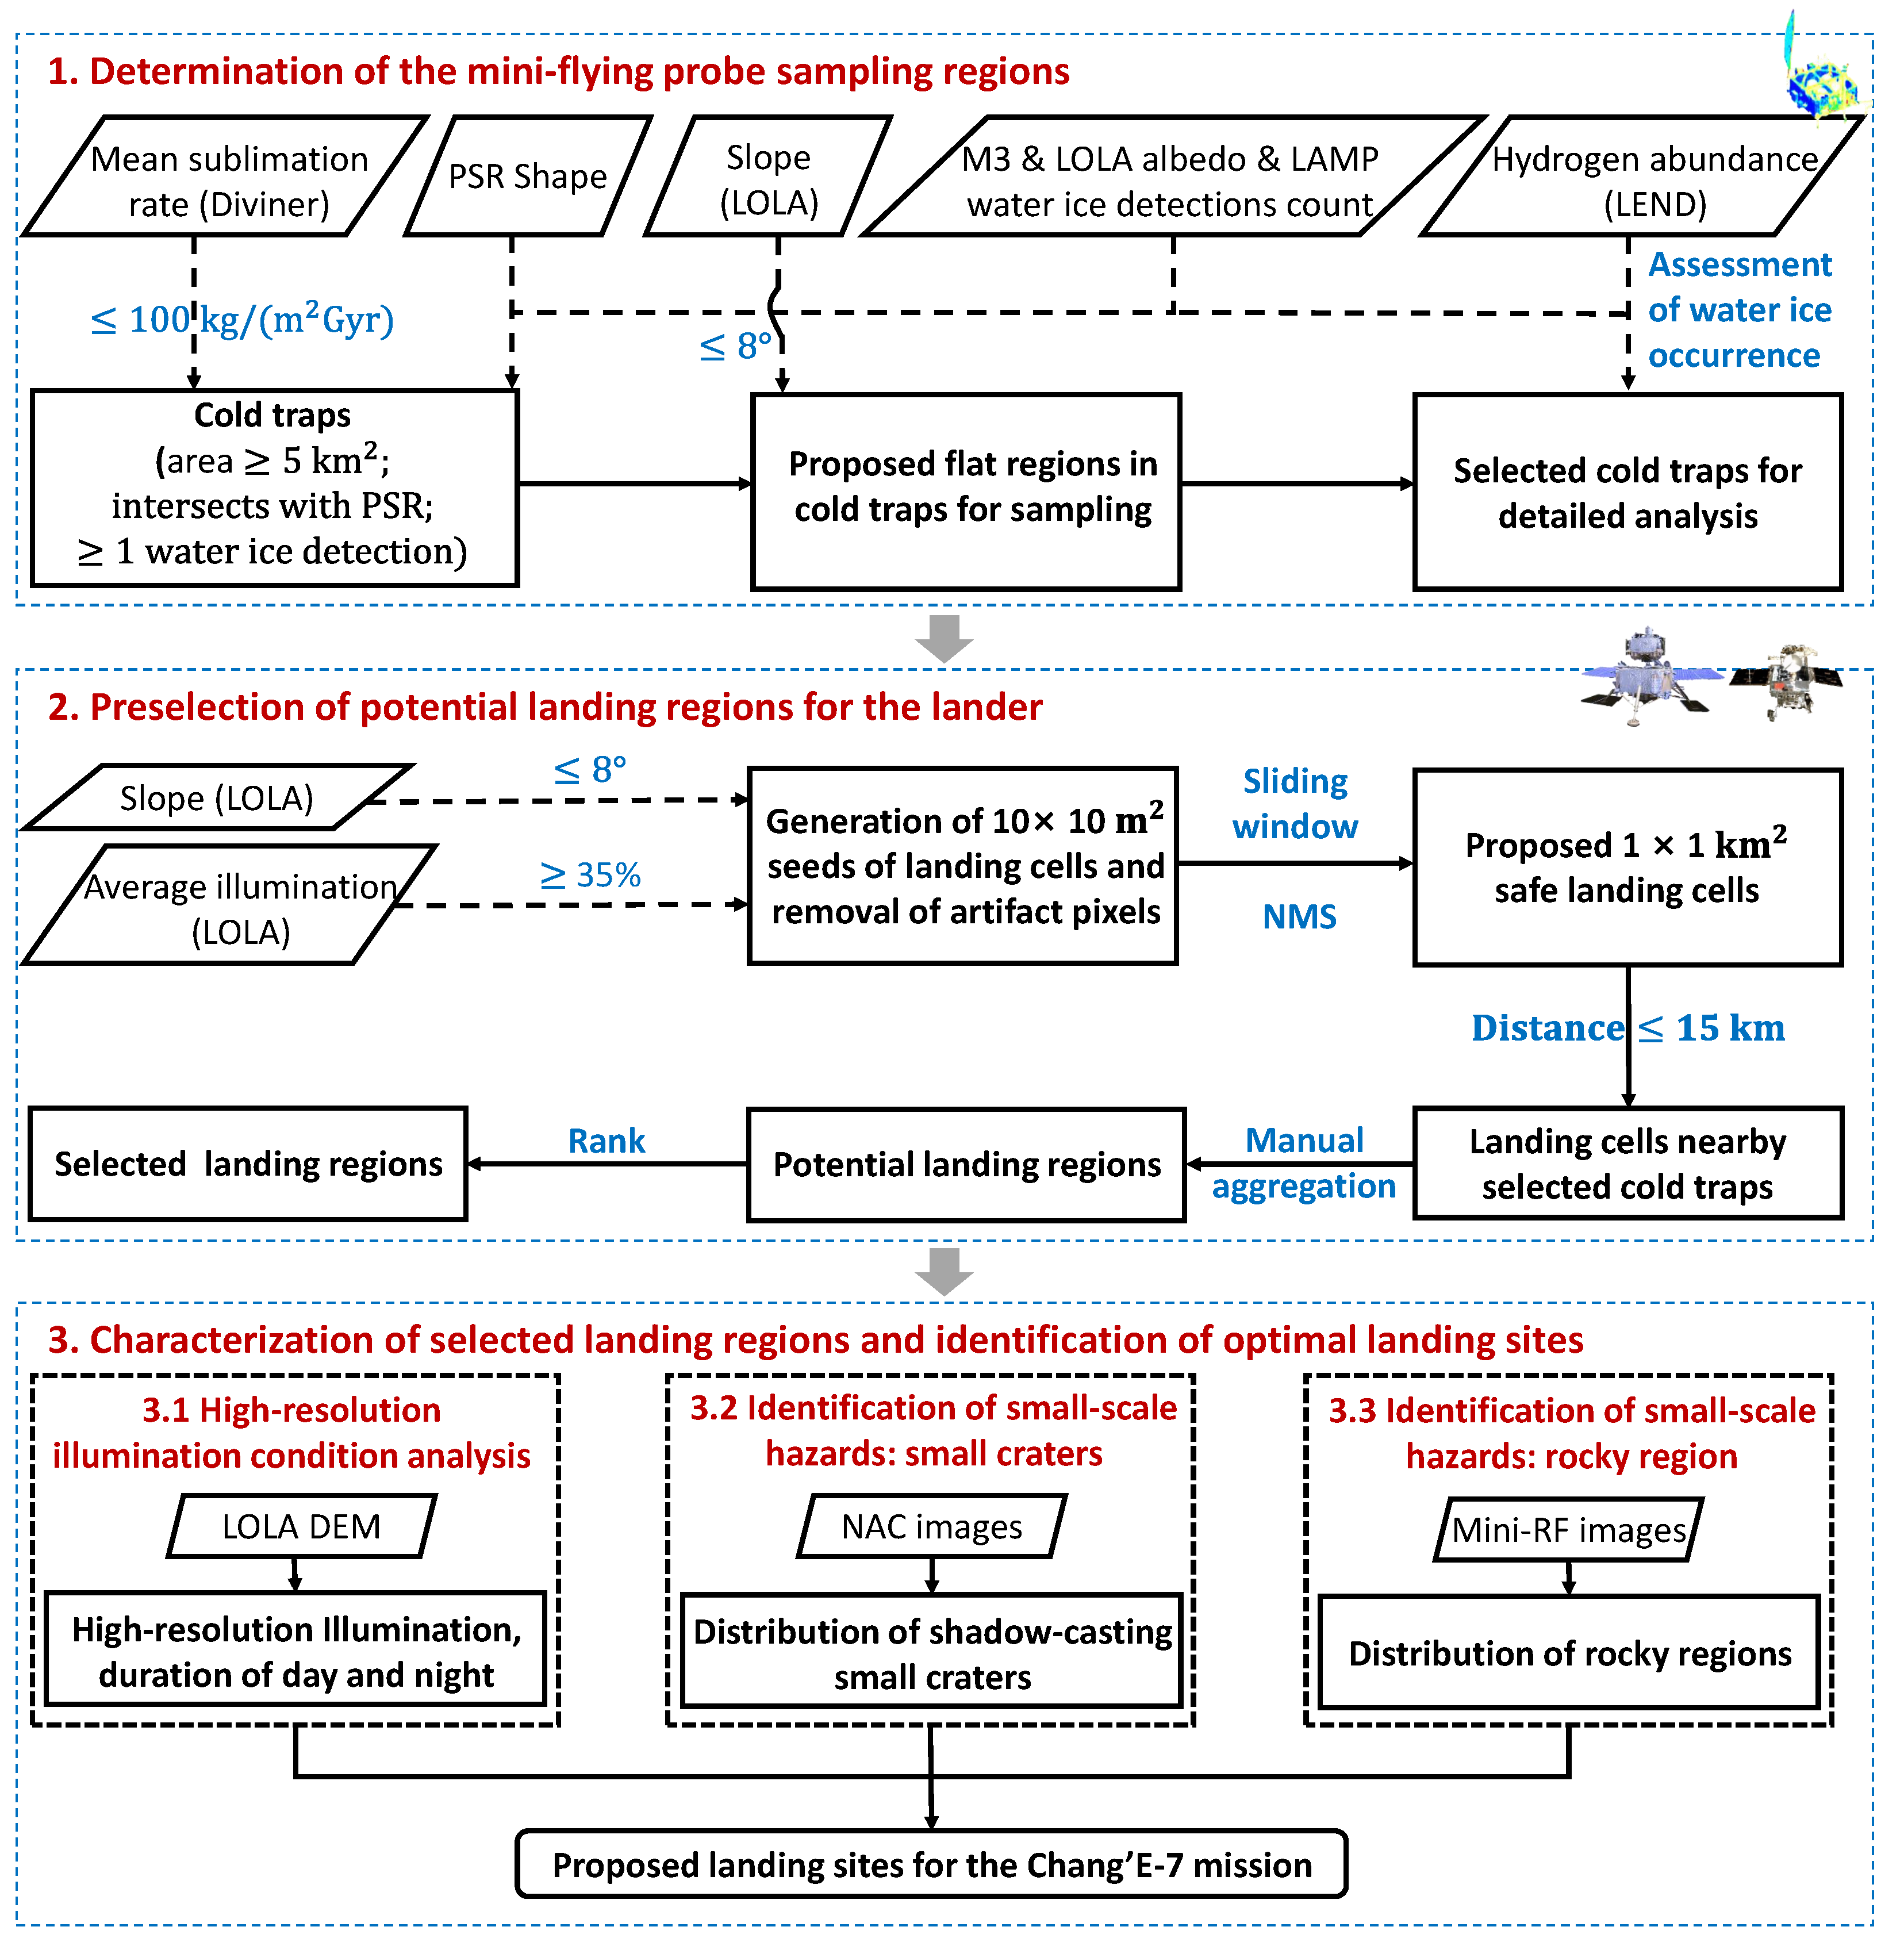
Landing the CE-7 probes in the harsh environment of the lunar south pole poses significant challenges. To maximize the likelihood of mission success, this section presents the method of determining the optimal landing site for CE-7 based on various high-resolution remote sensing data already collected from the lunar south pole. Figure 3 illustrates the overall framework for selecting landing and sampling sites. Supplementary Table S1 summarizes the remote sensing data used in this study. The following subsections will detail each step of the process.

3.1. Determination of the Mini-Flying Probe Sampling Regions

As previously summarized, the sampling region for the mini-flying probe should have a high likelihood of containing water ice and be safe for landing.

3.1.1. Likelihood of Bearing Water Ice

The cold traps, rather than the PSRs, within the study region (a 300 × 300 km2 area centered on the lunar south pole) are used to constrain the sampling region for the mini-flying probe preliminarily. It is important to note that while cold traps are generally co-located with PSRs, not all PSR areas maintain sufficiently low temperatures to preserve water ice, due to the presence of secondary illumination caused by surrounding terrain [69].
Following Schorghofer and Williams [70], we use a criterion of the time-averaged sublimation rate of ≤100 kg/(m2 Gyr) as a proxy for cold trap regions. This sublimation rate map is derived from 11 years of Diviner surface temperature measurements.
Cold traps signify only the potential of storing water ice; additional remote sensing data are needed to directly provide evidence of which cold traps are most likely to contain water ice, allowing for prioritized selection of these cold traps for exploration. The increased circular polarization ratio (CPR) of Clementine bistatic radar echoes [71] and synthetic aperture radar (SAR) images [Mini-SAR [72] on Chandrayaan-1 and Mini-RF [12] on lunar reconnaissance orbiter (LRO)], hydrogen abundance measurements from neutron spectrometers [lunar prospector neutron spectrometer (LPNS) [73] and LRO lunar exploration neutron detector (LEND) [74]], increased Off-band/On-band ultraviolet albedo ratio [Lyman alpha mapping project (LAMP)] [8], abnormal high 1064 nm albedo [lunar orbiter laser altimeter (LOLA)] [7], and the diagnostic near-infrared absorption features [9] all signal the occurrence of water ice at the poles of the Moon. Since the interpretation of radar data on water ice is more confused with rocky materials [14,75,76], we will not rely on it for constraining water ice but will use it solely to identify small-scale obstacles (i.e., roughness and rocks) later. Here, we only use the neutron spectrometer and other spectral data to rank cold traps based on the likelihood of the presence of water ice.
The count rate measured by the collimated sensors of epithermal neutrons (CSETNs), part of the Ruassian-made LEND instrument [77], is used to constrain the hydrogen abundance at the lunar south pole, serving as a strong indicator of the presence of water ice within 1 m depth of the surface in this study. Interactions between galactic cosmic rays and the lunar surface can produce epithermal neutrons. As these epithermal neutrons escape from the lunar regolith, they might collide with hydrogen nuclei (e.g., water ice), resulting in a loss of energy and ultimately leading to a decrease in the count rate of emitted epithermal neutrons [10,77,78,79]. Therefore, the count rate of epithermal neutrons decreases monotonically as the abundance of hydrogen increases [74]. We generated the epithermal count rate map by averaging CSETN measurements that were binned at 0.5° × 0.5° intervals, collected between September 2009 and September 2016. To reduce statistical uncertainty, a Gaussian filter was applied to smooth the count rate map projected in a south polar stereographic projection [77]. The full width at half maximum (FWHM) of the Gaussian filter is varying as FWHM = 50 0.2 + cos ( lat ) [80]. This adjustment accounts for the decreasing number of orbits per degree of longitude as the distance from the pole increases.
The LEND epithermal neutron count rate data have a coarse spatial resolution (>10 km) [77]; therefore, we complementarily adopt the water ice detections from Li et al. [9], with each point covering an area of approximately 240 m × 240 m, to provide a more robust evaluation of the cold traps. These water ice detection points are derived from a combination of M3 near-infrared spectral data, LOLA 1064 nm albedo data [7], and LAMP ultraviolet albedo data [8]. It is important to note that we do not further use the raw LOLA and LAMP data for assessment, as the water ice detections have already been filtered using these datasets.

3.1.2. Landing Safety of the Mini-Flying Probe

To ensure the safe landing of the mini-flying probe, the sampling region is further restricted to areas with slopes ≤ 8° [37] within cold traps. The slope map derived from the 10 m/pixel LOLA digital elevation model (DEM) data is used in this study. ShadowCam [81] and Mini-RF radar [82] images are used to identify rocks in the shadowed sampling sites within the cold traps.

3.2. Preselection of Potential Landing Regions for the Lander

In this study, we define a landing region as a large area that contains one or more feasible landing sites. In other words, a landing region can be viewed as a collection of clustered, small-scale landing sites. We first identified safe landing sites and then aggregated them into distinct landing regions. In order to comprehensively screen the lunar south pole for all potential landing site candidates, we partitioned the study area into a grid of overlapping cells, where each cell represents a potential landing site candidate. We will use the terms “landing site” and “landing cell” interchangeably hereafter.

3.2.1. Generation of Safe Landing Cells

To ensure landing safety and support long-term lunar surface operations powered by solar energy, slope and average illumination data are used to assess the landing feasibility of each point/pixel. A sliding window is then applied across the lunar south polar region, with overlap, to determine whether it contains a sufficient number of feasible landing points, thereby identifying it as a safe landing cell. Consequently, the feasible landing points/pixels can also be regarded as seeds for generating the landing cells. The details of each step will be provided in the following paragraphs of this section.
A combination of thresholds applied to the slope and illumination data is used to create the seed map for generating safe landing cells.
The slope data are derived from the 10 m/pixel LOLA DEM [83] using the Horn algorithm [84]. Therefore, the slopes have an equivalent baseline of 20 m. Based on the experience from the Chinese Lunar Exploration Program, pixels with slopes ≤ 8° [37] are considered to meet the landing safety requirements (Supplementary Figure S1a).
Illumination is defined as the time-averaged fraction of the visible solar disk, with values ranging from 0 to 1 [60,61]. For example, 50% illumination could represent a scenario where only half of the solar disk is visible at all times, or it could indicate that the Sun is fully visible for half of the time and completely obscured for the other half, among other possible variations. Illumination conditions over extended periods can be simulated using DEM data [60,61]. For the landing site assessment, the spatial resolution of the illumination map should be at the scale of the lander, e.g., on the order of several meters. The highest available spatial resolution of the DEM that covers the study region is 5 m/pixel [83]. However, calculating illumination at this high resolution over a 300 km × 300 km study area would be extremely time- and memory-intensive [60]. Therefore, we use the 60 m/pixel illumination map published by Mazarico et al. [60] to initially select candidate landing cells. Once the candidate cells are filtered based on slope and their accessibility to optimal cold traps, we will perform high-resolution illumination simulations on the remaining landing cells. It is reasonable to use a coarse-resolution illumination map in the initial stage of landing cell selection. This is because a low-resolution illumination map is sufficient to accurately capture distant terrain obstructions and typically reflects the potentially best lighting conditions for the target area, ensuring that potential well-illuminated regions are not overlooked.
Illumination requirements of CE-7 can be challenging to determine, as they depend on the frequency of specific energy-consuming tasks and the power consumption of individual instruments. Previous studies have used various illumination thresholds (e.g., 25% [85], 33% [28], 35% [21,30,34]) to select landing sites. In this study, an illumination threshold of ≥35% is set as the preliminary constraint for the landing site (Supplementary Figure S1b).
Pixels that meet both the slope and illumination requirements serve as the seeds (Supplementary Figure S1c) for generating landing cells. Discontinuous artifact streaks were observed on the seed map due to inconsistencies between the LOLA tracks (Supplementary Figure S2). To filter out these artifacts, an empirical threshold of a minimum continuous area of 100 × 100 m2 is applied.
The size of a landing cell should be comparable to the landing precision of the lander. Previous missions (e.g., CE-3 to CE-6, Luna-25, and Chandrayaan-2) had landing ellipses typically ranging from several kilometers to tens of kilometers [37,46,85]. However, landing in the challenging lunar south polar region requires much higher precision [30,83]. The landing precision of the CE-7 mission is designed to be better than one hundred meters [51]. To accommodate this and limit the number of landing cell candidates, a 1 × 1 km2 sliding window with 50% overlap is applied to the seed map of landing cells (Supplementary Figure S1c). Note that the seed map represents the distribution of pixels that simultaneously meet the criteria of slope ≤ 8° and illumination ≥ 35%. A seed area threshold of ≥100 × 100 m2 (equivalent to 100 seed pixels) is used to preliminarily identify candidate landing cells. This overlapping sliding window technique ensures that potential optimal landing areas, which may not align exactly with the search grid, are not missed.
Furthermore, the non-maximum suppression (NMS) algorithm [86] is employed to remove redundant overlapping landing cells. In this process, the area of seeds within each cell, weighted by their illumination, serves as the score for that cell. Based on the statistical distribution of the weighted seed areas of candidate landing cells (Supplementary Figure S3), a score threshold of 500 m2 is set. This threshold efficiently suppresses sites with poor illumination, typically located at the edges of clusters of landing sites. Thus far, all 1 × 1 km2 landing cells deemed safe for landing in the lunar south polar region have been identified.

3.2.2. Search and Evaluation of Flight Routes

Now, it is time to evaluate the accessibility of the proposed landing cells to water-ice-bearing cold traps. Landing cells that are too distant from the selected cold traps will be discarded. Additionally, the topography along the feasible flight route from the remaining landing cells to the corresponding cold traps will be quantitatively analyzed to provide insight into the expected flight trajectory control for the CE-7 mini-flying probe.
The CE-7 mini-flying probe can move by either rocket-powered propulsion to fly or leap, or it can walk using its legs. This probe is capable of multiple takeoffs, with each flight designed to reach a minimum of 10 km and potentially more than 15 km. This capability distinguishes it from wheeled rovers, as it can leap over steep crater walls.
For each cold trap and safe landing cell pair, the shortest route is designated as the initial flight route (Figure 4). The maximum horizontal flight distance ( d max ) of the mini-flying probe is set to 15 km. If the initial route exceeds d max , the cold trap is considered inaccessible from this landing cell. Otherwise, the terrain clearance and descent angle of the flight route [87] are further evaluated (Figure 4). Terrain clearance Δ h ( r ) is defined as the vertical distance between the flight path and the topographic profile along the route:
Δ h ( r ) = h flight ( r ) h terrain ( r ) ,   0 r d
where r represents the horizontal distance from the landing cell, d is the horizontal length of the flight route, h flight ( r ) is the probe’s altitude at r, and h terrain ( r ) is the terrain elevation at r.
The minimum of Δ h ( r ) are used to quantify the terrain obstructions along the flight route. The elevation difference between the landing site and sampling region calculated as h diff = h terrain ( 0 ) h terrain ( d ) determines the minimum vertical descent required by the mini-flying probe.
The mini-flying probe will land in a low-illumination region, making an early transition to a near-hover, horizontal flight mode crucial for a safe and precise landing. Therefore, we define the descent angle as the absolute terrain slope over a baseline of 500 m on the landing segment. It should be noted that the baseline for descent angle estimation in practice depends on the flight control planning and landing capabilities of the mini-flying probe. The selection of 500 m here is intended as a preliminary investigation. The descent angle is calculated as follows:
θ descent = arctan ( h terrain ( d ) h terrain ( d 500 m ) 500 m ) .
A smaller descent angle indicates less large-scale terrain variation near the mini-flying probe’s landing site, i.e., the sampling site in the cold trap.
In this study, we consider the mini-flying probe to follow a projectile trajectory, with the minimum terrain clearance Δ h min for a feasible flight route set to no less than 5 m. This requires the probe to initially ascend at least 5 m high after takeoff—a very conservative estimate given rocket propulsion.
If the initial shortest flight route is rejected due to terrain obstacles, alternative routes from the landing cell to other sampling points along the boundary of the cold trap’s flat region are evaluated (as in the previous step), and the shortest feasible route is ultimately selected (Figure 4). Landing cells within 15 km of the cold trap are not rejected, even if they lack a direct flight route to the cold trap that is free from terrain obstacles. This is because there is currently limited knowledge about the mini-flying probe’s maximum flying altitude. Furthermore, the probe may be able to circumvent certain terrain obstacles through multiple takeoffs.

3.2.3. Aggregation of Landing Cells into Regions and Their Evaluation

The number of landing cells near selected cold traps can be substantial. Analyzing them individually is both tedious and not very meaningful. From the perspective of landing region selection, it is more efficient to aggregate multiple spatially adjacent landing cells into a single larger landing region and then analyze these aggregated cells as a whole. The reasoning behind this is also that an isolated small, good landing cell may not be optimal for the mission, whereas the region encompassing a cluster of good landing cells offers a more robust solution.
We manually group the proposed landing cells into distinct regions based on their proximity and compactness. For a cold trap, the landing cells surrounding it are typically divided into eight distinct landing regions based on their azimuth. Isolated and widely scattered cells are not considered in this step. Additionally, landing cells with direct flight routes to the selected cold trap are often used as focal points to outline the region.
Once the landing regions are preselected, we analyze their characteristics in detail, including size, slope, illumination, and feasible flight routes. We then rank the regions based on these characteristics and select the optimal ones for further detailed characterization. As mentioned earlier, the extensive flat regions of the lunar south pole impose fewer constraints on landing site selection, and based on the analysis in Section 4.2.2, the flight routes (i.e., the horizontal and vertical flight distances) across different regions do not vary significantly. Therefore, size and illumination are used as the primary criteria for ranking the landing regions. The score of a landing region i is calculated as follows:
Score i = Normalize ( N C , i ) + Normalize ( I Avg , i )
where N C , i and I Avg , i represent the count of landing cells and the average illumination in region i, respectively. The Normalize function is defined as follows:
Normalize ( x i ) = x i min i x i / max i x i min i x i

3.3. Characterization of Selected Landing Regions and Identification of Optimal Landing Sites

To determine the optimal landing site for the CE-7 probes, it is essential to conduct a detailed analysis of the selected landing regions using high-resolution remote sensing data. This analysis focuses on key factors such as high-resolution illumination conditions and small-scale hazards, including craters and rocks, to identify the most suitable site for landing at the lander scale.

3.3.1. High-Resolution Illumination Condition Analysis

At this stage, the illumination conditions in the selected landing regions are constrained by a coarse illumination map derived from a 60 m/pixel DEM, which only represents the potential maximum averaged illumination over an 18.6-year lunar precession cycle. The impact of near-field terrain obstacles has not been adequately considered. In this study, we combine high-resolution DEM and optical imagery to evaluate the illumination conditions at the landing site scale.
In this study, we conduct illumination simulations for the selected landing sites using a horizon-based method [60], utilizing the highest-resolution DEM data available, i.e., 5 m/pixel [83]. A horizon map of the region of interest (ROI) is first generated. Subsequently, the horizon data are combined with the predicted Sun position relative to the Moon, as provided by NASA’s Jet Propulsion Laboratory (JPL) ephemeris DE421 [88], to calculate the temporal Sun visibility. The Python package Skyfield (v1.49) [89] serves to retrieve the Sun’s position at each time.
We employ three metrics to quantitatively characterize the illumination conditions: average illumination, longest continuous illumination period (LCIP), and longest continuous shadow period (LCSP) [83]. The average illumination, defined as the time-averaged fraction of the visible solar disk, characterizes the solar energy available in an average sense. LCIP quantifies the maximum duration during which the lander and rover can operate continuously with any fraction of the Sun visible, while LCSP represents the longest duration of continuous darkness they must endure.

3.3.2. Identification of Small-Scale Hazards: Small Craters

Although high-resolution 5 m/pixel DEM data have been used to constrain the illumination conditions, it was found that the DEM does not adequately capture decameter-scale small craters. While these craters may have a minimal impact on illumination for landing missions at mid-latitudes, they pose a greater hazard in polar regions, such as for the CE-7 mission. Due to the Moon’s low inclination angle, the Sun remains at a very low elevation in the polar regions, particularly in the selected landing areas for this study. As a result, even small craters (e.g., ∼10 m) can cast significant shadows, potentially obscuring a lander within them. Moreover, small, fresh craters can be hazardous due to the steep slopes of their inner walls, which are also not captured by the current DEM. Therefore, it would be beneficial to select a landing site with a lower density of small craters for the CE-7 mission.
The LRO Narrow Angle Camera (NAC) panchromatic images [90] are used in this study to identify small craters. Specifically, the controlled 1 m/pixel NAC south pole (≥85°S) average mosaic [90] is utilized. This mosaic was created by averaging valid pixels from 18,323 NAC images of the lunar south polar region, acquired between 2009 and 2013. Therefore, this mosaic likely represents the best illumination conditions in the southern polar region to some extent.
Small craters exhibit a distinct shadow-bright pattern in the polar NAC images. An automatic shadow-based method was employed to preliminarily detect small shadow-casting craters within the landing cells of the selected regions. This method begins by automatically estimating the shadow threshold and illumination direction. Crater detection is then performed in three steps: first, the crater shadow is segmented using the threshold; second, the crater edge is detected based on the gradient map along the illumination direction; and third, the centroid and diameter of each crater are estimated from the shadow and the position of its edge. This method is effective and efficient for detecting small shadow-casting craters but may fail in poorly illuminated regions (i.e., entirely dark areas).
A thorough manual inspection and evaluation were conducted on the results of the automatic detection. False detections were removed, and any missed craters were manually labeled. We scanned all landing cells within the selected landing regions. The use of the automatic method for preliminary crater detection significantly reduced the time required. During this process, very small craters (e.g., those with a shadow area ≤ 3 × 3 pixels) were not considered, as they are shallow enough not to cast significant shadows that would affect the lander.
We calculate the fraction of cratered terrain ( f crater ) to quantitatively characterize the small crater density within the landing cells or regions:
f crater = A crater A
where A crater is the area of cratered terrain, and A is the total area of the region over which craters are counted. Note that overlapping craters are not counted multiple times, as the focus is on how much area is occupied by small craters.
In this study, we propose a strategy that comprehensively considers the influence of terrain and small craters on the illumination at potential landing sites. Since the 5 m/pixel DEM does not capture the topography of small craters, the illumination map derived from this DEM reflects the illumination of locally smooth regions. Given the presence of small craters, which are depression-like features, we assume that points within craters exhibit zero illumination, while points outside the craters retain the illumination characteristic of the surrounding smooth/flat terrain, as indicated by the DEM. Consequently, the expected average illumination I Avg E for a specified region, from a statistical perspective, can be estimated as follows:
I Avg E = I Avg · 1 f crater
where I Avg and f crater represent the DEM-based average illumination and fraction of cratered terrain within the region, respectively.
It should be noted that the expected average illumination is to be interpreted from a statistical perspective, representing the anticipated illumination across the target region, rather than the actual time-averaged illumination at any specific point. Furthermore, Equation (6) serves as a first-order approximation of I Avg E , and it is important to acknowledge that the assumption of zero illumination within small craters is not strictly accurate. Nevertheless, we contend that the I Avg E indicator provides a reliable representation of the combined effects of terrain and small craters on the illumination at potential landing sites.

3.3.3. Identification of Small-Scale Hazards: Rocky Region

Rocks can also be a significant factor influencing landing site selection. While rocks may present interesting sampling targets for certain missions, they more often contribute to small-scale surface roughness, which can pose hazards to the lander (e.g., CE-7). In general, once a landing site is chosen, high-resolution imagery should be used to assess the density and size distribution of rocks and boulders, in order to evaluate the associated landing risks. However, at the stage of landing region or site selection, it is sufficient to identify regions with rocky terrain.
Identification of rocky regions on the Moon can be achieved using various remote sensing data, including thermal radiometers (e.g., Diviner), high-resolution DEMs, optical images, and radar images. However, in the lunar polar regions, the diurnal temperature variation is minimal and inadequate for detecting rocks. Additionally, there is a lack of high-resolution DEMs suitable for identifying boulders in these regions. Although high-resolution (1 m/pixel) optical images are available, the weak and variable illumination conditions render automatic rock detection methods ineffective. Manually identifying rocks from these optical images over large regions would be laborious. In contrast, radar, with its own illuminator, can consistently observe the lunar surface regardless of solar illumination. Its centimeter-scale wavelength also makes it highly sensitive to rocks ranging from the centimeter to meter scale [45,75]. Therefore, radar images were utilized to identify rocky regions within the selected landing areas for this study.
The Mini-RF radar image onboard the LRO is selected due to its high resolution (∼30 m/pixel) and extensive coverage [82]. Mini-RF is a compact polarimetric SAR that transmits circularly polarized waves and receives two orthogonally polarized linear waves. If the transmitted wave is left-circularly (L) polarized (as most of the Mini-RF data), the received information can be fully represented by the Stokes vector [91]:
I = I 1 I 2 I 3 I 4 = E H L 2 + E V L 2 E H L 2 E V L 2 2 Re E H L E V L 2 Im E H L E V L
where I 1 , I 2 , I 3 , I 4 are the Stokes parameters, E H L and E V L denote the amplitudes of received horizontal(H)- and vertical(V)-polarized waves, respectively. The bracket indicate ensemble averaging or multilooking processing, and superscript * denotes the conjugate operator.
The level-1 CDR images of Mini-RF, downloaded from the Planetary Data System (PDS), are used to construct the Stokes parameter images, which are then co-registered with the SLDEM and orthorectified [92].
Rocks are typical scatterers with random characteristics, capable of enhancing backscattering, with a dominant depolarized scattering component [93]. In this study, the m-chi decomposition [94] method is employed to analyze the dominant scattering mechanisms of the target. This method decomposes the backscattering power into components of double-bounce, single, and volume scattering power [91]:
P d = m I 1 1 ± sin 2 χ / 2
P s = m I 1 1 sin 2 χ / 2
P v = 1 m I 1
where m = I 2 2 + I 3 2 + I 4 2 / I 1 is the degree of polarization, and χ = 0.5 arcsin I 4 / m I 1 is the ellipticity angle of the completely polarized component of the backscattered wave. The upper sign in the ± and ∓ symbols is employed for left circular transmitting, whereas the lower sign is used for the right circular transmitting. The volume scattering power P v represents the randomly polarized component of the scattering echo, serving as a proxy for the rock presence and will be utilized subsequently to identify rocky regions.
P d , P s , and P v are then linearly stretched to the range of 0 to 255 using a 2–98% percentile truncation, and subsequently assigned to the red (R), blue (B), and green (G) channels to render as pseudo-color images for visually inspecting the scattering characteristics of the terrain.
In the m-chi decomposition pseudo-color image, rocky regions are distinguished by a pronounced volume scattering pattern. To identify these regions, an experimentally determined threshold value, G r o c k , with rocky regions defined as those where G G r o c k . While steep slopes, such as those of large crater walls, can also exhibit significant volume scattering, the selected landing regions are predominantly flat. Therefore, the presence of rocks is the primary factor contributing to the enhanced volume scattering. Although this threshold-based approach may be criticized for its oversimplification, it effectively detects rocky regions, as verified by comparison with optical NAC images. To highlight the rocky areas, a gamma correction [95] ( γ = 2 ) is applied to the G channel when displaying the m-chi decomposition images in this study.

4. Results

This section begins by presenting cold traps with a high probability of containing water ice. Subsequently, potential landing regions suitable for CE-7 to explore these selected cold traps are proposed. The size, slope, illumination, and topography along flight routes of these potential landing regions are analyzed to identify the optimal regions. High-resolution illumination conditions, as well as the distribution of small craters and rocks, in the selected optimal landing regions are further analyzed and compared. Finally, the optimal landing site is determined for each of the selected landing regions.

4.1. Cold Traps Prioritized for the CE-7 Mission

Using the Diviner-based sublimation rate map, a total of 133 cold traps ≥ 5 km2 are identified within 85°S. A minimum area threshold is applied to exclude smaller, less reliable cold traps due to the coarse spatial resolution (240 m/pixel) of Diviner temperature measurements. These 133 cold traps are ranked by area, with their rank in the order of identification serving as their cold trap ID, which will be used as their name unless located within a named crater.
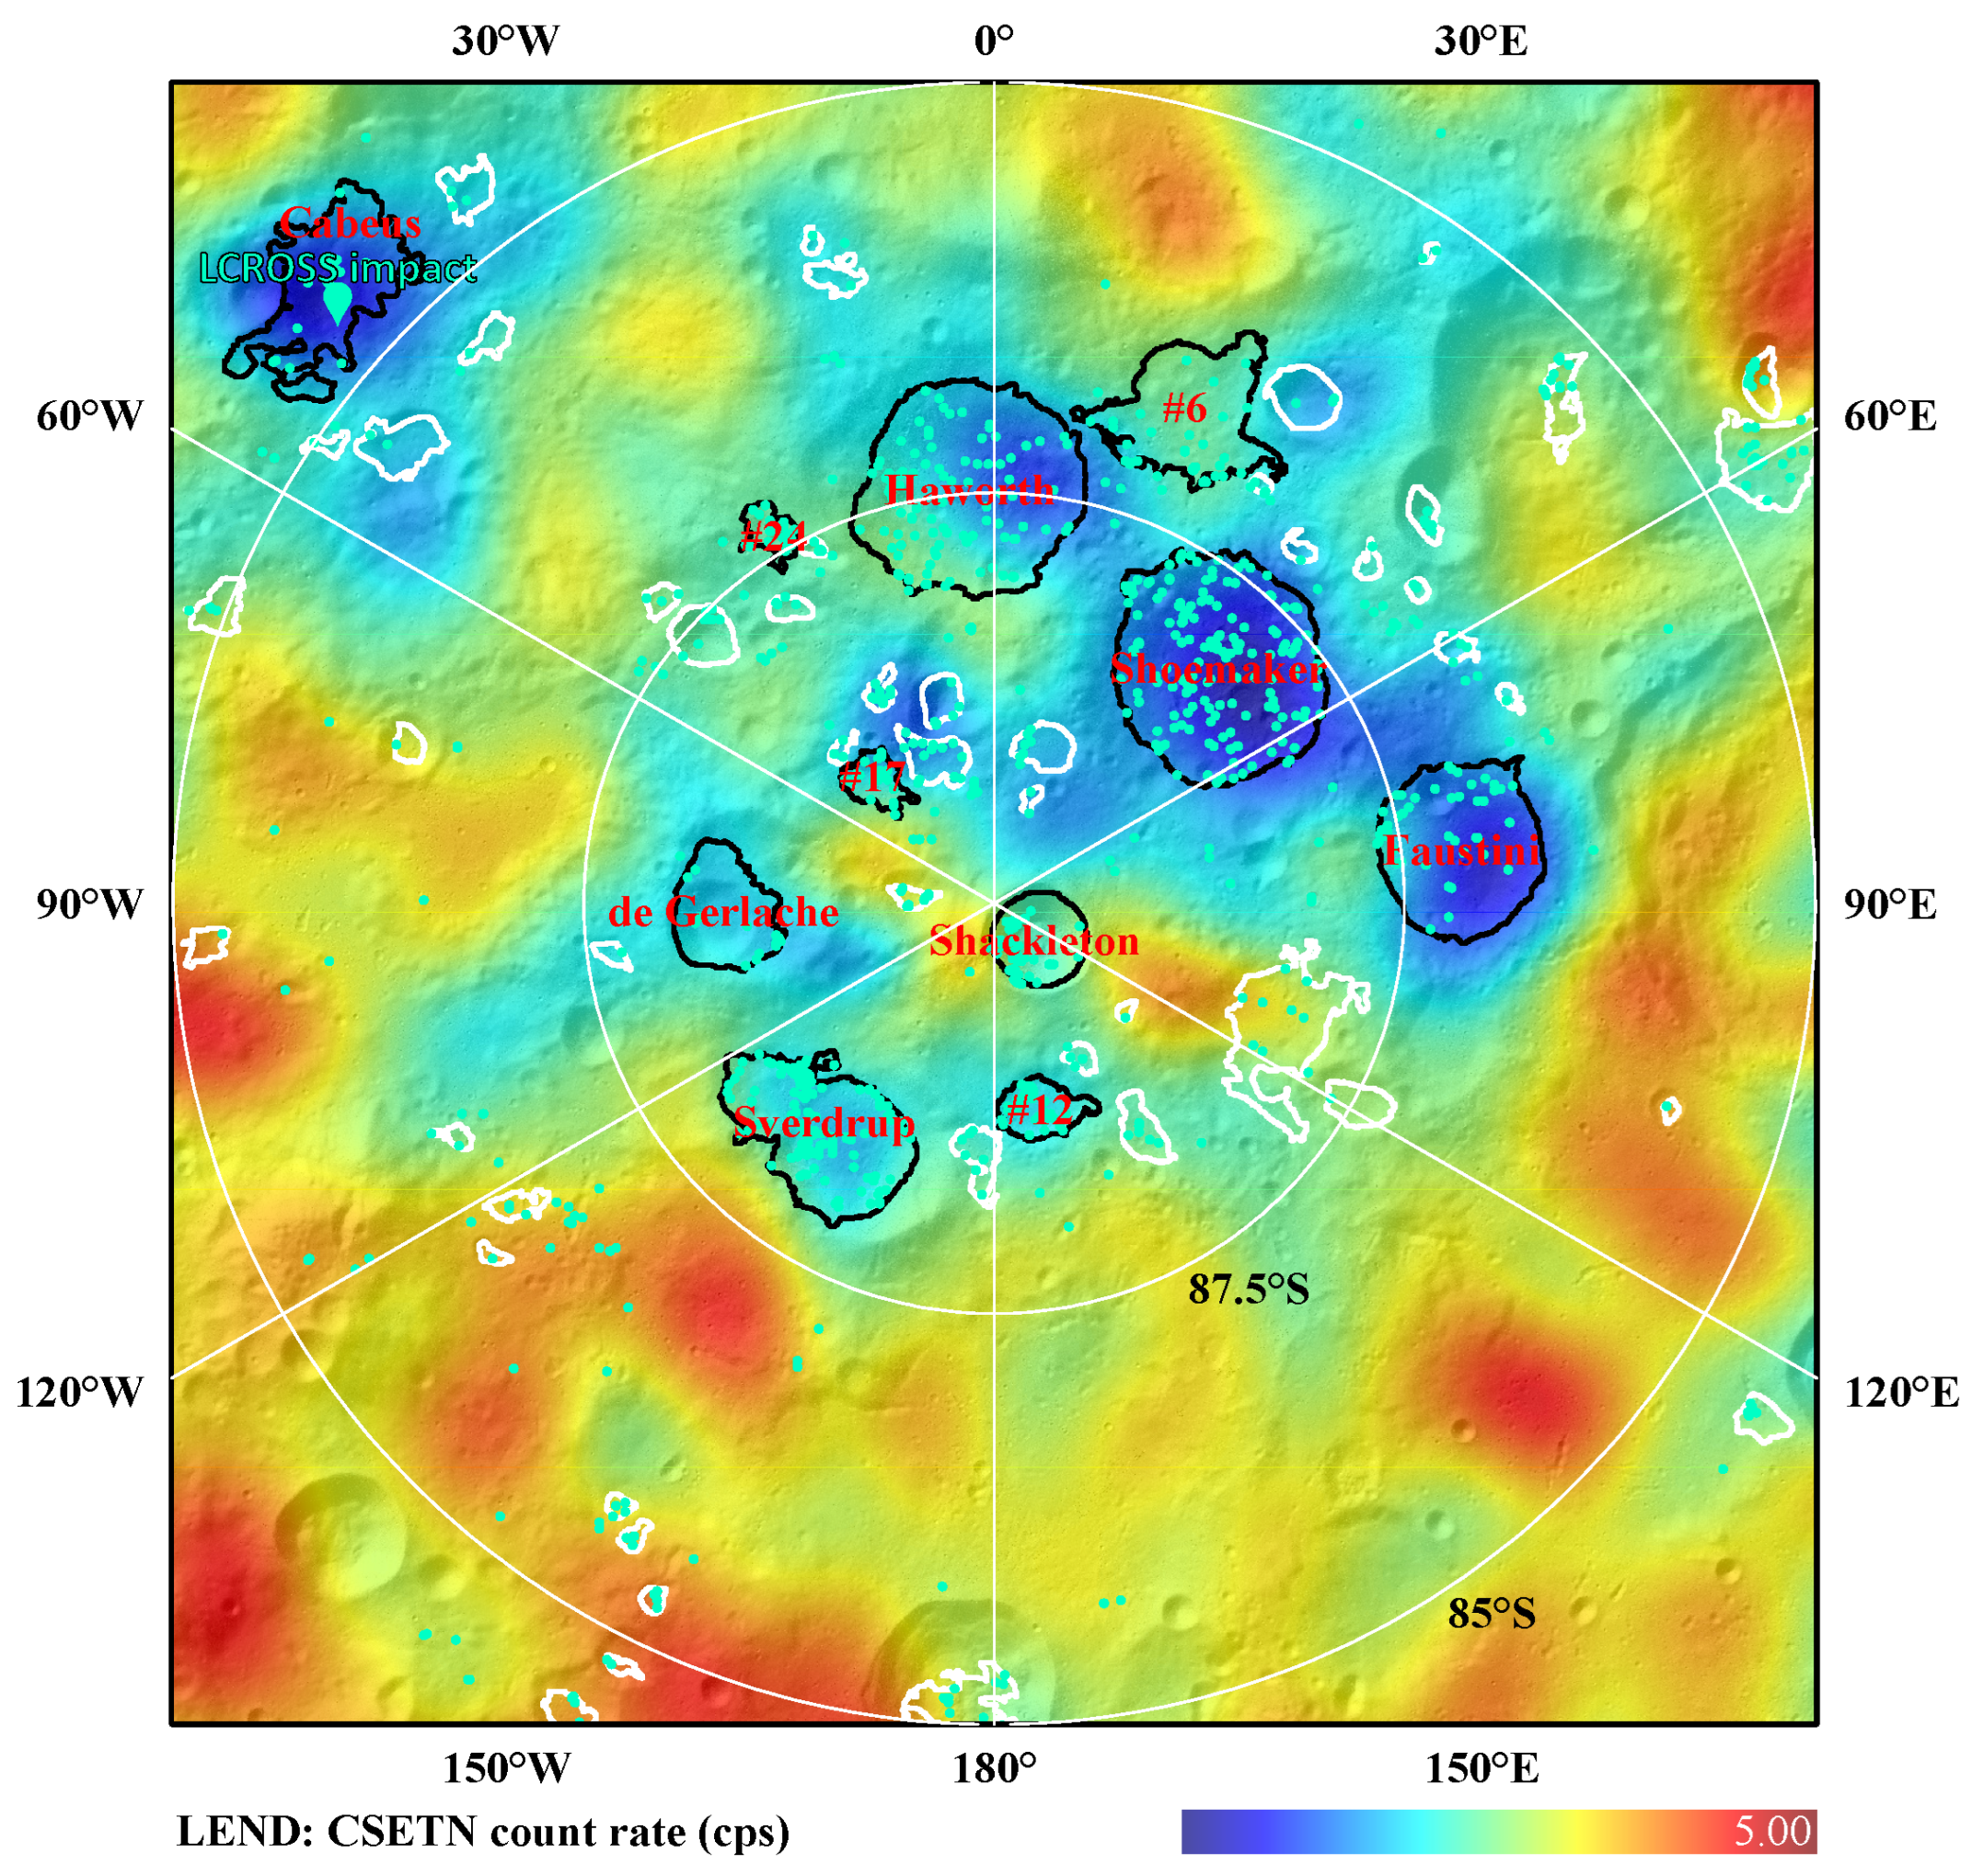
Only 61 out of the 133 cold traps intersect with a ≥5 km2 PSR and contain at least one water ice detection. The locations and values of water ice indicators for these 61 cold traps are listed in Supplementary Table S2. Figure 5 presents the epithermal neutron count rate map, which reveals that the large cold traps—Cabeus, Shoemaker, Faustini, Haworth, Sverdrup, and de Gerlache—exhibit the most significant suppression in epithermal neutron count rates, indicating a strong likelihood of substantial water ice presence within the upper 1 m.
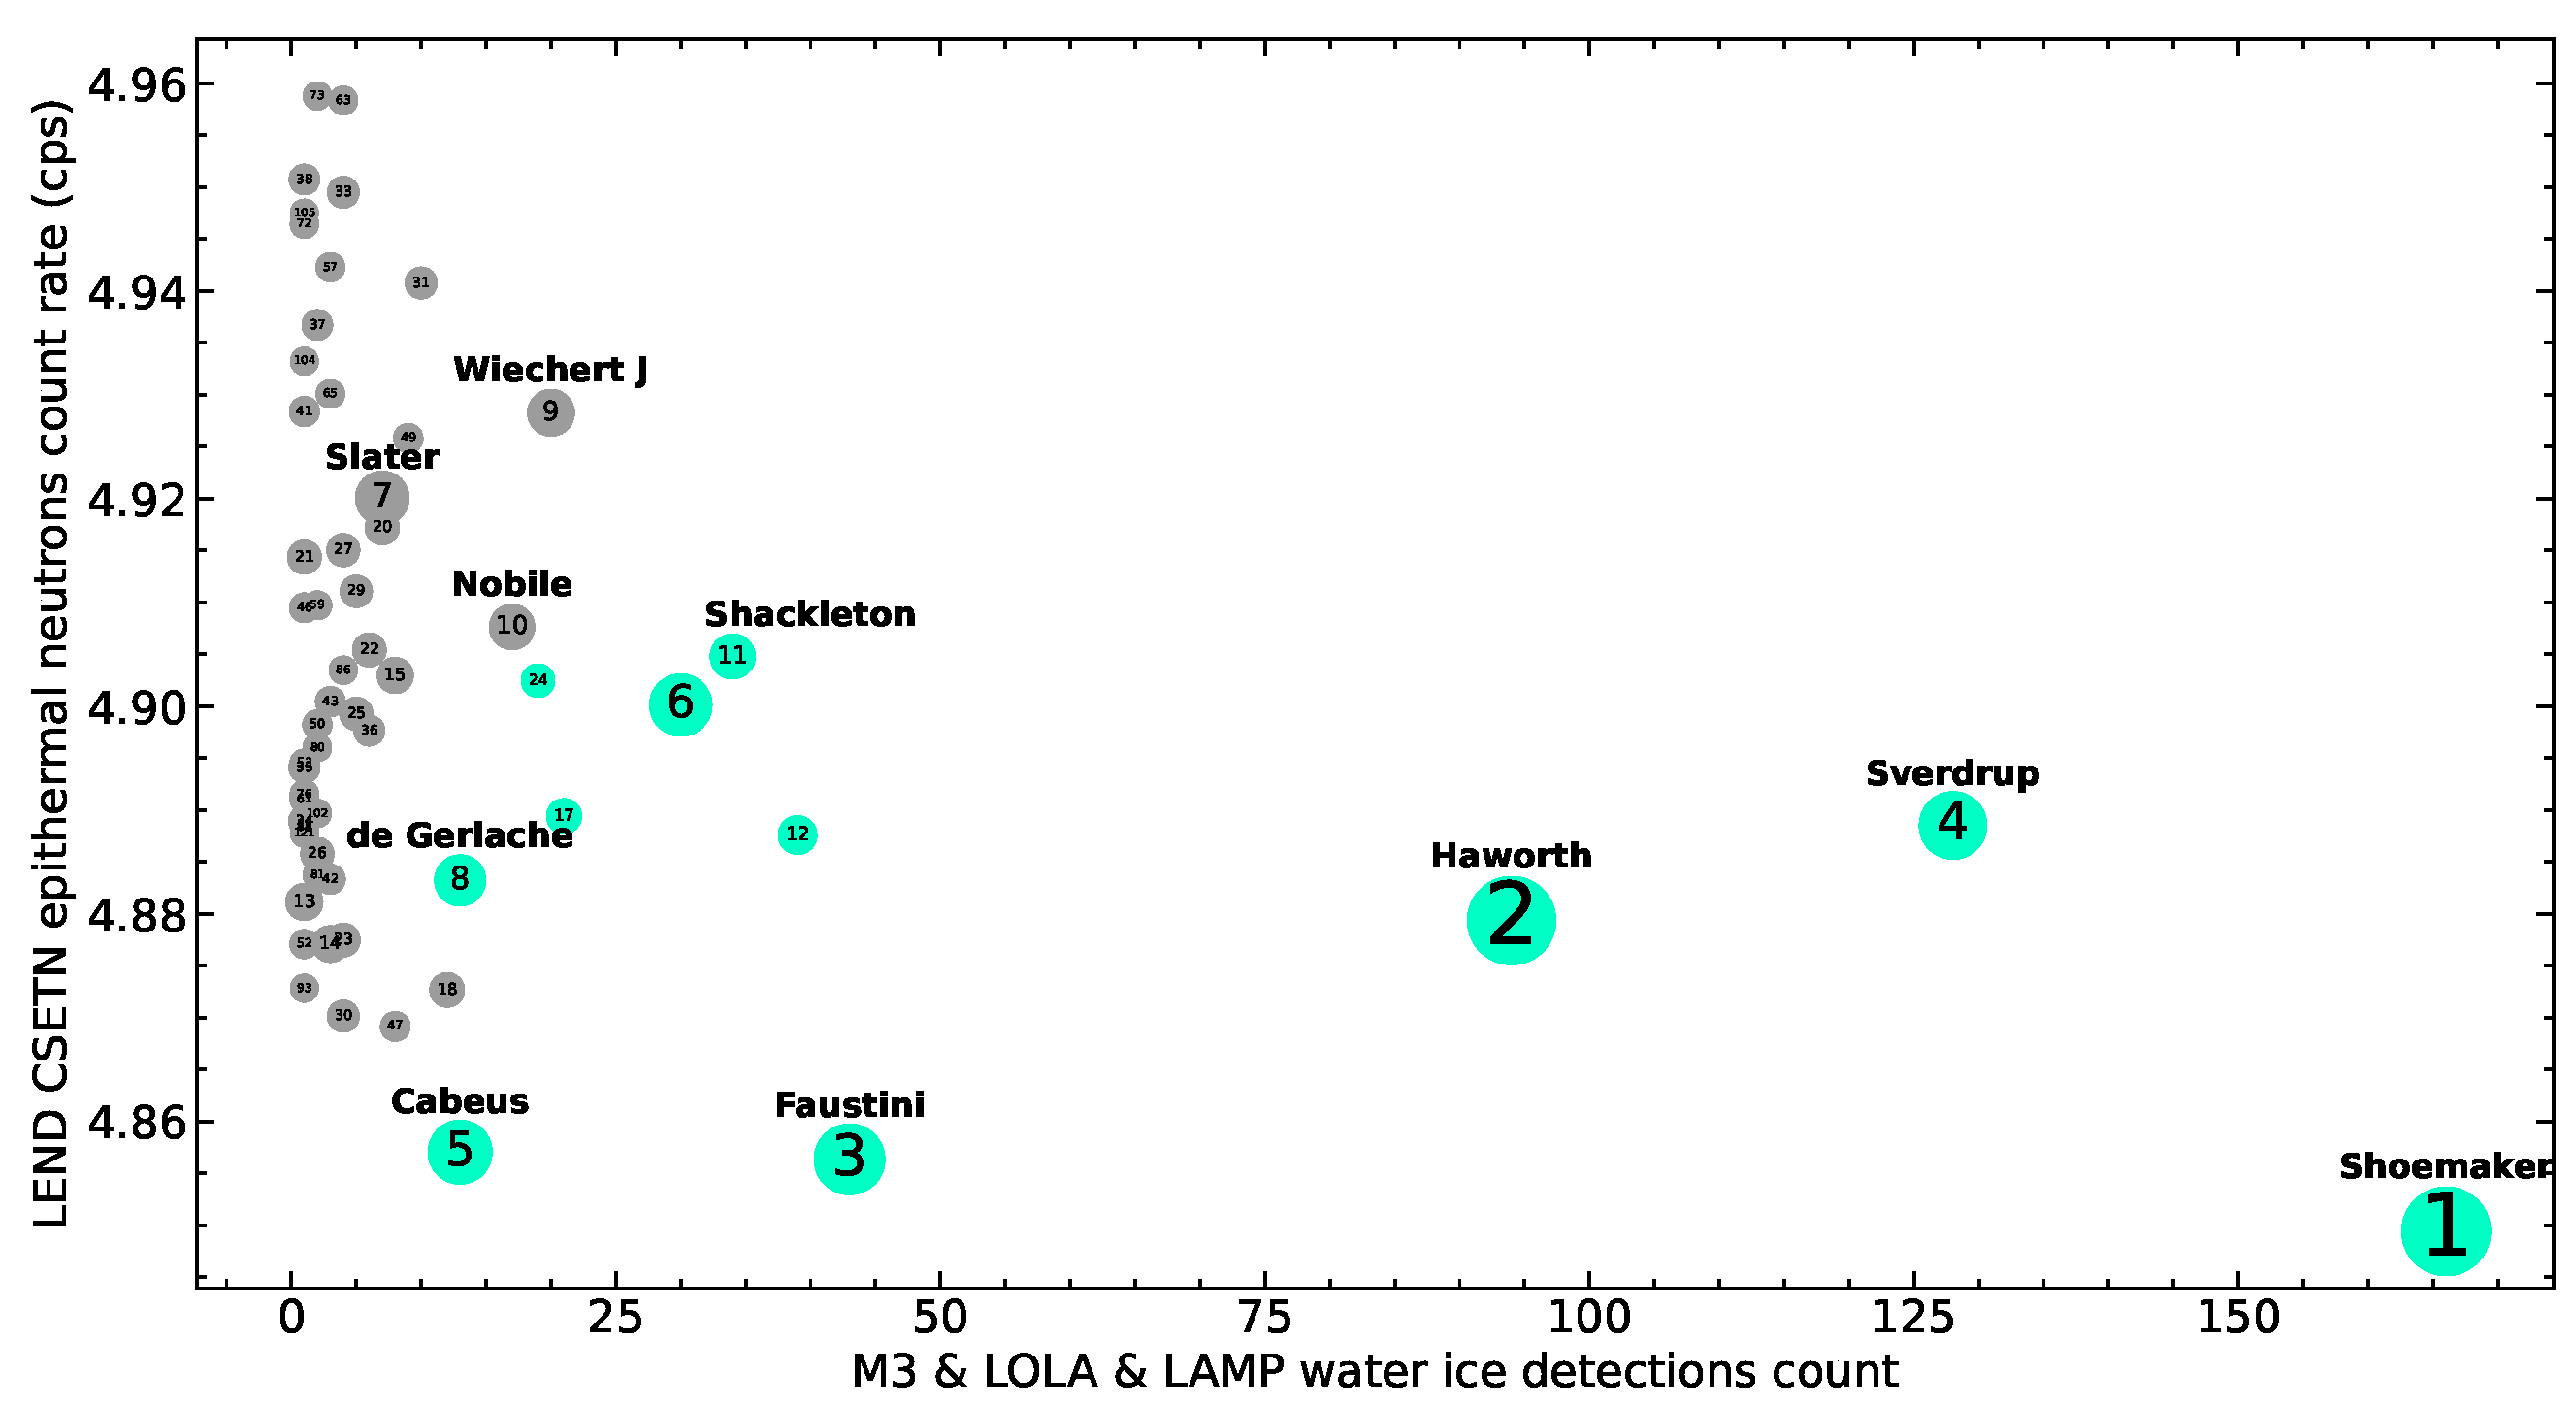
Figure 6 provides an assessment of the likelihood of water ice presence in the 61 cold traps, integrating data from the neutron spectrometer and spectral measurements.
At this stage, it is challenging to weight these two water ice indicators (i.e., neutron data and water ice detections). Instead, we applied threshold criteria to prioritize cold traps for CE-7 mini-flying probe sampling. The Lunar Crater Observation and Sensing Satellite (LCROSS) impact experiment [96] has confirmed the presence of water ice and other volatiles in the Cabeus cold trap (Figure 5). Accordingly, the detection count of water ice in Cabeus (13 detections) was established as the lower threshold for selecting optimal cold traps. Additionally, since the Shackleton crater has been officially identified as a potential target for the CE-7 mission [17], its epithermal neutron count rate (4.905 cps) was utilized as the upper threshold for optimal cold trap selection. However, it is important to note that Shackleton itself may not be the most favorable choice for the CE-7 mission due to its relatively low hydrogen abundance, which suggests a lower probability of containing water ice.
Ultimately, we identified 11 optimal (water ice detections ≥ 13, epithermal neutron count rate ≤ 4.905 cps) cold traps for mini-flying probe sampling, i.e., Shoemaker, Faustini, Cabeus, Haworth, Sverdrup, de Gerlache, Unnamed #12, #17, #6, #24, and Shackleton (highlighted in Figure 6), for further detailed analysis. From Figure 5 and Figure 6, it is evident that these optimal cold traps are generally large in size, and the following sections will address how to leap from appropriate well-illuminated landing regions into them.

4.2. Landing Regions for Selected Cold Traps

This subsection first presents the distribution of potential landing regions for the 11 selected cold traps. Subsequently, the size, slope, illumination, and flight routes of these regions are analyzed. Finally, the potential landing regions are ranked, and the optimal ones are selected.

4.2.1. Potential Landing Regions

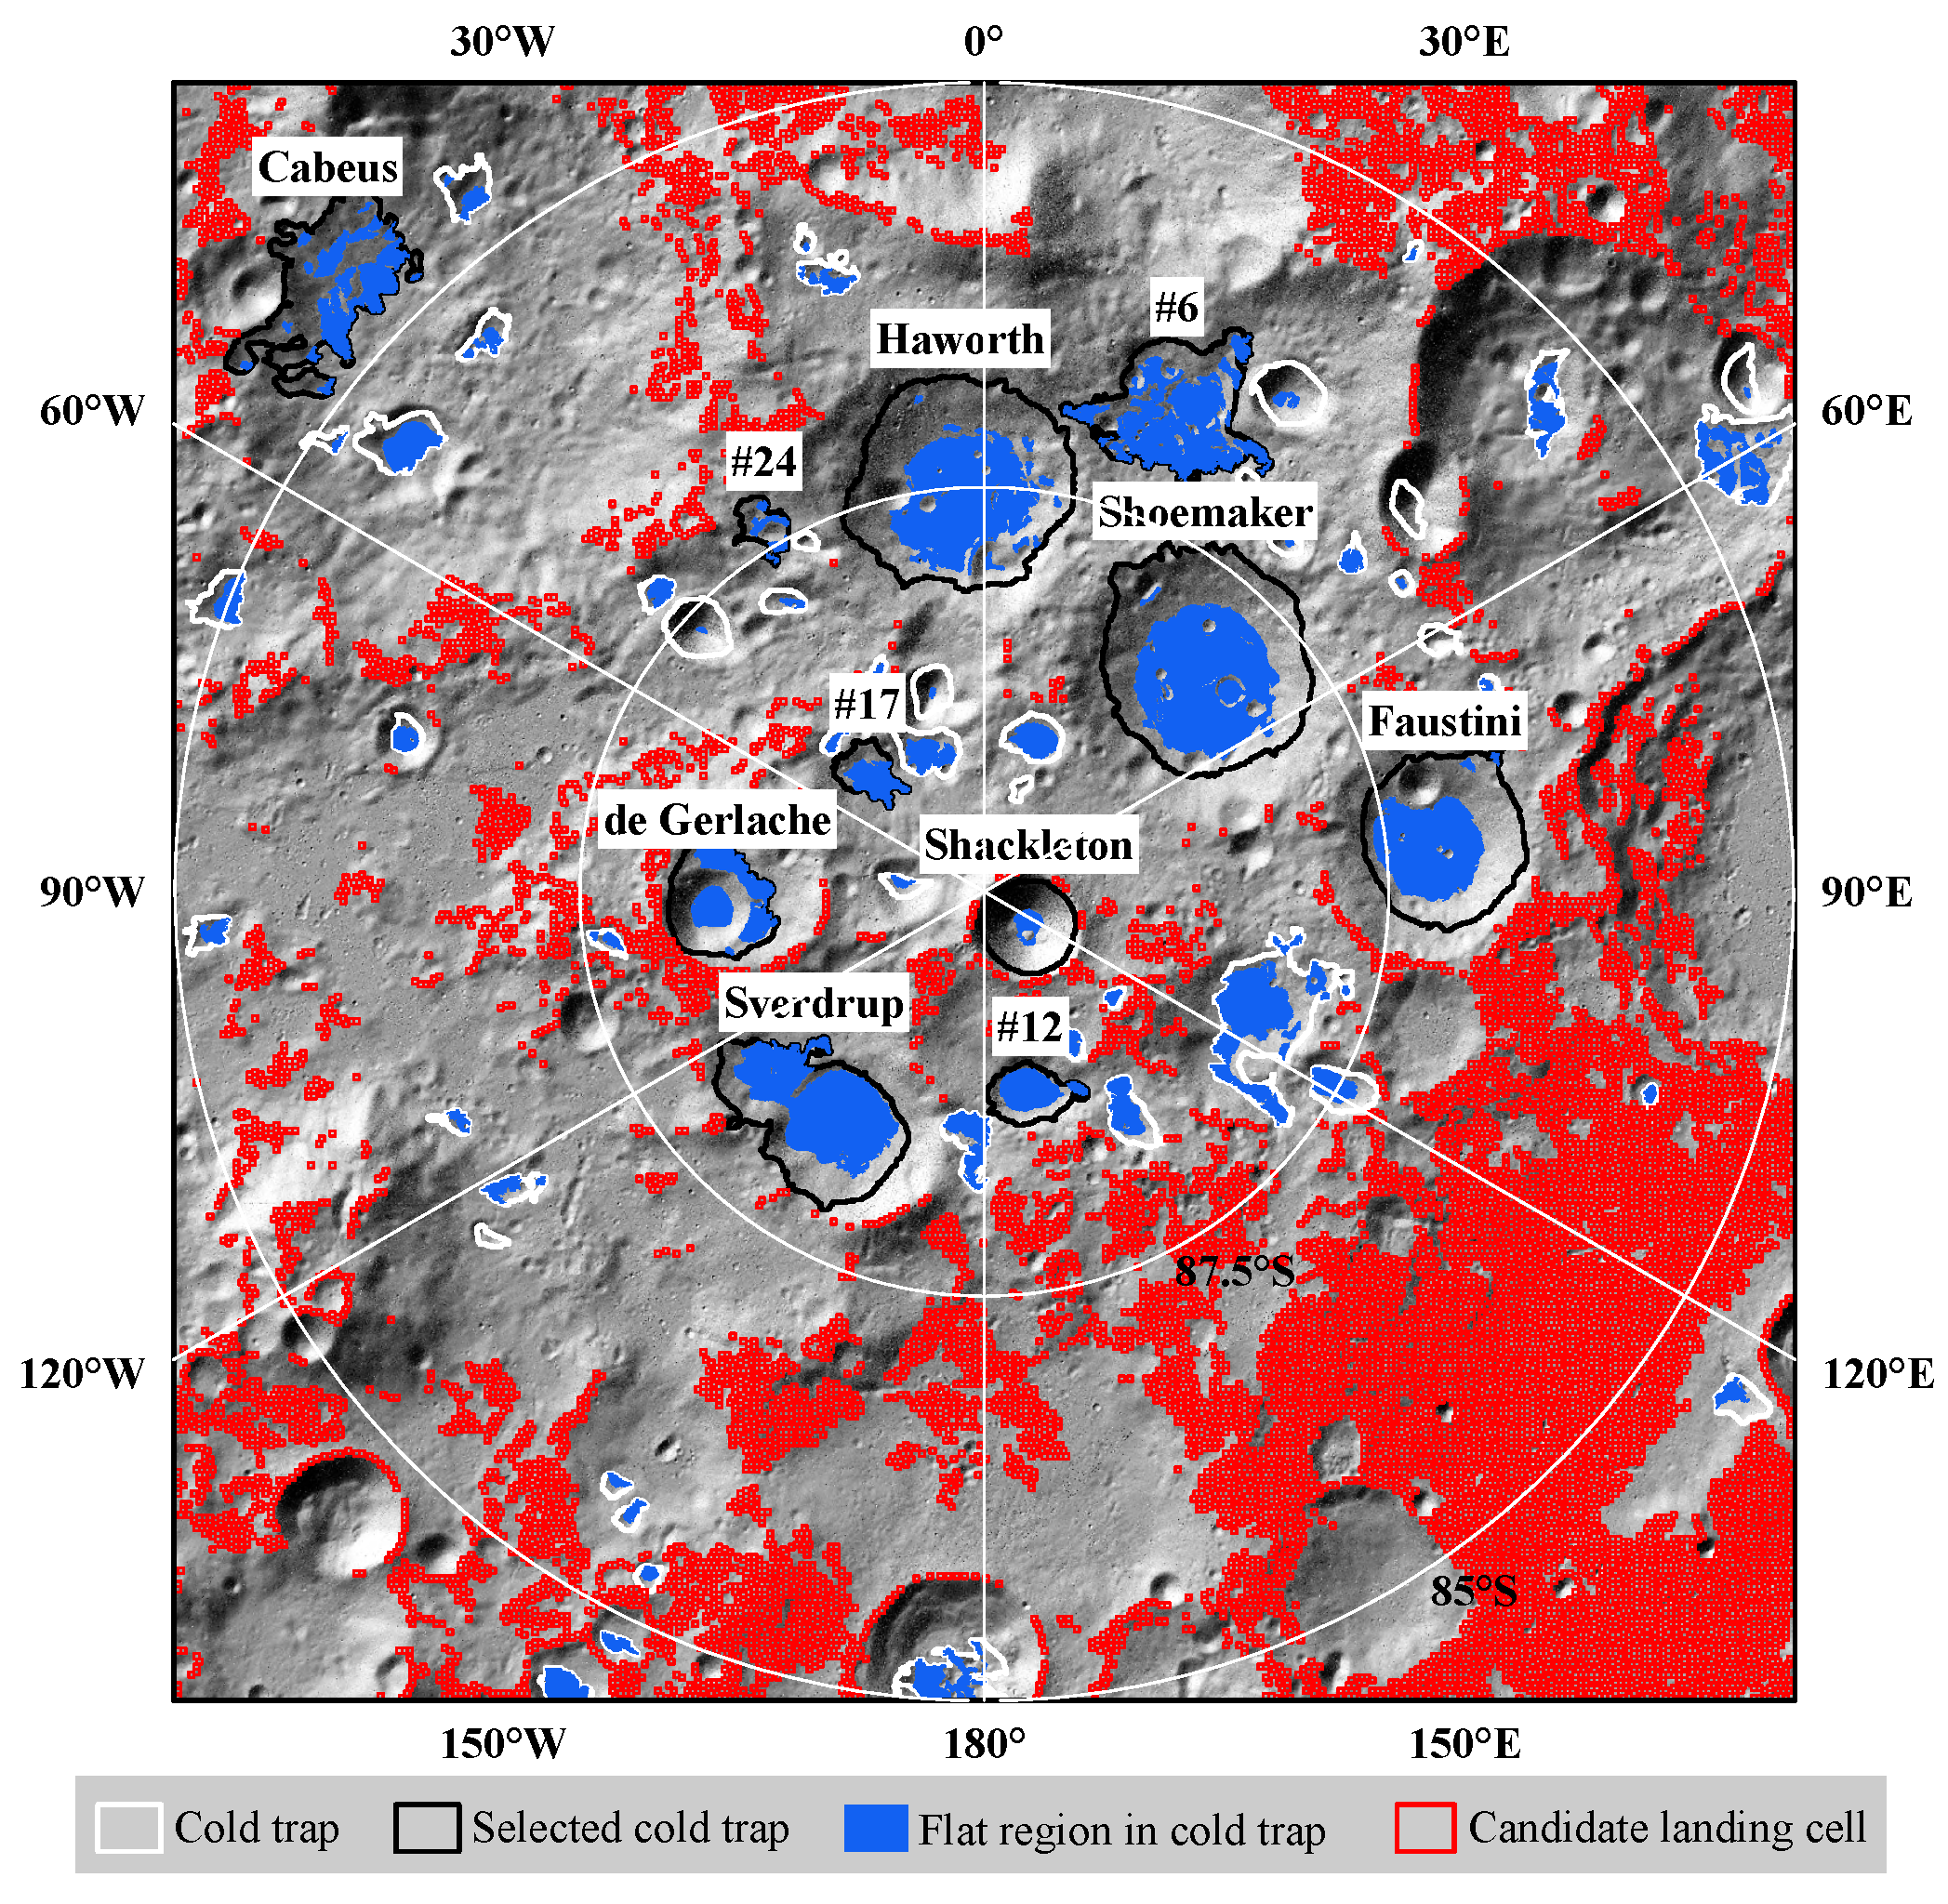
Using the landing cell selection method developed in this study, a total of 14,755 candidate safe landing cells (each corresponding to a 1 × 1 km2 area) are identified in the lunar south polar region (Figure 7). These landing cells are primarily distributed along the rims of large impact craters and in the southeastern part of the study area, specifically within the southern ejecta blanket of the Amundsen–Ganswindt basin (Figure 1). They can also serve as an initial selection for landing site identification in future south polar missions.
There are 757 landing cells (or landing sites) that are near the 11 selected cold traps (Figure 7). The three large ones (Shoemaker, Haworth, and the Unnamed #6) of the selected cold traps have few landing cells capable of reaching them under the CE-7 configuration. This is due to their location within an extensive low-light region (approximately 90 km across) centered at 87.5°S, 22.0°W. A flight distance of ≥20 km is required to explore these three cold traps. Among the other eight more accessible cold traps, Faustini, Sverdrup, de Gerlache, and Unnamed #12 are the easiest to reach. Each of these has at least 39 landing cells offering direct access to the cold trap and approximately 100 landing cells within a 15 km range. Cabeus, Unnamed #17, #24, and Shackleton exhibit moderate accessibility, each having 10 to 30 landing cells that can reach them.
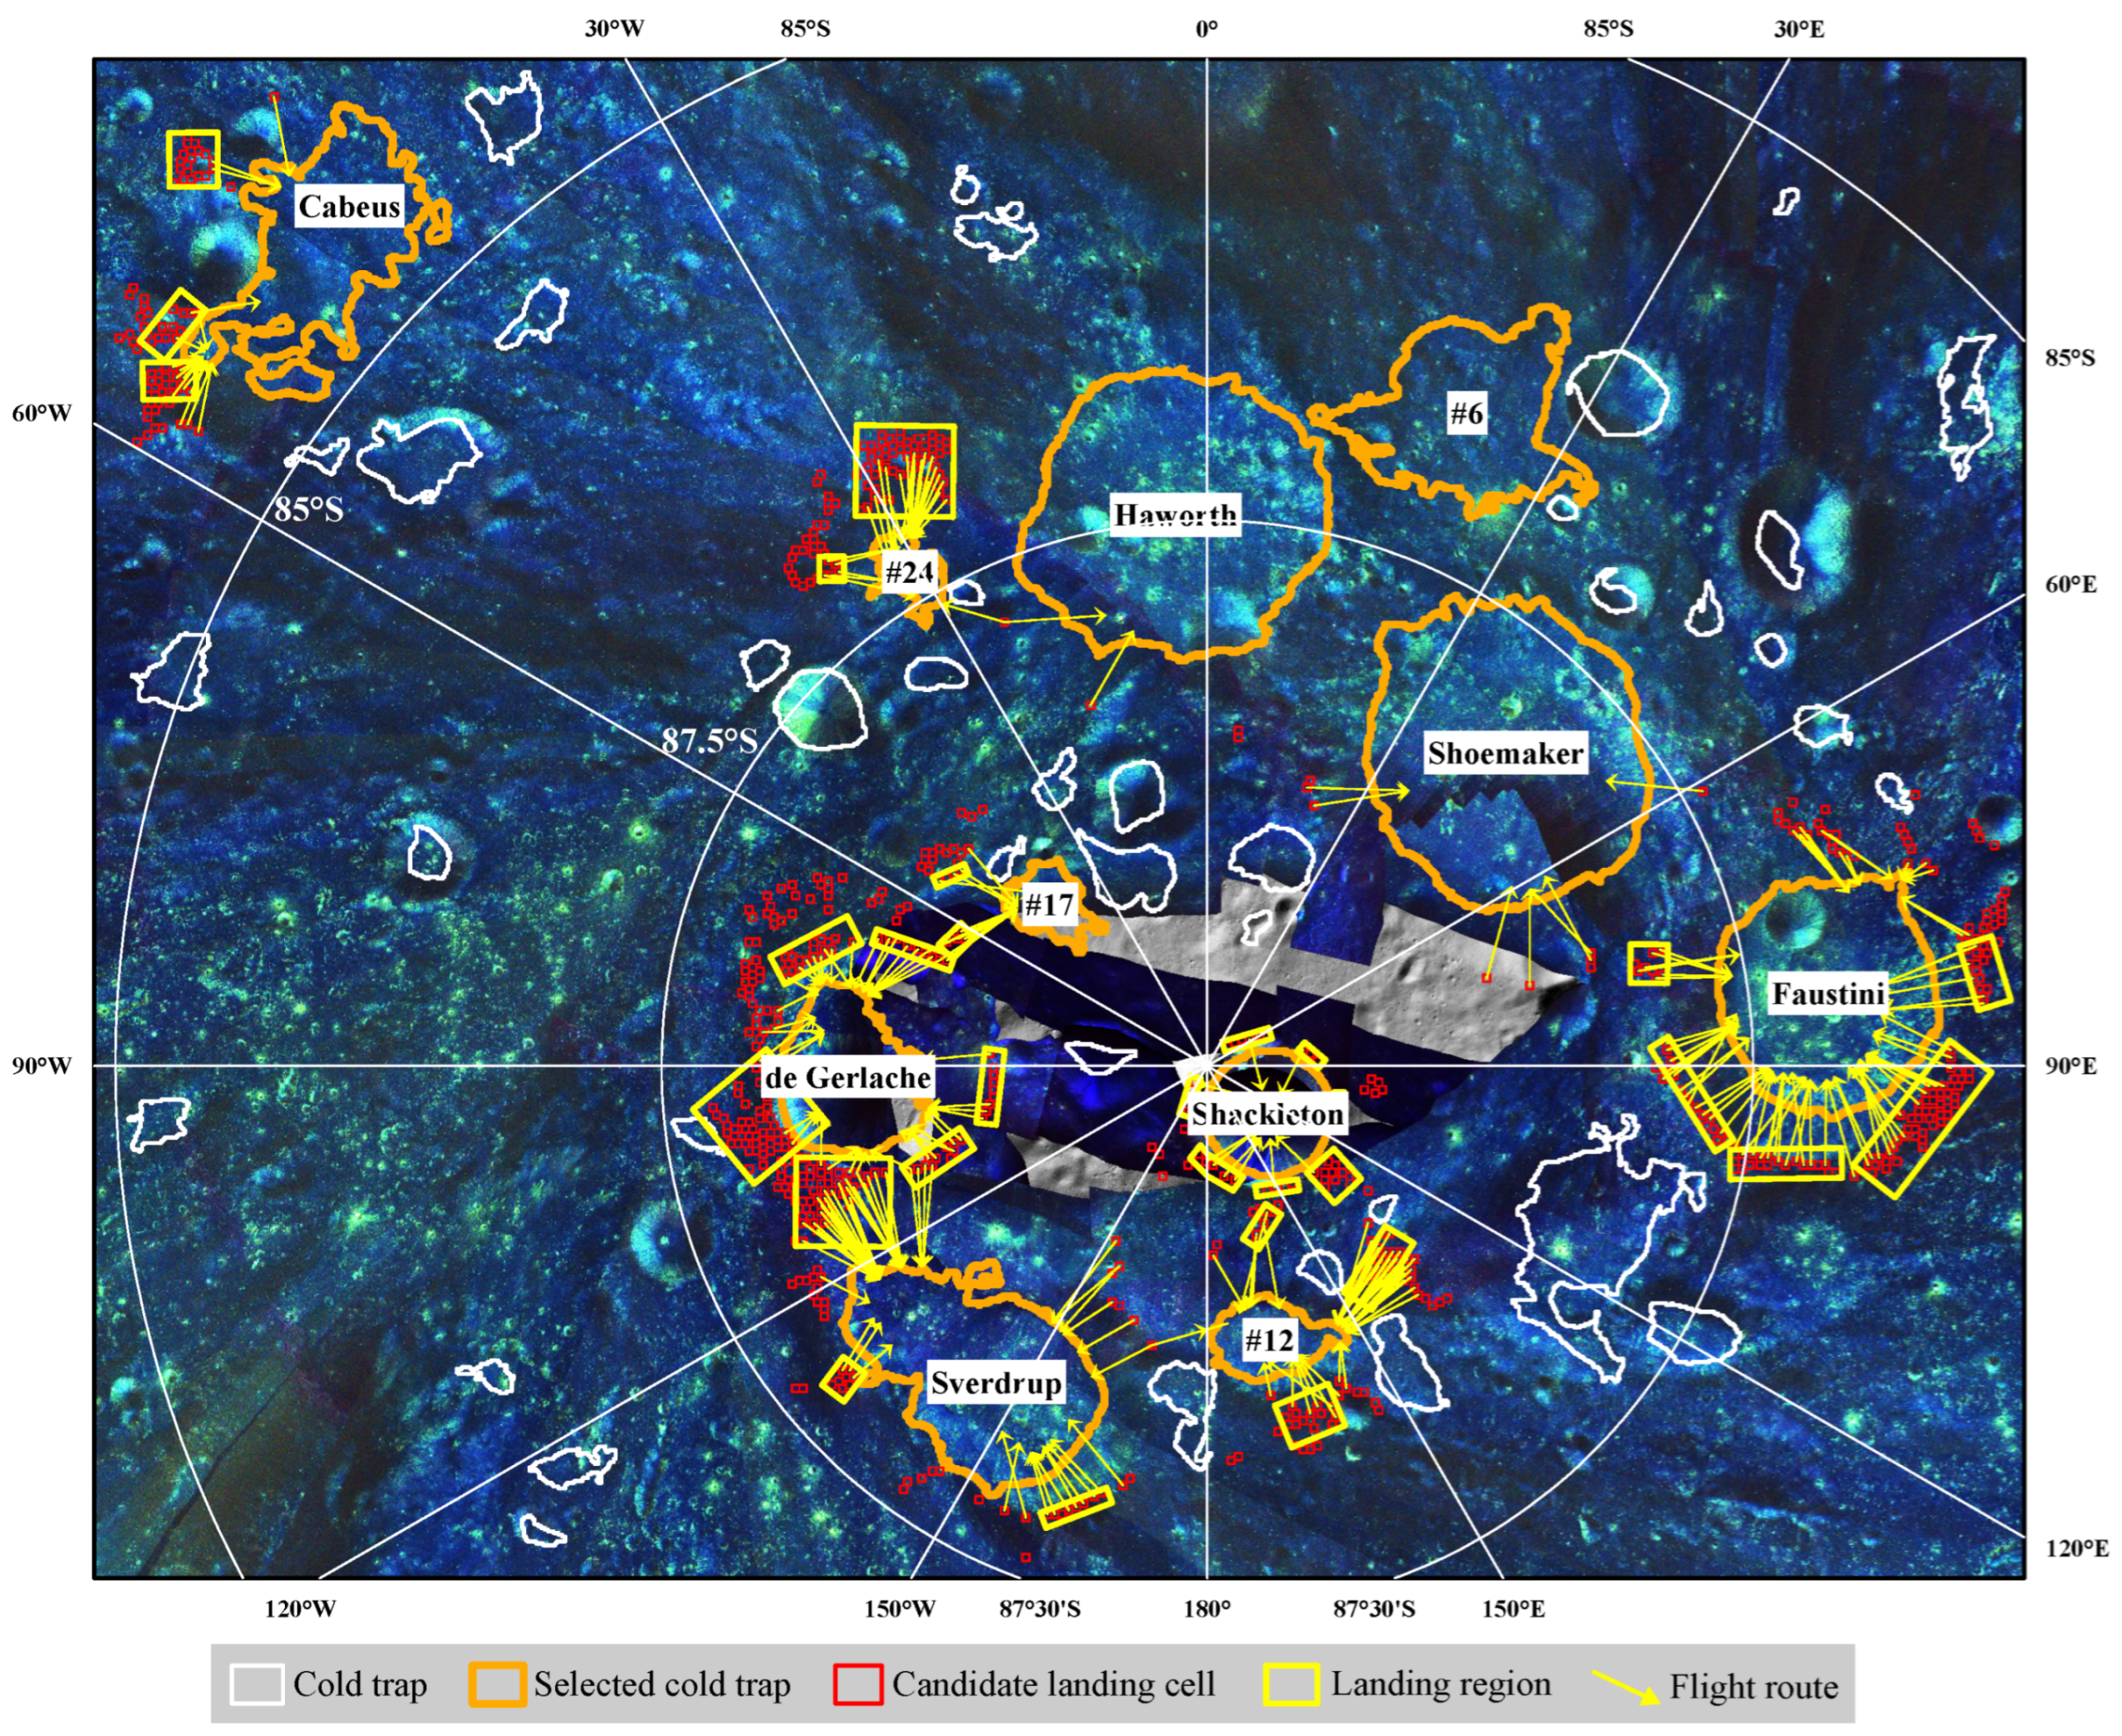
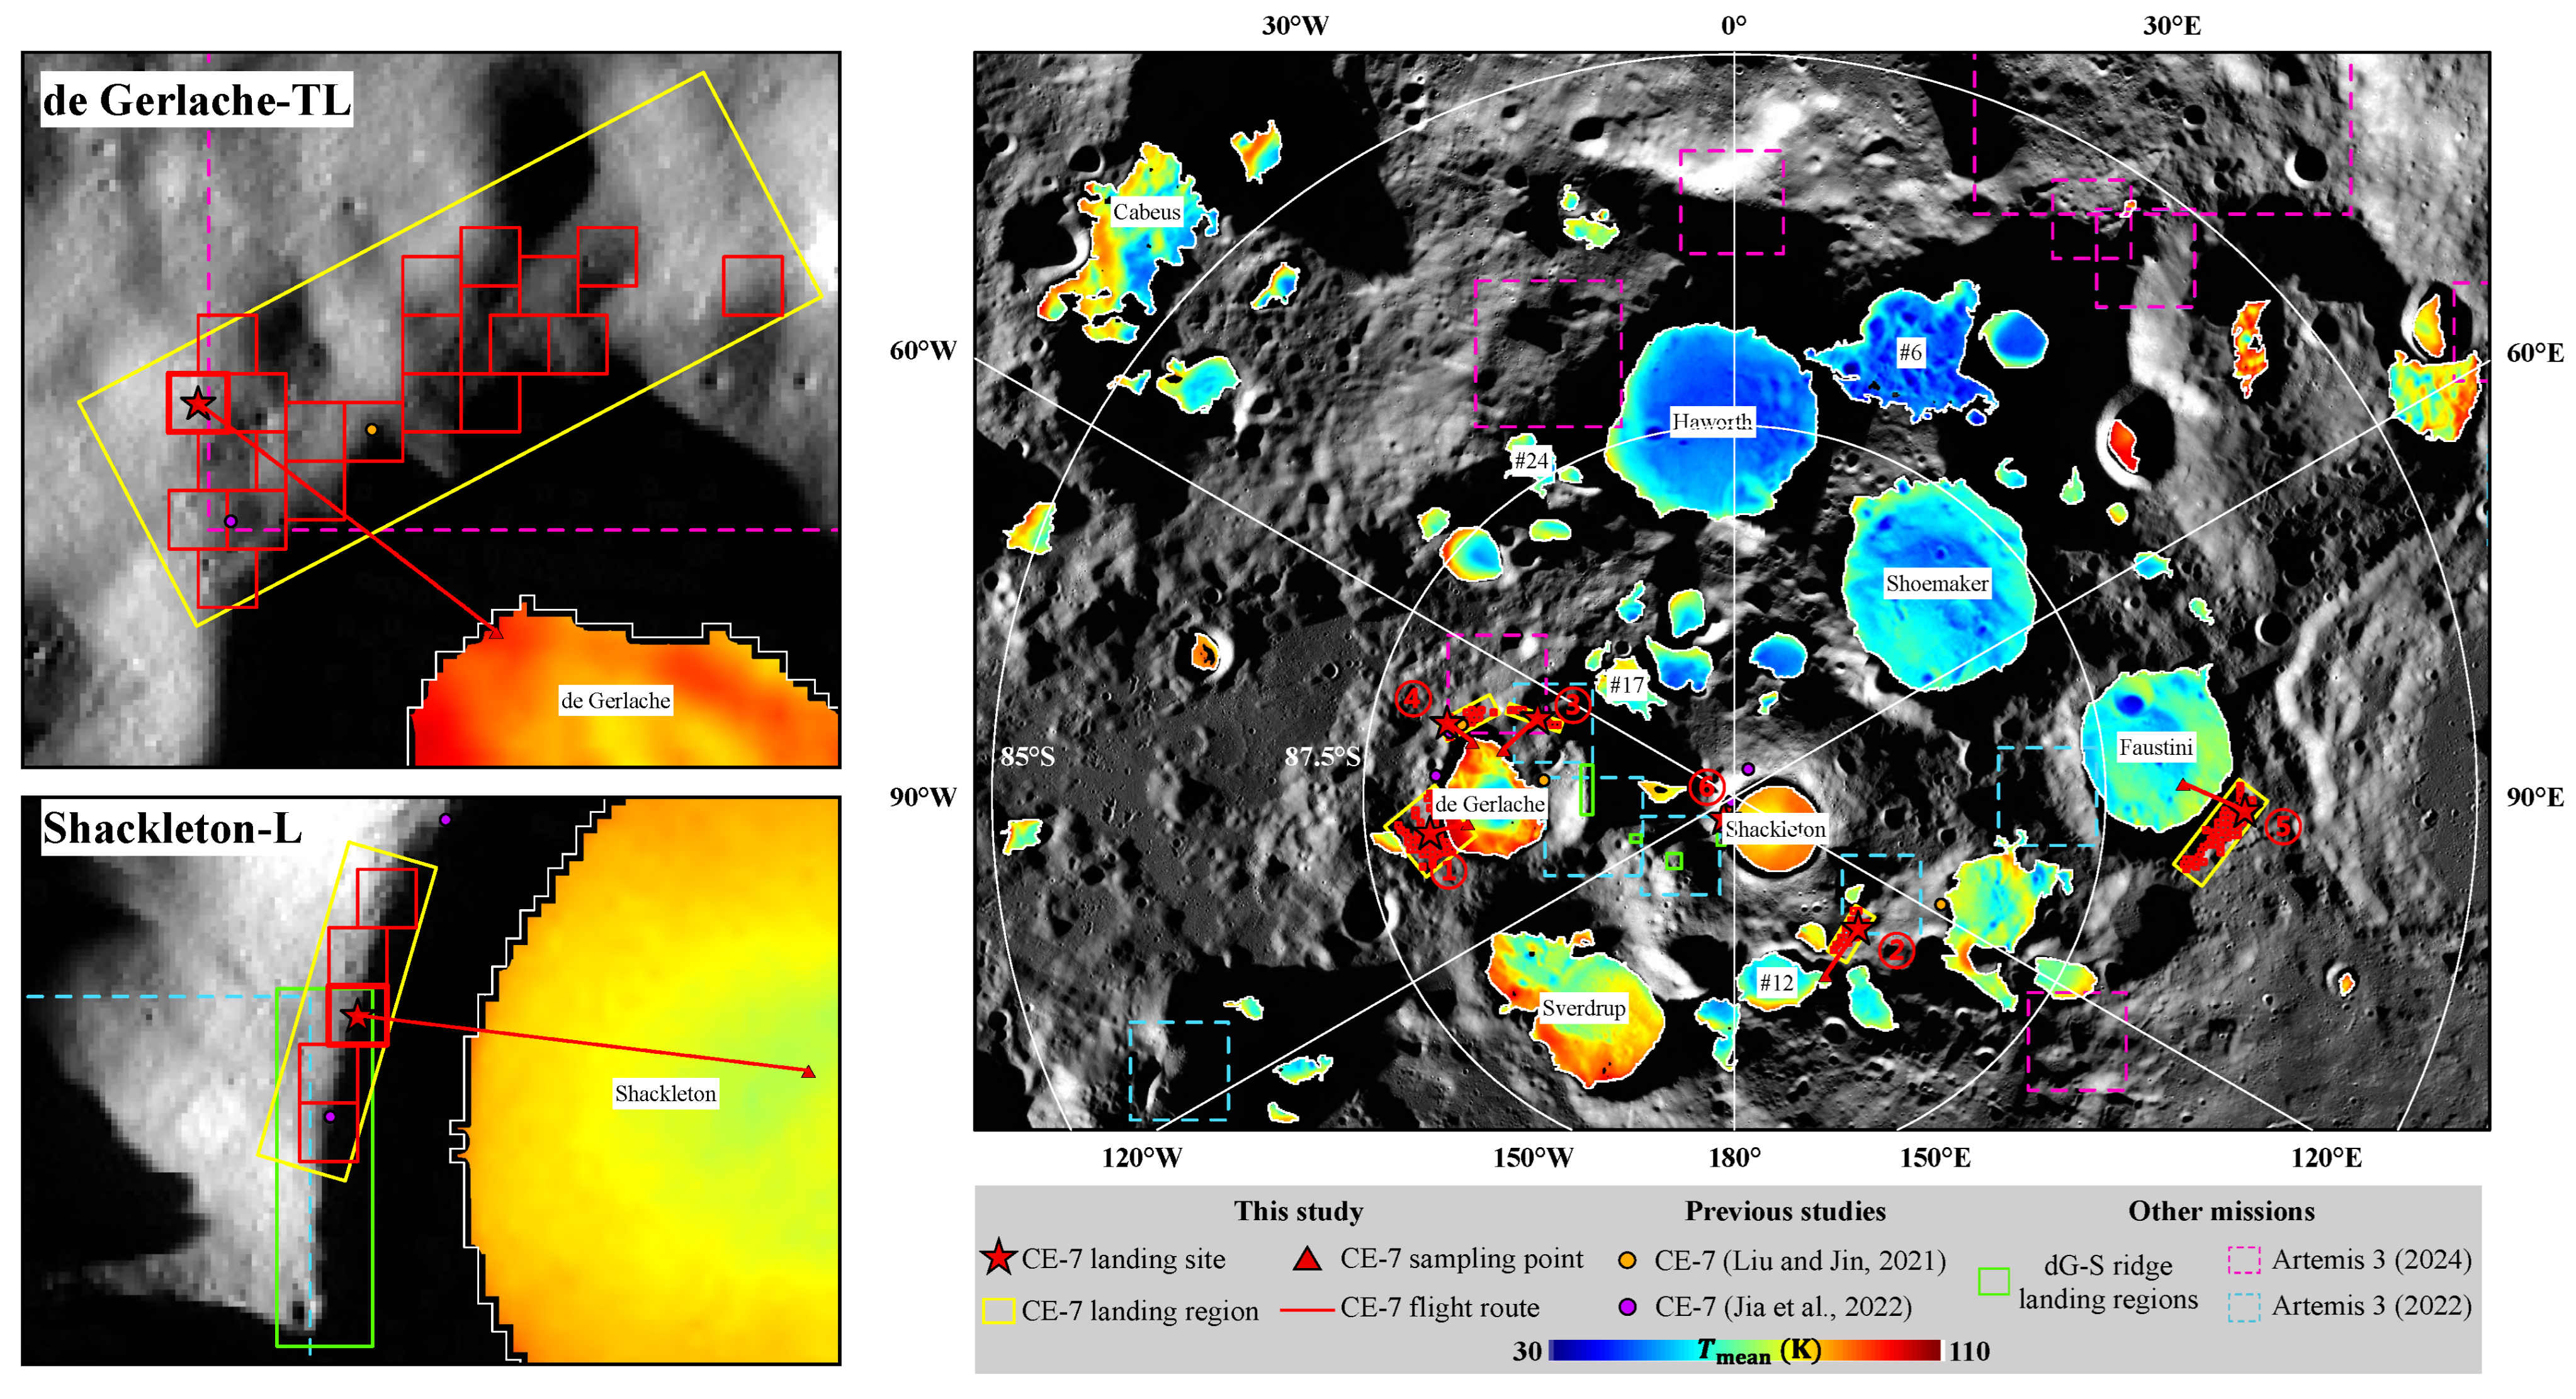
These landing cells/sites are further aggregated into landing regions (see Section 3). Note that scattered landing cells associated with the less accessible large cold traps in Haworth and Shoemaker are excluded. Additionally, some isolated landing cells, such as those north of Faustini, are disregarded due to their dispersed distribution. In total, 30 landing regions are identified, shown as yellow boxes in Figure 8. All of these regions meet, to some extent, the engineering constraints and water ice exploration requirements of the CE-7 mission.
In this study, landing regions are named based on the cold traps they surround, along with their relative azimuthal directions. For example, the landing region located on the western (left) rim of Shackleton is referred to as Shackleton-L, while the southwest (bottom-left) landing region near de Gerlache is designated as de Gerlache-BL. The use of top (T), bottom (B), left (L), and right (R) to indicate relative azimuthal directions, rather than geographic directions (north, south, east, west), is preferred because the study is focused on the polar regions, where geographic directions are less intuitive.

4.2.2. Statistical Analysis of Potential Landing Regions

In this subsection, the size, slope, illumination, and topography along feasible flight routes of the 30 proposed potential landing regions (Figure 8) are analyzed in sequence. The number of landing sites, as well as the statistics on slope, illumination, and flight routes within each landing region, are summarized in Supplementary Table S3. Note that only the slope and illumination values of the pixels within the landing cells of each region are included in the statistics presented here.
Size: The effective size of a landing region can be represented by the number of safe landing cells it contains. A higher number of landing cells within a region reduces the landing precision requirements for the CE-7 mission’s initial landing phase, while also expanding the rover’s potential exploration range following the landing. Four landing regions, namely Faustini-BR, de Gerlache-B, de Gerlache-BL, and #24-T, contain more than 45 landing cells, while all others have fewer than 25 landing cells (Figure 8 and Supplementary Table S3). These extensive landing regions are generally located on ejecta blankets overlying remnant intercrater highlands. In addition to the number of clustered landing cells, the shape of the landing region is also a critical factor. Experience from previous CE missions [37] indicates that control errors in altitude and longitude, as well as landing delays caused by unforeseen in-orbit technical issues, can all contribute to spacecraft drift. Therefore, a quasi-circular or square landing region is preferred, as it can better tolerate landing deviations in all directions compared to an elongated one. It should be noted that this consideration does not conflict with the high-precision landing capability of CE-7. This capability is expected to be most relevant in the later stages of landing, once the target landing area or site has been captured and locked. At this stage, high-precision pinpoint landing can be achieved within the designated area through real-time image matching with orbital landmark imagery. Considering the shape of the landing region, the elongated and narrow landing regions along the rim of the Shackleton crater would be challenging for the CE-7 mission (Figure 8).
Slope: The median slopes of most landing regions (26 out of 30) are less than 10°, with the majority being under 8° (Supplementary Table S3). The average slopes exhibit a similar trend. This demonstrates the effectiveness of the strategy for proposing landing regions. Except for the southeastern landing region of Shackleton, the landing regions near Shackleton have median or average slopes exceeding 10°. The 95th percentile slope for each region is generally comparable to or below 15° (within the safety threshold for rover traversal), but once again excluding the landing regions around the Shackleton crater (Supplementary Table S3).
Illumination: The average and median illumination of each landing region typically range from 31% to 44% (Supplementary Table S3). When ranked by average illumination, the top eight landing regions (with average illumination > 38%) are primarily located around de Gerlache and Shackleton, with the exceptions of Sverdrup-BR and #12-TR. The 95th percentile illumination of these eight regions is also high, surpassing 49%. Notably, the illumination of the de Gerlache-TR landing region (average: 43.6%, 95th percentile: 58.9%) is comparable to that of the well-illuminated landing region on Shackleton’s western rim (average: 43.3%, 95th percentile: 65.5%).
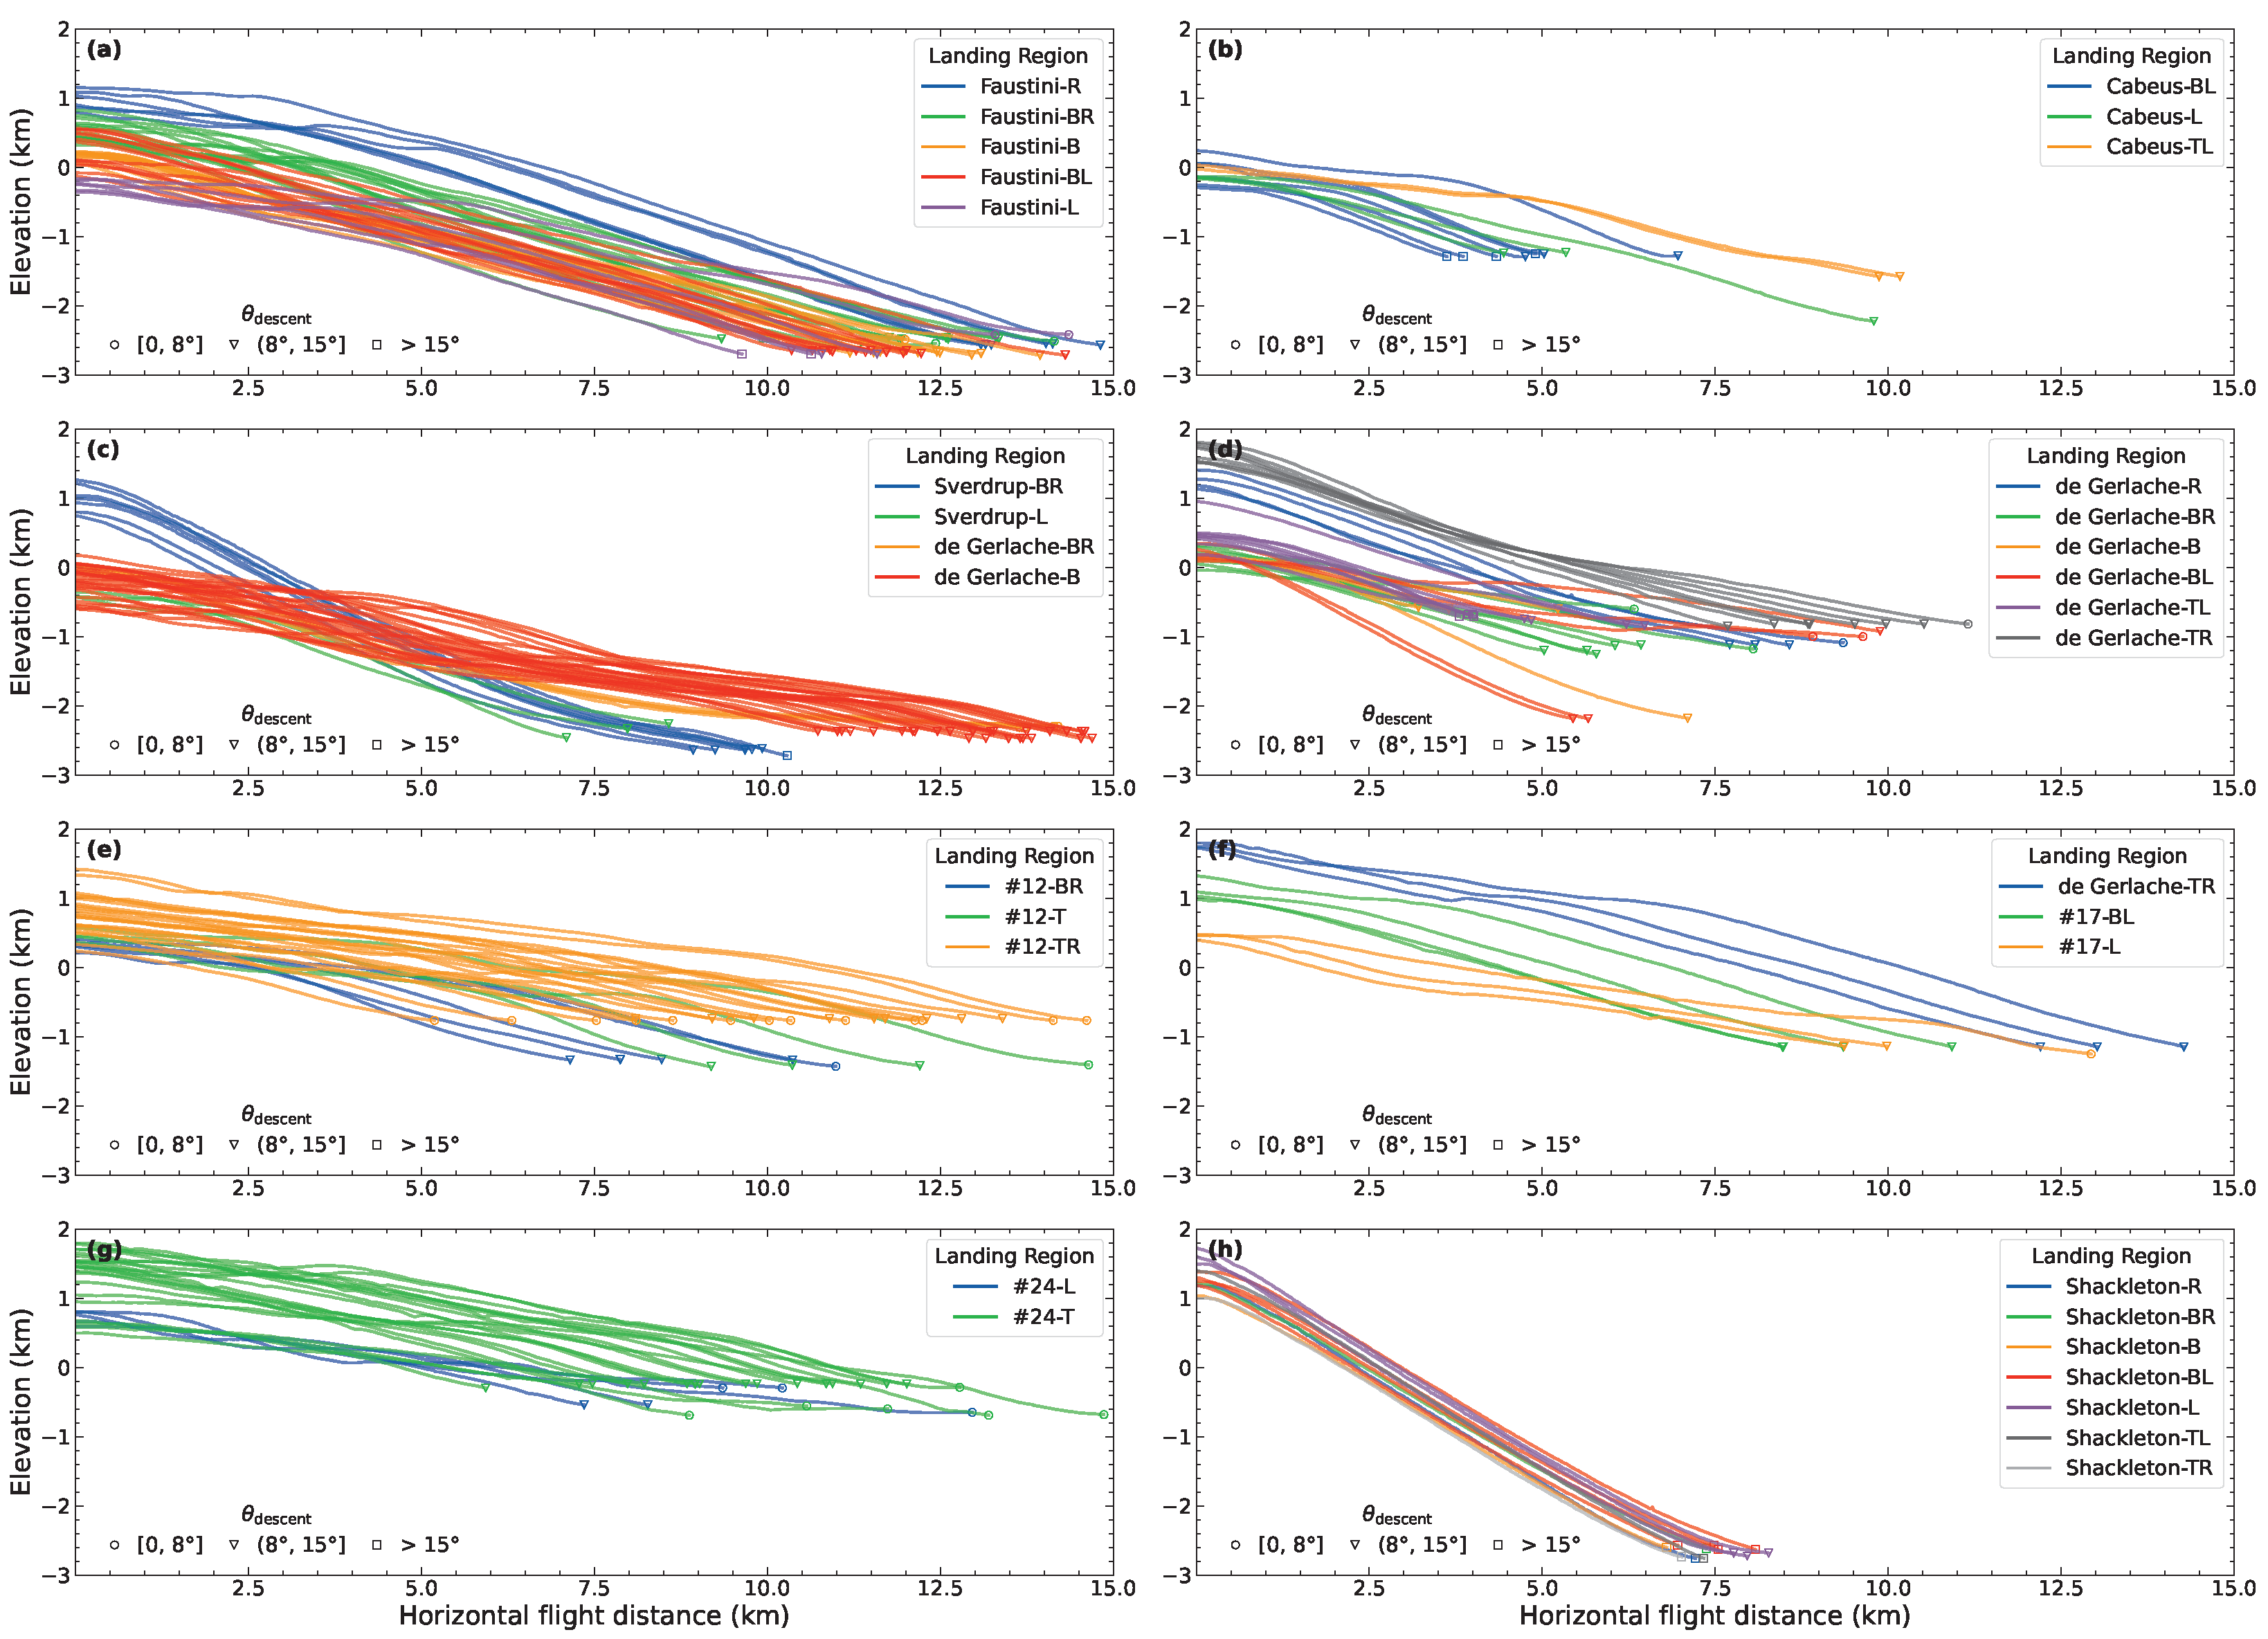
Topography along flight routes: The topographic profile along the flight route is critical for trajectory planning, flight control algorithm development, and energy management of the CE-7 mini-flying probe. Accordingly, a flight route is searched and evaluated for each landing site within the landing regions. The elevation profiles of the feasible routes, shown in Figure 9, depict the typical topographic variations that the CE-7 mission may encounter. Horizontal distance along the flight route dictates the probe’s energy requirements. The CE-7 mini-flying probe is designed to cover a single-flight distance of at least 10 km, with the capability for multiple flights. Due to Faustini’s large size, nearly all flight routes to it exceed 10 km, but stay within the assumed upper limit of 15 km. For the cold traps Sverdrup, #12, #17, and #24, the horizontal distances of the flight routes range from 7 to 14 km, depending on the landing region from which they are accessed. Horizontal distances of the flight routes to Cabeus, de Gerlache, and Shackleton are mostly within 10 km. From certain landing regions, such as Cabeus-L, de Gerlache-BR, and de Gerlache-TL, the corresponding cold traps can be accessed with flight distances as short as 5 km.
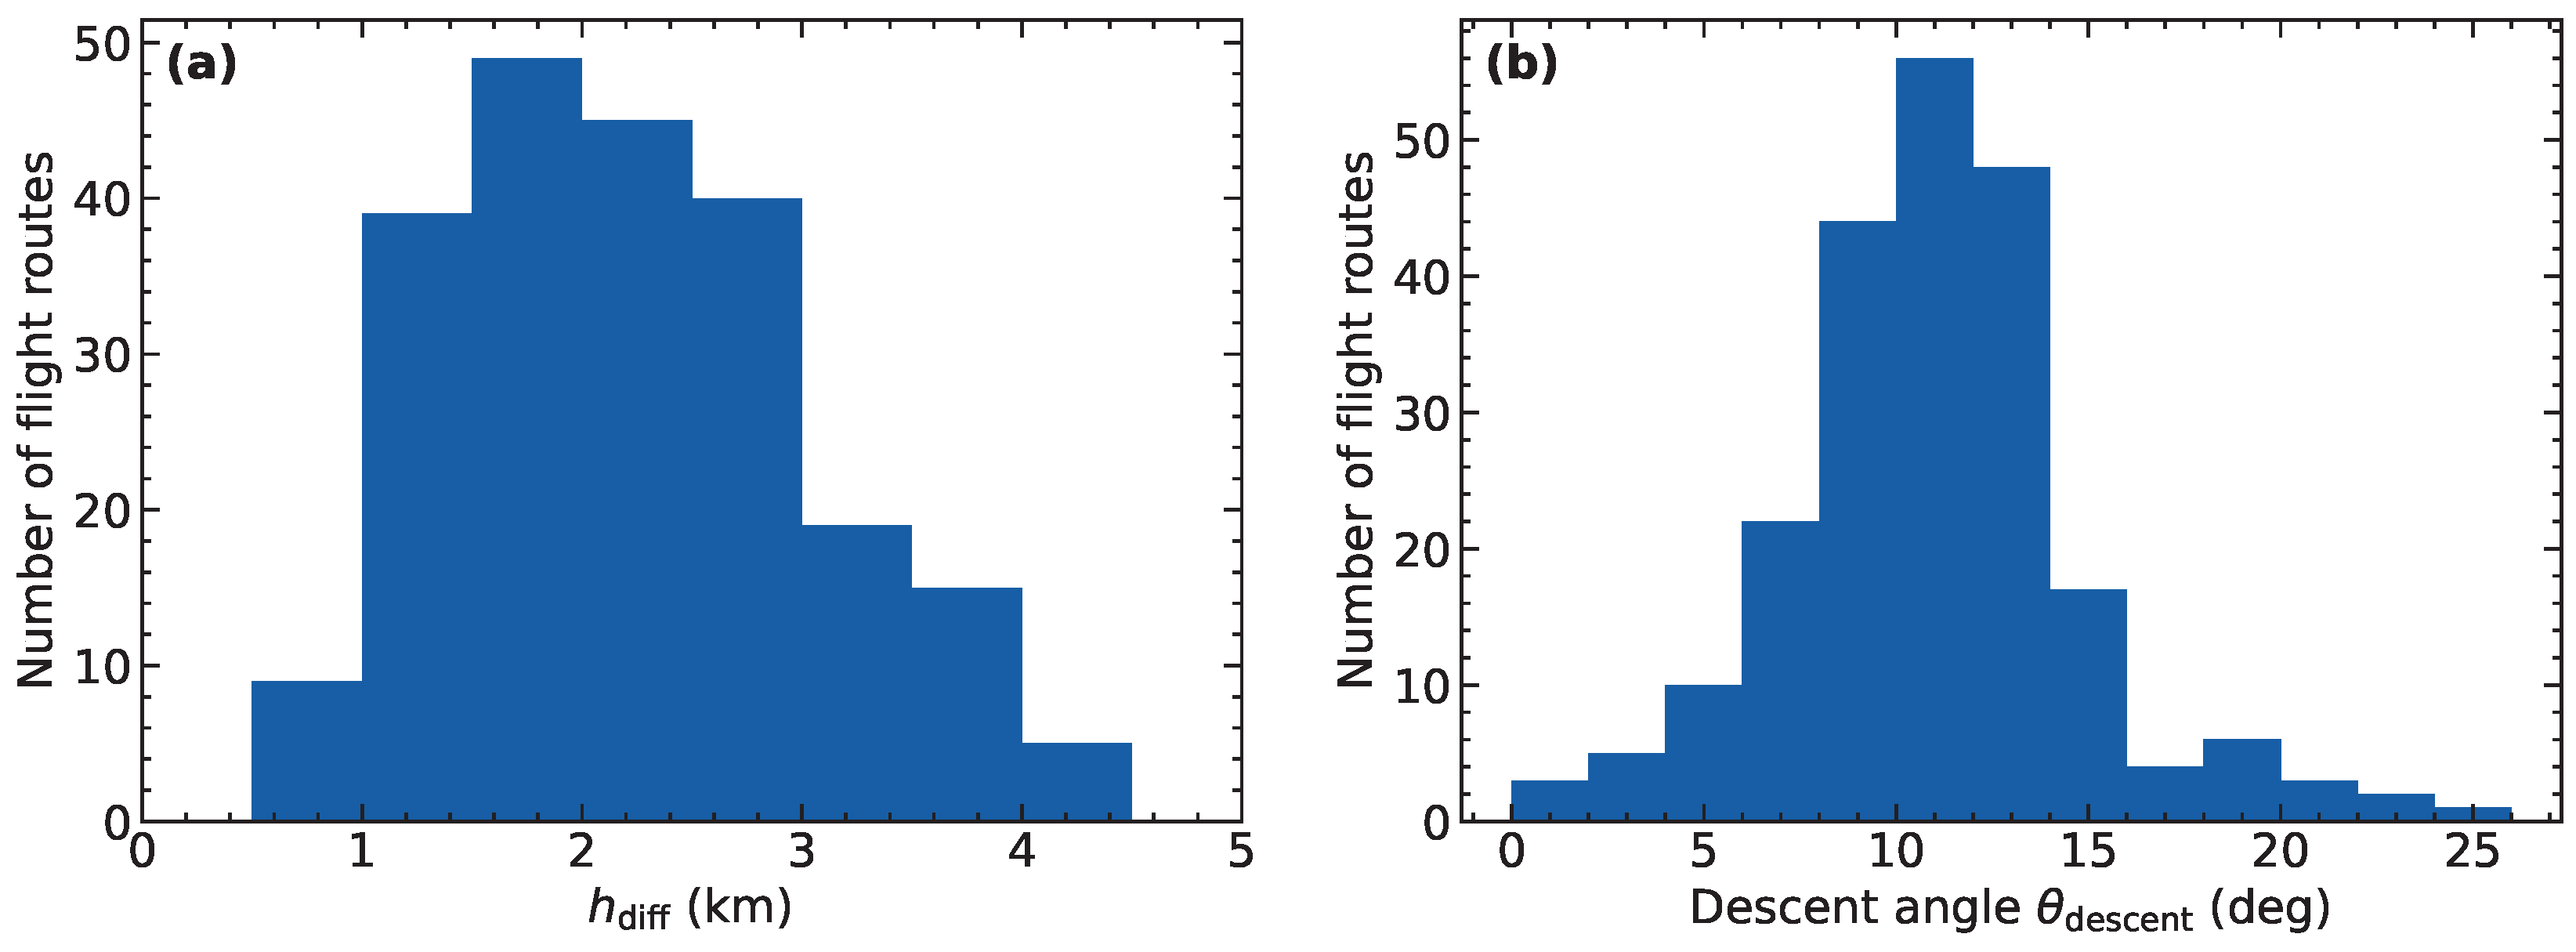
The elevation difference h diff between the landing and sampling regions is another important factor influencing the selection of flight routes. A reasonable h diff not only helps avoid terrain obstacles but may also conserve fuel. The h diff of the feasible flight routes ranges from 0.5 to 4.5 km (Figure 10a and Supplementary Table S4). Cold traps #12, #17, #24, and Cabeus differ from other cold traps in that the first three are not located within deep impact craters, while the flat sampling area of Cabeus is situated on its inner wall. As a result, the h diff of flight routes to these cold traps is generally less than 2 km. In contrast, landing on the floor of the large impact crater Faustini or the relatively young Shackleton crater would require a descent of at least 3 to 4 km. As shown in Figure 9h, the topography along the flight routes leading into Shackleton is notably the steepest, with slopes approaching 30°. Such steep elevation changes may pose challenges for the mini-flying probe, particularly in using lidar to measure altitude in real time. Finally, the vertical descent height from landing regions around de Gerlache to de Gerlache or Sverdrup is around 2 km, with relatively gentle topographic variations (Figure 9c,d). Notably, entering Sverdrup from de Gerlache-B(R) involves smoother elevation changes compared to other feasible landing regions near Sverdrup, albeit at the cost of a slightly longer horizontal distance.
In the final stage of the mini-flying probe’s landing, it is preferable for the terrain to be gentle, with smaller descent angles facilitating the transition to a horizontal hover mode for precise landing. As shown in Figure 10b, the descent angles along feasible flight routes range from 0° to 25°, with most concentrated around 10°. For Shackleton, the western landing region exhibits descent angles of approximately 10°, while other areas have angles reaching up to 20°. This difference arises from the rugged, hummocky terrain and potential landslides in the eastern portion of Shackleton. Consequently, the western landing region is likely the most favorable option for Shackleton.
To summarize, except for Shackleton, the topography along the flight routes into the selected cold traps is generally gentle, with horizontal distances around 10 km (slightly longer for Faustini and Sverdrup) and vertical distances of approximately 2 km. For Shackleton, the horizontal and vertical distances are around 7.5 km and 4 km, respectively. Among the landing regions surrounding Shackleton, Shackleton-L offers the optimal flight route due to its smaller descent angle. The CE-7 mini-flying probe is expected to navigate these terrains effectively.

4.2.3. Selection of Optimal Landing Regions

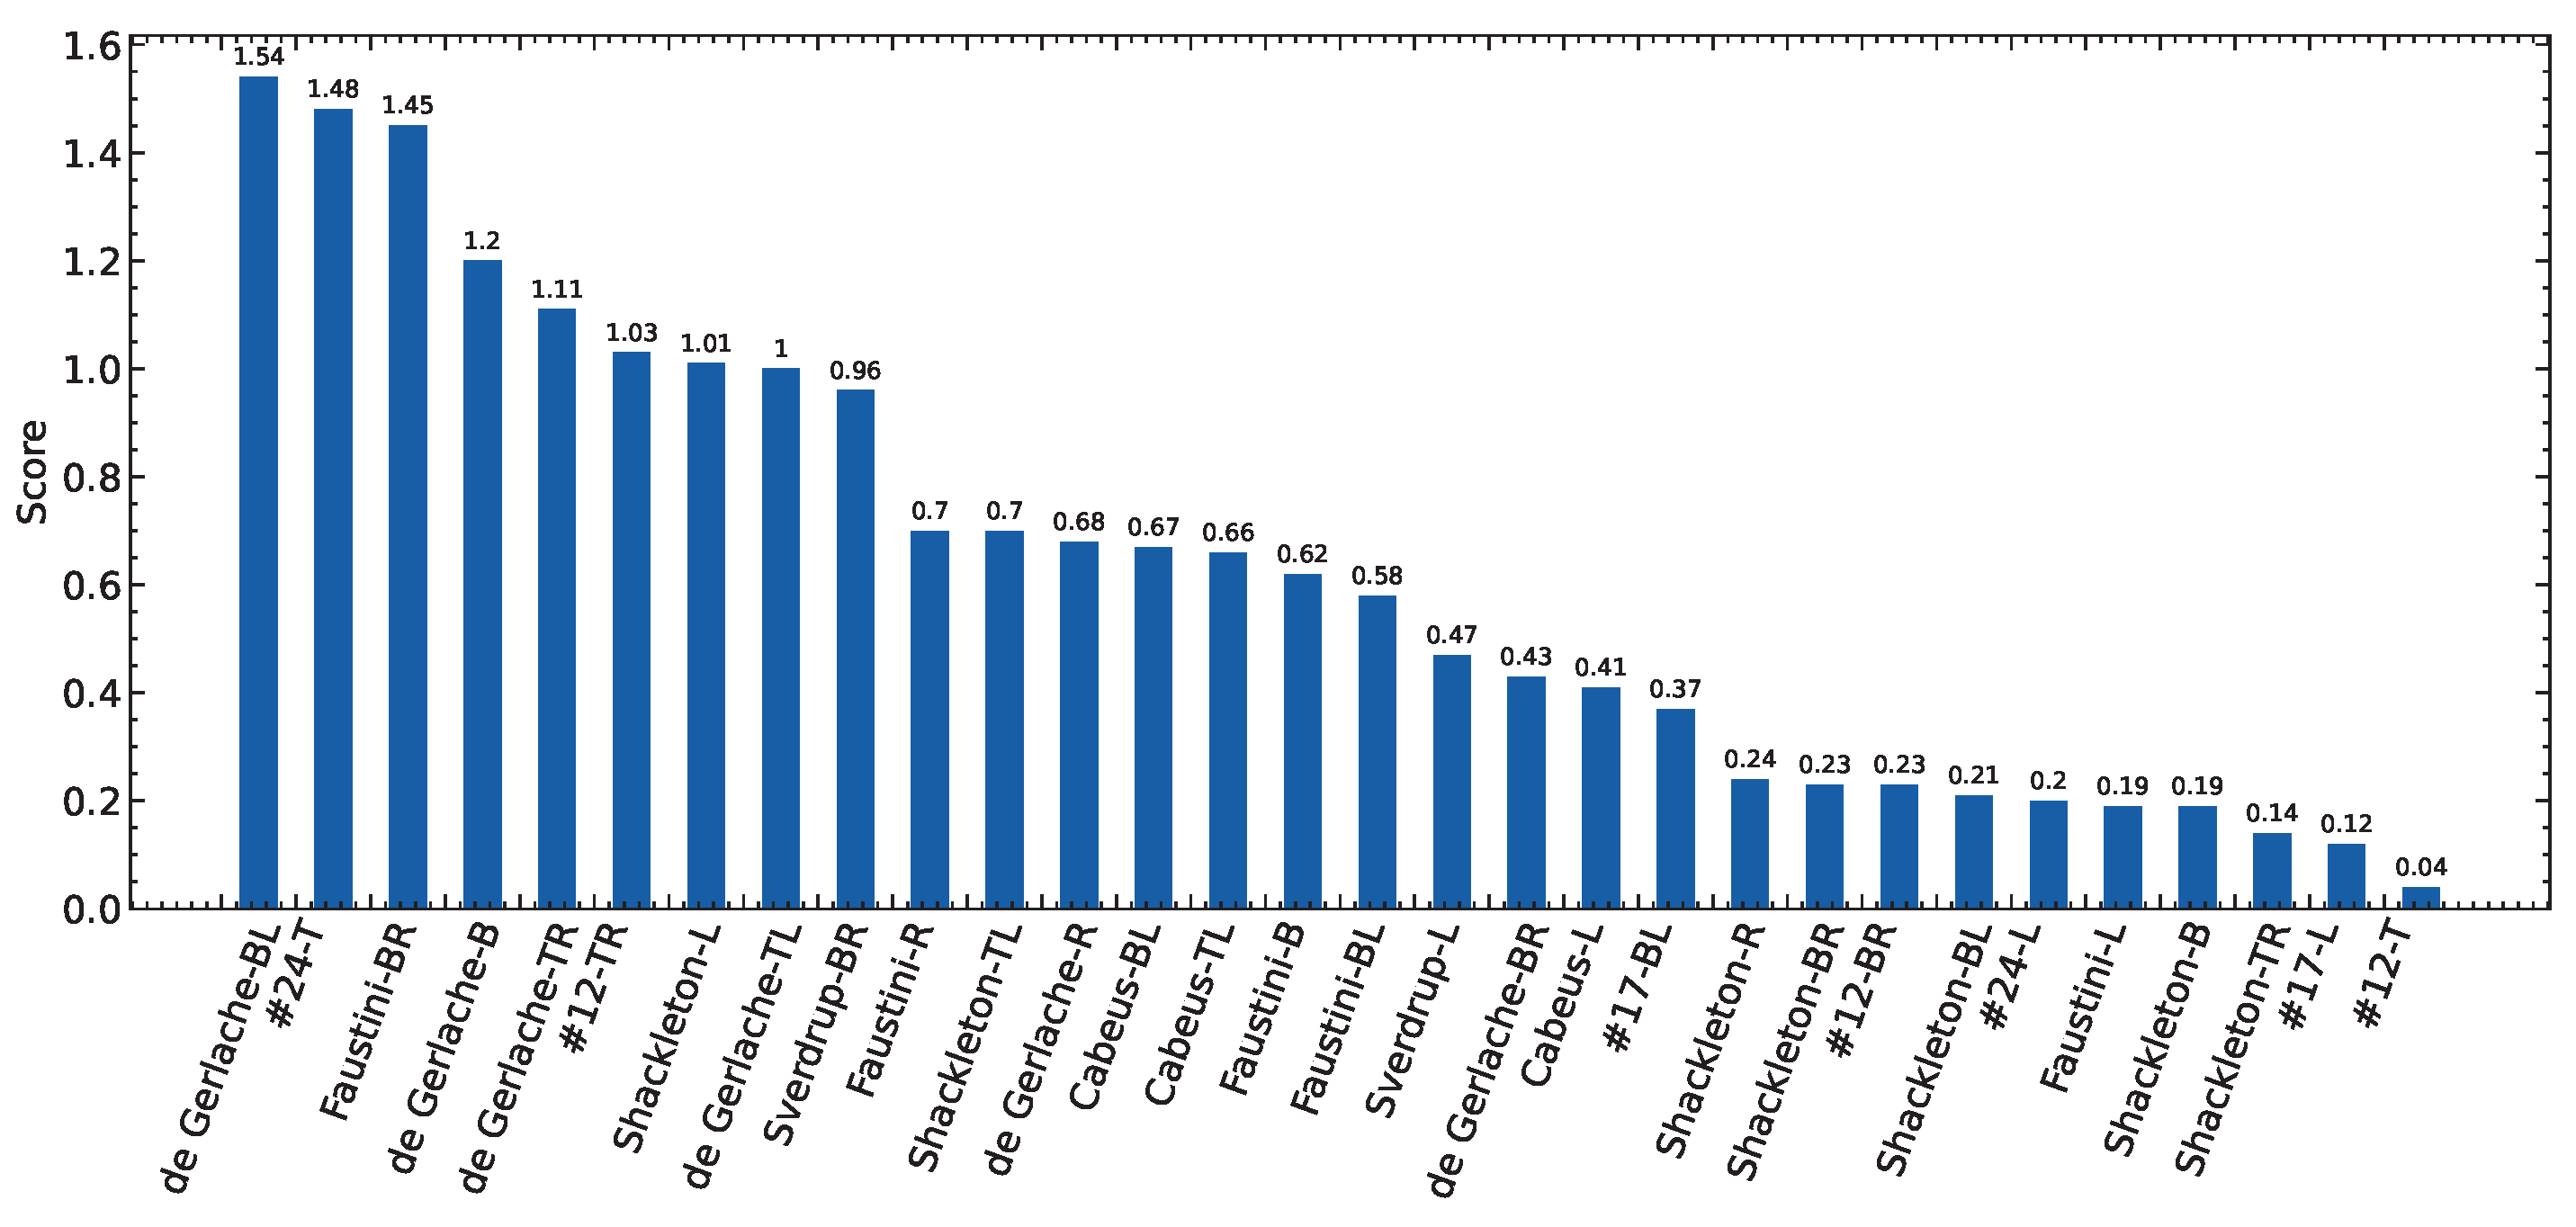
Based on the analysis above, while the number of landing cells and the illumination levels of these cells vary across the landing regions, the slopes generally meet the engineering requirements of the CE-7 mission. Additionally, the topographic analysis of the flight routes does not undermine the suitability of the potential landing regions. Hence, we rank the landing regions using a score calculated as Equation (3), to help prioritize the selection of optimal landing regions (Figure 11).
The complete ranked list of all 30 feasible landing regions is provided in Supplementary Table S3. The top eight landing regions are de Gerlache-BL, #24-T, Faustini-BR, de Gerlache-B, de Gerlache-TR, #12-TR, Shackleton-L, and de Gerlache-TL. When ranked by the number of landing cells and the 95th percentile illumination, all regions remain in the top eight, except for #12-TR, which drops to ninth place. These eight optimal landing regions will be further characterized and analyzed in the next subsection.

4.3. Detailed Characterization of Selected Landing Regions

This subsection presents a detailed analysis of the illumination conditions, distribution of small craters, and rocky areas in the eight selected landing regions, aiming to identify the optimal landing site within each of them.

4.3.1. High-Resolution Illumination Variation

The illumination conditions in the lunar south polar region vary both daily and seasonally due to changes in the Sun’s position. Figure 12 illustrates the variation in solar elevation angles at the south pole from October 2026 to October 2034. It is shown that the lunar south pole’s summer solstice in 2026 will occur in November. Therefore, if the CE-7 mission proceeds as scheduled, the optimal landing period would be November 2026.
We simulated the average illumination for the eight selected landing regions over an eight-year period, spanning from October 2026 to October 2034, using a simulation time step of one hour. This time step approximates the Sun’s angular diameter of 0.53°. For the simulations of LCIP and LCSP, we concentrated on the period from October 2026 to October 2027. This timeframe was specifically chosen to accurately capture the dynamics of the day–night cycle during the critical phase surrounding the landing.
The high-resolution maps of illumination characteristics (average illumination, LCIP, and LCSP) for the eight selected landing regions are shown in Figure 13 and Supplementary Figure S4. It can be observed that areas with illumination ≥ 60% are very limited at this scale. The high LCIP pixels are primarily concentrated along the rim crests of large craters, but with few exceeding 30 days. The interior regions of both small and large craters generally exhibit high LCSP values, indicating extended periods of shadow (>30 days).
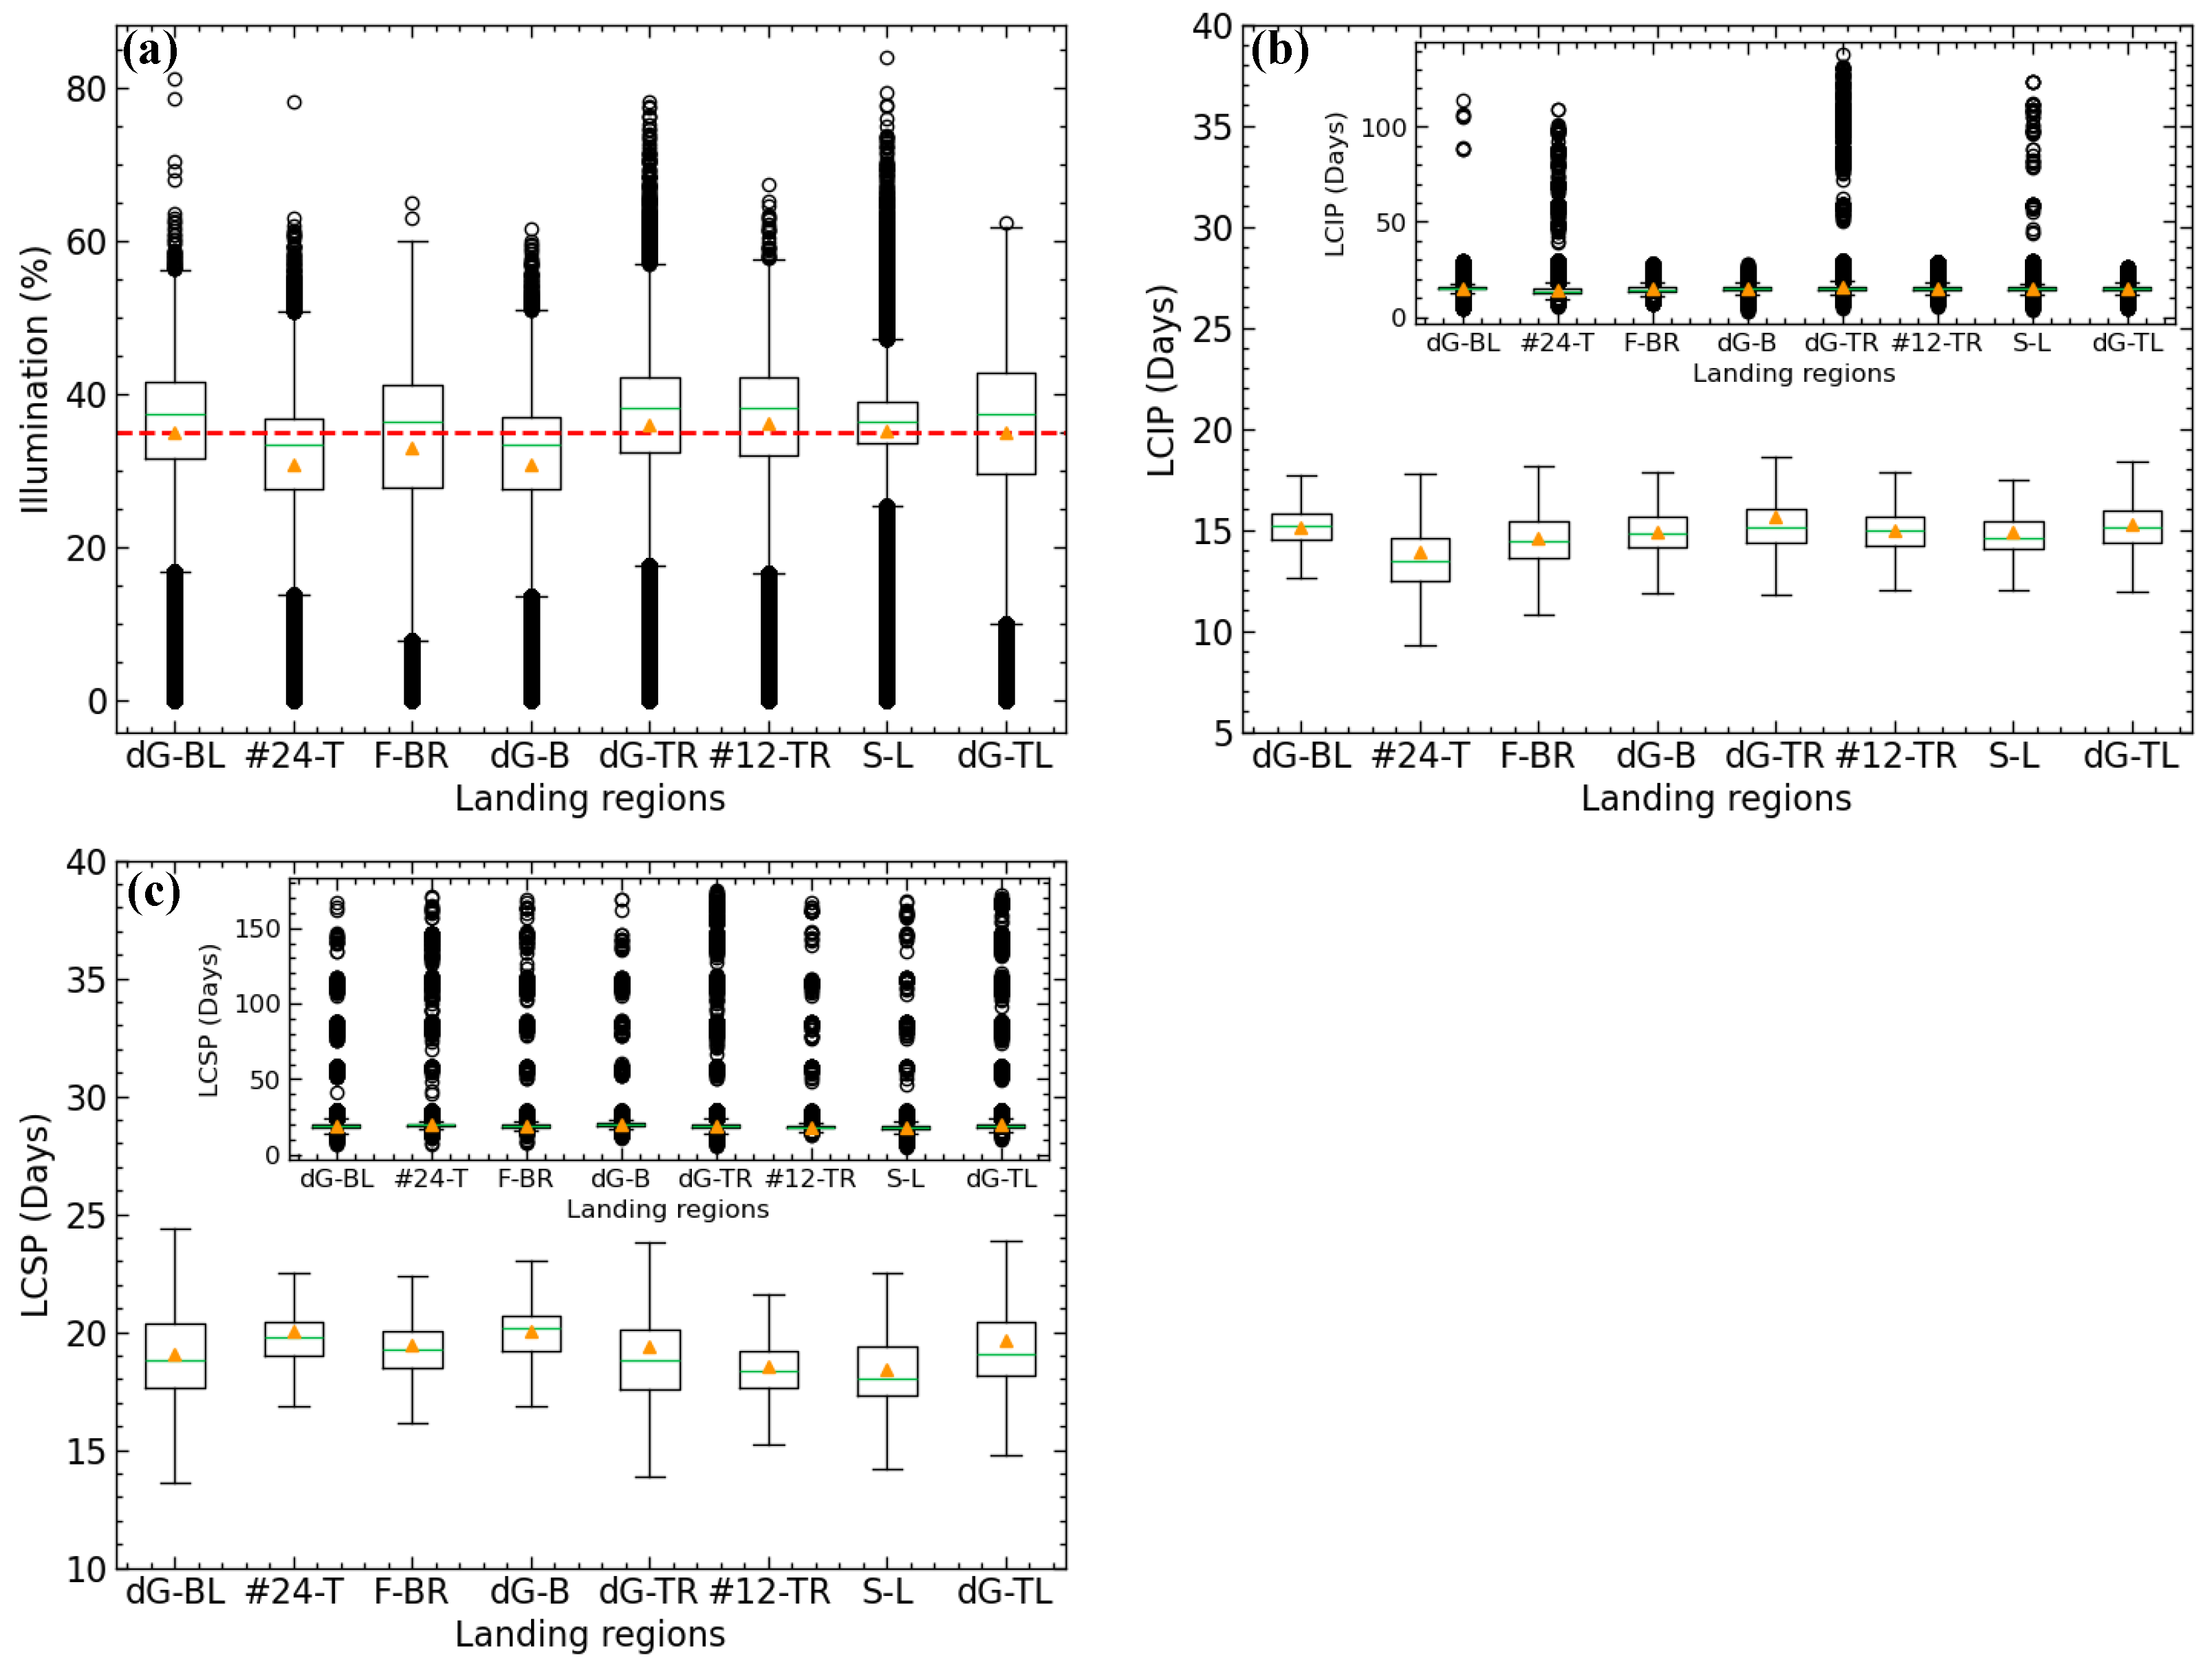
The statistics of the high-resolution illumination characteristics for the eight selected landing regions are shown in Figure 14 and summarized in Supplementary Table S4. Except for #24-T and de Gerlache-B, the majority of pixels in the other landing regions have illumination values exceeding 35%. Both the mean and median illumination for #24-T and de Gerlache-B are below 35%, which generally do not meet the solar energy requirements. The well-illuminated areas in these selected landing regions generally have illumination values exceeding 45% (the 95th percentile, Supplementary Table S4). As we will show later, if the landing region is confined to the optimal landing cell (site), such high illumination becomes more easily achievable.
The LCIP and LCSP for these eight regions are around 15 days and 20 days, respectively. The LCIP for #24-T is the shortest (e.g., mean value: 13.9 days) among these regions. Extended periods of continuous illumination (LCIP ≥ 100 days) are found in de Gerlache-BL, #24-T, de Gerlache-TR, #12-TR, and Shackleton-L (Figure 14c), but these points are few. The 95th percentiles of the LCIP for the well-illuminated pixels in these landing regions do not exceed 19 days (Supplementary Table S4). The mean LCSP values for these landing regions are generally around 19 days, with #24-T and de Gerlache-B having the longest at 20 days. The typical extended shadow periods are around 22 days (95th percentile of LCSP, Supplementary Table S4).
In summary, the high-resolution illumination characteristics indicate that landing regions #24-T and de Gerlache-B exhibit overall weak illumination and will not be considered further in the following sections. Areas with illumination ≥ 60% in the selected landing regions are minimal, but continuous areas with illumination ≥ 45% can be expected. When considering the one year following the CE-7 landing, the extended continuous illumination period is typically no longer than 19 days, while the continuous shadow period can be as long as 22 days, even in regions with relatively good illumination.

4.3.2. Distribution of Small Shadow-Casting Craters

An automated method for detecting small shadow-casting craters was employed, followed by manual verification across 163 landing cells within the six selected regions, encompassing a total area of 163 km2. In total, 69,755 shadow-casting craters were identified in these regions. The diameters of these craters range from 3 m to 500 m, with the majority measuring less than 50 m and most falling between 10 m and 20 m. The cumulative size–frequency distribution (CSFD) of the shadow-casting craters in each selected landing region is presented in Figure 15 and compared with the small crater distributions in the Chang’E-5 (CE-5) and Chang’E-6 (CE-6) landing regions as reported in previous studies. The catalogs of small craters at the CE-5 and CE-6 landing sites are sourced from [97,98].
From Figure 15, it is evident that the number of craters with diameters ≤ 9 m is underestimated. This is due to the intentional exclusion of craters with shadow areas ≤ 9 m2 (3 × 3 pixels), as detecting craters smaller than 10 m using 1 m/pixel NAC images is less reliable. Furthermore, craters smaller than 10 m are less hazardous, as they are shallow and do not significantly cast shadows on the lander. The distribution of craters between 10 m and 20 m is close to equilibrium saturation. The distribution of craters larger than 20 m is not yet saturated. This may indicate that equilibrium has not been reached for this size range, or it could be due to the fact that some craters, degraded to the point of being sufficiently shallow and no longer casting shadows, are not counted. The density of small craters in the selected landing regions for CE-7 falls between that of CE-5 and CE-6 (Figure 15). Therefore, the topographic roughness (i.e., slope) induced by small craters for CE-7 will not differ significantly from that of previous landing missions. However, their impact on illumination should be carefully considered.
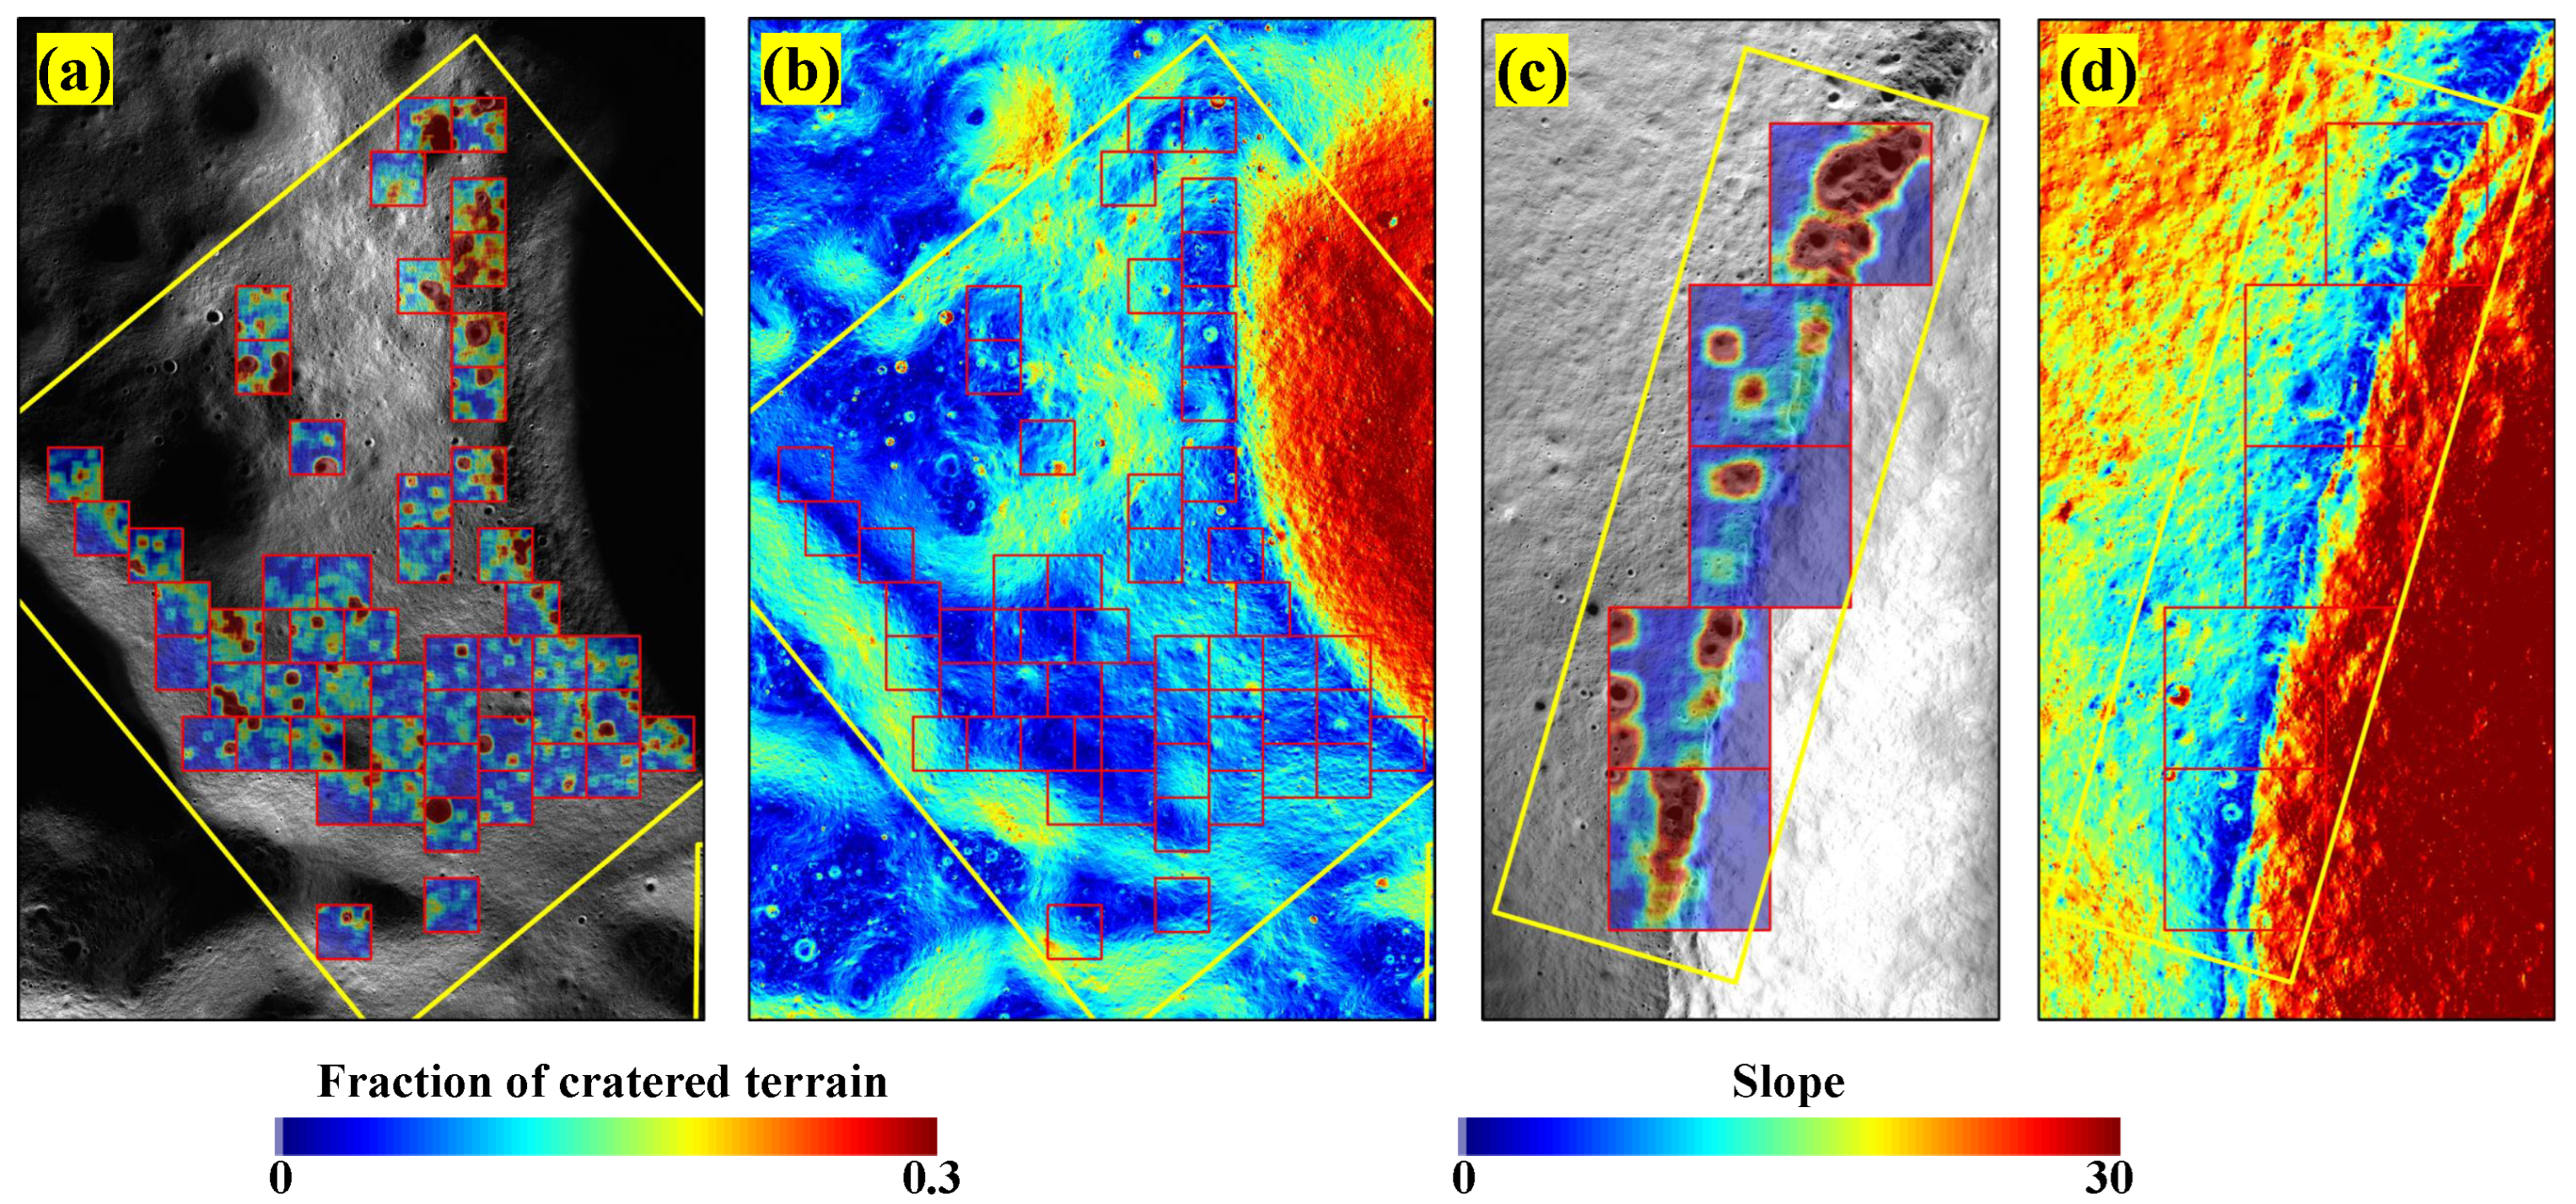
The area fraction of cratered terrain within a 100 m radius window (the assumed landing precision of CE-7), centered at each location, is calculated for the landing cells in each selected landing region (Figure 16 and Figure S5). The fraction of cratered terrain varies across landing cells, with some areas being highly cratered and therefore unsuitable for CE-7 landing (Figure 16). We also found that the density of small craters is negatively correlated with the slope of the topography. The rim crests of large craters (e.g., de Gerlache and Shackleton, Figure 16) feature gentle slopes but exhibit a higher density of small craters compared to the inner walls and outer ejecta blankets. This is because small craters are more likely to be preserved in flatter regions. Consequently, even the flat rim crests can appear rough at the scale of the lander.
The area fraction of cratered terrain within the landing cells ranges from 3.6% to 27.2%. The landing regions with the most cratered terrain are Shackleton-L (16.4%) and de Gerlache-TR (16.2%) (Supplementary Table S4). This cratered terrain experiences poor illumination due to self-shadowing, which is not fully accounted for in the illumination map derived from the DEM. For instance, while Shackleton-L has an average illumination of 35.2%, the presence of cratered terrain reduces the expected average illumination to 29.1% (see Section 3, and Supplementary Table S4). In the following subsection, the fraction of cratered terrain will be integrated with illumination data to identify the optimal landing cells for potential landing sites.

4.3.3. Distribution of Rocky Region

Rocky regions within the selected landing areas were mapped using Mini-RF radar images, leveraging the enhanced volume scattering characteristics of rocks. The threshold G rock for segmenting rocky areas from the green channel of the m-chi decomposition image was experimentally determined to be 200.
The distribution of rocky regions within the selected landing areas and their corresponding radar images are shown in Figure 17 and Supplementary Figure S6. The identified rocky areas were manually verified using high-resolution NAC optical images (Figure 17). It was observed that rocks are typically found around small, fresh craters. Additionally, clusters of rocks were observed in areas without sufficiently large central fresh craters capable of ejecting them. These rocks may have been ejected as boulders from larger impact craters at distant locations and later broken apart here. Furthermore, rock accumulations are also present on steep slopes, likely due to mass wasting.
Figure 18b presents the statistical distribution of the fraction of rocky terrain in landing cells across the selected landing regions. Compared to the fraction of cratered terrain (Figure 18a), the rocky terrain is locally clustered and exhibits an uneven, sparse distribution. Most landing cells have a rocky terrain fraction of no more than 5%, though some cells are highly rocky, with the fraction exceeding 50%. The average fraction of rocky terrain in landing cells for each region is summarized in Supplementary Table S4. It is shown that de Gerlache-TL, de Gerlache-BL, and Faustini-BR have the highest average fractions of rocky terrain, with values of 8.1%, 4.7%, and 4.3%, respectively.
The fraction of rocky terrain across landing cells is highly imbalanced, with most cells having relatively little rocky terrain. Therefore, these fractions will not be used as a score for ranking the optimal landing cells but will instead serve to filter out the very rocky cells using a fixed threshold.

4.3.4. Optimal Landing Site Within the Selected Landing Regions

Based on the results presented above, we exclude landing cells with a rocky terrain fraction of ≥10% and then rank the remaining cells by their expected average illumination (see Section 3: Materials and Methods) to determine the optimal landing cell in each selected landing region. This approach considers both the large-scale terrain-controlled illumination and the presence of small craters. The identified optimal landing cell in each region is proposed as the optimal landing site for CE-7.
Six optimal landing sites were selected from the landing cells within the six landing regions, ranked by their expected average illumination: de Gerlache-BL (32.0%), #12-TR (31.6%), de Gerlache-TR (31.0%), de Gerlache-TL (30.9%), Faustini-BR (30.4%), and Shackleton-L (29.1%).
Figure 19 illustrates the high-resolution illumination distribution of the selected optimal landing sites. The statistical illumination characteristics of these sites are plotted in Figure 20. With the exception of Shackleton-L, both the mean and median illumination of the selected landing sites in the remaining regions are higher than 40% (Figure 20), with over 90% of pixels having illumination greater than 35% (Figure 19). When considering only the selected landing sites, the LCIP and LCSP are primarily concentrated at 15 and 18 days, respectively. The LCSP also exhibits few extreme values at these landing sites, indicating a reduced number of long-shadow points, which is desirable.
Figure 19 also indicates that the highly illuminated points (outlined with black) in the Shackleton-L landing site are often separated by low-illumination areas. These low-illumination areas are caused by the presence of small craters with diameters ranging from 50 to 100 m. In contrast to Shackleton-L, the well-illuminated areas (illumination ≥ 40%) within the landing sites of de Gerlache-BL, Faustini-BR, de Gerlache-TR, #12-TR, and de Gerlache-TL exhibit more uniform and continuous spatial distributions. Notably, the extensive, continuous areas within the landing site in de Gerlache-BL exhibit illumination levels exceeding 45%, thereby enhancing its robustness in accommodating a landing precision on the order of hundreds of meters.
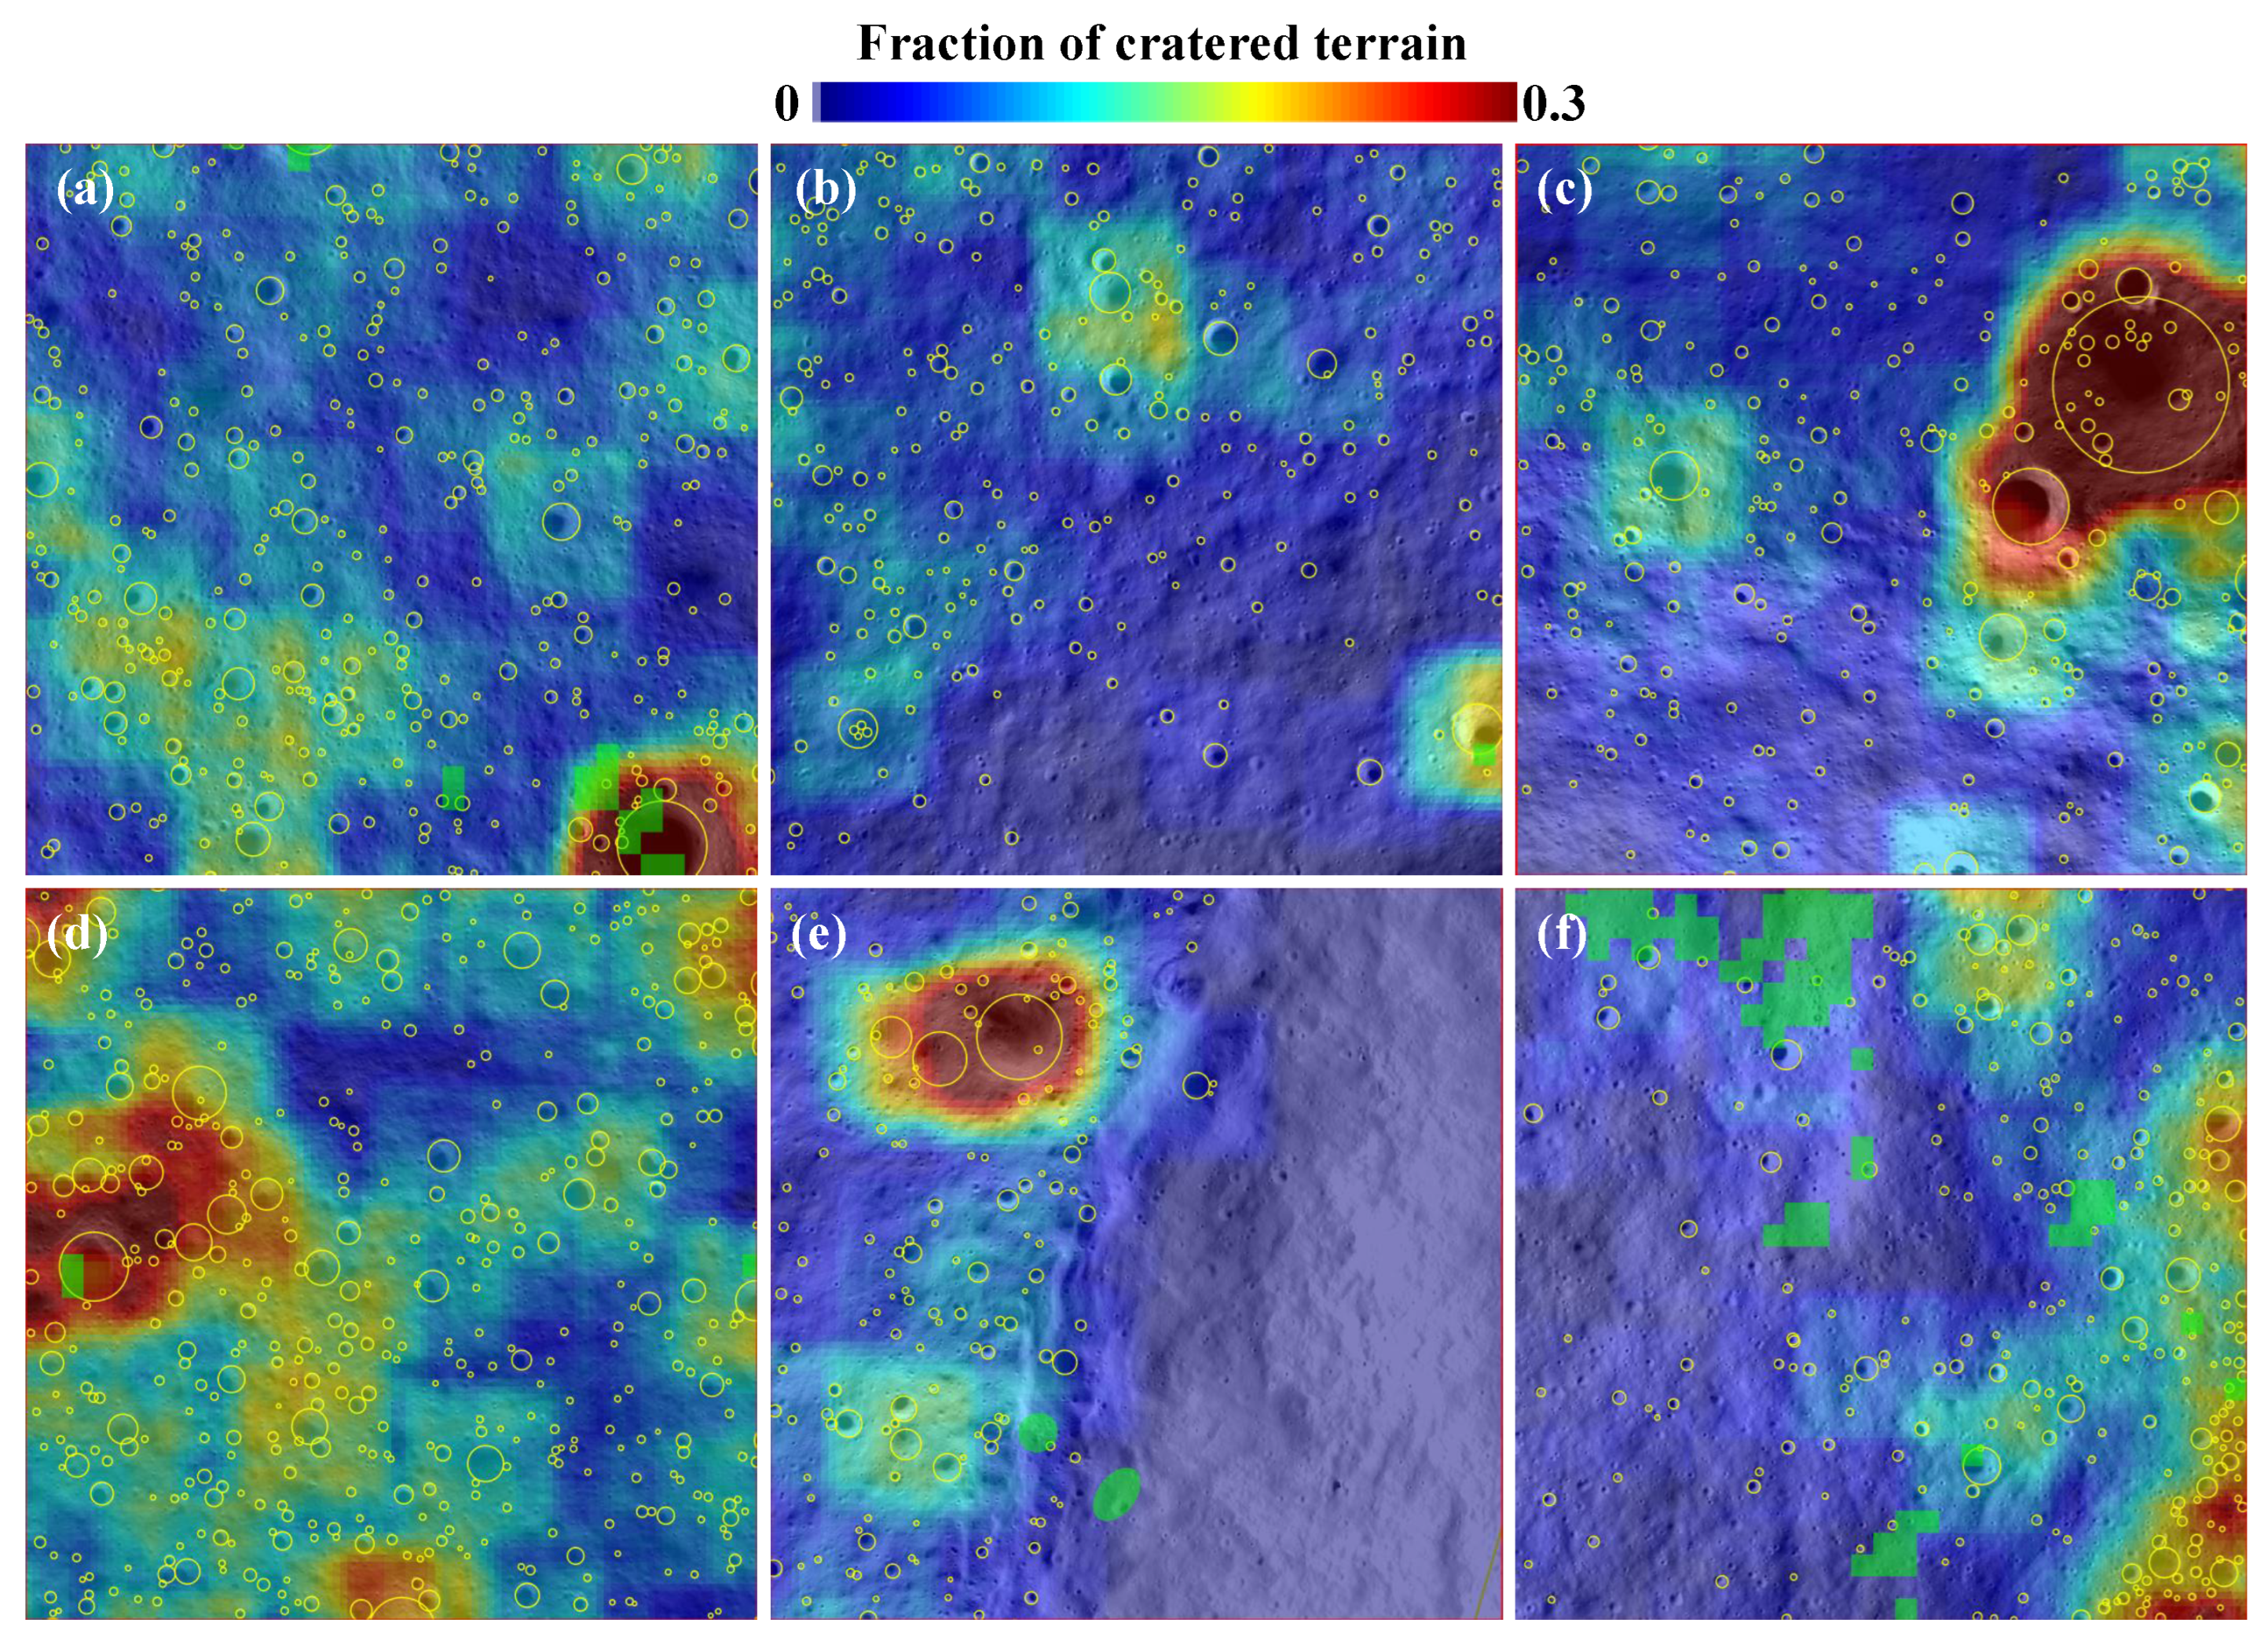
Figure 21 shows the fraction of cratered terrain and the distribution of rocky areas in the selected optimal landing sites. The regions with high fraction of cratered terrain primarily correspond to the presence of large craters, ranging from 100 m to 200 m in diameter. By comparing the fraction of cratered terrain maps (Figure 21) with the slope maps (Figure S7) for the landing sites, it is evident that areas with highly cratered terrain generally feature gentle slopes. However, the average fraction of cratered terrain in these sites does not exceed 15%. Among these landing sites, #12-TR, de Gerlache-TR, and Shackleton-L exhibit the highest fraction of cratered terrain on gentle slopes, at 12.5%, 11.3%, and 10.5%, respectively. This suggests that landing points should be selected in areas with gentle slopes, but small shadow-casting craters within these terrains should be autonomously avoided during the final landing phase using visual navigation.
The rocky areas are sporadically distributed across the selected landing sites, primarily around small, fresh craters. The de Gerlache-TL landing site has the highest concentration of rocky terrain, with clusters of rocks arranged in a linear pattern, likely indicative ejecta from distant large craters. With the exception of de Gerlache-TL, the relatively few rocky areas in the other landing sites do not pose significant challenges for landing.
These six landing sites within the selected regions are optimal in terms of slope, illumination, minimal small-scale hazards (i.e., small craters and rocks), and proximity to cold traps likely containing water ice. The following section will discuss these sites as the recommended landing sites for the CE-7 mission.

5. Discussion

The landing site selection approach proposed in this study considers factors such as proximity to water-ice-bearing cold traps, slope, illumination, and small-scale hazards. First, large-scale optimal landing regions are identified within the lunar south polar area (≥85°S). Then, optimal landing locations within these regions are selected using high-resolution remote sensing data. This two-step selection process ensures that the selected landing sites are distributed within extensive low-risk areas, rather than being isolated points, thereby enhancing the overall robustness and feasibility of the landing mission. The following subsection provides a detailed discussion on how these selected landing sites can be targeted by the CE-7 mission.

5.1. Proposed Landing Sites for the CE-7 Mission

Six landing sites suitable for the CE-7 mission have been identified in this study: de Gerlache-BL, #12-TR, de Gerlache-TR, de Gerlache-TL, Faustini-BR, and Shackleton-L. Each of these landing sites covers an area of 1 km × 1 km, with their central coordinates and other characteristics summarized in Table 1. The distribution of the landing sites is shown in Figure 22, along with landing sites selected in previous studies for the CE-7 mission [32,38], or other missions [11,100,101], for comparison.
Three of the selected landing sites provide access to the de Gerlache cold trap.
de Gerlache-BL: The de Gerlache-BL landing site offers entry to the de Gerlache cold trap from its bottom-left direction (Figure 22). With an average illumination of 44.7% and a median slope of 8.2°, it is the most promising landing site. Additionally, this site is located within an extensive optimal landing region (13 km × 13 km), making it highly robust for the CE-7 landing mission (Figure 22). However, a small elevated mountain crosses the flight route from the de Gerlache-BL landing site to the cold trap. This necessitates the CE-7 mini-flying probe to have a vertical climb capability of 300 m in order to bypass the obstacle and reach the cold trap. The horizontal and vertical distances of the flight route are 8.0 km and 2.5 km, respectively. Alternatively, multiple takeoffs could be used to circumvent the mountain and enter the cold trap. One of the feasible sampling points in the de Gerlache crater is shown in Figure 23a using 2 m/pixel ShadowCam and 30 m/pixel Mini-RF images. The figure illustrates a 1 km × 1 km flat region, free of rocks, surrounding the potential landing point of the mini-flying probe. Compared to the other two landing sites that can access this cold trap, de Gerlache-BL allows access to the deepest part (elevation: 2.2 km) of the cold trap, which is also the coldest portion of de Gerlache (Figure 22). Finally, the de Gerlache-BL landing site provides access to a small cold trap in its bottom-left direction, approximately 7 km away. The route from de Gerlache-BL to the small cold trap is well-illuminated, meaning that the small cold trap can even be explored by the CE-7 rover.
de Gerlache-TR: The de Gerlache-TR landing site is located in the top-right direction of de Gerlache crater. The average illumination and median slope of this site are 41.4% and 11.6°, respectively. Similar to the Shackleton-L landing site, de Gerlache-TR contains highly illuminated points (illumination ≥ 60%, Figure 20a). Compared to Shackleton-L, de Gerlache-TR has a greater number of well-illuminated points with illumination ≥ 50% (Figure 19). Additionally, the poorly illuminated regions in de Gerlache-TR are limited to only a few small craters, rather than extensive areas (Figure 19c). Therefore, if highly illuminated points are prioritized for the landing mission, de Gerlache-TR may be a more favorable landing site than Shackleton-L. No rocky regions have been identified at this site using 1 m/pixel NAC images.
The required horizontal and vertical flight distances from the landing site to the potential sampling site are 9.5 km and 2.5 km, respectively, with little to no ascent required. A potential sampling site for the mini-flying probe is shown in Figure 23c. This site is located on the highly cratered floor of the de Gerlache crater (elevation: 0.8 km), though no rocky regions are visible in the ShadowCam images. Finally, two other potential water-ice-bearing cold traps can be accessed from this landing site, with a horizontal flight distance of up to 15 km (Figure 22). The de Gerlache-TR landing site also partially overlaps with a potential landing region for the Artemis 3 mission.
de Gerlache-TL: The de Gerlache-TL landing site can access the de Gerlache cold trap from its top-left direction. The average illumination at de Gerlache-TL is 42.9%, with nearly all points within the site having illumination levels ≥ 40% (Figure 19f). This high illumination is attributed to the relatively sparse distribution of small craters in the region (Figure 21f), which also makes it one of the least cratered landing sites among those selected. This scarcity of craters is associated with the steep slopes in the top-left portion of the site (ranging from 15° to 30°, Supplementary Figure S7), as this area lies on the wall of a 2.2 km highly degraded crater. As a result, the median slope at this landing site is also relatively high, at 12.3°. Additionally, the top-left portion contains a large rocky area (Figure 21f), likely consisting of ejecta from a large crater located outside the site. However, the right portion of the site remains highly promising for landing.
While the de Gerlache-TL region overlaps with the elevated rim of de Gerlache crater, the optimal landing site lies outside this rim. Therefore, the mini-flying probe will need to have the capability to ascend 400 m to traverse the elevated rim. The horizontal and vertical distances to the sampling point in the cold trap are 6.4 km and 0.8 km, respectively. This makes the de Gerlache-TL landing site the closest to its corresponding sampling point in the cold trap among the six selected sites. This proximity allows the mini-flying probe to complete its mission in the cold trap and then make another flyover to the illuminated region. The assumed sampling target is the shallow portion of the floor of de Gerlache crater (elevation: 0.7 km), with the corresponding sampling site shown in Figure 23b. The sampling site is located on the flat floor materials of the de Gerlache crater, where only a few small craters (20–30 m in diameter) and one rocky area are present in the middle-bottom portion of the sampling site. Finally, two landing sites for CE-7 proposed in previous studies are located very close to de Gerlache-TL, but are positioned at the edges of well-illuminated regions. The de Gerlache-TL landing region also partially overlaps with a potential landing region for the Artemis 3 mission.
#12-TR: The #12-TR landing site is located in the top-right direction of the #12 cold trap (center location: 167.10°E, 88.71°S). The average illumination and median slope of this site are 42.5% and 8.9°, respectively. Compared to the other selected landing sites, #12-TR has the highest fraction of cratered terrain (12.5%) but a relatively small fraction of rocky regions (0.3%). The required horizontal and vertical flight distances from the landing site to the potential sampling site are 11.7 km and 1.6 km, respectively. Figure 23d shows ShadowCam and Mini-RF radar images of the potential sampling site, with a rocky region identifiable in the bottom-left portion of the site from the radar image. The sampling site is not located in the permanently shadowed area of the #12 cold trap. The #12-TR landing site provides access to three additional small cold traps that may contain water ice, with distances ranging from 6 to 8 km. It also partially overlaps with a potential landing region for the Artemis 3 mission (Figure 22).
Faustini-BR: The Faustini-BR landing site provides access to the large Faustini crater from its bottom-right direction. Based on neutron spectrometer and M3 hyperspectral data, the floor of Faustini crater is highly likely to contain water ice. Additionally, a lobate-rimed crater, indicative of the presence of water ice, has been identified on the floor of Faustini using ShadowCam images. The Faustini-BR landing site has an average illumination of 42.1% and a median slope of 9.6°, similarly to those of the #12-TR landing site. Like de Gerlache-BL, Faustini-BR is situated within an extensive, highly favorable landing region. Compared to the other selected landing sites, Faustini-BR has less cratered terrain and fewer rocky regions (Figure 21). Due to the large size of Faustini crater, the mini-flying probe must travel a horizontal distance of 13.9 km and a vertical distance of 3.0 km to reach the crater floor, requiring a 200 m ascent. A potential sampling site for the mini-flying probe is shown in Figure 23e, where a rocky region in the bottom-right portion of the sampling site is visible in both the ShadowCam and Mini-RF images.
Shackleton-L: The Shackleton-L landing site is located on the western rim of Shackleton crater and has been widely discussed as a potential landing site for CE-7 in previous studies. The western rim of Shackleton is well known for its highly illuminated regions. However, we find that while well-illuminated points (e.g., illumination ≥ 50%) do exist, they are limited during the CE-7 mission period. The majority of points in the Shackleton-L landing site have illumination levels below 40% (Figure 19e). The average illumination and median slope of Shackleton-L are 36.4% and 14.8°, respectively. Only the flat regions along the Shackleton rim crest within the landing site are suitable for landing, but these areas are also marked by numerous small hazardous craters (Figure 21e). To reach the floor of the Shackleton crater, the mini-flying probe requires a horizontal flight distance of 7.8 km and a vertical distance of 4.3 km. One potential sampling site on the floor of the Shackleton crater is shown in Figure 23f. Rocks rolling from the crater walls are observed within the sampling site, which may pose a challenge. If water ice exists in the floor of Shackleton, it could be buried by material deposited from the crater walls. Moreover, neutron spectrometer data suggest that the potential for water ice in the Shackleton crater is lower compared to other targeted cold traps. In conclusion, Shackleton-L may not be the best landing site for CE-7 as previously anticipated.

5.2. Implications for the CE-7 Mission

Under the configuration of CE-7, most of the cold traps in the lunar south polar region are accessible. However, high landing precision is required due to the limited area available for safe landings, caused by the harsh south polar environment. Among various factors (e.g., illumination, slope, small craters, and rocks), illumination is the most restrictive factor influencing landing site selection. Previous studies have identified several highly illuminated points suitable for long-duration lunar missions, but these locations require very high landing precision and may not be near cold traps, making them unsuitable for CE-7.
Based on the landing site selection results in this study, the power management systems of both the lander and rover should be designed to accommodate illumination conditions of 45%, with landing precision on the order of hundreds of meters. Higher illumination levels can be achieved if the lander can precisely target the few high-illumination areas (illumination ≥ 50%). For example, landing on the high-illumination points within the Shackleton-L landing site would require a landing precision of approximately 10 m. The duration of daylight and darkness encountered by the lander and rover are expected to be around 15 and 18 days, respectively, similar to conditions at mid- to low latitudes. It should be noted that better illumination could be expected if the height of the lander and rover’s solar panels were taken into account. However, this is not discussed in this study, as the illumination of landing sites has already been assessed based on the entire region rather than on individual points. The elevation uncertainty in this area, combined with landing position uncertainty, makes the consideration of solar panel height less practical in this context.
Feasible landing sites are generally located on the flat rim crests of large craters. However, these flat regions are likely to accumulate more small craters (e.g., with a diameter ≤ 50 m). These small craters can be difficult to identify even with current 5 m/pixel DEM data. They pose a hazard to the landing mission, not only because of their steep walls but also due to their potential to cast shadows that could obscure the lander. Therefore, small craters that cast shadows should be autonomously avoided during the final landing phase using visual navigation.
To approach the floors of the cold traps from the landing sites, the mini-flying probe should be capable of covering horizontal distances between 6.4 and 13.9 km, with vertical descent distances ranging from 0.8 to 4.3 km. In most cases, the mini-flying probe does not require ascent, as a projectile flight path suffices. However, having the capability to ascend 200 to 400 m would be advantageous, as it would allow for landing in more illuminated and expansive areas.
In the process of landing site selection, we only considered whether the landing sites were safe and whether they could access cold traps with a high probability of containing water ice. The potential landing of CE-8 at the lunar south pole, contributing to the basic configuration of the ILRS in conjunction with CE-7, was not specifically addressed in this study. However, the landing sites proposed in this study are generally located in large, safe regions (i.e., flat and well illuminated), making them suitable for CE-8 to land in nearby areas and conduct experiments alongside CE-7.
The finalization of the landing site selection can be complex, as it also involves considerations of the spacecraft’s launch time and mission execution after orbital insertion. For this reason, multiple optimal landing sites are proposed as contingency options for the CE-7 landing. Once CE-7 enters lunar orbit, it deserves to utilize its high-resolution camera and radar to image the landing sites identified in this study, enabling a detailed investigation and final selection of the landing site.

6. Conclusions

CE-7 is planned to land in the lunar south polar region, where a mini-flying probe will be released to fly into the cold trap and detect the water ice. This study presents the CE-7 potential landing site selection process and results, utilizing multi-source remote sensing data. First, the water-ice-bearing potential of all cold traps within 85°S is analyzed and ranked using neutron spectrometer and hyperspectral data. Slope and illumination data are then employed to screen feasible landing sites, which are subsequently aggregated into larger landing regions. The flying routes between each landing site and the corresponding sampling site in the flat regions of the cold traps are also analyzed. Optimal landing sites are further selected from the preselected regions using high-resolution illumination maps, optical, and radar images. This two-step approach ensures that the landing site is not isolated but rather within a broader safe region, making it more robust for landing. Extended illuminated areas (i.e., illumination ≥ 50%) are limited in size and thus require very high landing precision (∼10 m). Therefore, the power management systems for both the lander and the rover should be designed to accommodate illumination conditions of 45%, with landing precision on the order of hundreds of meters. Additionally, the flatness of the landing sites may lead to the accumulation of small shadow-casting craters, which could obscure the lander. These sites should be avoided during the final landing phase.
For the CE-7 landing mission, six potential landing sites have been selected using the method proposed in this study: de Gerlache-BL, #12-TR, de Gerlache-TR, de Gerlache-TL, Faustini-BR, and Shackleton-L. These sites are located around the de Gerlache crater, an unnamed cold trap at (167.10°E, 88.71°S), Faustini crater, and Shackleton crater. In practice, the CE-7 orbiter can also leverage its high-resolution optical camera and SAR payloads onboard to acquire additional high-resolution images around these sites, facilitating a more comprehensive investigation and enabling the finalization of the landing site selection.

Supplementary Materials

The following supporting information can be downloaded at https://www.mdpi.com/article/10.3390/rs17071121/s1. Figure S1: Factors influencing landing site selection; Figure S2: Removal of artifact seeds caused by inconsistencies in the LOLA topography data; Figure S3: Statistical distribution of the areas of seeds within candidate landing cells, weighted by illumination; Figure S4: High-resolution illumination characteristics for six of the eight optimal landing regions: #24-T, Faustini-BR, de Gerlache-B, de Gerlache-TR, #12-TR, and de Gerlache-TL.; Figure S5: Distribution of the area fraction of cratered terrain for the selected landing regions: Faustini-BR, de Gerlache-TR, de Gerlache-TL, and #12-TR; Figure S6: Distribution of rocky areas in the selected landing regions: de Gerlache-BL, de Gerlache-TL, #12-TR, de Gerlache-TR, and Shackleton-L; Figure S7: Distribution of slopes within the selected landing sites; Table S1: Summary of the remote sensing data used in this study; Table S2: List of the 61 potentially water-ice-bearing cold traps within 85°S for CE-7 mission; Table S3: Summary of characteristics of the landing regions; Table S4: Statistics of the high-resolution illumination characteristics, fraction of cratered terrain, and fraction of rocky terrain for the selected landing regions.

Author Contributions

Conceptualization, F.Z., P.L., R.W. and Y.W.; methodology, F.Z.; software, F.Z.; validation, F.Z., P.L., T.M. and Y.D.; investigation, F.Z.; data curation, F.Z. and Z.X.; writing—original draft preparation, F.Z. and P.L.; writing—review and editing, F.Z., P.L., T.M., Y.D., Y.G. and Y.W.; supervision, P.L. and R.W.; funding acquisition, P.L. All authors have read and agreed to the published version of the manuscript.

Funding

This work was financially supported by the National Natural Science Foundation of China (Grant Nos. 62422121, 62495035, and 12303065).

Data Availability Statement

The LOLA DEM data and corresponding illumination data can be downloaded from LOLA PDS Data Node: https://imbrium.mit.edu/ (accessed on 11 September 2024). The LEND neutron spectrometer data and Mini-RF radar images can be downloaded from the Planetary Data System (PDS): https://ode.rsl.wustl.edu/moon/productsearch (accessed on 1 October 2022). WAC and NAC mosaics: https://wms.lroc.asu.edu/lroc/ (accessed on 11 September 2024). ShadowCam: https://data.ser.asu.edu/lunaserv.html (accessed on 2 January 2025). Details about the datasets used in this study can be found in the attached Supplementary Information.

Acknowledgments

The authors would like to acknowledge the LRO LOLA, LROC, and Mini-RF teams for their outstanding work in developing these remarkable remote sensing instruments. The authors would also like to express their gratitude to the NASA PDS Geosciences Node for making these data freely available.

Conflicts of Interest

The authors declare no conflicts of interest.

References

  1. Heiken, G.H.; Vaniman, D.T.; French, B.M. Lunar Sourcebook, a User’s Guide to the Moon; Cambridge University Press: Cambridge, UK, 1991. [Google Scholar]
  2. Watson, K.; Murray, B.; Brown, H. On the possible presence of ice on the Moon. J. Geophys. Res. (1896–1977) 1961, 66, 1598–1600. [Google Scholar] [CrossRef]
  3. Lawrence, D.J. A tale of two poles: Toward understanding the presence, distribution, and origin of volatiles at the polar regions of the Moon and Mercury. J. Geophys. Res. Planets 2017, 122, 21–52. [Google Scholar] [CrossRef]
  4. Zhang, Y.; Zhao, F.; Chang, S.; Liu, M.; Wang, R. An Innovative Synthetic Aperture Radar Design Method for Lunar Water Ice Exploration. Remote Sens. 2022, 14, 2148. [Google Scholar] [CrossRef]
  5. Arnold, J.R. Ice in the lunar polar regions. J. Geophys. Res. Solid Earth 1979, 84, 5659–5668. [Google Scholar] [CrossRef]
  6. Campbell, D.B.; Campbell, B.A.; Carter, L.M.; Margot, J.L.; Stacy, N.J.S. No evidence for thick deposits of ice at the lunar south pole. Nature 2006, 443, 835–837. [Google Scholar] [CrossRef]
  7. Fisher, E.A.; Lucey, P.G.; Lemelin, M.; Greenhagen, B.T.; Siegler, M.A.; Mazarico, E.; Aharonson, O.; Williams, J.P.; Hayne, P.O.; Neumann, G.A.; et al. Evidence for surface water ice in the lunar polar regions using reflectance measurements from the Lunar Orbiter Laser Altimeter and temperature measurements from the Diviner Lunar Radiometer Experiment. Icarus 2017, 292, 74–85. [Google Scholar] [CrossRef]
  8. Hayne, P.O.; Hendrix, A.; Sefton-Nash, E.; Siegler, M.A.; Lucey, P.G.; Retherford, K.D.; Williams, J.P.; Greenhagen, B.T.; Paige, D.A. Evidence for exposed water ice in the Moon’s south polar regions from Lunar Reconnaissance Orbiter ultraviolet albedo and temperature measurements. Icarus 2015, 255, 58–69. [Google Scholar] [CrossRef]
  9. Li, S.; Lucey, P.G.; Milliken, R.E.; Hayne, P.O.; Fisher, E.; Williams, J.P.; Hurley, D.M.; Elphic, R.C. Direct evidence of surface exposed water ice in the lunar polar regions. Proc. Natl. Acad. Sci. USA 2018, 115, 8907. [Google Scholar] [CrossRef]
  10. Sanin, A.B.; Mitrofanov, I.G.; Litvak, M.L.; Malakhov, A.; Boynton, W.V.; Chin, G.; Droege, G.; Evans, L.G.; Garvin, J.; Golovin, D.V.; et al. Testing lunar permanently shadowed regions for water ice: LEND results from LRO. J. Geophys. Res. Planets 2012, 117, E00H26. [Google Scholar] [CrossRef]
  11. Sathyan, S.; Bhatt, M.; Chowdhury, M.; Gläser, P.; Misra, D.; Srivastava, N.; Narendranath, S.; Sajinkumar, K.S.; Bhardwaj, A. Potential landing sites characterization on lunar south pole: De-Gerlache to Shackleton ridge region. Icarus 2024, 412, 115988. [Google Scholar] [CrossRef]
  12. Spudis, P.D.; Bussey, D.B.J.; Baloga, S.M.; Cahill, J.T.S.; Glaze, L.S.; Patterson, G.W.; Raney, R.K.; Thompson, T.W.; Thomson, B.J.; Ustinov, E.A. Evidence for water ice on the Moon: Results for anomalous polar craters from the LRO Mini-RF imaging radar. J. Geophys. Res. Planets 2013, 118, 2016–2029. [Google Scholar] [CrossRef]
  13. Stacy, N.J.S.; Campbell, D.B.; Ford, P.G. Arecibo Radar Mapping of the Lunar Poles: A Search for Ice Deposits. Science 1997, 276, 1527–1530. [Google Scholar] [CrossRef]
  14. Eke, V.R.; Bartram, S.A.; Lane, D.A.; Smith, D.; Teodoro, L.F.A. Lunar polar craters—Icy, rough or just sloping? Icarus 2014, 241, 66–78. [Google Scholar] [CrossRef]
  15. Beyer, R.A.; Colaprete, A.; Shirley, M.; Balaban, E.; Siegler, M.; Camacho-Martinez, J. VIPER Site Selection. In Proceedings of the 53rd Lunar and Planetary Science Conference, Houston, TX, USA, 7–11 March 2022; p. 2479. [Google Scholar]
  16. Bhattacharya, S.; Dagar, A.K.; Pathak, S.; Rajasekhar, R.P.; Naik, S.S.; Kiran Kumar, A.S.; Desai, N.M.; Gupta, S.; Panigrahi, M.K. Characterization of ISRO-JAXA LUPEX Landing Site Near Shackleton-De Gerlache Ridge (SDR) Region Based on Observations from Chandrayaan-2 Imaging InfraRed Spectrometer (IIRS) Instrument. In Proceedings of the 54th Lunar and Planetary Science Conference, Houston, TX, USA, 13–17 March 2023; p. 2098. [Google Scholar]
  17. Wang, C.; Jia, Y.; Xue, C.; Lin, Y.; Liu, J.; Fu, X.; Xu, L.; Huang, Y.; Zhao, Y.; Xu, Y.; et al. Scientific objectives and payload configuration of the Chang’E-7 mission. Natl. Sci. Rev. 2023, 11, nwad329. [Google Scholar] [CrossRef]
  18. De Rosa, D.; Bussey, B.; Cahill, J.T.; Lutz, T.; Crawford, I.A.; Hackwill, T.; van Gasselt, S.; Neukum, G.; Witte, L.; McGovern, A.; et al. Characterisation of potential landing sites for the European Space Agency’s Lunar Lander project. Planet. Space Sci. 2012, 74, 224–246. [Google Scholar] [CrossRef]
  19. Heather, D.J.; Fisackerly, R.K.; Trautner, R.; Barber, S.; Houdou, B.; Boazman, S.; Team, P.S.; Consortium, P.I. The ESA PROSPECT Payload for CP22: Science Activities and Operations Planning. In Proceedings of the 55th Lunar and Planetary Science Conference, Houston, TX, USA, 11–15 March 2024; p. 1085. [Google Scholar]
  20. Hu, T.; Yang, Z.; Li, M.; van der Bogert, C.H.; Kang, Z.; Xu, X.; Hiesinger, H. Possible sites for a Chinese International Lunar Research Station in the Lunar South Polar Region. Planet. Space Sci. 2023, 227, 105623. [Google Scholar] [CrossRef]
  21. Huang, Q.; Liu, S.; Yang, X.; Tong, X. Artemis III pre-selected landing sites engineering suitability analysis with illumination, communication and slope, based on LOLA terrain. In Proceedings of the International Conference on Remote Sensing, Mapping, and Geographic Systems (RSMG 2023), Kaifeng, China, 7–9 July 2023; SPIE: Bellingham, WA, USA, 2023; Volume 12815. [Google Scholar]
  22. Kumari, N.; Bretzfelder, J.M.; Ganesh, I.; Lang, A.; Kring, D.A. Surface Conditions and Resource Accessibility at Potential Artemis Landing Sites 007 and 011. Planet. Sci. J. 2022, 3, 224. [Google Scholar] [CrossRef]
  23. CNSA. Chang’E-7 Mission Payload Opportunity Announcement. Available online: https://www.cnsa.gov.cn/n6758823/n6758838/c6840869/content.html (accessed on 9 September 2024). (In Chinese)
  24. Beyer, R.A.; Alexandrov, O.; Balaban, E.; Colaprete, A.; Shirley, M.; Martinez-Camacho, J.; Siegler, M. VIPER Geospatial Data for Site Selection and Traverse Planning. In Proceedings of the 54th Lunar and Planetary Science Conference, Houston, TX, USA, 13–17 March 2023; p. 2377. [Google Scholar]
  25. Blewett, D.T.; Meyer, H.M.; Kinczyk, M.J.; Halekas, J.; Ho, G.C.; Greenhagen, B.T.; Denevi, B.W.; Klima, R.L.; Cahill, J.T.S.; Anderson, B.J.; et al. Selection and Characterization of the Landing Site for NASA CLPS PRISM1 Lunar Lander Mission CP-11. In Proceedings of the 54th Lunar and Planetary Science Conference, Houston, TX, USA, 13–17 March 2023; p. 1780. [Google Scholar]
  26. Boazman, S.J.; Heather, D.; Inoue, H.; Ohtake, M. Mapping Potential Hazards and Identifying Sampling Points within Lunar South Polar Region Areas of Interest. Planet. Sci. J. 2024, 5, 279. [Google Scholar] [CrossRef]
  27. Boazman, S.J.; Shah, J.; Harish; Gawronska, A.J.; Halim, S.H.; Satyakumar, A.V.; Gilmour, C.M.; Bickel, V.T.; Barrett, N.; Kring, D.A. The Distribution and Accessibility of Geologic Targets near the Lunar South Pole and Candidate Artemis Landing Sites. Planet. Sci. J. 2022, 3, 275. [Google Scholar] [CrossRef]
  28. Cannon, K.M.; Britt, D.T. Accessibility Data Set for Large Permanent Cold Traps at the Lunar Poles. Earth Space Sci. 2020, 7, e2020EA001291. [Google Scholar] [CrossRef]
  29. Cao, Y.; Wang, Y.; Liu, J.; Zeng, X.; Wang, J. Selection of Whole-Moon Landing Zones Based on Weights of Evidence and Fractals. Remote Sens. 2022, 14, 4623. [Google Scholar] [CrossRef]
  30. Feng, Y.; Li, H.; Tong, X.; Li, P.; Wang, R.; Chen, S.; Xi, M.; Sun, J.; Wang, Y.; He, H.; et al. Optimized Landing Site Selection at the Lunar South Pole: A Convolutional Neural Network Approach. IEEE J. Sel. Top. Appl. Earth Obs. Remote Sens. 2024, 17, 10998–11015. [Google Scholar] [CrossRef]
  31. Ivanov, M.A.; Hiesinger, H.; Abdrakhimov, A.M.; Basilevsky, A.T.; Head, J.W.; Pasckert, J.H.; Bauch, K.; van der Bogert, C.H.; Gläser, P.; Kohanov, A. Landing site selection for Luna-Glob mission in crater Boguslawsky. Planet. Space Sci. 2015, 117, 45–63. [Google Scholar] [CrossRef]
  32. Jia, Y.; Liu, L.; Wang, X.; Guo, N.; Wan, G. Selection of Lunar South Pole Landing Site Based on Constructing and Analyzing Fuzzy Cognitive Maps. Remote Sens. 2022, 14, 4863. [Google Scholar] [CrossRef]
  33. Jia, Y.; Zhang, S.; Liu, B.; Di, K.; Xie, B.; Nan, J.; Zhao, C.; Wan, G. A robust method for large-scale route optimization on lunar surface utilizing a multi-level map model. Chin. J. Aeronaut. 2025, 38, 103388. [Google Scholar] [CrossRef]
  34. Lemelin, M.; Blair, D.M.; Roberts, C.E.; Runyon, K.D.; Nowka, D.; Kring, D.A. High-priority lunar landing sites for in situ and sample return studies of polar volatiles. Planet. Space Sci. 2014, 101, 149–161. [Google Scholar] [CrossRef]
  35. Liu, D.; Gan, H.; Wei, G.; Qiu, Y.; Wan, L.; Li, X. Lunar South Polar Landing Area Selection Constrained by Illumination Conditions and Slopes. J. Deep. Space Explor. 2023, 10, 544–556. [Google Scholar] [CrossRef]
  36. Liu, H.; Wang, Y.; Wen, S.; Liu, J.; Wang, J.; Cao, Y.; Meng, Z.; Zhang, Y. A New Blind Selection Approach for Lunar Landing Zones Based on Engineering Constraints Using Sliding Window. Remote Sens. 2023, 15, 3184. [Google Scholar] [CrossRef]
  37. Liu, J.; Zeng, X.; Li, C.; Ren, X.; Yan, W.; Tan, X.; Zhang, X.; Chen, W.; Zuo, W.; Liu, Y.; et al. Landing Site Selection and Overview of China’s Lunar Landing Missions. Space Sci. Rev. 2020, 217, 6. [Google Scholar] [CrossRef]
  38. Liu, N.; Jin, Y.Q. Selection of a Landing Site in the Permanently Shadowed Portion of Lunar Polar Regions Using DEM and Mini-RF Data. IEEE Geosci. Remote. Sens. Lett. 2022, 19, 4503305. [Google Scholar] [CrossRef]
  39. Peña Asensio, E.; Neira-Acosta, A.S.; Sánchez-Lozano, J.M. Evaluating potential landing sites for the Artemis III mission using a multi-criteria decision making approach. arXiv 2024, arXiv:2406.19863. [Google Scholar]
  40. Rao, W.; Fang, Y.; Peng, S.; Zhang, H.; Sheng, L.; Ma, J. Landing Site Selection Method of Lunar South Pole Region. J. Deep. Space Explor. 2022, 9, 571–578. [Google Scholar] [CrossRef]
  41. Tomka, R.; Boazman, S.; Bradák, B.; Heather, D.J.; Kereszturi, A.; Pal, B.D.; Steinmann, V. Boulder distribution, circular polarization, and optical maturity: A survey of example lunar polar terrains for future landing sites. Adv. Space Res. 2024, 73, 2243–2260. [Google Scholar] [CrossRef]
  42. Wen, S.; Wang, Y.; Gong, Q.; Liu, J.; Kang, X.; Liu, H.; Chen, R.; Zhu, K.; Zhang, S. A New Robust Lunar Landing Selection Method Using the Bayesian Optimization of Extreme Gradient Boosting Model (BO-XGBoost). Remote Sens. 2024, 16, 3632. [Google Scholar] [CrossRef]
  43. Zhang, H.; Du, Y.; Li, F.; Zhang, H.; Ma, J.; Sheng, L.; Wu, K. Proposals for Sites Selection of Soft Landing on Lunar South Polar Region. J. Deep. Space Explor. 2020, 7, 232–240. [Google Scholar] [CrossRef]
  44. Butler, N.; Lee, P. Comparison and Rating of Candidate Artemis 3 Landing Regions on the Basis of South Pole-Aitken Basin Material Sampling and Exposed H2O Ice Investigation. In Proceedings of the 55th Lunar and Planetary Science Conference, Houston, TX, USA, 11–15 March 2024; p. 1403. [Google Scholar]
  45. Liu, N.; Jin, Y.Q. A Statistical Rule of the Stokes Parameters of Pol-SAR for Identifying Flat Surface in PSR. IEEE Geosci. Remote Sens. Lett. 2023, 20, 4002705. [Google Scholar] [CrossRef]
  46. Amitabh, S.; Srinivasan, T.P.; Suresh, K. Potential Landing Sites for Chandrayaan-2 Lander in Southern Hemisphere of Moon. In Proceedings of the 49th Lunar and Planetary Science Conference, Houston, TX, USA, 19–23 March 2018; p. 1975. [Google Scholar]
  47. Bernhardt, H.; Robinson, M.S.; Boyd, A.K. Geomorphic map and science target identification on the Shackleton-de Gerlache ridge. Icarus 2022, 379, 114963. [Google Scholar] [CrossRef]
  48. Kawashima, O.; Morota, T.; Ohtake, M.; Kasahara, S. Size-frequency measurements of meter-sized craters and boulders in the lunar polar regions for landing-site selections of future lunar polar missions. Icarus 2022, 378, 114938. [Google Scholar] [CrossRef]
  49. Wei, G.; Li, X.; Zhang, W.; Tian, Y.; Jiang, S.; Wang, C.; Ma, J. Illumination conditions near the Moon’s south pole: Implication for a concept design of China’s Chang’E-7 lunar polar exploration. Acta Astronaut. 2023, 208, 74–81. [Google Scholar] [CrossRef]
  50. Zhong, Z.; Yan, J.; He, H.; Wen, Q.; Liu, D.; Barriot, J.P. Illumination and regolith temperature at China’s next candidate lunar landing site Shackleton crater. Sci. China Earth Sci. 2023, 66, 417–429. [Google Scholar] [CrossRef]
  51. Yu, H.; Rao, W.; Zhang, Y.; Xing, Z. Mission Analysis and Spacecraft Design of Chang’E-7. J. Deep. Space Explor. 2023, 10, 567–576. [Google Scholar] [CrossRef]
  52. Garrick-Bethell, I.; Zuber, M.T. Elliptical structure of the lunar South Pole-Aitken basin. Icarus 2009, 204, 399–408. [Google Scholar] [CrossRef]
  53. Krasilnikov, S.S.; Ivanov, M.A.; Head, J.W.; Krasilnikov, A.S. Geologic history of the south circumpolar region (SCR) of the Moon. Icarus 2023, 394, 115422. [Google Scholar] [CrossRef]
  54. Hiesinger, H.; van der Bogert, C.H.; Pasckert, J.H.; Schmedemann, N.; Robinson, M.S.; Jolliff, B.; Petro, N. New Crater Size-Frequency Distribution Measurements of the South Pole-Aitken Basin. In Proceedings of the 43rd Lunar and Planetary Science Conference, Houston, TX, USA, 19–23 March 2012; p. 2863. [Google Scholar]
  55. Joy, K.H.; Wang, N.; Snape, J.F.; Goodwin, A.; Pernet-Fisher, J.F.; Whitehouse, M.J.; Liu, Y.; Lin, Y.T.; Darling, J.R.; Tar, P.; et al. Evidence of a 4.33 billion year age for the Moon’s South Pole-Aitken basin. Nat. Astron. 2024, 9, 55–65. [Google Scholar] [CrossRef] [PubMed]
  56. Citron, R.I.; Smith, D.E.; Stewart, S.T.; Hood, L.L.; Zuber, M.T. The South Pole-Aitken Basin: Constraints on Impact Excavation, Melt, and Ejecta. Geophys. Res. Lett. 2024, 51, e2024GL110034. [Google Scholar] [CrossRef]
  57. Krasilnikov, A.S.; Ivanov, M.A.; Krasilnikov, S.S.; Head, J.W. Stratigraphic cross-sections, geologic history, and provenance of material at the candidate landing sites of the Artemis missions. Icarus 2024, 420, 116190. [Google Scholar] [CrossRef]
  58. Cannon, K.M.; Britt, D.T. A geologic model for lunar ice deposits at mining scales. Icarus 2020, 347, 113778. [Google Scholar] [CrossRef]
  59. Deutsch, A.N.; Head, J.W.; Neumann, G.A. Analyzing the ages of south polar craters on the Moon: Implications for the sources and evolution of surface water ice. Icarus 2020, 336, 113455. [Google Scholar] [CrossRef]
  60. Mazarico, E.; Neumann, G.A.; Smith, D.E.; Zuber, M.T.; Torrence, M.H. Illumination conditions of the lunar polar regions using LOLA topography. Icarus 2011, 211, 1066–1081. [Google Scholar] [CrossRef]
  61. Gläser, P.; Scholten, F.; De Rosa, D.; Marco Figuera, R.; Oberst, J.; Mazarico, E.; Neumann, G.A.; Robinson, M.S. Illumination conditions at the lunar south pole using high resolution Digital Terrain Models from LOLA. Icarus 2014, 243, 78–90. [Google Scholar] [CrossRef]
  62. Schörghofer, N.; Rufu, R. Past extent of lunar permanently shadowed areas. Sci. Adv. 2023, 9, eadh4302. [Google Scholar] [CrossRef] [PubMed]
  63. Speyerer, E.J.; Robinson, M.S.; Boyd, A.; Wagner, R.V.; Henriksen, M.R. Exploration of the Lunar South Pole with LROC Data Products. In Proceedings of the Lunar Surface Science Workshop, Virtual, 28–30 April 2020; Volume 2241, p. 5132. [Google Scholar]
  64. Yin, Z.; Liu, N.; Jin, Y.Q. Simulation of the Temperatures in Permanently Shadowed Region of the Crater Shackleton and Implications to In-situ Detection. IEEE J. Sel. Top. Appl. Earth Obs. Remote Sens. 2024, 17, 6739–6746. [Google Scholar] [CrossRef]
  65. Yin, Z.; Liu, N.; Jin, Y.Q. Simulation of the temperatures in the permanently shadowed region of the Moon’s south pole and data validation. Icarus 2024, 411, 115917. [Google Scholar] [CrossRef]
  66. Paige, D.A.; Siegler, M.A.; Zhang, J.A.; Hayne, P.O.; Foote, E.J.; Bennett, K.A.; Vasavada, A.R.; Greenhagen, B.T.; Schofield, J.T.; McCleese, D.J.; et al. Diviner Lunar Radiometer Observations of Cold Traps in the Moon’s South Polar Region. Science 2010, 330, 479–482. [Google Scholar] [CrossRef]
  67. Xu, L.; Zou, Y.L.; Qin, L. Overview of China’s Lunar Exploration Program and Scientific Vision for Future Missions. In Proceedings of the 50th Lunar and Planetary Science Conference, Houston, TX, USA, 18–22 March 2019; p. 2440. [Google Scholar]
  68. Li, X.; Wang, X.; Lu, W.; Guo, M.; Huang, Z.; Zhang, X.; Xu, Z.; Yao, L.; Ruan, J.; Kan, R.; et al. Design for In-Situ Water Ice Analysis in the Lunar Polar Region. J. Deep. Space Explor. 2023, 10, 618–630. [Google Scholar] [CrossRef]
  69. Mahanti, P.; Thompson, T.J.; Robinson, M.S.; Humm, D.C. View Factor-Based Computation of Secondary Illumination Within Lunar Permanently Shadowed Regions. IEEE Geosci. Remote Sens. Lett. 2022, 19, 8027004. [Google Scholar] [CrossRef]
  70. Schorghofer, N.; Williams, J.P. Mapping of Ice Storage Processes on the Moon with Time-dependent Temperatures. Planet. Sci. J. 2020, 1, 54. [Google Scholar] [CrossRef]
  71. Nozette, S.; Lichtenberg, C.L.; Spudis, P.; Bonner, R.; Ort, W.; Malaret, E.; Robinson, M.; Shoemaker, E.M. The Clementine Bistatic Radar Experiment. Science 1996, 274, 1495–1498. [Google Scholar] [CrossRef]
  72. Spudis, P.D.; Bussey, D.B.J.; Baloga, S.M.; Butler, B.J.; Carl, D.; Carter, L.M.; Chakraborty, M.; Elphic, R.C.; Gillis-Davis, J.J.; Goswami, J.N.; et al. Initial results for the north pole of the Moon from Mini-SAR, Chandrayaan-1 mission. Geophys. Res. Lett. 2010, 37, L06204. [Google Scholar] [CrossRef]
  73. Lawrence, D.J.; Peplowski, P.N.; Wilson, J.T.; Elphic, R.C. Global Hydrogen Abundances on the Lunar Surface. J. Geophys. Res. Planets 2022, 127, e2022JE007197. [Google Scholar] [CrossRef]
  74. Sanin, A.B.; Mitrofanov, I.G.; Litvak, M.L.; Bakhtin, B.N.; Bodnarik, J.G.; Boynton, W.V.; Chin, G.; Evans, L.G.; Harshman, K.; Fedosov, F.; et al. Hydrogen distribution in the lunar polar regions. Icarus 2017, 283, 20–30. [Google Scholar] [CrossRef]
  75. Campbell, B.A. High circular polarization ratios in radar scattering from geologic targets. J. Geophys. Res. Planets 2012, 117, E06008. [Google Scholar] [CrossRef]
  76. Fa, W.; Eke, V.R. Unravelling the Mystery of Lunar Anomalous Craters Using Radar and Infrared Observations. J. Geophys. Res. Planets 2018, 123, 2119–2137. [Google Scholar] [CrossRef]
  77. Litvak, M.L.; Mitrofanov, I.G.; Sanin, A.B.; Golovin, D.V.; Malakhov, A.V.; Boynton, W.V.; Droege, G.F.; Harshman, K.; Starr, R.D.; Milikh, G.; et al. LEND neutron data processing for the mapping of the Moon. J. Geophys. Res. Planets 2012, 117, E00H32. [Google Scholar] [CrossRef]
  78. Mitrofanov, I.G.; Sanin, A.B.; Boynton, W.V.; Chin, G.; Garvin, J.B.; Golovin, D.; Evans, L.G.; Harshman, K.; Kozyrev, A.S.; Litvak, M.L.; et al. Hydrogen Mapping of the Lunar South Pole Using the LRO Neutron Detector Experiment LEND. Science 2010, 330, 483–486. [Google Scholar] [CrossRef]
  79. Mitrofanov, I.; Litvak, M.; Sanin, A.; Malakhov, A.; Golovin, D.; Boynton, W.; Droege, G.; Chin, G.; Evans, L.; Harshman, K.; et al. Testing polar spots of water-rich permafrost on the Moon: LEND observations onboard LRO. J. Geophys. Res. Planets 2012, 117, E00H27. [Google Scholar] [CrossRef]
  80. Boynton, W.V.; Droege, G.F.; Mitrofanov, I.G.; McClanahan, T.P.; Sanin, A.B.; Litvak, M.L.; Schaffner, M.; Chin, G.; Evans, L.G.; Garvin, J.B.; et al. High spatial resolution studies of epithermal neutron emission from the lunar poles: Constraints on hydrogen mobility. J. Geophys. Res. Planets 2012, 117, E00H33. [Google Scholar] [CrossRef]
  81. Robinson, M.S.; Brylow, S.M.; Caplinger, M.A.; Carter, L.M.; Clark, M.J.; Denevi, B.W.; Estes, N.M.; Humm, D.C.; Mahanti, P.; Peckham, D.A.; et al. ShadowCam Instrument and Investigation Overview. J. Astron. Space Sci. 2023, 40, 149–171. [Google Scholar] [CrossRef]
  82. Cahill, J.T.S.; Thomson, B.J.; Patterson, G.W.; Bussey, D.B.J.; Neish, C.D.; Lopez, N.R.; Turner, F.S.; Aldridge, T.; McAdam, M.; Meyer, H.M.; et al. The Miniature Radio Frequency instrument’s (Mini-RF) global observations of Earth’s Moon. Icarus 2014, 243, 173–190. [Google Scholar] [CrossRef]
  83. Barker, M.K.; Mazarico, E.; Neumann, G.A.; Smith, D.E.; Zuber, M.T.; Head, J.W. Improved LOLA elevation maps for south pole landing sites: Error estimates and their impact on illumination conditions. Planet. Space Sci. 2021, 203, 105119. [Google Scholar] [CrossRef]
  84. Horn, B.K.P. Hill shading and the reflectance map. Proc. IEEE 1981, 69, 14–47. [Google Scholar] [CrossRef]
  85. Flahaut, J.; Carpenter, J.; Williams, J.P.; Anand, M.; Crawford, I.A.; van Westrenen, W.; Füri, E.; Xiao, L.; Zhao, S. Regions of interest (ROI) for future exploration missions to the lunar South Pole. Planet. Space Sci. 2020, 180, 104750. [Google Scholar] [CrossRef]
  86. Zhang, A.; Lipton, Z.C.; Li, M.; Smola, A.J. Dive into Deep Learning; Cambridge University Press: Cambridge, UK, 2023. [Google Scholar]
  87. Pérez Sanz, L.; Fernández-Shaw González, A.; Pérez-Castán, J.A.; Serrano-Mira, L.; Rodríguez Fernández, D.; Sánchez Ayra, E. Additional Clearance over Obstacles to Determine Minimum Flight Altitude in Mountainous Terrain. Appl. Sci. 2024, 14, 5155. [Google Scholar] [CrossRef]
  88. Williams, J.; Boggs, D.; Folkner, W. DE421 Lunar Orbit, Physical Librations, and Surface Coordinates, JPL IOM 335-JW, DB; Technical Report. WF-20080314-001; JPL: Pasadena, CA, USA, 2008. [Google Scholar]
  89. Rhodes, B. Skyfield: High Precision Research-Grade Positions for Planets and Earth Satellites Generator; Version ascl:1907.024; Astrophysics Source Code Library: Houghton, MI, USA, 2019. [Google Scholar]
  90. Archinal, B.A.; Weller, L.A.; Richie, J.O.; Lee, E.M.; Bennett, K.A.; Speyerer, E.J.; Tyburczy, T. Controlled High-Resolution LROC NAC Polar Mosaics. In Proceedings of the 54th Lunar and Planetary Science Conference, Houston, TX, USA, 13–17 March 2023; p. 2333. [Google Scholar]
  91. Zhao, F.; Gao, Y.; Dang, Y.; Lu, P.; Meng, T.; Yang, T.; Wang, R. Refining Constraints on the Origin of Lunar Irregular Mare Patches via Mini-RF and DFSAR Data Analysis. IEEE J. Sel. Top. Appl. Earth Obs. Remote Sens. 2024, 17, 8213–8229. [Google Scholar] [CrossRef]
  92. Xu, Z.; Zhao, F.; Lu, P.; Gao, Y.; Meng, T.; Dang, Y.; Li, M. Automatic Registration of Mini-Rf S-Band Level-1 Data. In Proceedings of the IGARSS 2024—2024 IEEE International Geoscience and Remote Sensing Symposium, Athens, Greece, 7–12 July 2024; pp. 6142–6145. [Google Scholar] [CrossRef]
  93. Gao, Y.; Zhao, F.; Hou, W.; Han, Y.; Liu, M.; Dang, Y.; Lu, P.; Wang, R. Analysis of Rock Abundance on Lunar Surface and Near-Surface Using Mini-RF SAR Data. IEEE J. Sel. Top. Appl. Earth Obs. Remote Sens. 2023, 16, 9590–9605. [Google Scholar] [CrossRef]
  94. Raney, R.K.; Cahill, J.T.S.; Patterson, G.W.; Bussey, D.B.J. The m-chi decomposition of hybrid dual-polarimetric radar data with application to lunar craters. J. Geophys. Res. Planets 2012, 117, E00H21. [Google Scholar] [CrossRef]
  95. Gonzales, R.C.; Wintz, P. Digital Image Processing; Addison-Wesley Longman Publishing Co., Inc.: Boston, MA, USA, 1987. [Google Scholar]
  96. Colaprete, A.; Schultz, P.; Heldmann, J.; Wooden, D.; Shirley, M.; Ennico, K.; Hermalyn, B.; Marshall, W.; Ricco, A.; Elphic, R.C.; et al. Detection of Water in the LCROSS Ejecta Plume. Science 2010, 330, 463–468. [Google Scholar] [CrossRef]
  97. Yang, C.; Wang, X.; Zhao, D.; Guan, R.; Zhao, H. Accurate Mapping and Evaluation of Small Impact Craters within the Lunar Landing Area. Remote Sens. 2024, 16, 2165. [Google Scholar] [CrossRef]
  98. Su, Y.; Xu, L. Chang’e-6 Nearby Craters Within a 1 km Diameter and the Simulated Craters; Zenodo: Geneva, Switzerland, 2024. [Google Scholar] [CrossRef]
  99. Michael, G.G. Planetary Surface Dating with Craterstats3—A New Open Source Implementation in Python. In Proceedings of the 2021 Annual Meeting of Planetary Geologic Mappers, Virtually, 28 June–2 July 2021; Volume 2610, p. 7010. [Google Scholar]
  100. Lloyd, V.; Johnson, A.; Hambleton, K. NASA Identifies Candidate Regions for Landing Next Americans on Moon. Available online: https://www.nasa.gov/news-release/nasa-identifies-candidate-regions-for-landing-next-americans-on-moon/ (accessed on 27 January 2025).
  101. Taveau, J. NASA Provides Update on Artemis III Moon Landing Regions. Available online: https://www.nasa.gov/news-release/nasa-provides-update-on-artemis-iii-moon-landing-regions/ (accessed on 27 January 2025).
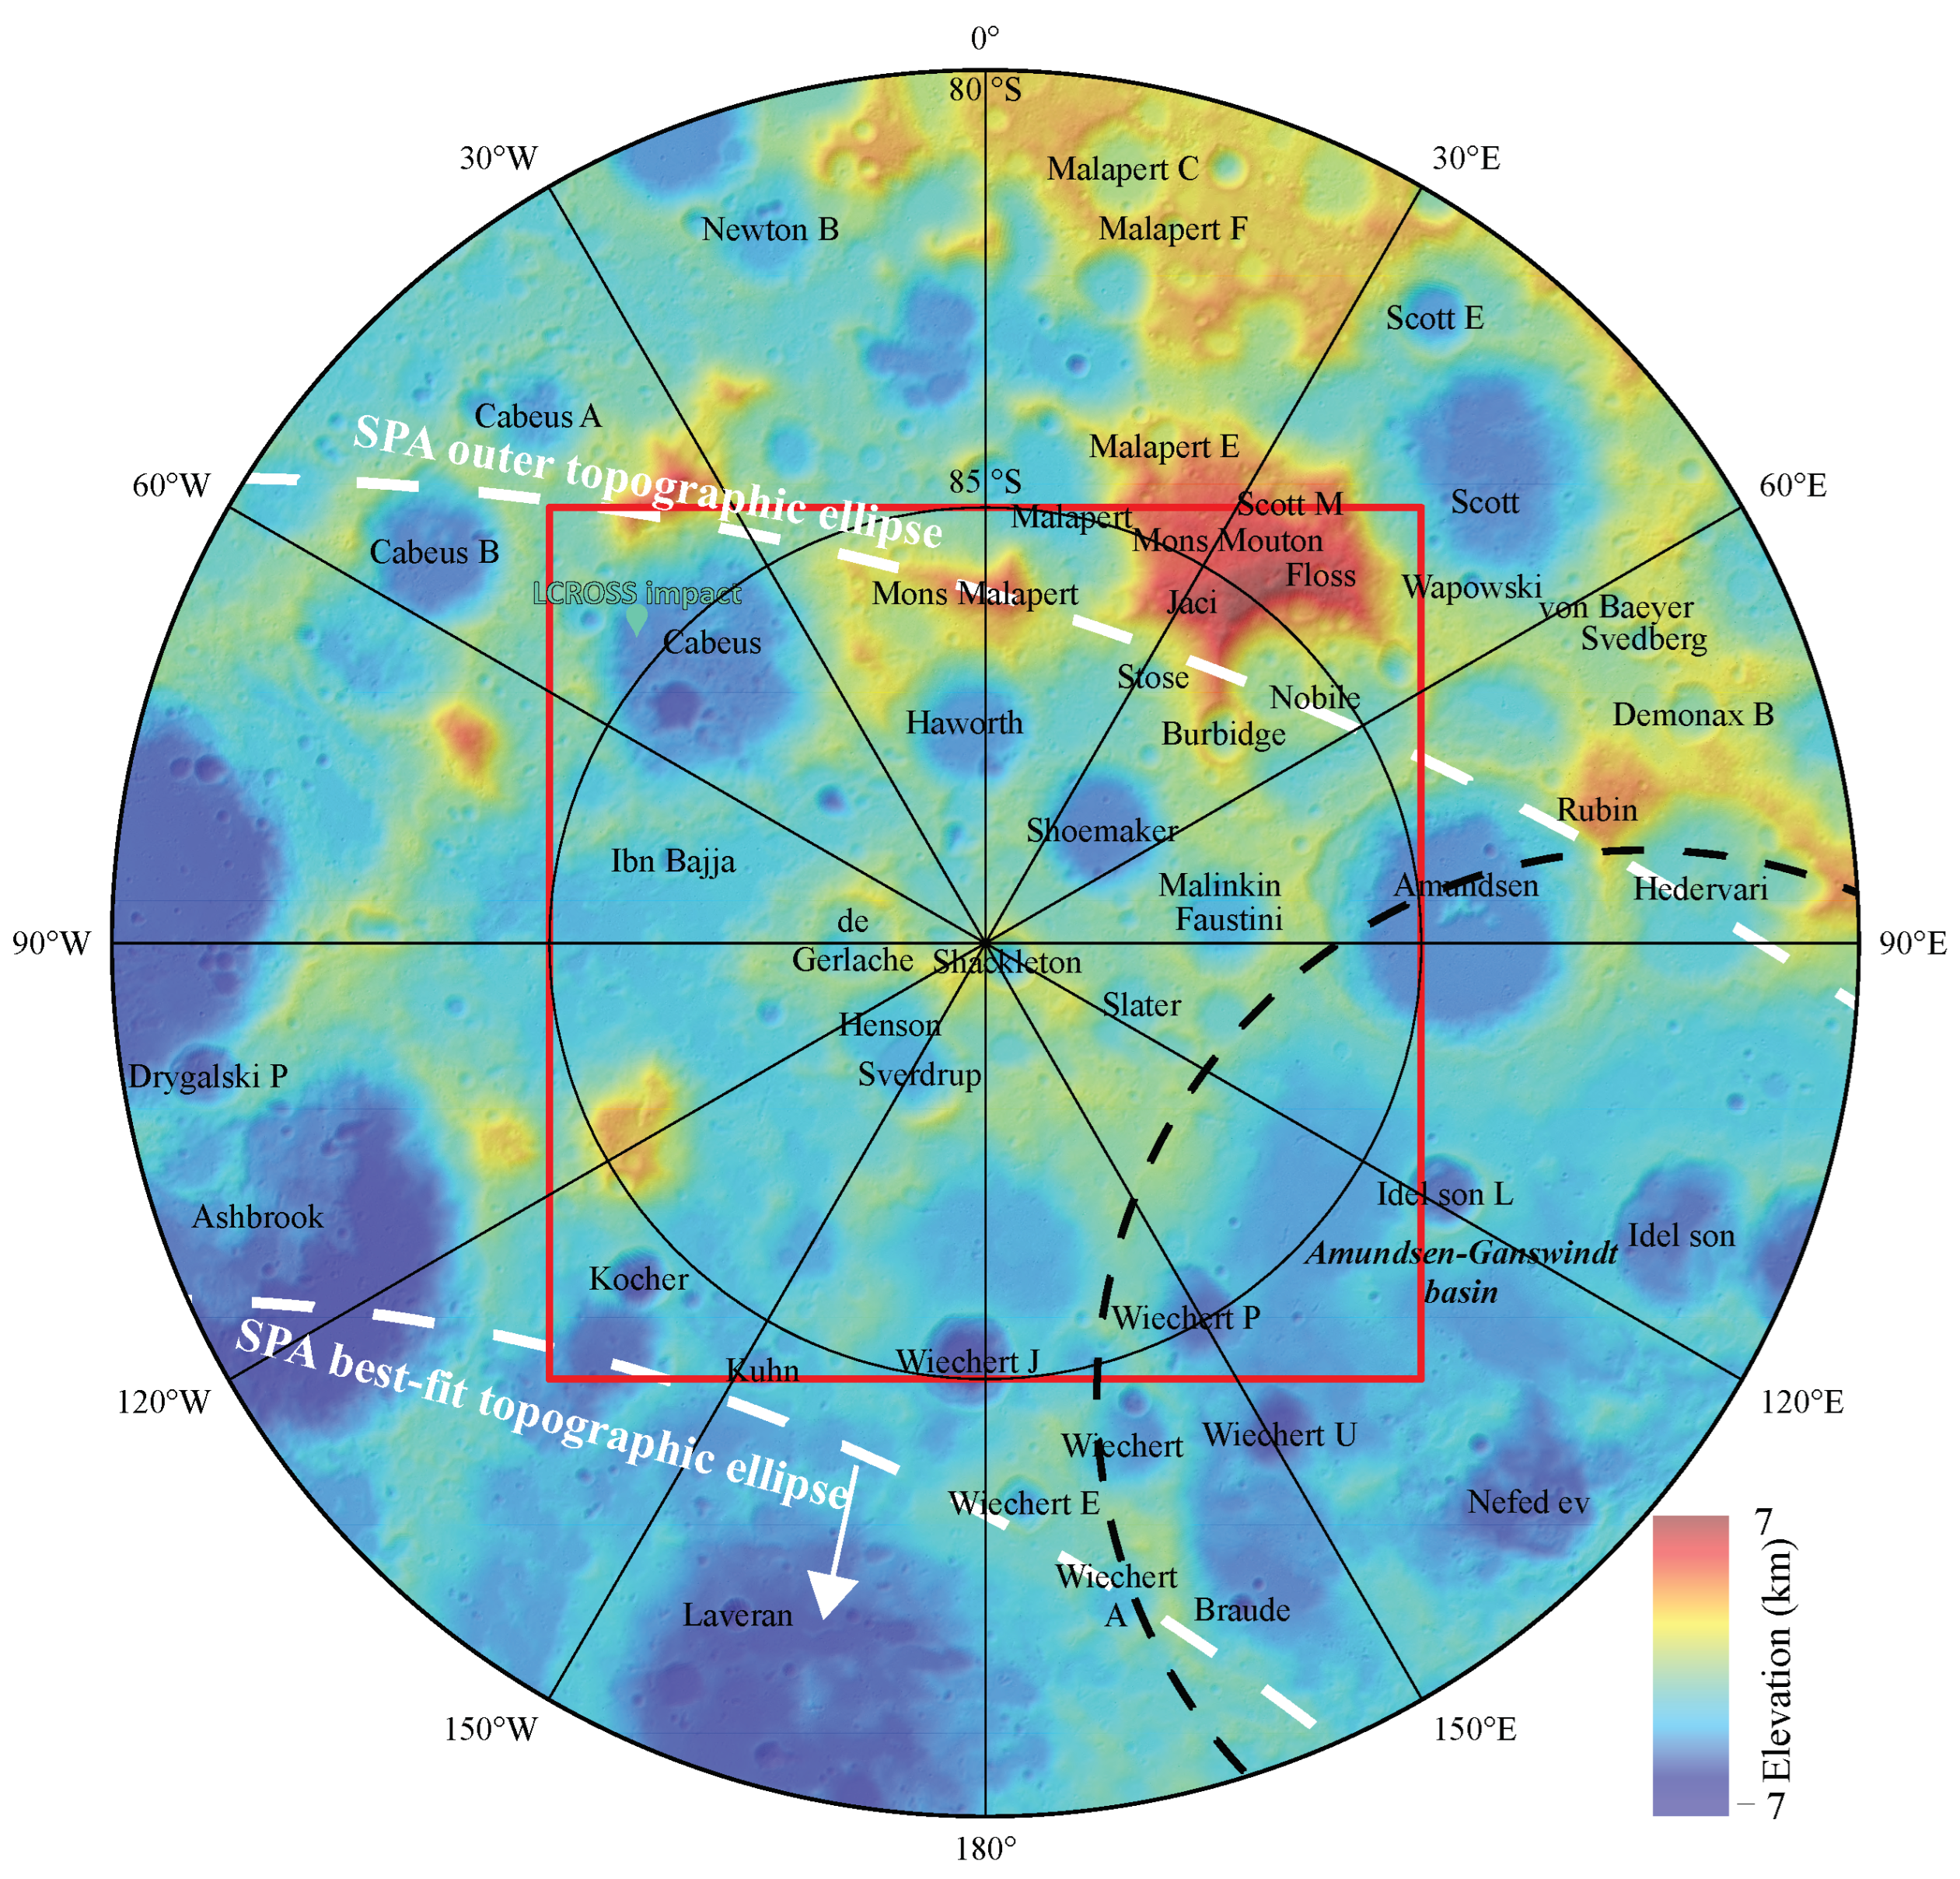
Figure 1. Topographic map of the lunar south pole, with elevation data overlaid on a shaded relief (data source: LOLA 10 m/pixel DEM). The majority of the study area (red box) lies within the broad rim of the South Pole–Aitken (SPA) impact basin, situated between the SPA’s inner best-fit topographic ellipse and the outer topographic ellipse (dashed white lines) [52]. A white arrow indicates the direction of the SPA center. The topography of the study area is also heavily influenced by the continuous ejecta from the Amundsen–Ganswindt basin (black dashed line) [53]. This map is in a south pole stereographic projection, and subsequent maps will also use this projection unless otherwise specified.
Remotesensing 17 01121 g001
Figure 2. Chang’E-7 (CE-7) will land near permanently shadowed regions (PSRs) to confirm the presence of water ice. (a) Distribution of large PSRs (≥5 km2, outlined in red) overlaid on the LRO/WAC 100 m/pixel south polar summer mosaic [63] in the study area; (b) schematic diagram of the CE-7 mission, with the base map derived from the CE-2 CCD 20 m/pixel images (data source: https://moon.bao.ac.cn/ce5web/moonGisMap.search (accessed on 25 September 2024)).
Remotesensing 17 01121 g002
Figure 3. Workflow in selecting landing and sampling sites for the Chang’E-7 mission.
Remotesensing 17 01121 g003
Figure 4. Search and evaluation of flight routes between candidate landing cells and sampling sites within the flat region of the cold trap.
Remotesensing 17 01121 g004
Figure 5. Gaussian-smoothed LEND CSETN epithermal neutron count rate map (counts per second, cps) overlaid on shaded relief (LOLA 10 m/pixel DEM). Water ice detections derived from M3, LOLA, and LAMP data are also shown as cyan points. The 61 large cold traps (≥5 km2) that may contain water ice (i.e., intersecting with PSR and having at least one water ice detection) are outlined with white and black (the 11 selected cold traps most likely to contain water ice) polygons. Cold traps are defined as regions with an average sublimation rate of no more than 100 kg/(m2 Gyr).
Remotesensing 17 01121 g005
Figure 6. Scatter plots illustrating the likelihood of water ice presence in 61 cold traps (refer to the main text for the derivation of these cold traps). The selected 11 optimal cold traps for exploration are highlighted. The x-axis indicates the total count of water ice detections in each cold trap, while the y-axis represents the average epithermal neutron count rate for that cold trap. A cold trap with a higher x-axis value and lower y-axis value indicates a higher likelihood of containing water ice. Each cold trap is labeled with an ID based on its size ranking, and the size of each marker is proportional to the area of the cold trap. Some cold traps are also labeled with the names of their parent craters.
Remotesensing 17 01121 g006
Figure 7. Distribution of candidate landing cells in the lunar south polar region, where 10% of the area within each cell satisfies the conditions of slope ≤ 8° and illumination ≥ 35%.
Remotesensing 17 01121 g007
Figure 8. Distribution of the 30 potential landing regions. Candidate landing cells (red boxes) near selected cold traps (orange outlines) are grouped into landing regions (yellow boxes). Yellow arrows indicate feasible flight routes from each landing region to the flat areas of the cold traps. The base map is a mosaic of Mini-RF radar m-chi decomposition images.
Remotesensing 17 01121 g008
Figure 9. Topographic profiles along feasible routes from various landing regions to the selected cold traps: (a) Faustini; (b) Cabeus; (c) Sverdrup; (d) de Gerlache; (e) #12; (f) #17; (g) #24; and (h) Shackleton. The marker at the end of each profile indicates the descent angle over a 500 m baseline: circle (0–8°), triangle (8–15°), and square (≥15°).
Remotesensing 17 01121 g009
Figure 10. Histogram of (a) elevation differences and (b) descent angles over a 500 m baseline for feasible flight routes to the selected cold traps.
Remotesensing 17 01121 g010
Figure 11. Ranking of the 30 potential landing regions based on scores calculated using Equation (3), with the top eight (score ≥ 1.0) selected as the optimal regions.
Remotesensing 17 01121 g011
Figure 12. The variation in the Sun’s elevation angle at the lunar south pole from October 2026 to October 2034. The optimal landing time for the CE-7 mission is around the summer solstice in November 2026. This plot is derived from the JPL ephemeris DE421.
Remotesensing 17 01121 g012
Figure 13. High-resolution (5 m/pixel) illumination characteristics for optimal landing regions (a) de Gerlache-BL and (b) Shackleton-L. For other six optimal landing regions refer to the Supplementary Figure S4. LCIP and LCSP indicate the longest continuous illuminated and shadowed periods, respectively, during the time frame from 1 October 2026 to 1 October 2027. The optimal landing site (cell) with the highest expected average illumination within each landing region is highlighted with a red box. The red box has dimensions of 1 km × 1 km for size reference.
Remotesensing 17 01121 g013
Figure 14. Boxplot of high-resolution illumination characteristics for the eight selected landing regions. (a) Illumination, averaged over 8 years. (b) The longest continuous illuminated period (LCIP). (c) The longest continuous shadowed period (LCSP) over a 1-year duration. Boxplots for LCIP and LCSP statistics are based on well-illuminated pixels with illumination ≥ 35% [red horizontal line in (a)]. The green line indicates the median, the orange triangle denotes the mean, and the black circle represents extreme values. Abbreviations: dG-BL: de Gerlache-BL; F-BR: Faustini-BR; dG-B: de Gerlache-B; dG-TR: de Gerlache-TR; S-L: Shackleton-L; dG-TL: de Gerlache-TL.
Remotesensing 17 01121 g014
Figure 15. Cumulative size–frequency distribution of shadow-casting craters in landing cells of selected landing regions, compared with the small crater distributions in the Chang’E-5 [97] and Chang’E-6 [98] landing regions. Plotted using the Craterstats software (v3.1.0) [99].
Remotesensing 17 01121 g015
Figure 16. Distribution of the area fraction of cratered terrain within a 100 m radius window and the corresponding slope map (derived from a 5 m/pixel DEM). (a) Area fraction of cratered terrain in de Gerlache-BL. (b) Slope in de Gerlache-BL. (c) Area fraction of cratered terrain in Shackleton-L. (d) Slope in Shackleton-L. The yellow box indicates the boundary of the landing region, while the red boxes represent 1 km × 1 km landing cells. Other selected landing regions are shown in Supplementary Figure S5.
Remotesensing 17 01121 g016
Figure 17. Distribution of rocky areas in the Faustini-BR landing region. (a) Mini-RF m-chi decomposition image. (b) Radar-derived rocky areas (green) overlaid on the NAC image. (c) Examples of identified rocky areas. The yellow box indicates the boundary of the landing region, while the red boxes represent 1 km × 1 km landing cells. Other selected landing regions are shown in Supplementary Figure S6.
Remotesensing 17 01121 g017
Figure 18. Histogram of the area fraction of (a) cratered and (b) rocky terrain within landing cells across the selected landing regions: de Gerlache-BL, Faustini-BR, de Gerlache-TR, #12-TR, Shackleton-L, and de Gerlache-TL.
Remotesensing 17 01121 g018
Figure 19. High-resolution (5 m/pixel, except for Faustini-BR at 10 m/pixel) illumination distribution map of the optimal landing sites in the selected regions: (a) de Gerlache-BL, (b) Faustini-BR, (c) de Gerlache-TR, (d) #12-TR, (e) Shackleton-L, (f) de Gerlache-TL. Pixels with illumination ≥ 50% are outlined in black. Each landing site covers an area of 1 km × 1 km. The center locations of these landing sites can be found in Table 1.
Remotesensing 17 01121 g019
Figure 20. Boxplot of high-resolution illumination characteristics for the six optimal landing sites. (a) Illumination, averaged over 8 years. (b) The longest continuous illuminated period (LCIP) and (c) the longest continuous shadowed period (LCSP) over a 1-year duration. Boxplots for LCIP and LCSP statistics are based on well-illuminated pixels with illumination ≥ 35% [red horizontal line in (a)]. The green line indicates the median, the orange triangle denotes the mean, and the black circle represents extreme values. Abbreviations: dG-BL: de Gerlache-BL; F-BR: Faustini-BR; dG-B: de Gerlache-B; dG-TR: de Gerlache-TR; S-L: Shackleton-L; dG-TL: de Gerlache-TL.
Remotesensing 17 01121 g020
Figure 21. Fraction of cratered terrain and distribution of rocky areas (green patches) overlaid on 1m/pixel NAC images in the optimal landing sites across the selected regions: (a) de Gerlache-BL, (b) Faustini-BR, (c) de Gerlache-TR, (d) #12-TR, (e) Shackleton-L, (f) de Gerlache-TL. Each landing site covers an area of 1 km × 1 km. The yellow circles indicate the identified small craters. The center locations of these landing sites can be found in Table 1.
Remotesensing 17 01121 g021
Figure 22. Distribution of the six selected optimal landing sites and corresponding potential sampling points for the CE-7 mission. Landing sites selected for CE-7 or other missions in previous studies [32,38] are also shown for comparison. The cold traps are shown with their mean temperature distribution. The “dG-S ridge” refers to the de Gerlache–Shackleton connecting ridge.
Remotesensing 17 01121 g022
Figure 23. Sampling sites for the CE-7 mini-flying probe from different landing sites: (a) de Gerlache-BL; (b) de Gerlache-TL; (c) de Gerlache-TR; (d) #12-TR; (e) Faustini-BR; (f) Shackleton-L. The panchromatic images are from ShadowCam, and the RGB images are Mini-RF m-chi decomposition images. Note that there is no high-quality radar imagery covering the sampling sites for de Gerlache-TR and Shackleton-L. The red triangle denotes the center location of the sampling sites, listed as follows: (95.626°W, 88.195°S), (78.124°W, 88.195°S), (78.357°W, 88.411°S), (152.934°E, 88.652°S), (88.274°E, 86.978°S), (133.568°E, 89.748°S). The red line represents the flight route projected onto the horizontal plane. Each sampling site covers an area of 1 km × 1 km.
Remotesensing 17 01121 g023
Table 1. Optimal landing sites for the CE-7 mission. These six landing sites are ranked based on their expected average illumination (Equation (6)). Each landing site covers an area of 1 km × 1 km and is specified by its central longitude and latitude coordinates.
Landing SiteLon. (°)Lat. (°)Med. Slope (°)Avg. Illum. (%)Cratered Fraction (%)Rocky Fraction (%)Topography Along Flight PathRemarks
d (km) h diff (km) Δ h min (m)
de Gerlache-BL−96.714−87.9358.244.79.01.38.02.5−314Pros: Highest average illumination; Located within an extensive well-illuminated region.
Cons: Requires 300 m vertical climb for the mini-flying probe.
#12-TR136.648−88.7848.942.512.50.311.71.60Pros: Provides access to multiple cold traps.
Cons: Contains many hazardous small craters.
de Gerlache-TR−68.066−88.57211.641.411.30.09.52.50Pros: Contains points with illumination ≥ 60%; Provides access to multiple cold traps.
Cons: Presence of several small craters with very poor illumination.
de Gerlache-TL−75.496−88.00112.342.95.86.26.40.8−384Pros: Few areas with very low illumination; Shortest flight distance.
Cons: Requires 400 m vertical climb for the mini-flying probe.
Faustini-BR91.548−86.5609.642.15.10.113.93.0−192Pros: Located within an extensive well-illuminated region; Targeted cold trap most likely contains water ice.
Cons: Requires 200 m vertical climb for the mini-flying probe; Longest flight distance.
Shackleton-L−153.223−89.84014.836.410.50.67.84.30Pros: Contains points with illumination ≥ 60%.
Cons: Extensive areas with poor illumination; Safe landing zones are limited due to small craters and steep topography.
Note: d, hdiff and Δhmin represent the horizontal distance, the vertical elevation difference between the landing site and sampling site, and the minimum terrain clearance under a projectile flight path, respectively.
Disclaimer/Publisher’s Note: The statements, opinions and data contained in all publications are solely those of the individual author(s) and contributor(s) and not of MDPI and/or the editor(s). MDPI and/or the editor(s) disclaim responsibility for any injury to people or property resulting from any ideas, methods, instructions or products referred to in the content.