
GDP Estimation by Integrating Qimingxing-1 Nighttime Light, Street-View Imagery, and Points of Interest: An Empirical Study in Dongguan City


Abstract
1. Introduction
2. Study Area and Data
2.1. Study Area
2.2. Data
2.2.1. GDP
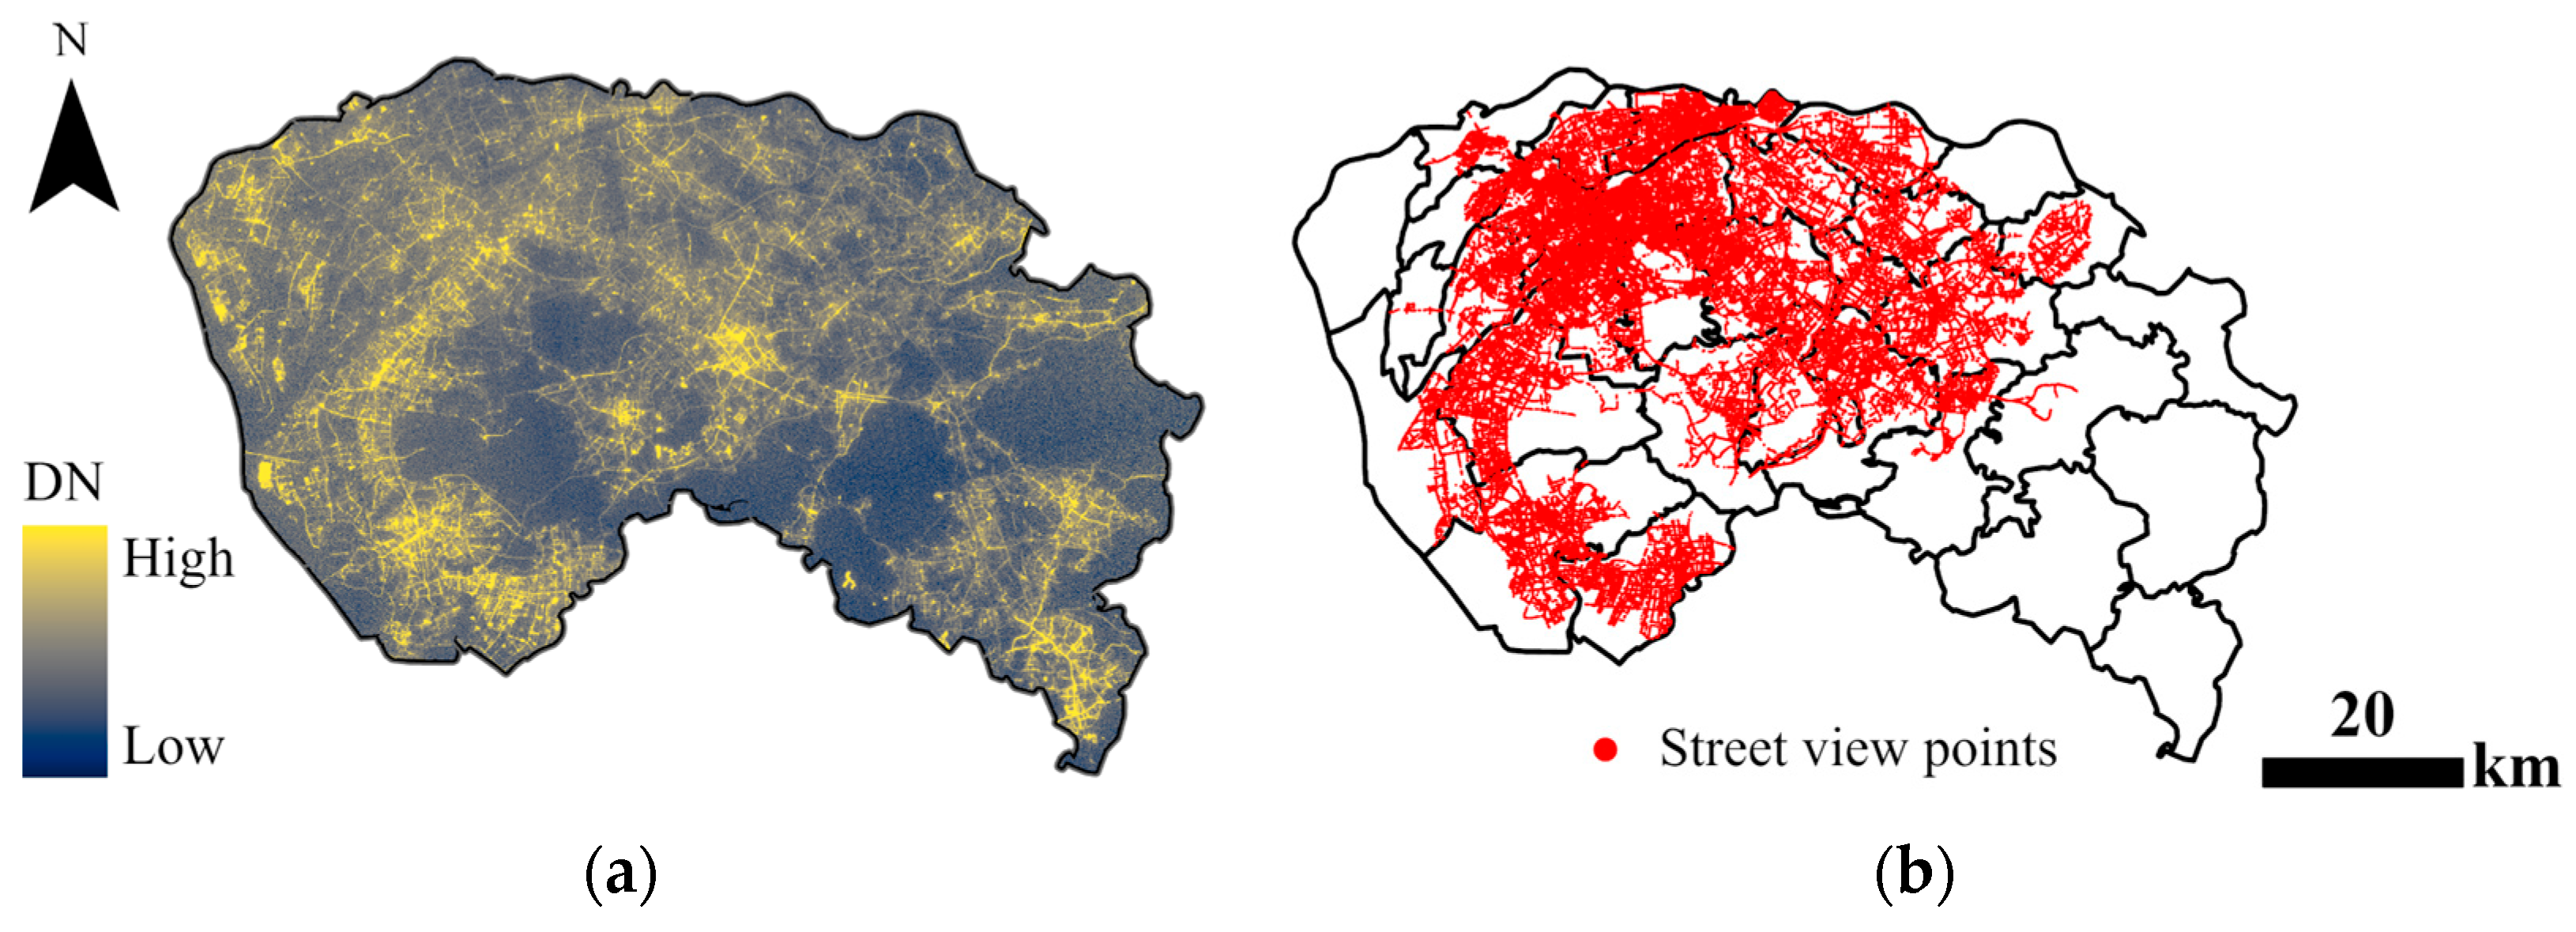
2.2.2. Qimingxing-1 Nighttime Light Data
2.2.3. Street-View Imagery (SVI)
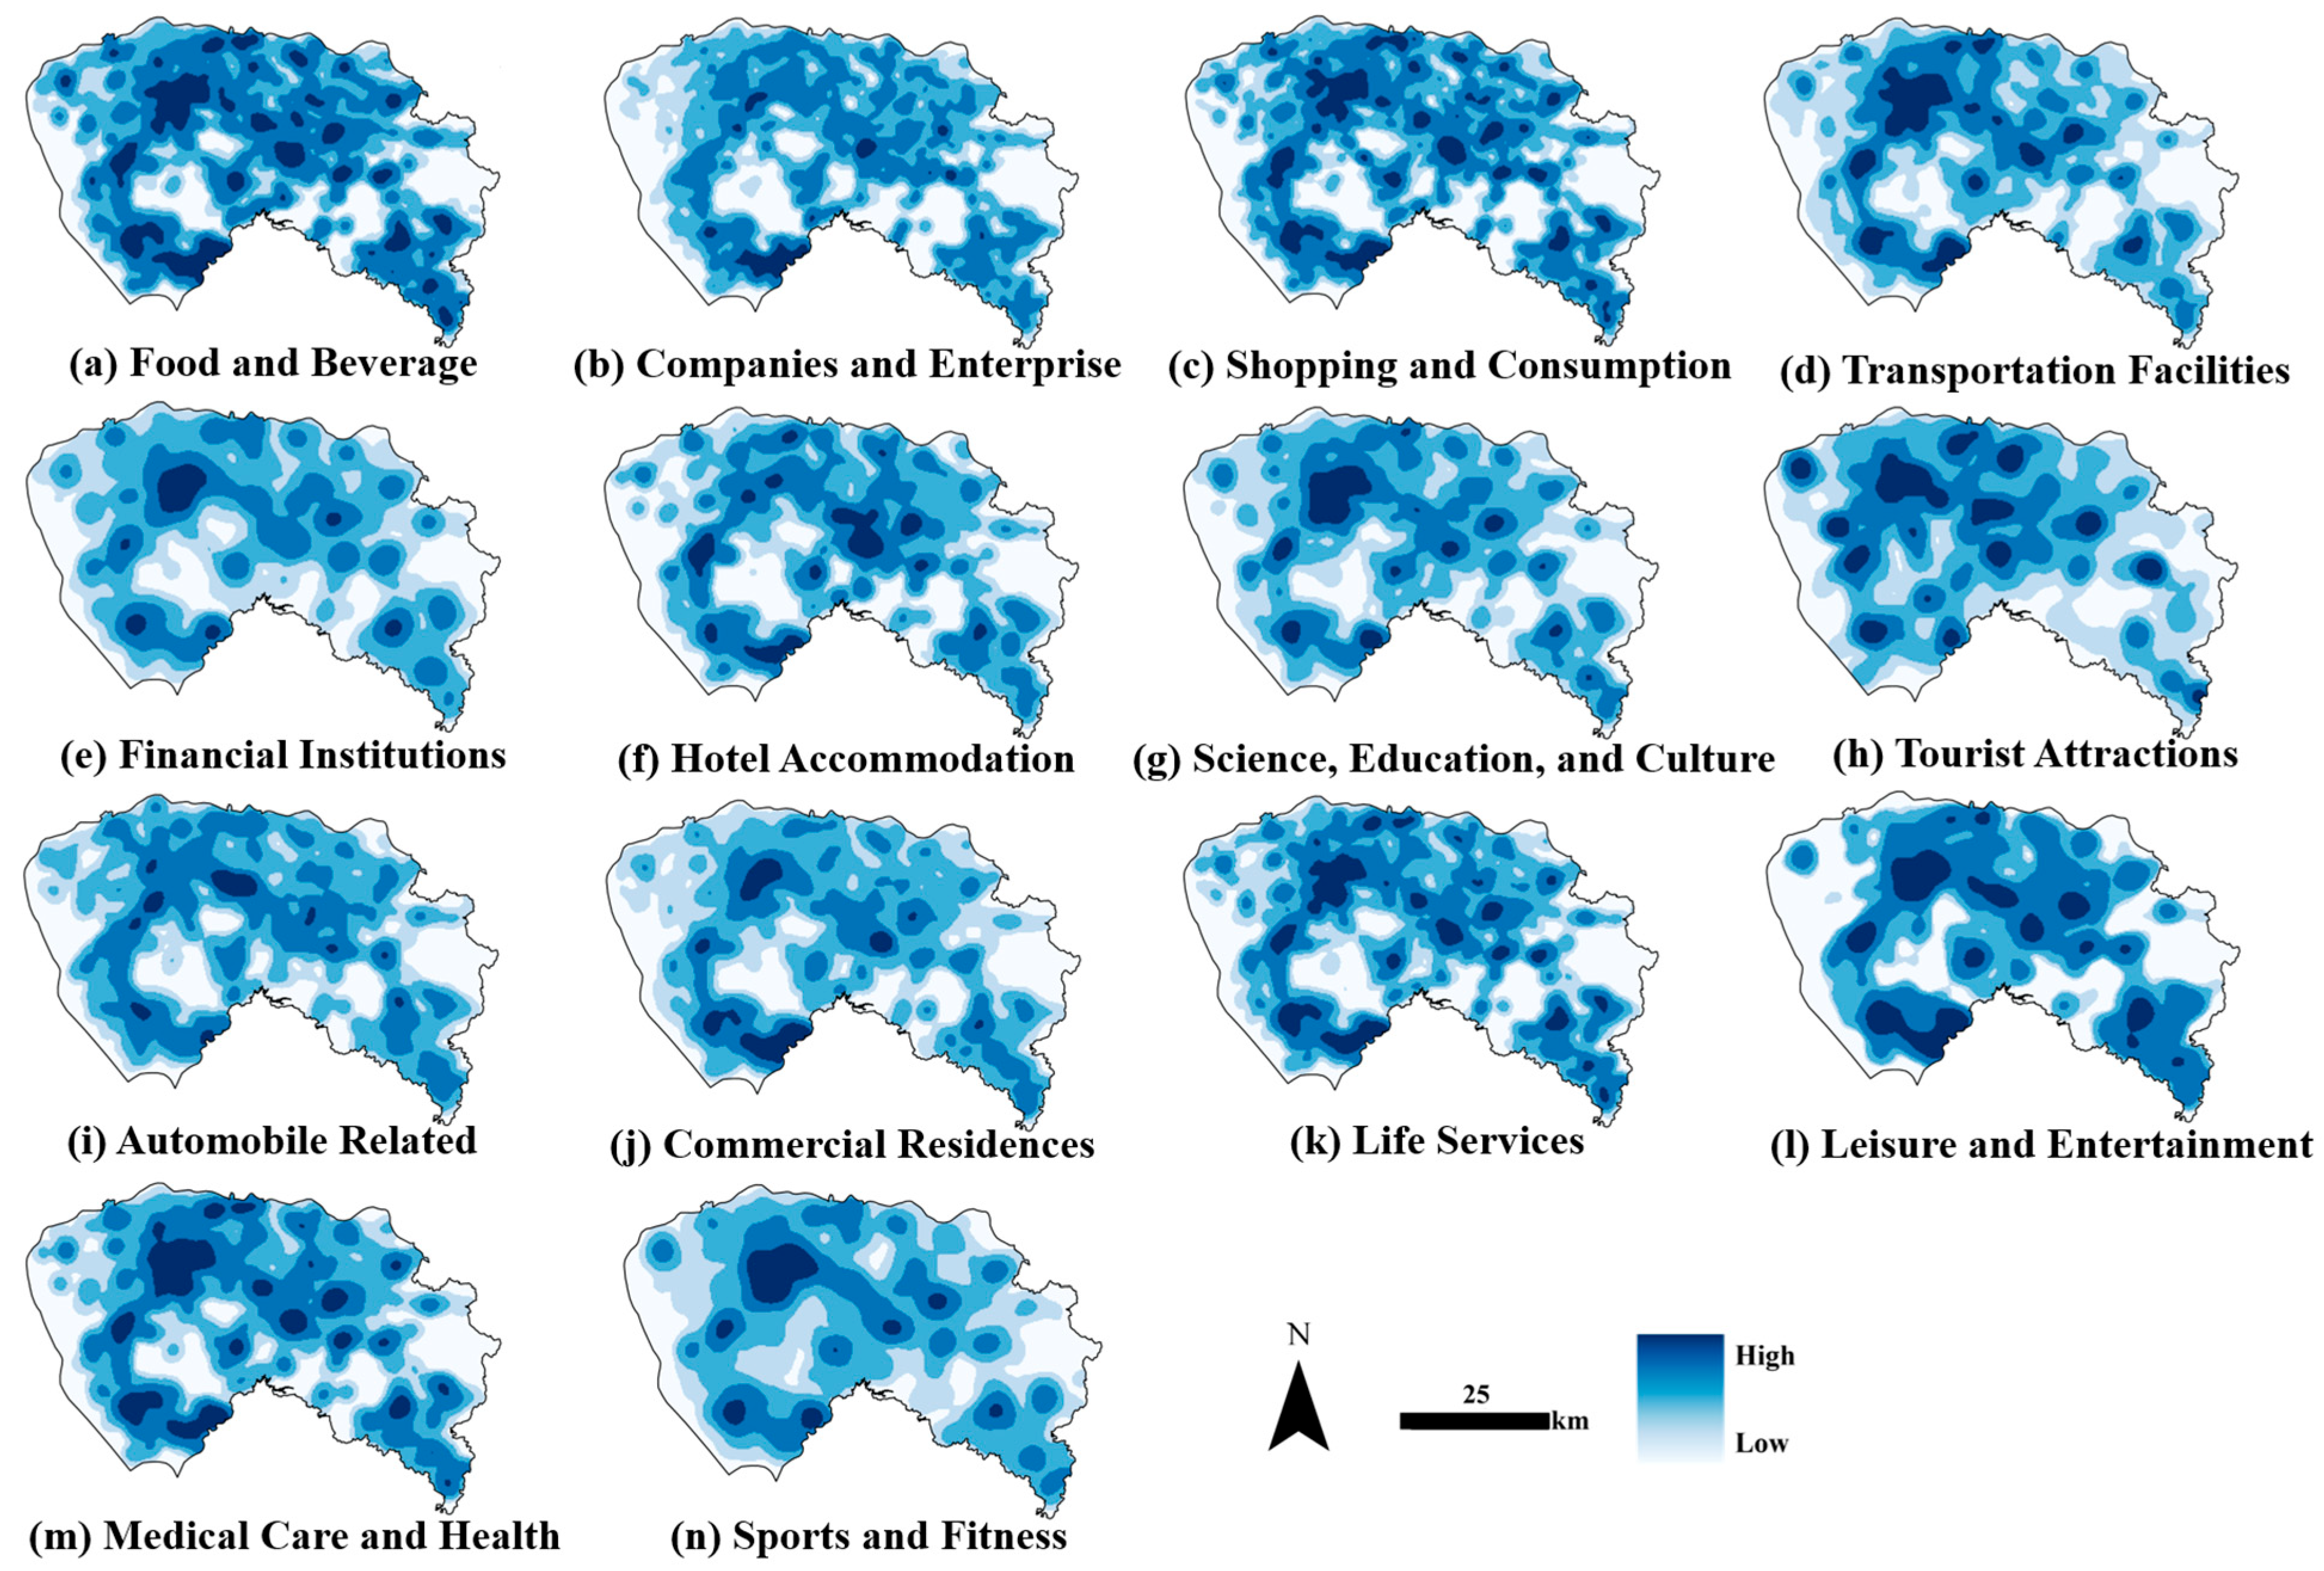
2.2.4. Points of Interest (POI)
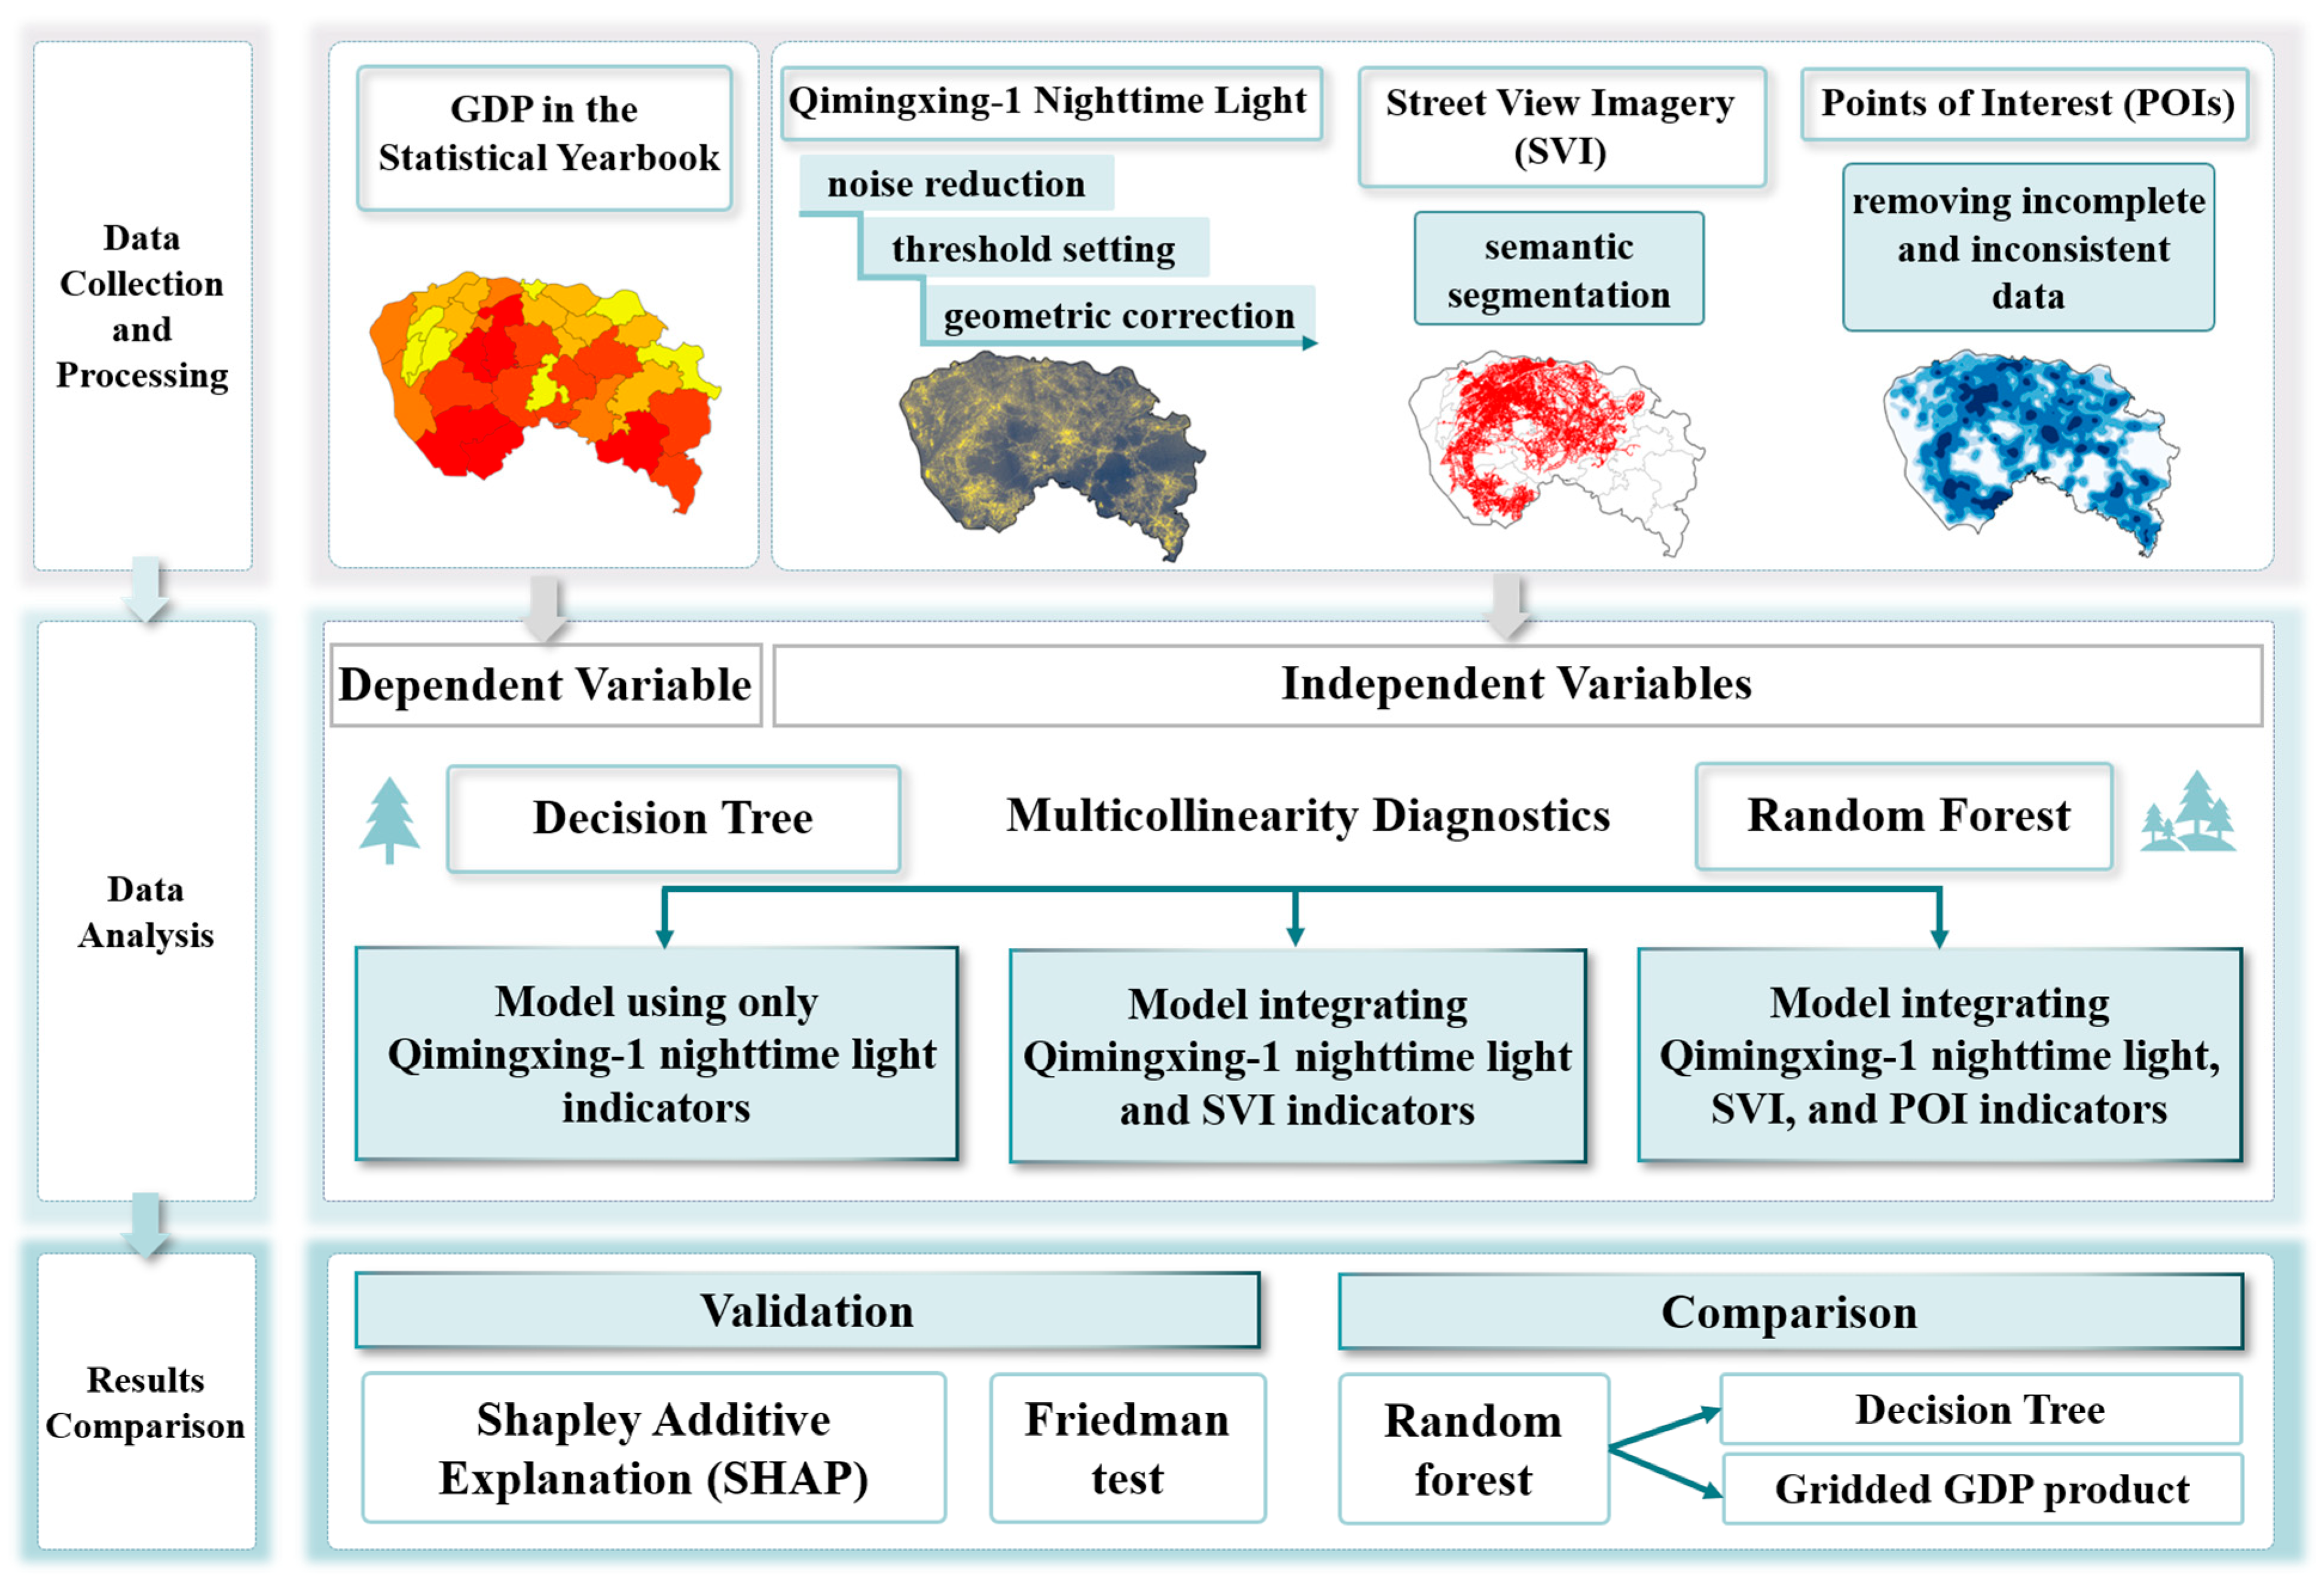
3. Method
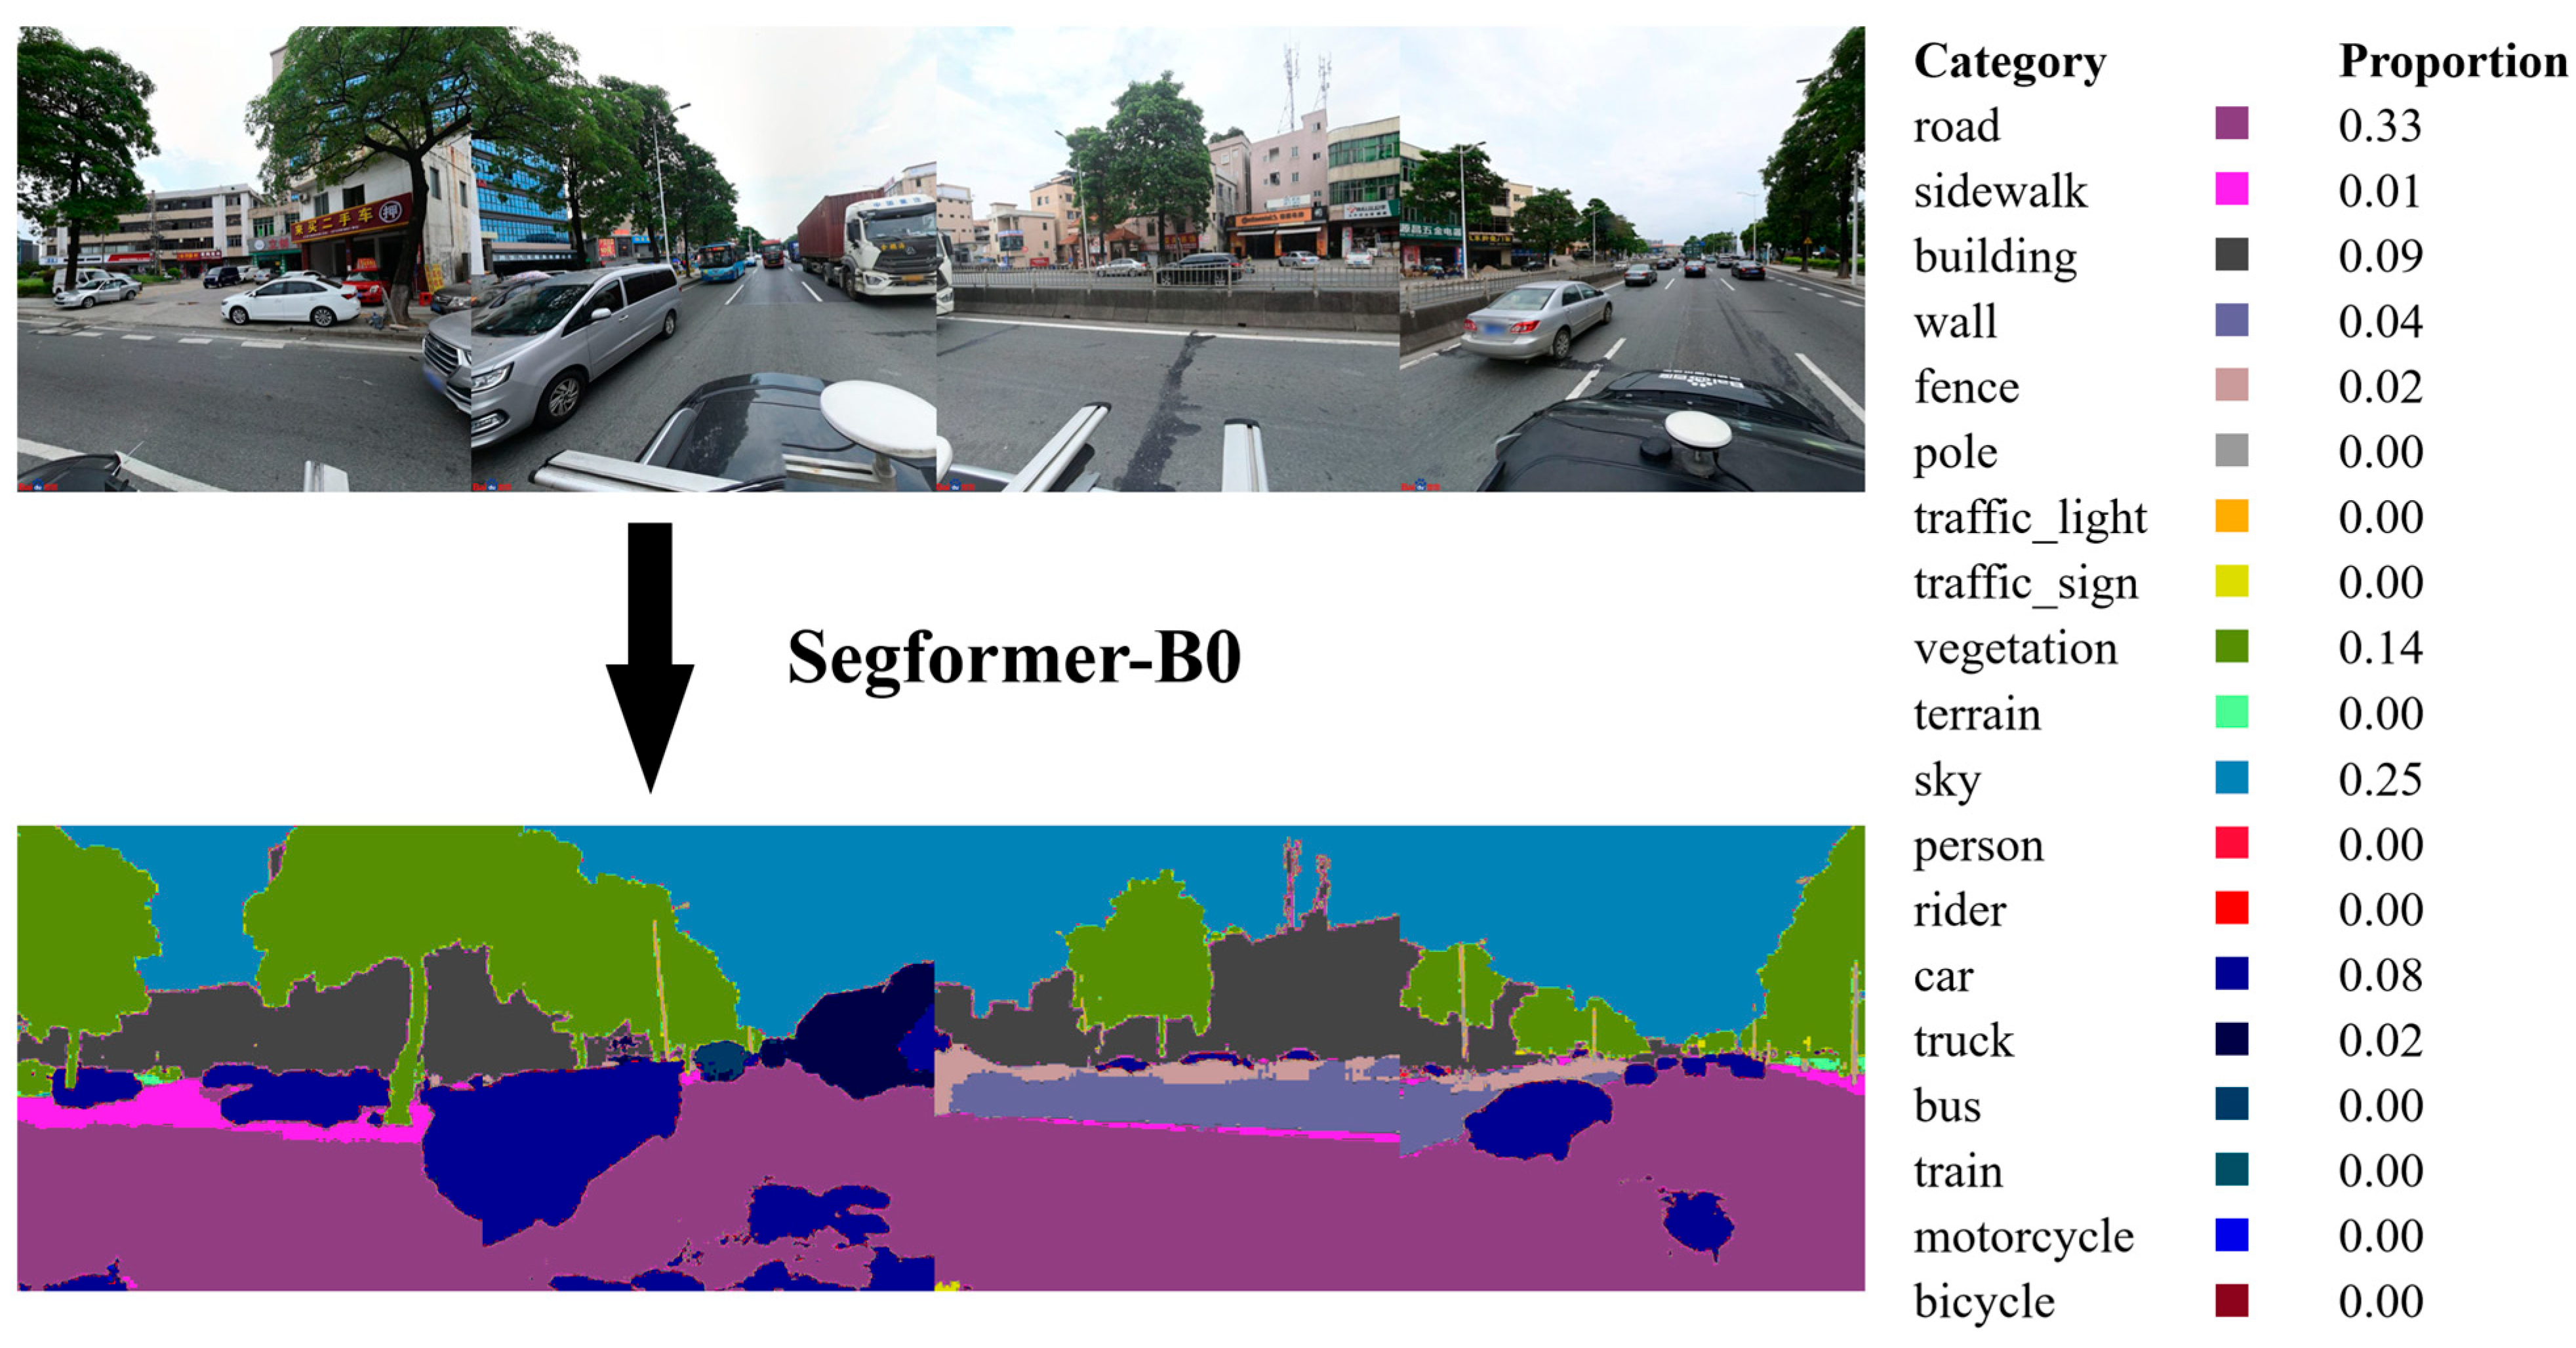
3.1. Semantic Segmentation
3.2. Random Forest
3.3. Decision Tree
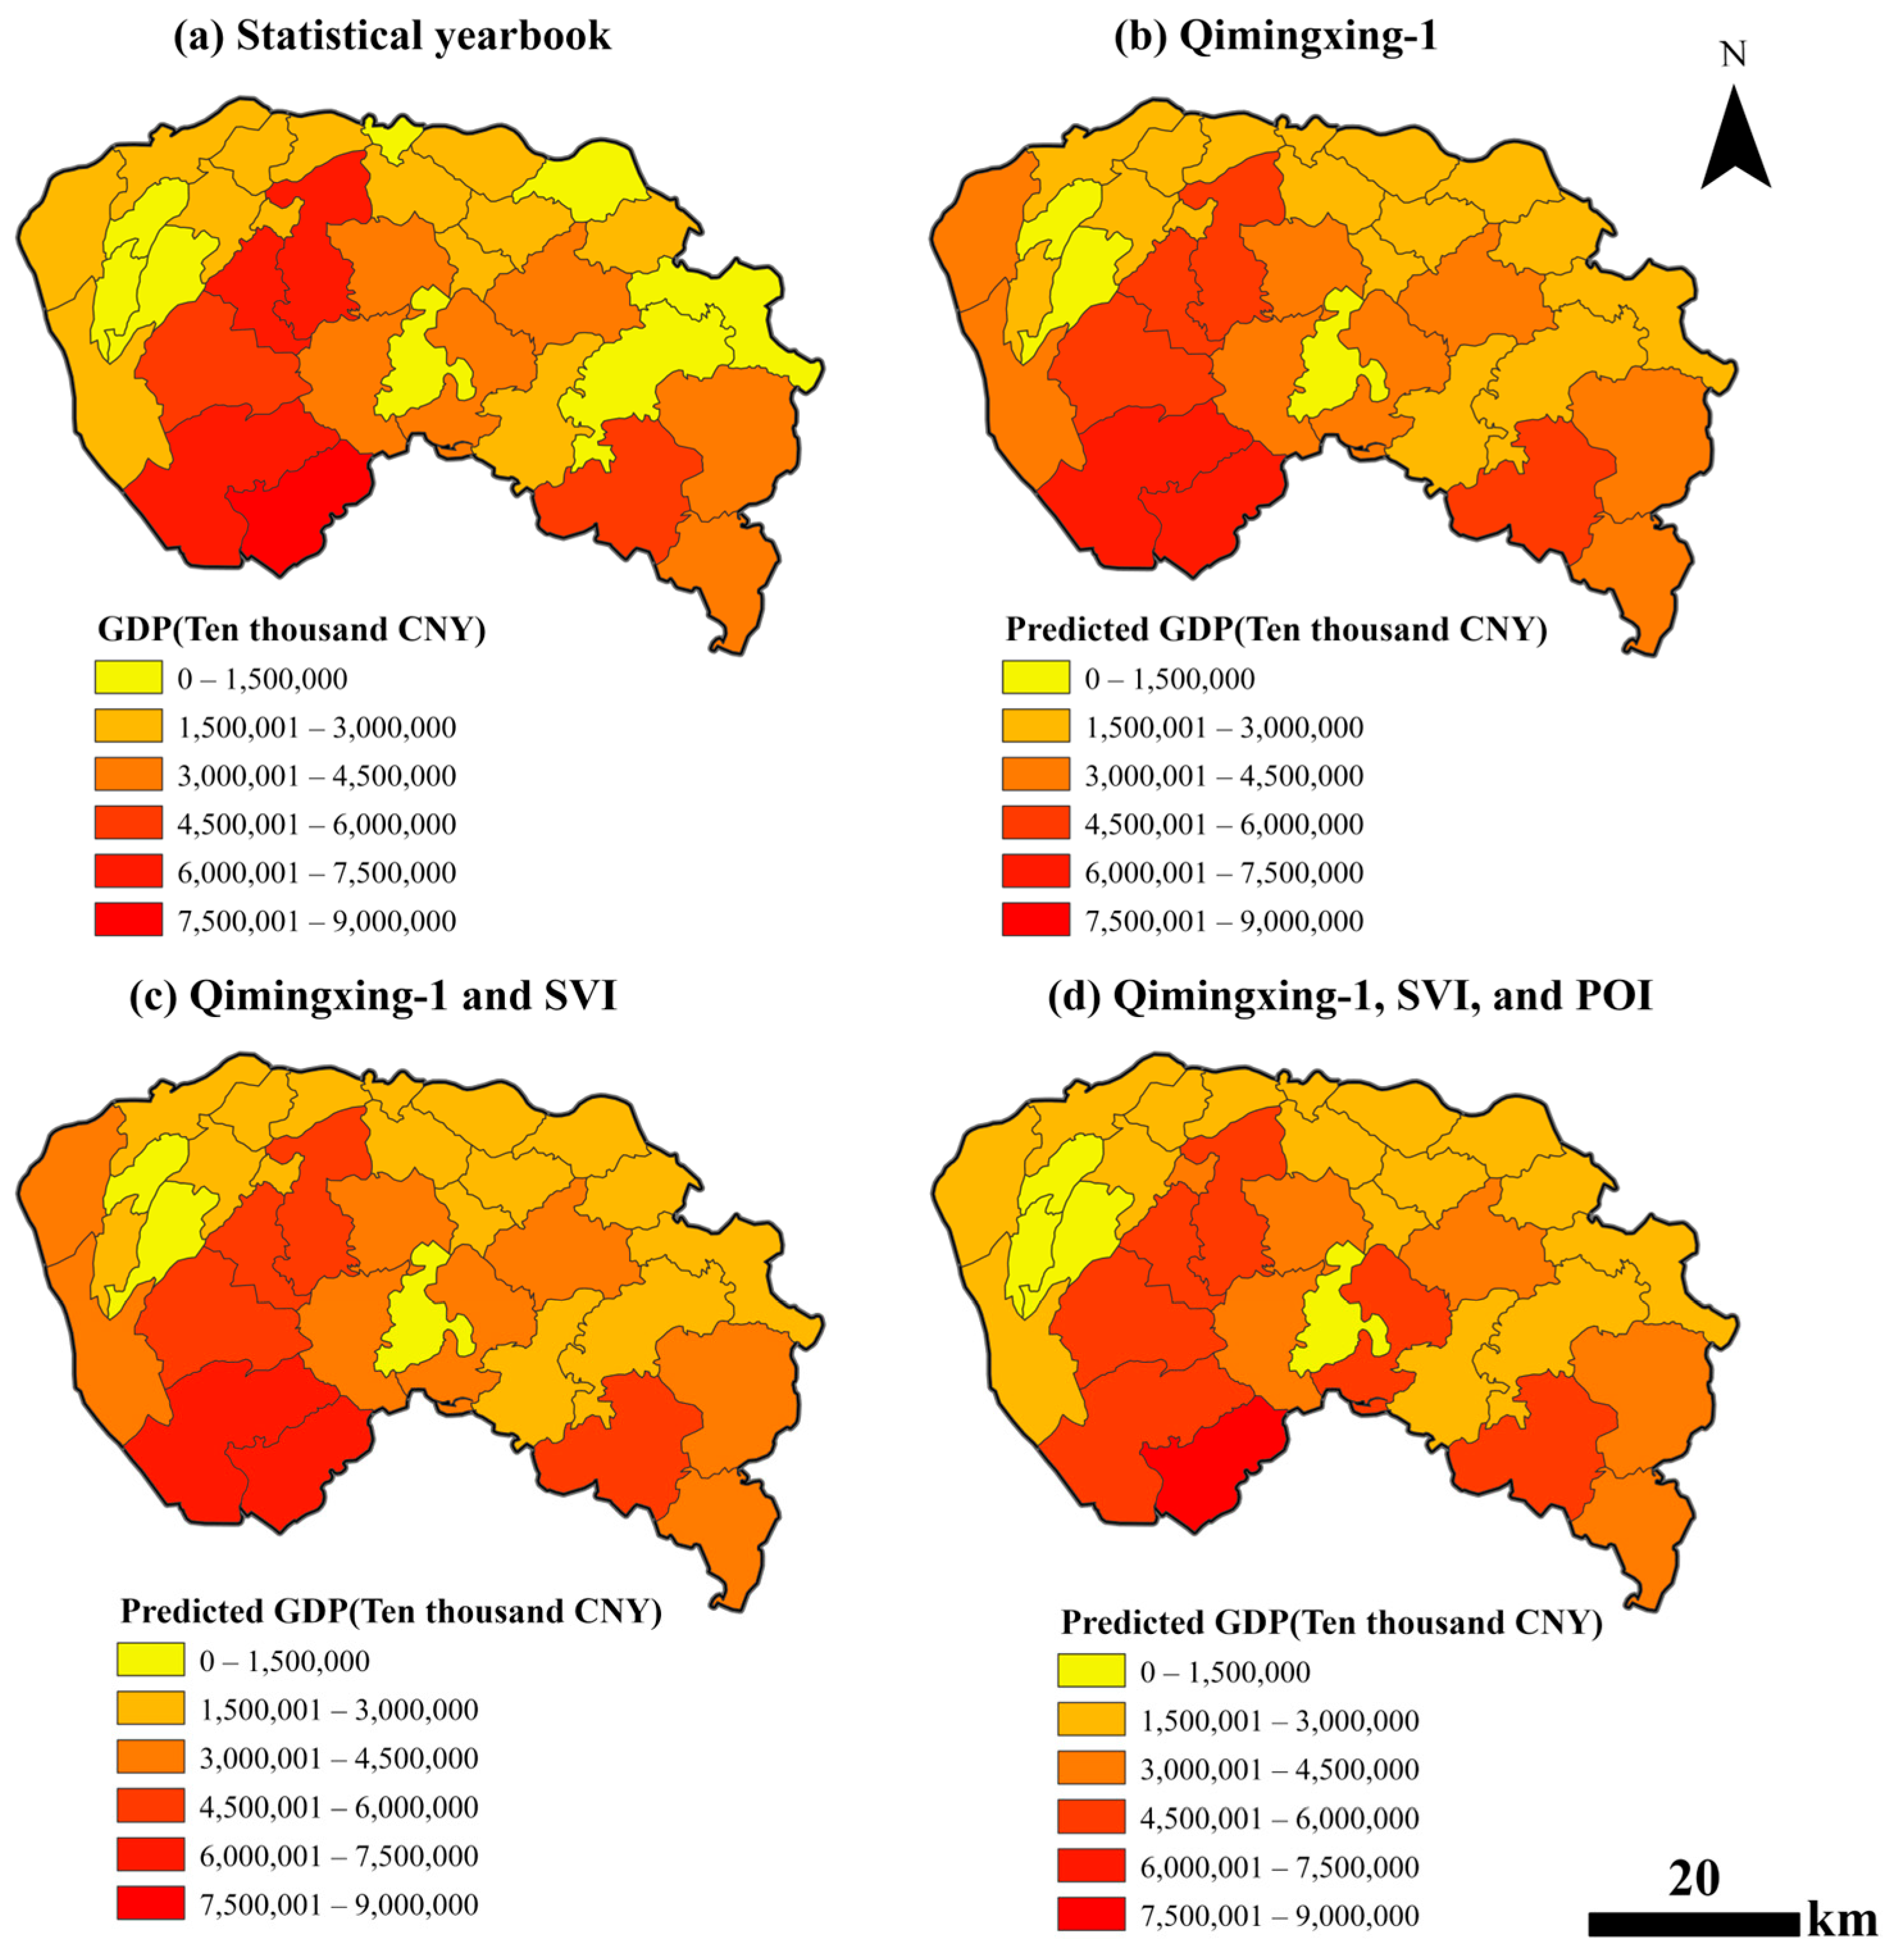
4. Results
4.1. Comparison Among Different Models
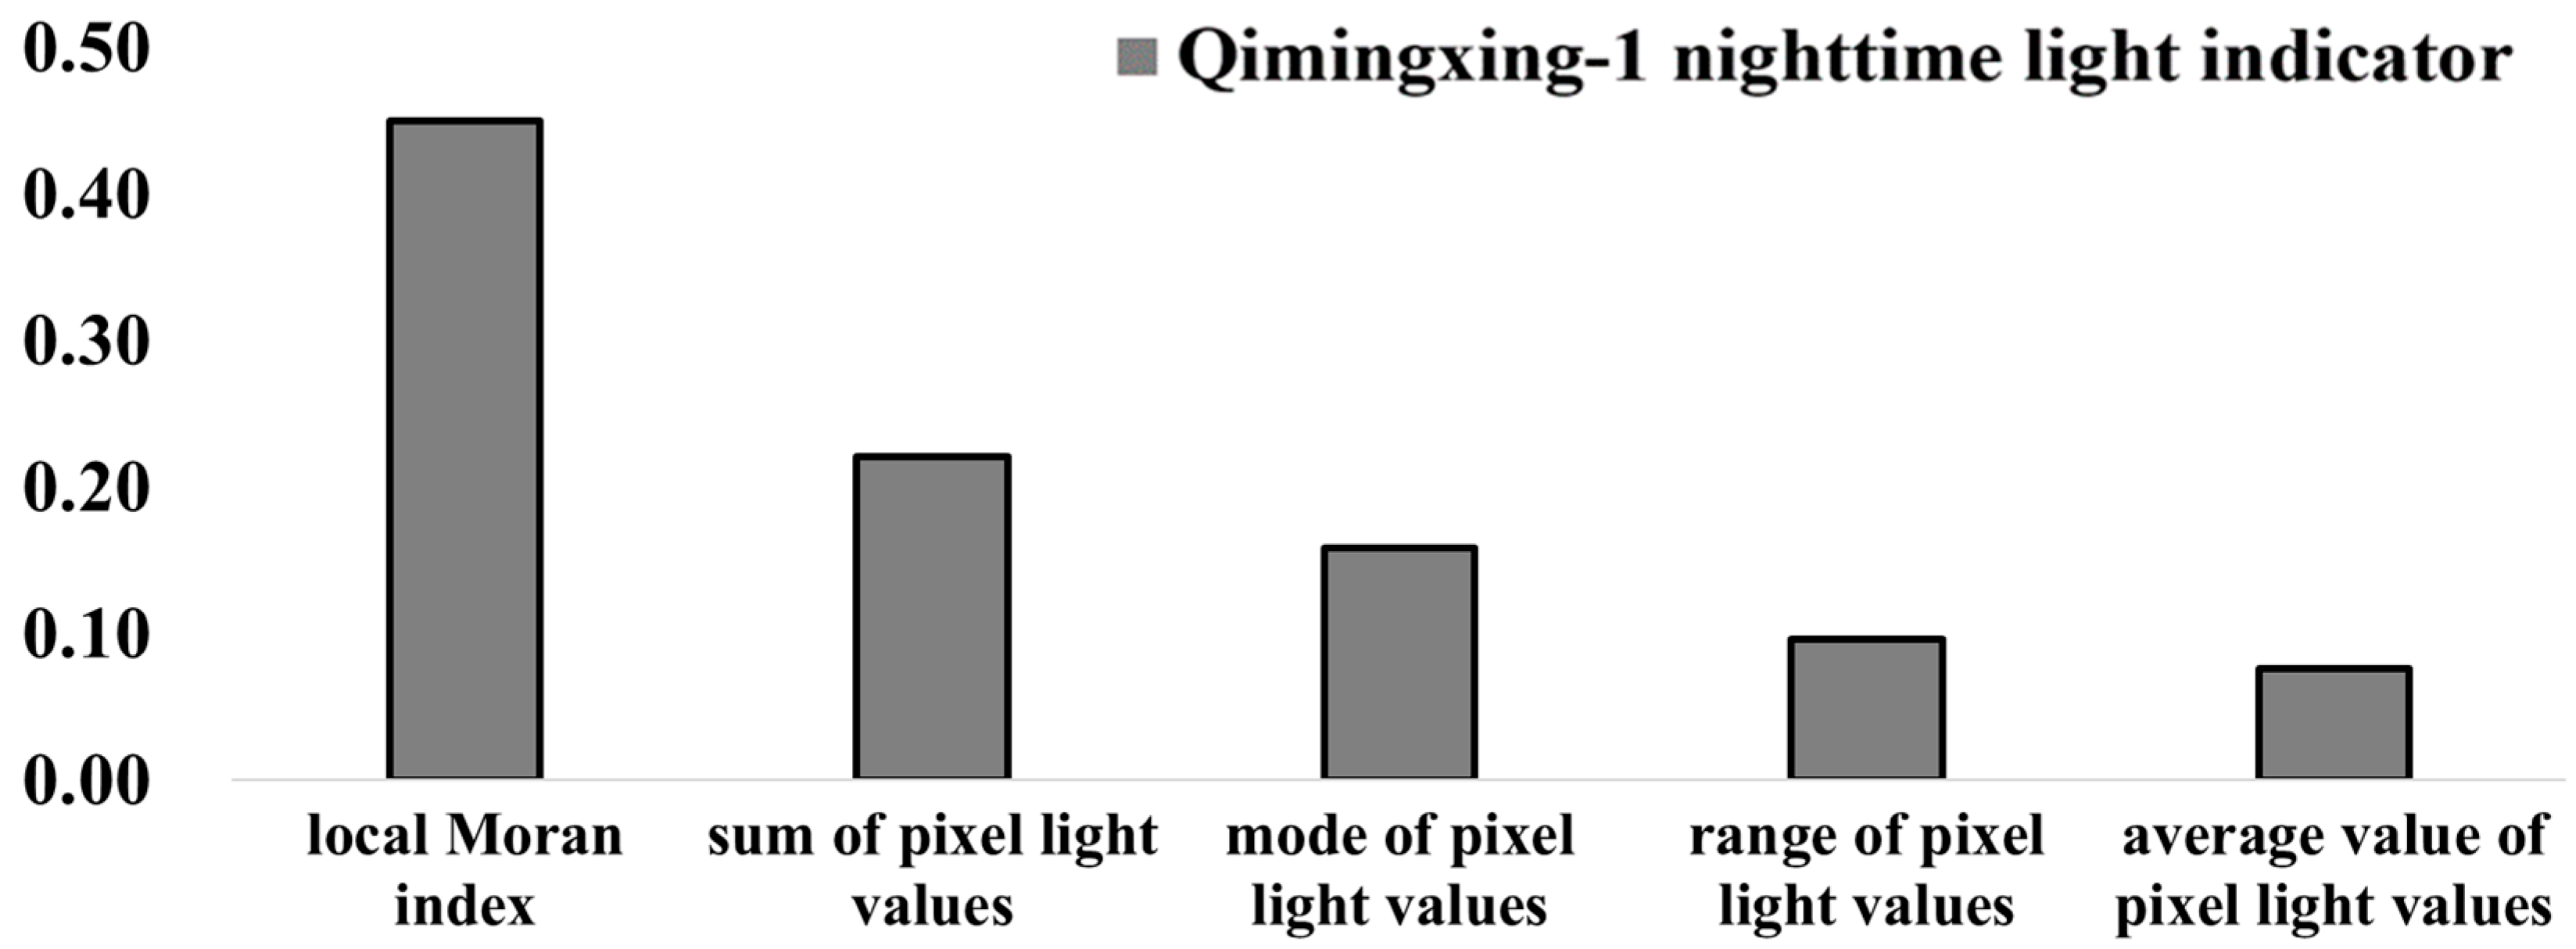
4.2. Random Forest Model Using Only Qimingxing-1 Nighttime Light Indicators
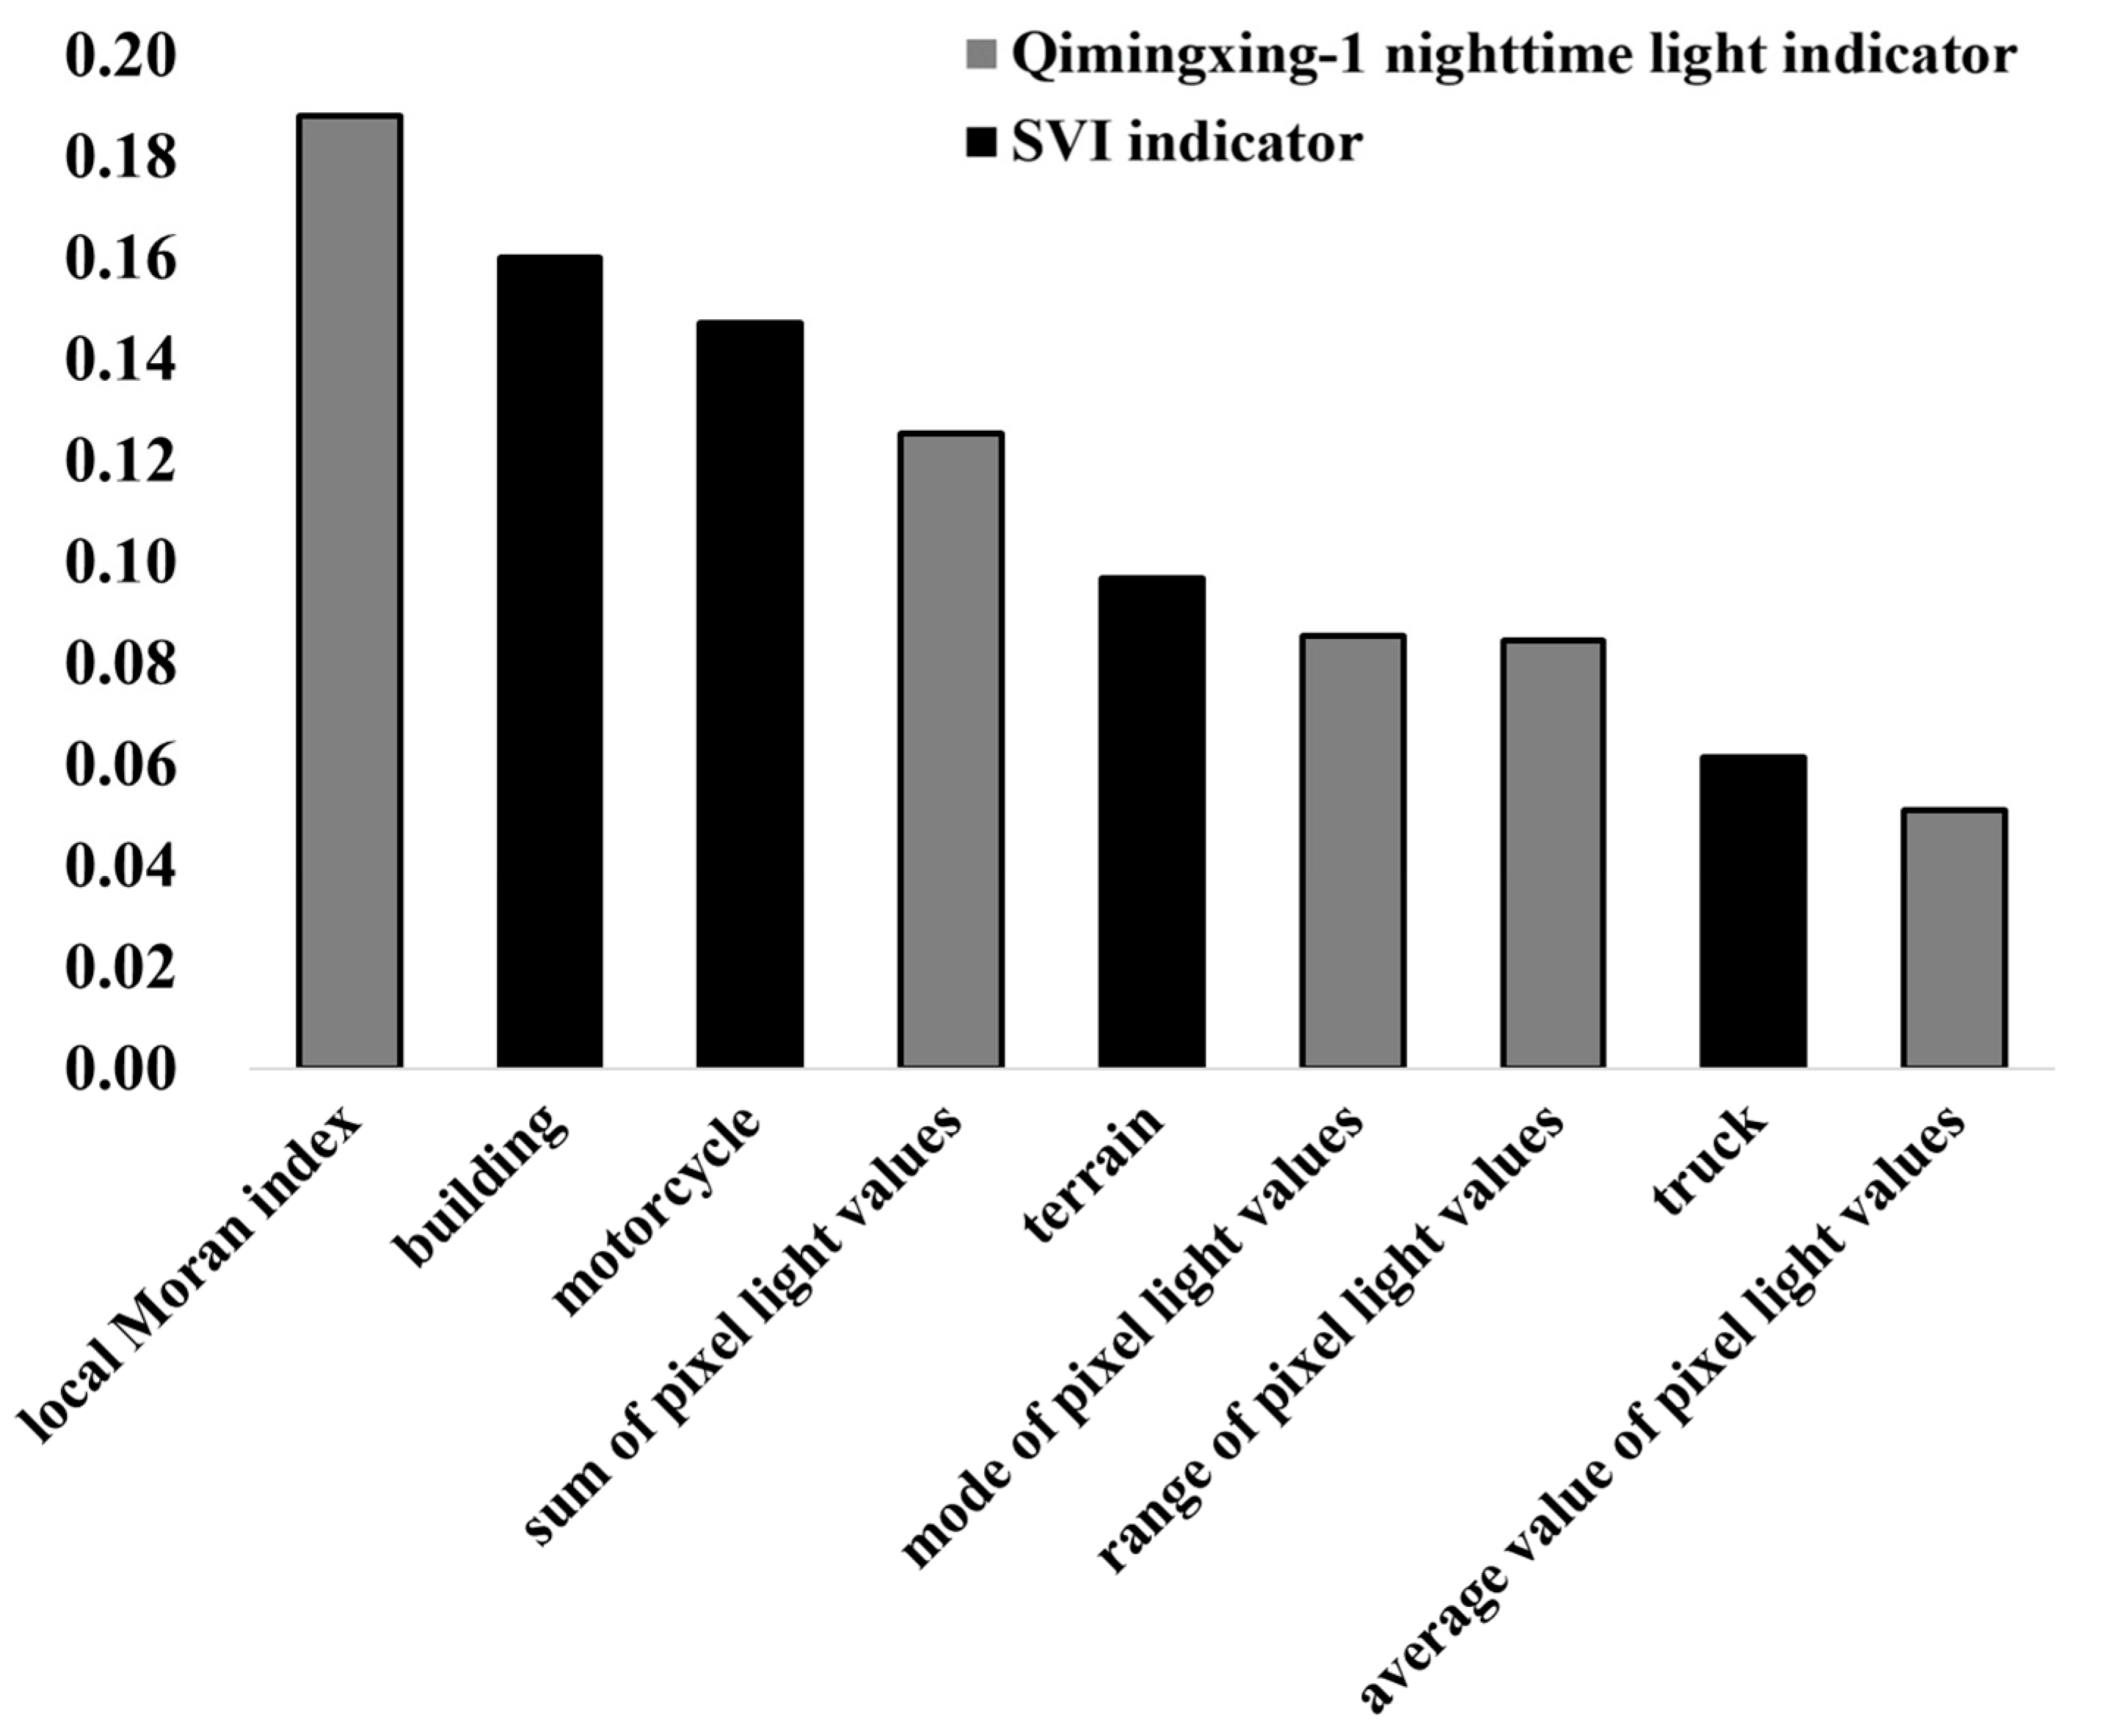
4.3. Random Forest Model Integrating Qimingxing-1 Nighttime Light and SVI Indicators
4.4. Random Forest Model Integrating Qimingxing-1 Nighttime Light, SVI, and POI Indicators
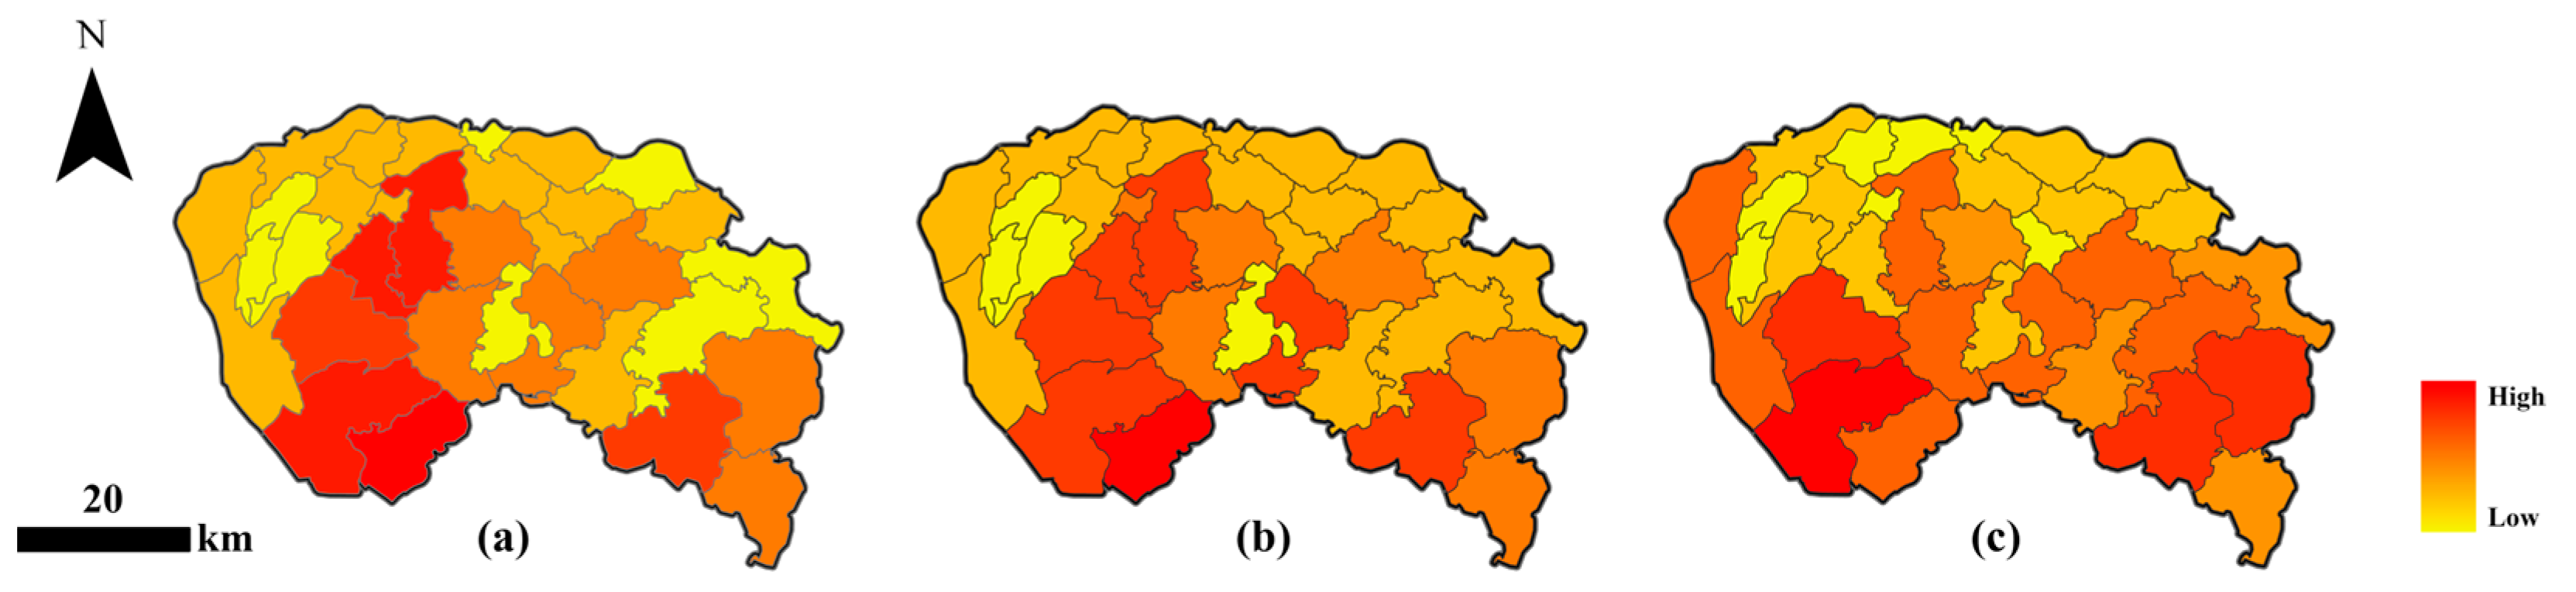
4.5. Comparison of the Optimal Random Forest Model Integrating Qimingxing-1 Nighttime Light, SVI, and POI Indicators with Gridded GDP
5. Discussion
5.1. Main Contributions of This Study
5.2. Advantages and Shortcomings of This Study
6. Conclusions
Author Contributions
Funding
Data Availability Statement
Conflicts of Interest
References
- Lu, Y.; Coops, N.C. Bright Lights, Big City: Causal Effects of Population and GDP on Urban Brightness. PLoS ONE 2018, 13, e0199545. [Google Scholar] [CrossRef]
- Zhao, N.; Liu, Y.; Cao, G.; Samson, E.L.; Zhang, J. Forecasting China’s GDP at the Pixel Level Using Nighttime Lights Time Series and Population Images. GISci. Remote Sens. 2017, 54, 407–425. [Google Scholar] [CrossRef]
- Hong, Y.; Xu, P.; Wang, L.; Pan, Z. Relationship between the News-Based Categorical Economic Policy Uncertainty and US GDP: A Mixed-Frequency Granger-Causality Analysis. Financ. Res. Lett. 2022, 48, 103024. [Google Scholar] [CrossRef]
- Guo, L.; Yang, L. The Corporate Economic Influence and Corporate Social Responsibility: Evidence from China. Sustainability 2023, 15, 10694. [Google Scholar] [CrossRef]
- Liao, H.; Wang, C.; Liu, Y.; Gao, Y.; Wang, F. Revision on China’s Energy Data by Sector and Fuel Type at Provincial Level. Energy Effic. 2019, 12, 849–861. [Google Scholar] [CrossRef]
- Liu, J.; Yang, H. China Fights Against Statistical Corruption. Science 2009, 325, 675–676. [Google Scholar] [CrossRef]
- Rawski, T.G. What Is Happening to China’s GDP Statistics? China Econ. Rev. 2001, 12, 347–354. [Google Scholar] [CrossRef]
- Lu, S.; Xiao, Y.; Lu, Y.; Lin, J. Spatialization of Electricity Consumption by Combining High-Resolution Nighttime Light Remote Sensing and Urban Functional Zoning Information. Geo-Spat. Inf. Sci. 2024, 1–14. [Google Scholar] [CrossRef]
- Tripathy, B.R.; Sajjad, H.; Elvidge, C.D.; Ting, Y.; Pandey, P.C.; Rani, M.; Kumar, P. Modeling of Electric Demand for Sustainable Energy and Management in India Using Spatio-Temporal DMSP-OLS Night-Time Data. Environ. Manag. 2018, 61, 615–623. [Google Scholar] [CrossRef]
- Duerler, R.; Cao, C.; Xie, B.; Huang, Z.; Chen, Y.; Wang, K.; Xu, M.; Lu, Y. Cross Reference of GDP Decrease with Nighttime Light Data via Remote Sensing Diagnosis. Sustainability 2023, 15, 6900. [Google Scholar] [CrossRef]
- Ullah, I.; Li, W.; Meng, F.; Nadeem, M.I.; Ahmed, K. GDP Spatialization in City of Zhengzhou Based on NPP/VIIRS Night-Time Light and Socioeconomic Statistical Data Using Machine Learning. Photogramm. Remote Sens. 2024, 90, 233–240. [Google Scholar] [CrossRef]
- Yu, T.; Ye, Y.; Fan, Z. Estimating GDP Growth Using VIIRS Night-Time Light Data. Int. J. Remote Sens. 2024, 45, 7939–7958. [Google Scholar] [CrossRef]
- Hu, T.; Li, N.; Yang, Q. Evaluating the Influence of COVID-19 Pandemic on Socioeconomic Development in Wumeng Mountain Area Based on Multi-Source Remote Sensing Data. Int. J. Digit. Earth 2024, 17, 2391031. [Google Scholar]
- Elvidge, C.D.; Baugh, K.E.; Kihn, E.A.; Kroehl, H.W.; Davis, E.R.; Davis, C.W. Relation between Satellite Observed Visible-near Infrared Emissions, Population, Economic Activity and Electric Power Consumption. Int. J. Remote Sens. 1997, 18, 1373–1379. [Google Scholar] [CrossRef]
- Ghosh, T.; Anderson, S.; Powell, R.; Sutton, P.; Elvidge, C. Estimation of Mexico’s Informal Economy and Remittances Using Nighttime Imagery. Remote Sens. 2009, 1, 418–444. [Google Scholar] [CrossRef]
- Li, X.; Xu, H.; Chen, X.; Li, C. Potential of NPP-VIIRS Nighttime Light Imagery for Modeling the Regional Economy of China. Remote Sens. 2013, 5, 3057–3081. [Google Scholar] [CrossRef]
- Shi, K.; Yu, B.; Huang, Y.; Hu, Y.; Yin, B.; Chen, Z.; Chen, L.; Wu, J. Evaluating the Ability of NPP-VIIRS Nighttime Light Data to Estimate the Gross Domestic Product and the Electric Power Consumption of China at Multiple Scales: A Comparison with DMSP-OLS Data. Remote Sens. 2014, 6, 1705–1724. [Google Scholar] [CrossRef]
- Propastin, P.; Kappas, M. Assessing Satellite-Observed Nighttime Lights for Monitoring Socioeconomic Parameters in the Republic of Kazakhstan. GISci. Remote Sens. 2012, 49, 538–557. [Google Scholar] [CrossRef]
- Letu, H.; Hara, M.; Tana, G.; Nishio, F. A Saturated Light Correction Method for DMSP/OLS Nighttime Satellite Imagery. IEEE Trans. Geosci. Remote Sens. 2012, 50, 389–396. [Google Scholar] [CrossRef]
- Zhang, G.; Guo, X.; Li, D.; Jiang, B. Evaluating the Potential of LJ1-01 Nighttime Light Data for Modeling Socio-Economic Parameters. Sensors 2019, 19, 1465. [Google Scholar] [CrossRef]
- Guo, W.; Zhang, J.; Zhao, X.; Li, Y.; Liu, J.; Sun, W.; Fan, D. Combining Luojia1-01 Nighttime Light and Points-of-Interest Data for Fine Mapping of Population Spatialization Based on the Zonal Classification Method. IEEE J. Sel. Top. Appl. Earth Obs. Remote Sens. 2023, 16, 1589–1600. [Google Scholar] [CrossRef]
- Levin, N.; Kyba, C.C.M.; Zhang, Q.; Sánchez de Miguel, A.; Román, M.O.; Li, X.; Portnov, B.A.; Molthan, A.L.; Jechow, A.; Miller, S.D.; et al. Remote Sensing of Night Lights: A Review and an Outlook for the Future. Remote Sens. Environ. 2020, 237, 111443. [Google Scholar] [CrossRef]
- Zheng, Q.; Seto, K.C.; Zhou, Y.; You, S.; Weng, Q. Nighttime Light Remote Sensing for Urban Applications: Progress, Challenges, and Prospects. ISPRS-J. Photogramm. Remote Sens. 2023, 202, 125–141. [Google Scholar] [CrossRef]
- Hu, Y.; Chen, J.; Cao, X.; Chen, X.; Cui, X.; Gan, L. Correcting the Saturation Effect in DMSP/OLS Stable Nighttime Light Products Based on Radiance-Calibrated Data. IEEE Trans. Geosci. Remote Sens. 2022, 60, 5602011. [Google Scholar] [CrossRef]
- Chen, Z.; Yu, B.; Yang, C.; Zhou, Y.; Yao, S.; Qian, X.; Wang, C.; Wu, B.; Wu, J. An Extended Time Series (2000–2018) of Global NPP-VIIRS-like Nighttime Light Data from a Cross-Sensor Calibration. Earth Syst. Sci. Data 2021, 13, 889–906. [Google Scholar] [CrossRef]
- Li, M.; Lin, J.; Ji, Z.; Chen, K.; Liu, J. Grid-Scale Poverty Assessment by Integrating High-Resolution Nighttime Light and Spatial Big Data—A Case Study in the Pearl River Delta. Remote Sens. 2023, 15, 4618. [Google Scholar] [CrossRef]
- Dong, B.; Zhang, R.; Li, S.; Ye, Y.; Huang, C. A Meta-Analysis for the Nighttime Light Remote Sensing Data Applied in Urban Research: Key Topics, Hotspot Study Areas and New Trends. Sci. Remote Sens. 2025, 11, 100186. [Google Scholar] [CrossRef]
- Qiu, S.; Chen, Z.; Luo, H.; Lin, J.; Lu, S.; Zhang, X. Evaluation of Impervious Surface Extraction Based on Qimingxing-1 Nighttime Light and Point of Interest Data. Int. J. Digit. Earth 2024, 17, 2430680. [Google Scholar] [CrossRef]
- Zhong, Q.; Xiao, R.; Cao, H.; Li, X.; Wu, J. Evaluation of Qimingxing-1 Nighttime Light Image. Geomat. Inf. Sci. Wuhan Univ. 2023, 48, 1273–1285. [Google Scholar] [CrossRef]
- Chen, Q.; Hou, X.; Zhang, X.; Ma, C. Improved GDP Spatialization Approach by Combining Land-Use Data and Night-Time Light Data: A Case Study in China’s Continental Coastal Area. Int. J. Remote Sens. 2016, 37, 4610–4622. [Google Scholar] [CrossRef]
- Gao, M.; Guo, H.; Liu, L.; Zeng, Y.; Liu, W.; Liu, Y.; Xing, H. Integrating Street View Imagery and Taxi Trajectory for Identifying Urban Function of Street Space. Geo-Spat. Inf. Sci. 2024, 1–23. [Google Scholar] [CrossRef]
- Li, Q.; Cui, C.; Liu, F.; Wu, Q.; Run, Y.; Han, Z. Multidimensional Urban Vitality on Streets: Spatial Patterns and Influence Factor Identification Using Multisource Urban Data. ISPRS Int. J. Geo-Inf. 2021, 11, 2. [Google Scholar] [CrossRef]
- Yuan, Y.; Wang, R.; Niu, T.; Liu, Y. Using Street View Images and a Geographical Detector to Understand How Street-Level Built Environment Is Associated with Urban Poverty: A Case Study in Guangzhou. Appl. Geogr. 2023, 156, 102980. [Google Scholar] [CrossRef]
- Gebru, T.; Krause, J.; Wang, Y.; Chen, D.; Deng, J.; Aiden, E.L.; Li, F.-F. Using Deep Learning and Google Street View to Estimate the Demographic Makeup of Neighborhoods across the United States. Proc. Natl. Acad. Sci. USA 2017, 114, 13108–13113. [Google Scholar] [CrossRef]
- Byun, G.; Kim, Y. A Street-View-Based Method to Detect Urban Growth and Decline: A Case Study of Midtown in Detroit, Michigan, USA. PLoS ONE 2022, 17, e0263775. [Google Scholar] [CrossRef]
- Glaeser, E.L.; Kominers, S.D.; Luca, M.; Naik, N. Big Data and Big Cities: The Promises and Limitations of Improved Measures of Urban Life. Econ. Inq. 2018, 56, 114–137. [Google Scholar] [CrossRef]
- Zhang, F.; Salazar-Miranda, A.; Duarte, F.; Vale, L.; Hack, G.; Chen, M.; Liu, Y.; Batty, M.; Ratti, C. Urban Visual Intelligence: Studying Cities with Artificial Intelligence and Street-Level Imagery. Ann. Am. Assoc. Geogr. 2024, 114, 876–897. [Google Scholar] [CrossRef]
- Cinnamon, J.; Jahiu, L. Panoramic Street-Level Imagery in Data-Driven Urban Research: A Comprehensive Global Review of Applications, Techniques, and Practical Considerations. ISPRS Int. J. Geo-Inf. 2021, 10, 471. [Google Scholar] [CrossRef]
- Biljecki, F.; Ito, K. Street View Imagery in Urban Analytics and GIS: A Review. Landsc. Urban Plan. 2021, 215, 104217. [Google Scholar] [CrossRef]
- Zhou, H.; He, S.; Cai, Y.; Wang, M.; Su, S. Social Inequalities in Neighborhood Visual Walkability: Using Street View Imagery and Deep Learning Technologies to Facilitate Healthy City Planning. Sustain. Cities Soc. 2019, 50, 101605. [Google Scholar] [CrossRef]
- Wu, Y.; Liu, Q.; Hang, T.; Yang, Y.; Wang, Y.; Cao, L. Integrating Restorative Perception into Urban Street Planning: A Framework Using Street View Images, Deep Learning, and Space Syntax. Cities 2024, 147, 104791. [Google Scholar] [CrossRef]
- Lin, J.; Luo, S.; Huang, Y. Poverty Estimation at the County Level by Combining LuoJia1-01 Nighttime Light Data and Points of Interest. Geocarto International 2022, 37, 3590–3606. [Google Scholar] [CrossRef]
- Xu, Z.; Wang, Y.; Sun, G.; Chen, Y.; Ma, Q.; Zhang, X. Generating Gridded Gross Domestic Product Data for China Using Geographically Weighted Ensemble Learning. ISPRS Int. J. Geo-Inf. 2023, 12, 123. [Google Scholar] [CrossRef]
- Guo, W.; Liu, J.; Zhao, X.; Hou, W.; Zhao, Y.; Li, Y.; Sun, W.; Fan, D. Spatiotemporal Dynamics of Population Density in China Using Nighttime Light and Geographic Weighted Regression Method. Int. J. Digit. Earth 2023, 16, 2704–2723. [Google Scholar] [CrossRef]
- Yang, Y.; Wu, J.; Wang, Y.; Huang, Q.; He, C. Quantifying Spatiotemporal Patterns of Shrinking Cities in Urbanizing China: A Novel Approach Based on Time-Series Nighttime Light Data. Cities 2021, 118, 103346. [Google Scholar] [CrossRef]
- Ye, Y.; Huang, L.; Zheng, Q.; Liang, C.; Dong, B.; Deng, J.; Han, X. A Feasible Framework to Downscale NPP-VIIRS Nighttime Light Imagery Using Multi-Source Spatial Variables and Geographically Weighted Regression. Int. J. Appl. Earth Obs. Geoinf. 2021, 104, 102513. [Google Scholar] [CrossRef]
- Li, G.; Cai, Z.; Liu, X.; Liu, J.; Su, S. A Comparison of Machine Learning Approaches for Identifying High-Poverty Counties: Robust Features of DMSP/OLS Night-Time Light Imagery. Int. J. Remote Sens. 2019, 40, 5716–5736. [Google Scholar] [CrossRef]
- Yin, J.; Qiu, Y.; Zhang, B. Identification of Poverty Areas by Remote Sensing and Machine Learning: A Case Study in Guizhou, Southwest China. ISPRS Int. J. Geo-Inf. 2020, 10, 11. [Google Scholar] [CrossRef]
- Zheng, X.; Zhang, W.; Deng, H.; Zhang, H. County-Level Poverty Evaluation Using Machine Learning, Nighttime Light, and Geospatial Data. Remote Sens. 2024, 16, 962. [Google Scholar] [CrossRef]
- Zeng, Q.; Gong, Z.; Wu, S.; Zhuang, C.; Li, S. Measuring Cyclists’ Subjective Perceptions of the Street Riding Environment Using K-Means SMOTE-RF Model and Street View Imagery. Int. J. Appl. Earth Obs. Geoinf. 2024, 128, 103739. [Google Scholar] [CrossRef]
- Zhao, X.; Lu, Y.; Lin, G. An Integrated Deep Learning Approach for Assessing the Visual Qualities of Built Environments Utilizing Street View Images. Eng. Appl. Artif. Intell. 2024, 130, 107805. [Google Scholar] [CrossRef]
- Qing, Y.; Wu, H.; Qi, K.; Gui, Z.; Liu, Y.; Li, Z.; Li, R. Integrating Street-View Imagery and Points of Interest for Refining Population Spatialization: A Case Study in Wuhan City. Sustain. Cities Soc. 2024, 115, 105883. [Google Scholar] [CrossRef]
- Delgado-Panadero, Á.; Hernández-Lorca, B.; García-Ordás, M.T.; Benítez-Andrades, J.A. Implementing Local-Explainability in Gradient Boosting Trees: Feature Contribution. Inf. Sci. 2022, 589, 199–212. [Google Scholar] [CrossRef]
- Grinsztajn, L.; Oyallon, E.; Varoquaux, G. Why Do Tree-Based Models Still Outperform Deep Learning on Tabular Data? Adv. Neural Inf. Process. Syst. 2022, 35, 507–520. [Google Scholar]
- Zhang, Z.; Zhang, T.; Li, J. Unbiased Gradient Boosting Decision Tree with Unbiased Feature Importance. arXiv 2023, arXiv:2305.10696. [Google Scholar]
- Benkendorf, D.J.; Hawkins, C.P. Effects of Sample Size and Network Depth on a Deep Learning Approach to Species Distribution Modeling. Ecol. Inform. 2020, 60, 101137. [Google Scholar] [CrossRef]
- He, J.; Fu, R.; Wang, G.; Lu, D. How to Measure the Effect of Training-Data Sample Size on Image Classification Algorithms Based on Deep Learning. In Advances in Guidance, Navigation and Control; Yan, L., Duan, H., Deng, Y., Eds.; Lecture Notes in Electrical Engineering; Springer Nature: Singapore, 2025; Volume 1345, pp. 82–93. ISBN 978-981-9622-31-3. [Google Scholar]
- Breiman, L. Random Forests. Machine Learning. Mach. Learn. 2001, 45, 5–32. [Google Scholar] [CrossRef]
- Genuer, R.; Poggi, J.-M.; Tuleau, C. Random Forests: Some Methodological Insights. arXiv 2008, arXiv:0811.3619. [Google Scholar]
- Kingsford, C.; Salzberg, S.L. What Are Decision Trees? Nat. Biotechnol. 2008, 26, 1011–1013. [Google Scholar] [CrossRef]
- Kotsiantis, S.B. Decision Trees: A Recent Overview. Artif. Intell. Rev. 2013, 39, 261–283. [Google Scholar] [CrossRef]
- Rokach, L.; Maimon, O. Decision Trees. In Data Mining and Knowledge Discovery Handbook; Maimon, O., Rokach, L., Eds.; Springer: New York, NY, USA, 2005; pp. 165–192. ISBN 978-0-387-24435-8. [Google Scholar]
- Kaiser, M.; Günnemann, S.; Disse, M. Regional-Scale Prediction of Pluvial and Flash Flood Susceptible Areas Using Tree-Based Classifiers. J. Hydrol. 2022, 612, 128088. [Google Scholar] [CrossRef]
- Banaie-Dezfouli, M.; Nadimi-Shahraki, M.H.; Beheshti, Z. R-GWO: Representative-Based Grey Wolf Optimizer for Solving Engineering Problems. Appl. Soft Comput. 2021, 106, 107328. [Google Scholar] [CrossRef]
- Ganaie, M.A.; Tanveer, M. LSTSVM Classifier with Enhanced Features from Pre-Trained Functional Link Network. Appl. Soft Comput. 2020, 93, 106305. [Google Scholar] [CrossRef]
- Korkmaz, S.; Şahman, M.A.; Cinar, A.C.; Kaya, E. Boosting the Oversampling Methods Based on Differential Evolution Strategies for Imbalanced Learning. Appl. Soft Comput. 2021, 112, 107787. [Google Scholar] [CrossRef]
- Peng, J.; Zou, K.; Zhou, M.; Teng, Y.; Zhu, X.; Zhang, F.; Xu, J. An Explainable Artificial Intelligence Framework for the Deterioration Risk Prediction of Hepatitis Patients. J. Med. Syst. 2021, 45, 61. [Google Scholar] [CrossRef] [PubMed]
- Ward, I.R.; Wang, L.; Lu, J.; Bennamoun, M.; Dwivedi, G.; Sanfilippo, F.M. Explainable Artificial Intelligence for Pharmacovigilance: What Features Are Important When Predicting Adverse Outcomes? Comput. Methods Programs Biomed. 2021, 212, 106415. [Google Scholar] [CrossRef]
- Han, X.; Tana, G.; Qin, K.; Letu, H. Estimating Industrial Structure Changes in China Using Dmsp—Ols Night-Time Light Data During 1999–2012. Int. Arch. Photogramm. Remote Sens. Spat. Inf. Sci. 2018, 42, 9–15. [Google Scholar] [CrossRef]
- Gu, Y.; Shao, Z.; Huang, X.; Cai, B. GDP Forecasting Model for China’s Provinces Using Nighttime Light Remote Sensing Data. Remote Sens. 2022, 14, 3671. [Google Scholar] [CrossRef]
- Bound, J.; Brown, C.; Mathiowetz, N. Chapter 59—Measurement Error in Survey Data. In Handbook of Econometrics; Heckman, J.J., Leamer, E., Eds.; Elsevier: Amsterdam, The Netherlands, 2001; Volume 5, pp. 3705–3843. [Google Scholar]
- Deaton, A. Measuring Poverty in a Growing World (or Measuring Growth in a Poor World). Rev. Econ. Stat. 2005, 87, 1–19. [Google Scholar] [CrossRef]


| Aspect | Description | Calculation |
|---|---|---|
| Central tendency | Average value of pixel light values | |
| Average light index | Number of light pixels/Sum of pixel light values | |
| Median of pixel light values | - | |
| Mode of pixel light values | - | |
| Dispersion degree | Variance of pixel light values | |
| Standard deviation of pixel light values | ||
| Distribution characteristic | Sum of pixel light values | |
| Number of light pixels | - | |
| Range of pixel light values | - | |
| Maximum of pixel light values | - | |
| Minimum of pixel light values | - | |
| Spatial characteristic | Local Moran index |
| Model | Indicator | Tolerance | VIF |
|---|---|---|---|
| Using only Qimingxing-1 nighttime light | range of pixel light values | 0.2800 | 3.5715 |
| average value of pixel light values | 0.4600 | 2.1739 | |
| sum of pixel light values | 0.3567 | 2.8038 | |
| mode of pixel light values | 0.6846 | 1.4606 | |
| local Moran index | 0.8672 | 1.1532 | |
| Integrating Qimingxing-1 nighttime light and SVI | range of pixel light values | 0.2757 | 3.6268 |
| average value of pixel light values | 0.3803 | 2.6297 | |
| sum of pixel light values | 0.3413 | 2.9297 | |
| mode of pixel light values | 0.6538 | 1.5294 | |
| local Moran index | 0.7539 | 1.3264 | |
| building | 0.1452 | 6.8854 | |
| terrain | 0.6336 | 1.5783 | |
| truck | 0.4074 | 2.4546 | |
| motorcycle | 0.1877 | 5.3289 | |
| Integrating Qimingxing-1 nighttime light, SVI, and POI | range of pixel light values | 0.2095 | 4.7744 |
| average value of pixel light values | 0.3023 | 3.3079 | |
| sum of pixel light values | 0.3064 | 3.2640 | |
| mode of pixel light values | 0.5258 | 1.9019 | |
| local Moran index | 0.6953 | 1.4383 | |
| building | 0.1074 | 9.3148 | |
| terrain | 0.5257 | 1.9023 | |
| truck | 0.2276 | 4.3946 | |
| motorcycle | 0.1314 | 7.6076 | |
| hotel accommodation | 0.2459 | 4.0662 | |
| tourist attractions | 0.1765 | 5.6650 | |
| automobile related | 0.2833 | 3.5297 | |
| commercial residences | 0.2334 | 4.2840 |
| Model | Metric | Using Only Qimingxing-1 Nighttime Light | Integrating Qimingxing-1 Nighttime Light and SVI | Integrating Qimingxing-1 Nighttime Light, SVI, and POI |
|---|---|---|---|---|
| Random Forest | Correlation coefficient | 0.9604 | 0.9710 | 0.9796 |
| Mean absolute error | 510,894.5 | 468,248.5 | 456,649.8 | |
| Root mean squared error | 734,278.6 | 671,378.0 | 671,332.6 | |
| Relative absolute error | 0.3119 | 0.2859 | 0.2788 | |
| Root relative squared error | 0.3575 | 0.3268 | 0.3268 | |
| Decision Tree | Correlation coefficient | 0.6997 | 0.7442 | 0.8018 |
| Mean absolute error | 1,064,221.8 | 992,372.8 | 830,477.2 | |
| Root mean squared error | 1,467,605.8 | 1,372,162.2 | 1,227,661.4 | |
| Relative absolute error | 0.6497 | 0.6059 | 0.5070 | |
| Root relative squared error | 0.7145 | 0.6680 | 0.5976 |
Disclaimer/Publisher’s Note: The statements, opinions and data contained in all publications are solely those of the individual author(s) and contributor(s) and not of MDPI and/or the editor(s). MDPI and/or the editor(s) disclaim responsibility for any injury to people or property resulting from any ideas, methods, instructions or products referred to in the content. |
© 2025 by the authors. Licensee MDPI, Basel, Switzerland. This article is an open access article distributed under the terms and conditions of the Creative Commons Attribution (CC BY) license (https://creativecommons.org/licenses/by/4.0/).
Share and Cite
Chen, Z.; Zhang, C.; Qiu, S.; Lin, J. GDP Estimation by Integrating Qimingxing-1 Nighttime Light, Street-View Imagery, and Points of Interest: An Empirical Study in Dongguan City. Remote Sens. 2025, 17, 1127. https://doi.org/10.3390/rs17071127
Chen Z, Zhang C, Qiu S, Lin J. GDP Estimation by Integrating Qimingxing-1 Nighttime Light, Street-View Imagery, and Points of Interest: An Empirical Study in Dongguan City. Remote Sensing. 2025; 17(7):1127. https://doi.org/10.3390/rs17071127
Chicago/Turabian StyleChen, Zejia, Chengzhi Zhang, Suixuan Qiu, and Jinyao Lin. 2025. "GDP Estimation by Integrating Qimingxing-1 Nighttime Light, Street-View Imagery, and Points of Interest: An Empirical Study in Dongguan City" Remote Sensing 17, no. 7: 1127. https://doi.org/10.3390/rs17071127
APA StyleChen, Z., Zhang, C., Qiu, S., & Lin, J. (2025). GDP Estimation by Integrating Qimingxing-1 Nighttime Light, Street-View Imagery, and Points of Interest: An Empirical Study in Dongguan City. Remote Sensing, 17(7), 1127. https://doi.org/10.3390/rs17071127