Article

Multi-Aspect Interpolation Method for SAR Complex Images of Typical Aircraft Target Using Multi-Aspect Scattering Information Complex Generative Adversarial Network

by
Shixin Wei
1,2,3,
Bing Han
1,2,*,
Jiayuan Shen
1,3,4,
Jiaxin Wan
1,2,3,
Yugang Feng
1,2 and
Qianyue Xue
1,2,3
1
Aerospace Information Research Institute, Chinese Academy of Sciences, Beijing 100094, China
2
Key Laboratory of Target Cognition and Application Technology, Beijing 100190, China
3
School of Electronic, Electrical and Communication Engineering, University of Chinese Academy of Sciences, Beijing 100049, China
4
Key Laboratory of Technology in Geo-Spatial Information Processing and Application System, Chinese Academy of Sciences, Beijing 100190, China
*
Author to whom correspondence should be addressed.
Remote Sens. 2025, 17(7), 1143; https://doi.org/10.3390/rs17071143
Submission received: 14 February 2025 / Revised: 14 March 2025 / Accepted: 21 March 2025 / Published: 24 March 2025
(This article belongs to the Special Issue SAR Images Processing and Analysis (2nd Edition))

Abstract

:
Due to the huge differences in Synthetic Aperture Radar (SAR) image features of the same target under different observing aspects, the demand for constructing multi-aspect SAR datasets of various typical targets is becoming increasingly urgent with the expansion of SAR technology application fields. Meanwhile, multi-aspect interpolation techniques for constructing multi-aspect SAR datasets, based on electromagnetic scattering features and on Generative Adversarial Networks (GANs), have some shortcomings that are difficult to address. The former method provide descriptions of the target scattering so overly idealized that they are not real, while the latter method suffers from incomplete amplitude information and a loss of phase information in multi-aspect interpolation results due to the SAR images input into GANs being phaseless and amplitude-quantized. In response to the above issues, this paper proposes the Multi-aspect Scattering Information Complex GAN (MS-CGAN) guided by the scattering information in observing aspects of SAR images to simulate the multi-aspect interpolation of SAR images from specific aspects. MS-CGAN provides a new approach for dataset construction and augmentation. Moreover, as a complex network, MS-CGAN does not require phase removal or amplitude quantization of the input SAR images; thus, the significant issue of the severe loss of scattering information in multi-aspect interpolation methods based on GANs is greatly addressed. In the experiments, assuming the absence of real SAR images from certain aspects, both the correlation coefficient and the phase correlation between interpolated SAR images from MS-CGAN and real SAR images achieve good results. In the case of a sampling aspect interval of 10°, the mean correlation of the amplitude and phase of the interpolated SAR images and the corresponding real SAR images both reach over 80%. In the case of a sampling aspect interval of 20°, the mean correlation of the amplitude and phase of the interpolated SAR images and the corresponding real SAR images remain above 75%. In the case of a sampling aspect interval of 30°, the mean correlation of the amplitude and phase of the interpolated SAR images and the corresponding real SAR images can reach around 70%. Energy integration curves are completed at specific aspects, demonstrating the effectiveness of the MS-CGAN multi-aspect interpolation method.

1. Introduction

Due to the huge differences in Synthetic Aperture Radar (SAR) image features of the same target under different observing aspects and the continuous expansion of the multi-aspect SAR technology field, important research directions such as SAR image interpretation, feature extraction, and multi-aspect scattering analysis have increasingly required SAR datasets of different typical targets. However, collecting real target data through multi-aspect SAR faces challenges such as high costs, numerous limiting factors (fixed observing orbits, limited observing aspects, and so on). Therefore, conducting relevant technical research on SAR image multi-aspect interpolation, expanding the scarce SAR sample image data, and striving to address the mismatch between supply and demand of multi-aspect SAR image datasets are crucial.
Currently, SAR image multi-aspect interpolation techniques can be broadly categorized into two types: traditional SAR image multi-aspect interpolation or simulation techniques based on electromagnetic scattering features [1] and SAR image multi-aspect interpolation techniques based on Generative Adversarial Networks (GANs) [2,3]. SAR image multi-aspect interpolation is a relatively new concept, aiming to use the SAR images of sampled observing aspects to interpolate and generate SAR images of unsampled observing aspects [4,5]. However, many current traditional methods are simulating SAR images, that is, they use simulated prior information to simulate SAR images, without the support of real SAR image data. Therefore, in the introduction of the traditional SAR image multi-aspect interpolation or simulation techniques based on electromagnetic scattering features, the primary focus is on the technology of simulating SAR images.
Traditional SAR image multi-aspect interpolation or simulation techniques based on electromagnetic scattering features mainly consist of three methods [6]: feature-based SAR image simulation methods, echo signal-based SAR image simulation methods, and linear or nonlinear vector multi-aspect interpolation methods based on real SAR images. Feature-based SAR image simulation methods aim to simulate the geometric features and scattering features of targets [7]. The calculation methods for this type of electromagnetic scattering are mainly high-frequency methods, including Physical Optics (PO) [8], Geometrical Optics (GO) [9,10], Geometrical Theory of Diffraction (GTD) [11], and Shooting and Bouncing Ray (SBR) [12]. These methods are suitable for large-sized targets [13]. High-frequency methods lead to a reduction in accuracy due to the simplification of the computational models. Echo signal-based SAR image simulation methods focus on the simulation of target echo signals [14]. The calculation methods for this type of electromagnetic scattering are primarily low-frequency methods, including Finite Difference Time Domain (FDTD) [15], Method of Moment (MoM) [16], Fast Multipole Method (FMM) [17], and Multi-Level FMM (MLFMM) [18]. These methods are suitable for rough surface targets. The algorithmic time complexity of low-frequency methods continues to increase, leading to lower computational efficiency [19]. Linear or nonlinear vector multi-aspect interpolation methods based on real SAR images mainly utilize SAR images that have actually been sampled to obtain interpolated SAR images [20].
Traditional SAR image multi-aspect interpolation or simulation techniques based on electromagnetic scattering features are considered classical in SAR multi-aspect interpolation or simulation theory. However, the simulation models assume the ideal, uniform, linear motion of the SAR platform trajectory, without finely modeling the impact of the environment in which the target is located or the structure and material of the target itself on scattering features; thus, the outcomes of interpolation or simulation are often overly idealized and not real. Therefore, traditional SAR image multi-aspect interpolation or simulation techniques based on electromagnetic scattering features often struggle to accurately describe real targets.
With the advent of the “big data accumulation, high network performance” era, deep learning has become integrated into scientific research across various industries. The rich and practical algorithmic thinking, model rules, and network architectures proposed by researchers have gradually permeated into various research fields of SAR. In 2014, when GAN was first proposed by Ian Goodfellow [2,3], it not only ushered in a new era of image simulation but also brought a whole new realm of exploration for multi-aspect interpolation techniques in SAR images. In important research areas of SAR such as multi-aspect interpolation and data augmentation [21,22,23,24,25,26], optical image transformation [27,28,29,30,31,32], and SAR image super-resolution reconstruction [33,34,35,36,37], the presence of SAR image multi-aspect interpolation techniques based on GANs can be observed. Guo et al. [21] proposed a D2D GAN model to complete SAR images from various azimuth aspects by generating the required SAR images with specific aspects from sampled SAR images. To improve the quality of generated samples and the convergence speed of the algorithm, Zhang et al. [22] combined GANs with Convolutional Neural Networks (CNNs) and introduced a Deep Convolutional GAN (DCGAN) to achieve target SAR image dataset augmentation. By leveraging the azimuth sensitivity features of SAR images, they incorporated an azimuth recognition network to extract the target azimuth and generate SAR images consistent with the azimuth of the sampled SAR images. Cui et al. [23] proposed a selection model based on Wasserstein GAN–Gradient Penalty (WGAN-GP) for azimuth filtering in SAR images, which improved the instability of the DCGAN method, enriched the azimuthal information of SAR target images, and addressed the issue of mode collapse in the generation of SAR targets. Sun et al. [24] proposed a method for simulating target SAR images using Spectral Normalization GAN (SN-GAN), which addressed the issue of data sparsity in SAR automatic target recognition. To ensure the diversity, similarity, and correct categorization of generated SAR images so that they can serve as supplementary datasets, Du et al. [25] proposed a Multiconstraint GAN (MCGAN). By introducing an encoder and noise, the results showed that the MCGAN could provide high-quality images, which could assist in achieving good classification accuracy. To provide new solutions for dataset construction and expansion, Wang et al. [26] conducted SAR image multi-aspect interpolation research based on GANs using aircraft datasets. They built a multi-aspect SAR aircraft target dataset through sampling real data and employed a scattering analysis and a Self-Attention GAN (SAGAN) to achieve simulated SAR image multi-aspect interpolation at specific aspects. In scenarios where some data were assumed missing, the effectiveness of multi-aspect interpolation based on SAGAN was confirmed through a comprehensive evaluation of the similarity between the interpolated images and real sampled SAR images using specific metrics.
The SAR image multi-aspect interpolation technique based on GAN demonstrates excellent interpolation and extrapolation capabilities. Compared to traditional SAR image multi-aspect interpolation techniques based on electromagnetic scattering features, the multi-aspect interpolation theory based on GANs can directly achieve high-realism multi-aspect interpolation using real sampled images, achieving “high-precision, high-correlation, high-similarity” SAR amplitude image interpolation, which, to a certain extent, compensates for the shortcomings of traditional electromagnetic scattering multi-aspect interpolation methods in accurately describing targets. However, up to now, the development of SAR image multi-aspect interpolation techniques based on GANs has mostly focused on generating SAR amplitude images, with the phase information of SAR images completely lost. Additionally, a portion of the amplitude information is also lost due to the amplitude quantization of SAR images before inputting them into the GAN model. Currently, many fields of SAR, such as target classification [38,39,40] and recognition [41], image fusion [42] and image interpretation [43], etc., are trying to combine complex networks to solve related problems. Therefore, if the concept of complex networks can be combined with GANs, and the complexification of GANs can be performed, the problem of the missing phase can be solved. In the field of SAR imaging, the issue of phase loss has always been a critical challenge when introducing neural networks. If the phase information is lost, the target scattering information is severely compromised, significantly impacting tasks such as fine processing of SAR images, target detection, target recognition, target classification, and image interpretation. Therefore, addressing the problem of phase generation in networks is of the utmost urgency.
In our previous research, we explored the relationship between multi-aspect interpolation and the target structural complexity, elucidating the prerequisites for improving interpolation effectiveness [4,5]. In this paper, in order to address the challenges of traditional multi-aspect interpolation methods based on electromagnetic scattering features in accurately describing the scattering of targets and the issues of incomplete amplitude information and lost phase information in GAN-based multi-aspect interpolation methods, a Multi-aspect Scattering Information Complex GAN (MS-CGAN) guided by scattering information from observing aspects of SAR images is designed. Assuming that some data are missing, the MS-CGAN is used to interpolate the aspects of target aircraft SAR images with missing aspects. The model should input SAR image samples with fully closed-loop aspect information (samples with non-closed-loop aspect information will be the focus of future work). The assessment parameters are used for a numerical analysis of the interpolated SAR images and the corresponding real SAR images, and the energy integration curve is completed, which proves the feasibility of using this method for specific-aspect SAR image multi-aspect interpolation. After rigorous control experiments, the effectiveness of the unquantized-amplitude SAR images and the phase SAR images generated by MS-CGAN are verified. Under the same experimental conditions, compared with previous methods, the assessment parameters of amplitude and phase SAR images are improved by varying degrees from 5% to 15%.
The main contributions of this paper are given as follows:
  • We propose an intelligent method for SAR complex image multi-aspect interpolation, MS-CGAN, to generate SAR complex images with unquantized amplitude, no missing phase, and required aspects, thereby trying to solve the problems of SAR amplitude image quantization and SAR phase image missing in current intelligent multi-aspect interpolation methods.
  • We construct a Pseudo-Scattering Information Sequence (PSIS) as the MS-CGAN input which differs from the random noise input typical of general GANs; instead, it consists of the PSIS formed by interpolating random noise into prior scattering information, where the prior scattering information is generated through the integration of complex center sequences containing anisotropic scattering information. Essentially, while the noise information remains random, the input sequence contains scattering information observed from multiple aspects. Theoretically, it can facilitate the convergence of the scattering distribution in interpolated SAR images towards the target scattering distribution.
  • We propose a custom-defined SAR phase image quality assessment parameter: the phase correlation. The phase coherence coefficient in interferometric SAR is used to verify the effectiveness of the phase correlation.
The rest of the paper is organized as follows: In Section 2, we describe the data preprocessing and construction of the typical aircraft target dataset in this paper. In Section 3, we conduct a scattering analysis of multi-aspect SAR images, elaborate on the different parts of MS-CGAN, and explain the assessment parameters of interpolated SAR amplitude and phase images. In Section 4, we carry out the experimental design and analysis of experimental results, verifying the advantages of the MS-CGAN multi-aspect interpolation method and the effectiveness of PSIS. In Section 5, we discuss our method and consider future works. Conclusions are presented in Section 6.

2. Dataset Description and Data Preprocessing

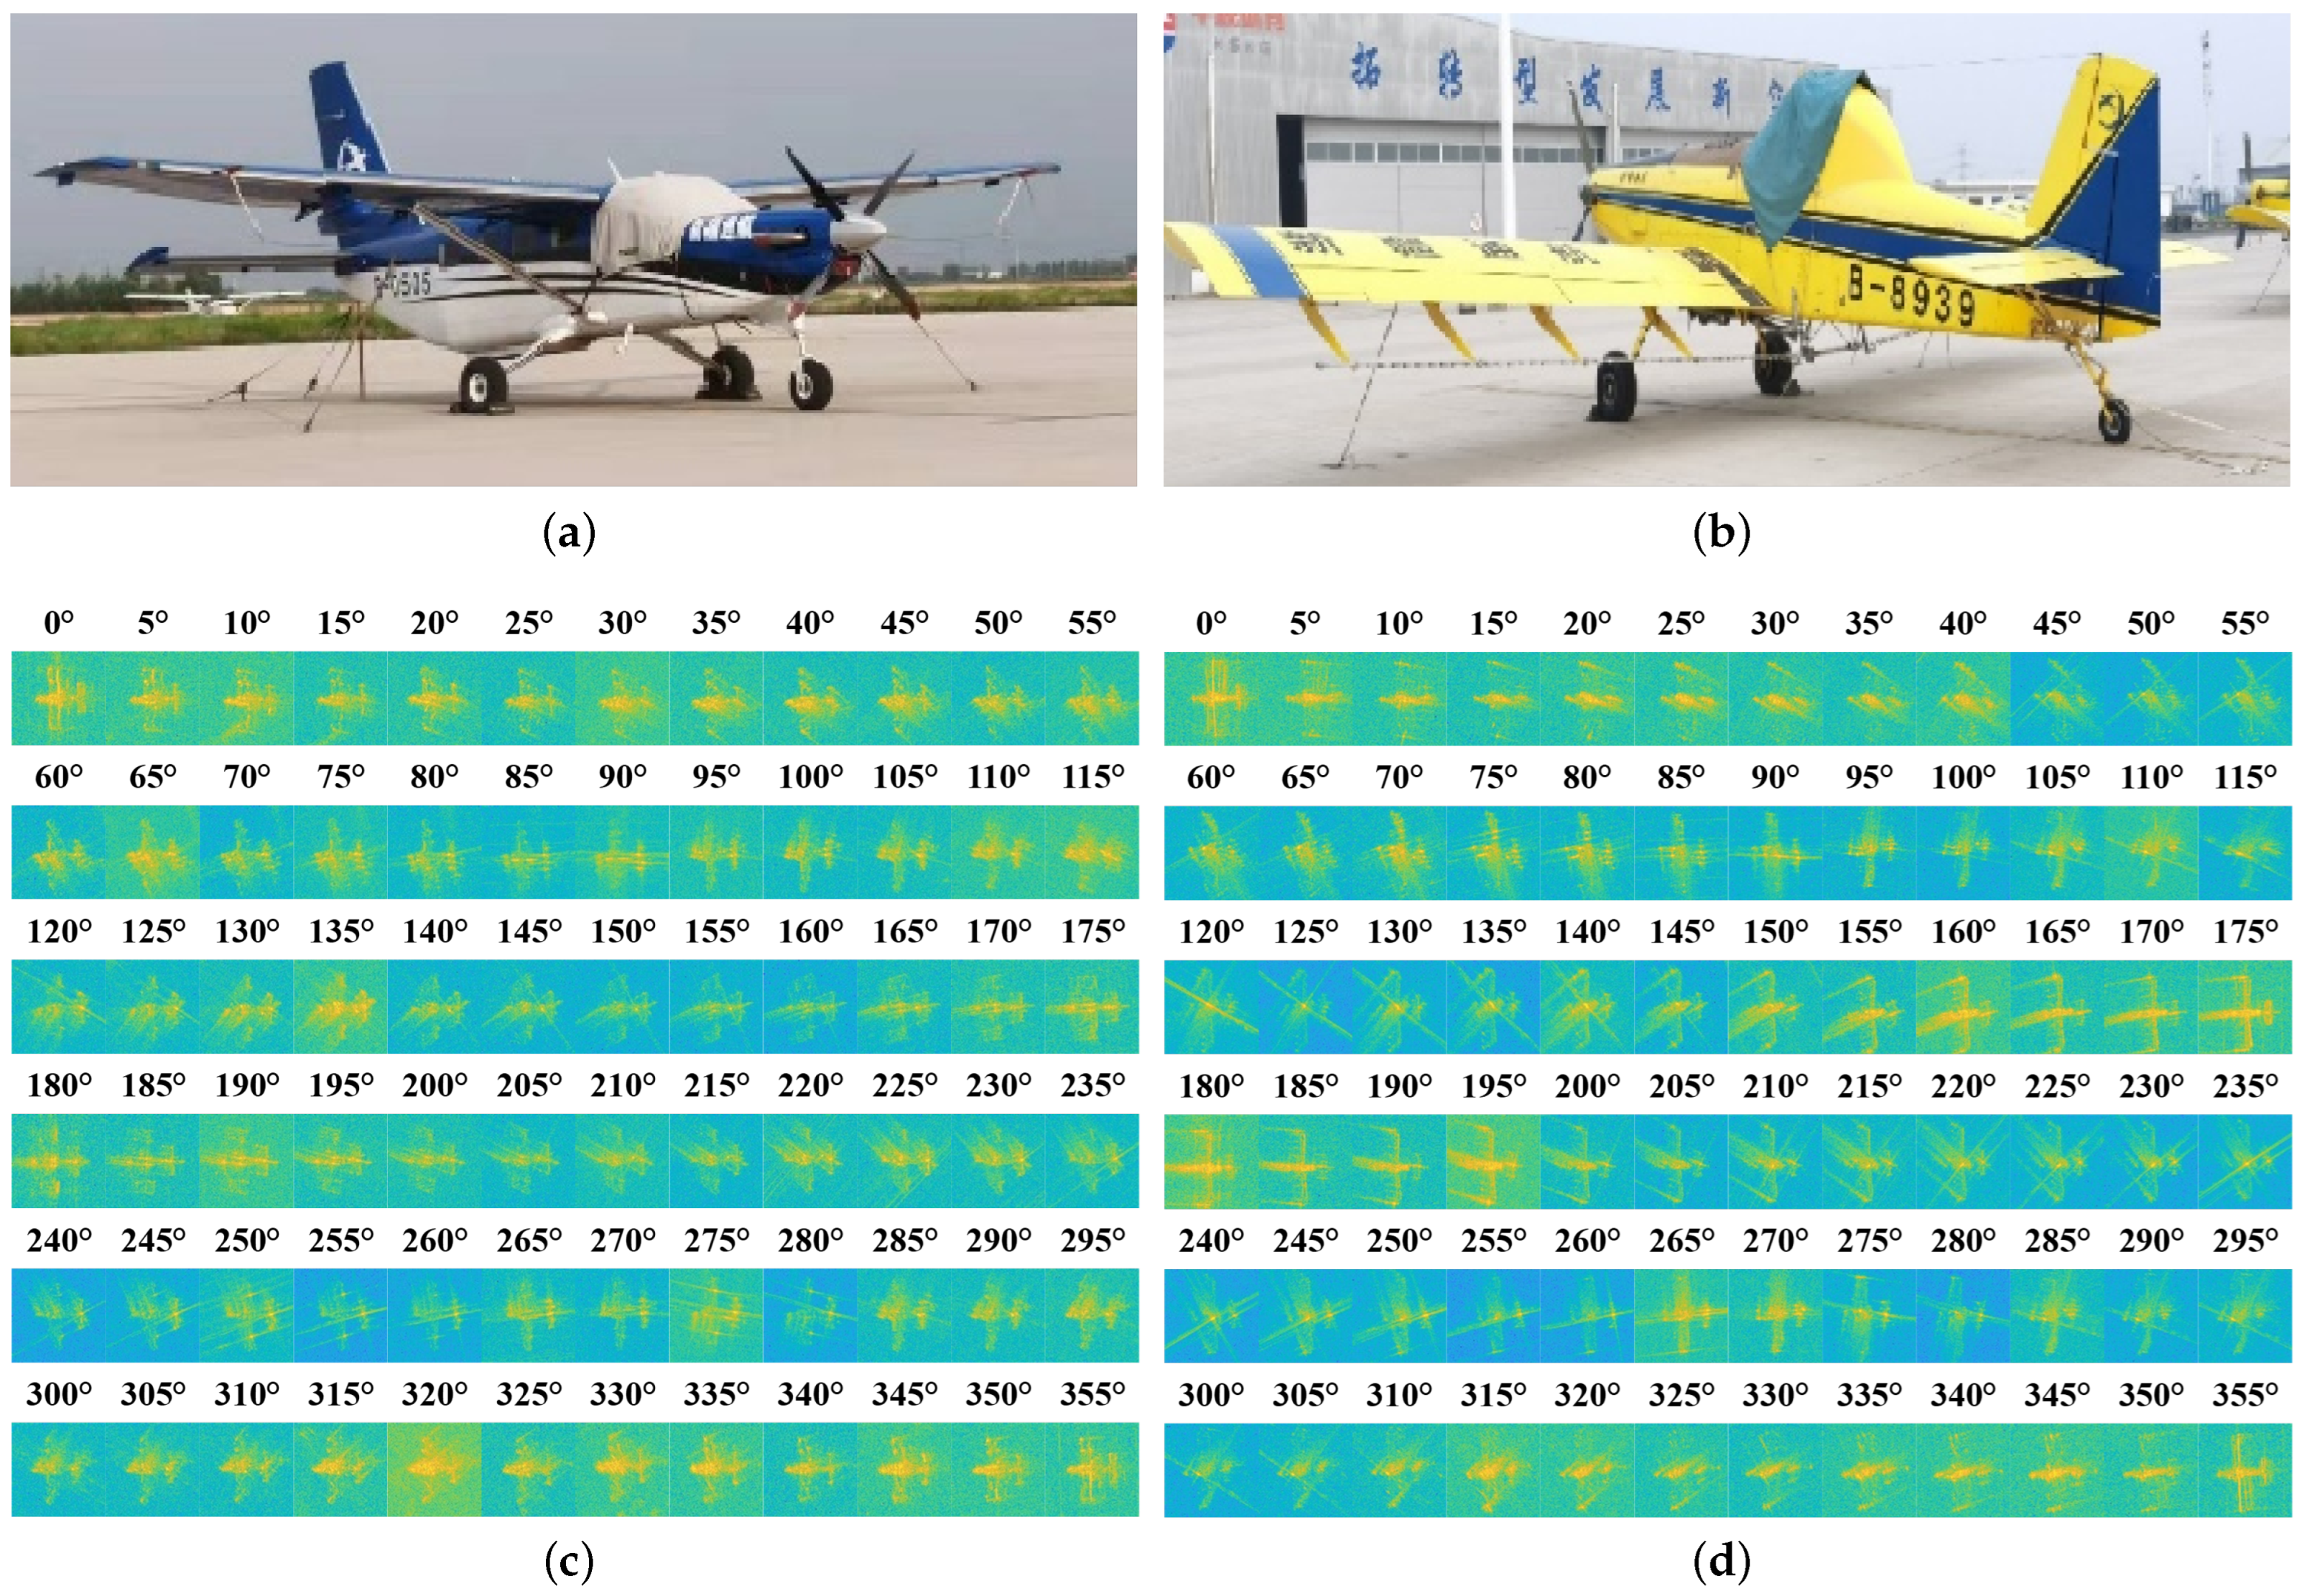
2.1. Dataset Description

The dataset used in this paper was a Ku-band multi-aspect SAR dataset provided by Aerospace Information Research Institute, Chinese Academy of Sciences (AIRCAS). The data collection experiment was conducted by AIRCAS at Yaocheng Airport in Taiyuan, Shanxi Province, China in 2022. The flight platform selected was the KWT-X6L-15 multi-rotor UAV in this test, the SAR was observed with a right-side view and a look aspect of 45°, and the imaging method used was the strip imaging mode. The radar used was the 4 kg MiniSAR R/SYA4000Ku-T1 from AIRCAS. The operating parameters of the MiniSAR payload are shown in Table 1.
Figure 1a shows the flight route that was planned for the Quest 100 aircraft shown in Figure 1b as the center of the flight trace. The imaging mode used was strip imaging, and the flight mode used was the route calibration mode. Starting from the true north direction (0°), the interval between adjacent routes was 5°, that is, the 72 sampled aspects were 0°, 5°, 10°, 15°, …, 345°, 350°, 355°, and the look aspect of the radar and the radar transmit power were kept constant. The remote sensing image of the test area and the flight route planning image are shown in Figure 1a. Figure 1b shows the panoramic image of the airport at 0° and with the HH polarization after imaging using the BP algorithm [44,45,46].

2.2. Data Preprocessing

The primary target aircraft in this paper were the Quest 100 and T504S, which are the aircraft within the red and blue boxes in Figure 1b. Therefore, appropriate cropping ranges were planned for data slice processing of aircraft SAR images, that is, 400 pixels × 400 pixels for one sliced target aircraft’s SAR image. Figure 2a,b shows the photographs of the Quest 100 and T504S. The sliced dataset of SAR amplitude images of the two target aircraft are shown in Figure 2c,d.
The phase image of the target aircraft was wrapped. To simplify the experiment and make the SAR phase image exhibit clearer regularity, it was necessary to unwrap the SAR phase image [47,48]. Figure 3a,c show the wrapped SAR phase image with 3D and top views, while Figure 3b,d display the unwrapped SAR phase image with 3D and top views.
Assuming F is the SAR complex image matrix, L is the number of rows, S is the number of columns, ϕ is the unwrapped phase, and φ is the wrapped phase, the unwrapping for the mth row is
ϕ m S = ϕ m 0 + n = 0 S 1 ω Δ ω φ m n
where the wrapping operator ω π , π , m and n represent the ordinal number of the row and column, and the difference operator Δ is defined as
Δ ϕ m n = ϕ m n + 1 ϕ m n
The unwrapped SAR phase image dataset of the two target aircraft obtained is shown in Figure 4.

3. Methodology and Parameter Analysis

3.1. Scattering Analysis of Multi-Aspect SAR Amplitude Images

The sum of the squared amplitudes of targets in SAR images is the energy integral. There are a total of a observing aspects. If the energy distribution of targets from each observing aspect is within L × S pixels, and the energy integration of the ith aspect (i = 1, 2, …, a) in multi-aspect SAR images is R ( θ i ) , with θ being the set of observing aspects, in other words, θ = [ θ 1 , θ 2 , , θ a ] , then the curve of energy integration R ( θ ) with respect to the changing aspect is
R ( θ i ) = j = 1 L k = 1 S F j k ( θ i ) 2 R ( θ ) = v e c t o r R ( θ i ) i = 1 a
According to Equation (3), it can be inferred that the energy of a target from a certain aspect θ is the sum of the energies of each pixel from the aspect θ . Therefore, the energy integral curve of a target can be obtained by summing up the energies of individual pixels. This is akin to representing the entire target with an equivalent pixel, akin to the concept of a scattering center [26,49,50].
In this paper, the energy integral curves of each SAR amplitude image of aircraft targets were calculated according to Equation (3). In Figure 5, the energy integral curves with 72 aspects at 0°, 5°, …, 350°, 355° for both Quest 100 and T504S are plotted, along with energy integral curves with 36 aspects at 0°, 10°, …, 340°, 350° assuming partial data are unsampled.
Equation (3) mainly focuses on the integration of scattering energy and ignores the role of phase. Therefore, it can be reasonably extended to complex numbers to form vector integration. The dataset in this paper was based on imaging using the BP algorithm, so the BP imaging principle was used to estimate the vector integration [46]. By accumulating the scattering center, the accumulated complex-amplitude-value vector integration’s scattering information sequence [51] is approximately
R c ( θ i ) = j = 1 L k = 1 S F j k ( θ i ) R c ( θ ) = v e c t o r R c ( θ i ) i = 1 a
wherein the vector integration of the ith aspect in the multi-aspect is R c ( θ i ) , and the curve of vector integration with changing aspects is R c ( θ ) .
The target energy integral curve can reflect the relative relationships between the energy integrals of the target from different aspects. Comparing Figure 5a,c with Figure 5b,d, it can be observed that while the latter pair has contours similar to the former, there are still significant differences in curve variations and details. In subsequent experiments, the image data of the latter are used as the dataset to perform multi-aspect interpolation using MS-CGAN on, achieving aspect complement of the target energy integral curves, demonstrating the multi-aspect interpolation capability of MS-CGAN at unsampled angles of aircraft targets.

3.2. MS-CGAN Model

For multi-aspect SAR images of typical aircraft targets, the MS-CGAN model is constructed for SAR image multi-aspect interpolation from different aspects. The network framework is shown in Figure 6. The network is divided into an input generation model, a generator model, a discriminator model, and a feedback model. Note that the model should input SAR image samples with fully closed-loop aspect information. Samples with non-closed-loop aspect information will be the focus of future work.

3.2.1. Modeling of the PSIS

The input of MS-CGAN is different from the random noise input of a general GAN. Instead, it is composed of pseudo-random scattering information sequences formed by the random interpolation of random noise to prior scattering information. Essentially, the noise information is still random, but the input sequence contains scattering information observed from multiple aspects. The construction process of the PSIS is shown in Figure 7.
An image set composed of SAR images from m observing aspects forms an anisotropic scattering integral sequence representing the real SAR images through the vector integral of Equation (4). Then, the random noise sequence is randomly inserted into the integral sequence to form a PSIS, which is used as the input to the network.
The purpose of randomly distributing random noise in the real scattering information sequence is to make the scattering distribution of the final generated interpolated SAR image more similar to the distribution of the real SAR image at the desired aspect.
Assuming that the generated interpolated SAR image, F G , can well simulate the actual SAR image, F * , i.e., it can estimate the real SAR image’s scattering distribution p * f . However, in reality, it is impossible to take all subset pixels or subset scattering information of the ideal actual SAR image F * , so one can only obtain the scattering distribution p f corresponding to a limited subset of pixels. Thus, the goal becomes to obtain a distribution p G f that is close to p f . If the similarity of the distribution [52] is measured by the Kullback–Leibler divergence, then we have
(5) D K L p p = i p f i log p f i p G f i (6) = i p f i log p f i i p f i log p G f i (7) = H p f + i p f i log p G f i
Here, D K L is the Kullback–Leibler divergence, and H(·) is the entropy function. From Equation (5), it can be seen that in order to make p G close to p , the Kullback–Leibler divergence needs to be minimized. The optimization objective function changes as follows:
m i n D K L p p = m i n i p f i log p G f i = m a x H p f log p G f
That is, to maximize the cross entropy of p G and p , when there is scattering information in the random noise, we have
m i n D K L p p = m i n i p f i log p G f i f 0 = m a x H p f log p G f f 0
The existence of prior scattering information f 0 makes the probability distribution of p G less random and more deterministic, therefore
p G f < p G f f 0 log p G f < log p G f f 0
It makes the aim H p f i log p G f f 0 improve. Therefore, when there is scattering information in the random noise, it is more beneficial for the final generated interpolated SAR image to converge to the target distribution p .

3.2.2. Generator Model

The structure of the generator model G is shown in the middle part of Figure 6.
The first five blocks are composed of transposed convolution, batch normalization, and the Rectified Linear Unit (ReLU) activation function, where the expression of the ReLU function is
f R e L U x = x , x 0 0 , x < 0 = m a x 0 , x
The ReLU function can accelerate the convergence speed of the network and avoid the problem of vanishing gradient to a certain extent, but if the input of the ReLU function is non-positive, the vanishing gradient will appear again.
Afterwards, it goes through multiple linear transformation layers for feature enhancement and then into the residual network structure. Finally, it enters the convolution layer and the Tanh layer to produce the generator structure output.
The addition of the residual layer is mainly aimed at simplifying the learning process, enhancing gradient propagation, and enhancing the network’s generalization ability [53]. Considering the early layers of the network are almost all composed of convolution, batch normalization, and ReLU functions, they are represented as
a c = c x , ω c b = b c l = l b
wherein c(·) represents the convolution operation, b(·) represents the batch normalization operation, and l(·) represents the ReLU operation. It can then be shown that the derivative of the loss function loss with respect to c is
d l o s s d c = d c d ω c × d b d c × d l d b × d l o s s d l
From Equation (13), it can be seen that if the derivative of an intermediate term is extremely small, the gradient vanishes after multiple small gradients are multiplied continuously. This leads to a very limited effective gradient value from the deep network near the output end to the shallow network at the input end, making the entire network unable to update effectively. After adding the residual layer, the loss function at the output end accumulates the scattering information at different times. At this time, the derivative of the loss function with respect to c contains an identity term o, which is
d l o s s d c = d c d ω c × d b d c × d l d b × d l o s s d l + o
Therefore, by adding a residual layer and enhancing gradient propagation, the network can always backpropagate effectively, enabling the scattering information injected into the network to continuously play its due role.

3.2.3. Discriminator Model

The discriminator model D, as shown at the bottom of Figure 6, is essentially a binary classifier. The discriminator of this paper has two input ends. One receives interpolated SAR images generated by the generator model G and then determines whether the image is true or false. The other receives feedback information from the feedback model, mainly used to optimize its own discrimination ability and understand the final actual judgment results of the images generated by the generator model G.
The discriminator model D consists of eight blocks. Each block is made up of convolution, instance normalization, and the Leaky ReLU activation function. The Leaky ReLU function is represented as
f L e a k y R e L U x = x , x 0 α x , x < 0
where α is the slope of the Leaky ReLU.
The output of the discriminator model D is the judgment result of the discriminator after the input of the interpolated SAR image generated by the generator model G, that is, the credibility d = D ( F ) R of the SAR image input to this model, where R is the set of real numbers. When the credibility d 1 , + , it means that the discriminator considers the input image to be a real SAR image. When the credibility d , 1 , it means that the discriminator considers the input image to be an interpolated SAR image. When the credibility d 1 , 1 , the judgment result of the input SAR image is uncertain.

3.2.4. Feedback Model

The feedback model consists of the domain module and the correlation assessment module, and its main function is to carry out the correlation evaluation of the interpolated SAR images identified as true by the discriminator and the real SAR images and then feed the assessment results back to the interpolated network. As for the assessment of interpolated SAR images, it is divided into the quality assessment of interpolated SAR amplitude images and SAR phase images, and the assessment parameters are explained in detail in Section 3.3.

3.3. Assessment Parameters

3.3.1. Quality Assessment of Interpolated SAR Amplitude Images

This paper used the correlation coefficient and Mean Square Error (MSE) to evaluate the similarity between interpolated SAR amplitude images and real SAR amplitude images.
The mean value μ F most directly describes the average backscatter characteristics of SAR images and is defined as
μ F = 1 L S i = 1 L j = 1 S F i j
F is the SAR image matrix, L is the number of rows, and S is the number of columns. The variance σ F 2 reflects the degree of unevenness in the distribution of scattering information and is defined as
σ F 2 = 1 L S i = 1 L j = 1 S μ F F i j 2
Linear vector interpolation is an efficient and simple interpolation method that involves vector operations on SAR images from known coherent aspects to interpolate SAR images from unsampled aspects. The linear vector interpolation relationship of SAR images is
F θ 1 + Δ θ 0 = i = 1 m c i F θ 1 + i 1 Δ θ
c is the linear vector interpolation constant coefficient, m is the number of observing aspects used for calculating the anisotropic entropy, θ 1 is the first aspect used for calculating the anisotropic entropy, Δ θ is the aspect interval used for calculating the anisotropic entropy, and Δ θ 0 is the interpolated aspect interval.
To calculate the correlation between the interpolated SAR image and the real SAR image, the correlation coefficient ρ is used to measure the linear correlation between the two images, and its expression is given by
ρ F in , F real = 1 L S 1 i = 1 L j = 1 S F in i j μ F in σ F in F real i j μ F real σ F real
F in and F real represent the interpolated image and the real image, respectively. μ F in and σ F in are the mean and standard deviation of F in , while μ F real and σ F real are the mean and standard deviation of F real . The higher the similarity between two images, the closer to 1 the correlation coefficient ρ . Figure 8 shows the schematic diagram of the linear vector interpolation and correlation evaluation parameter. The MSE is typically defined as follows:
M S E F in , F real = 1 L S l = 1 L s = 1 S F real l , s F in l , s 2

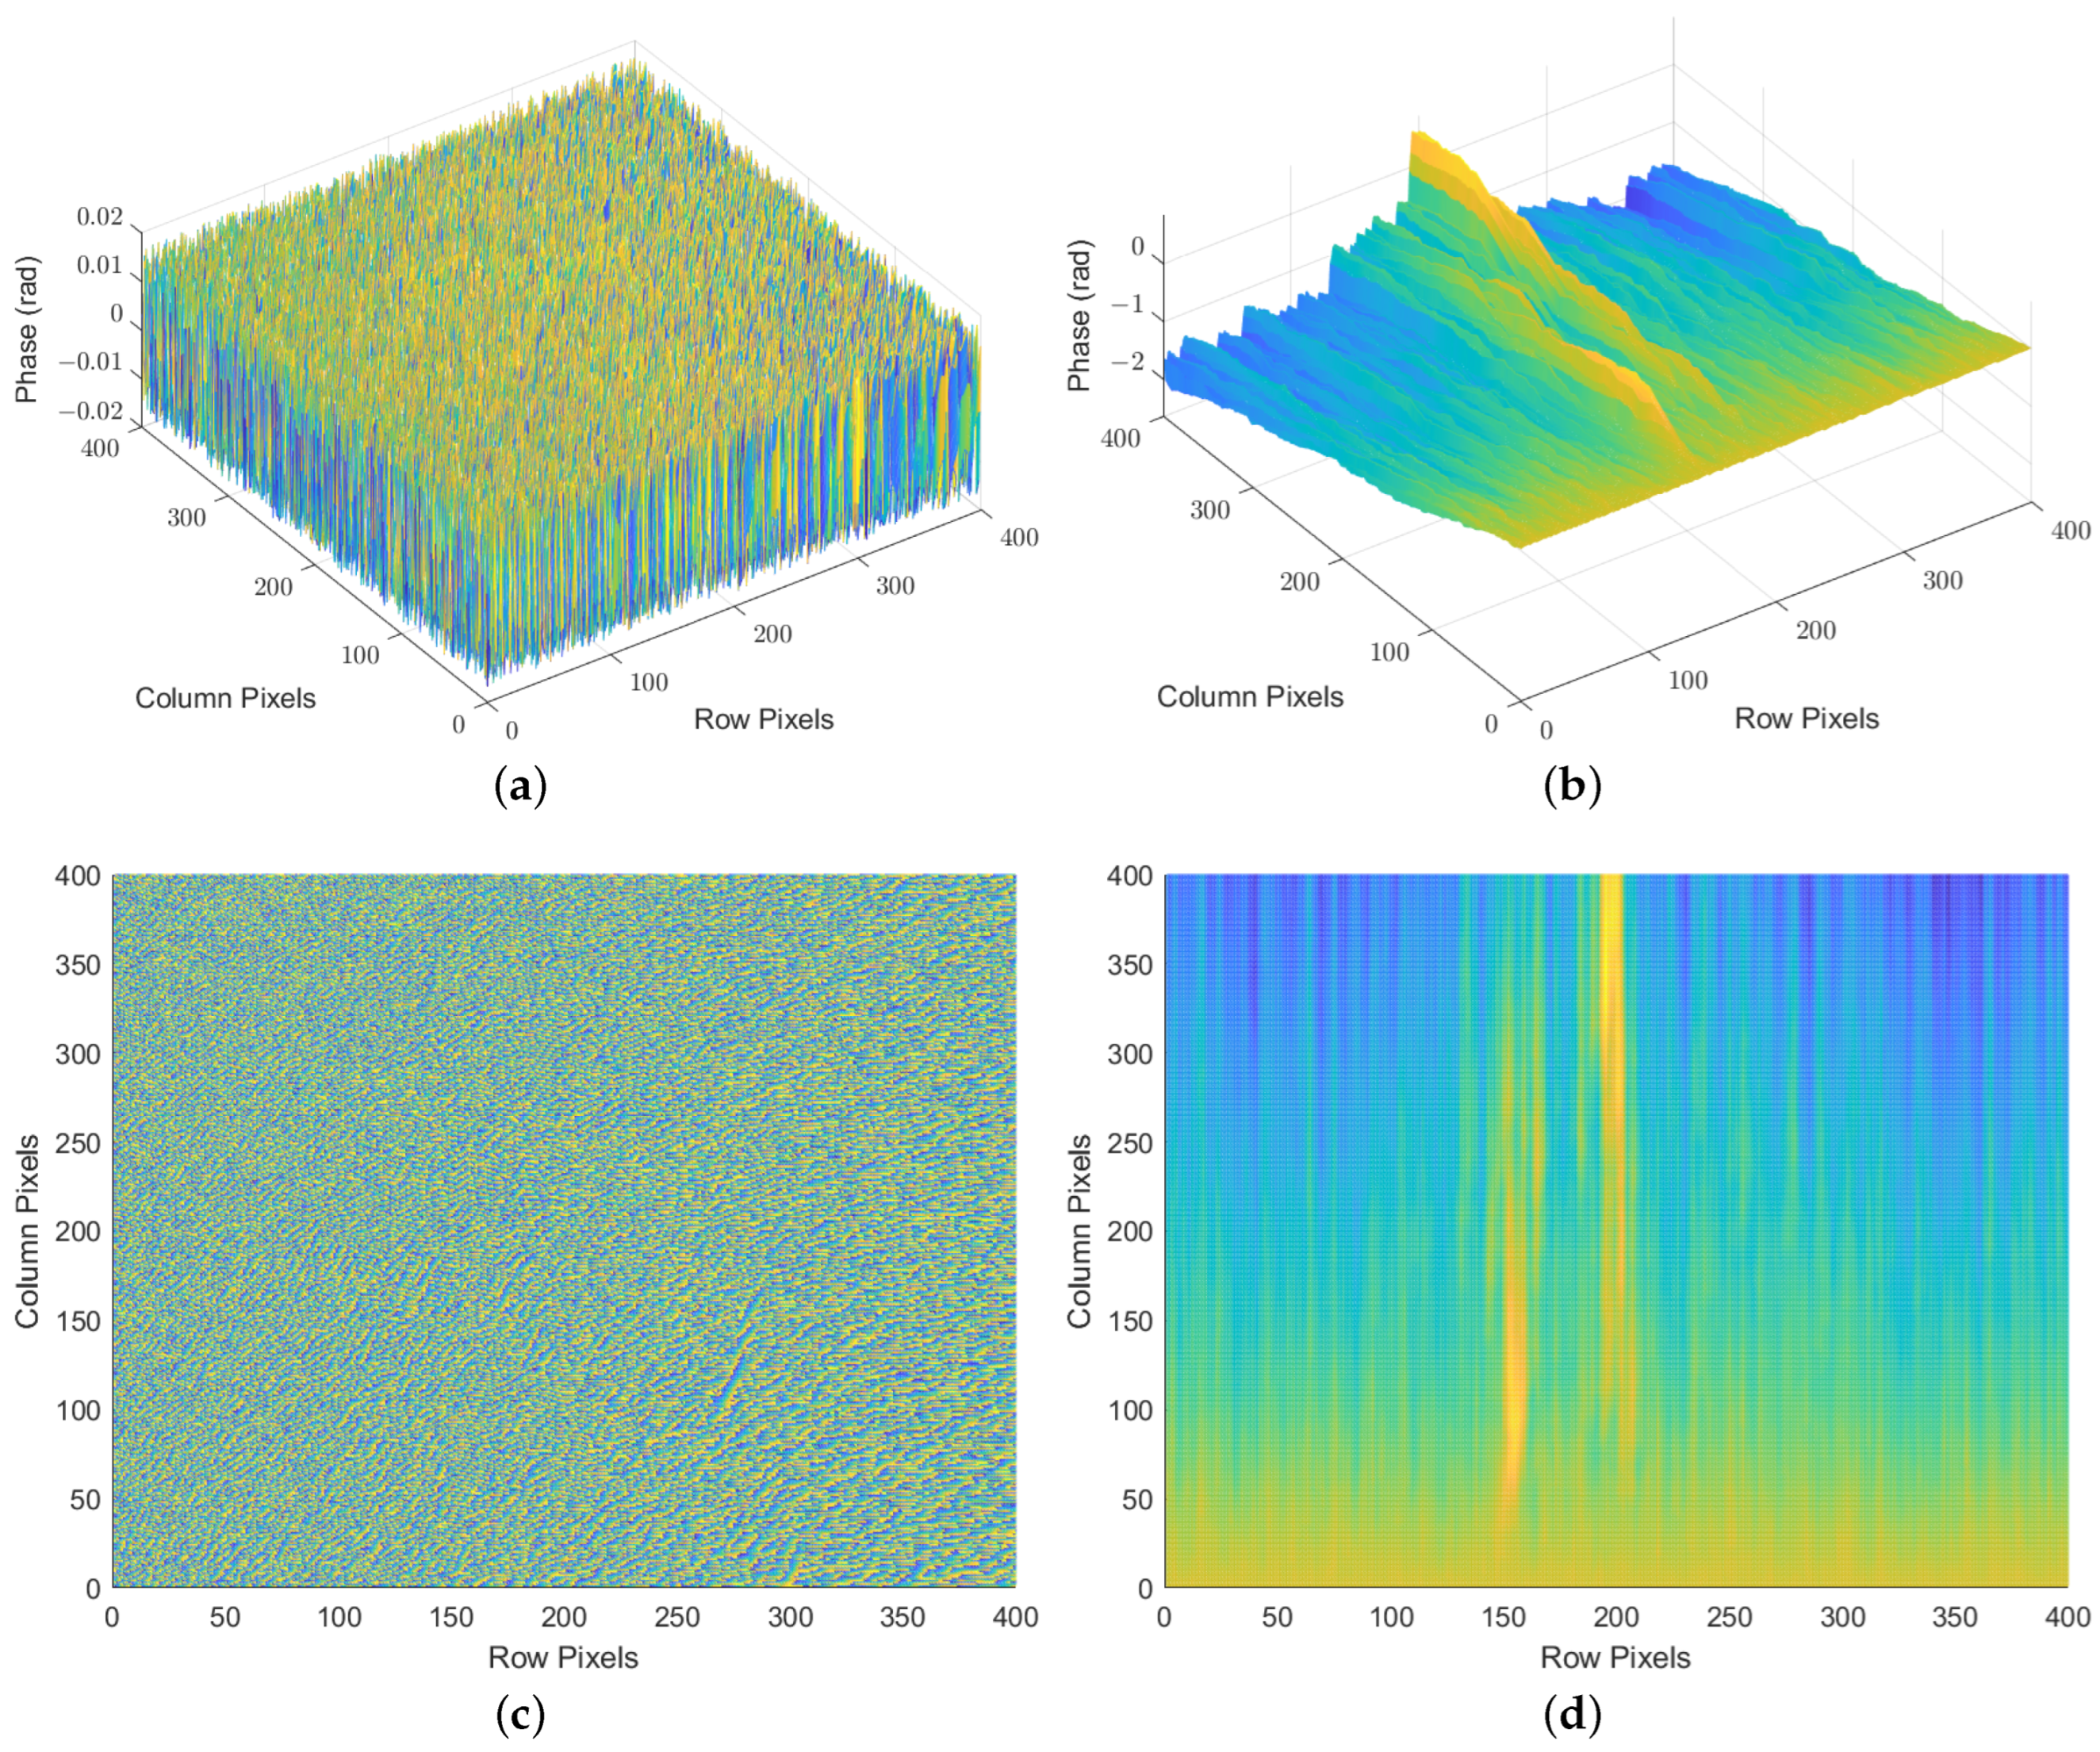
3.3.2. Quality Assessment of Interpolated SAR Phase Images

For the quality assessment of interpolated SAR phase images, we custom-defined the phase correlation for evaluation. Let ϕ in and ϕ real be the phase matrices of F in and F real , where the elements represent the phase information in radians or degrees. The phase correlation is defined as follows:
r ϕ = 1 i = 1 L j = 1 S ϕ in ϕ real i j L S m a x ϕ in , ϕ real m i n ϕ in , ϕ real
r ϕ 0 , 1 and as r ϕ approaches 1, the similarity between the two phase images increases. Since this operation involves phase calculations, we can express each element in ϕ in and ϕ real in exponential form as follows:
ω f i j = e j ϕ f i j
ω is the exponential form of ϕ , j 2 = 1 , and f is F in or F real ; in this case, Equation (21) can also be defined as
r ω = 1 L S 2 i = 1 S j = 1 S ω F in H ω F real i j = e j ω
H represents the conjugate transpose, and r ω is similar to a unit circle with radius r ω = 1 . When r ω approaches e j 0 , the similarity between the two phase images increases. Alternatively, considering its mapping onto the horizontal axis, c o s ω 1 , 1 . As c o s ω approaches 1, the similarity between the two phase images increases. When c o s ω = 1 , it indicates that the two phase images are completely out of phase.
To validate the effectiveness of the aforementioned custom-defined phase correlation, the phase coherence coefficient ρ ϕ in interferometric SAR was used for auxiliary verification [54]:
ρ ϕ = 1 E ln ω F in H ω F real E ln ω F in 2 E ln ω F real 2
where ln(·) is a logarithmic function with base e, and E(·) is an expectation function.

4. Experiment and Results

4.1. Experiment and Analysis of the Effectiveness of MS-CGAN

4.1.1. Experimental Design

To compare the performance of the MS-CGAN interpolation method proposed in this paper, the following sets of control experiments were conducted. The interpolated SAR images obtained from traditional interpolation methods and GAN-based intelligent interpolation methods were compared with sampled real SAR images, as shown in Table 2. Recall that this paper only considered the situation where the inputs are SAR image samples with fully closed-loop aspect information.
In this paper, the experiments for each type of aircraft were divided into three main parts, assuming different levels of data missingness. Linear vector interpolation method, DCGAN interpolation method, SAGAN interpolation method, and our method, the MS-CGAN interpolation method, were used to interpolate the assumed missing data separately, and then the interpolation results were compared.
Here is an explanation of the selection of these interpolation methods:
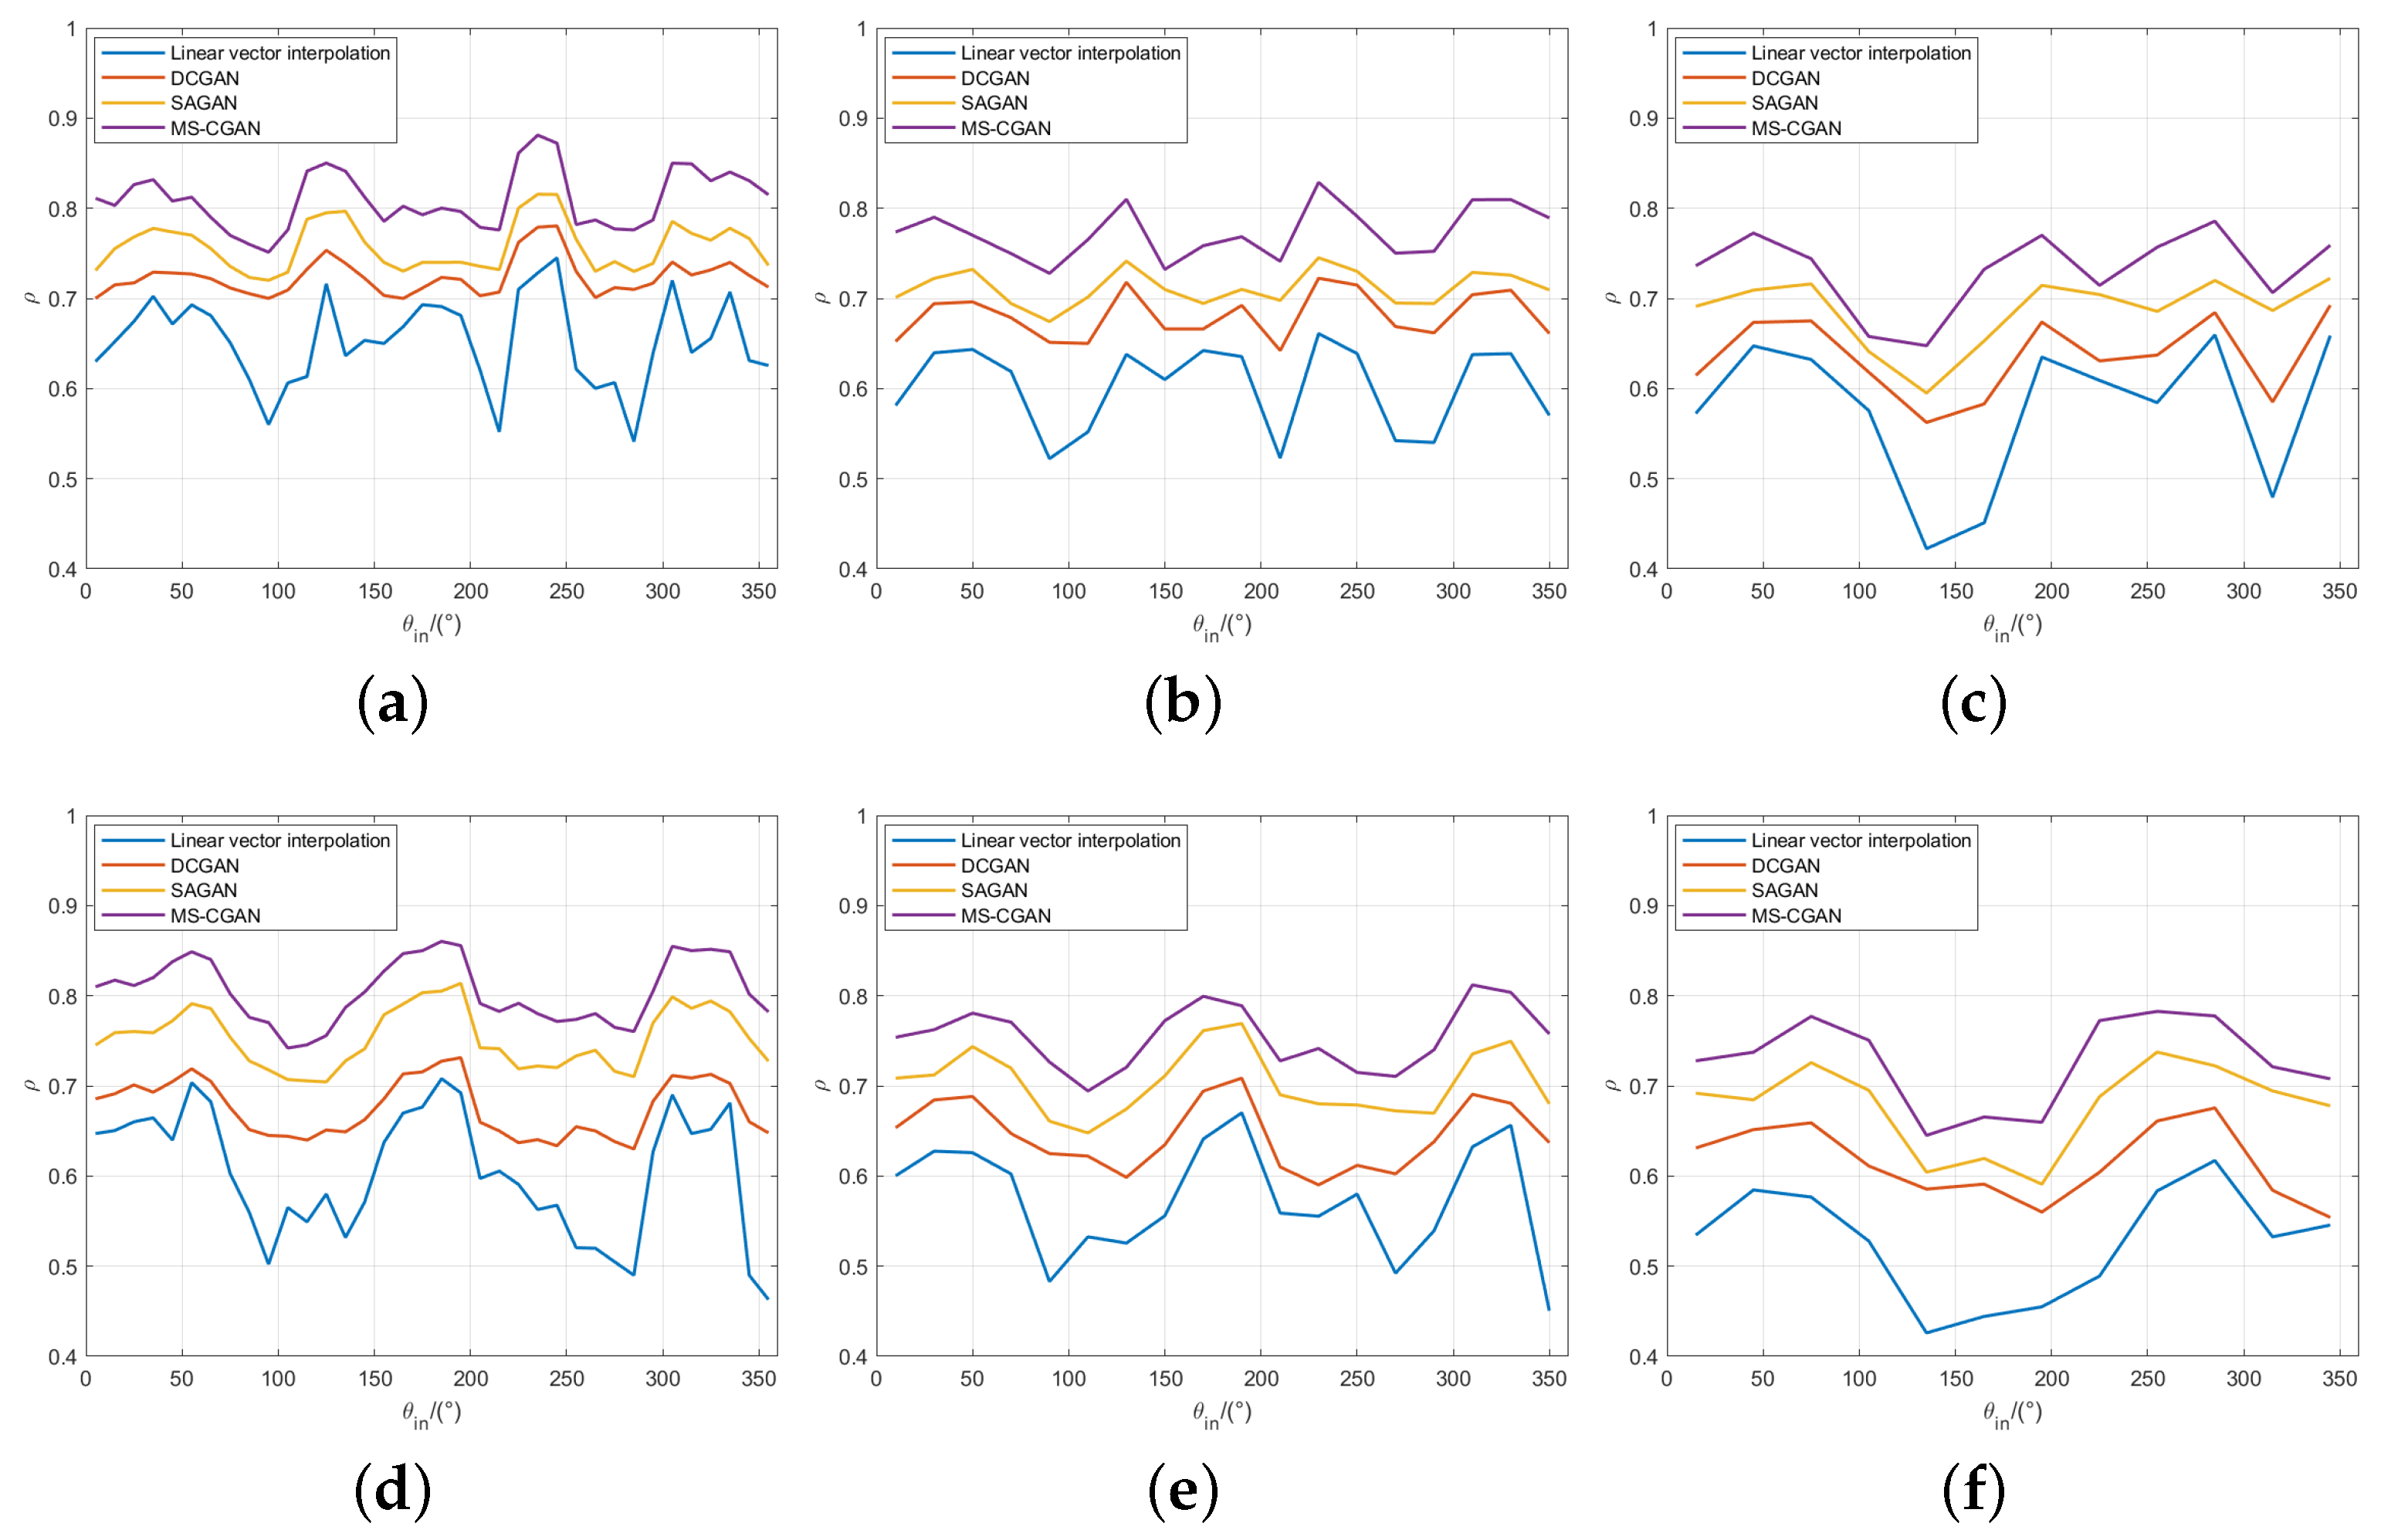
  • The linear vector interpolation method [20] is commonly used in engineering and is practical and simple, making it the most widely used traditional multi-aspect interpolation method.
  • The DCGAN interpolation method [22] represents traditional GAN intelligent multi-aspect interpolation methods. Although it is an early GAN model, it still plays a significant role in the ongoing updates and iterations of various intelligent multi-aspect interpolation methods.
  • The SAGAN interpolation method [26] is part of a new trend of multi-aspect interpolation methods, known for its novelty.
It is worth mentioning that DCGAN and SAGAN are inherently used for multi-aspect interpolation of quantized SAR amplitude images without phase, and they do not have modules for generating unquantized SAR amplitude images or SAR phase images. However, in order to address the significant issue of missing scattering information in quantized SAR amplitude images, as well as to ensure identity in the experimental input data and consistency in the dimensions of the interpolation results, in our experiments, we concatenated the unquantized SAR amplitude image and SAR phase image datasets and input them into DCGAN and SAGAN for multi-aspect interpolation. Therefore, the effectiveness of these methods may not be ideal.
Both the generator model and the discriminator model utilized the Adam optimizer, with hyperparameters set to β 1 = 0.5 and β 1 = 0.9 , and the learning rate was set to 0.00001.

4.1.2. Analysis of Experimental Results

Analysis of Results Based on Assessment Parameters

Table 3 and Table 4 show the visual presentation effects and corresponding assessment parameters of the interpolated SAR images obtained using the datasets of Quest 100 and T504S, respectively, under different missing aspect conditions, using the multi-aspect interpolation methods of linear interpolation, DCGAN, SAGAN, and MS-CGAN; the subfigures in Table 3 and Table 4 display interpolated SAR images for two specific aspects, with each row showing images from the same aspect. Figure 9 is the correlation coefficient of the interpolated SAR image and the corresponding real SAR image, and the correlation coefficient in Table 3 and Table 4 is the mean of each curve shown in Figure 9. Similarly, the MSE, phase correlation, and phase coherence coefficient in Table 3 and Table 4 are also means. The trends of the phase correlation and the phase coherence coefficient are shown in Figure 10 and Figure 11, respectively. The trends of the correlation coefficient, phase correlation, and phase coherence coefficient were very similar, so the focus was on the correlation coefficient for the detailed discussion and analysis, and the other two were not elaborated upon. In the subfigures of Table 3 and Table 4, the first row displays the interpolated SAR amplitude images, while the second row shows their corresponding interpolated SAR phase images.
By observing Table 3 and Table 4, it can be seen that as the quantity of experimental data decreased (from Experiment ONE to Experiment TWO, and then to Experiment THREE), or as the number of assumed missing observing aspects increased, the correlation coefficient, phase correlation, and phase coherence coefficient of the interpolated SAR images generated by each method continuously decreased. However, the decrease in the data of the interpolated SAR images obtained by the MS-CGAN proposed in this paper was slow, and it could always be maintained within a good indicator range. Moreover, when the number of missing aspects was lower, the unquantized interpolated SAR amplitude images and phase images obtained by the MS-CGAN multi-aspect interpolation method proposed in this paper achieved considerable effects, with correlation coefficient and phase correlation both exceeding 80%.
From Figure 12, it can be seen that MS-CGAN maintained a high correlation in different missing aspect situations. Even in severe missing aspect situations, MS-CGAN could still obtain interpolated SAR images with a high correlation coefficient from some aspects.
Furthermore, it can be seen that the size of the dataset also had a significant impact on the interpolation results of MS-CGAN. With the increase in experimental training data, the MS-CGAN proposed in this paper could learn the overall scattering features of typical aircraft targets better. The contours of the targets and the strong scattering points in the interpolated SAR images became clearer, the phase could be better aligned, and the correlation with the amplitude and phase of the interpolated and corresponding real SAR images became higher and higher.

Complement of Aspects of the Target Energy Integral Curve

Using the interpolated SAR images in Experiment ONE, we calculated the energy integration, completing the missing aspects, that is, completing the missing aspects in Figure 5b,d. After complementing, we compared it with the energy integration curves of Figure 5a,c. The comparison of the energy integration curve of the completed aspects and the energy integration curve of Figure 5a,c is shown in Figure 12. The red solid line represents the real energy integration curve of the dataset, and the blue dashed line represents the energy integration curve completed by the interpolated SAR image obtained by MS-CGAN after missing half of the aspect information; so do the completed curves for other multi-aspect interpolation methods.
From Figure 12, it can be seen that in most areas, the red solid line and the blue dashed line match well, indicating that there is a very high correlation between the interpolated image and the corresponding real image. This also proves that it is feasible to use MS-CGAN for SAR image multi-aspect interpolation when some aspects are missing.
It is not difficult to see that MS-CGAN completes the scattering information most excellently and is clearly superior to the other methods from Figure 12.

4.2. Ablation Study on the PSIS

To demonstrate the effectiveness of the PSIS, we conducted an ablation study on MS-CGAN. In Section 4.1.1, Experiment ONE, Experiment TWO, and Experiment THREE were designed. In this section, an ablation study was carried out on MS-CGAN, using the PSIS and random noise sequences as separate inputs, and the results were compared.
Table 5 and Table 6 show the comparative results of Quest 100 and T504S under the conditions of Experiment ONE, Experiment TWO and Experiment THREE, using the PSIS and random noise sequences as inputs to MS-CGAN, respectively.
From Table 5 and Table 6, it is clear that the SAR image amplitude energy from the multi-aspect interpolation results without PSIS constraints did not converge well to the energy distribution of the real situation, and its correlation coefficient and other indicators also decreased correspondingly. Therefore, the experiments further demonstrated that inputting the PSIS, which contains scattering information, into the front end of MS-CGAN can make the multi-aspect interpolation results converge better to the real scattering information distribution.

5. Discussion

In this paper, the primary focus was on exploring a novel multi-aspect interpolation method to address the severe loss of scattering information caused by the absence of phase and amplitude quantization in intelligent network-based multi-aspect interpolation methods. Firstly, a multi-aspect SAR image dataset was constructed using sampled SAR images of typical aircraft target. Then, assuming the absence of SAR images from certain aspects, multi-aspect interpolation was performed using different multi-aspect interpolation methods. Subsequently, the missing aspects in the energy integration curves were complemented using interpolated SAR images generated by MS-CGAN. Finally, the quality of the interpolated SAR images produced by different multi-aspect interpolation methods was evaluated to demonstrate the superiority of the MS-CGAN-based multi-aspect interpolation method. The authenticity of the MS-CGAN-based multi-aspect interpolation method was verified by analyzing the correlation of the complemented energy integration curves.
The optimization potential for GAN-based multi-aspect interpolation technology is substantial, encompassing both the refinement of interpolation results and the enhancement of network efficiency.
Future research on intelligent multi-aspect interpolation methods should not be confined to the interpolation (or simulation) of quantized grayscale SAR amplitude images but should instead focus on the interpolation of SAR complex images. Interpolating SAR complex images inevitably introduces a challenge: the volume of input data to the network increases significantly. In the era of quantized grayscale downsampled SAR amplitude images, the input data for most datasets typically consist of an image with dimensions of 1 × 128 × 128 × 256, where 1 represents the amplitude dimension, 128 × 128 denotes the downsampled image size, and 256 signifies the amplitude quantization dimension. However, when investigating non-quantized SAR complex image interpolation methods with phase information, the input dataset must have dimensions of 2 × X × X × ∞, where 2 represents the amplitude and phase dimensions, X × X corresponds to the size of the cropped target image, and indicates no quantization (though standardization and normalization can be applied, ensuring that the relative relationships of image scattering power remain unchanged). Consequently, the increased volume of input data necessitates improvements in network performance and convergence efficiency.

6. Conclusions

For typical aircraft targets, this paper researched the construction of a multi-aspect SAR dataset through the collection of real data and used MS-CGAN to achieve multi-aspect interpolation of SAR images. After the dataset was constructed, it was assumed that SAR images of some aspects were missing, and the interpolated SAR images of MS-CGAN were used for a numerical analysis and to find the complement of missing aspects in the energy integration curve. The results of the quality assessment of the interpolated SAR images and the results after finding the complement of the missing aspects in the energy integration curve both proved the feasibility of MS-CGAN for multi-aspect interpolation. In the case of a sampling aspect interval of 10°, the mean correlation of the amplitude and phase of the interpolated SAR images and the corresponding real SAR images both reached over 80%. In the case of a sampling aspect interval of 20°, the mean correlation of the amplitude and phase of the interpolated SAR images and the corresponding real SAR images remained above 75%. In the case of a sampling aspect interval of 30°, the mean correlation of the amplitude and phase of the interpolated SAR images and the corresponding real SAR images reached around 70%. This method, which combines real data collection and intelligent simulation, is a new way to build and expand the multi-aspect SAR image dataset for typical aircraft targets and a new method for SAR image multi-aspect interpolation.
In addition, this paper proposed a custom-defined phase correlation and extended its exponential form. Through the phase coherence coefficient commonly used in interferometric SAR, the phase correlation proposed in this paper was corroborated and applied in the experiment, verifying the effectiveness of the 0phase correlation.
In this paper, the input data and model construction process of MS-CGAN did not consider the limitations of actual sample data, employing a relatively comprehensive perspective or conditions where aspect information could complete a loop. The experimental design involved inputting aspect information that was at the same aspect interval and where the aspects interconnected end-to-end. However, in reality, the aspect information of most samples is not comprehensive and often cannot form a closed loop. It typically only meets the sampling requirements of aspects adjacent to the target aspect, failing to achieve the full 360° aspect closed-loop sampling. Therefore, it is essential to focus future discussions on the multi-aspect interpolation capabilities of MS-CGAN (or more advanced networks) under conditions of non-closed-loop aspect information. Additionally, this paper focused solely on the discussion of typical aircraft targets and did not delve deeper into the applicability conditions for other typical targets.

Author Contributions

Conceptualization, S.W. and B.H.; methodology, S.W. and B.H.; software, S.W.; validation, S.W. and J.S.; formal analysis, S.W., B.H., J.S., J.W., Y.F. and Q.X.; investigation, S.W.; resources, B.H.; data curation, S.W.; writing—original draft preparation, S.W., B.H. and J.S.; writing—review and editing, S.W., B.H., J.S., J.W., Y.F. and Q.X.; visualization, S.W.; supervision, S.W. and B.H.; project administration, B.H.; funding acquisition, B.H. All authors have read and agreed to the published version of the manuscript.

Funding

This research was funded by Aerospace Information Research Institute, Chinese Academy of Sciences grant number E23D08010D.

Data Availability Statement

Data are contained within the article.

Acknowledgments

The authors would like to thank Wei Sun’s team from the Key Laboratory of Microwave Imaging Technology, Aerospace Information Research Institute, Chinese Academy of Sciences for providing the field flight data.

Conflicts of Interest

The authors declare that they have no known competing financial interests or personal relationships that could have appeared to influence the work reported in this paper.

References

  1. Chang, Y.L.; Chiang, C.Y.; Chen, K. SAR image simulation with application to target recognition. Prog. Electromagn. Res. 2011, 119, 35–57. [Google Scholar] [CrossRef]
  2. Goodfellow, I.; Pouget-Abadie, J.; Mirza, M.; Xu, B.; Warde-Farley, D.; Ozair, S.; Courville, A.; Bengio, Y. Generative adversarial networks. Commun. ACM 2020, 63, 139–144. [Google Scholar] [CrossRef]
  3. Mirza, M.; Osindero, S. Generative adversarial nets. In Proceedings of the 27th International Conference on Neural Information Processing Systems, Montrea, QC, Canada, 8–13 December 2014; Volume 2, pp. 2672–2680. [Google Scholar] [CrossRef]
  4. Wei, S.; Han, B.; Li, Y.; Hong, W.; Wan, J. Anisotropic Scattering Analysis of Typical Aircraft Target Structural Complexity in Multi-aspect SAR. IEEE Trans. Geosci. Remote Sens. 2024, 62, 5226617. [Google Scholar] [CrossRef]
  5. Wei, S.; Han, B.; Teng, F.; Sun, W.; Yang, J.; Hong, W. Analysis of SAR texture feature of anisotropic entropy based on Radon transform. In Proceedings of the CNSRP 2023—2023 Chinese National Symposium on Radio Propagation, Qingdao, China, 24–27 September 2023; pp. 575–578. [Google Scholar] [CrossRef]
  6. Li, G.; Wang, J.; Zhang, C.; Feng, B.; Gao, Y.; Yang, H. Review of SAR Image Simulation Methods. Comput. Eng. Appl. 2021, 57, 62–72. [Google Scholar] [CrossRef]
  7. Niu, S.; Qiu, X.; Lei, B.; Ding, C.; Fu, K. Parameter extraction based on deep neural network for SAR target simulation. IEEE Trans. Geosci. Remote Sens. 2020, 58, 4901–4914. [Google Scholar] [CrossRef]
  8. Asvestas, J.S. The physical optics method in electromagnetic scattering. J. Math. Phys. 1980, 21, 290–299. [Google Scholar] [CrossRef]
  9. Franceschetti, G.; Iodice, A.; Riccio, D.; Ruello, G. SAR raw signal simulation for urban structures. IEEE Trans. Geosci. Remote Sens. 2003, 41, 1986–1995. [Google Scholar] [CrossRef]
  10. Yan, H.; Zhang, L.; Lu, J.; Xing, X.; Li, S.; Yin, H. Frequency-dependent factor expression of the GTD scattering center model for the arbitrary multiple scattering mechanism. J. Radars 2021, 10, 370–381. [Google Scholar] [CrossRef]
  11. Munro, P.R.; Ignatyev, K.; Speller, R.D.; Olivo, A. The relationship between wave and geometrical optics models of coded aperture type x-ray phase contrast imaging systems. Opt. Express 2010, 18, 4103–4117. [Google Scholar] [CrossRef]
  12. Bhalla, R.; Ling, H.; Lee, S.W.; Hughes, J.A. Bistatic scattering center extraction using the shooting and bouncing ray technique. In Proceedings of the Algorithms for Synthetic Aperture Radar Imagery VI, Orlando, FL, USA, 5–9 April 1999; Volume 3721, pp. 612–619. [Google Scholar] [CrossRef]
  13. Chew, W.C.; Jin, J.M.; Lu, C.C.; Michielssen, E.; Song, J.M. Fast solution methods in electromagnetics. IEEE Trans. Antennas Propag. 1997, 45, 533–543. [Google Scholar] [CrossRef]
  14. Zou, B.; Zhang, L.; Kou, L.; Wei, T. Characteristic Analysis and Simulation of SAR Moving Targets. Radar Sci. Technol. 2008, 6, 116–122. [Google Scholar] [CrossRef]
  15. Yee, K. Numerical solution of initial boundary value problems involving Maxwell’s equations in isotropic media. IEEE Trans. Antennas Propag. 1966, 14, 302–307. [Google Scholar] [CrossRef]
  16. Harrington, R.F. The Method of Moments Applied to Aperture Problems. IEICE Proc. Ser. 1992, 7, 301–311. [Google Scholar] [CrossRef]
  17. Rokhlin, V. Rapid solution of integral equations of classical potential theory. J. Comput. Phys. 1985, 60, 187–207. [Google Scholar] [CrossRef]
  18. Song, J.; Lu, C.; Chew, W.; Lee, S. Fast Illinois solver code (FISC). IEEE Antennas Propag. Mag. 1998, 40, 27–34. [Google Scholar] [CrossRef]
  19. Weijie, X.; Jianjiang, Z. A raw signal simulator for bistatic SAR. Chin. J. Aeronaut. 2009, 22, 434–443. [Google Scholar] [CrossRef]
  20. Ivanenko, Y.; Vu, V.T.; Batra, A.; Kaiser, T.; Pettersson, M.I. Interpolation methods with phase control for backprojection of complex-valued SAR data. Sensors 2022, 22, 4941. [Google Scholar] [CrossRef]
  21. Guo, J.; Lei, B.; Ding, C.; Zhang, Y. Synthetic aperture radar image synthesis by using generative adversarial nets. IEEE Geosci. Remote Sens. Lett. 2017, 14, 1111–1115. [Google Scholar] [CrossRef]
  22. Zhang, M.; Cui, Z.; Wang, X.; Cao, Z. Data augmentation method of SAR image dataset. In Proceedings of the IGARSS 2018–2018 IEEE International Geoscience and Remote Sensing Symposium, Valencia, Spain, 22–27 July 2018; pp. 5292–5295. [Google Scholar] [CrossRef]
  23. Cui, Z.; Zhang, M.; Cao, Z.; Cao, C. Image data augmentation for SAR sensor via generative adversarial nets. IEEE Access 2019, 7, 42255–42268. [Google Scholar] [CrossRef]
  24. Sun, Z.; Xu, X. Simulation method of target SAR image based on spectral normalization generative adversarial network. Comput. Mod. 2020, 2020, 14–20. [Google Scholar] [CrossRef]
  25. Du, S.; Hong, J.; Wang, Y.; Qi, Y. A high-quality multicategory SAR images generation method with multiconstraint GAN for ATR. IEEE Geosci. Remote Sens. Lett. 2021, 19, 4011005. [Google Scholar] [CrossRef]
  26. Wang, R.; Zhang, H.; Han, B.; Zhang, Y.; Guo, J.; Hong, W.; Sun, W.; Hu, W. Multiangle SAR Dataset Construction of Aircraft Targets Based on Angle Interpolation Simulation. J. Radars 2022, 11, 637–651. [Google Scholar] [CrossRef]
  27. Gong, M.; Niu, X.; Zhang, P.; Li, Z. Generative adversarial networks for change detection in multispectral imagery. IEEE Geosci. Remote Sens. Lett. 2017, 14, 2310–2314. [Google Scholar] [CrossRef]
  28. Ao, D.; Dumitru, C.O.; Schwarz, G.; Datcu, M. Dialectical GAN for SAR image translation: From Sentinel-1 to TerraSAR-X. Remote Sens. 2018, 10, 1597. [Google Scholar] [CrossRef]
  29. Hughes, L.H.; Schmitt, M.; Zhu, X.X. Mining hard negative samples for SAR-optical image matching using generative adversarial networks. Remote Sens. 2018, 10, 1552. [Google Scholar] [CrossRef]
  30. Merkle, N.; Auer, S.; Müller, R.; Reinartz, P. Exploring the Potential of Conditional Adversarial Networks for Optical and SAR Image Matching. IEEE J. Sel. Top. Appl. Earth Obs. Remote Sens. 2018, 11, 1811–1820. [Google Scholar] [CrossRef]
  31. Niu, X.; Gong, M.; Zhan, T.; Yang, Y. A conditional adversarial network for change detection in heterogeneous images. IEEE Geosci. Remote Sens. Lett. 2018, 16, 45–49. [Google Scholar] [CrossRef]
  32. Lu, X.; Zhang, J.; Zhou, J. Remote sensing image translation using spatial-frequency consistency GAN. In Proceedings of the 2019 12th International Congress on Image and Signal Processing, BioMedical Engineering and Informatics (CISP-BMEI), Suzhou, China, 19–21 October 2019; pp. 1–6. [Google Scholar] [CrossRef]
  33. Wei, Y.; Li, Y.; Ding, Z.; Wang, Y.; Zeng, T.; Long, T. SAR parametric super-resolution image reconstruction methods based on ADMM and deep neural network. IEEE Trans. Geosci. Remote Sens. 2021, 59, 10197–10212. [Google Scholar] [CrossRef]
  34. Wang, L.; Zheng, M.; Du, W.; Wei, M.; Li, L. Super-resolution SAR Image Reconstruction via Generative Adversarial Network. In Proceedings of the 2018 12th International Symposium on Antennas, Propagation and EM Theory (ISAPE), Hangzhou, China, 3–6 December 2018; pp. 1–4. [Google Scholar] [CrossRef]
  35. Shi, X.; Zhou, F.; Yang, S.; Zhang, Z.; Su, T. Automatic target recognition for synthetic aperture radar images based on super-resolution generative adversarial network and deep convolutional neural network. Remote Sens. 2019, 11, 135. [Google Scholar] [CrossRef]
  36. Zheng, C.; Jiang, X.; Zhang, Y.; Liu, X.; Yuan, B.; Li, Z. Self-normalizing generative adversarial network for super-resolution reconstruction of SAR images. In Proceedings of the IGARSS 2019—2019 IEEE International Geoscience and Remote Sensing Symposium, Yokohama, Japan, 28 July–2 August 2019; pp. 1911–1914. [Google Scholar] [CrossRef]
  37. Pu, W. Deep SAR imaging and motion compensation. IEEE Trans. Image Process. 2021, 30, 2232–2247. [Google Scholar] [CrossRef]
  38. Asiyabi, R.M.; Datcu, M.; Nies, H.; Anghel, A. Complex-valued vs. real-valued convolutional neural network for polsar data classification. In Proceedings of the IGARSS 2022–2022 IEEE International Geoscience and Remote Sensing Symposium, Kuala Lumpur, Malaysia, 17–2 July 2022; pp. 421–424. [Google Scholar] [CrossRef]
  39. Zhang, Z.; Wang, H.; Xu, F.; Jin, Y.Q. Complex-Valued Convolutional Neural Network and Its Application in Polarimetric SAR Image Classification. IEEE Trans. Geosci. Remote Sens. 2017, 55, 7177–7188. [Google Scholar] [CrossRef]
  40. Yu, L.; Hu, Y.; Xie, X.; Lin, Y.; Hong, W. Complex-valued full convolutional neural network for SAR target classification. IEEE Geosci. Remote Sens. Lett. 2019, 17, 1752–1756. [Google Scholar] [CrossRef]
  41. Hua, Q.; Zhang, Y.; Wei, C.; Ji, Z. CV-RotNet: Complex-Valued Convolutional Neural Network for SAR three-dimensional rotating ship target recognition. In Proceedings of the IGARSS 2022–2022 IEEE International Geoscience and Remote Sensing Symposium, Kuala Lumpur, Malaysia, 17–22 July 2022; pp. 3552–3555. [Google Scholar] [CrossRef]
  42. He, Y.; Zhang, Y.; Chen, P.; Wang, J. Complex number domain SAR image fusion based on Laplacian pyramid. In Proceedings of the 2021 CIE International Conference on Radar (Radar), Haikou, China, 15–19 December 2021; pp. 306–309. [Google Scholar] [CrossRef]
  43. Huang, Z.; Datcu, M.; Pan, Z.; Lei, B. Deep SAR-Net: Learning objects from signals. ISPRS J. Photogramm. Remote Sens. 2020, 161, 179–193. [Google Scholar] [CrossRef]
  44. Feng, S.; Lin, Y.; Wang, Y.; Yang, Y.; Shen, W.; Teng, F.; Hong, W. DEM Generation With a Scale Factor Using Multi-Aspect SAR Imagery Applying Radargrammetry. Remote Sens. 2020, 12, 556. [Google Scholar] [CrossRef]
  45. Ponce, O.; Prats, P.; Rodriguez-Cassola, M.; Scheiber, R.; Reigber, A. Processing of Circular SAR trajectories with Fast Factorized Back-Projection. In Proceedings of the 2011 IEEE International Geoscience and Remote Sensing Symposium, Vancouver, BC, Canada, 24–29 July 2011; pp. 3692–3695. [Google Scholar] [CrossRef]
  46. Ulander, L.; Hellsten, H.; Stenstrom, G. Synthetic-aperture radar processing using fast factorized back-projection. IEEE Trans. Aerosp. Electron. Syst. 2003, 39, 760–776. [Google Scholar] [CrossRef]
  47. Yu, H.; Lan, Y.; Yuan, Z.; Xu, J.; Lee, H. Phase unwrapping in InSAR: A review. IEEE Geosci. Remote Sens. Mag. 2019, 7, 40–58. [Google Scholar] [CrossRef]
  48. Baek, W.K.; Jung, H.S. Phase unwrapping of SAR interferogram from modified U-net via training data simulation and network structure optimization. Remote Sens. Environ. 2024, 314, 114392. [Google Scholar] [CrossRef]
  49. Teng, F.; Hong, W.; Lin, Y. Aspect entropy extraction using circular SAR data and scattering anisotropy analysis. Sensors 2019, 19, 346. [Google Scholar] [CrossRef]
  50. Teng, F.; Lin, Y.; Feng, S.; Hong, W. A Man-Made Target Detection Method Based on Multi-Angular Phase Characteristic. In Proceedings of the 2021 IEEE International Geoscience and Remote Sensing Symposium IGARSS, Brussels, Belgium, 11–16 July 2021; pp. 5024–5027. [Google Scholar] [CrossRef]
  51. Gao, Y.; Li, Z.; Sheng, J.; Xing, M. Extraction method for anisotropy characteristic of scattering center in wide-angle SAR imagery. J. Electron. Inf. Technol. 2016, 38, 1956–1961. [Google Scholar] [CrossRef]
  52. Pérez-Cruz, F. Kullback-Leibler divergence estimation of continuous distributions. In Proceedings of the 2008 IEEE international symposium on information theory, Toronto, ON, Canada, 6–11 July 2008; pp. 1666–1670. [Google Scholar] [CrossRef]
  53. He, K.; Zhang, X.; Ren, S.; Sun, J. Deep residual learning for image recognition. In Proceedings of the IEEE conference on computer vision and pattern recognition, Las Vegas, NV, USA, 27–30 June 2016; pp. 770–778. [Google Scholar] [CrossRef]
  54. Guarnieri, A.M.; Prati, C. SAR interferometry: A “quick and dirty” coherence estimator for data browsing. IEEE Trans. Geosci. Remote Sens. 1997, 35, 660–669. [Google Scholar] [CrossRef]
Figure 1. The working scenario of the data acquisition experiment: (a) remote sensing images of airborne stripmap SAR multi-aspect test by AIRCAS in 2022. The red boundary outlines the planned flight route for the flight platform; (b) aircraft panoramic SAR image at 0° and with the HH polarization.
Remotesensing 17 01143 g001
Figure 2. Photographs: (a) Quest 100; (b) T504S. Multi-aspect SAR amplitude image sliced dataset: (c) Quest 100; (d) T504S.
Remotesensing 17 01143 g002
Figure 3. Wrapped and unwrapped SAR phase images, taking the SAR image of Quest 100 at 350° as an example: (a) wrapped phase 3D image; (b) unwrapped phase 3D image; (c) wrapped phase top-view image; (d) unwrapped phase top-view image.
Remotesensing 17 01143 g003
Figure 4. Unwrapped multi-aspect SAR phase image sliced dataset: (a) Quest 100; (b) T504S.
Remotesensing 17 01143 g004
Figure 5. Energy integral curve: (a) Quest 100 with 72 aspects; (b) Quest 100 with 36 aspects; (c) T504S with 72 aspects; (d) T504S with 36 aspects.
Remotesensing 17 01143 g005
Figure 6. The MS-CGAN framework.
Remotesensing 17 01143 g006
Figure 7. The construction process of the PSIS.
Remotesensing 17 01143 g007
Figure 8. Schematic diagram of linear vector interpolation and correlation. Here, F in represents the interpolated SAR image, F real represents the real SAR image, m is the number of observing aspects used for calculating the anisotropic entropy, c i (i=1, 2, …, m) is the linear vector interpolation constant coefficient, θ i (i=1, 2, …, m) is the ith aspect used for calculating the anisotropic entropy, and Δ θ 0 is the interpolated aspect interval.
Remotesensing 17 01143 g008
Figure 9. The correlation coefficient between the interpolated SAR amplitude images and the corresponding real SAR amplitude images in each interpolation method: (a) Quest 100 in Experiment ONE; (b) Quest 100 in Experiment TWO; (c) Quest 100 in Experiment THREE; (d) T504S in Experiment ONE; (e) T504S in Experiment TWO; (f) T504S in Experiment THREE.
Remotesensing 17 01143 g009
Figure 10. The phase correlation between the interpolated SAR phase images and the corresponding real SAR phase images in each interpolation method: (a) Quest 100 in Experiment ONE; (b) Quest 100 in Experiment TWO; (c) Quest 100 in Experiment THREE; (d) T504S in Experiment ONE; (e) T504S in Experiment TWO; (f) T504S in Experiment THREE.
Remotesensing 17 01143 g010
Figure 11. The phase coherence coefficient between the interpolated SAR phase images and the corresponding real SAR phase images in each interpolation method: (a) Quest 100 in Experiment ONE; (b) Quest 100 in Experiment TWO; (c) Quest 100 in Experiment THREE; (d) T504S in Experiment ONE; (e) T504S in Experiment TWO; (f) T504S in Experiment THREE.
Remotesensing 17 01143 g011
Figure 12. Aspect complement of the energy integration curve, taking Experiment ONE as an example: (a) Quest 100; (b) T504S.
Remotesensing 17 01143 g012
Table 1. Parameters of the Ku-band multi-aspect MiniSAR.
ParametersValue
Radar systemFMCW
Carrier frequency14.9 GHz
Bandwidth1.2 GHz
Polarization modeFull-polarization
Azimuth beamwidth
Range beamwidth20°
Flight height150 m
Table 2. Design of the control experiment.
Experiment NumberDatasetInterpolated SAR Images
Experiment
ONE
Linear vector interpolation [20]SAR images of targets from 36 different aspects:
0°, 10°, 20°, …, 340°, 350°
Interpolated SAR images of targets from 36 different aspects:
5°, 15°, 25°, …, 345°, 355°
DCGAN [22]
SAGAN [26]
MS-CGAN (Ours)
Experiment
TWO
Linear vector interpolation [20]SAR images of targets from 18 different aspects:
0°, 20°, 40°, …, 320°, 340°
Interpolated SAR images of targets from 18 different aspects:
10°, 30°, 50°, …, 330°, 350°
DCGAN [22]
SAGAN [26]
MS-CGAN (Ours)
Experiment
THREE
Linear vector interpolation [20]SAR images of targets from 12 different aspects:
0°, 30°, 60°, …, 300°, 330°
Interpolated SAR images of targets from 12 different aspects:
15°, 45°, 75°, …, 315°, 345°
DCGAN [22]
SAGAN [26]
MS-CGAN (Ours)
Table 3. Assessment parameter comparison of multi-aspect interpolation methods for Quest 100.
Assessment ParametersRealLinear Vector InterpolationDCGANSAGANMS-CGAN (Ours)
Experiment
ONE
Complex ImagesRemotesensing 17 01143 i001Remotesensing 17 01143 i002Remotesensing 17 01143 i003Remotesensing 17 01143 i004Remotesensing 17 01143 i005
ρ 1.00000.65220.72350.75770.8099
MSE (10−1)0.00000.39970.30900.26650.1056
r ϕ 1.00000.75230.72640.75410.8129
ρ ϕ 1.00000.71250.69040.72210.7878
Experiment
TWO
Complex ImagesRemotesensing 17 01143 i006Remotesensing 17 01143 i007Remotesensing 17 01143 i008Remotesensing 17 01143 i009Remotesensing 17 01143 i010
ρ 1.00000.60190.68050.71150.7732
MSE (10−1)0.00000.79630.41460.36800.1752
r ϕ 1.00000.62220.69130.72270.7853
ρ ϕ 1.00000.60130.67290.70050.7677
Experiment
THREE
Complex ImagesRemotesensing 17 01143 i011Remotesensing 17 01143 i012Remotesensing 17 01143 i013Remotesensing 17 01143 i014Remotesensing 17 01143 i015
ρ 1.00000.57720.63580.68650.7319
MSE (10−1)0.00002.83470.55390.46970.2093
r ϕ 1.00000.51250.62690.66100.7108
ρ ϕ 1.00000.49430.60970.64340.6862
Table 4. Assessment parameter comparison of multi-aspect interpolation methods for T504S.
Assessment ParametersRealLinear Vector InterpolationDCGANSAGANMS-CGAN (Ours)
Experiment
ONE
Complex ImagesRemotesensing 17 01143 i016Remotesensing 17 01143 i017Remotesensing 17 01143 i018Remotesensing 17 01143 i019Remotesensing 17 01143 i020
ρ 1.00000.60280.67530.75290.8061
MSE (10−1)0.00000.42130.34750.27390.1377
r ϕ 1.00000.67190.67340.72180.8019
ρ ϕ 1.00000.66020.65730.70100.7796
Experiment
TWO
Complex ImagesRemotesensing 17 01143 i021Remotesensing 17 01143 i022Remotesensing 17 01143 i023Remotesensing 17 01143 i024Remotesensing 17 01143 i025
ρ 1.00000.57380.64540.70360.7543
MSE (10−1)0.00000.74100.45450.38990.1794
r ϕ 1.00000.58580.65410.67580.7777
ρ ϕ 1.00000.54990.64130.65270.7507
Experiment
THREE
Complex ImagesRemotesensing 17 01143 i026Remotesensing 17 01143 i027Remotesensing 17 01143 i028Remotesensing 17 01143 i029Remotesensing 17 01143 i030
ρ 1.00000.52640.61400.67770.7270
MSE (10−1)0.00002.59120.70290.69270.2233
r ϕ 1.00000.49640.58010.62710.7130
ρ ϕ 1.00000.47160.55990.60130.6976
Table 5. Ablation study on the PSIS for Quest 100.
Assessment ParametersRealMS-CGAN With PSISMS-CGAN Without PSIS
Experiment
ONE
Complex ImagesRemotesensing 17 01143 i031Remotesensing 17 01143 i032Remotesensing 17 01143 i033
ρ 1.00000.80990.7309
MSE (10−1)0.00000.10560.1593
Experiment
TWO
Complex ImagesRemotesensing 17 01143 i034Remotesensing 17 01143 i035Remotesensing 17 01143 i036
ρ 1.00000.77320.7166
MSE (10−1)0.00000.17520.2371
Experiment
THREE
Complex ImagesRemotesensing 17 01143 i037Remotesensing 17 01143 i038Remotesensing 17 01143 i039
ρ 1.00000.73190.6403
MSE (10−1)0.00000.20930.3085
Table 6. Ablation study on the PSIS for T504S.
Assessment ParametersRealMS-CGAN With PSISMS-CGAN Without PSIS
Experiment
ONE
Complex ImagesRemotesensing 17 01143 i040Remotesensing 17 01143 i041Remotesensing 17 01143 i042
ρ 1.00000.80610.7406
MSE (10−1)0.00000.13770.1787
Experiment
TWO
Complex ImagesRemotesensing 17 01143 i043Remotesensing 17 01143 i044Remotesensing 17 01143 i045
ρ 1.00000.75430.6966
MSE (10−1)0.00000.17940.2403
Experiment
THREE
Complex ImagesRemotesensing 17 01143 i046Remotesensing 17 01143 i047Remotesensing 17 01143 i048
ρ 1.00000.72700.6410
MSE (10−1)0.00000.22330.3482
Disclaimer/Publisher’s Note: The statements, opinions and data contained in all publications are solely those of the individual author(s) and contributor(s) and not of MDPI and/or the editor(s). MDPI and/or the editor(s) disclaim responsibility for any injury to people or property resulting from any ideas, methods, instructions or products referred to in the content.

