Article

High-Precision Remote Sensing Monitoring of Extent, Species, and Production of Cultured Seaweed for Korean Peninsula

by
Shuangshuang Chen
1,
Zhanjiang Ye
1,
Runjie Jin
1,
Junjie Zhu
1,
Nan Wang
1,
Yuhan Zheng
2,
Junyu He
1 and
Jiaping Wu
1,*
1
Ocean College, Zhejiang University, Zhoushan 316021, China
2
Ministry of Education Key Laboratory for Biodiversity Science and Ecological Engineering, Fudan University, Shanghai 200438, China
*
Author to whom correspondence should be addressed.
Remote Sens. 2025, 17(7), 1150; https://doi.org/10.3390/rs17071150
Submission received: 16 January 2025 / Revised: 16 March 2025 / Accepted: 21 March 2025 / Published: 24 March 2025

Abstract

:
Sustainable seaweed cultivation is crucial for marine environmental protection, ecosystem health, socio-economic development, and carbon sequestration. Accurate and timely information on the distribution, extent, species, and production of cultivated seaweeds is essential for tracking biomass production, monitoring ecosystem health, assessing environmental impacts, optimizing cultivation planning, supporting investment decisions, and quantifying carbon sequestration potential. However, this important information is usually lacking. This study developed a high-precision monitoring approach by integrating Otsu thresholding features with random forest classification, implemented through Google Earth Engine using Sentinel-2 imagery (10-m). The method was applied to analyze spatiotemporal variations of seaweed cultivation across the Korean Peninsula from 2017 to 2023. Results showed that annual cultivation acreage in North Korea remained relatively stable between 1506 and 2033 ha, while it experienced a significant increase of 8209 ha in South Korea. By integrating spectral features, seaweed phenology, and field cultivation practices, we successfully differentiated the predominant species: laver (Pyropia) and kelp (Saccharina and Undaria). During the 2022–2023 cultivation season, South Korea’s farms comprised 78% laver and 22% kelp, while North Korea’s showed an inverse distribution. A strong correlation (r2 = 0.99) between acreage and seaweed production enabled us to estimate annual seaweed production in North Korea, effectively addressing data gaps in regions with limited statistics. Our approach demonstrates the potential for global seaweed cultivation monitoring, while the spatial analysis lays the foundation for identifying potential cultivation zones. Given the relatively low initial investment requirement of seaweed farming and significant economic return, this approach offers valuable insights for promoting economic development and food security, ultimately supporting sustainable aquaculture management.

1. Introduction

Seaweeds are integral components of marine ecosystems, serving as primary producers and playing a crucial role in maintaining the balance of the marine environment [1]. They absorb CO2 and release O2 through photosynthesis, which regulates seawater pH and increases dissolved oxygen, mitigating ocean acidification [2]. Furthermore, by sequestering carbon [3,4,5], seaweeds contribute significantly to carbon offsetting efforts, which are essential in the broader context of alleviating climate change [6,7,8,9,10]. They provide food and habitats for various marine species [11,12], enhancing biodiversity within the marine ecosystem [13,14,15]. Throughout their growth cycle, seaweeds actively assimilate nutrients, particularly nitrogen and phosphorus, which are key contributors to eutrophication [16,17]. This nutrient uptake capability remarkably mitigates the occurrence of eutrophication and helps prevent the subsequent harmful algal blooms (HABs) that can plague coastal waters [18]. Beyond their ecological contributions, seaweeds exhibit exceptional versatility with applications in the food, pharmaceutical, and cosmetics sectors [19]. The multifaceted utility of seaweeds positions them as a sustainable resource with the potential to support several United Nations’ Sustainable Development Goals (SDGs) (https://www.un.org/sustainabledevelopment/, accessed on 5 March 2023), particularly Goals 1–3, 8, 10, and 12–14 [20].
The Korean Peninsula consists of two countries, the Democratic People’s Republic of Korea (hereinafter referred to as North Korea) and the Republic of Korea (hereinafter referred to as South Korea). The long coastline, nutrient-rich upwelling, and mild climate provide excellent conditions for seaweed cultivation [21]. Within the cultural and economic fabric of the Korean Peninsula, the practice of seaweed cultivation has played a pivotal role in the sustenance and prosperity of coastal communities for generations [22]. This marine aquacultural endeavor has provided a stable livelihood for the inhabitants and catalyzed economic growth within these regions [23]. Despite South Korea’s rich and varied seaweed flora, the Saccharina, Undaria, and Pyropia species constitute approximately 98% of its total seaweed production, according to the ’2023 Statistical Yearbook of Oceans and Fisheries’ published by the Ministry of Oceans and Fisheries [24]. Saccharina and Undaria are both genera within the order Laminariales, commonly known as kelp. Pyropia, including its species such as Pyropia tenera, is commonly known as laver. Similarly, in North Korea, these species dominate the nation’s seaweed farming industry [25]. The combined seaweed production of these two countries represents about 7% of the global total, a proportion that is equivalent to the sum of all other countries’ outputs, apart from China’s leading (60% of the global total) and Indonesia’s following (27% of the global total), respectively, as reported by the United Nations’ Food and Agriculture Organization [25].
To promote the development of seaweed aquaculture, South Korea has adopted a dual strategy of technological innovation and application expansion. Regarding applications, the industry has ventured into high-value product chains, encompassing functional foods (such as fucoidan extracts), biodegradable plastics (containing 60% seaweed), and novel feed additives, thus driving the growth of industrial value [26,27]. Technologically, South Korea has developed artificial automatic harvesting systems and integrated multi-trophic aquaculture (IMTA) systems [28,29] to enhance productivity. Amidst the rapid expansion of the industry, reliable and efficient monitoring methods are urgently needed to ensure sustainable aquaculture practices, optimize resource allocation, and support policy evaluation. Traditional approaches to monitoring and estimating the cultivation status of seaweed, which rely on field surveys and stratified reporting, are labor-intensive, time-consuming, and often fail to capture real-time changes. In South Korea, production data are limited and lack specific acreage information [24], while the real production information from North Korea is often not available, with FAO data indicating implausible consistent annual production figures [25]. In comparison, remote sensing technology is efficient and reliable, enabling non-invasive, extensive, multispectral, and continuous collection of information on the Earth’s surface. It is widely applied across various fields and provides strong support for scientific research, decision making, and management [30,31,32,33,34,35,36,37]. Currently, an increasing number of studies are leveraging remote sensing technology to monitor coastal environments and resources [38,39], such as seagrass [40,41,42,43], tidal flats [44], salt marshes [45,46,47], mangroves [48,49], and aquaculture ponds [50,51,52]. Similarly, remote sensing technology has proven valuable for monitoring seaweed farming. While numerous studies have successfully mapped the spatial distribution and extent of seaweed cultivation across various geographical regions [53,54,55,56,57,58,59,60], they have primarily focused on spatial mapping without addressing species identification or yield estimation over broad areas. Furthermore, the classification methods used in these studies each present distinct advantages and limitations. Threshold-based segmentation offers simplicity and computational efficiency but struggles with environmental variability and areas showing overlapping spectral signatures [56,57]. Object-based image analysis (OBIA) enhances accuracy by integrating spectral and spatial features, making it suitable for complex environments, though its computational intensity and need for precise parameter calibration limit its scalability [54,55]. Deep learning methods, such as CNN and U-net, deliver superior accuracy and adaptability, especially with large datasets, but demand substantial computational resources and extensive training data [58,59,60]. Random Forest (RF) demonstrates notable advantages in handling high-dimensional, noisy data while minimizing overfitting risks. Its ability to analyze feature importance provides valuable insights into key factors affecting seaweed mapping [53]. Moreover, its computational efficiency, coupled with the low requirement for extensive labeled data, renders Random Forest (RF) an ideal choice for the large-scale, real-time monitoring of seaweed cultivation.
Various automatic thresholding approaches exist, including Otsu’s method, iterative thresholding, adaptive thresholding, multi-thresholding, entropy-based methods, and energy minimization techniques [61,62,63]. Otsu’s method emerges as particularly effective due to its computational efficiency, robustness, and wide applicability [64,65]. By maximizing inter-class variance to determine optimal thresholds without requiring iterative processes or complex parameter adjustments, it holds particular value for processing large-scale remote sensing imagery.
With these considerations, this study aims to (1) develop an efficient approach integrating Otsu with Random Forest classification to delineate the extent and identify species of cultured seaweed across the Korean Peninsula; (2) analyze the spatiotemporal dynamics of seaweed farming from 2017 to 2023 using 10 m resolution Sentinel-2 imagery; (3) establish and validate relationships between cultivation acreage and production to estimate seaweed yields in North Korea, where official statistics are often unavailable. This research contributes to the broader understanding of regional seaweed cultivation patterns and demonstrates a practical approach for large-scale aquaculture monitoring, supporting global sustainable marine resource management.

2. Materials and Methods

2.1. Study Area

The Korean Peninsula is situated in the eastern part of the Asian continent, spanning latitudes 33° to 43° north and longitudes 124° to 131° east (Figure 1). The East Sea borders it to the east and south, and the Yellow Sea to the west. The peninsula boasts a coastline approximately 17,300 km in length. These extensive coastal features and favorable climatic conditions offer exceptional opportunities for aquaculture development, particularly in seaweed cultivation [22,29]. For this study, we define the maritime area extending 10 km from the Korean Peninsula’s coastline as our research region. The coastline is delineated using the Global Administrative Areas database (GADM) (https://gadm.org, accessed on 12 April 2022) in conjunction with remote sensing imagery.

2.2. Image Data

We selected Sentinel-2 Level-2A images (https://developers.google.com/earth-engine/datasets/catalog/sentinel-2, accessed on 12 April 2022) as the data source for online processing via Google Earth Engine (https://www.google.com/earth/education/tools/google-earth-engine/, accessed on 16 March 2022), which offers a robust framework for conducting diverse analysis and extracting significant insights. The Sentinel-2 satellite constellation, operated by the European Space Agency (ESA), comprises a group of multispectral satellites designed to provide high-quality imagery for Earth observation and environmental monitoring, frequently used for their high revisit frequency and multispectral capabilities. They are equipped to record detailed information across 13 spectral bands, with spatial resolutions of 10 m for bands 2, 3, 4, and 8; 20 m for bands 5, 6, 7, 8a, and 11; and 60 m for bands 1, 9, 10, and 12. For this study, we specifically selected bands 2, 3, 4, and 8 with a 10 m resolution. Figure 2 shows the research framework.

2.3. Image Selection and Processing

The Korean Peninsula primarily cultivates laver (Pyropia) and kelp (Saccharina and Undaria) (Figure 1). Although their farming periods differ slightly, they all encompass the period from December to April of the following year [66] (Table 1). We chose Sentinel-2 satellite imagery from this period to ensure precise analysis, specifically targeting cloud-free images covering aquaculture areas. Overall, we processed a dataset consisting of 146 Sentinel-2 images (Table A1) by these selection procedures:
(1)
Temporal considerations: we selected images within the defined farming season (December to April) to ensure temporal alignment with seaweed cultivation activities. This alignment was critical for accurately capturing the spatial extent and phenological stages of seaweed farming.
(2)
Spatial resolution: Sentinel-2 imagery provides a spatial resolution of 10 m in the visible and near-infrared bands, which is suitable for identifying seaweed cultivation areas while minimizing interference from smaller non-aquaculture features.
(3)
Cloud cover and data quality: Cloud cover significantly impacts satellite image quality. Only images with cloud cover greater than 10%, acceptable atmospheric conditions, and minimal distortions were excluded from the analysis. For images with minor cloud presence, we applied cloud masking techniques using the Sentinel-2 Quality Assessment Band (QA60) to remove cloud-affected pixels while retaining usable data.
(4)
Seawater area masking: To improve classification accuracy and focus on seaweed cultivation areas, we applied an adjusted coastline mask to delineate the land–water boundary. This step removed land-based features from the analysis, ensuring that only seawater areas—where seaweed cultivation occurs—were considered in subsequent image processing.

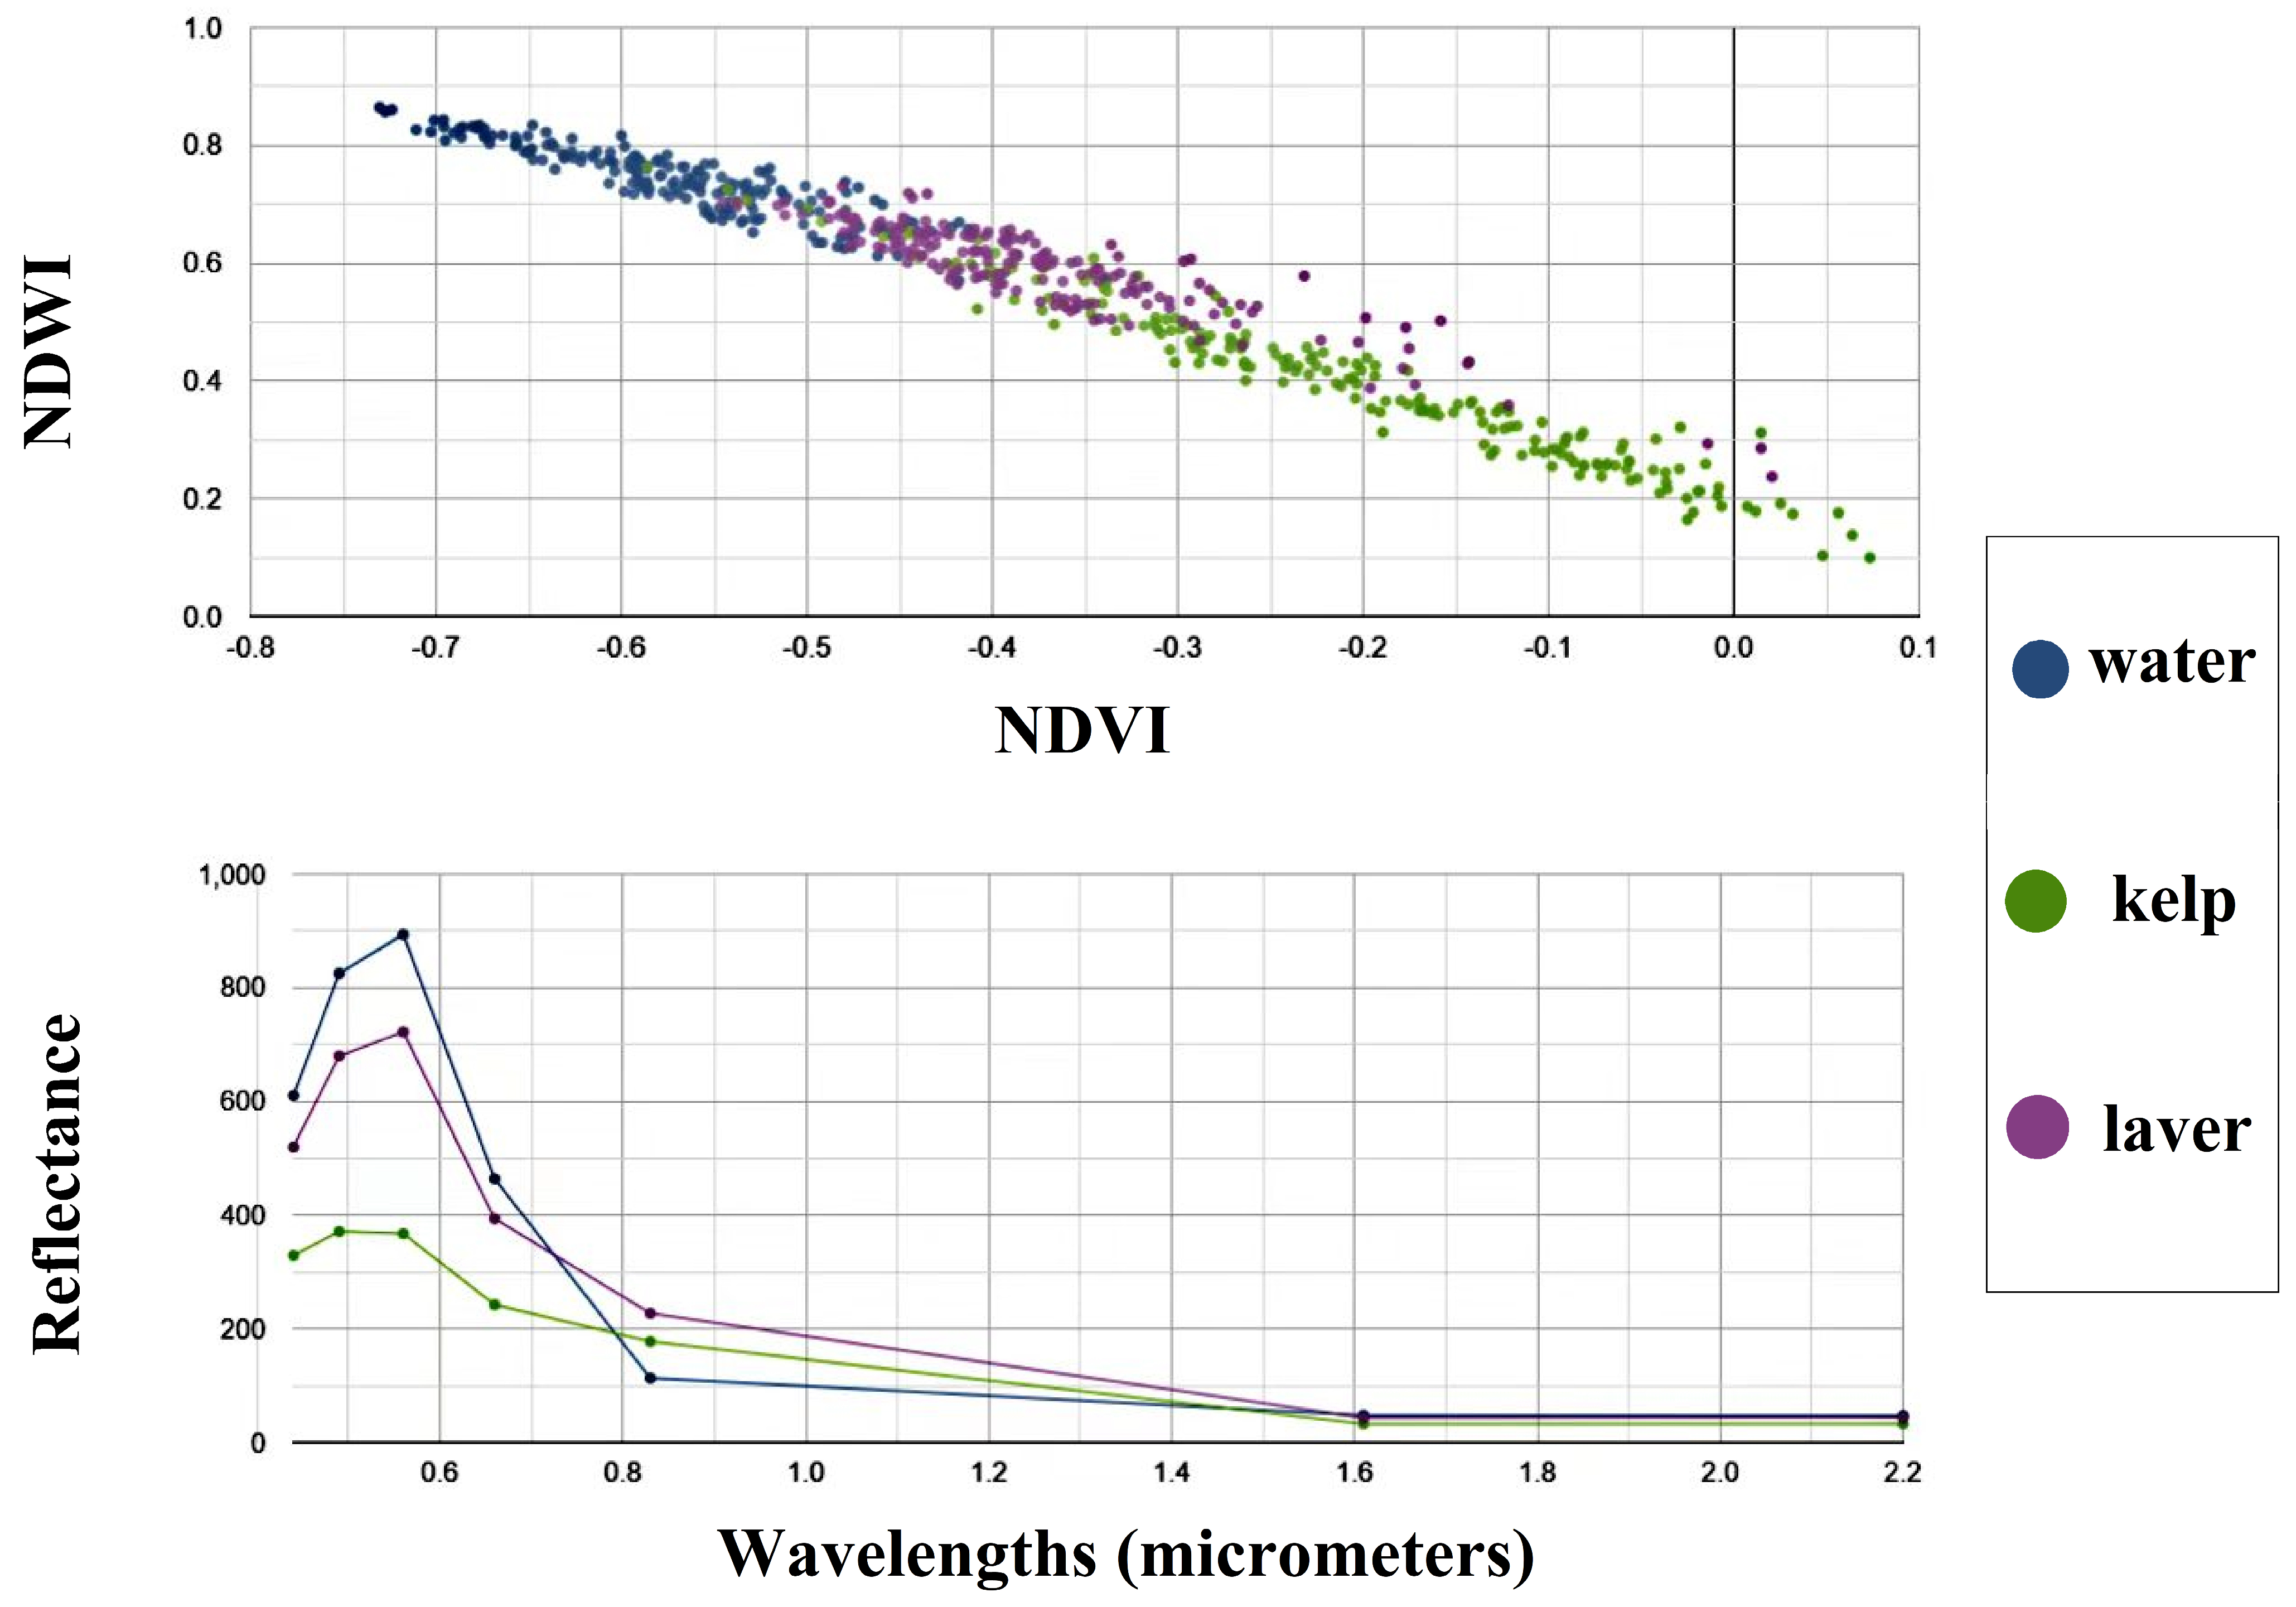
2.4. Spectral Information and Classification Model

The seaweed cultivation zones manifest as areas with distinct, regular geometries in satellite imagery, displaying lower brightness levels compared to the surrounding waters (Figure 3e). The chlorophyll present in seaweed fronds exhibits pronounced absorption in the visible light spectrum, encompassing bands B2 (blue), B3 (green), and B4 (red), resulting in lower reflectance for these bands when compared to seawater. Furthermore, we computed the normalized difference vegetation index (NDVI) [67,68] and the normalized difference water index (NDWI) [69], which are pivotal for analyzing vegetation and water bodies, respectively. These indices instrumentally provide critical data for environmental monitoring and agronomic evaluations. The respective formulas for their calculation are as follows:
N D V I = N I R R e d N I R + R e d
N D W I = G r e e n N I R G r e e n + N I R
As illustrated in Figure 3b, seaweed exhibits greater distinguishability from seawater in the green band. Consequently, we selected the B3 band as the input for the Otsu algorithm (Figure 3g). The Otsu algorithm is a well-established image processing method that calculates the grayscale histogram of an image and iteratively computes the optimal threshold by minimizing intra-class variance and maximizing inter-class variance, thereby separating the image into distinct background and foreground regions [70,71,72]. This automatic thresholding method is particularly effective for segmentation tasks where the classes are distinguishable but not predefined. In this study, we employed Otsu’s method to generate the binary masks of seaweed cultivation areas as a preprocessing step. These segmentation results were then integrated into our classification feature set, helping reduce noise for the subsequent random forest classification. The complete feature set comprises spectral bands (B2, B3, B4, and B8), computed indices (NDVI, NDWI), and segmentation results from the Otsu algorithm (Figure 3).
In general, the features present in the images requiring processing encompass seawater, seaweed, and occasionally a small number of cages utilized for fish breeding. We select a suitable number of sample points for each type of feature to be used in the subsequent training of the classifier and for evaluating classification accuracy. As for the classifier, we opted for the random forest method [73,74], an ensemble learning approach that builds multiple decision trees during training and determines the classification outcome by outputting the mode of the classes. Owing to its ensemble nature, random forest is robust and less prone to overfitting, suitable for complex classification tasks [75,76]. Key parameters in this study were set as follows: (1) Number of trees (N_trees): initially trained with 15 trees, we evaluated accuracy for N_trees ranging from 10 to 100. The final model used N_trees = 50 for the highest accuracy. (2) Maximum depth of trees (Max_depth): set to 20 to balance model complexity and avoid overfitting. (3) Number of features per split (Max_features): default. (4) Minimum samples per leaf (Min_samples_leaf): set to 1 to capture fine-grained data differences. All input features were normalized to [0, 1] for equal weighting during training.

2.5. Species Identification

We assessed seaweed cultivation in the region by focusing on phenological features, such as the growing and harvesting timings, growing locations, and farming methods of two primary species: laver and kelp. Laver cultivation is predominantly carried out using two methods: fixed systems and floating systems. Initially, laver was cultivated using fixed pole systems, which were established in nearshore areas with good water quality and stable conditions. However, with advancements in aquaculture technology in the early 1980s, fixed pole systems began to be supplanted by floating systems. This transition allowed laver cultivation to expand from nearshore to more offshore areas. In parallel, kelp cultivation employs long-line methods in more open waters, which is essential for the health and productivity of the kelp [29]. This technique ensures that the kelp fronds have ample space to grow and develop, enabling the large, leafy blades to fully extend and capture the necessary sunlight for photosynthesis.
Laver’s sensitivity to high temperatures [77] dictates that the majority of its harvest is typically completed by April. Conversely, kelp, which has a higher tolerance to temperature compared to laver [66,78,79], has a slightly later harvest period, with the majority of the harvest usually concluded by the end of May. The distinct temporal patterns in the harvest period of these species offer a discernible temporal signature, which is instrumental in species recognition on satellite imagery. In addition to phenological differences, laver and kelp exhibit distinct spectral characteristics in visible and near-infrared (NIR) bands, as well as in the NDVI and NDWI indices (Figure 4). By integrating temporal, spatial, and spectral features, coupled with high-resolution imagery from Google Earth and Sentinel-2, our approach enables accurate and efficient species recognition.

2.6. Production Estimation

In the absence of accessible data on North Korea’s seaweed production, we endeavored to estimate the figures by examining the annual yields and cultivation areas of kelp in Ulsan and laver in Gyeonggi Province, South Korea. Given the mono-species cultivation practices prevalent in these regions, we were able to simplify the comparative analysis, thereby facilitating a more straightforward extrapolation to North Korea’s potential production. This extrapolation is grounded in the pronounced environmental congruity between their coastal zones. Both regions are situated within interconnected marine ecosystems regulated by the same oceanic currents and the East Asian monsoon regime. Their nearshore waters display synchronized seasonal variations in thermal and haline properties, while minimal latitudinal variation ensures relatively uniform annual cycles of photosynthetically active radiation (PAR) duration and spectral composition—critical factors regulating seaweed productivity and biogeochemical processes [80,81].
While this environmental similarity provides a scientific basis for cross-border yield estimation, we acknowledge that our approach does not fully account for differences in cultivation technologies, economic conditions, and policy frameworks between the two countries. Future studies could enhance accuracy by incorporating these factors and validating results through additional data sources.

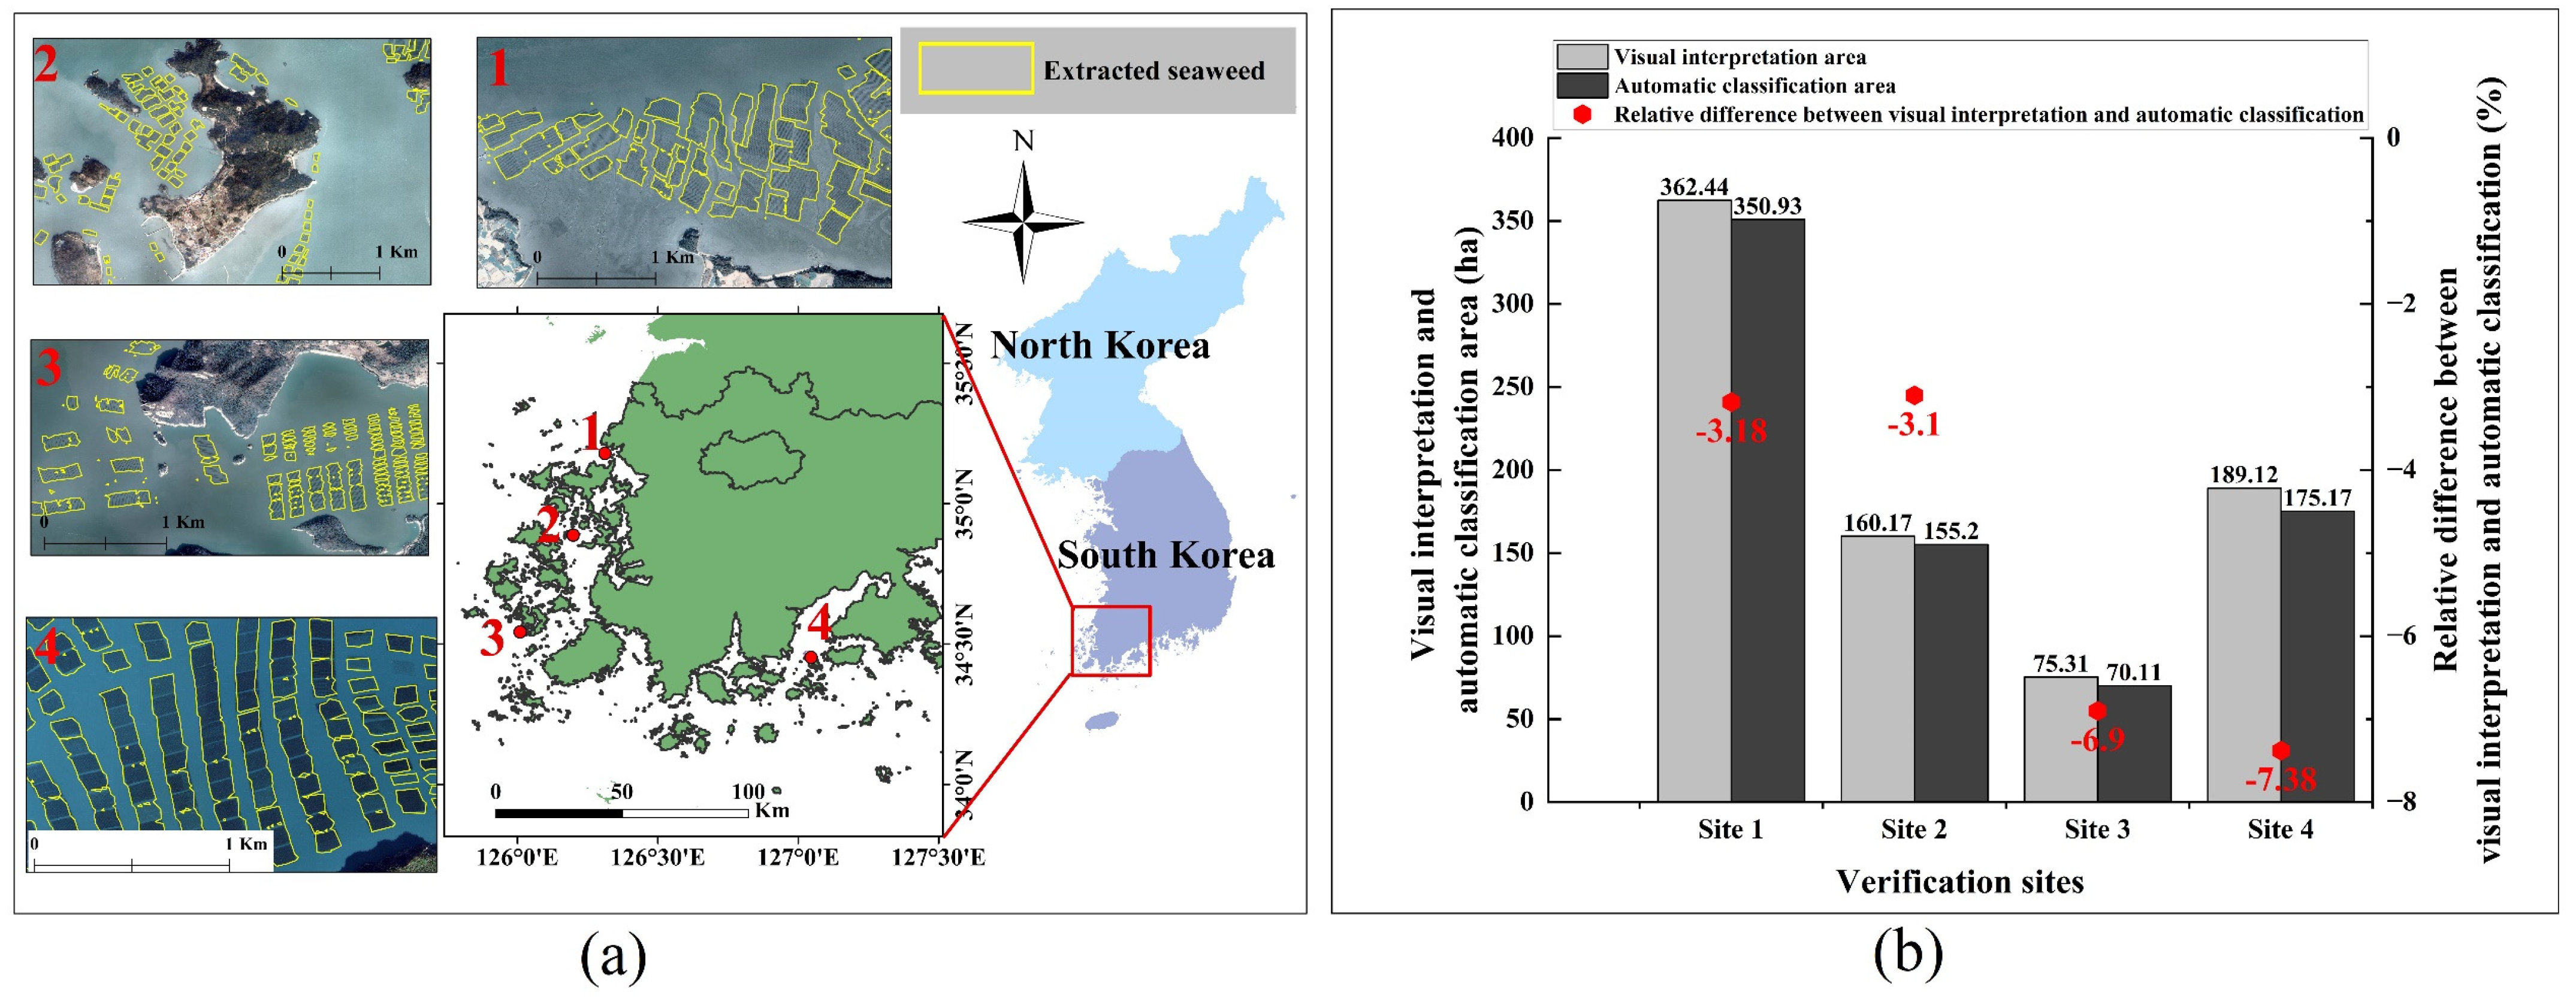
2.7. Accuracy Assessment

To rigorously assess the accuracy of our classification outcomes and to substantiate the efficacy and dependability of the identified seaweed cultivation areas, we utilized high-resolution Google Earth imagery to conduct visual interpretations of selected emblematic cultivation zones. Owing to the buoyant nature of seaweed culture systems, which are susceptible to seawater currents, their spatial locations can exhibit some variations over time. Consequently, we opted to evaluate the relative difference between areas automatically extracted through our classification model and those identified manually, which serves as a direct measure of classification accuracy. In addition, we incorporated the overall accuracy (OA) and Kappa coefficient to quantify the model’s performance.

3. Results

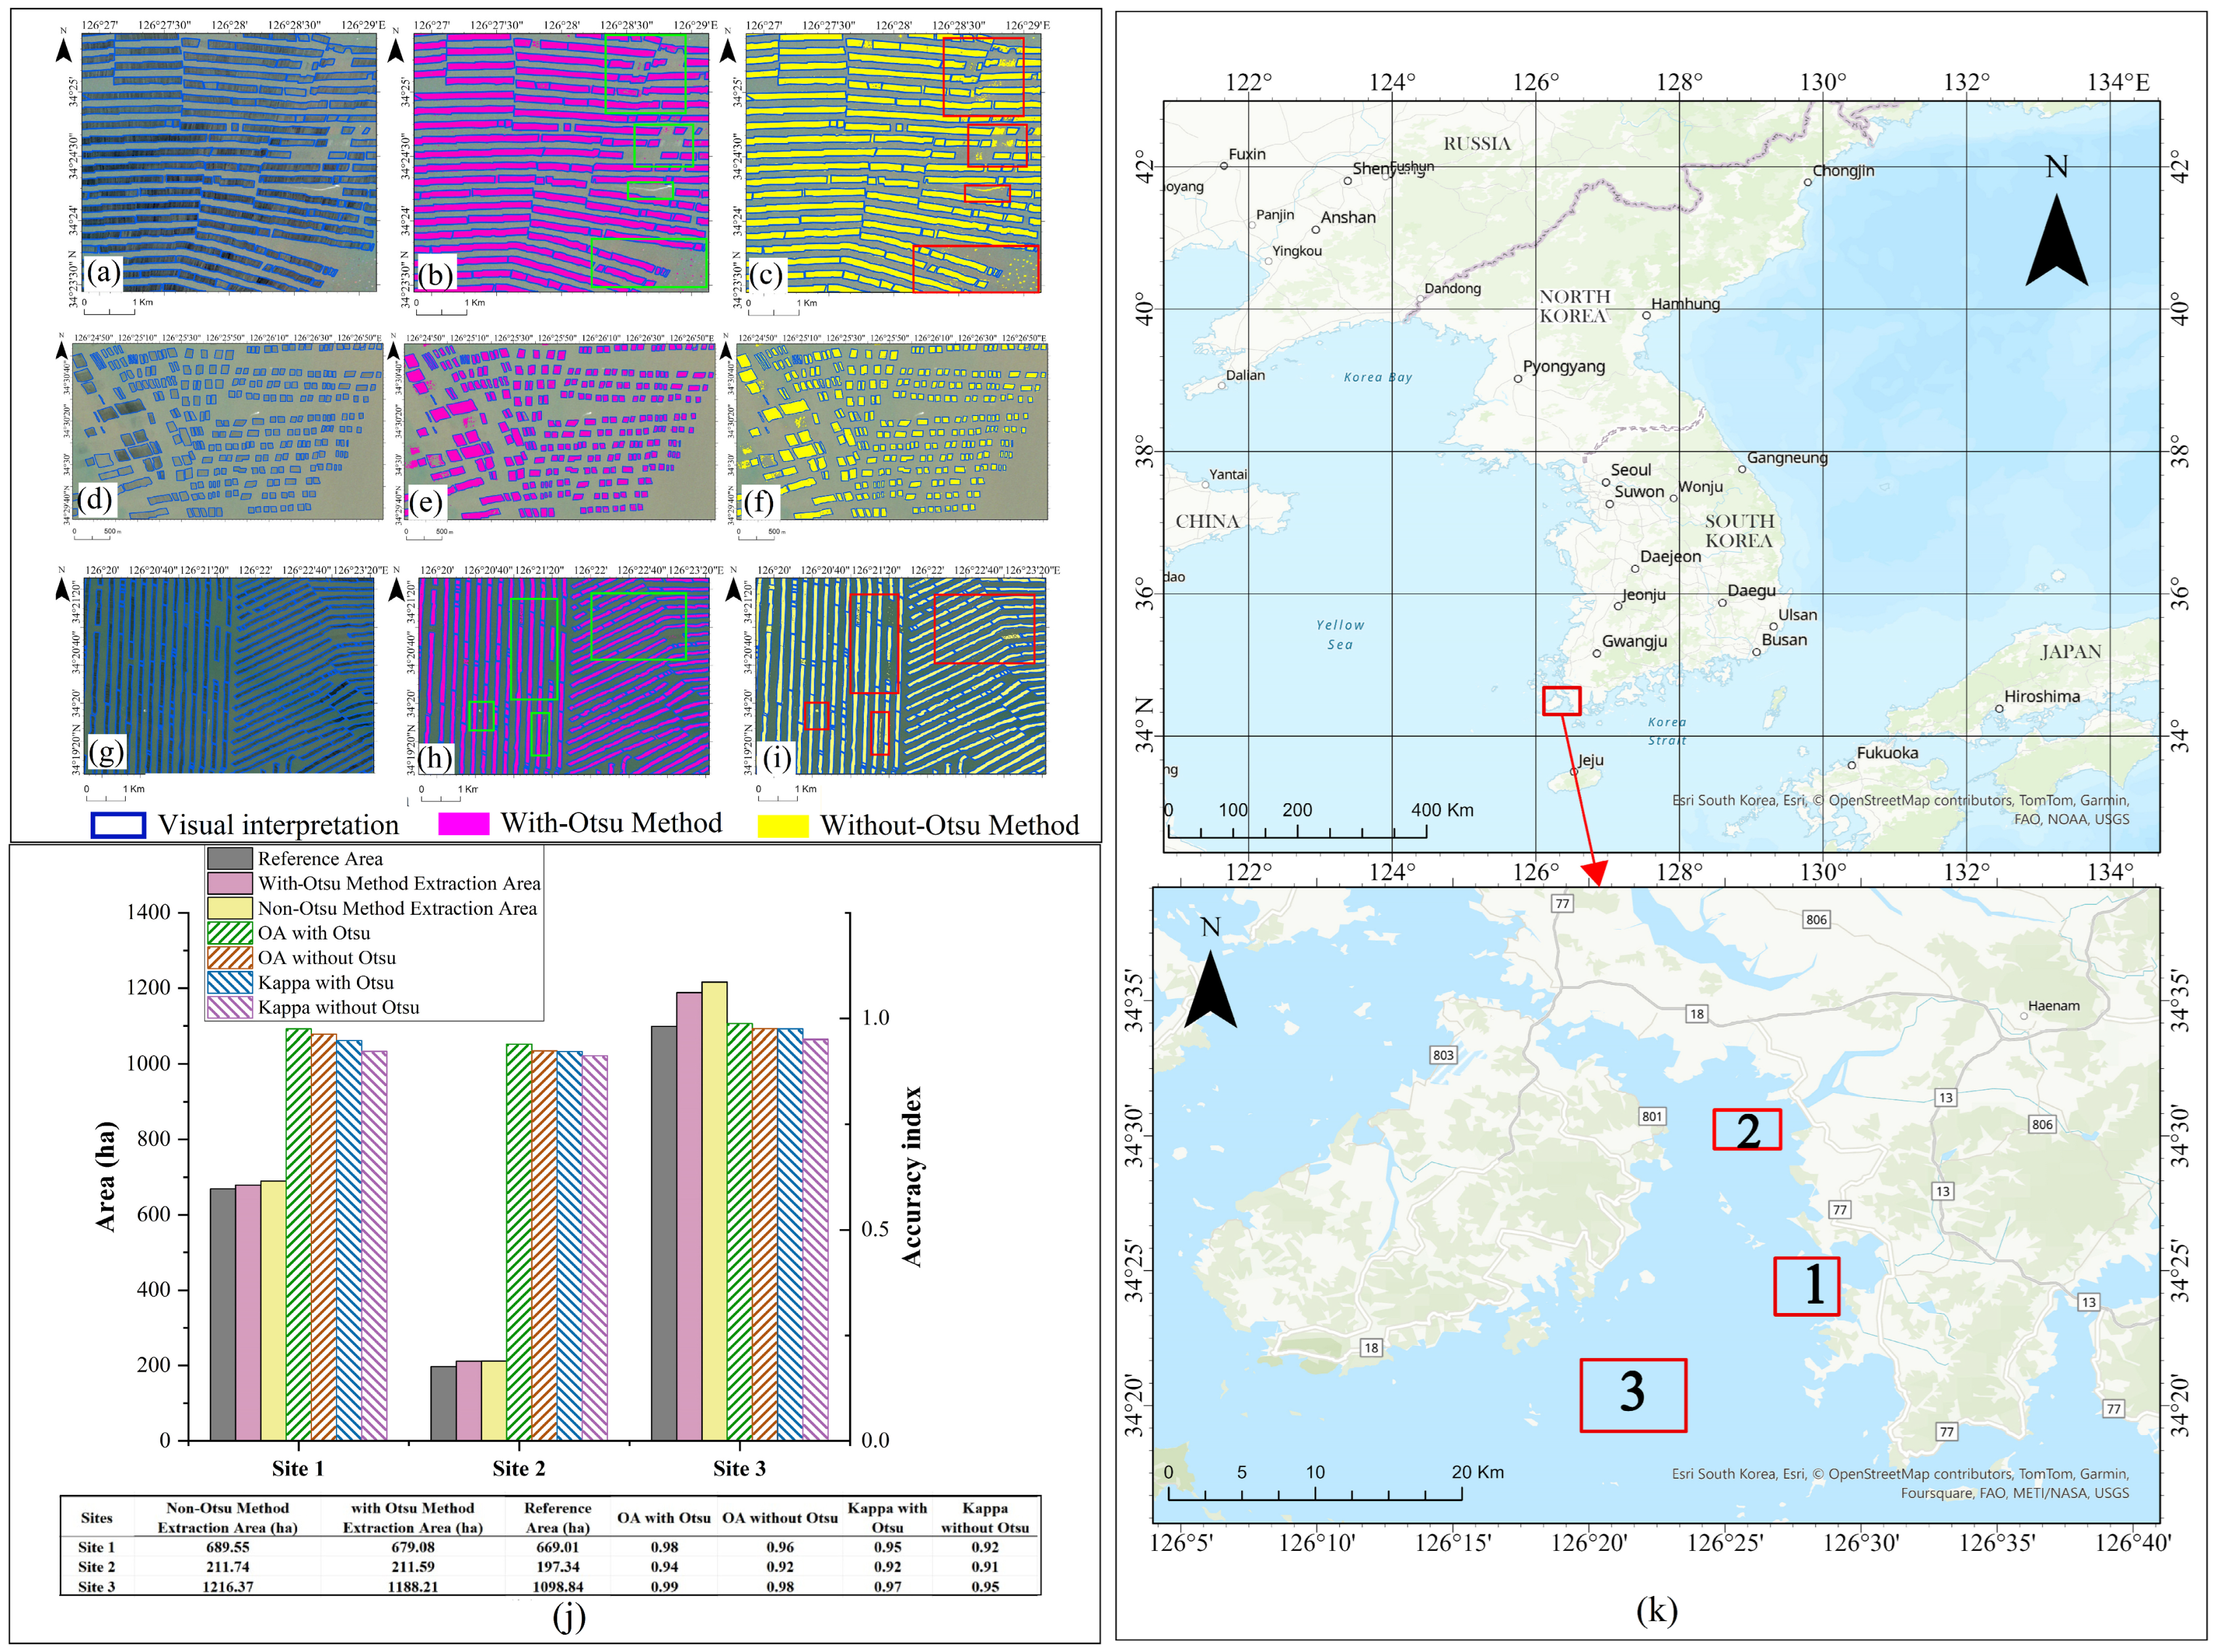
3.1. Classification Accuracy

By superimposing the classification results of four illustrated sites with the manually delineated outcomes from high-resolution Google Earth imagery, we conducted the relative difference to calculate the accuracy of our model (Figure 5a). The outcomes were highly satisfactory, with the relative difference to visual interpretation for sites 1, 2, 3, and 4 being −3.18%, −3.10%, −6.90%, and −7.38%, respectively (Figure 5b). Additionally, the accuracy assessment results indicate that our image classification outcomes are highly satisfactory, with the OA values exceeding 0.9 and the Kappa values exceeding 0.8, underscoring the reliability and precision of our method (Figure 6).

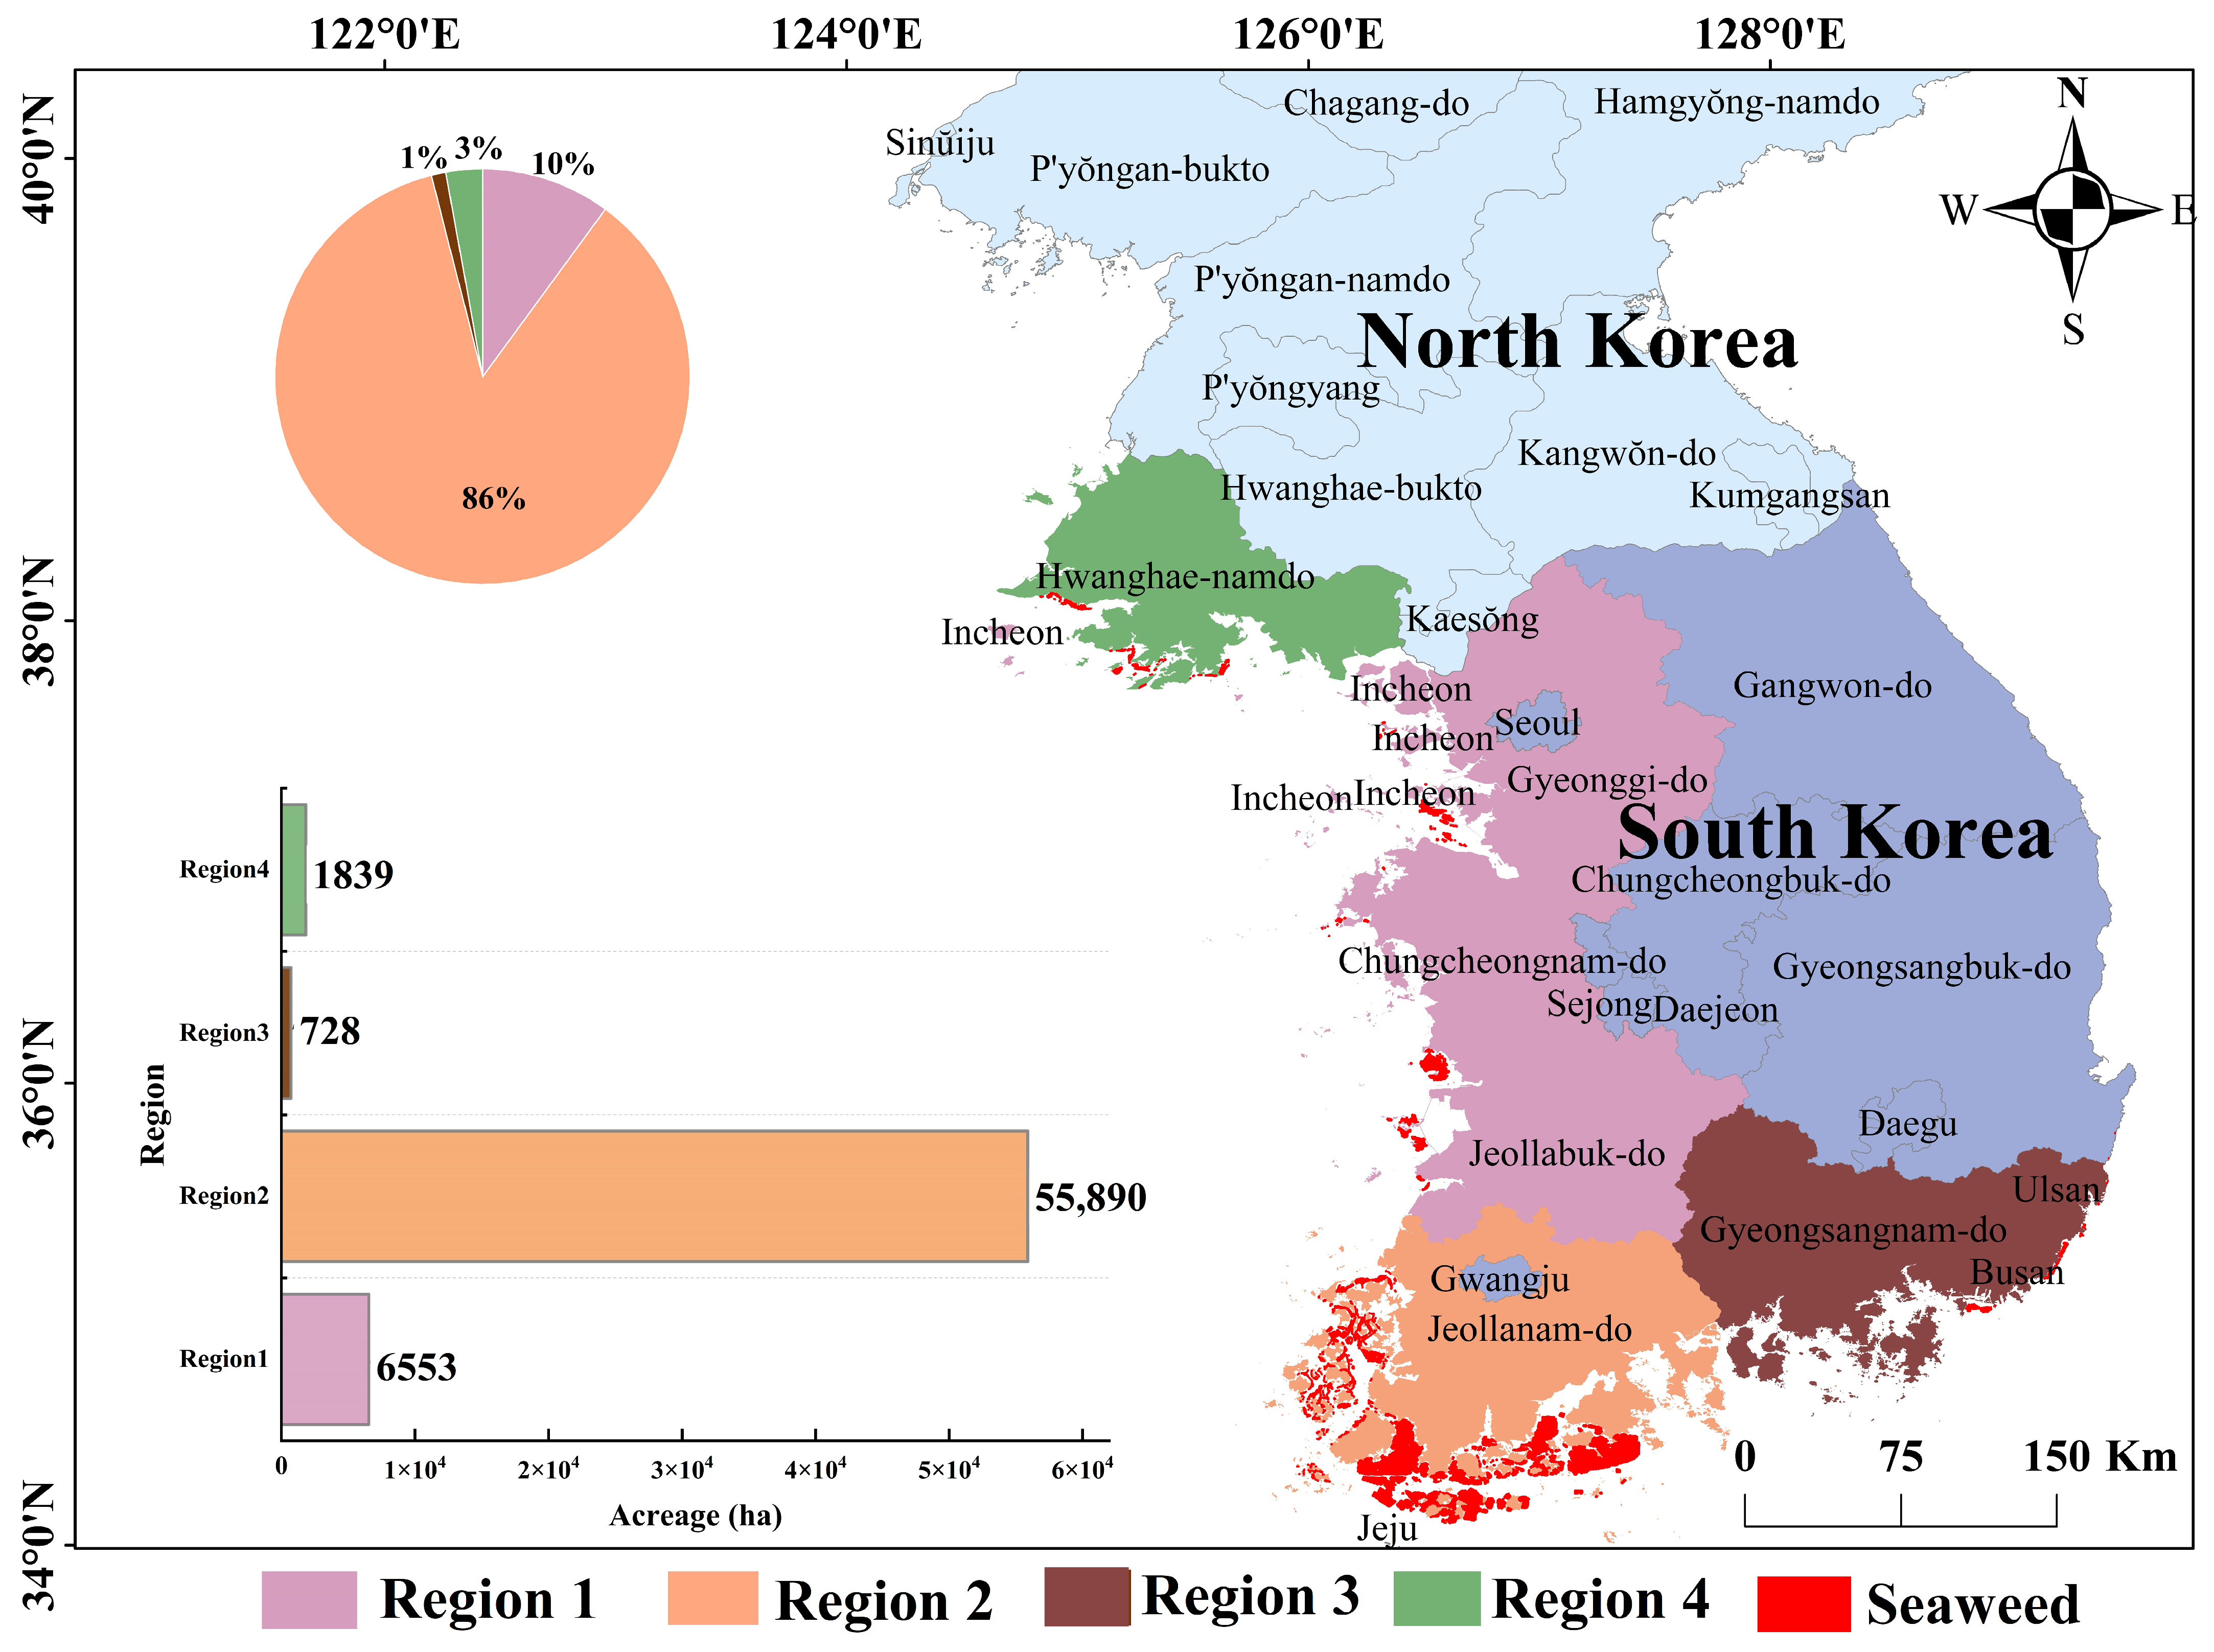
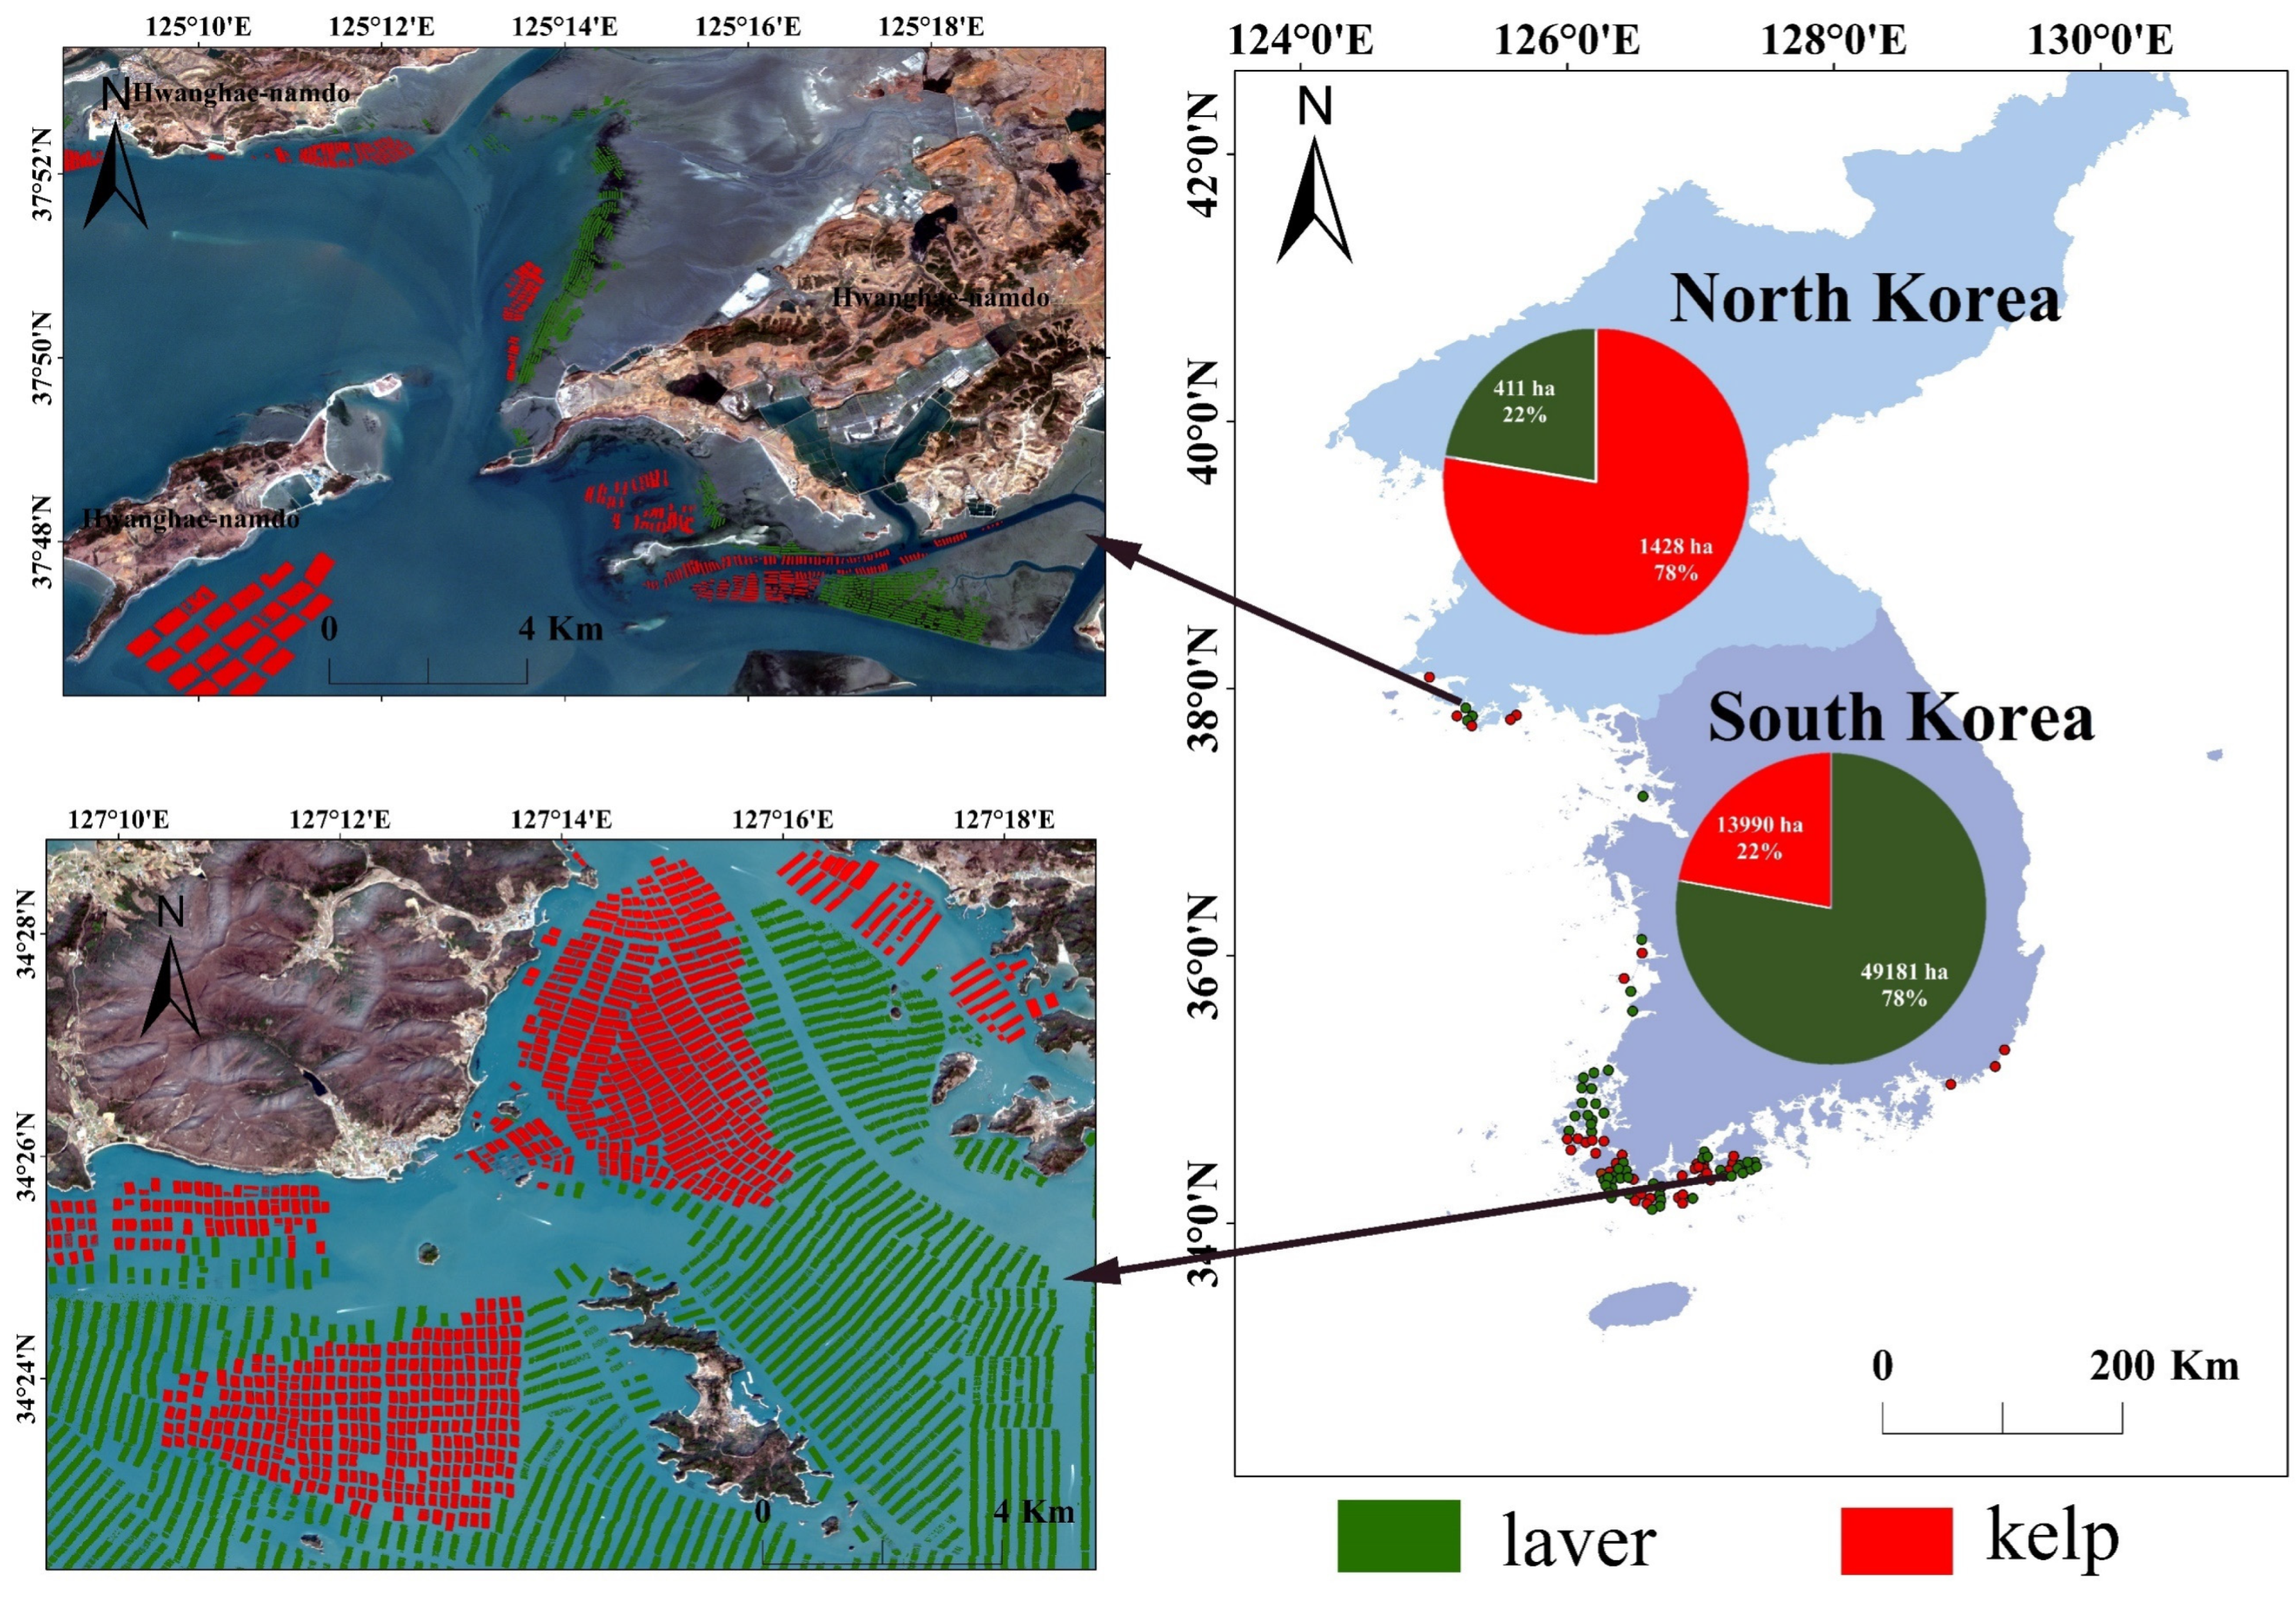
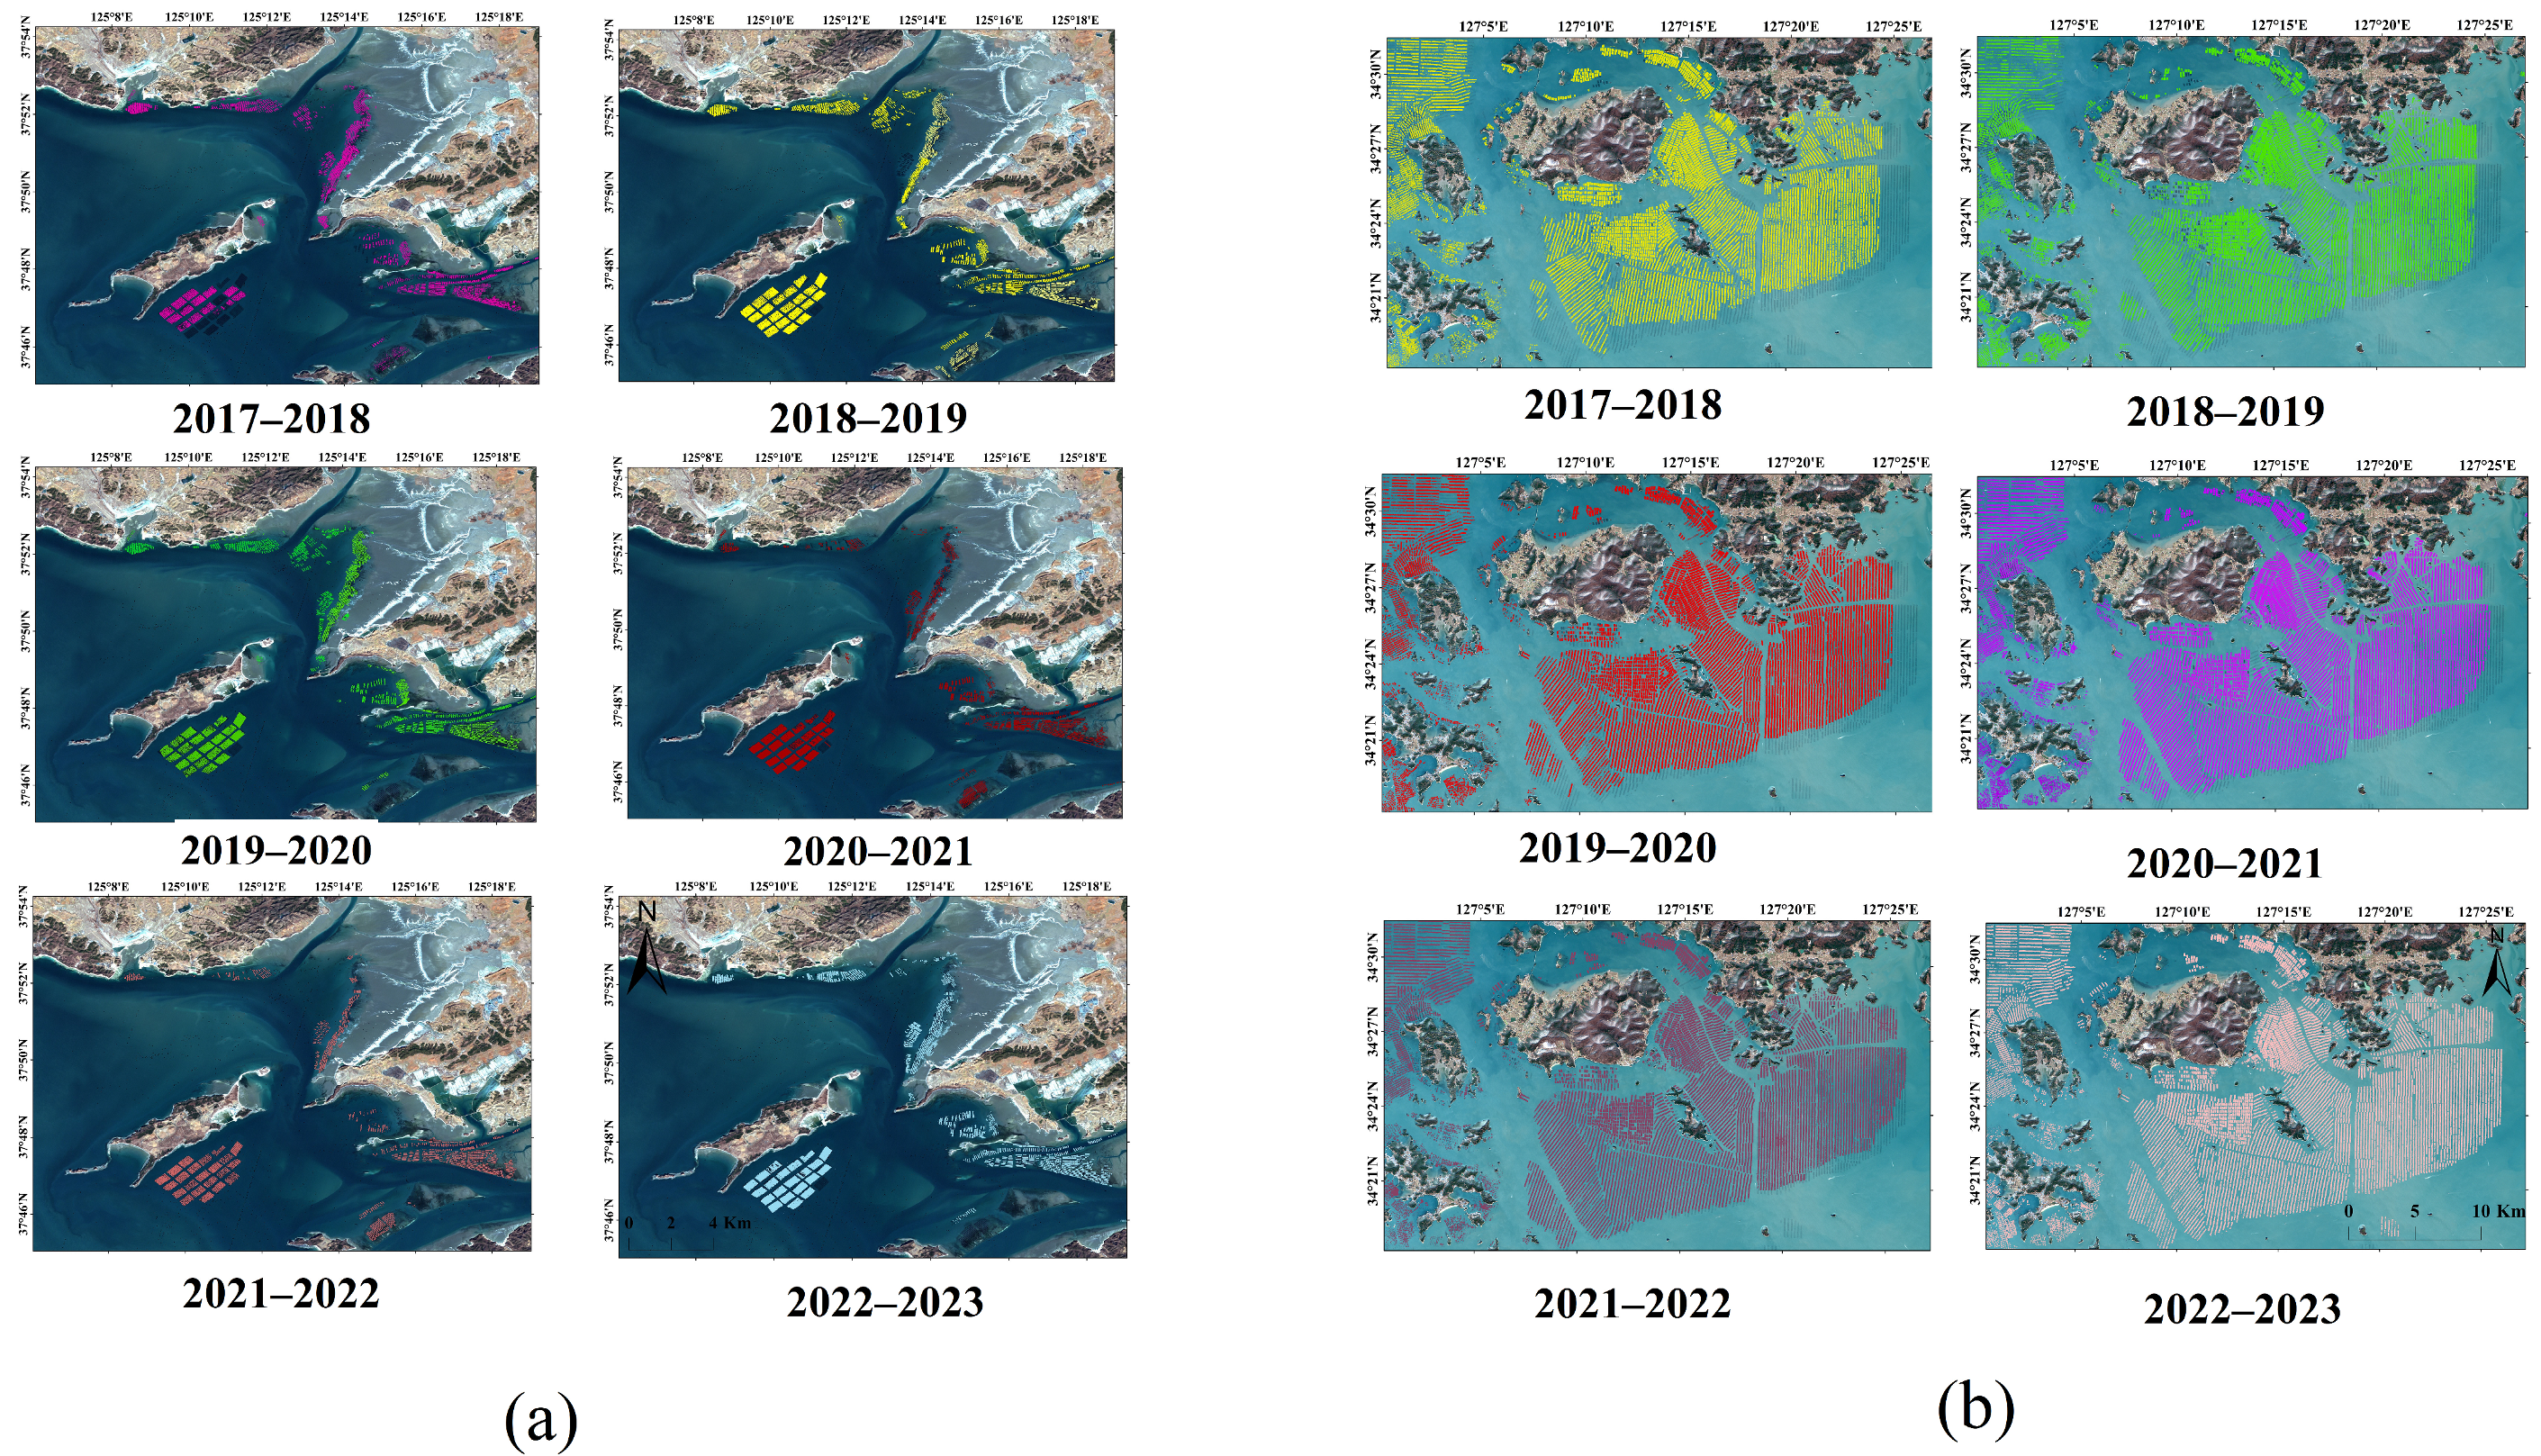
3.2. The Spatial Distribution, Acreage, and Species Information of Cultured Seaweed

The spatial distribution and acreage information of seaweed farms across Korean Peninsula for the period 2022–2023 are shown in Figure 7. The total seaweed cultivation acreage in the 2022–2023 season was 65,009.7 ha. This encompasses an acreage of 1839.1 ha in North Korea (Region 4, Hwanghae-namdo Province), accounting for 3% of the total, and a substantial 63,170.6 ha in South Korea, representing 97% of the total. In South Korea, the distribution is as follows: Region 1 with 6552.7 ha, Region 2 with 55,889.5 ha, and Region 3 with 728.4 ha.
As depicted in Figure 8, the cultivation areas and distribution of laver and kelp are notably distinct between South Korea and North Korea. In South Korea, the southern coast of Jeollanam-do Province is a hub for seaweed farming, with laver dominating the seascape. Specifically, laver cultivation extends over 49,180.7 ha, constituting 78% of the nation’s total seaweed cultivation area. Kelp, on the other hand, occupies 13,989.8 ha, or 22% of the total. In North Korea, the scenario is quite the opposite, with kelp assuming a leading role in the aquaculture industry. Kelp cultivation spans 1427.9 ha, which is 78% of the total seaweed farming area in the country. Conversely, laver cultivation is less extensive, with an acreage of 411.2 ha, representing about 22% of the total.

3.3. The Spatiotemporal Dynamics of Seaweed Cultivation

The analysis of inter-annual variations in seaweed cultivation areas between North and South Korea (2017–2023) reveals distinctly different development trajectories (Figure 6a). The cultivation area in North Korea’s Hwanghae-namdo Province demonstrated relative stability, fluctuating between 1505.9 and 2033.1 ha, with the peak occurring in the 2018–2019 season and returning to 1839.1 ha by 2022–2023. This equilibrium state likely reflects systemic constraints, including the technological limitations, infrastructure deficiencies, and resource allocation priorities characteristic of an inward-focused production regime [25].
In contrast, South Korea exhibited substantial expansion, with the cultivation area increasing from 54,961.9 ha in 2017–2018 to 63,170.6 ha in 2022–2023, representing a 14.9% growth. This substantial expansion may stem from four key drivers: (1) Surging global demand fueled by Asian market growth and the worldwide popularity of Korean cuisine [82]; (2) Technological innovations incorporating smart farming systems and enhanced cultivation techniques [21]; (3) Government support through aquaculture subsidies and export facilitation programs [83,84,85,86]; (4) Growing environmental imperatives underscore seaweed’s pivotal role as a blue carbon reservoir [21]. Notably, South Korea’s formal incorporation of blue carbon ecosystems into its 2030 NDC and 2050 Carbon Neutrality Strategy [87]. This institutionalization has fostered a tripartite innovation ecosystem combining governmental oversight, academic research, and industrial application, particularly evident in advanced cultivation biotechnologies and value-added product streams [88].
Remote sensing temporal analysis (Figure 9) quantitatively validates these differential trajectories, highlighting how geopolitical-economic contexts mediate marine resource utilization. While North Korea’s static profile suggests resource-limited equilibrium, South Korea’s expansion exemplifies how policy-technology synergies can transform coastal ecosystems into dual-purpose climate-economic assets. This difference underscores the critical role of institutional capacity and technological access in contemporary aquaculture development.

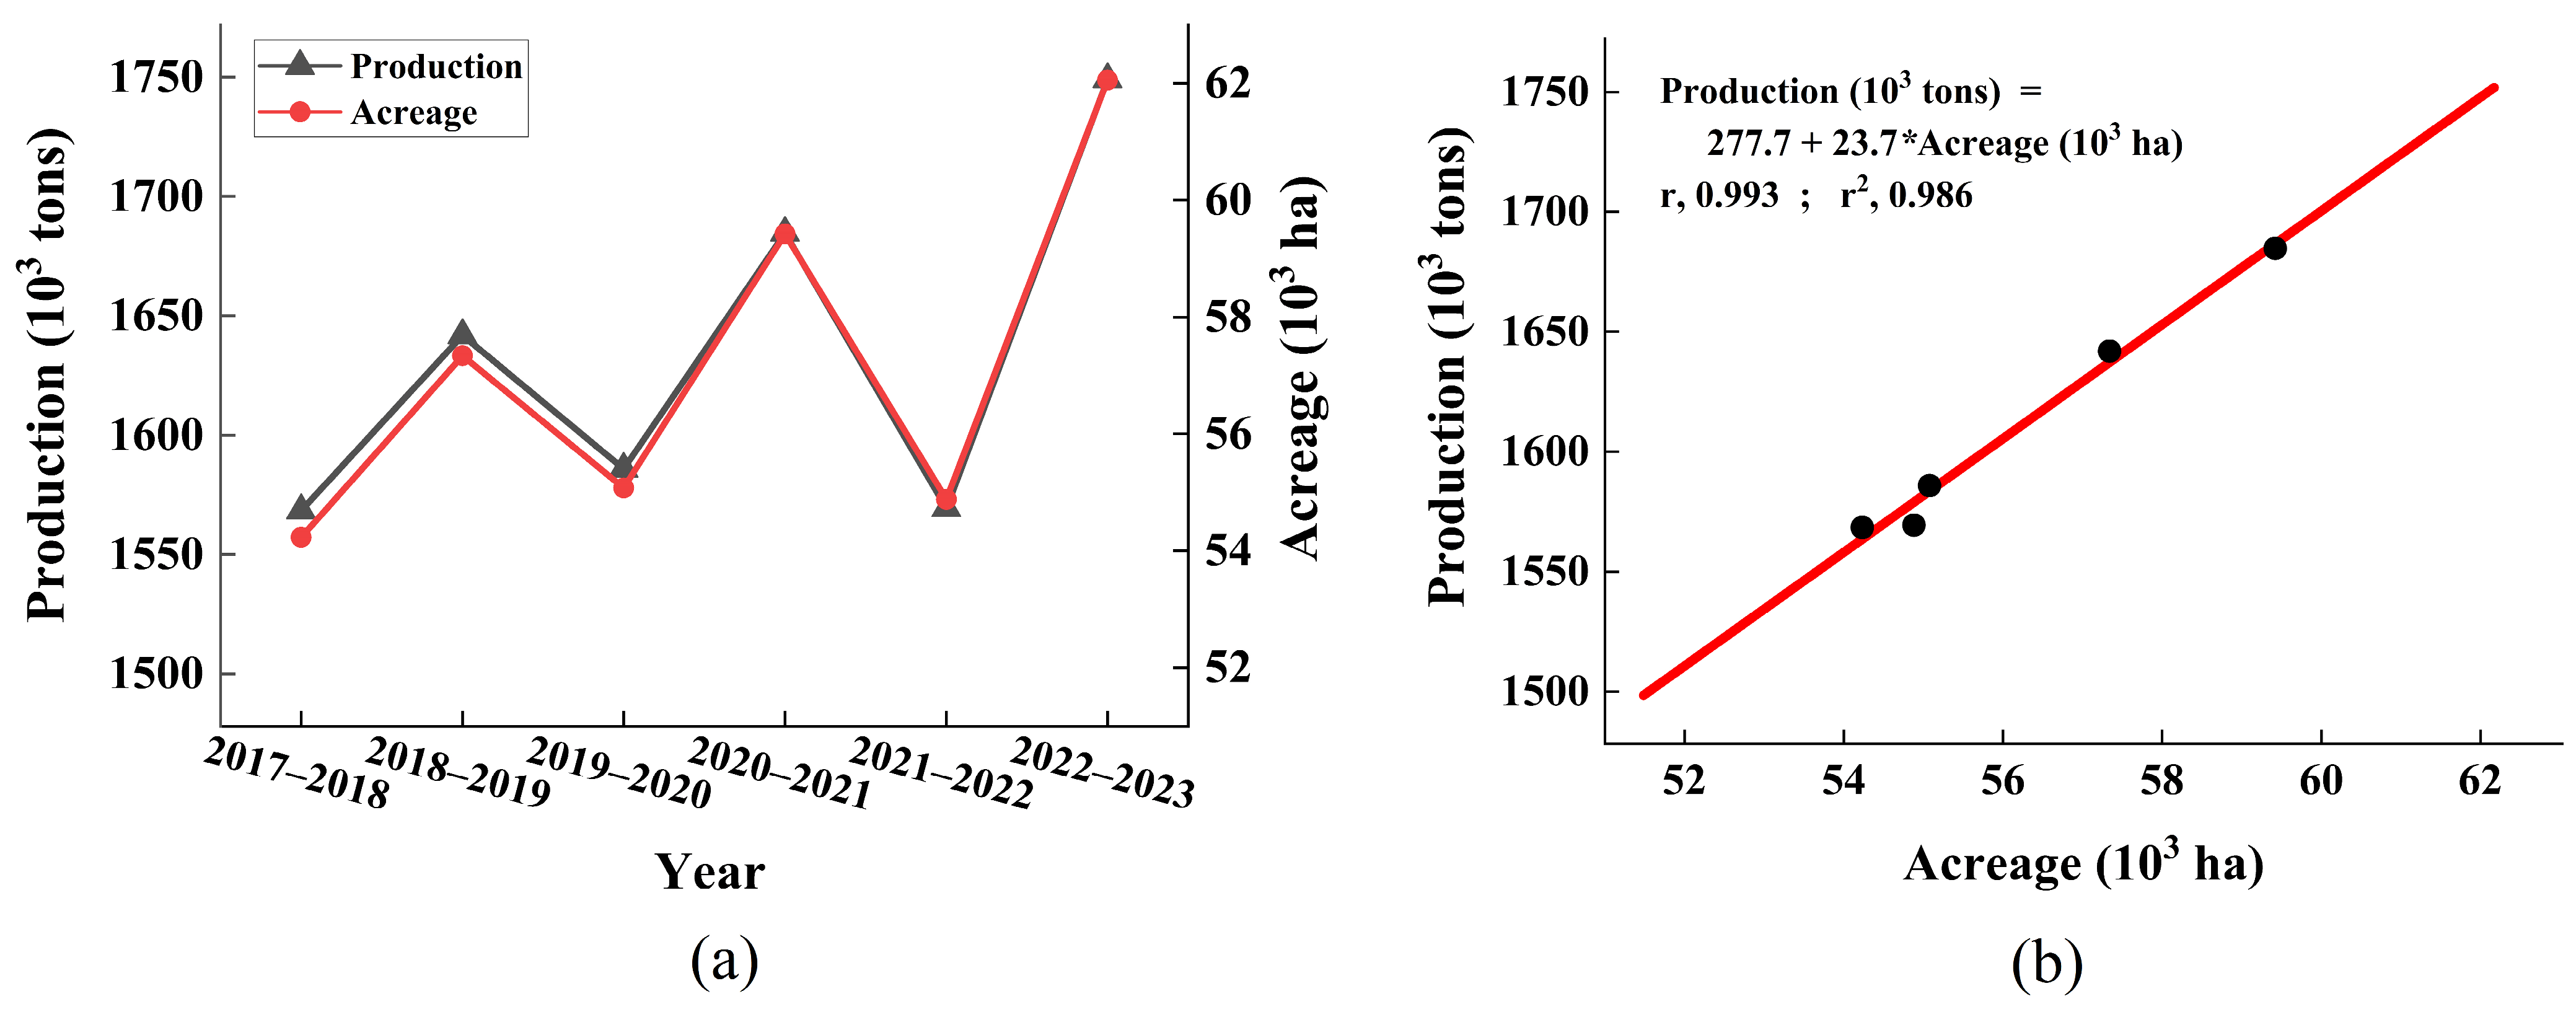
3.4. Association Between Cultivated Acreage and Production in South Korean Regions

Upon comparison, we found that the acreage data from 2017 to 2021 and the production data from the South Korean Fisheries Statistical Yearbook exhibited similar fluctuations, suggesting an association or causal relationship between the two (Figure 10a). In the analysis of the three aquaculture regions in South Korea, Jeollanam-do (Region 2) dominated in terms of cultivation area and production, accounting for as much as 88% of the total, and its trend of change was consistent with the overall trend. This indicates a significant impact of Jeollanam-do on the overall data. So, we analyzed the relationship for Jeollanam-do and revealed a very strong positive relationship between cultivated acreage and production (r = 0.99), with the equation showing a robust explanatory power (r2 = 0.99), accounting for nearly all the variability in production (Figure 10b). In other words, variations in acreage could accurately predict changes in production. Based on the strong association between production and acreage, we predict that the yield in 2022–2023 will be 1,749,145 tons, with a 95% confidence interval. However, due to the limited number of data points (only five years of data), the predictive power and robustness of the model may be constrained. Small sample sizes are susceptible to the influence of outliers or random fluctuations, and therefore, these statistical results should be approached with caution. To enhance the reliability of the model, it would be prudent to collect more data in the future to validate these findings, which would help to confirm the generalizability and robustness of the model.

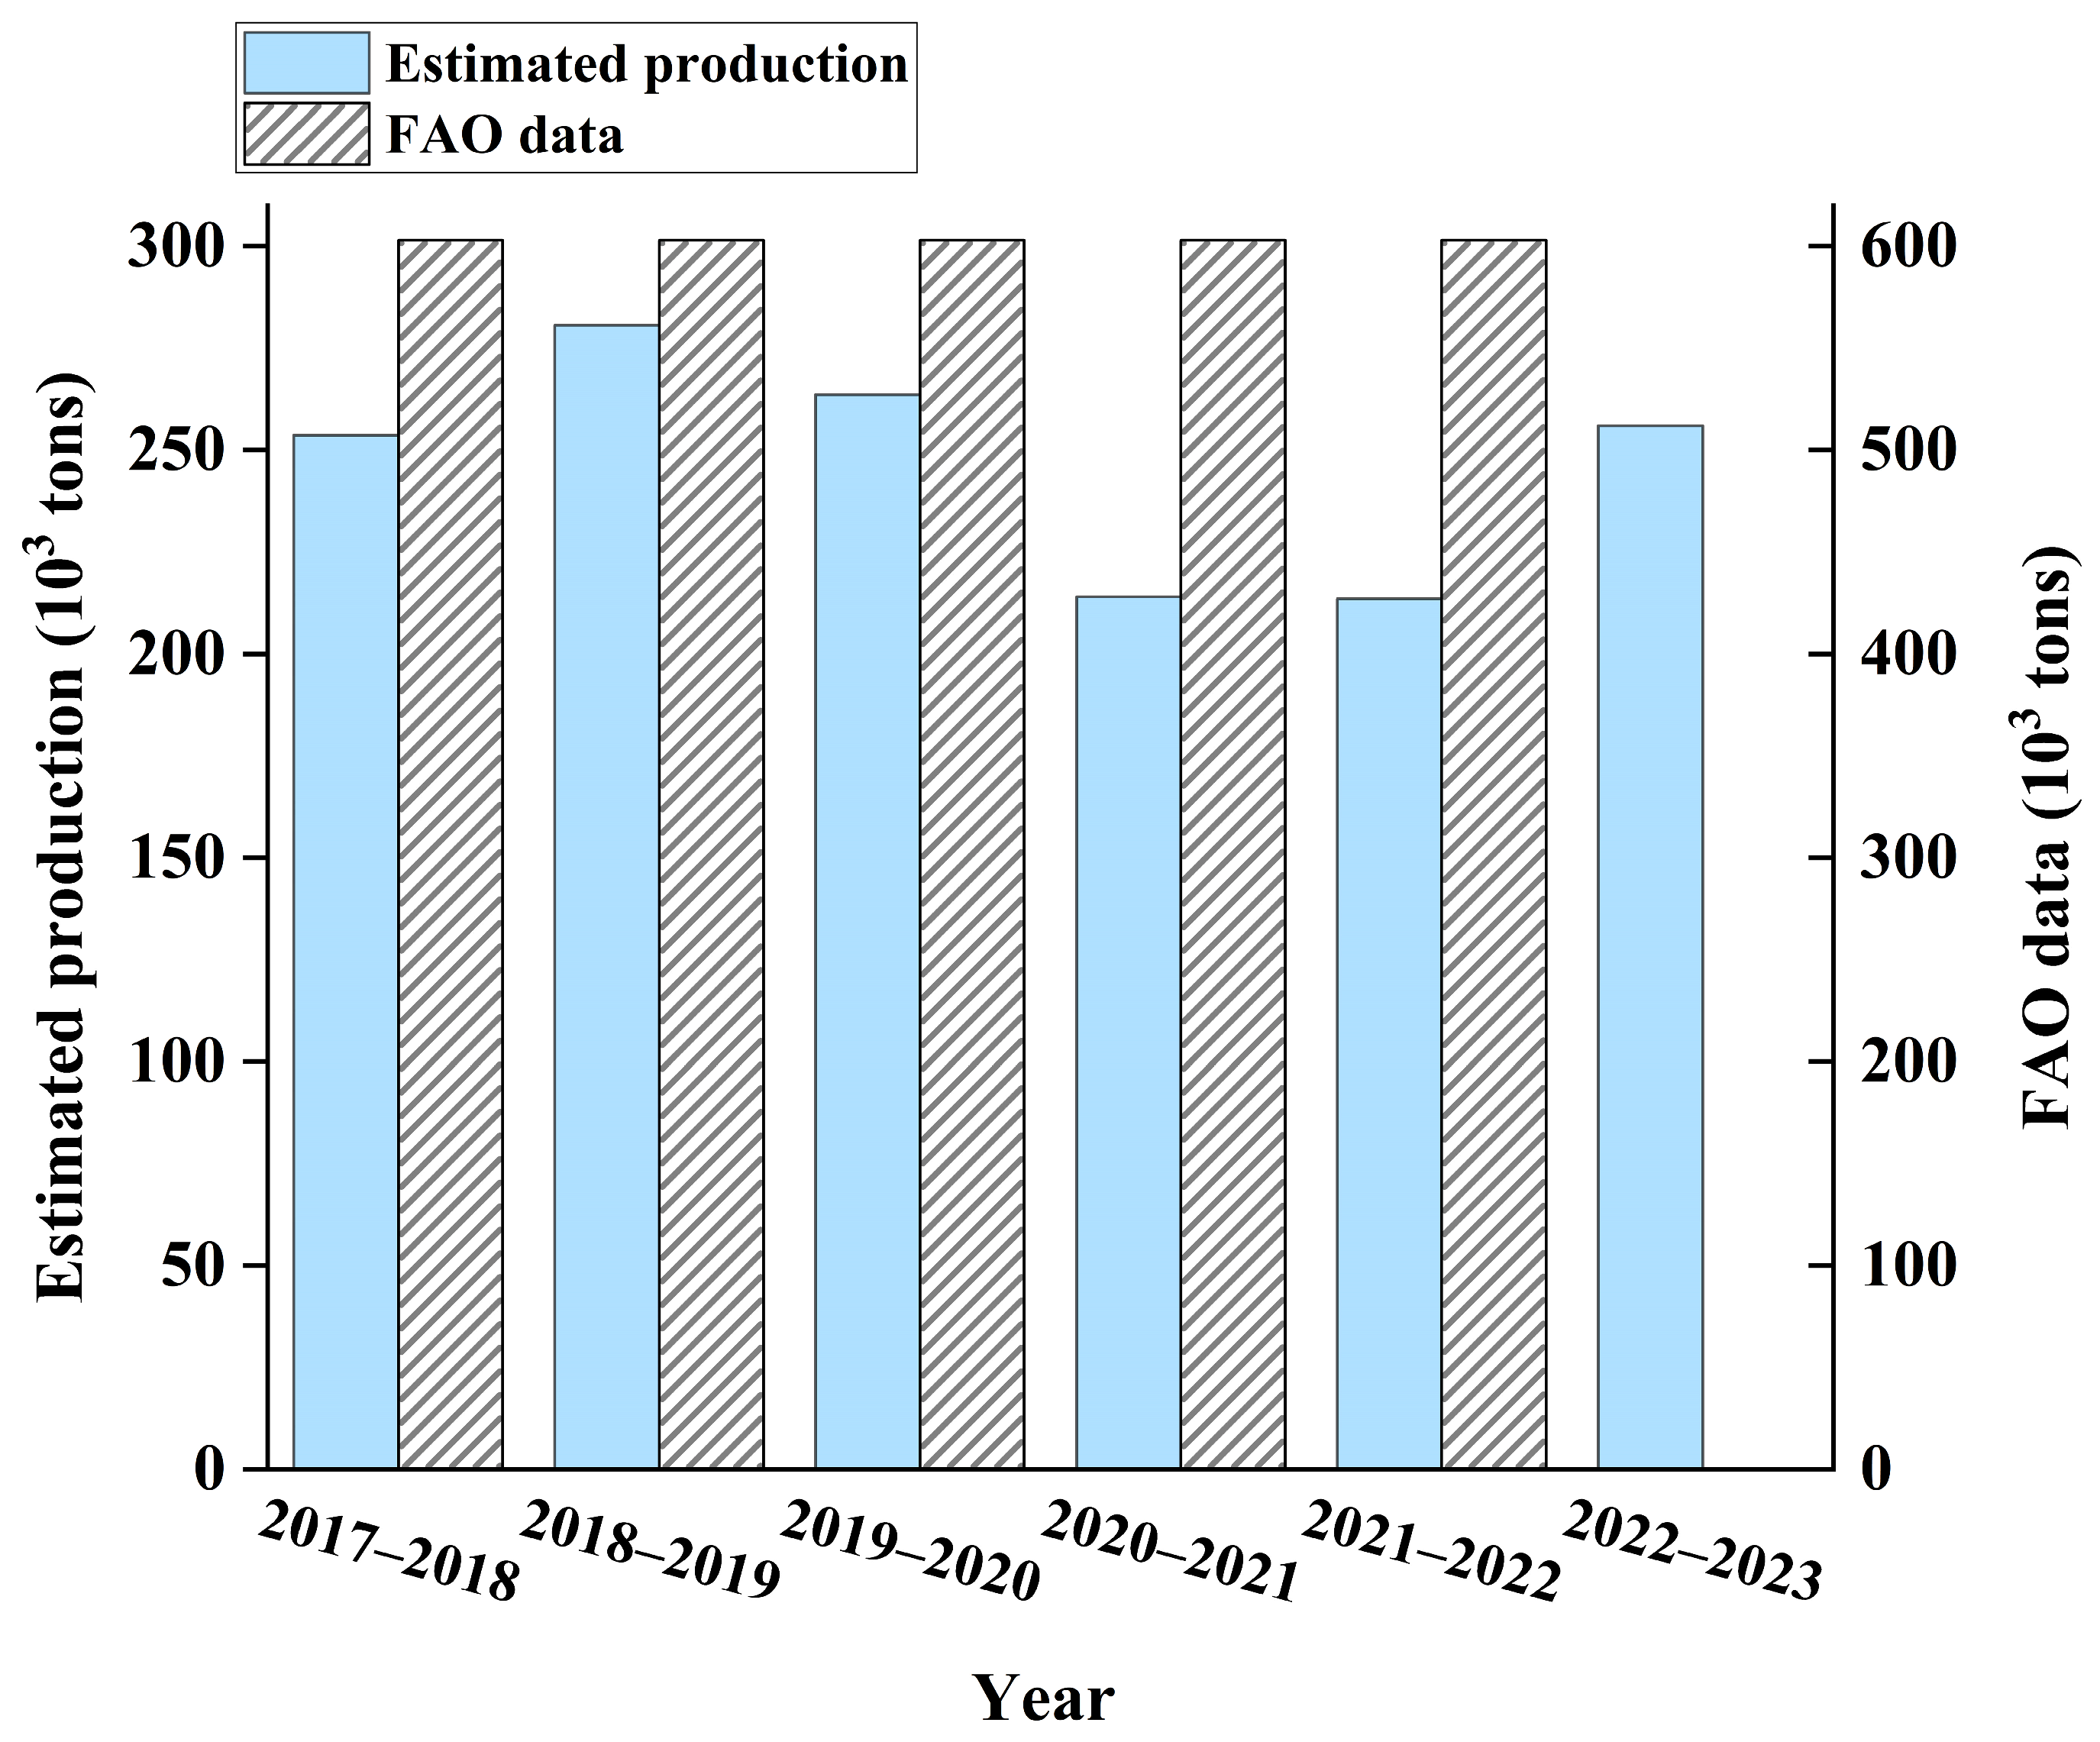
3.5. Estimating the Seaweed Production in North Korea

By incorporating the yields of laver and kelp and the cultivated acreage of corresponding species in North Korea we previously determined, the seaweed production in North Korea is estimated to be 253,648.1 during the period 2017–2018; 280,666.0 tons during the period 2018–2019; 263,590.8 tons during the period 2019–2020; 214,033.9 tons during the period 2020–2021; 213,532.2 tons during the period 2021–2022; and 255,965.2 tons during the period 2022–2023, respectively (Figure 11). However, during the same five consecutive harvest seasons, FAO data reported that the seaweed production in North Korea remained the same (600,000 tons). Notably, the production data of North Korea reported by FAO has been consistently labeled as ‘imputed’ since 2003. Furthermore, from 1960 to 2003, the country’s seaweed production exhibited considerable volatility, ranging from 4426 to 106,800 tons annually, without discernible regularity. This erratic fluctuation casts doubt on the data quality from the FAO report, which, on the other hand, shows the significance of remote sensing tools applied in monitoring the seaweed culture.

4. Discussion

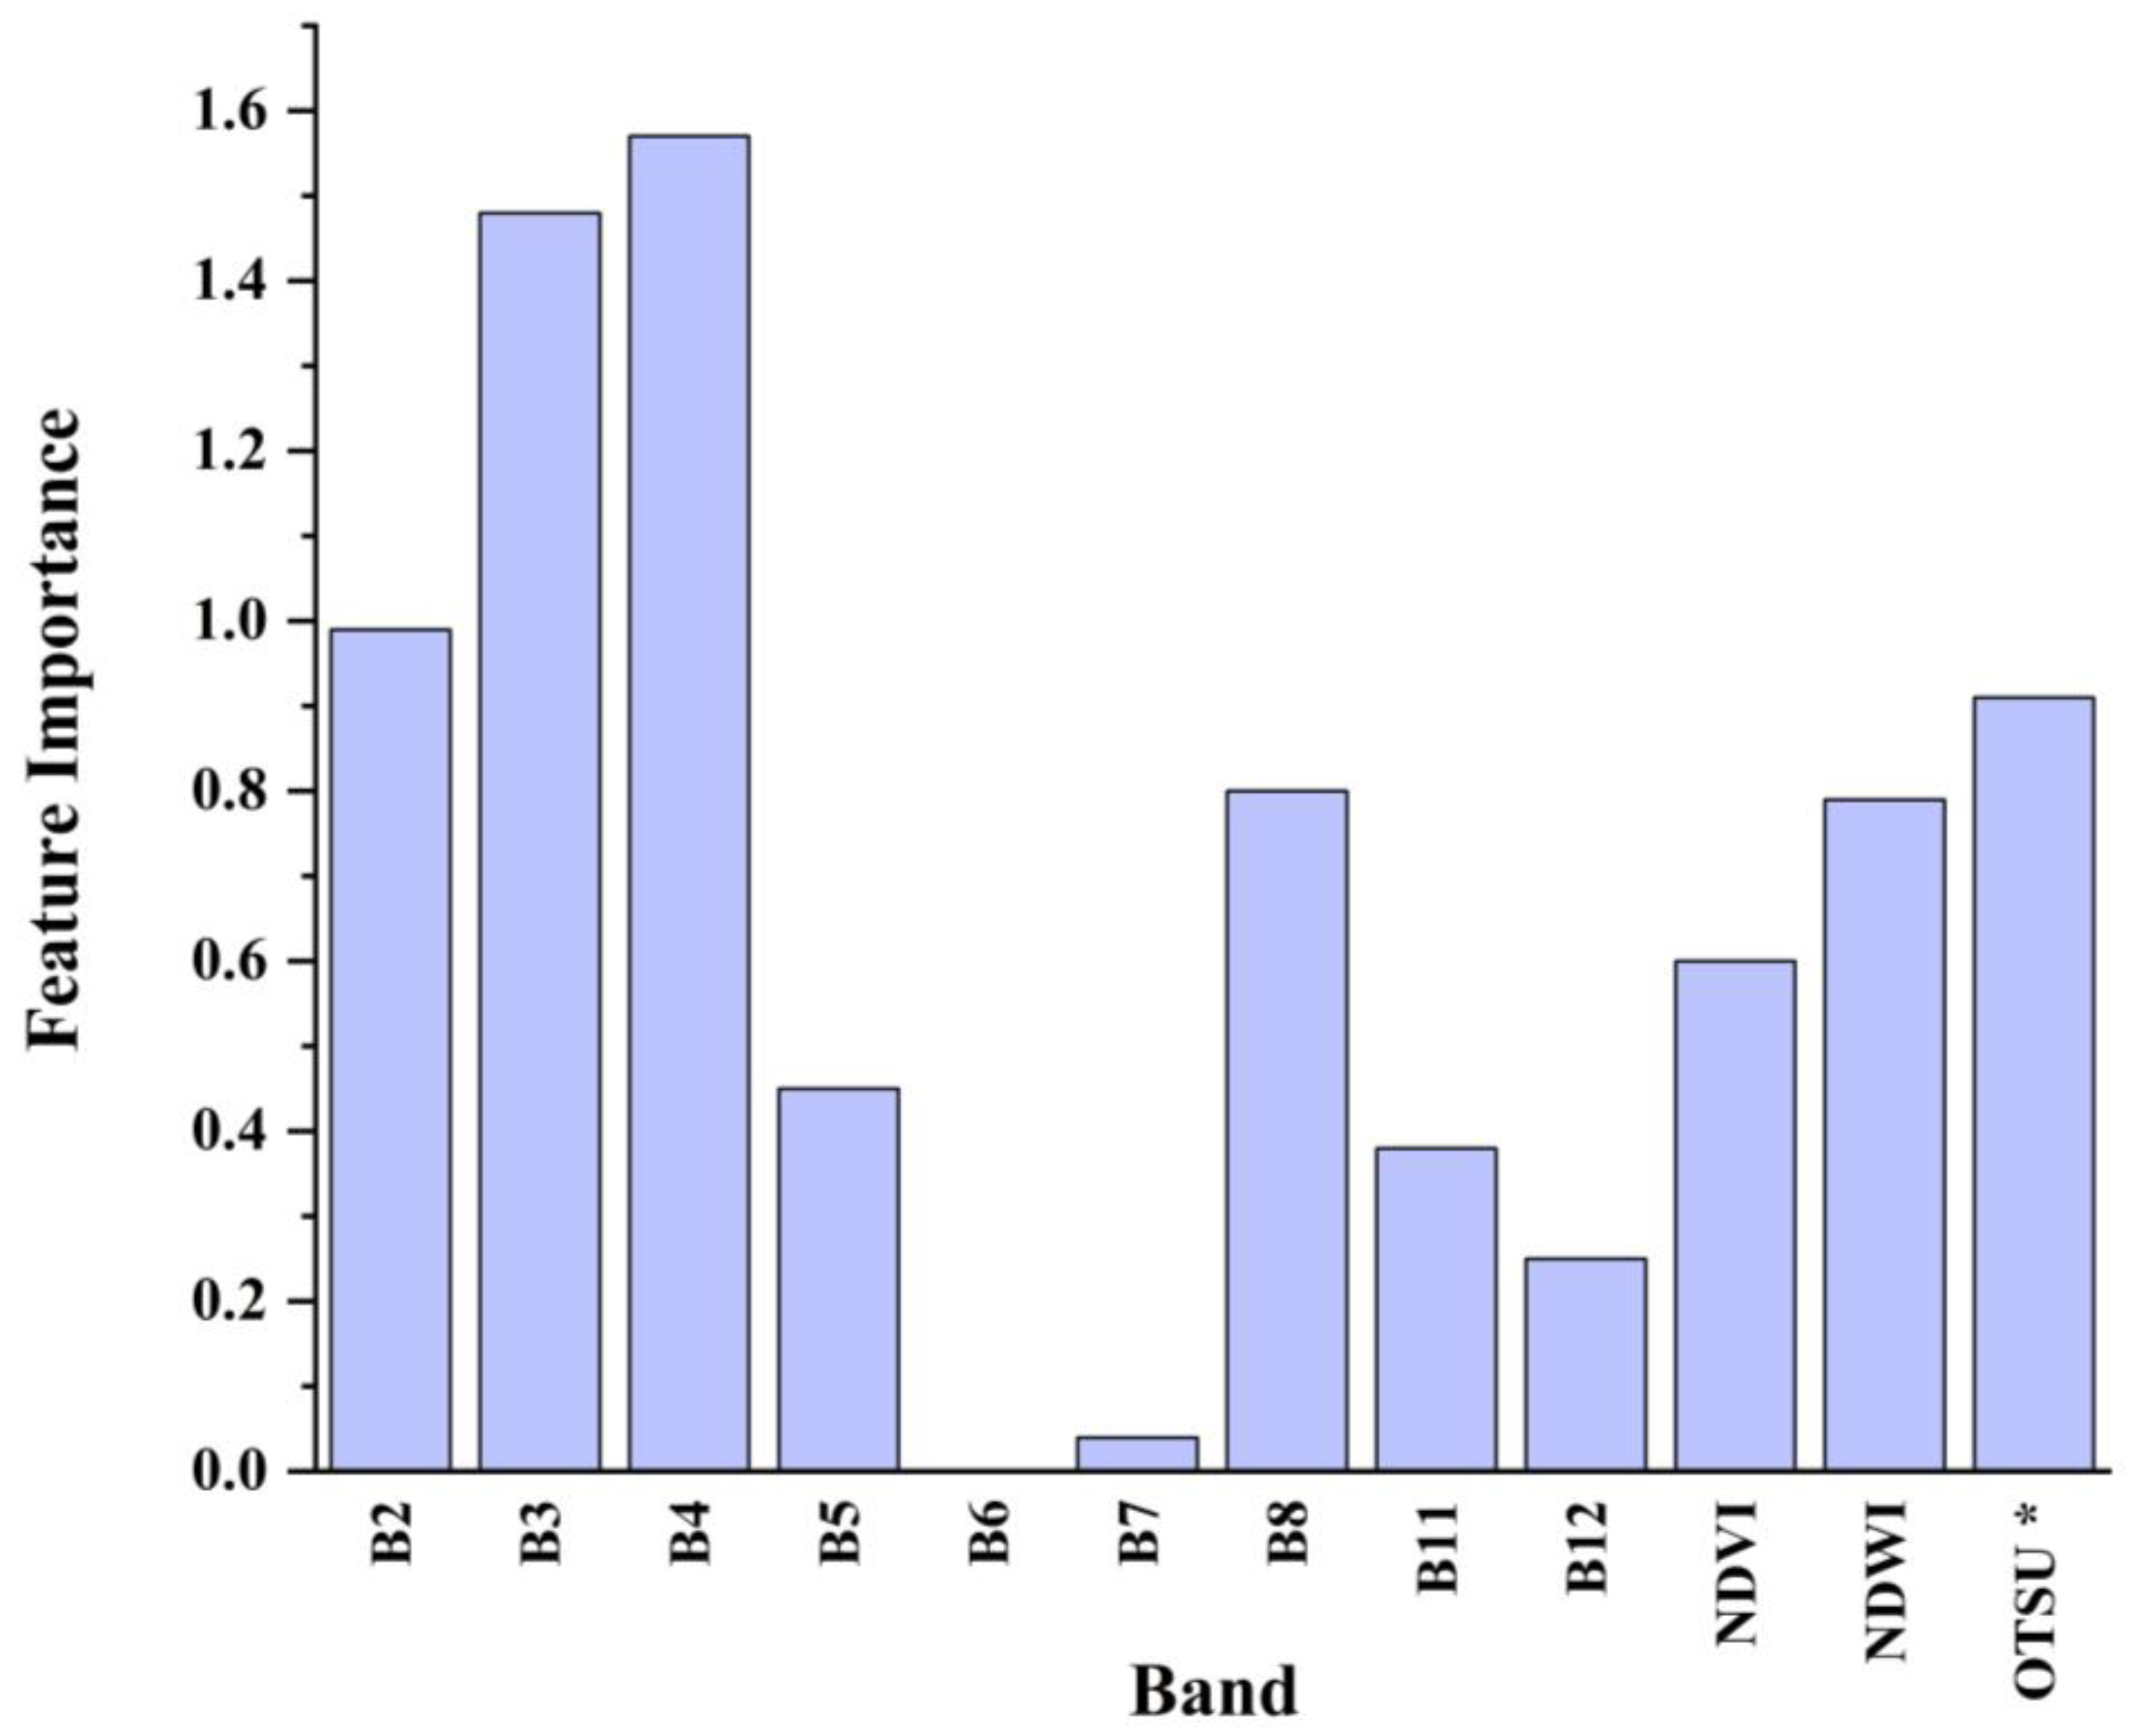
4.1. Model Performance and Feature Optimization for Seaweed Mapping

The random forest classifier demonstrated robust performance in distinguishing seaweed cultivation zones from seawater by effectively utilizing both spectral and spatial features. The integration of the Otsu algorithm further enhanced the classification accuracy by generating a binary mask that highlights potential cultivation areas. Band selection played a critical role in this process. Feature importance analysis (Figure 12) revealed that the Red (B4) and Green (B3) bands were the most critical, with importance scores of 1.57 and 1.48, respectively, which is consistent with chlorophyll’s strong absorption in these wavelengths. The Blue (B2) and NIR (B8) bands also played significant roles in the classification process, with importance scores of 0.99 and 0.8, respectively. NDWI (0.79) and NDVI (0.6) further enhanced the separability between seaweed and water, while the Otsu-derived binary layer (OTSU*) contributed spatial constraints, reducing false positives from non-cultivation areas (importance score: 0.91). The empirical tests of the band combinations confirmed the optimality of the selected features: the combination of B2, B3, B4, B8, NDVI, NDWI, and the OTSU* achieved near-perfect accuracy (OA = 0.99, Kappa = 0.98), while the exclusion of any key feature, such as NDVI or the OTSU*, resulted in a 1–2% reduction in overall accuracy. Notably, SWIR bands (B11, B12) contributed negligibly (importance scores ≤ 0.38), confirming their redundancy in this context (Table 2).
We evaluated the performance of other classifiers using identical training samples, encompassing support vector machine (SVM) [89] and decision tree (DT) [90]. The SVM achieved an OA of 0.89 and Kappa of 0.85, while the decision tree classifier performed well with an OA of 0.97 and Kappa of 0.94. The random forest model, with an OA of 0.99 and Kappa of 0.98, outperformed both of these models, further highlighting its robustness in seaweed aquaculture mapping (Table A2).
These findings underscore the synergy between spectral bands, vegetation indices, and spatial constraints in achieving high-accuracy seaweed mapping. While the current feature set is optimal for the dominant seaweed species in the Korean Peninsula, future studies targeting different regions should validate the importance of specific bands locally, particularly in areas with varying water clarity or seaweed species. This framework provides a replicable and efficient approach for large-scale seaweed monitoring, contributing to sustainable aquaculture management.

4.2. Improved Classification Strategy: Integration of Otsu Features and Multi-Temporal Analysis

In traditional applications, the Otsu algorithm typically serves as an independent segmentation step [64,65,72], where the binarization output is considered the final result. This conventional usage does not fully utilize the potential information contained in the binary patterns. In this study, we extend the application of Otsu’s algorithm from segmentation to feature extraction by incorporating the binarization results as spatial distribution descriptors into the feature space. This approach establishes a novel processing framework that integrates segmentation, feature extraction, and classification, providing enhanced discriminative information for the classification task.
To validate the effectiveness of the proposed method, we conducted experiments at three different sites with varying characteristics (Figure 13). At each site, we compared the extraction results using both with-Otsu and non-Otsu methods against the reference area. The experimental results demonstrated that the integration of the Otsu thresholding method consistently improved the classification accuracy across all test sites. Specifically, for Site 1 (reference area: 669.01 ha), the with-Otsu method achieved an Overall Accuracy (OA) of 0.98 and a Kappa coefficient of 0.95, compared to an OA of 0.96 and a Kappa coefficient of 0.92 for the non-Otsu method. Similar improvements were observed in Site 2 (reference area: 197.34 ha) and Site 3 (reference area: 1098.84 ha), with the with-Otsu method consistently showing 2–3 percentage points improvement in both OA and Kappa coefficients.
The superior performance of the proposed method can be attributed to its enhanced ability to differentiate between water and seaweed pixels. The quantitative analysis of classification results reveals that the non-Otsu method demonstrated a notable tendency to misclassify water pixels as seaweed, resulting in larger deviations from the reference area. For example, in Site 3, the non-Otsu method overestimated the seaweed area by 117.53 ha, while the with-Otsu method reduced this overestimation to 89.37 ha. Although pixel-based classification methods are inherently susceptible to salt-and-pepper noise [91], the incorporation of Otsu thresholding results as a classification feature significantly mitigated this effect.
Furthermore, we observed that seaweed cultivation areas within the same region often exhibit heterogeneous growth stages, making single-epoch image classification susceptible to omission errors, particularly in newly seeded or early-stage cultivation areas. To mitigate this limitation, we adopted a simple yet effective approach by combining classification results from multiple epochs. The combined results were subsequently refined using focal mode filtering to reduce classification noise and eliminate spatial fragmentation (Figure 14). This straightforward temporal integration strategy helped improve the completeness of seaweed cultivation area detection.
This comprehensive approach strikes an optimal balance between accuracy and efficiency, offering superior noise reduction compared to traditional pixel-based methods while maintaining higher computational efficiency than object-oriented classification approaches. Combining Otsu features and multi-temporal integration improves classification accuracy and enhances seaweed detection’s robustness by reducing false positives in water regions and better capturing cultivation areas at different growth stages, demonstrating its potential for robust and efficient large-scale seaweed monitoring applications.

4.3. Bridging the Data Gap: Efficient and Timely Monitoring of Seaweed Cultivation

The traditional statistical reporting of seaweed cultivation faces significant challenges in providing timely and comprehensive information. For instance, the Fishery Statistical Yearbook released by the South Korean government in December 2023 primarily contains data from 2022, indicating a two-year lag between cultivation initiation and statistical reporting [24]. Moreover, these official statistics only provide production data without detailed information on cultivation areas. The situation is even more challenging for North Korea, where both production and acreage data are largely inaccessible through conventional channels.
Our remote sensing-based approach effectively addresses these limitations by providing a rapid and accurate assessment of seaweed cultivation areas. By analyzing the satellite imagery from 2022 to 2023, we achieved both timely monitoring and high accuracy, with overall accuracy and Kappa coefficients consistently exceeding 90%. This method not only bridges the temporal gap in data availability but also supplements existing statistics with crucial spatial information.
In the case of North Korea, while acknowledging potential variations in cultivation techniques and environmental influences on seaweed production, our analytical framework provides the fundamental estimates of cultivation extent and distribution patterns from 2017 to 2023. Although actual production may vary based on specific conditions, this approach represents a practical methodology for assessing agricultural potential in regions where direct data collection is limited. The resulting analysis contributes to a more comprehensive understanding of regional agricultural dynamics and supports evidence-based decision making for sustainable seaweed cultivation management.
This remote sensing-based monitoring approach demonstrates significant advantages in terms of efficiency, timeliness, and cost-effectiveness. It not only addresses the current data gaps in both South and North Korea but also holds considerable reference value for the global seaweed cultivation community.

4.4. Adaptive Remote Sensing Strategies for Seaweed Farm Monitoring Amidst Environmental Variability

The Korean Peninsula predominantly employs large-scale floating cultivation systems, which remain visible in satellite imagery throughout the growth cycle regardless of tidal changes. However, challenges exist where seagrass beds adjacent to seaweed farms can compromise classification accuracy, particularly during low tide when seagrass exposure may obscure floating cultivation apparatus. This explains the accuracy variations between North and South Korea. To address this, we strategically selected imagery captured during high tide when seagrass beds are submerged, enabling the better differentiation of floating cultivation structures.
While our approach effectively addresses most environmental interference factors, limitations in current satellite imagery’s temporal and spatial resolution may result in minor omissions. The future integration of higher-resolution data sources, such as Planet satellites, could further enhance monitoring accuracy and support more efficient aquaculture management.

5. Conclusions

This study developed an integrated approach combining Otsu features with Random Forest classification to monitor seaweed cultivation across the Korean Peninsula from 2017 to 2023. By leveraging Google Earth Engine and Sentinel-2 imagery, we successfully mapped cultivation zones and identified key species, revealing contrasting patterns: small-scale fluctuations in North Korea (1505.9–2033.1 ha) versus substantial expansion in South Korea (54,961.9 to 63,170.6 ha). The strong correlation (r2 = 0.99) between cultivation acreage and production enabled the reliable estimation of seaweed yields in regions lacking official statistics.
To comprehensively understand the drivers behind these spatial patterns, further research should examine the impacts of environmental policies, economic factors, technological innovations, and market dynamics. Long-term monitoring will be crucial for evaluating the ecological implications of seaweed cultivation expansion. Building upon the comprehensive mapping of Chinese seaweed farms, our study advances the global monitoring of key seaweed farming regions. This ongoing endeavor not only enriches our comprehension of the world’s major seaweed regions but also contributes to the sustainable management and ecological preservation of these vital resources.

Author Contributions

Data curation, S.C.; Formal analysis, S.C.; Funding acquisition, J.W.; Investigation, S.C.; Methodology, S.C.; Resources, S.C.; Supervision, J.W., J.H. and Y.Z.; Validation, Z.Y., R.J., J.Z. and N.W.; Visualization, S.C.; Writing—original draft, S.C.; Writing—review and editing, S.C. All authors have read and agreed to the published version of the manuscript.

Funding

This research was funded by the National Key R&D Project (Grant No. 2023YFE0113103) and the Shanghai Pujiang Programme (Grant No. 23PJD008).

Data Availability Statement

Public datasets form the basis of this research. Analyses were performed on Google Earth Engine’s cloud platform (https://earthengine.google.com/, accessed 20 June 2024), a tool developed collaboratively by Google, Carnegie Mellon University, and USGS. Sentinel data are freely available within the Google Earth Engine environment. Those interested in obtaining raw data should contact jw67@zju.edu.cn.

Acknowledgments

We appreciate the Google Earth Engine platform’s capabilities in facilitating both the acquisition and analysis of Sentinel-2 datasets.

Conflicts of Interest

The authors declare no conflicts of interest.

Appendix A

Table A1. Number of scenes of Sentinel-2 imagery used in the study from 2017 to 2023.
YearsNumber of Scenes
2017–201824
2018–201927
2019–202025
2020–202124
2021–202223
2022–202323
Table A2. Classification accuracy of different models for seaweed mapping.
Classification ModelOverall Accuracy (OA)Kappa
Random forest0.990.98
Support vector machine0.890.85
Decision tree0.970.94

References

  1. Choudhary, P.; Khade, M.; Savant, S.; Musale, A.; Chelliah, M.S.; Dasgupta, S. Empowering Blue Economy: From Underrated Ecosystem to Sustainable Industry. J. Environ. Manag. 2021, 291, 112697. [Google Scholar] [CrossRef] [PubMed]
  2. Xiao, X.; Agustí, S.; Yu, Y.; Huang, Y.; Chen, W.; Hu, J.; Li, C.; Li, K.; Wei, F.; Lu, Y.; et al. Seaweed Farms Provide Refugia from Ocean Acidification. Sci. Total Environ. 2021, 776, 145192. [Google Scholar] [CrossRef] [PubMed]
  3. Krause-Jensen, D.; Duarte, C.M. Substantial Role of Macroalgae in Marine Carbon Sequestration. Nat. Geosci. 2016, 9, 737–742. [Google Scholar] [CrossRef]
  4. Macreadie, P.I.; Anton, A.; Raven, J.A.; Beaumont, N.; Connolly, R.M.; Friess, D.A.; Kelleway, J.J.; Kennedy, H.; Kuwae, T.; Lavery, P.S.; et al. The Future of Blue Carbon Science. Nat. Commun. 2019, 10, 3998. [Google Scholar] [CrossRef]
  5. Mashoreng, S.; Nafie, Y.A.L.; Isyrini, R. Cultivated Seaweed Carbon Sequestration Capacity. IOP Conf. Ser. Earth Environ. Sci. 2019, 370, 012017. [Google Scholar] [CrossRef]
  6. Duarte, C.M.; Losada, I.J.; Hendriks, I.E.; Mazarrasa, I.; Marbà, N. The Role of Coastal Plant Communities for Climate Change Mitigation and Adaptation. Nat. Clim. Change 2013, 3, 961–968. [Google Scholar] [CrossRef]
  7. Duarte, C.M.; Wu, J.; Xiao, X.; Bruhn, A.; Krause-Jensen, D. Can Seaweed Farming Play a Role in Climate Change Mitigation and Adaptation? Front. Mar. Sci. 2017, 4, 100. [Google Scholar] [CrossRef]
  8. Froehlich, H.E.; Afflerbach, J.C.; Frazier, M.; Halpern, B.S. Blue Growth Potential to Mitigate Climate Change through Seaweed Offsetting. Curr. Biol. 2019, 29, 3087–3093.e3. [Google Scholar] [CrossRef]
  9. Wu, J.; Zhang, H.; Pan, Y.; Krause-Jensen, D.; He, Z.; Fan, W.; Xiao, X.; Chung, I.; Marbà, N.; Serrano, O.; et al. Opportunities for Blue Carbon Strategies in China. Ocean Coast. Manag. 2020, 194, 105241. [Google Scholar] [CrossRef]
  10. Yong, W.T.L.; Thien, V.Y.; Rupert, R.; Rodrigues, K.F. Seaweed: A Potential Climate Change Solution. Renew. Sustain. Energy Rev. 2022, 159, 112222. [Google Scholar] [CrossRef]
  11. Cotas, J.; Gomes, L.; Pacheco, D.; Pereira, L. Ecosystem Services Provided by Seaweeds. Hydrobiology 2023, 2, 75–96. [Google Scholar] [CrossRef]
  12. Wernberg, T.; Thomsen, M.S.; Kotta, J. Complex Plant–Herbivore–Predator Interactions in a Brackish Water Seaweed Habitat. J. Exp. Mar. Biol. Ecol. 2013, 449, 51–56. [Google Scholar] [CrossRef]
  13. Al, M.A.; Akhtar, A.; Rahman, M.F.; Kamal, A.H.M.; Karim, N.U.; Hassan, M.L. Habitat Structure and Diversity Patterns of Seaweeds in the Coastal Waters of Saint Martin’s Island, Bay of Bengal, Bangladesh. Reg. Stud. Mar. Sci. 2020, 33, 100959. [Google Scholar] [CrossRef]
  14. Dijkstra, J.A.; Harris, L.G.; Mello, K.; Litterer, A.; Wells, C.; Ware, C. Invasive Seaweeds Transform Habitat Structure and Increase Biodiversity of Associated Species. J. Ecol. 2017, 105, 1668–1678. [Google Scholar] [CrossRef]
  15. Radulovich, R.; Umanzor, S.; Cabrera, R.; Mata, R. Tropical Seaweeds for Human Food, Their Cultivation and Its Effect on Biodiversity Enrichment. Aquaculture 2015, 436, 40–46. [Google Scholar] [CrossRef]
  16. Racine, P.; Marley, A.; Froehlich, H.E.; Gaines, S.D.; Ladner, I.; MacAdam-Somer, I.; Bradley, D. A Case for Seaweed Aquaculture Inclusion in U.S. Nutrient Pollution Management. Mar. Policy 2021, 129, 104506. [Google Scholar] [CrossRef]
  17. Xiao, X.; Agusti, S.; Lin, F.; Li, K.; Pan, Y.; Yu, Y.; Zheng, Y.; Wu, J.; Duarte, C.M. Nutrient Removal from Chinese Coastal Waters by Large-Scale Seaweed Aquaculture. Sci. Rep. 2017, 7, 46613. [Google Scholar] [CrossRef]
  18. Zhu, Y.; Wang, Z.; Song, L.; Christakos, G.; Agusti, S.; Duarte, C.; Wu, J. Dynamics of Phytoplankton Community in Relation to Seasonal Variation and Laminaria Japonica Culturing in Coastal Area. Estuar. Coast. Shelf Sci. 2022, 277, 108063. [Google Scholar] [CrossRef]
  19. Farghali, M.; Mohamed, I.M.A.; Osman, A.I.; Rooney, D.W. Seaweed for Climate Mitigation, Wastewater Treatment, Bioenergy, Bioplastic, Biochar, Food, Pharmaceuticals, and Cosmetics: A Review. Environ. Chem. Lett. 2023, 21, 97–152. [Google Scholar] [CrossRef]
  20. Duarte, C.M.; Bruhn, A.; Krause-Jensen, D. A Seaweed Aquaculture Imperative to Meet Global Sustainability Targets. Nat. Sustain. 2021, 5, 185–193. [Google Scholar] [CrossRef]
  21. Kim, K.Y.; Kim, K.Y. Harnessing Seaweed Farming for Climate Mitigation in South Korea: Evaluating Carbon Dioxide Removal Potential and Future Research Directions. Algae 2024, 39, 329–347. [Google Scholar] [CrossRef]
  22. Hwang, E.K.; Choi, H.G.; Kim, J.K. Seaweed Resources of Korea. Bot. Mar. 2020, 63, 395–405. [Google Scholar] [CrossRef]
  23. Hwang, E.K.; Boo, G.H.; Graf, L.; Yarish, C.; Yoon, H.S.; Kim, J.K. Kelps in Korea: From Population Structure to Aquaculture to Potential Carbon Sequestration. Algae 2022, 37, 85–103. [Google Scholar] [CrossRef]
  24. Statistical Yearbook of Oceans and Fisheries 2023. Available online: https://www.mof.go.kr/statPortal/stp/cts/anr/statsAnlrpt.do (accessed on 29 March 2024).
  25. FishStat: Global Aquaculture Production 1950–2022. Available online: https://www.fao.org/fishery/en/statistics/software/fishstatj (accessed on 29 March 2024).
  26. Nagahawatta, D.P.; Liyanage, N.M.; Jayawardena, T.U.; Yang, F.; Jayawardena, H.H.a.C.K.; Kurera, M.J.M.S.; Wang, F.; Fu, X.; Jeon, Y.-J.; Nagahawatta, D.P.; et al. Functions and Values of Sulfated Polysaccharides from Seaweed. Algae 2023, 38, 217–240. [Google Scholar] [CrossRef]
  27. Lee, H.-G.; Nagahawatta, D.P.; Liyanage, N.M.; Jayawardhana, H.H.A.C.K.; Yang, F.; Je, J.-G.; Kang, M.-C.; Kim, H.-S.; Jeon, Y.-J.; Lee, H.-G.; et al. Structural Characterization and Anti-Inflammatory Activity of Fucoidan Isolated from Ecklonia maxima Stipe. Algae 2022, 37, 239–247. [Google Scholar] [CrossRef]
  28. Park, M.; Shin, S.K.; Do, Y.H.; Yarish, C.; Kim, J.K. Application of Open Water Integrated Multi-Trophic Aquaculture to Intensive Monoculture: A Review of the Current Status and Challenges in Korea. Aquaculture 2018, 497, 174–183. [Google Scholar] [CrossRef]
  29. Hwang, E.K.; Park, C.S. Seaweed Cultivation and Utilization of Korea. ALGAE 2020, 35, 107–121. [Google Scholar] [CrossRef]
  30. Assefa, A.; Haile, A.T.; Dhanya, C.T.; Walker, D.W.; Gowing, J.; Parkin, G. Impact of Sustainable Land Management on Vegetation Cover Using Remote Sensing in Magera Micro Watershed, Omo Gibe Basin, Ethiopia. Int. J. Appl. Earth Obs. Geoinform. 2021, 103, 102495. [Google Scholar] [CrossRef]
  31. Aurin, D.A.; Dierssen, H.M. Advantages and Limitations of Ocean Color Remote Sensing in CDOM-Dominated, Mineral-Rich Coastal and Estuarine Waters. Remote Sens. Environ. 2012, 125, 181–197. [Google Scholar] [CrossRef]
  32. Cheng, X.; Yang, J.; Han, Z.; Shi, G.; Pan, D.; Meng, L.; Zeng, Z.; Shen, Z. Optimizing Rural Waste Management: Leveraging High-Resolution Remote Sensing and GIS for Efficient Collection and Routing. Int. J. Appl. Earth Obs. Geoinform. 2024, 135, 104219. [Google Scholar] [CrossRef]
  33. Hossain, M.S.; Hashim, M. Potential of Earth Observation (EO) Technologies for Seagrass Ecosystem Service Assessments. Int. J. Appl. Earth Obs. Geoinform. 2019, 77, 15–29. [Google Scholar] [CrossRef]
  34. Pasqualini, V.; Pergent-Martini, C.; Fernandez, C.; Pergent, G. The Use of Airborne Remote Sensing for Benthic Cartography: Advantages and Reliability. Int. J. Remote Sens. 1997, 18, 1167–1177. [Google Scholar] [CrossRef]
  35. Virtriana, R.; Anggraini, T.S.; Ihsan, K.T.N.; Alifah, M.N.; Retnowati, D.A.; Rohayani, P.; Harto, A.B.; Riqqi, A. Developing a Spatial-Based Predictive Model for Conservation Area Management Prioritization Using Ecosystem Service and Site Suitability Index in Java Island. Int. J. Appl. Earth Obs. Geoinform. 2024, 126, 103606. [Google Scholar] [CrossRef]
  36. Wang, K.; Franklin, S.E.; Guo, X.; Cattet, M. Remote Sensing of Ecology, Biodiversity and Conservation: A Review from the Perspective of Remote Sensing Specialists. Sensors 2010, 10, 9647–9667. [Google Scholar] [CrossRef]
  37. Xie, Y.; Sha, Z.; Yu, M. Remote Sensing Imagery in Vegetation Mapping: A Review. J. Plant Ecol. 2008, 1, 9–23. [Google Scholar]
  38. Duan, H.; Yang, C.; Yu, X. Evaluation of Historical and Future Coastal Wetland Change in the Yellow and Bohai Seas Using Satellite Images and a Land Use Model. J. Environ. Manag. 2024, 351, 119986. [Google Scholar] [CrossRef]
  39. Mahrad, B.E.; Newton, A.; Icely, J.; Kacimi, I.; Abalansa, S.; Snoussi, M. Contribution of Remote Sensing Technologies to a Holistic Coastal and Marine Environmental Management Framework: A Review. Remote Sens. 2020, 12, 2313. [Google Scholar] [CrossRef]
  40. Bai, J.; Li, Y.; Chen, S.; Du, J.; Wang, D. Long-Time Monitoring of Seagrass Beds on the East Coast of Hainan Island Based on Remote Sensing Images. Ecol. Indic. 2023, 157, 111272. [Google Scholar] [CrossRef]
  41. Li, Q.; Jin, R.; Ye, Z.; Gu, J.; Dan, L.; He, J.; Christakos, G.; Agusti, S.; Duarte, C.M.; Wu, J. Mapping Seagrass Meadows in Coastal China Using GEE. Geocarto Int. 2022, 37, 12602–12617. [Google Scholar] [CrossRef]
  42. Pu, R.; Bell, S. Mapping Seagrass Coverage and Spatial Patterns with High Spatial Resolution IKONOS Imagery. Int. J. Appl. Earth Obs. Geoinform. 2017, 54, 145–158. [Google Scholar] [CrossRef]
  43. Topouzelis, K.; Makri, D.; Stoupas, N.; Papakonstantinou, A.; Katsanevakis, S. Seagrass Mapping in Greek Territorial Waters Using Landsat-8 Satellite Images. Int. J. Appl. Earth Obs. Geoinform. 2018, 67, 98–113. [Google Scholar] [CrossRef]
  44. Wang, X.; Xiao, X.; Zou, Z.; Chen, B.; Ma, J.; Dong, J.; Doughty, R.B.; Zhong, Q.; Qin, Y.; Dai, S.; et al. Tracking Annual Changes of Coastal Tidal Flats in China during 1986–2016 through Analyses of Landsat Images with Google Earth Engine. Remote Sens. Environ. 2020, 238, 110987. [Google Scholar] [CrossRef] [PubMed]
  45. Chen, G.; Jin, R.; Ye, Z.; Li, Q.; Gu, J.; Luo, M.; Luo, Y.; Christakos, G.; Morris, J.; He, J.; et al. Spatiotemporal Mapping of Salt Marshes in the Intertidal Zone of China during 1985–2019. J. Remote Sens. 2022, 2022, 9793626. [Google Scholar] [CrossRef]
  46. Chen, C.; Ma, Y.; Yu, D.; Hu, Y.; Ren, L. Tracking Annual Dynamics of Carbon Storage of Salt Marsh Plants in the Yellow River Delta National Nature Reserve of China Based on Sentinel-2 Imagery during 2017–2022. Int. J. Appl. Earth Obs. Geoinform. 2024, 130, 103880. [Google Scholar] [CrossRef]
  47. Stückemann, K.-J.; Waske, B. Mapping Lower Saxony’s Salt Marshes Using Temporal Metrics of Multi-Sensor Satellite Data. Int. J. Appl. Earth Obs. Geoinform. 2022, 115, 103123. [Google Scholar] [CrossRef]
  48. Sunkur, R.; Kantamaneni, K.; Bokhoree, C.; Rathnayake, U.; Fernando, M. Mangrove Mapping and Monitoring Using Remote Sensing Techniques towards Climate Change Resilience. Sci. Rep. 2024, 14, 6949. [Google Scholar] [CrossRef]
  49. Zheng, Y.; Takeuchi, W. Quantitative Assessment and Driving Force Analysis of Mangrove Forest Changes in China from 1985 to 2018 by Integrating Optical and Radar Imagery. ISPRS Int. J. Geo-Inf. 2020, 9, 513. [Google Scholar] [CrossRef]
  50. Duan, Y.; Li, X.; Zhang, L.; Chen, D.; Liu, S.; Ji, H. Mapping National-Scale Aquaculture Ponds Based on the Google Earth Engine in the Chinese Coastal Zone. Aquaculture 2020, 520, 734666. [Google Scholar] [CrossRef]
  51. Luo, J.; Sun, Z.; Lu, L.; Xiong, Z.; Cui, L.; Mao, Z. Rapid Expansion of Coastal Aquaculture Ponds in Southeast Asia: Patterns, Drivers and Impacts. J. Environ. Manag. 2022, 315, 115100. [Google Scholar] [CrossRef]
  52. Alexandridis, T.K.; Topaloglou, C.A.; Lazaridou, E.; Zalidis, G.C. The Performance of Satellite Images in Mapping Aquacultures. Ocean Coast. Manag. 2008, 51, 638–644. [Google Scholar] [CrossRef]
  53. Cheng, J.; Jia, N.; Chen, R.; Guo, X.; Ge, J.; Zhou, F. High-Resolution Mapping of Seaweed Aquaculture along the Jiangsu Coast of China Using Google Earth Engine (2016–2022). Remote Sens. 2022, 14, 6202. [Google Scholar] [CrossRef]
  54. Liu, Y.; Wang, Z.; Yang, X.; Zhang, Y.; Yang, F.; Liu, B.; Cai, P. Satellite-Based Monitoring and Statistics for Raft and Cage Aquaculture in China’s Offshore Waters. Int. J. Appl. Earth Obs. Geoinform. 2020, 91, 102118. [Google Scholar] [CrossRef]
  55. Zheng, Y.; Wu, J.; Wang, A.; Chen, J. Object- and Pixel-Based Classifications of Macroalgae Farming Area with High Spatial Resolution Imagery. Geocarto Int. 2018, 33, 1048–1063. [Google Scholar] [CrossRef]
  56. Xing, Q.; An, D.; Zheng, X.; Wei, Z.; Wang, X.; Li, L.; Tian, L.; Chen, J. Monitoring Seaweed Aquaculture in the Yellow Sea with Multiple Sensors for Managing the Disaster of Macroalgal Blooms. Remote Sens. Environ. 2019, 231, 111279. [Google Scholar] [CrossRef]
  57. Innocentini, M.M.; Rodrigues, E.F.; Mathion, J.K.; Caritá, E.C.; Simão, L.; Marins, M. Analysis of Multispectral Indices as a Tool for Segmenting and Quantifying the Seaweed Kappaphycus Alvarezii in a Commercial Cultivation System. Biomass 2024, 4, 933–946. [Google Scholar] [CrossRef]
  58. Zhu, H.; Lu, Z.; Zhang, C.; Yang, Y.; Zhu, G.; Zhang, Y.; Liu, H. Remote Sensing Classification of Offshore Seaweed Aquaculture Farms on Sample Dataset Amplification and Semantic Segmentation Model. Remote Sens. 2023, 15, 4423. [Google Scholar] [CrossRef]
  59. Sui, B.; Jiang, T.; Zhang, Z.; Pan, X.; Liu, C. A Modeling Method for Automatic Extraction of Offshore Aquaculture Zones Based on Semantic Segmentation. ISPRS Int. J. Geo-Inf. 2020, 9, 145. [Google Scholar] [CrossRef]
  60. Cui, B.; Fei, D.; Shao, G.; Lu, Y.; Chu, J. Extracting Raft Aquaculture Areas from Remote Sensing Images via an Improved U-Net with a PSE Structure. Remote Sens. 2019, 11, 2053. [Google Scholar] [CrossRef]
  61. López-Leyva, R.; Rojas-Domínguez, A.; Flores-Mendoza, J.P.; Casillas-Araiza, M.Á.; Santiago-Montero, R. Comparing Threshold-Selection Methods for Image Segmentation: Application to Defect Detection in Automated Visual Inspection Systems. In Pattern Recognition; Springer: Cham, Switzerland, 2016; pp. 33–43. [Google Scholar]
  62. Tan, Z.; Zhang, D. A Fuzzy Adaptive Gravitational Search Algorithm for Two-Dimensional Multilevel Thresholding Image Segmentation. J. Ambient Intell. Humaniz. Comput. 2020, 11, 4983–4994. [Google Scholar] [CrossRef]
  63. Kaur, G.; Kumar, R. Comparative Analysis of Image Segmentation Using Thresholding. Int. J. Eng. Appl. Sci. IJEAS 2020, 7, 28–34. [Google Scholar] [CrossRef]
  64. Singh, S.; Mittal, N.; Singh, H.; Oliva, D. Improving the Segmentation of Digital Images by Using a Modified Otsu’s between-Class Variance. Multimed. Tools Appl. 2023, 82, 40701–40743. [Google Scholar] [CrossRef]
  65. Xu, X.; Xu, S.; Jin, L.; Song, E. Characteristic Analysis of Otsu Threshold and Its Applications. Pattern Recognit. Lett. 2011, 32, 956–961. [Google Scholar] [CrossRef]
  66. Kim, B.-T.; Han, I.-S.; Lee, J.-S.; Kim, D.-H. Impact of Seawater Temperature on Korean Aquaculture under Representative Concentration Pathways (RCPs) Scenarios. Aquaculture 2021, 542, 736893. [Google Scholar] [CrossRef]
  67. Huang, S.; Tang, L.; Hupy, J.P.; Wang, Y.; Shao, G. A Commentary Review on the Use of Normalized Difference Vegetation Index (NDVI) in the Era of Popular Remote Sensing. J. For. Res. 2021, 32, 1–6. [Google Scholar] [CrossRef]
  68. Kriegler, F.J.; Malila, W.A.; Nalepka, R.F.; Richardson, W. Preprocessing Transformations and Their Effects on Multispectral Recognition. In Proceedings of the Remote Sensing of Environment, VI, Ann Arbor, MI, USA, 13–16 October 1969; p. 97. [Google Scholar]
  69. McFeeters, S.K. The Use of the Normalized Difference Water Index (NDWI) in the Delineation of Open Water Features. Int. J. Remote Sens. 1996, 17, 1425–1432. [Google Scholar] [CrossRef]
  70. Otsu, N. A Threshold Selection Method from Gray-Level Histograms. IEEE Trans. Syst. Man Cybern. 1979, 9, 62–66. [Google Scholar] [CrossRef]
  71. Huang, M.; Yu, W.; Zhu, D. An Improved Image Segmentation Algorithm Based on the Otsu Method. In Proceedings of the 2012 13th ACIS International Conference on Software Engineering, Artificial Intelligence, Networking and Parallel/Distributed Computing, Kyoto, Japan, 8–10 August 2012; pp. 135–139. [Google Scholar]
  72. Singh, N.; Bhandari, A.K.; Kumar, I.V. Fusion-Based Contextually Selected 3D Otsu Thresholding for Image Segmentation. Multimed. Tools Appl. 2021, 80, 19399–19420. [Google Scholar] [CrossRef]
  73. Breiman, L. Random Forests. Mach. Learn. 2001, 45, 5–32. [Google Scholar] [CrossRef]
  74. Ho, T.K. The Random Subspace Method for Constructing Decision Forests. IEEE Trans. Pattern Anal. Mach. Intell. 1998, 20, 832–844. [Google Scholar] [CrossRef]
  75. Belgiu, M.; Drăguţ, L. Random Forest in Remote Sensing: A Review of Applications and Future Directions. ISPRS J. Photogramm. Remote Sens. 2016, 114, 24–31. [Google Scholar] [CrossRef]
  76. Pelletier, C.; Valero, S.; Inglada, J.; Champion, N.; Dedieu, G. Assessing the Robustness of Random Forests to Map Land Cover with High Resolution Satellite Image Time Series over Large Areas. Remote Sens. Environ. 2016, 187, 156–168. [Google Scholar] [CrossRef]
  77. Sohn, C.-H. Porphyra, Undaria and Hizikia Cultivation in Korea. Algae 1993, 8, 207–216. [Google Scholar]
  78. Choi, H.G.; Kim, Y.S.; Lee, S.J.; Nam, K.W. Growth and Reproductive Patterns of Undaria Pinnatifida Sporophytes in a Cultivation Farm in Busan, Korea. J. Appl. Phycol. 2007, 19, 131–138. [Google Scholar] [CrossRef]
  79. Kim, S.H.; Kim, Y.D.; Hwang, M.S.; Hwang, E.K.; Yoo, H.I. Temperature Ranges for Survival and Growth of Juvenile Saccharina Sculpera (Laminariales, Phaeophyta) and Applications for Field Cultivation. Algae 2021, 36, 231–240. [Google Scholar] [CrossRef]
  80. World Bank Climate Change Knowledge Portal. Available online: https://climateknowledgeportal.worldbank.org/ (accessed on 17 February 2025).
  81. El-Manaway, I.M.; Rashedy, S.H. The Ecology and Physiology of Seaweeds: An Overview. In Sustainable Global Resources of Seaweeds Volume 1; Springer: Cham Switzerland, 2022; pp. 3–16. ISBN 978-3-030-91955-9. [Google Scholar]
  82. Korea’s Dried Seaweed Exports Reach All-Time Record in 2024—The Korea Times. Available online: https://www.koreatimes.co.kr/www/nation/2025/02/113_387071.html (accessed on 17 February 2025).
  83. South Korea, Ministry of Oceans and Fisheries. Public Waters Management and Reclamation Act. Available online: https://elaw.klri.re.kr/eng_mobile/viewer.do?hseq=46970&type=part&key=35 (accessed on 17 February 2025).
  84. South Korea, Ministry of Oceans and Fisheries. Fishing Management and Promotion Act. Available online: https://elaw.klri.re.kr/eng_mobile/viewer.do?hseq=56301&type=part&key=27 (accessed on 17 February 2025).
  85. South Korea, Ministry of Oceans and Fisheries. Act on Experiments and Research for the Promotion of Science and Technology of Fisheries. Available online: https://faolex.fao.org/docs/pdf/kor168039.pdf (accessed on 17 February 2025).
  86. South Korea, Ministry of Oceans and Fisheries. Fishery Resources Management Act. Available online: https://elaw.klri.re.kr/eng_service/lawView.do?hseq=36363&lang=ENG (accessed on 17 February 2025).
  87. 2050 Carbon Neutral Strategy of the Republic of Korea|UNFCCC. Available online: https://unfccc.int/documents/267683 (accessed on 17 February 2025).
  88. South Korea, Ministry of Oceans and Fisheries. Sustainable Management of Ocean and Achievement of Maritime Safety. Available online: https://www.mof.go.kr (accessed on 17 February 2025).
  89. Vapnik, V.N. The Support Vector Method. In Artificial Neural Networks—ICANN’97; Gerstner, W., Germond, A., Hasler, M., Nicoud, J.-D., Eds.; Lecture Notes in Computer Science; Springer: Berlin/Heidelberg, Germany, 1997; Volume 1327, pp. 261–271. ISBN 978-3-540-63631-1. [Google Scholar]
  90. Quinlan, J.R. Induction of Decision Trees. Mach. Learn. 1986, 1, 81–106. [Google Scholar] [CrossRef]
  91. Blaschke, T.; Hay, G.J.; Kelly, M.; Lang, S.; Hofmann, P.; Addink, E.; Feitosa, R.Q.; Van der Meer, F.; Van der Werff, H.; Van Coillie, F.; et al. Geographic Object-Based Image Analysis—Towards a New Paradigm. ISPRS J. Photogramm. Remote Sens. 2014, 87, 180–191. [Google Scholar] [CrossRef]
Figure 1. Study area and main cultured seaweed species in the Korean Peninsula: (a) Kelp (red box) and laver (green box) show different colors and shapes; High-resolution satellite imagery of (b) kelp and (c) laver cultivation zones, sourced from Google Earth; (d) Kelp (Saccharina and Undaria) longline cultivation system; (e) Laver (Porphyria) floating cultivation system [29].
Remotesensing 17 01150 g001
Figure 2. Research Framework. Blue denotes input data, green indicates processing steps, pink shows processing outcomes, yellow highlights classification feature sets, orange represents species classification methods, and cyan marks the final results.
Remotesensing 17 01150 g002
Figure 3. Spectral band analysis and vegetation indices for seaweed cultivation monitoring.
Remotesensing 17 01150 g003
Figure 4. Analysis of spectral bands and normalization indices for seaweed identification.
Remotesensing 17 01150 g004
Figure 5. (a) The location and classification results of the four verification sites in Jeollanam-do, South Korea. (b) Area numbers and relative differences of cultivated seaweeds between visual interpretation and automatic classification.
Remotesensing 17 01150 g005
Figure 6. (a) Acreage and (b) overall accuracy (OA) and Kappa coefficient of seaweed classification during 2017 and 2023.
Remotesensing 17 01150 g006
Figure 7. Spatial distribution and acreage of cultivated seaweed in Korean Peninsula in 2022–2023. In North Korea, extensive seaweed farms are primarily concentrated in Hwanghae-namdo Province, which is shown as Region 4 in the figure. In contrast, South Korea’s seaweed farms are scattered across several areas. To organize the visual representation of the data, we grouped the regions into three distinct aquaculture areas: Region 1 encompasses Incheon, Gyeonggi Province, Chungcheongnam-do, and Jeollabuk-do; Region 2 comprises Jeollanam-do; and Region 3 includes Gyeongsangnam-do, Busan, and Ulsan.
Remotesensing 17 01150 g007
Figure 8. Spatial distribution and acreage proportion of the main cultivated seaweed species in the Korean Peninsula.
Remotesensing 17 01150 g008
Figure 9. Spatiotemporal dynamics of seaweed cultivation in (a) North Korea and (b) South Korea from 2017 to 2023. Satellite imagery from 2022 to 2023 was used as a consistent base map to enhance the visualization of spatial changes. Different colors represent seaweed cultivation areas identified in different years.
Remotesensing 17 01150 g009
Figure 10. (a) Interannual changes and (b) relationships between cultivated seaweed production and acreage in Jeollanam-do, South Korea. The production data for 2022–2023 in panel (a) were estimated using the regression equation in panel (b). The * in the formula on the panel (b) means multiplication.
Remotesensing 17 01150 g010
Figure 11. Our estimated seaweed production in North Korea compared with FAO data. FAO data for the 2022–2023 season have not yet been released to date.
Remotesensing 17 01150 g011
Figure 12. Feature importance scores for spectral bands and indices used in seaweed classification. OTSU * indicates the Otsu-derived binary layer.
Remotesensing 17 01150 g012
Figure 13. (k) Comparative analysis of seaweed classification at three experimental sites. Panels (a,d,g) show satellite images for sites 1, 2, and 3. Panels (b,e,h) display classification results using the with-Otsu method, and panels (c,f,i) show results without the Otsu method. The areas circled by red and green boxes clearly show the superior classification effect of the with-Otsu method. Panel (j) compares extraction accuracy between the two methods based on visually interpreted reference areas. The red frames in the panel (k) represent experimental sites.
Remotesensing 17 01150 g013
Figure 14. Satellite images and classification results with post-processing. Panels (a,b) display satellite images at various phases, while (c,d) illustrate the classification results before and after post-processing, respectively.
Remotesensing 17 01150 g014
Table 1. Species, farming methods, and growing period of cultured seaweed.
SpeciesFarming MethodsGrowing Period
PyropiaFixing pole system
or floating system
November–April
SaccharinaLongline systemDecember–May
UndariaLongline systemDecember–July
Table 2. Classification accuracy of different band combinations for seaweed classification.
Band CombinationOverall Accuracy (OA)Kappa
B2, B3, B4, B8, NDVI, NDWI, OTSU *0.990.98
B2, B3, B40.980.96
B2, B3, B5, B80.970.94
B2, B4, B5, B80.970.94
B2, B5, B8, B110.950.90
B3, B4, B8, B110.980.96
OTSU * indicates the Otsu-derived binary layer.
Disclaimer/Publisher’s Note: The statements, opinions and data contained in all publications are solely those of the individual author(s) and contributor(s) and not of MDPI and/or the editor(s). MDPI and/or the editor(s) disclaim responsibility for any injury to people or property resulting from any ideas, methods, instructions or products referred to in the content.

