Article

Bayesian Model Averaging for Satellite Precipitation Data Fusion: From Accuracy Estimation to Runoff Simulation

1
College of Civil Engineering, Hefei University of Technology, Hefei 230009, China
2
School of Hydrology and Water Resources, Nanjing University of Information Science and Technology, Nanjing 210098, China
3
Universal Engineering and Science College, Pokhara University, Lalitpur 44700, Nepal
4
Nepal Academy of Science and Technology, Lalitpur 44700, Nepal
*
Author to whom correspondence should be addressed.
Remote Sens. 2025, 17(7), 1154; https://doi.org/10.3390/rs17071154
Submission received: 5 February 2025 / Revised: 9 March 2025 / Accepted: 19 March 2025 / Published: 25 March 2025
(This article belongs to the Special Issue Remote Sensing in Hydrometeorology and Natural Hazards)

Abstract

:
Precipitation plays a vital role in the hydrological cycle, directly affecting water resource management and influencing flood and drought risk prediction. This study proposes a Bayesian Model Averaging (BMA) framework to integrate multiple precipitation datasets. The framework enhances estimation accuracy for hydrological simulations. The BMA framework synthesizes four precipitation products—Climate Hazards Group Infrared Precipitation with Station (CHIRPS), the fifth-generation ECMWF Atmospheric Reanalysis (ERA5), Global Satellite Mapping of Precipitation (GSMaP), and Integrated Multi-satellitE Retrievals (IMERG)—over China’s Ganjiang River Basin from 2008 to 2020. We evaluated the merged dataset’s performance against its constituent datasets and the Multi-Source Weighted-Ensemble Precipitation (MSWEP) at daily, monthly, and seasonal scales. Evaluation metrics included the correlation coefficient (CC), root mean square error (RMSE), and Kling–Gupta efficiency (KGE). The Variable Infiltration Capacity (VIC) hydrological model was further applied to assess how these datasets affect runoff simulations. The results indicate that the BMA-merged dataset substantially improves precipitation estimation accuracy when compared with individual inputs. The merged product achieved optimal daily performance (CC = 0.72, KGE = 0.70) and showed superior seasonal skill, notably reducing biases in autumn and winter. In hydrological applications, the BMA-driven VIC model effectively replicated observed runoff patterns, demonstrating its efficacy for regional long-term predictions. This study highlights BMA’s potential for optimizing hydrological model inputs, providing critical insights for sustainable water management and risk reduction in complex basins.

1. Introduction

Precipitation plays a critical role in the hydrological cycle [1,2], serving as a vital input for runoff simulation [3]. Accurate precipitation data enhances the reliability of hydrological simulations [4]. It also facilitates sustainable water resource management and water-related risk prediction [5]. Historically, precipitation datasets used in hydrologic models have primarily relied on gauge observations [6]. However, economic and geographical constraints frequently lead to sparse, unevenly distributed rain gauge stations in underdeveloped countries and remote mountainous regions [7,8].
Recent advances in observational techniques and inverse algorithms have enabled the development of precipitation products from gauge stations, reanalysis, and satellites. These innovations offer unprecedented opportunities for real-time monitoring at global and regional scales, as well as improved flood and drought warnings. Gauge-based precipitation products, such as those from the Climate Prediction Center (CPC) [9], rely on global gauge observations combined with diverse interpolation techniques. Their accuracy principally depends on station density and quantity [10]. In recent years, there has been growing research interest in developing reanalysis products using numerical weather models and data assimilation techniques. These methods offer an alternative to traditional observations, enabling more detailed and accurate analyses of weather patterns and trends [11]. Ongoing enhancements to the Integrated Forecast System (IFS)—including improvements in modeling processes, core dynamics, and data assimilation—have made the publicly available ERA5 dataset one of the most advanced resources [12]. Satellite precipitation products combine high-resolution spatiotemporal infrared imagery with precise passive microwave estimates. This integration offers distinct advantages over ground-based observations, including seamless spatial coverage, global monitoring capabilities, and near-real-time data availability [13,14]. Prominent satellite precipitation products currently in operational use include CHIRPS [15], GSMaP [16], and IMERG [17]. The MSWEP dataset, which integrates gauge observations, satellite retrievals, and reanalysis outputs, also provides reliable global precipitation estimates [18]. Currently, some studies have developed merging methods to achieve improved precipitation estimates. For instance, the double-machine-learning strategy proposed by Lyu and Yong integrates the advantages of traditional machine learning (ML) and deep learning (DL), significantly enhancing algorithmic stability and the accuracy of merged products [19]. Gavahi et al. introduced a depth-based convolutional neural network architecture that fully leverages spatiotemporal dependencies to improve precipitation estimates [20].
Extensive research has examined how different precipitation datasets influence hydrological modeling, using both individual and merged data products [21]. Zeng et al. evaluated nine gridded precipitation products using hydrological simulations in four sub-basins of the Gandaki River Basin with the HBV model. The analysis revealed substantial discrepancies among precipitation datasets, indicating that ERA5-Land, IMERG-Final V06, and MSWEP v2.8 performed optimally in both precipitation quantification and hydrological modeling [22]. Aryal et al. applied the SWAT model to evaluate four satellite-based precipitation products for streamflow prediction in the Myagdi Khola Basin. The findings indicated that satellite-derived precipitation data reliably predicted streamflow in topographically complex basins, with bias-corrected products showing improved accuracy and adaptability in Himalayan catchments [23]. Although widely used in semi-distributed hydrological models, these precipitation products face limitations when implemented in fully distributed modeling frameworks. Furthermore, their predictive capability remains constrained by systematic errors, indicating substantial potential for algorithmic improvements [24].
Integration-based methods consolidate multi-source precipitation data, typically producing merged datasets of higher accuracy than individual sources [25]. The BMA framework uses a weighted ensemble approach that aligns predictions with observations through model skill assessment and parameter optimization [26]. Unlike conventional ensemble methods, BMA explicitly incorporates weighting uncertainties in predictive distributions, enhancing simulation reliability [27]. Recently, many researchers have used the BMA approach to improve precipitation estimation. Ma et al., employed a dynamic BMA algorithm in a hybrid experiment using multi-satellite precipitation data. The results showed that dynamic BMA data reduced errors relative to ensemble members and outperformed both SMA and OOR methods in generating precipitation ensembles, proving especially beneficial for merging multi-satellite data in sparsely observed regions [28]. Yumnam et al. proposed a Quantile-based Bayesian Model Averaging (QBMA) method to blend three satellite precipitation products in the Vamsadhara Basin. Their findings indicated that QBMA products, when bias-corrected, further reduced errors and outperformed traditional ensemble methods [29]. Wei et al. developed a modifiable BMA framework, using optimal weights and variable initialization methods to quantitatively examine how different inputs affect BMA predictions. The results showed significant variations in BMA prediction performance depending on input sources, with CPC emerging as the primary influencing factor [30]. However, BMA-based merged precipitation products have seldom been applied in hydrological simulations. Evaluating the impact of BMA-merged precipitation products on runoff simulation is therefore both valuable and necessary.
This study uses the BMA algorithm as its core framework to integrate multiple precipitation datasets, producing a merged precipitation product. We employ a combined approach of precipitation estimation and hydrological simulation to evaluate the merged product’s applicability in the study area. The experimental design incorporates four precipitation datasets (CHIRPS, ERA5, GSMaP, and IMERG) from 2008 to 2020. The ensemble precipitation product MSWEP serves as a comparative dataset, and the Ganjiang River Basin in China is chosen as the study area. Several metrics are used to assess the BMA-merged product’s ability to estimate precipitation at daily, monthly, and seasonal timescales. The widely adopted VIC distributed hydrological model is then employed to evaluate the merged precipitation product’s effectiveness in simulating daily and monthly runoff. Finally, we apply the error propagation ratio to examine how different products mitigate errors from precipitation to runoff. The study’s findings are expected to provide more reliable precipitation estimates, thereby contributing to improved hydrological understanding and enhancing precipitation inputs for regional hydrological simulations.

2. Study Area and Data
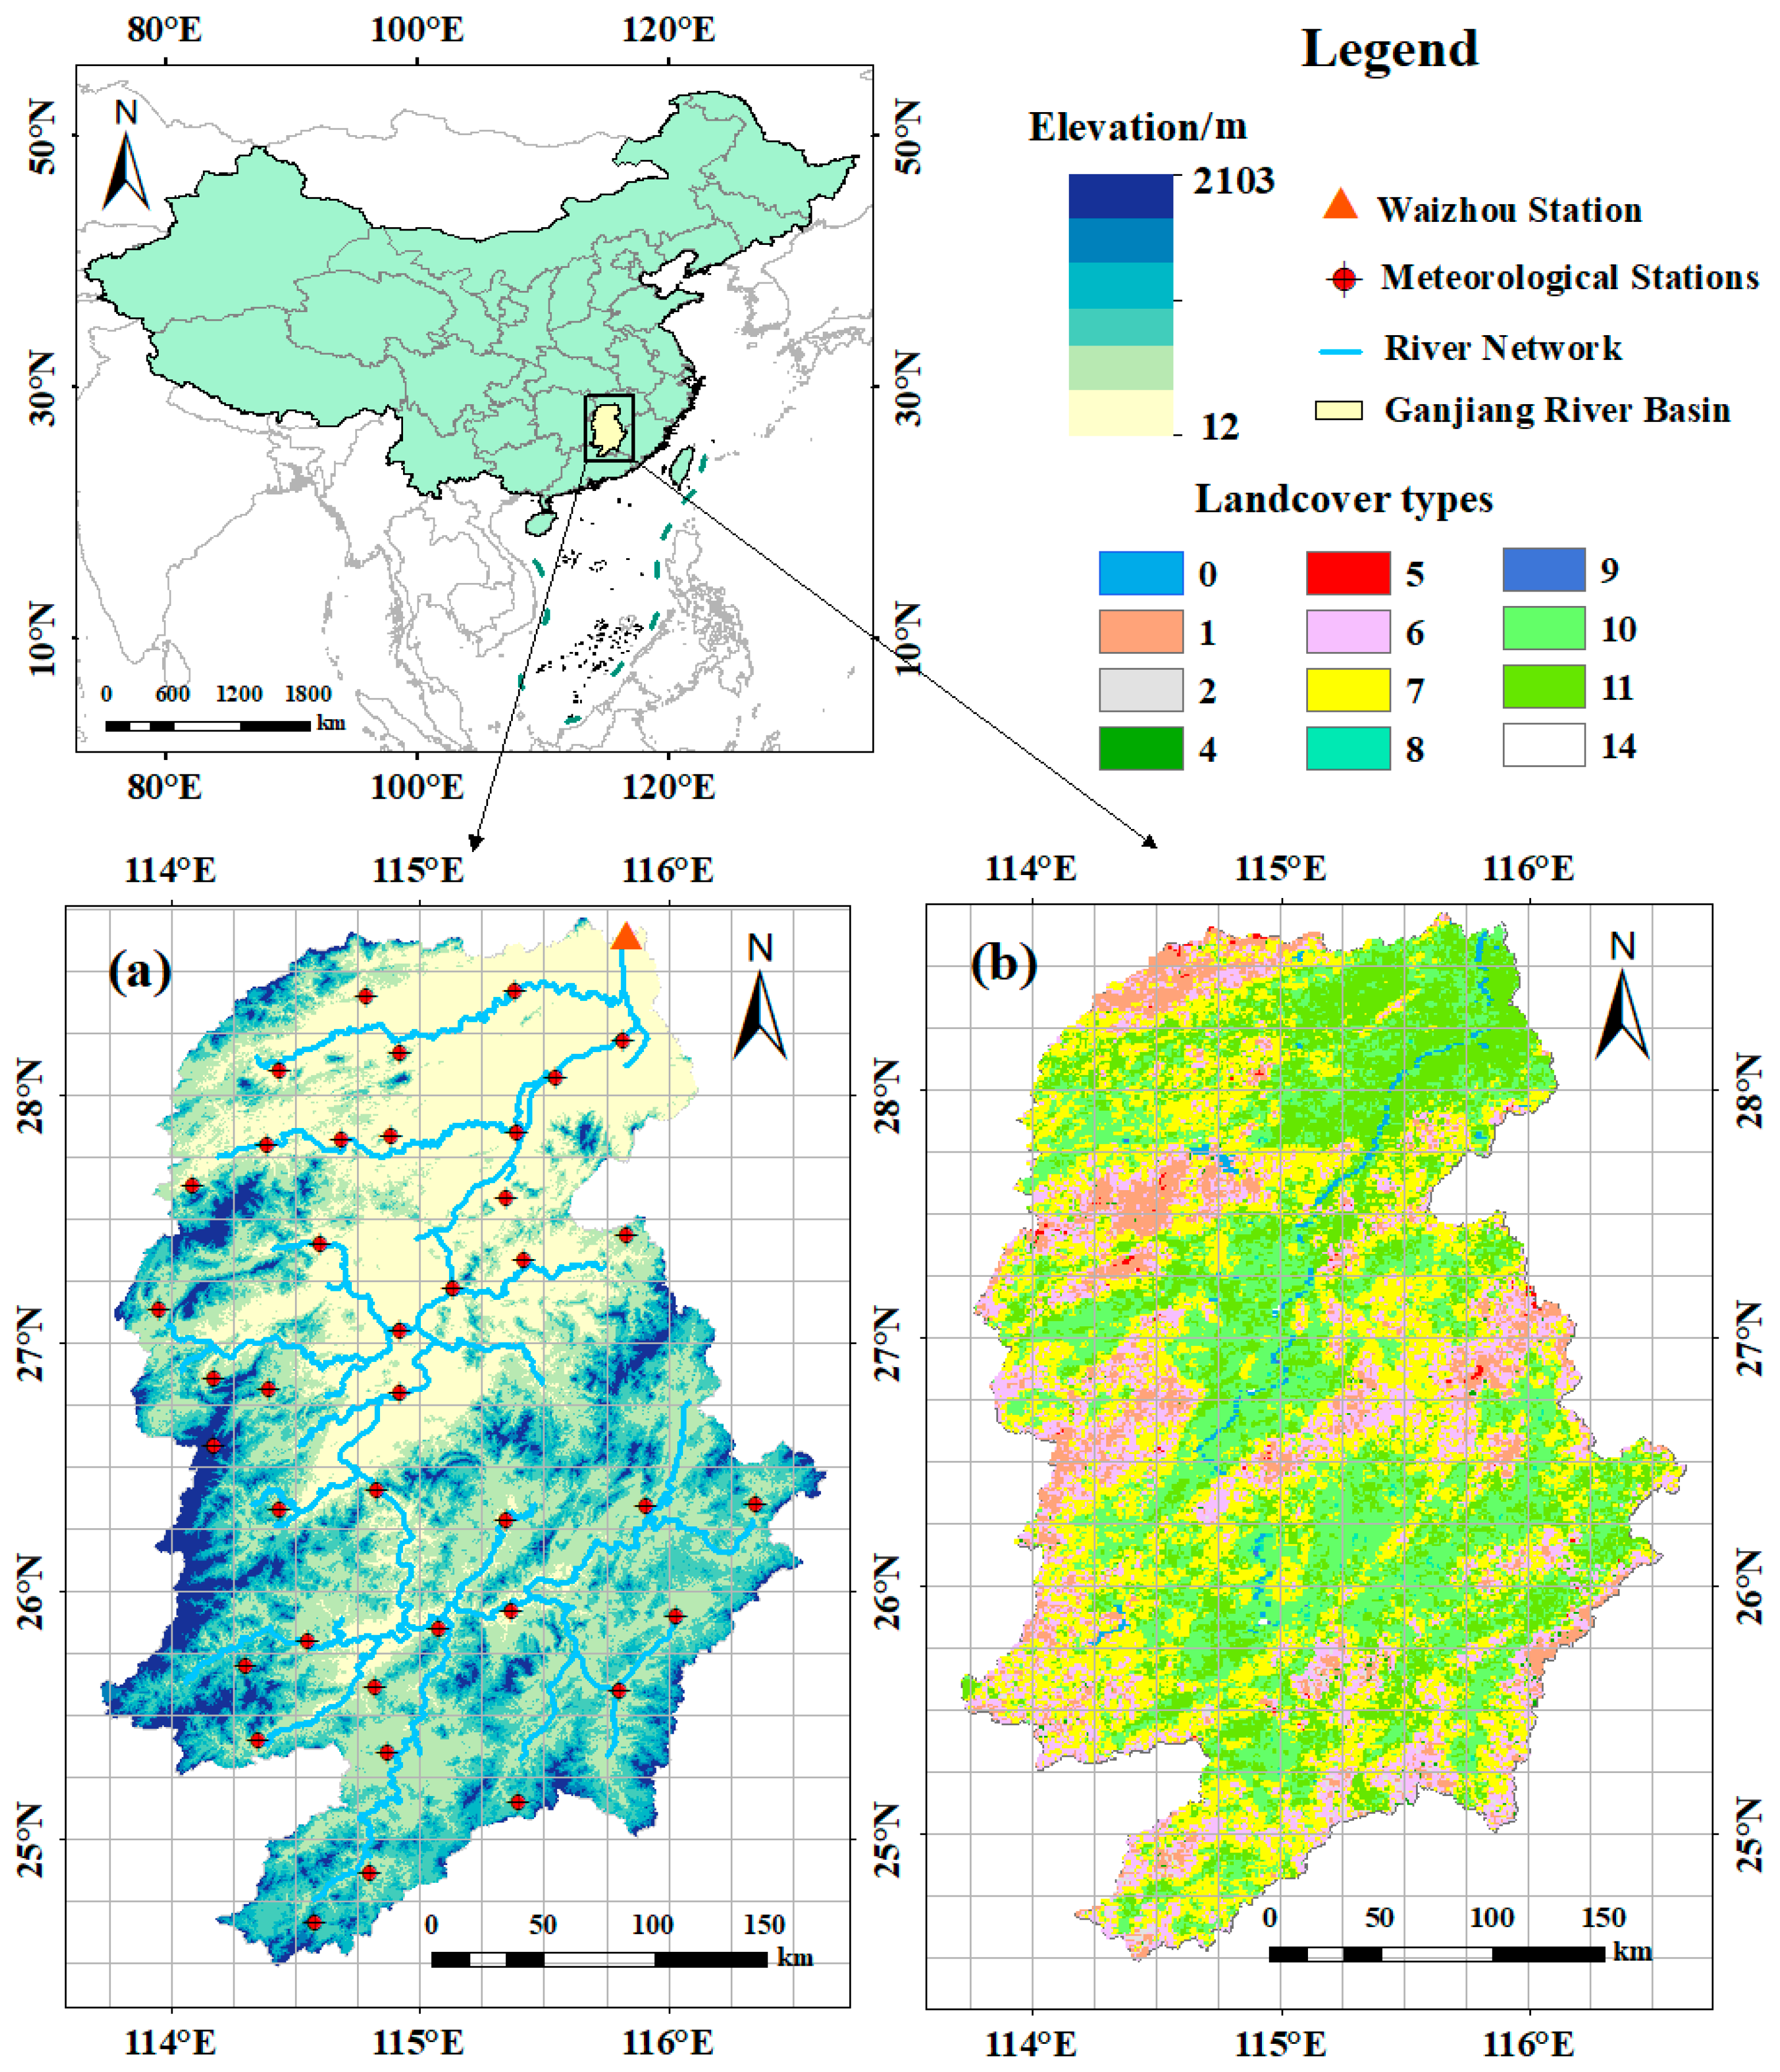
2.1. Study Area

The Ganjiang River, the seventh-largest tributary of the Yangtze River, is located in Jiangxi Province in southeastern China. The Ganjiang River Basin covers approximately 83,385 km2 and is monitored by the Waizhou Hydrological Station (115.84°E, 28.63°N). Elevation ranges from 12 to 2103 m (Figure 1a), with higher terrain in the south and lower in the north. The Ganjiang River Basin’s landscape is characterized by mountains and hills (64.7%), low hills (31.5%, below 200 m above sea level), and plains and water bodies (3.9%). The average temperature is about 18 °C, with annual precipitation ranging from 1400 to 1800 mm.

2.2. Data

2.2.1. Ground Observation Data

We obtained precipitation data from 2008 to 2020 using the China Gauge-based Daily Precipitation Analysis (CGDPA), developed by the China Meteorological Administration (CMA) (https://data.cma.cn/, accessed on 2 February 2024). The dataset provides a 0.25°/24 h spatiotemporal resolution and undergoes rigorous quality control for extreme values, internal consistency, and spatial consistency [31]. Daily maximum and minimum temperatures, as well as average wind speed data, were also obtained from the CMA, following strict quality control before publication.

2.2.2. Satellite, Reanalysis, and Ensemble Precipitation Products

In this study, we conducted error analysis at a 0.25° spatial resolution. Therefore, a nearest neighbor resampling approach was adopted to standardize all products to a 0.25° spatial resolution and subsequently aggregated to a daily time scale prior to error computation. This method has been widely applied in precipitation assessment and hydrological modeling [24,32,33]. Basic information about the evaluated products is shown in Table 1.
CHIRPS, originally designed for agricultural drought detection, uses improved inverse-distance weighting (IDW) interpolation combined with infrared cold cloud duration (CCD) retrievals to offer a comprehensive, credible, and timely precipitation dataset [34,35]. The latest version, CHIRPS 2.0 (0.25° resolution), is available at https://data.chc.ucsb.edu/products/CHIRPS-2.0 (accessed on 4 February 2024).
ERA5 is the latest generation of atmospheric reanalysis products, employing improved four-dimensional data assimilation [19]. It integrates model data with global observations, offering broader temporal coverage (1950–present) and higher spatiotemporal resolution (0.25°/1 h) than ERA-Interim (0.76°/6 h) [36]. The dataset can be accessed at https://doi.org/10.24381/cds.adbb2d47 (accessed on 4 February 2024).
The GSMaP project’s satellite-based precipitation products are developed by the Japan Aerospace Exploration Agency (JAXA). JAXA aims to create high-resolution global precipitation maps by integrating core satellite data from the GPM program with infrared and multi-band passive microwave algorithms, including front-back deformation techniques and Kalman filters [37,38]. The GSMaP-Gauge (GSMaP-G) dataset used in this study is available at https://sharaku.eorc.jaxa.jp/GSMaP (accessed on 7 February 2024).
IMERG, an algorithm designed for the GPM mission, produces third-level products aimed at generating advanced global precipitation datasets [39]. IMERG merges precipitation estimates from multiple microwave sensors, microwave-corrected infrared satellite data, and monthly rain gauge observations, all calibrated through its own algorithm [40]. IMERG operates in three stages—Early, Later, and Final. This study uses IMERG Final Run Version 06B (IMERG-F), which is freely available at https://doi.org/10.5067/GPM/IMERG/3B-HH/06 (accessed on 7 February 2024).
MSWEP, a comprehensive global precipitation dataset developed by the Beck team, uses a multi-source weighted-ensemble method that integrates nearly all available precipitation observations [41]. It uniquely merges gauge, satellite, and reanalysis data to produce highly accurate precipitation estimates for each location [42]. This study uses MSWEP version 2.8 as a benchmark to highlight the BMA precipitation merging effect. Compared to earlier versions, MSWEP 2.8 exhibits lower peak precipitation values, a longer record, and near real-time updates. The dataset is available at https://www.gloh2o.org/mswep/ (accessed on 8 February 2024).
Table 1. Basic information of the precipitation products.
ProductsSpatial CoverageSpatial ResolutionTemporal CoverageTemporal ResolutionReferences
CHIRPS50°N-S0.05°1981–present24 h[34]
ERA5Global0.25°1950–present1 h[36]
GSMaP-G60°N-S0.1°2000–present1 h[38]
IMERG-F60°N-S0.1°2000–present0.5 h[40]
MSWEPGlobal0.1°1979–present3 h[42]

2.2.3. Runoff Data and Others
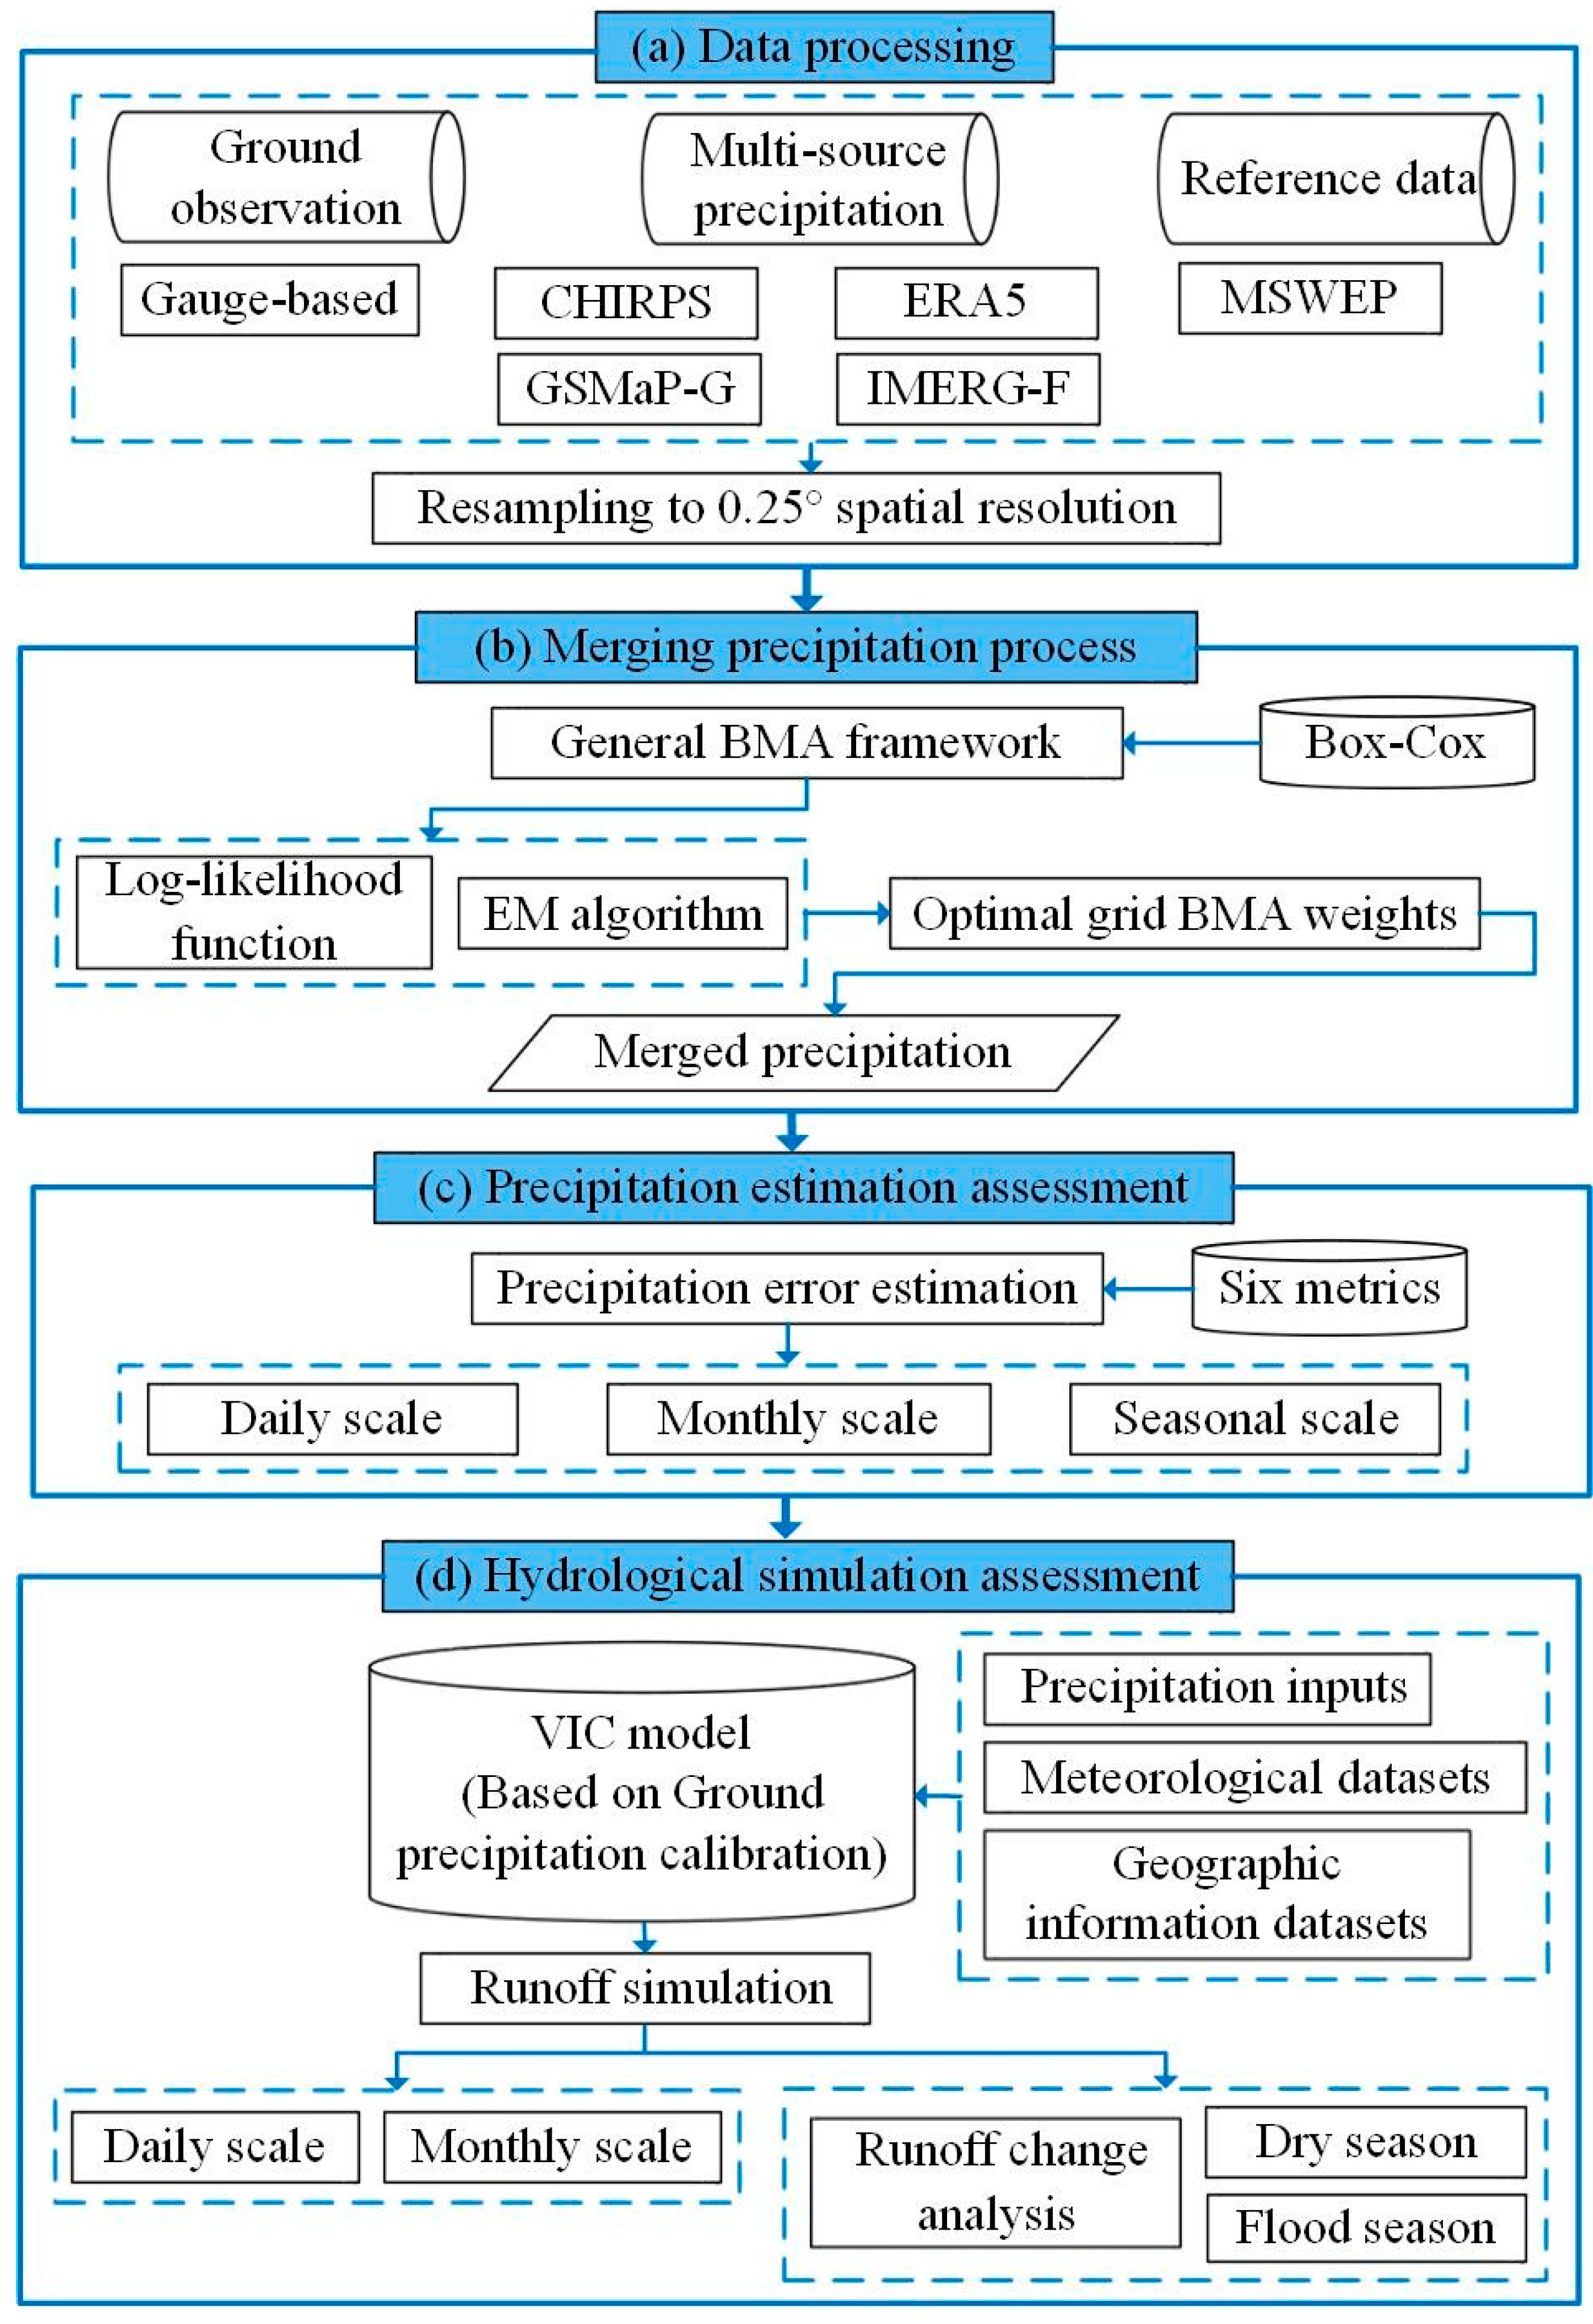
Daily runoff data (2008–2020) for the VIC model were acquired from Waizhou Station in Jiangxi Province. Digital Elevation Model (DEM) data for the Ganjiang River Basin were obtained from the Geospatial Data Cloud (https://www.gscloud.cn/, accessed on 1 February 2024) at a 90 m resolution. Vegetation data, including vegetation type (Figure 1b), leaf area index, and minimum stomatal resistance, were obtained from the global land cover classification dataset published by the University of Maryland (1 km resolution; https://iridl.ldeo.columbia.edu/SOURCES/.UMD/.GLCF/.GLCDS/.lc/, accessed on 3 February 2024). Soil data, such as soil type, variable infiltration capacity curve, and soil thickness, were extracted from the Harmonized World Soil Database (HWSD) released by the Food and Agriculture Organization of the United Nations (FAO; http://www.fao.org/soils-portal/data-hub, accessed on 3 February 2024).

3. Methods

The flowchart of this study is shown in Figure 2. The following subsections elaborate on each component of this methodological framework in detail.

3.1. Bayesian Model Averaging (BMA)

Based on Bayesian theory, the statistical ensemble model BMA combines inference and prediction based on ensemble membership to obtain a more reliable probability set [43]. In this study, a BMA method featuring an adjusted posterior probability density function (PDF) merges multiple precipitation datasets to better align with ground observations. According to the law of total probability, the PDF of BMA-merged precipitation product is expressed as
p ( M B ) = n = 1 N p ( f n B ) × p n ( M f n , B )
where M represents the merged precipitation product; B represents the observed precipitation; N is the number of precipitation inputs; f n represents the precipitation estimates of the nth member; p ( f n B ) denotes the posterior probability of the precipitation input, determined as the likelihood of the ensemble members; and p n ( M f n , B ) represents the posterior distribution of from estimated and observed precipitation.
Each member’s posterior probability is determined using observations from the same period, guaranteeing that the sum of the weights equals 1. If w n represents p ( f n B ) , and n = 1 N p ( f n B ) = n = 1 N w n = 1 , then the formula can be written as
p ( M B ) = n = 1 N w n × p n ( M f n , B )
Moreover, the posterior mean E ( M B ) and variance V a r ( M B ) of the merged product can be written as
E ( M B ) = n = 1 N w n × f n
V a r ( M B ) = n = 1 N w n × [ f n E ( M B ) ] 2 + n = 1 N w n σ n 2
where σ n 2 represents the variability between the estimated and observed precipitation.
Generally, the prior probability distribution of precipitation does not conform to the Gaussian assumption and is normally distributed. Before executing the BMA algorithm, it is necessary to perform a Box–Cox transformation on the original and observed precipitation data to obtain an approximate Gaussian distribution of p n ( M f n , B ) . The weights of the input precipitation dataset can be effectively estimated using the maximum likelihood function:
L ( w n , σ n ) = log [ n = 1 N w n × p n ( M f n , B ) ] = log [ n = 1 N w n × g ( M f n × σ n 2 ) ]
where g ( · ) represents the Gaussian distribution. The EM algorithm iterates through the expectation (E) and maximization (M) steps until the change in the log-likelihood falls below a given threshold or until the predefined number of iterations is reached [44,45]. During the iterative process, the prior BMA weights of single members were set to 1/N. The detailed process of the BMA algorithm is shown in Figure 3.

3.2. VIC Hydrological Model

The VIC distributed hydrological model features large-scale, gridded, and physically robust characteristics, allowing integration with various climate models to comprehensively account for the effects of weather, soil, terrain, and vegetation [46,47]. The model also handles complex scenarios effectively, making it well suited for long-term hydrological and material cycle studies. Thanks to these advantages, the VIC model has been widely applied in runoff simulations since its inception in 1994 and effectively used for evaluating the hydrological impacts of precipitation products [48,49].
This study employs VIC version 4.2d, using original station-observed precipitation data, BMA-merged data, precipitation data from four ensemble members, and MSWEP data at daily and monthly scales. To optimize model parameters, observed precipitation data serve as inputs for the warm-up (2008–2009), calibration (2010–2015), and validation (2016–2020) periods. The Shuffled Complex Evolution (SCE-UA) algorithm optimizes model parameters. It converges when the change in the Nash–Sutcliffe efficiency (NSE) falls below 1 × 10⁻⁸ and stops iterating when the iteration count reaches 5000. To ensure fair assessment, the same initial ranges for soil parameters are applied across all precipitation inputs. The calibration results are shown in Table 2.

3.3. Evaluation Metrics

The evaluation metrics in this study fall into two categories: accuracy assessment of precipitation estimation and accuracy assessment of VIC model runoff simulation. This study uses six metrics—CC, RB, RMSE, KGE, POD, and FAR—to measure the consistency between estimated and observed precipitation. CC measures linear correlation, RB evaluates systematic deviation, RMSE represents average error, KGE integrates linear correlation, systematic bias, and total error, POD captures the correct detection of rainfall events, and FAR identifies false detections. A threshold of 1 mm/day is set when calculating POD and FAR to determine rain/no-rain events. Nash–Sutcliffe efficiency (NSE) evaluates the VIC model’s runoff simulation performance. Descriptions, equations, and value ranges for these metrics appear in Table 3.

4. Results

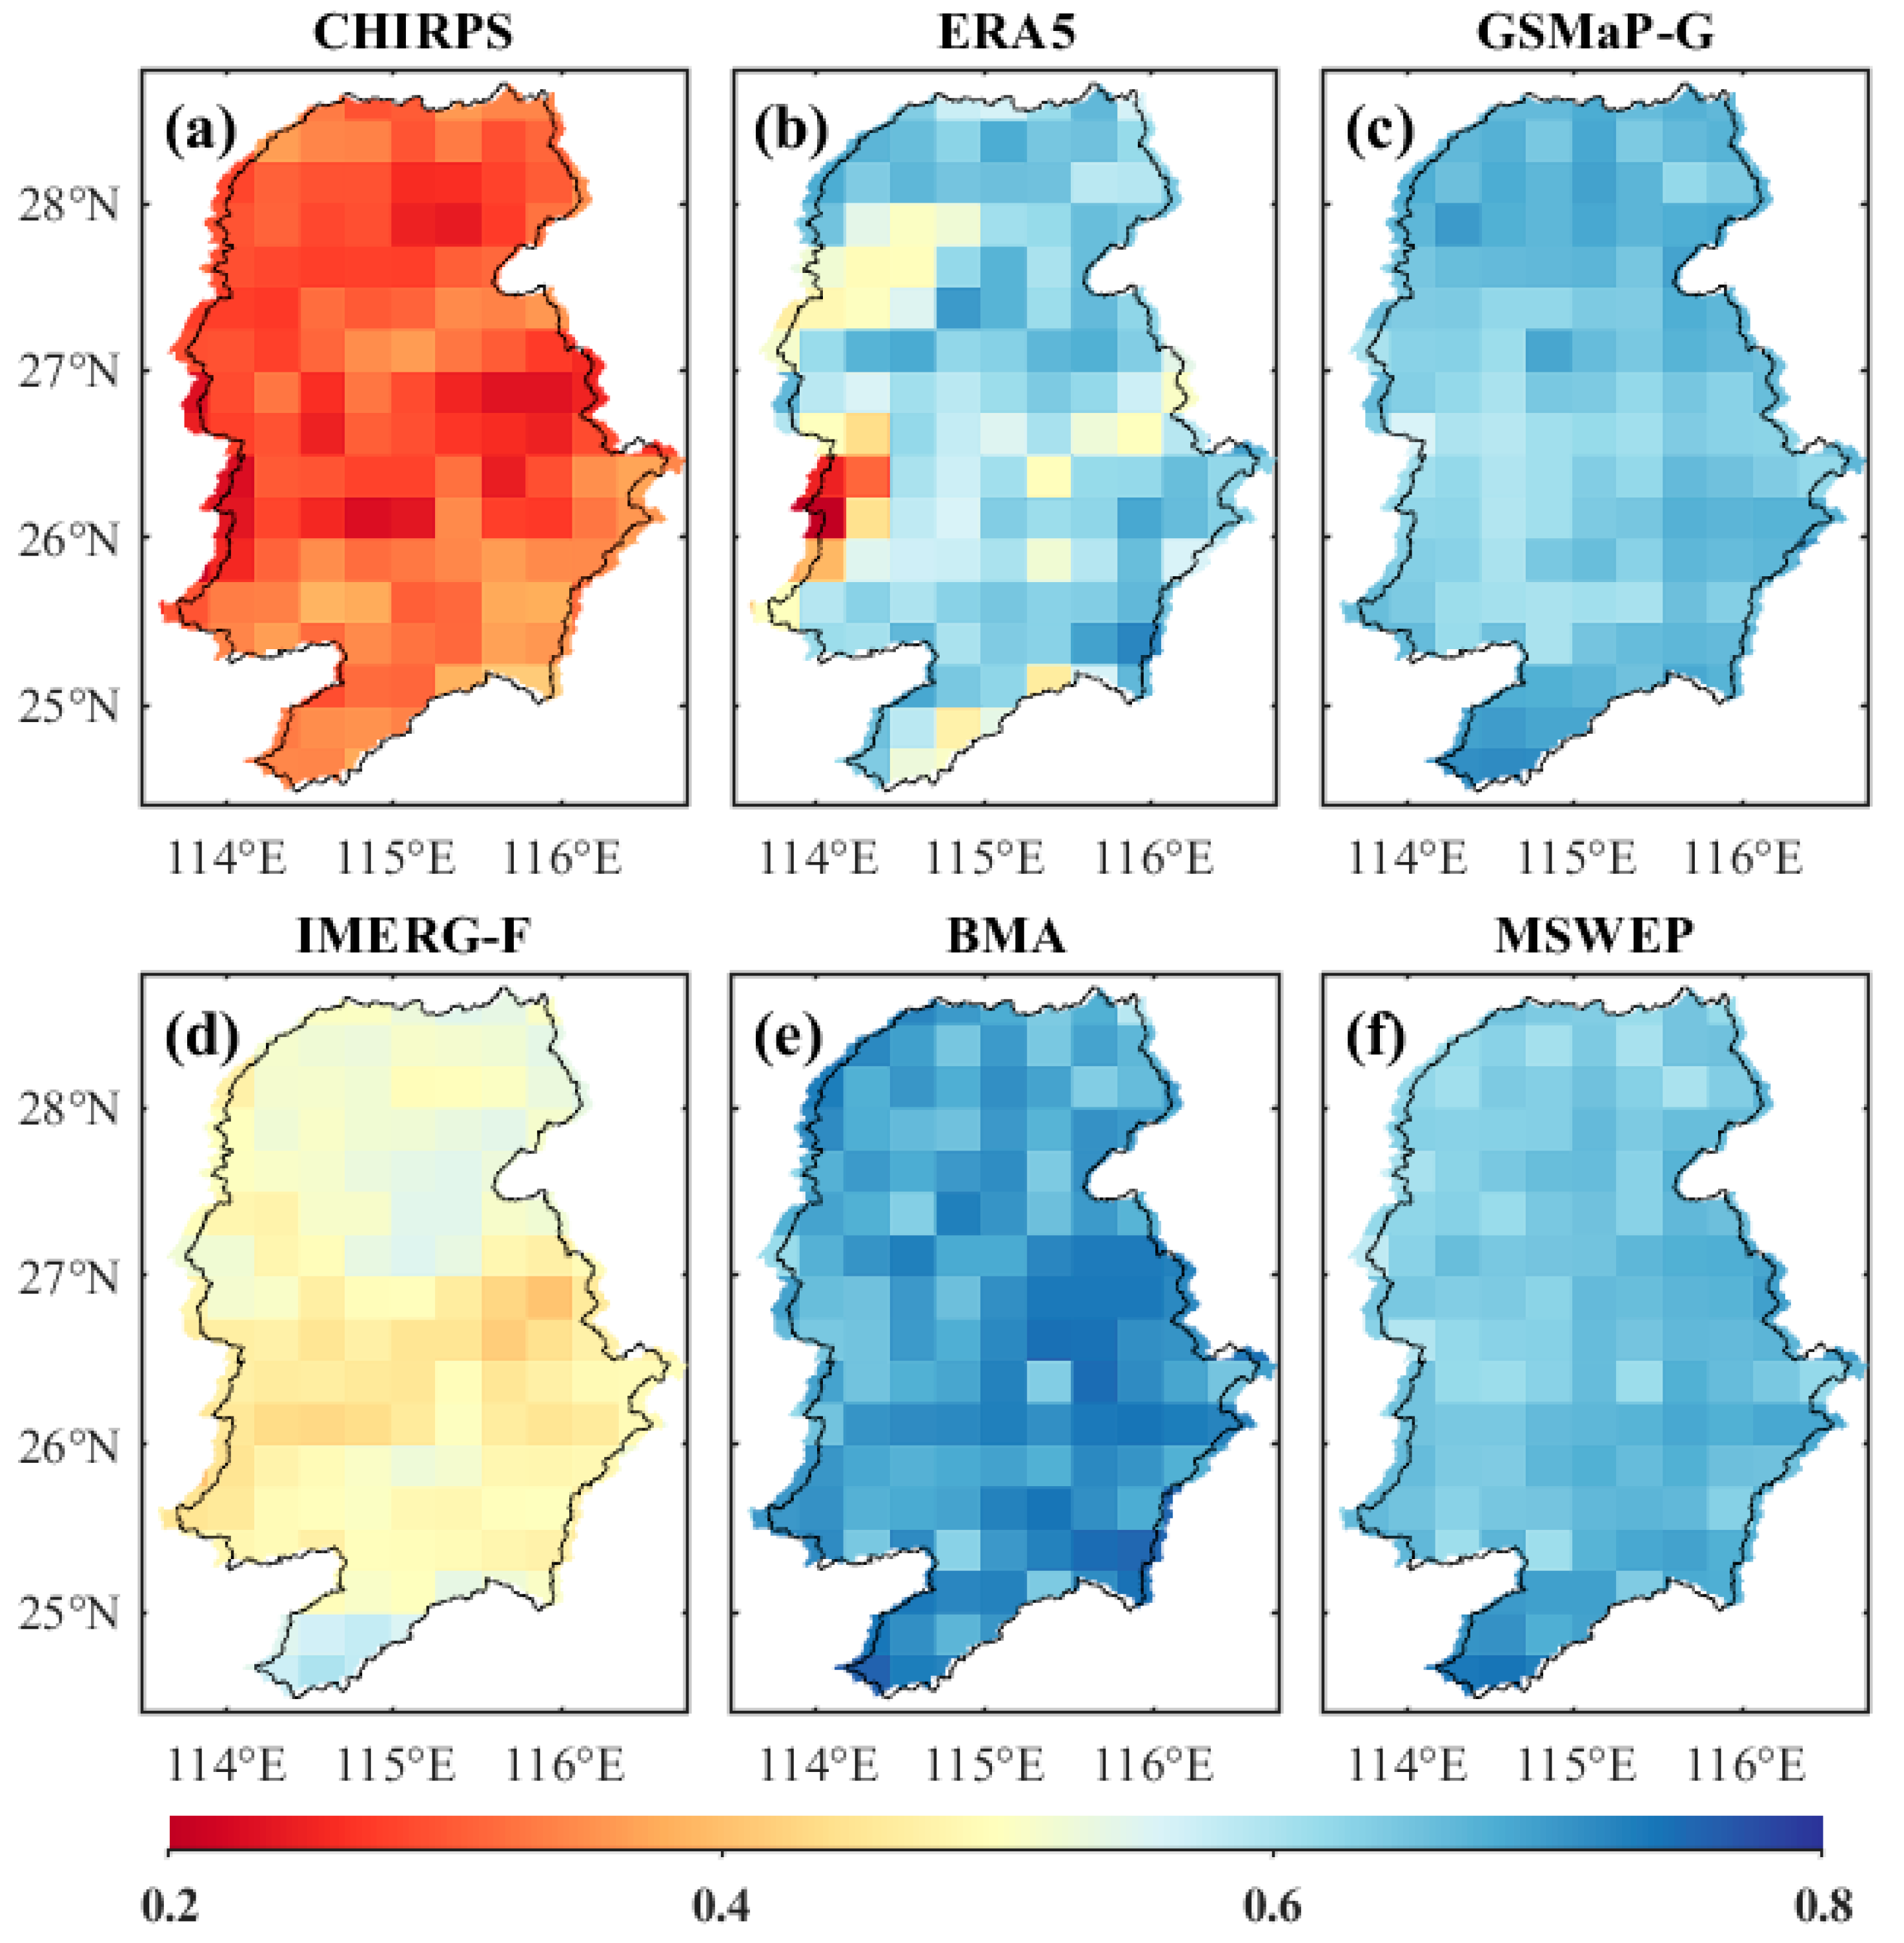
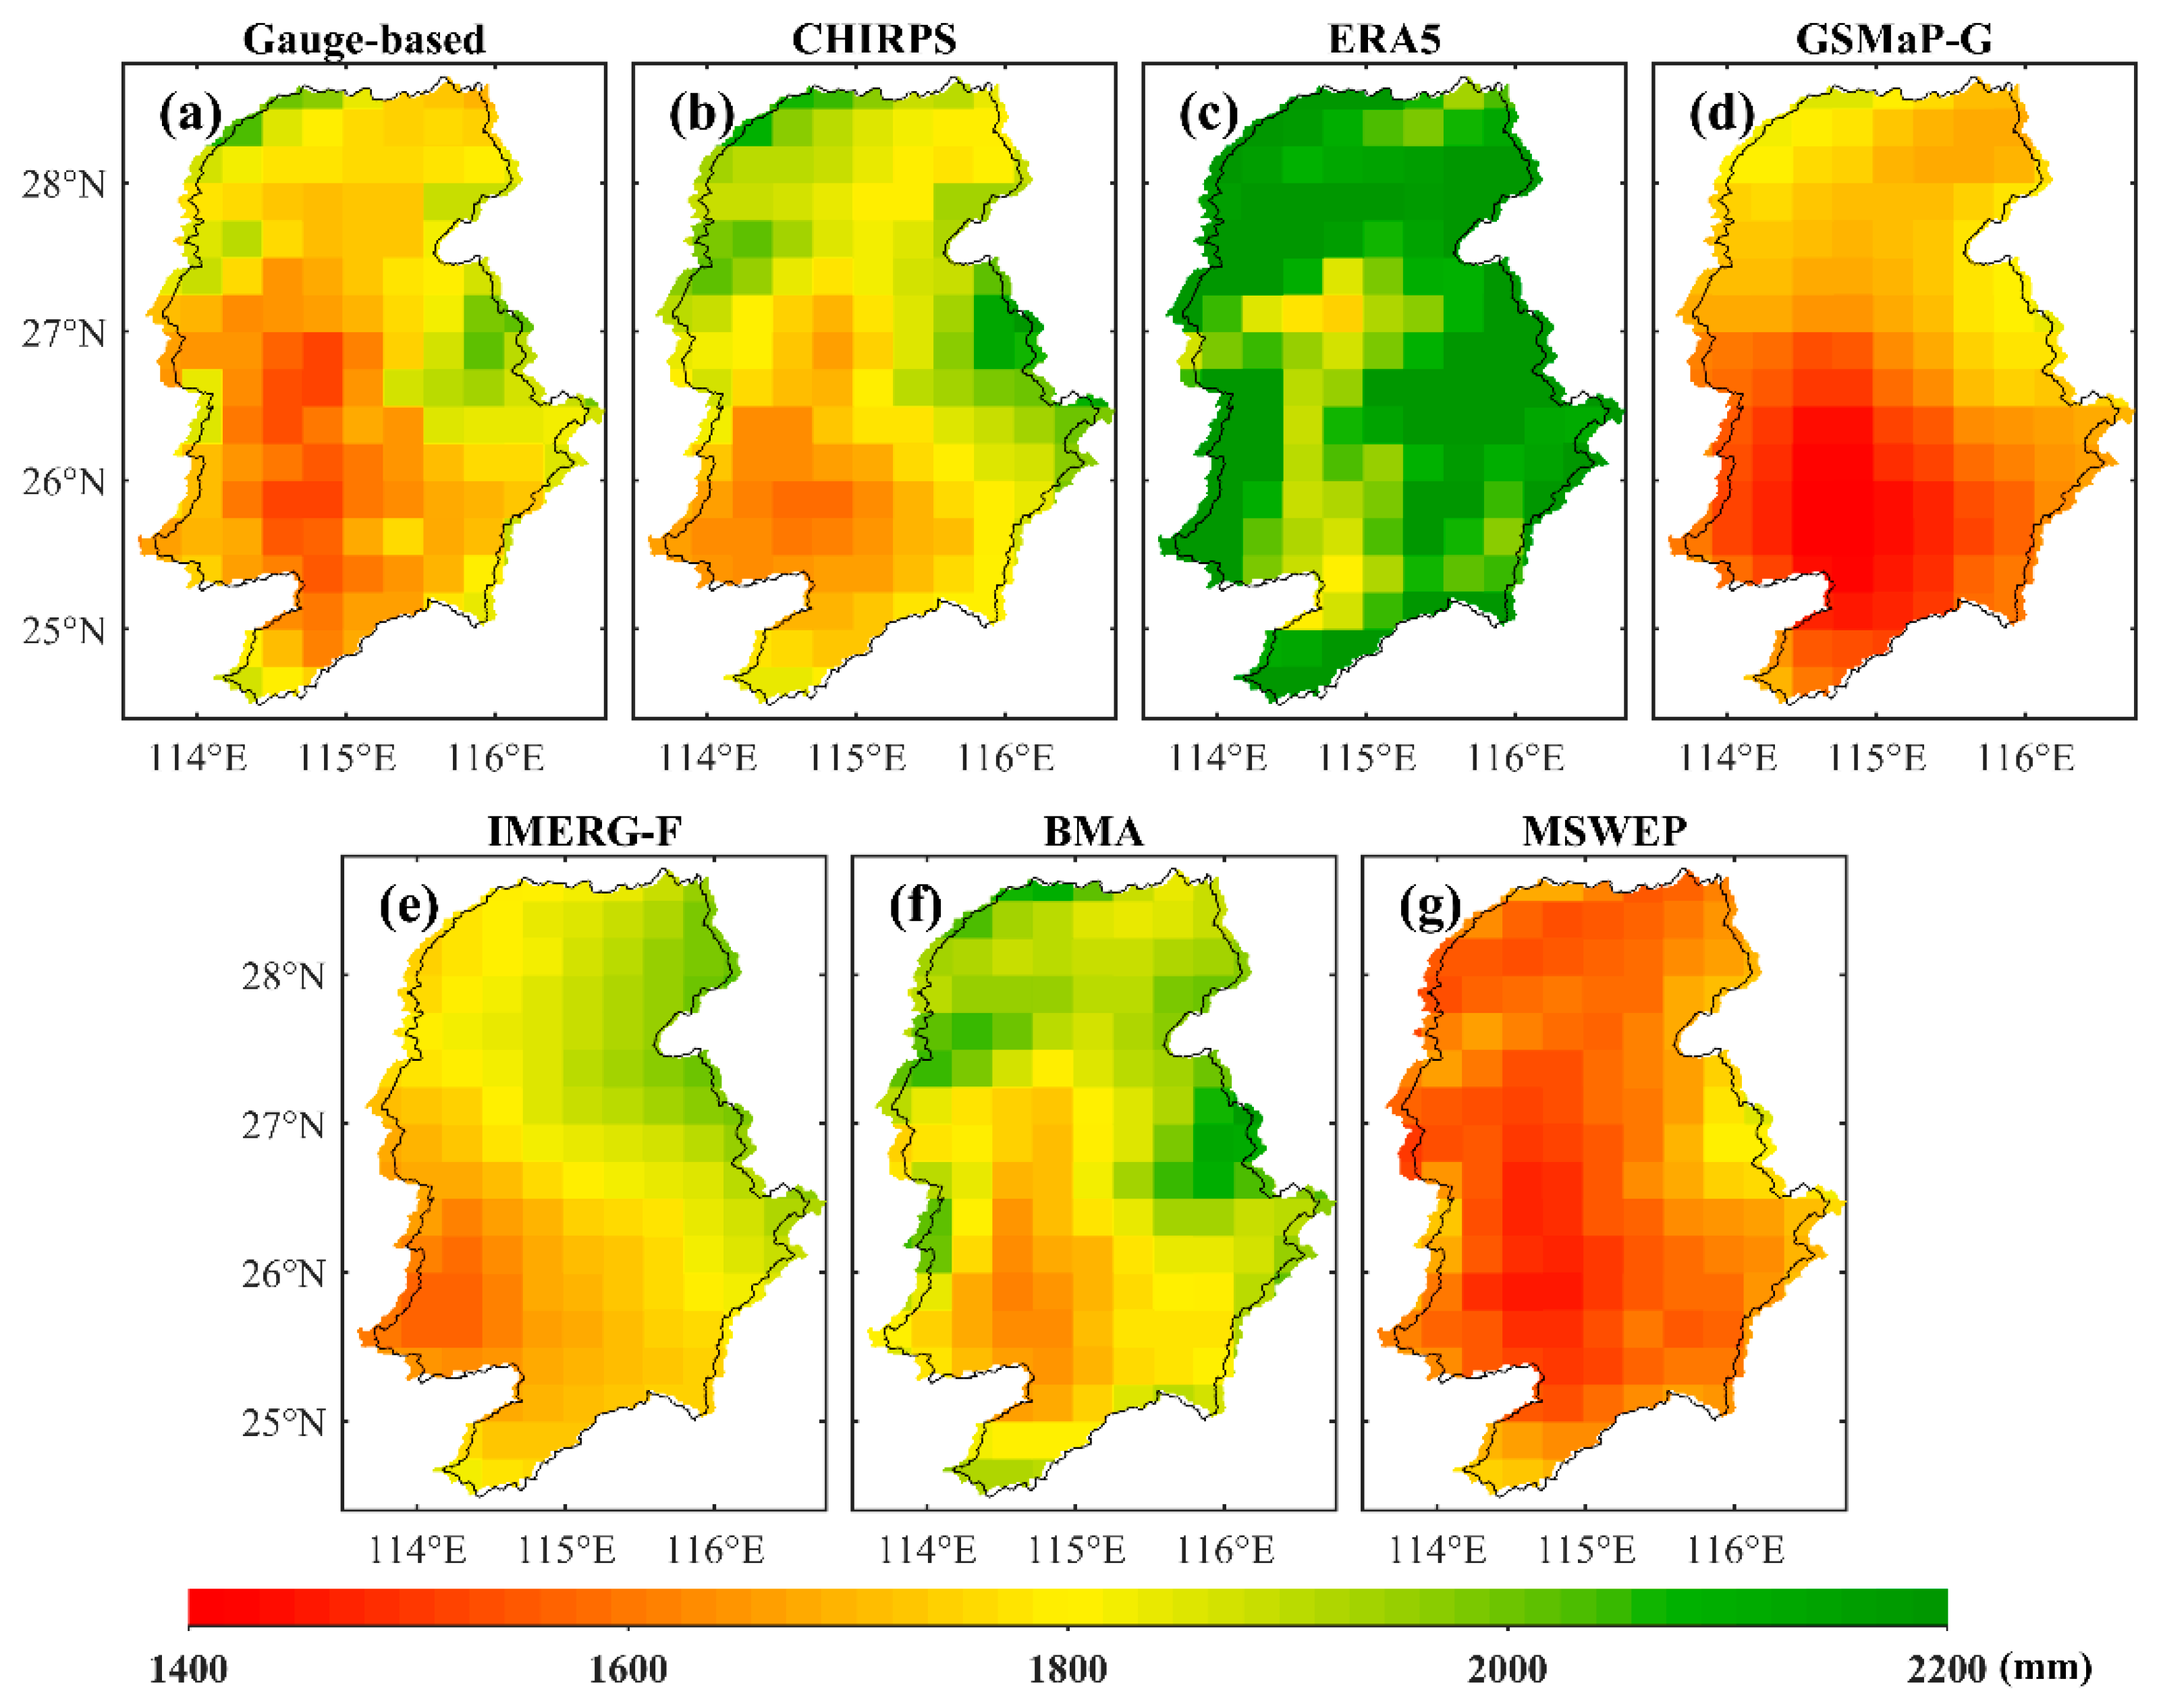
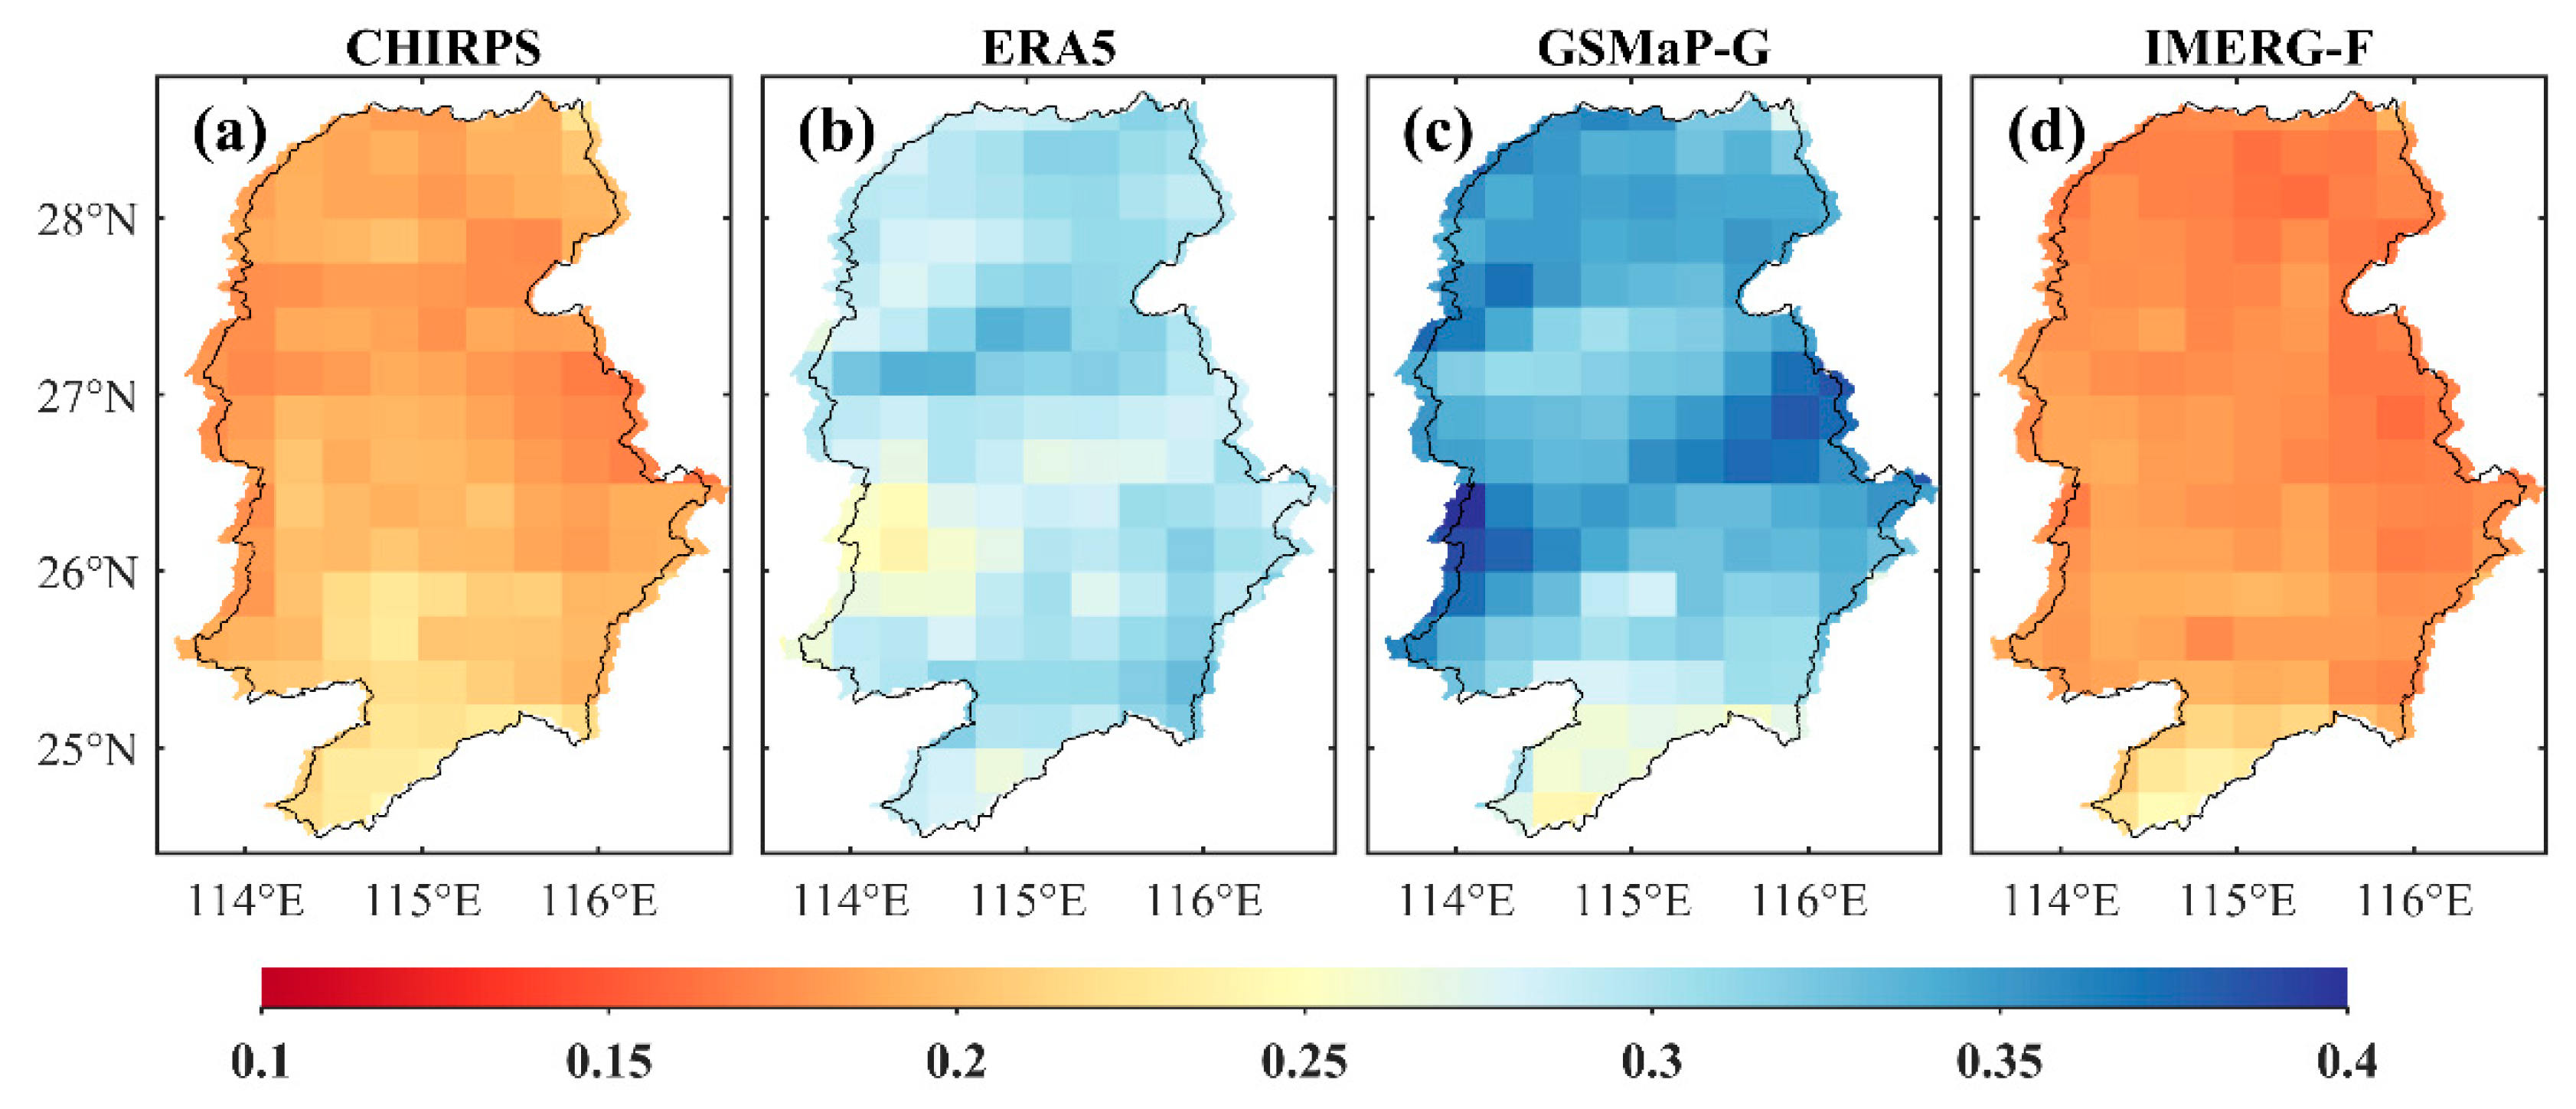
4.1. Accuracy Evaluation of Precipitation Estimation for Different Products

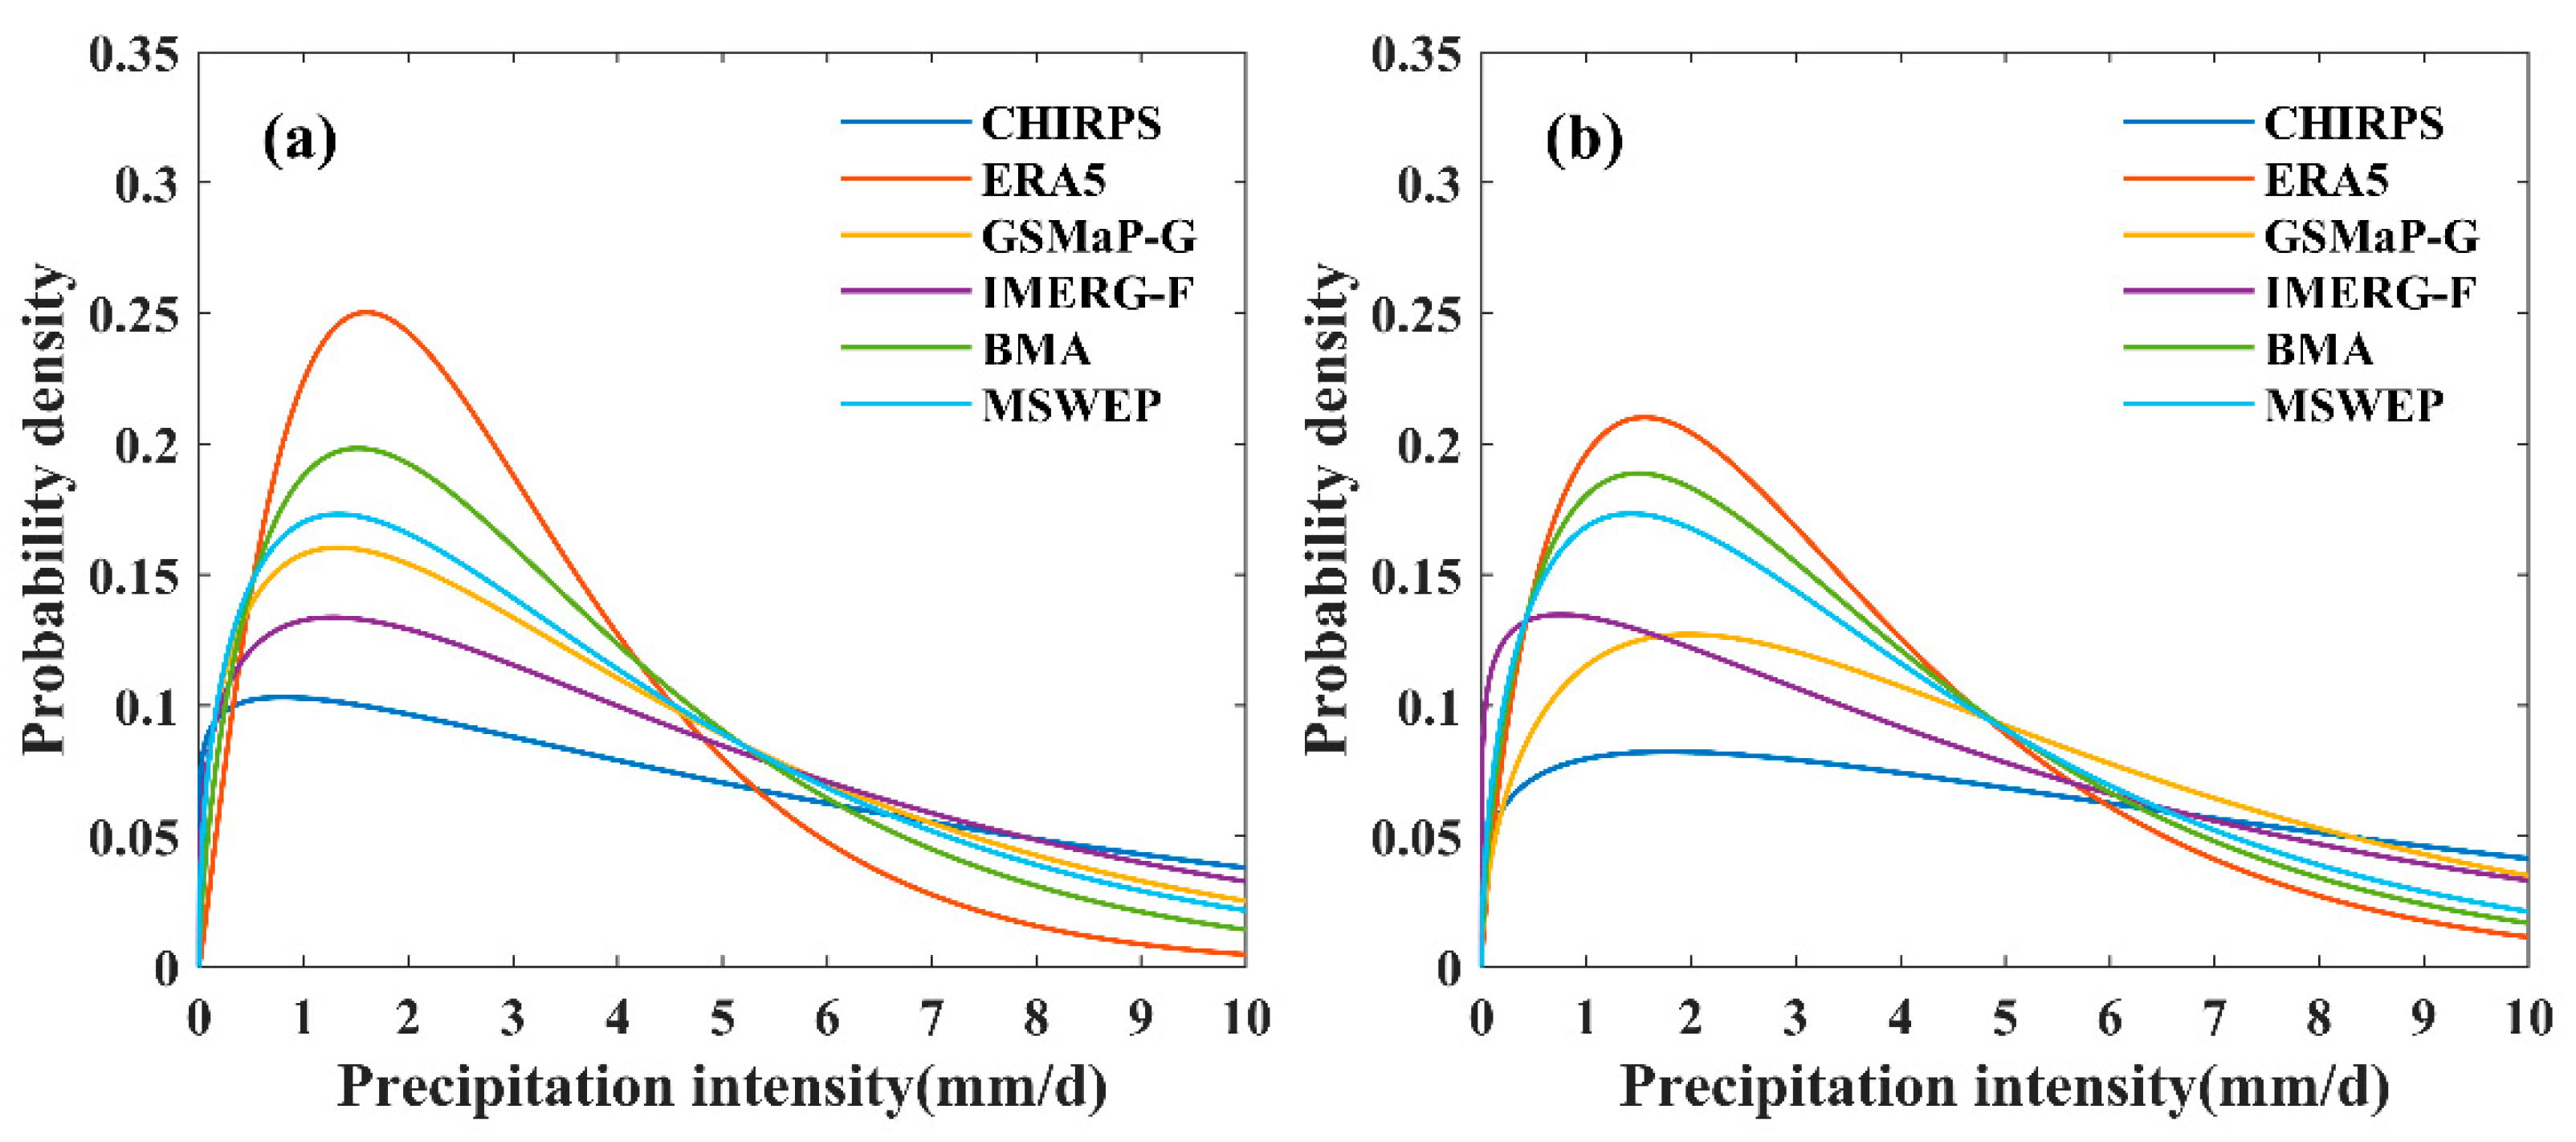
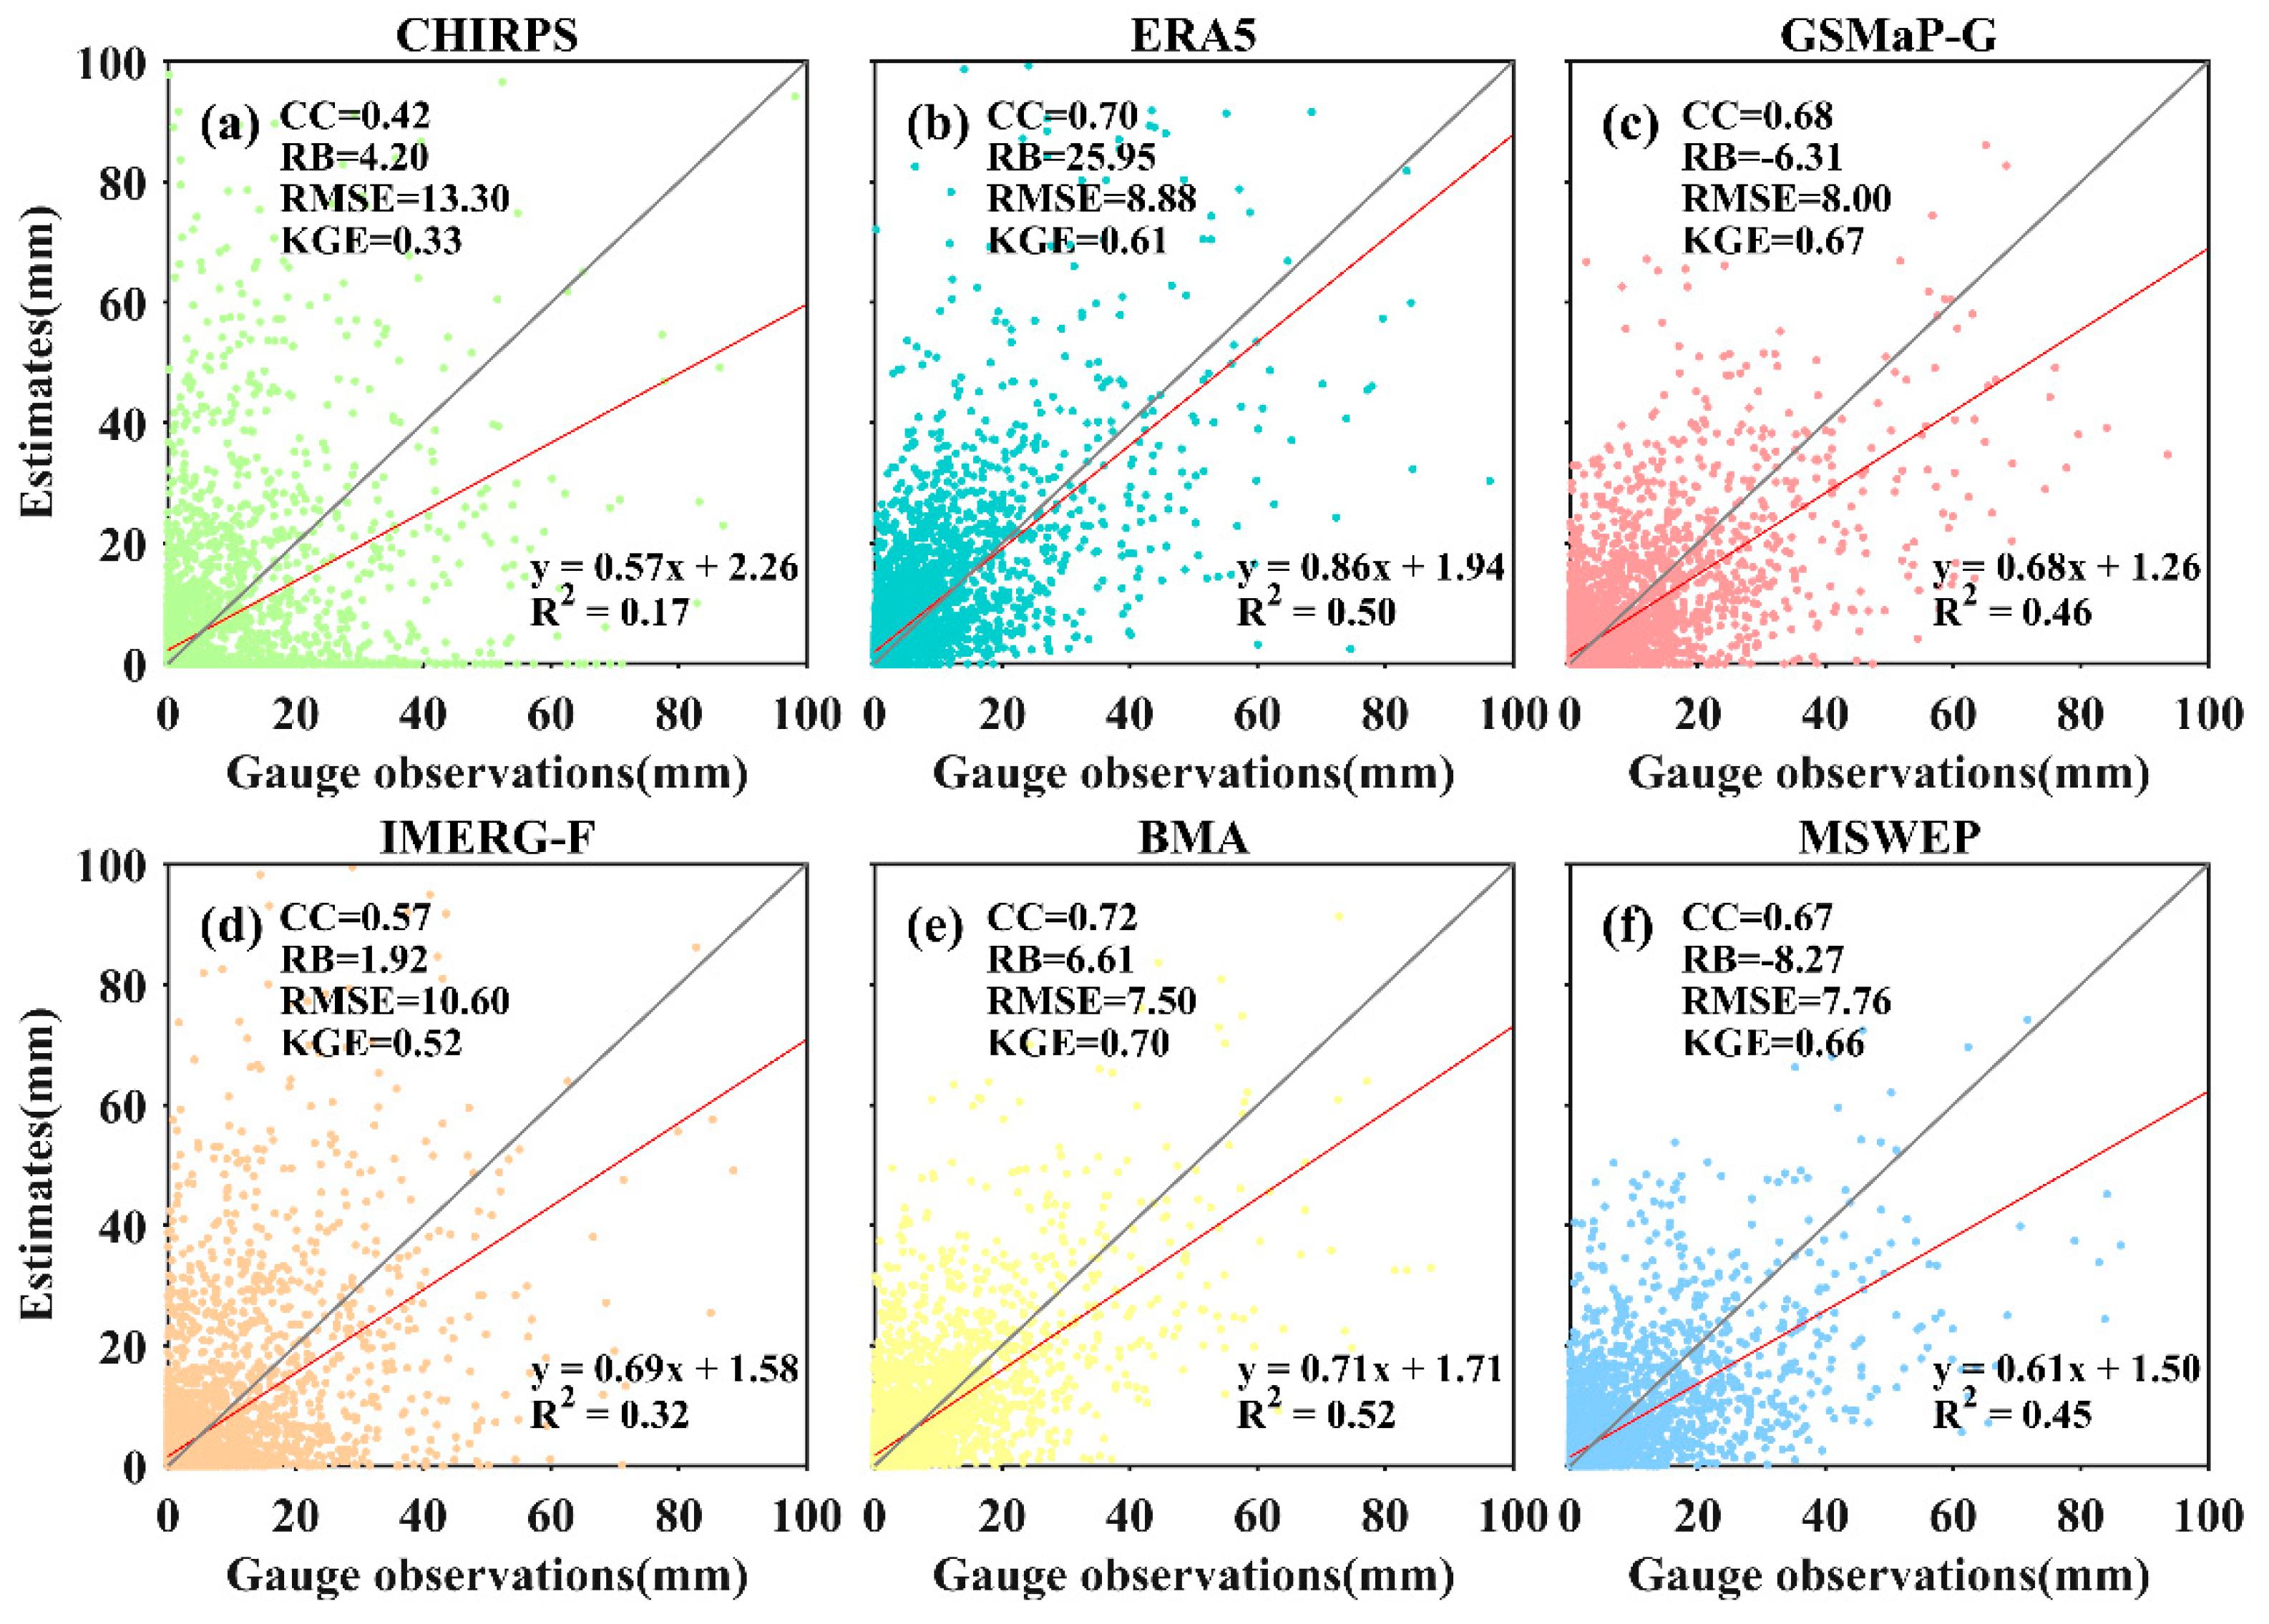
4.1.1. Daily Scale Evaluation

Figure 4 shows the daily-scale metric performance for the BMA-merged product (hereafter BMA), its ensemble members, and MSWEP in the study area (2008–2020). Compared to individual products, BMA shows clear advantages on multiple metrics, achieving the highest CC (0.72) and KGE (0.70), the lowest RMSE (7.50 mm), and outperforming most products in RB (6.61%), POD (0.84), and FAR (0.22). Some products show unique strengths: IMERG-F achieves the lowest RB, ERA5 the highest POD, and GSMaP-G the smallest FAR. MSWEP performs well overall, whereas CHIRPS shows poor performance.
Figure 5 illustrates the probability distributions of precipitation intensity for missed and false-alarm events [50] across different products. CHIRPS, GSMaP-G, and IMERG-F display broad, flat probability distributions for both missed and false-alarm events, suggesting high uncertainty in their precipitation estimates. Compared with other products, ERA5 shows a higher RB and FAR, with a greater tendency for missed and false alarms during light rainfall (<10 mm/d). BMA features a relatively narrow distribution and surpasses MSWEP in minimizing missed and false positives.
Figure 6 shows the box plots of evaluation metrics for various products at the daily scale. While CHIRPS and IMERG-F underperform, IMERG-F’s median RB is closest to 0 (Figure 6b). GSMaP-G performs well overall and achieves the lowest FAR among all products (Figure 6f). ERA5 shows a significant positive bias, severely overestimating daily precipitation in the study area, which likely explains its highest POD (Figure 6b,e). Downscaling may reduce ERA5’s overestimation but could diminish its precipitation detection performance [12]. BMA performs strongly on all metrics, offering superior CC, RMSE, and KGE compared to MSWEP and its ensemble members, effectively addressing the limitations of CHIRPS and ERA5 with high reliability.
The KGE, a comprehensive metric, is widely used to evaluate precipitation accuracy and has proven effective across various basins and hydrological settings. To examine the spatial distribution of evaluation metrics, a KGE map for six products is provided. As shown in Figure 7, CHIRPS performs poorly, with KGE values mostly below 0.4. ERA5 shows considerable fluctuations in KGE, with a highly uneven spatial distribution. GSMaP-G and MSWEP share similar spatial patterns, with KGE values mostly between 0.6 and 0.7, indicating solid performance. BMA shows excellent adaptability in the basin, with most regions having KGE values above 0.7 and a uniform spatial pattern. The results indicate that, compared with other products, BMA provides better precipitation estimates in the study area, underscoring its potential for hydrological modeling.
Figure 8 illustrates the spatial distributions of average annual precipitation (2008–2020) in the Ganjiang River Basin for gauge-based observations (hereafter Gauge-based), BMA, ensemble members, and MSWEP. Overall, all products exhibit a similar spatial pattern, with lower precipitation in the south and higher precipitation in the north. Gauge-based observations indicate average annual precipitation of 1500–1900 mm in the study area. Compared with Gauge-based data, ERA5 considerably overestimates precipitation in most regions, reaching up to 2800 mm/year in some areas, while GSMaP-G underestimates precipitation across much of the region. IMERG-F’s average annual precipitation aligns closely with Gauge-based observations, but it increases from southwest to northeast. MSWEP presents a highly uniform precipitation distribution basin-wide, averaging around 1500 mm/year, slightly lower than Gauge-based observations. Both CHIRPS and BMA produce precipitation estimates and spatial distributions similar to Gauge-based observations, confirming BMA’s applicability and feasibility.
Figure 9 shows scatter plots and evaluation metrics comparing gauge-based observations with BMA, ensemble members, and MSWEP, highlighting the correlation and dispersion between estimated and observed precipitation. Compared with MSWEP and the ensemble members, BMA’s precipitation estimates align most closely with gauge-based observations, showing the highest correlation and lowest dispersion. ERA5 ranks second in precipitation estimation, with high correlation, low dispersion, but substantial RB. GSMaP-G and MSWEP produce generally accurate precipitation estimates, performing well across all metrics. CHIRPS and IMERG-F yield poor precipitation estimates, deviating considerably from observed values.

4.1.2. Monthly Scale Evaluation

As indicated in Table 4, BMA and other precipitation products show much higher consistency with observed precipitation at the monthly scale than at the daily scale. Even CHIRPS, which underperforms at the daily scale, achieves CC and KGE values above 0.90 at the monthly scale. IMERG-F’s monthly-scale accuracy greatly exceeds its daily performance, with RB and KGE reaching 1.93% and 0.95, respectively. Compared with MSWEP, BMA shows greater alignment with observed precipitation, achieving the highest CC, the lowest RMSE, and the best characterization of monthly precipitation.
Figure 10 shows the box plots of evaluation metrics for various precipitation products at the monthly scale. Compared with other products, BMA achieves the highest performance in CC, RB, and RMSE, with its KGE second only to IMERG-F. ERA5 performs notably worse than the others, showing low accuracy, high deviation, and limited data availability. These findings indicate that BMA provides reliable precipitation estimates at the monthly scale, closely matching observed values.

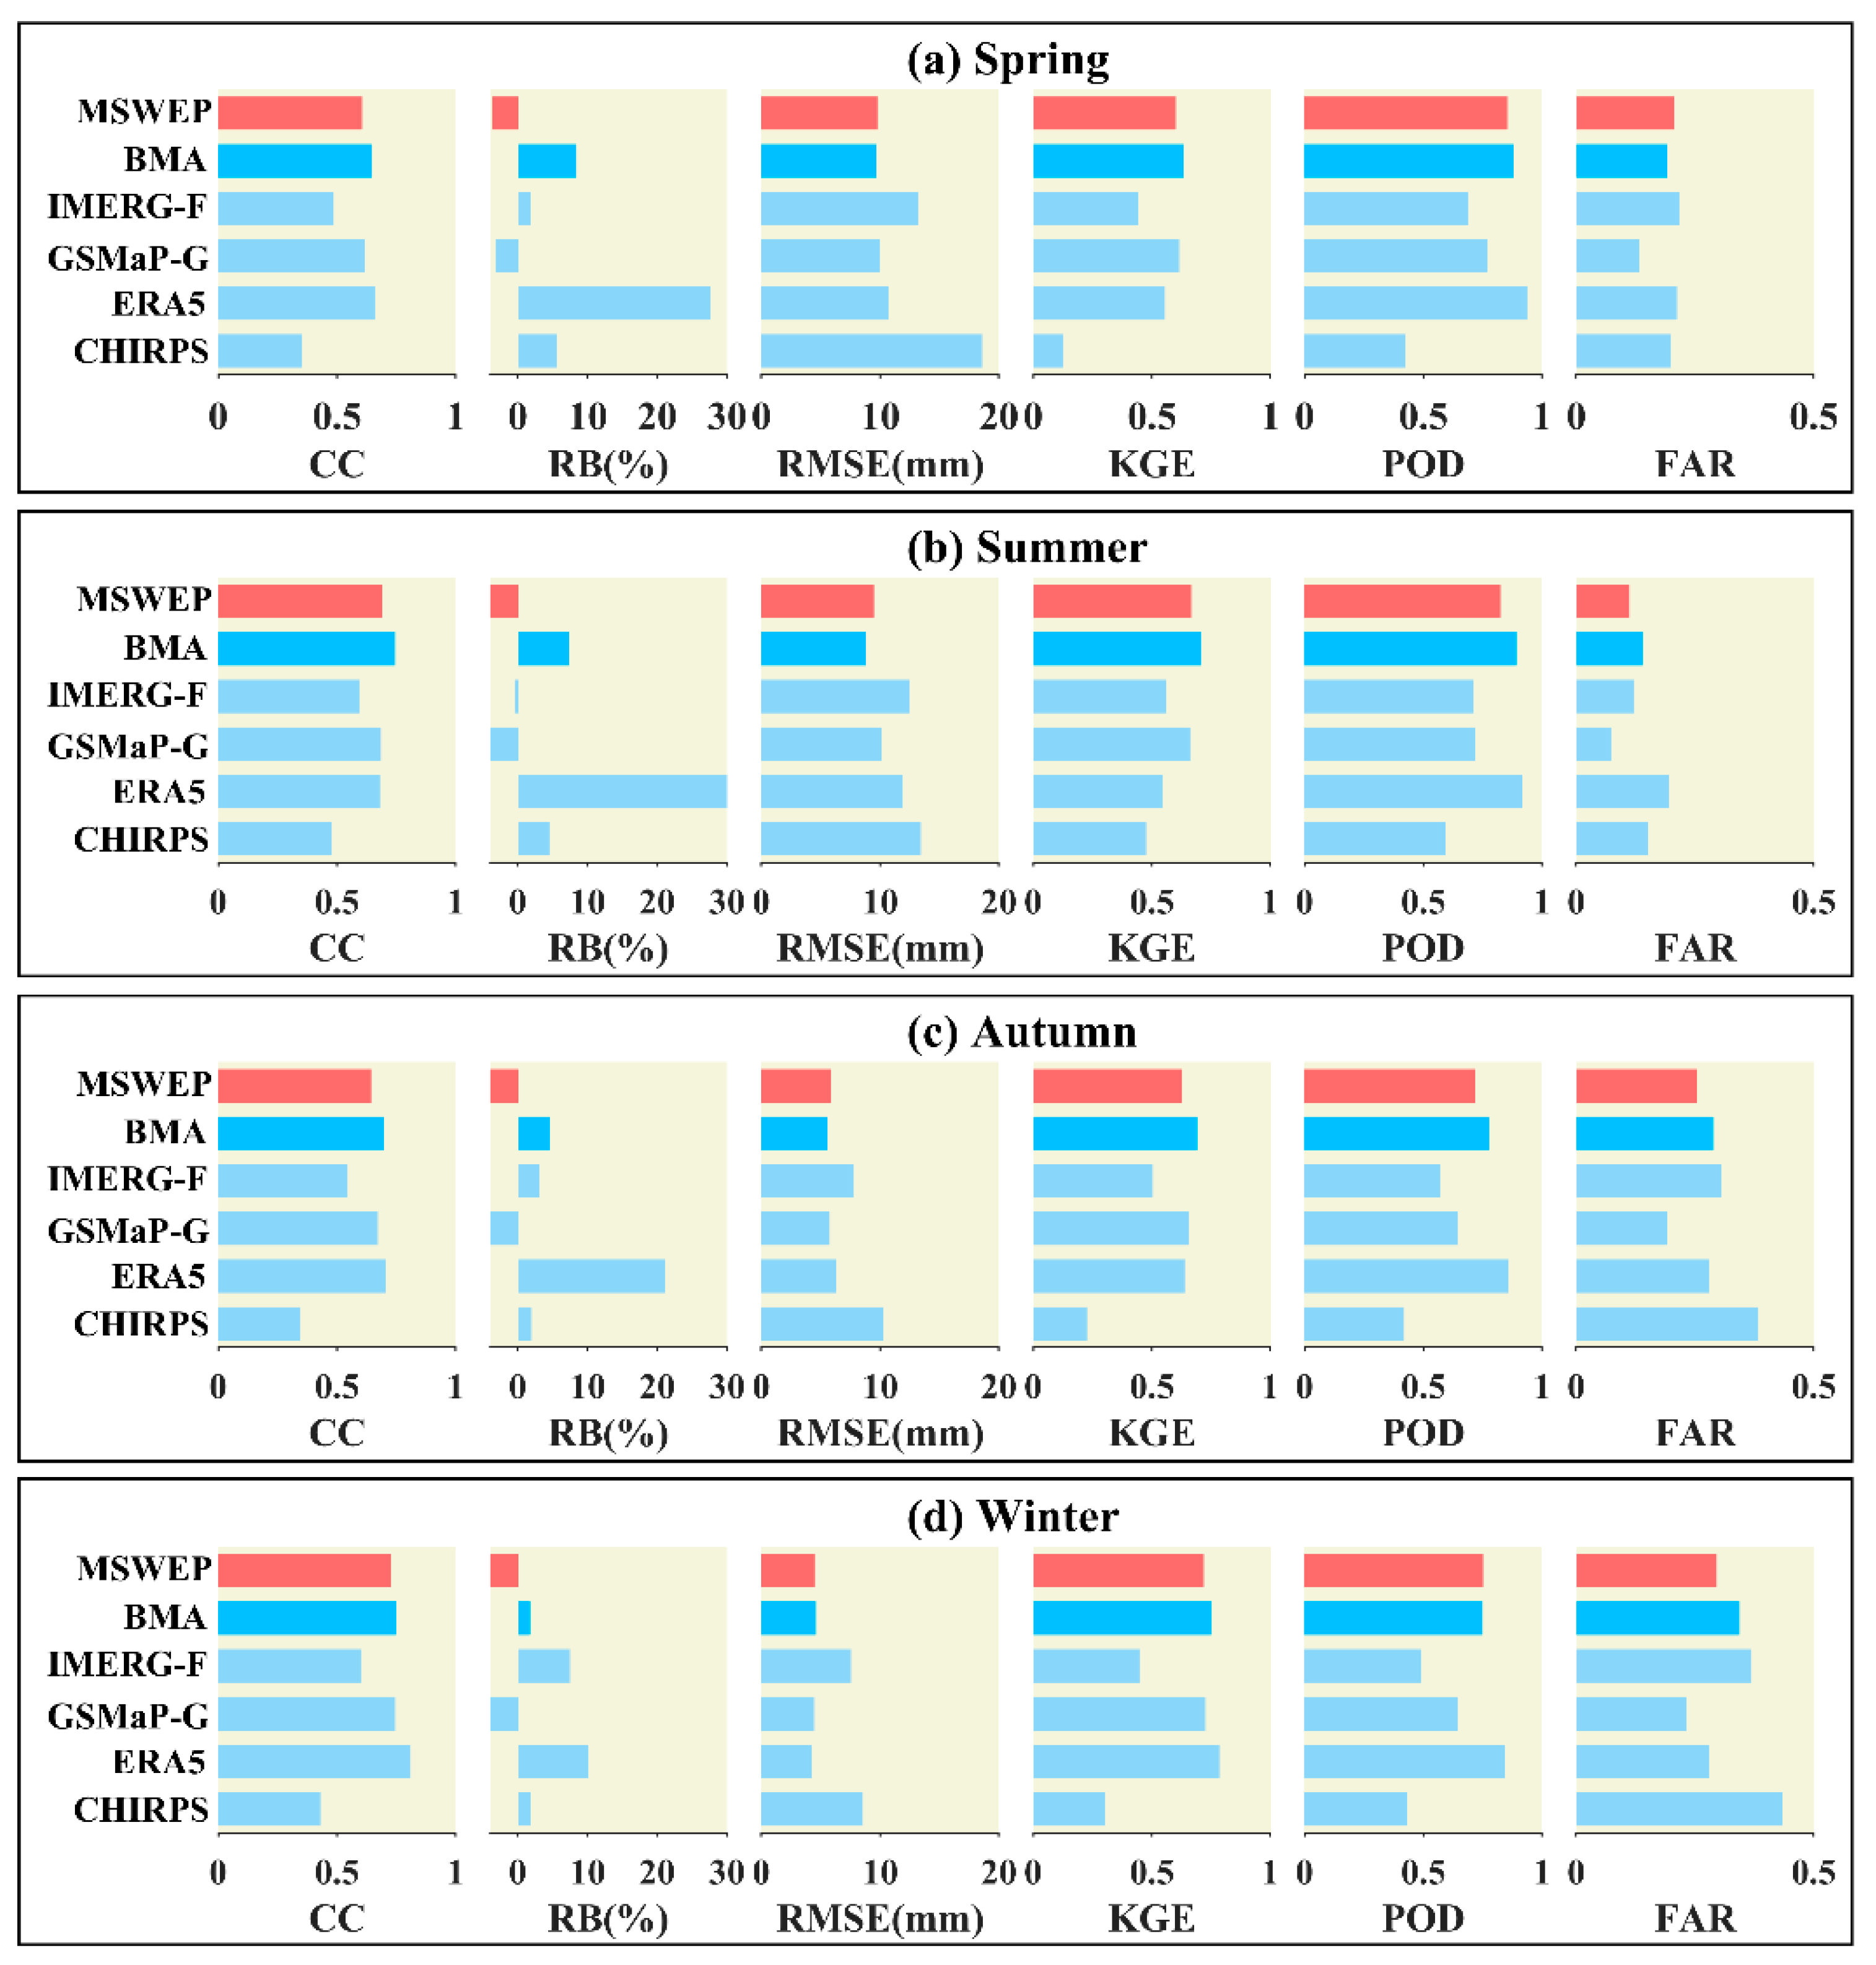
4.1.3. Seasonal Scale Evaluation

Figure 11 shows the seasonal evaluation metrics for six precipitation products in the study area (2008–2020). The dataset is divided into four seasons for metric calculation: spring (March–May), summer (June–August), autumn (September–November), and winter (December–February). The results show marked improvements and substantial advantages of BMA in different seasons. The BMA scheme effectively addresses CHIRPS’s deficiencies (poor CC, RMSE, etc.), ERA5’s higher RB, and IMERG-F’s lower KGE and POD across seasons.
Among these, CHIRPS, ERA5, and IMERG-F show low accuracy, large deviations, and poor detection performance. CHIRPS and IMERG-F demonstrate relatively high availability in summer, while ERA5 remains more reliable in winter. For most metrics, BMA surpasses MSWEP and other products in spring, especially in CC, RMSE, and KGE (Figure 9a). During summer, ERA5’s deviation reaches 30%, while BMA and other products show stronger metric performance (Figure 9b). In autumn, BMA’s RB and RMSE decrease further, but all products show varying degrees of deterioration in POD and FAR (Figure 9c). In winter, BMA attains the best results in CC, RB, RMSE, and KGE, demonstrating robust performance. CHIRPS underperforms in FAR, with rainfall events near 0.5 failing to align correctly (Figure 9d). These findings indicate that BMA and other products show seasonal variations and differences in precipitation estimation. Most products perform better in POD and FAR during spring and summer, and score higher in CC, RB, RMSE, and KGE during autumn and winter.

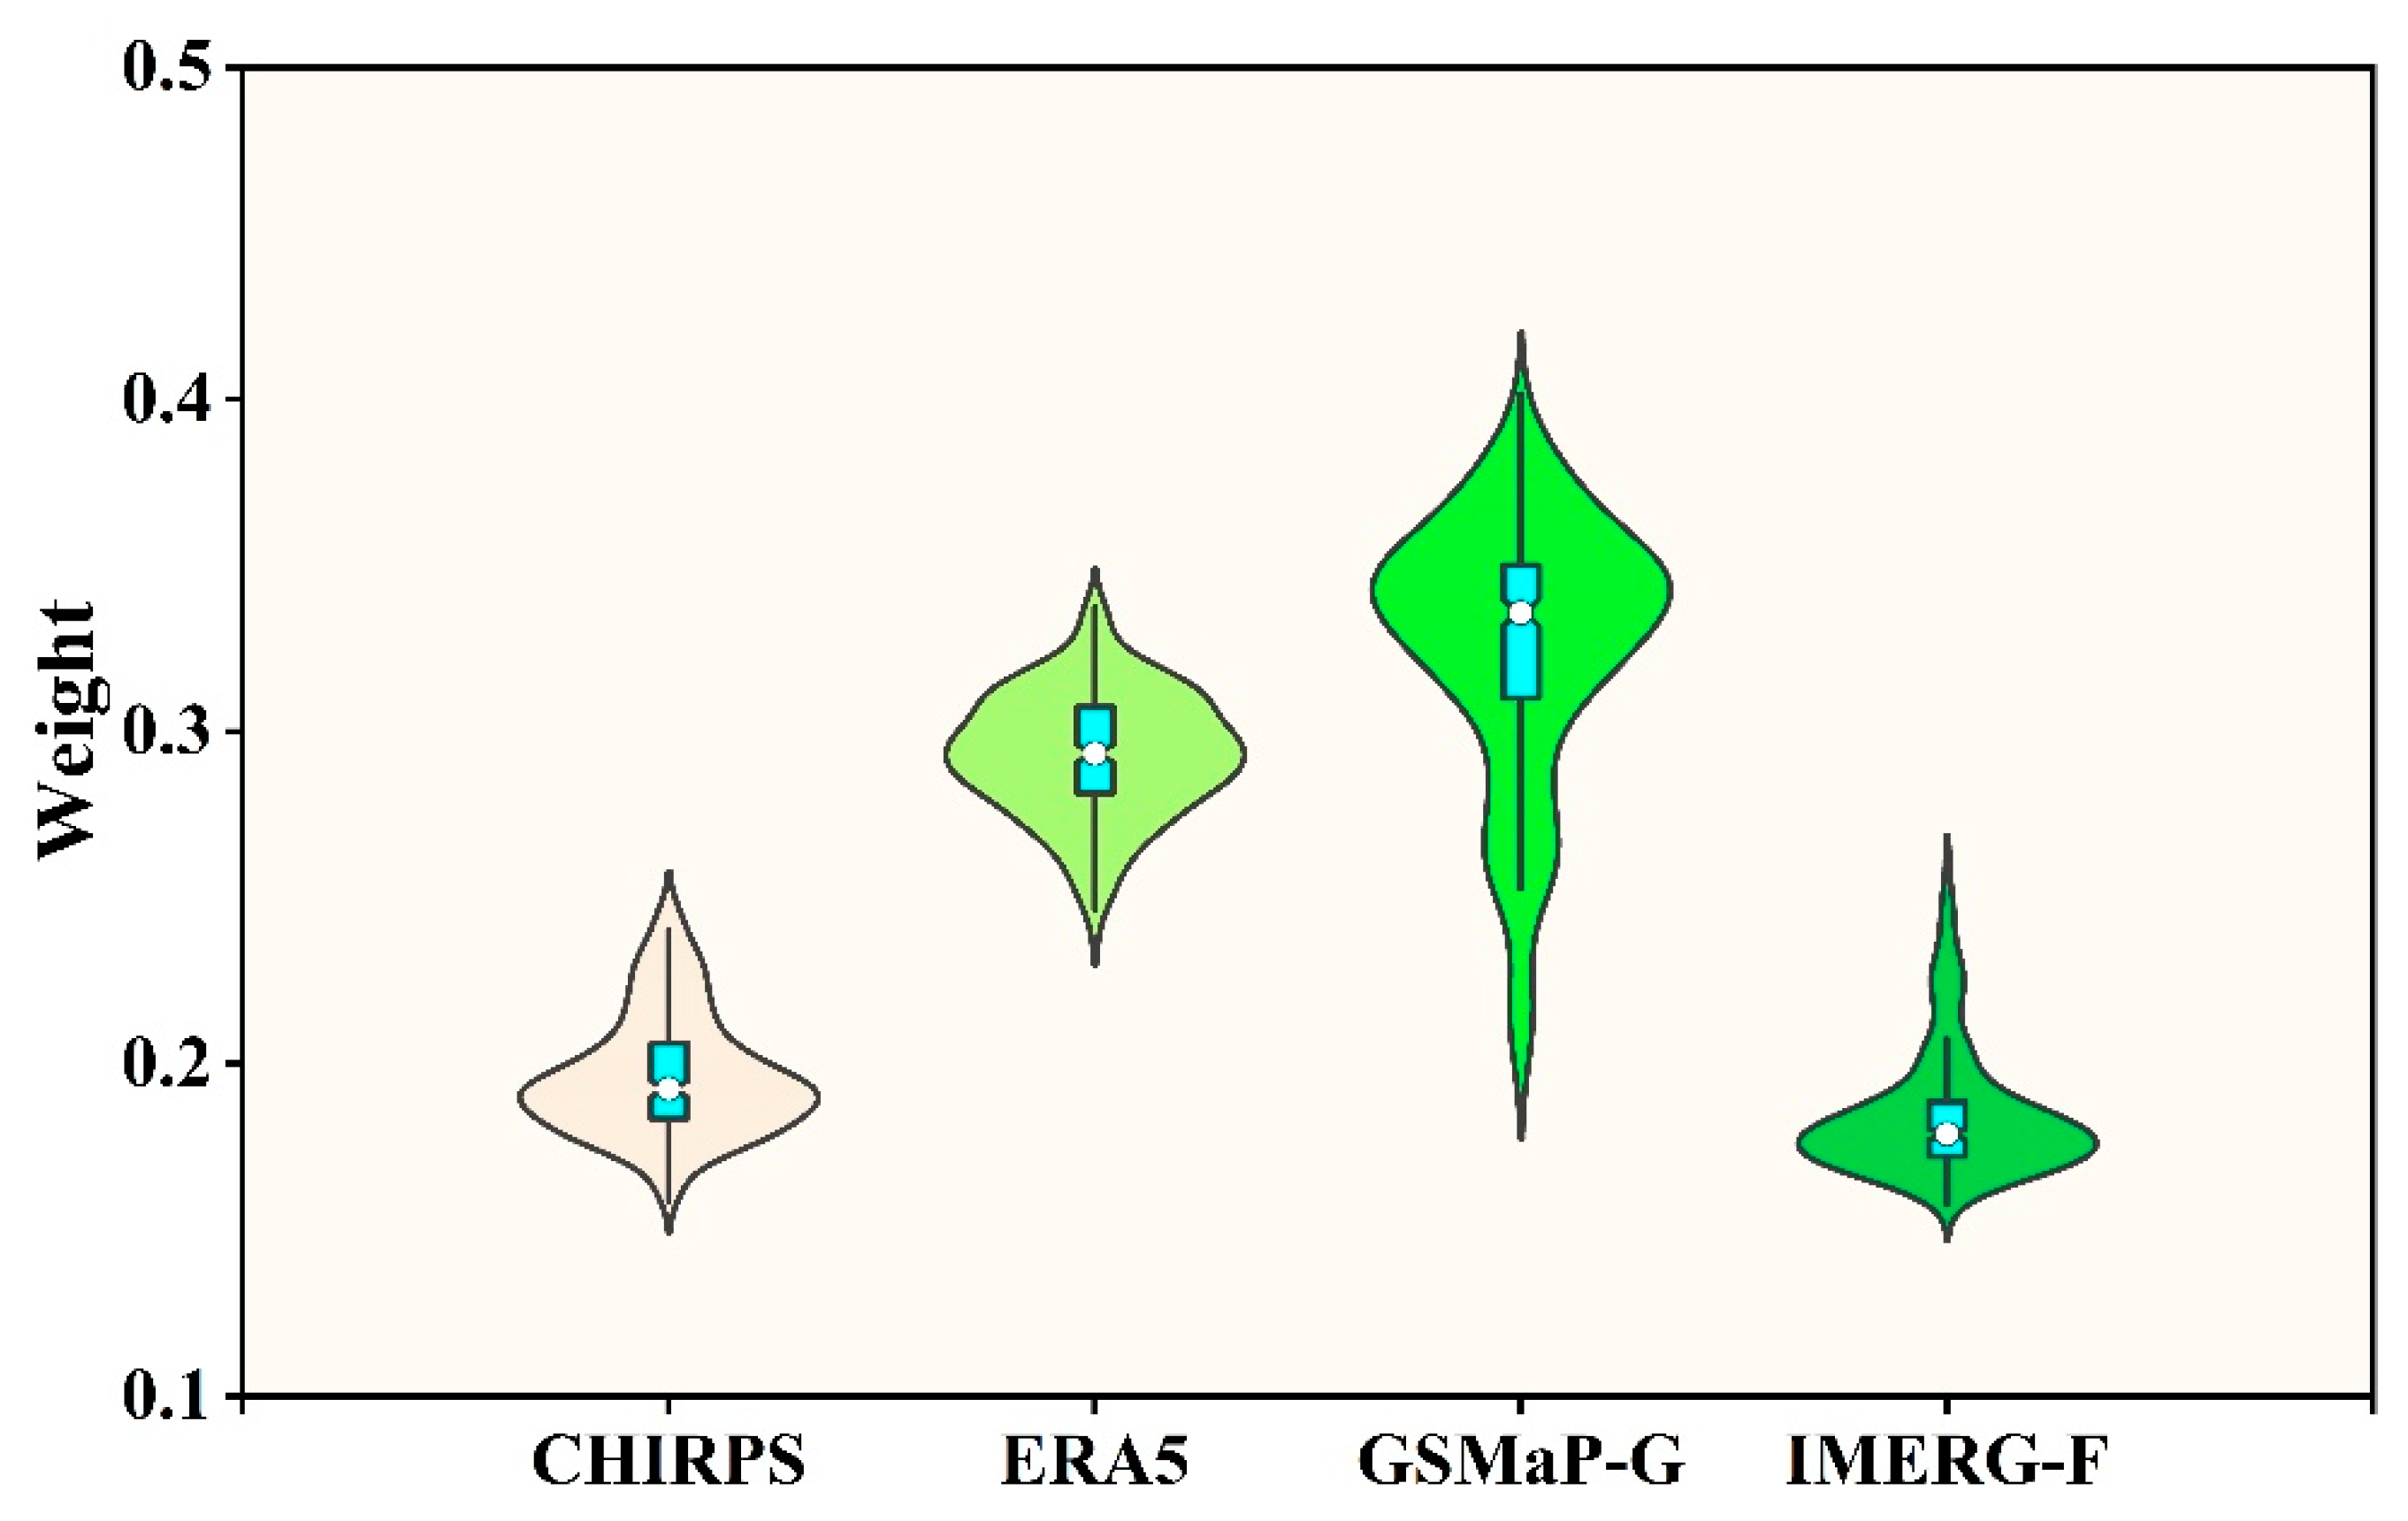
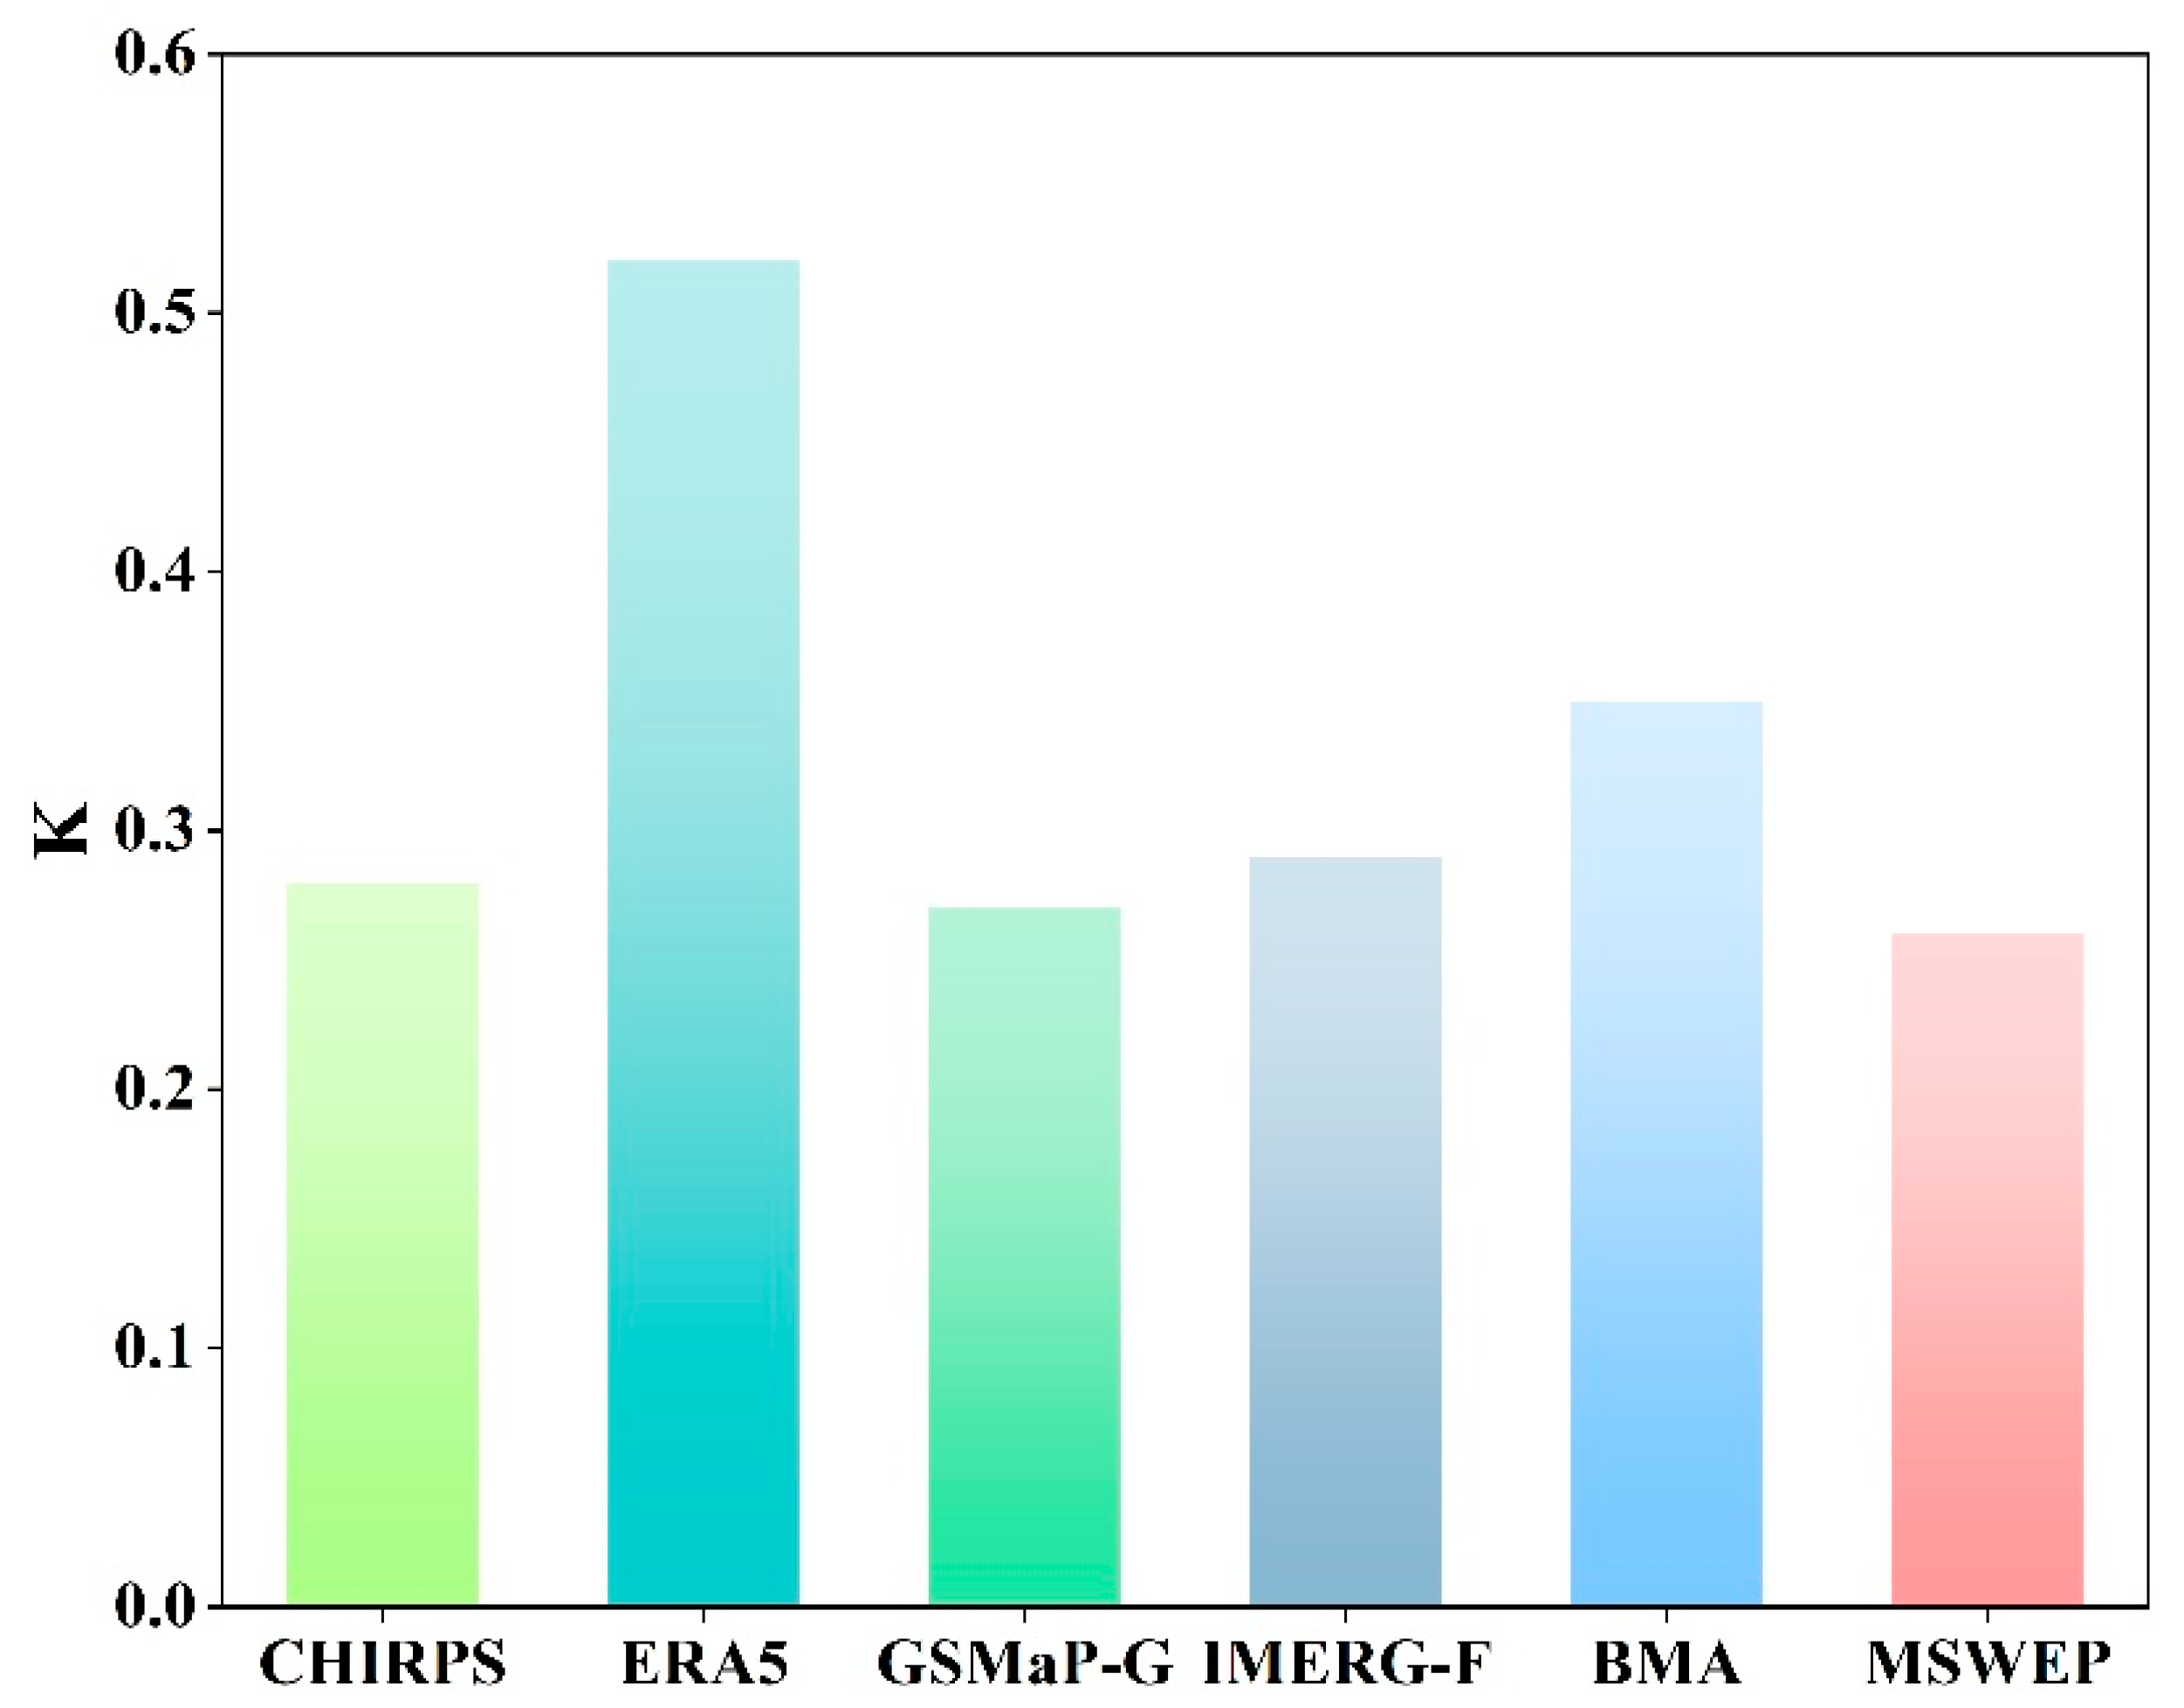
4.2. Weight Analysis of BMA Ensemble Members

In this study, optimal weights for each ensemble member across 234 grids in the Ganjiang River Basin were calculated using 2008–2020 as the training period. Figure 12 shows the weight distribution of the four ensemble members in BMA across the Ganjiang River Basin. Higher weights go to better-performing members in BMA, as each product’s feasibility is determined by its consistency with observed precipitation [43,51]. GSMaP-G generally has the highest weight, contributing most to BMA, with a median of 0.34 and a range of 0.18–0.42. ERA5 ranks second, with weights from 0.25 to 0.35. CHIRPS and IMERG-F have similar weights, with medians of 0.19 and 0.17, respectively, contributing less to BMA overall.
Figure 13 illustrates the spatial distribution of ensemble member weights. Overall, the weight distributions of the various precipitation products exhibit a certain degree of consistency, while simultaneously reflecting their relative advantages across different regions. CHIRPS and IMERG-F demonstrate comparatively uniform weight distributions, with only slightly elevated values in the southern portion of the study area, suggesting that their precipitation estimates in this region are relatively more reliable. In contrast, ERA5 and GSMaP-G display more pronounced spatial variability, indicating that their suitability for precipitation estimation differs across the region.

4.3. Hydrological Simulation Driven by Different Precipitation Products

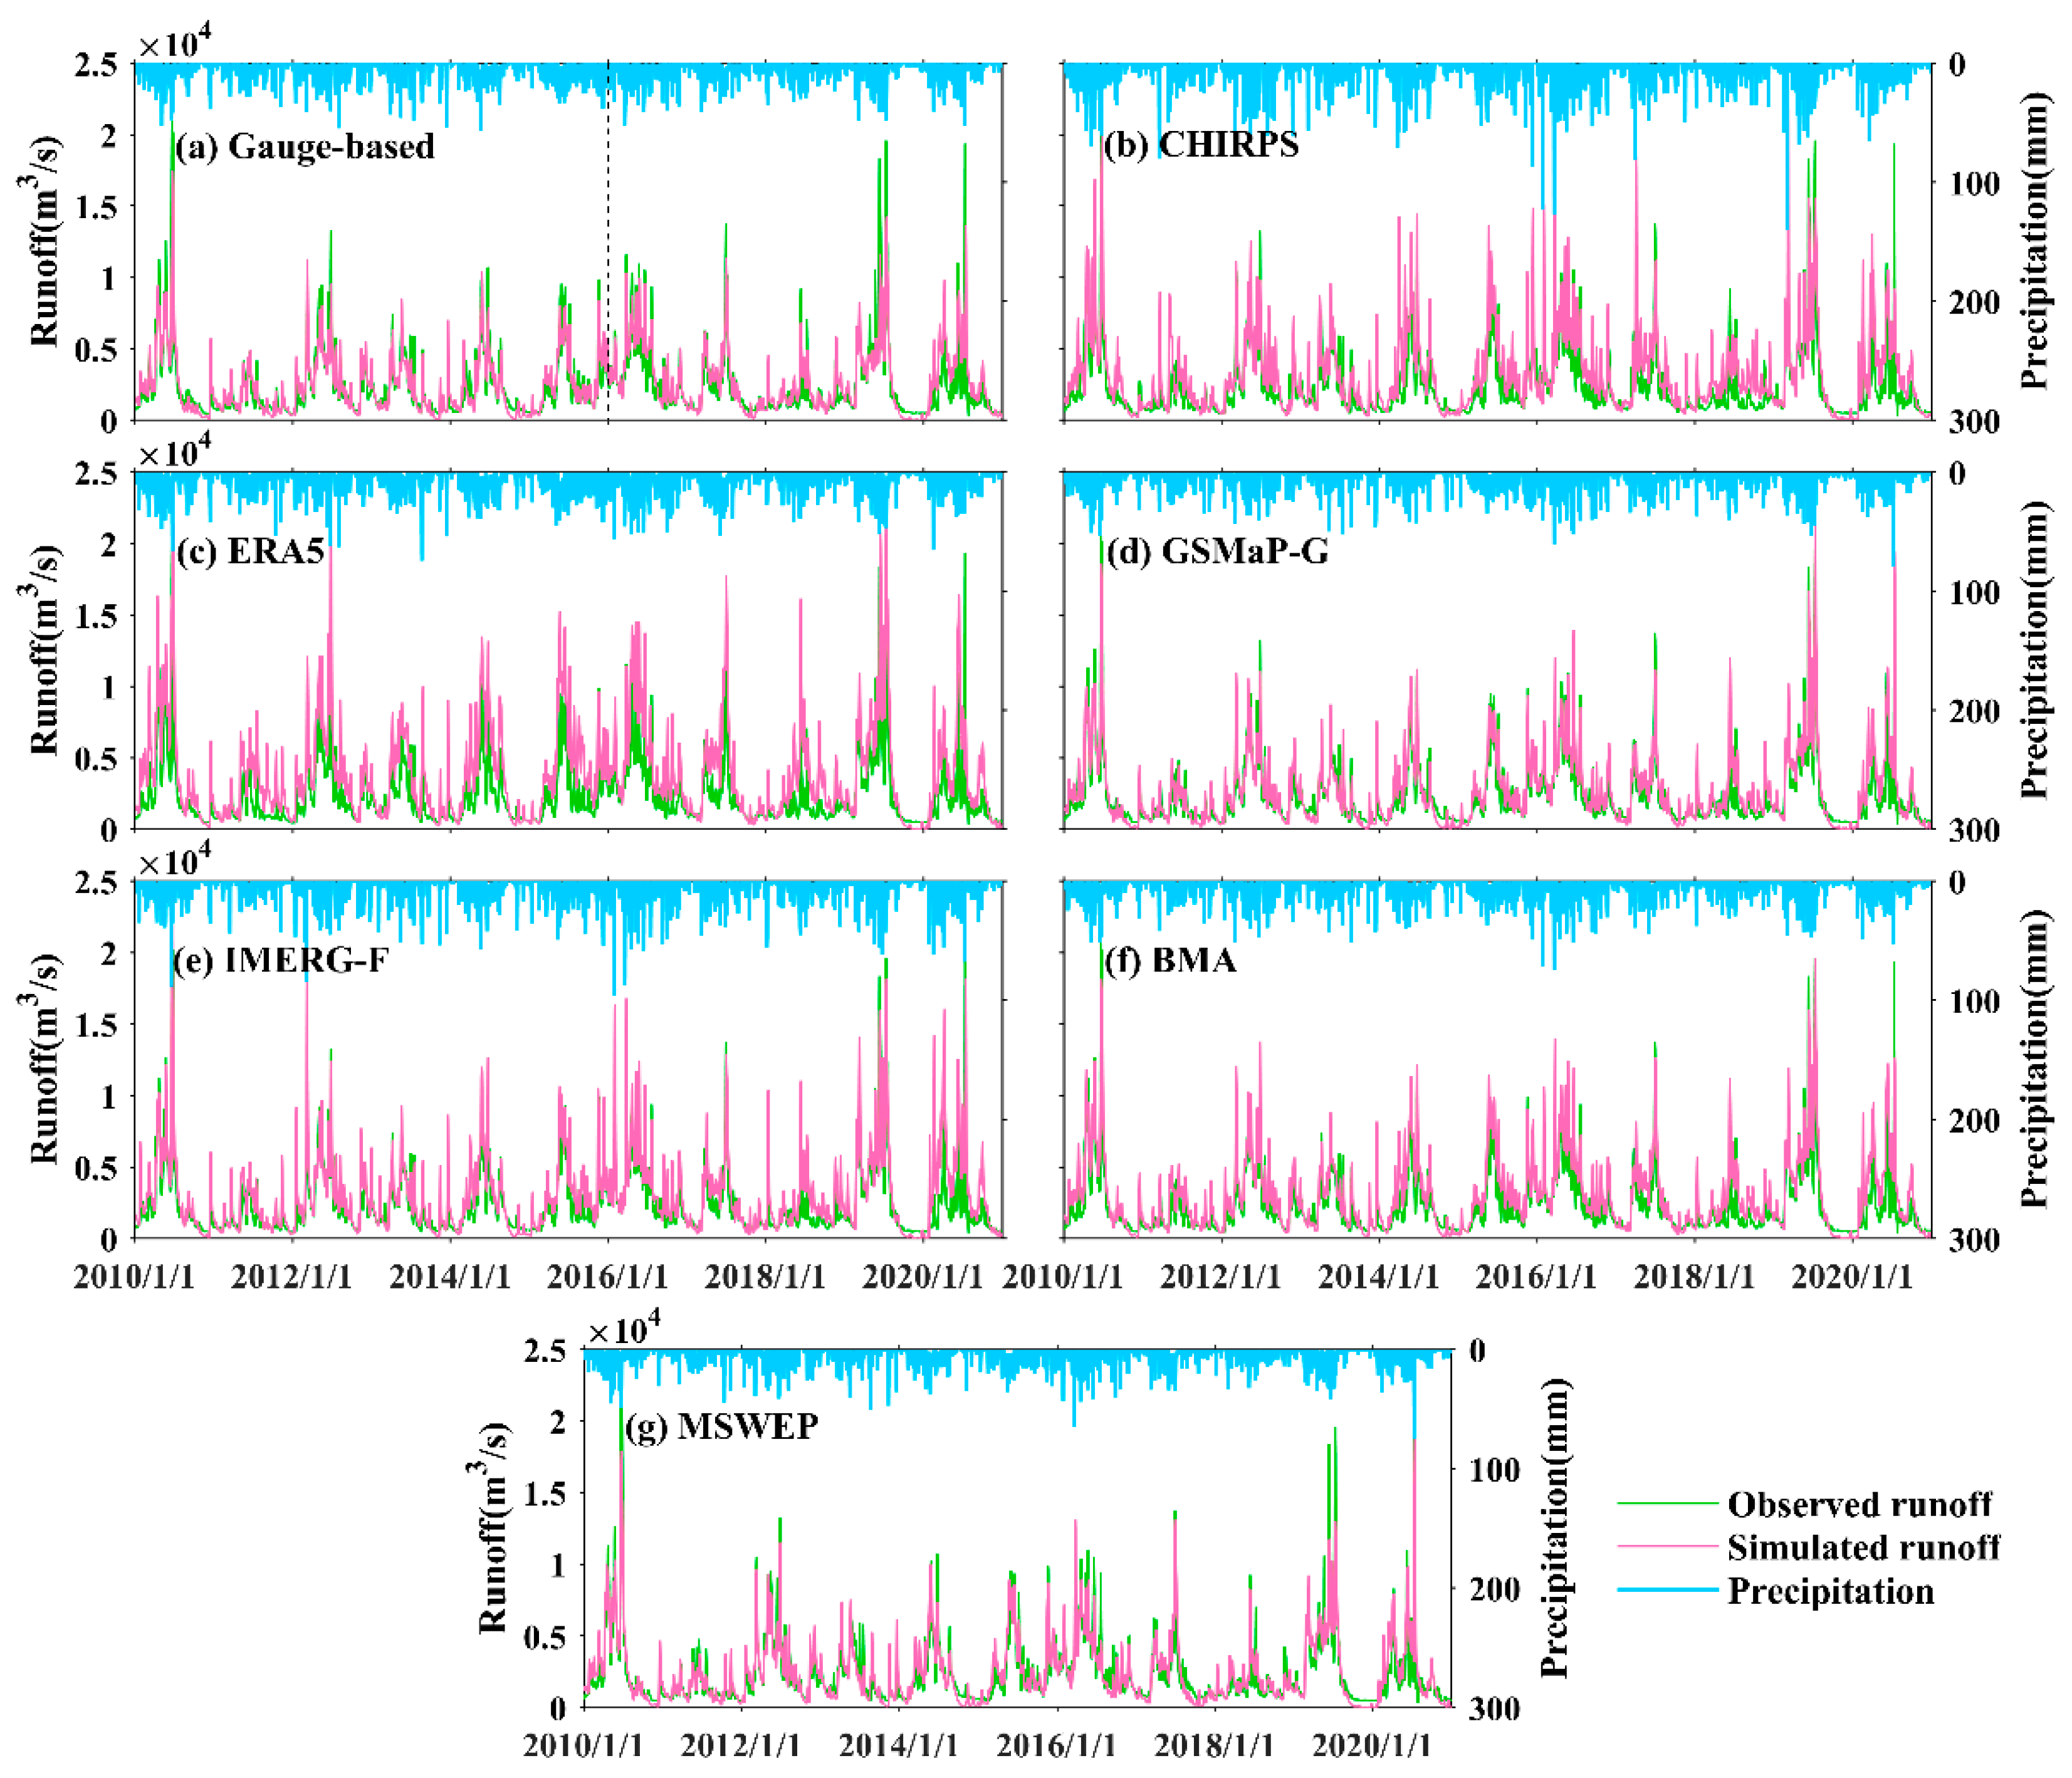
4.3.1. Daily Scale Simulation

Figure 14 compares observed daily runoff with simulations driven by daily precipitation data from BMA, its ensemble members, and MSWEP. Gauge-based simulations perform well, with NSE values of 0.86 during calibration and 0.74 during verification, indicating high feasibility for daily runoff prediction. CHIRPS and IMERG-F perform poorly throughout the study period, with NSE values below 0.6 and simulated runoff far exceeding observed values. ERA5’s NSE is just 0.07, with simulated runoff greatly exceeding observed values, rendering the results unreliable. Both GSMaP-G and MSWEP produce reliable runoff simulations, with NSE values of 0.79 and 0.82, respectively. GSMaP-G captures peak flows more accurately, while MSWEP’s runoff trends closely match observed trends. BMA’s runoff simulation also performs well, with an NSE of 0.70. Simulated and observed runoff trends are closely aligned, and the estimated precipitation trend matches observations, indicating high reliability. Although BMA’s runoff simulation slightly overestimates runoff, it remains acceptable and surpasses other products. The NSE values of different precipitation products during the calibration period, verification period, and the entire study period are presented in Table 5.

4.3.2. Monthly Scale Simulation

Figure 15 compares observed monthly runoff with simulations driven by various precipitation products at the monthly scale. From daily to monthly scales, all products except ERA5 show improved simulation accuracy, indicated by higher NSEs, while ERA5’s NSE drops to −0.15, suggesting unreliable results. Notably, MSWEP-driven monthly simulations reach an NSE of 0.91, closely matching observed runoff. BMA’s NSE rises to 0.71, with its monthly runoff simulation closely aligning with observed values, especially during high-discharge flood events. These findings illustrate BMA’s strong applicability for runoff simulation in the study area.

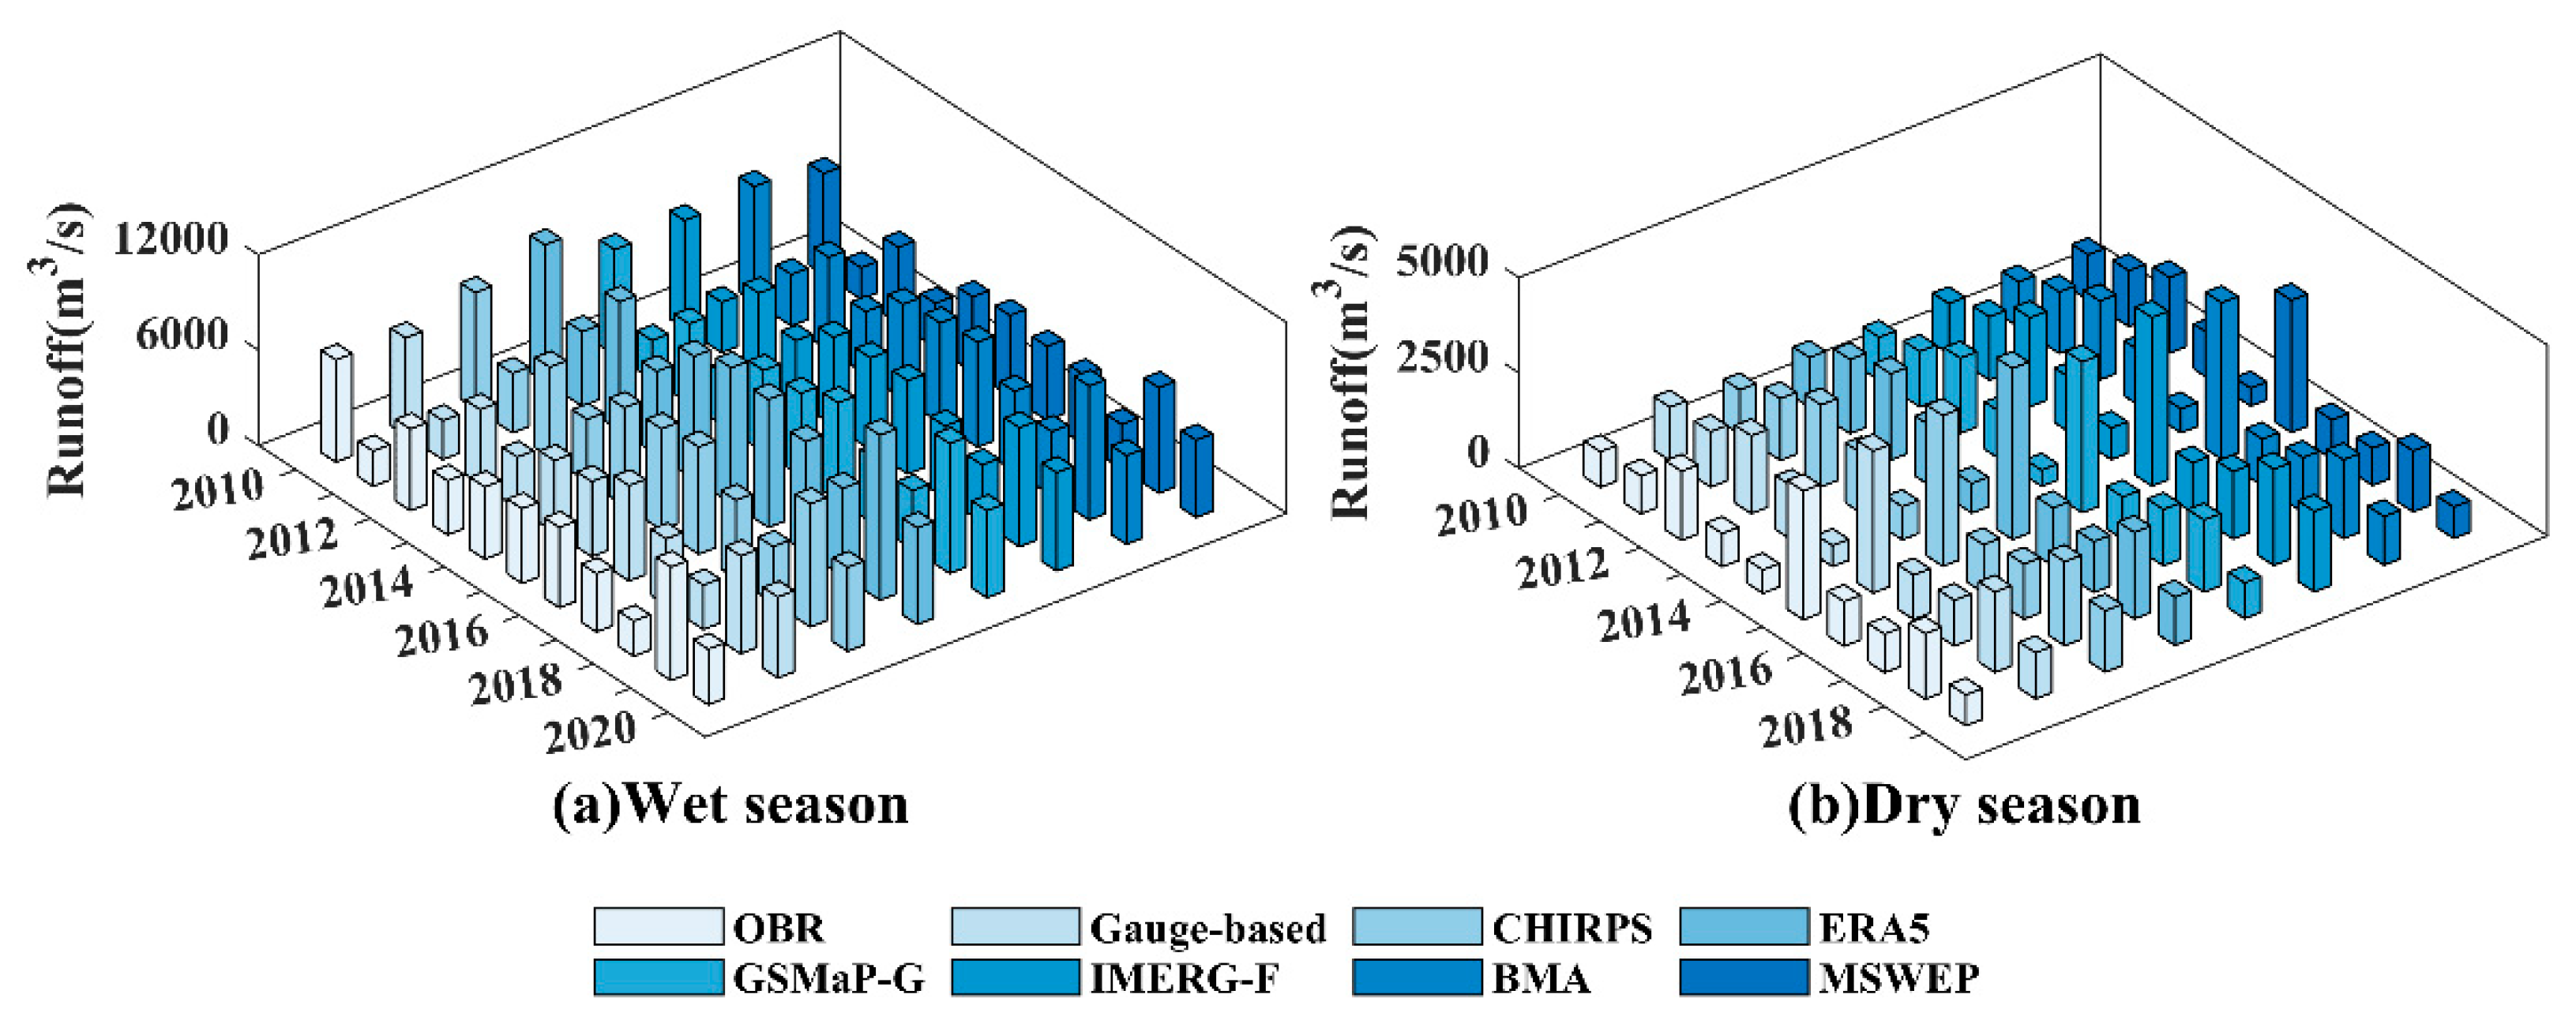
4.3.3. Analysis of Runoff Changes During Wet and Dry Periods

The wet season in the Ganjiang River Basin (2010–2020) extends from May to August, while the dry season lasts from November to February. Figure 16 compares observed runoff (hereafter OBR) with average monthly runoff simulations from various products during wet and dry seasons. Figure 16a shows observed runoff and simulated results from precipitation products in the wet season. Gauge-based simulations produce average monthly runoff that closely aligns with OBR in the wet season, yielding optimal results. CHIRPS and IMERG-F perform poorly, tending to overestimate average monthly runoff. ERA5’s simulated average monthly runoff consistently surpasses OBR, making the results unreliable. GSMaP-G’s average monthly runoff aligns closely with OBR from 2010 to 2015 but notably exceeds it from 2016 to 2020. MSWEP’s average monthly runoff simulations are reliable, closely matching OBR. BMA also performs well in simulating wet season runoff. Although simulated runoff is slightly higher than OBR in most years, BMA shows strong feasibility and applicability for wet season runoff prediction.
Figure 16b shows observed runoff and simulated results from precipitation products in the dry season. From November 2015 to February 2016, average monthly runoff from OBR and other products is markedly higher than in other years, though differences in other dry seasons remain minimal. As runoff decreases in the dry season, deviations between simulated runoff and OBR diminish, yet CHIRPS, ERA5, and IMERG-F remain considerably higher, illustrating poor feasibility. During the dry season, GSMaP-G, MSWEP, and BMA produce an average monthly runoff that closely aligns with OBR, yielding credible results.

5. Discussion

5.1. Strengths and Contributions of the BMA in This Study

Different types of precipitation products inherently represent distinct physical processes. Instrument-based products (e.g., CPC) often provide accurate localized precipitation measurements, but their spatial coverage tends to be limited. Satellite-based products (e.g., CHIRPS, GSMaP, IMERG) rely on cloud-top or microwave radiation for precipitation estimation. They are effective at capturing convective systems but can struggle with light precipitation or complex terrain. Reanalysis products (e.g., ERA5) incorporate sparse observations into global atmospheric models and can offer smoother, continuous coverage. However, they may overestimate or underestimate precipitation because of model-related factors (e.g., convective parameterization).
BMA constructs posterior probability distributions of precipitation, considering both the ensemble mean and the dispersion (i.e., variance) of each product’s estimates [52]. The BMA framework assigns weights to each ensemble member based on its agreement with surface observations, producing a statistically optimal combination that captures each product’s precipitation formation mechanism and compensates for single-source uncertainties. Most existing studies concentrate on one or two precipitation timescales, and the direct connection between fused precipitation products and actual hydrological modeling outcomes remains insufficiently explored.
This study adopts a comprehensive multi-timescale approach, systematically evaluating the data quality of multiple precipitation products at daily, monthly, and seasonal scales, while also examining their simulation effects in hydrologic modeling. These findings are expected to boost confidence in using fused precipitation data for extended hydrologic forecasts and water resource management. They also offer valuable insights for broader BMA applications in data-sparse regions, complex terrain, or areas with strong seasonal variation.

5.2. Influence of Precipitation Inputs on BMA

In this study, we use the BMA method to merge four distinct precipitation products into a unified daily dataset, whose performance is systematically evaluated and compared in Section 4.1. Generally, careful consideration of product types and quantities is needed when selecting precipitation products for ensemble-based datasets. The accuracy of individual products heavily influences BMA data quality because different retrieval algorithms, terrain, and climate conditions lead to significant performance variations. Typically, higher-performing members receive larger weights in BMA [28,43]. Chen et al. pointed out that poorly performing members can reduce the integration accuracy of merged data, underscoring the critical role of input datasets in BMA [30,53].
The BMA-merged product substantially enhances precipitation estimation, outperforming other products at daily, monthly, and seasonal scales. However, its runoff simulation is weaker than GSMaP-G and MSWEP at both daily and monthly scales. Among the ensemble members, GSMaP-G demonstrates the highest accuracy and receives the largest weight (0.34), followed by ERA5 at about 0.3. However, ERA5 notably overestimates precipitation, while CHIRPS and IMERG-F also show overestimation to varying degrees, causing inflated merged precipitation and biased runoff simulations. MSWEP integrates observations, satellite data, and reanalysis, drawing from about 77,000 global sites [54]. This extensive coverage often yields superior performance relative to other datasets in most regions. In future studies, excluding lower-performing products (e.g., CHIRPS and ERA5) and incorporating gauge-based and other high-accuracy datasets may further improve the quality of merged products.

5.3. Extreme Runoff Analysis

Analyzing daily and monthly runoff in the Ganjiang River Basin’s wet and dry seasons shows notable variations in observed runoff compared with other years. Quan et al. reported a strong correlation between precipitation and discharge in the Huaihe River Basin, suggesting a reliable link between extreme precipitation and extreme runoff [55]. Therefore, extreme runoff is closely related to extreme precipitation.
In mid-to-late June 2010, the Ganjiang River Basin experienced heavy rainfall from the combined influence of northern cold air and warm, humid southwestern air. On June 22, Waizhou Station recorded its highest discharge. During the 2015–2016 dry season, average monthly runoff was considerably higher than in other years, driven by record precipitation in November and December 2015 from the strongest El Niño event since May 2014, which triggered a rare winter flood. Two major floods occurred from June to July 2019, followed by a sharp discharge decline and persistently low water levels in the latter half of the year due to notable weather and climate anomalies influenced by the El Niño event. Intense rainfall from early June to July 2019 shifted to high temperatures and low rainfall, inducing a historic drought lasting from summer to winter. In 2020, influenced by El Niño and La Niña events, a concentrated rainfall period from mid-to-early July caused a major flood in the study area.
For extreme runoff, simulation results showed marked discrepancies from observed data. Therefore, further research is needed to evaluate how well BMA-merged products detect extreme precipitation events. GSMaP-G provides more accurate runoff simulations and captures peak flows more effectively. Future studies may incorporate GSMaP-G and other suitable products for data merging or refine BMA algorithms to improve extreme runoff simulation.

5.4. Analysis of Error Propagation from Precipitation to Runoff

In this study, certain precipitation products like ERA5 perform well in precipitation error assessments but yield poor runoff simulations. Therefore, investigating the relationship between precipitation input errors and simulated runoff errors, along with error propagation in hydrological models, is crucial for data quality and model enhancement [56]. Because hydrological processes are non-linear, runoff simulations may either amplify or diminish precipitation errors [57,58].
The propagation ratio K for relative root mean square error (RRMSE) indicates the magnification (K > 1) or reduction (K < 1) of precipitation estimation errors in runoff simulation. As shown in Figure 17, all selected precipitation products exhibit strong error-dampening effects in runoff simulation. ERA5’s error-dampening effect is weaker than that of the other products, implying that its observation technology and inversion algorithms need further refinement to improve hydrological simulations in the study area. Although BMA achieves the best precipitation error evaluation, its ability to reduce errors from precipitation to runoff is relatively limited. MSWEP and GSMaP-G show the strongest error-dampening effects in runoff simulation, underscoring their potential for hydrological modeling in the study area. Additionally, MSWEP and GSMaP-G incorporate ground data or corrections, implying that including observed precipitation in BMA products may more effectively minimize precipitation-to-runoff errors in future research. This section examines each product’s error-dampening effects from precipitation to runoff, although the influence of basin size, climate zone, and season on error dampening warrants further investigation.

5.5. Improvements in Future Research

This study employs a standard BMA framework to fuse four precipitation products and examines the spatial distribution of their weights in the Ganjiang River Basin. However, the temporal distribution of these weights remains unexamined. Future studies could investigate adaptable BMA approaches, such as dynamic, multi-stage, and quantile-based methods [29,59], to achieve more accurate precipitation estimates and better runoff simulations.
Although BMA excels at integrating precipitation products, spatial variations in data sources and complex geographical settings [60] may affect its performance. Numerous studies suggest that BMA-based precipitation estimates can be highly uncertain in complex terrain. Rahman et al. reported that the Dynamic Clustered Bayesian Model Averaging (DCBA) method showed its highest uncertainty in glacier areas and lowest in extremely arid regions, with peak precision and correlation at lower elevations [61]. Ma et al. observed that the dynamic BMA method performed best between 1000 and 3000 m over the Tibetan Plateau, with performance declining above 4000 m [62].
In this study, mountainous regions in the southwestern Ganjiang River Basin may influence precipitation estimates [63]. Furthermore, because the Ganjiang River Basin is a typical subtropical monsoon region with a mild climate and ample precipitation, it is well-suited for BMA. However, BMA’s applicability in other complex climatic zones—such as tropical humid or cold arid regions—remains unclear. Therefore, despite BMA’s enhanced performance, further studies are needed to develop dynamic BMA approaches suitable for complex terrains and climates, while incorporating new or improved data sources. Finally, the BMA framework could also benefit from integrating machine learning (ML) [64] and neural networks (NN) [65].

6. Conclusions

In this study, the BMA method is applied to create a merged precipitation product by integrating four datasets (CHIRPS, ERA5, GSMaP-G, and IMERG-F) in the Ganjiang River Basin. BMA, its ensemble members, and MSWEP are then compared and analyzed at daily, monthly, and seasonal scales. Furthermore, the VIC model is employed to evaluate the effects of six precipitation products on simulated runoff in the basin. The main conclusions are as follows.
In terms of evaluation metrics like CC, RMSE, and KGE at daily and monthly scales, BMA significantly outperforms the other products. The estimated precipitation shows strong applicability across the study area, reflecting high correlation and low dispersion compared to observed precipitation. GSMaP-G and MSWEP display stronger reliability in the Ganjiang River Basin, while ERA5 considerably overestimates precipitation in most regions.
Seasonal assessments highlight notable variations in precipitation estimation between BMA and the other products. In spring and summer, BMA achieves the best POD and FAR. In autumn and winter, it significantly surpasses other products in RB and KGE. BMA effectively addresses the seasonal deficiencies of its ensemble members in precipitation estimation.
In BMA, higher-performing ensemble members are assigned larger weights, with GSMaP-G achieving the highest median weight of 0.34 and contributing the most to the merged product. ERA5 follows closely, with weights varying from 0.25 to 0.35. CHIRPS and IMERG-F show the lowest scores and thus contribute minimally to BMA.
Driven by BMA, the VIC model yields excellent results in daily and monthly runoff simulations, with simulated and observed runoff trends closely aligned. The average monthly runoff in both wet and dry seasons closely matches observed values. This product exhibits good applicability in the study area and meets the requirements for long-term runoff simulation in the Ganjiang River Basin.
This study indicates that a merged precipitation product based on the BMA method provides high accuracy across various temporal scales in the Ganjiang River Basin. The product offers reliable precipitation data in areas with sparse rain gauge coverage, which is crucial for agricultural irrigation, flood forecasting, and water resource management. Furthermore, the strong performance of the BMA product in runoff simulation underscores its potential to offer reliable input for hydrological models, thereby supporting dynamic hydrological simulations. This lays a solid foundation for long-term hydrological forecasting and water resource assessments in the Ganjiang River Basin, thereby enhancing the region’s capacity for flood and drought disaster prevention.

Author Contributions

Conceptualization, S.N. and Y.C.; methodology, S.N.; software, J.W. and B.R.T.; validation, Y.Z. (Yuliang Zhang). and J.J.; writing—original draft preparation, Y.C.; writing—review and editing, S.N.; visualization, Y.Z. (Yuliang Zhang); supervision, Y.Z. (Yuliang Zhou).; funding acquisition, Y.Z. (Yuliang Zhou). All authors have read and agreed to the published version of the manuscript.

Funding

This project is funded by the National Key Research and Development Program of China (2023YFC3206604-02), the National Natural Science Foundation of China (42271084, 52379006) and Anhui Provincial Natural Science Foundation (2308085US13).

Data Availability Statement

All data that support the findings of this study are included within the article. The runoff data used in this study are confidential.

Acknowledgments

We sincerely thank the precipitation dataset producers used in this research.

Conflicts of Interest

The authors declare that they have no known competing financial interests or personal relationships that could have appeared to influence the work reported in this paper.

References

  1. Zhang, X.; Song, Y.; Nam, W.-H.; Huang, T.; Gu, X.; Zeng, J.; Huang, S.; Chen, N.; Yan, Z.; Niyogi, D. Data fusion of satellite imagery and downscaling for generating highly fine-scale precipitation. J. Hydrol. 2024, 631, 130665. [Google Scholar] [CrossRef]
  2. Aksu, H.; Taflan, G.Y.; Yaldiz, S.G.; Akgül, M.A. Evaluation of IMERG for GPM satellite-based precipitation products for extreme precipitation indices over Turkiye. Atmos. Res. 2023, 291, 106826. [Google Scholar] [CrossRef]
  3. Jahanshahi, A.; Roshun, S.H.; Booij, M.J. Comparison of satellite-based and reanalysis precipitation products for hydrological modeling over a data-scarce region. Clim. Dynam. 2024, 62, 3505–3537. [Google Scholar] [CrossRef]
  4. Wang, J.; Zhuo, L.; Han, D.; Liu, Y.; Rico-Ramirez, M.A. Hydrological model adaptability to rainfall inputs of varied quality. Water Resour. Res. 2023, 59, e2022WR032484. [Google Scholar] [CrossRef]
  5. Yang, X.; Yang, S.; Tan, M.L.; Pan, H.; Zhang, H.; Wang, G.; He, R.; Wang, Z. Correcting the bias of daily satellite precipitation estimates in tropical regions using deep neural network. J. Hydrol. 2022, 608, 127656. [Google Scholar] [CrossRef]
  6. Chang, Y.; Qi, Y.; Wang, Z. Comprehensive evaluation of IMERG, ERA5-Land and their fusion products in the hydrological simulation of three karst catchments in Southwest China. J. Hydrol.-Reg. Stud. 2024, 52, 101671. [Google Scholar] [CrossRef]
  7. Nguyen, L.H.; Nguyen, D.L.; Nguyen, H.H. Assessing applicability of two gridded precipitation datasets for hydrological simulation in a poorly gauged river basin towards supporting sustainable water resources management. Environ. Res. 2023, 237, 116956. [Google Scholar] [CrossRef]
  8. Chen, C.; He, Q.; Li, Y. Downscaling and merging multiple satellite precipitation products and gauge observations using random forest with the incorporation of spatial autocorrelation. J. Hydrol. 2024, 632, 130919. [Google Scholar] [CrossRef]
  9. Xie, P.; Chen, M.; Yang, S.; Yatagai, A.; Hayasaka, T.; Fukushima, Y.; Liu, C. A gauge-based analysis of daily precipitation over East Asia. J. Hydrometeorol. 2007, 8, 607–626. [Google Scholar] [CrossRef]
  10. Shen, Y.; Xiong, A. Validation and comparison of a new gauge-based precipitation analysis over mainland China. Int. J. Climatol. 2016, 36, 252–265. [Google Scholar] [CrossRef]
  11. Wu, X.; Feng, X.; Wang, Z.; Chen, Y.; Deng, Z. Multi-source precipitation products assessment on drought monitoring across global major river basins. Atmos. Res. 2023, 295, 106982. [Google Scholar] [CrossRef]
  12. Xu, J.; Ma, Z.; Yan, S.; Peng, J. Do ERA5 and ERA5-land precipitation estimates outperform satellite-based precipitation products? A comprehensive comparison between state-of-the-art model-based and satellite-based precipitation products over mainland China. J. Hydrol. 2022, 605, 127353. [Google Scholar] [CrossRef]
  13. Ma, Z.; Xu, J.; Ma, Y.; Zhu, S.; He, K.; Zhang, S.; Ma, W.; Xu, X. AERA5-Asia: A long-term asian precipitation dataset (0.1°, 1-hourly, 1951–2015, Asia) anchoring the ERA5-land under the total volume control by APHRODITE. Bull. Am. Meteorol. Soc. 2022, 103, E1146–E1171. [Google Scholar] [CrossRef]
  14. Li, J.; Hsu, K.-L.; Aghakouchak, A.; Sorooshian, S. Object-based assessment of satellite precipitation products. Rem. Sens. 2016, 8, 547. [Google Scholar] [CrossRef]
  15. Funk, C.; Peterson, P.; Landsfeld, M.; Pedreros, D.; Verdin, J.; Shukla, S.; Husak, G.; Rowland, J.; Harrison, L.; Hoell, A. The climate hazards infrared precipitation with stations—A new environmental record for monitoring extremes. Sci. Data 2015, 2, 150066. [Google Scholar] [CrossRef]
  16. Zhou, C.; Zhou, L.; Du, J.; Yue, J.; Ao, T. Accuracy evaluation and comparison of GSMaP series for retrieving precipitation on the eastern edge of the Qinghai-Tibet Plateau. J. Hydrol.-Reg. Stud. 2024, 56, 102017. [Google Scholar] [CrossRef]
  17. Chen, H.; Wen, D.; Du, Y.; Xiong, L.; Wang, L. Errors of five satellite precipitation products for different rainfall intensities. Atmos. Res. 2023, 285, 106622. [Google Scholar] [CrossRef]
  18. Beck, H.E.; Van Dijk, A.I.; Levizzani, V.; Schellekens, J.; Miralles, D.G.; Martens, B.; De Roo, A. MSWEP: 3-hourly 0.25 global gridded precipitation (1979–2015) by merging gauge, satellite, and reanalysis data. Hydrol. Earth Syst. Sci. 2017, 21, 589–615. [Google Scholar] [CrossRef]
  19. Lyu, Y.; Yong, B. A novel Double Machine Learning strategy for producing high-precision multi-source merging precipitation estimates over the Tibetan Plateau. Water Resour. Res. 2024, 60, e2023WR035643. [Google Scholar] [CrossRef]
  20. Gavahi, K.; Foroumandi, E.; Moradkhani, H. A deep learning-based framework for multi-source precipitation fusion. Remote Sens. Environ. 2023, 295, 113723. [Google Scholar] [CrossRef]
  21. Tang, G.; Clark, M.P.; Knoben, W.J.; Liu, H.; Gharari, S.; Arnal, L.; Beck, H.E.; Wood, A.W.; Newman, A.J.; Papalexiou, S.M. The impact of meteorological forcing uncertainty on hydrological modeling: A global analysis of cryosphere basins. Water Resour. Res. 2023, 59, e2022WR033767. [Google Scholar] [CrossRef]
  22. Zeng, Q.; Zhao, Q.; Luo, Y.-T.; Ma, S.-G.; Kang, Y.; Li, Y.-Q.; Chen, H.; Xu, C.-Y. Uncertainty estimation of hydrological modelling using gridded precipitation as model inputs in the Gandaki River Basin. J. Hydrol.-Reg. Stud. 2024, 53, 101825. [Google Scholar] [CrossRef]
  23. Aryal, A.; Tran, T.-N.-D.; Kumar, B.; Lakshmi, V. Evaluation of Satellite-Derived Precipitation Products for Streamflow Simulation of a Mountainous Himalayan Watershed: A Study of Myagdi Khola in Kali Gandaki Basin, Nepal. Rem. Sens. 2023, 15, 4762. [Google Scholar] [CrossRef]
  24. Gao, Z.; Tang, G.; Jing, W.; Hou, Z.; Yang, J.; Sun, J. Evaluation of Multiple Satellite, Reanalysis, and Merged Precipitation Products for Hydrological Modeling in the Data-Scarce Tributaries of the Pearl River Basin, China. Rem. Sens. 2023, 15, 5349. [Google Scholar] [CrossRef]
  25. Beck, H.E.; Wood, E.F.; Pan, M.; Fisher, C.K.; Miralles, D.G.; Van Dijk, A.I.; Mcvicar, T.R.; Adler, R.F. MSWEP V2 global 3-hourly 0.1 precipitation: Methodology and quantitative assessment. Bull. Am. Meteorol. Soc. 2019, 100, 473–500. [Google Scholar] [CrossRef]
  26. Massoud, E.; Lee, H.; Gibson, P.; Loikith, P.; Waliser, D. Bayesian model averaging of climate model projections constrained by precipitation observations over the contiguous United States. J. Hydrometeorol. 2020, 21, 2401–2418. [Google Scholar] [CrossRef]
  27. Ahsan, S.; Bhat, M.S.; Alam, A.; Farooq, H.; Shiekh, H.A. Complementary use of multi-model climate ensemble and Bayesian model averaging for projecting river hydrology in the Himalaya. Environ. Sci. Pollut. Res. 2023, 30, 38898–38920. [Google Scholar] [CrossRef]
  28. Ma, Y.; Hong, Y.; Chen, Y.; Yang, Y.; Tang, G.; Yao, Y.; Long, D.; Li, C.; Han, Z.; Liu, R. Performance of optimally merged multisatellite precipitation products using the dynamic Bayesian model averaging scheme over the Tibetan Plateau. J. Geophys. Res.-Atmos. 2018, 123, 814–834. [Google Scholar] [CrossRef]
  29. Yumnam, K.; Guntu, R.K.; Rathinasamy, M.; Agarwal, A. Quantile-based Bayesian Model Averaging approach towards merging of precipitation products. J. Hydrol. 2022, 604, 127206. [Google Scholar] [CrossRef]
  30. Wei, L.; Jiang, S.; Dong, J.; Ren, L.; Liu, Y.; Zhang, L.; Wang, M.; Duan, Z. Fusion of gauge-based, reanalysis, and satellite precipitation products using Bayesian model averaging approach: Determination of the influence of different input sources. J. Hydrol. 2023, 618, 129234. [Google Scholar] [CrossRef]
  31. Shen, Z.; Yong, B.; Gourley, J.J.; Qi, W. Real-time bias adjustment for satellite-based precipitation estimates over Mainland China. J. Hydrol. 2021, 596, 126133. [Google Scholar] [CrossRef]
  32. Zhang, Y.; Ju, Q.; Zhang, L.; Xu, C.-Y.; Lai, X. Evaluation and hydrological application of four gridded precipitation datasets over a large Southeastern Tibetan Plateau Basin. Rem. Sens. 2022, 14, 2936. [Google Scholar] [CrossRef]
  33. Lei, H.; Zhao, H.; Ao, T.; Hu, W. Quantifying the reliability and uncertainty of satellite, reanalysis, and merged precipitation products in hydrological simulations over the topographically diverse basin in Southwest China. Rem. Sens. 2022, 15, 213. [Google Scholar] [CrossRef]
  34. Nawaz, M.; Iqbal, M.F.; Mahmood, I. Validation of CHIRPS satellite-based precipitation dataset over Pakistan. Atmos. Res. 2021, 248, 105289. [Google Scholar] [CrossRef]
  35. Guo, B.; Xu, T.; Yang, Q.; Zhang, J.; Dai, Z.; Deng, Y.; Zou, J. Multiple spatial and temporal scales evaluation of eight satellite precipitation products in a mountainous catchment of south China. Rem. Sens. 2023, 15, 1373. [Google Scholar] [CrossRef]
  36. Hersbach, H.; Bell, B.; Berrisford, P.; Hirahara, S.; Horányi, A.; Muñoz-Sabater, J.; Nicolas, J.; Peubey, C.; Radu, R.; Schepers, D. The ERA5 global reanalysis. Q. J. R. Meteorolog. Soc. 2020, 146, 1999–2049. [Google Scholar] [CrossRef]
  37. Zhou, Z.; Guo, B.; Xing, W.; Zhou, J.; Xu, F.; Xu, Y. Comprehensive evaluation of latest GPM era IMERG and GSMaP precipitation products over mainland China. Atmos. Res. 2020, 246, 105132. [Google Scholar] [CrossRef]
  38. Lv, X.; Guo, H.; Tian, Y.; Meng, X.; Bao, A.; De Maeyer, P. Evaluation of GSMaP Version 8 Precipitation Products on an Hourly Timescale over Mainland China. Rem. Sens. 2024, 16, 210. [Google Scholar] [CrossRef]
  39. Chen, X.; Letu, H.; Shang, H.; Ri, X.; Tang, C.; Ji, D.; Shi, C.; Teng, Y. Rainfall Area Identification Algorithm Based on Himawari-8 Satellite Data and Analysis of its Spatiotemporal Characteristics. Rem. Sens. 2024, 16, 747. [Google Scholar] [CrossRef]
  40. Retalis, A.; Katsanos, D.; Tymvios, F.; Michaelides, S. Comparison of GPM IMERG and TRMM 3B43 Products over Cyprus. Rem. Sens. 2020, 12, 3212. [Google Scholar] [CrossRef]
  41. Deng, Y.; Wang, X.; Ruan, H.; Lin, J.; Chen, X.; Chen, Y.; Duan, W.; Deng, H. The magnitude and frequency of detected precipitation determine the accuracy performance of precipitation data sets in the high mountains of Asia. Sci. Rep. 2024, 14, 17251. [Google Scholar] [CrossRef]
  42. Abbas, H.; Song, W.; Wang, Y.; Xiang, K.; Chen, L.; Feng, T.; Linghu, S.; Alam, M. Validation of CRU TS v4. 08, ERA5-Land, IMERG v07B, and MSWEP v2. 8 Precipitation Estimates Against Observed Values over Pakistan. Rem. Sens. 2024, 16, 4803. [Google Scholar] [CrossRef]
  43. Duan, Q.; Ajami, N.K.; Gao, X.; Sorooshian, S. Multi-model ensemble hydrologic prediction using Bayesian model averaging. Adv. Water Resour. 2007, 30, 1371–1386. [Google Scholar] [CrossRef]
  44. Jiang, S.; Ren, L.; Hong, Y.; Yong, B.; Yang, X.; Yuan, F.; Ma, M. Comprehensive evaluation of multi-satellite precipitation products with a dense rain gauge network and optimally merging their simulated hydrological flows using the Bayesian model averaging method. J. Hydrol. 2012, 452, 213–225. [Google Scholar] [CrossRef]
  45. Raftery, A.E.; Gneiting, T.; Balabdaoui, F.; Polakowski, M. Using Bayesian model averaging to calibrate forecast ensembles. Mon. Weather. Rev. 2005, 133, 1155–1174. [Google Scholar] [CrossRef]
  46. Chen, F.; Kong, X.; Li, X.; Wang, Y.; Pang, C. Reliability of satellite-derived precipitation data in driving hydrological simulations: A case study of the upper Huaihe River basin, China. J. Hydrol. 2022, 612, 128076. [Google Scholar] [CrossRef]
  47. Ji, X.; Li, Y.; Luo, X.; He, D.; Guo, R.; Wang, J.; Bai, Y.; Yue, C.; Liu, C. Evaluation of bias correction methods for APHRODITE data to improve hydrologic simulation in a large Himalayan basin. Atmos. Res. 2020, 242, 104964. [Google Scholar] [CrossRef]
  48. Wang, Z.; Zhong, R.; Lai, C.; Chen, J. Evaluation of the GPM IMERG satellite-based precipitation products and the hydrological utility. Atmos. Res. 2017, 196, 151–163. [Google Scholar] [CrossRef]
  49. Han, X.; Yuan, H. Impacts of precipitation uncertainty on hydrological ensemble simulations over the Ganjiang River Basin. J. Hydrol.-Reg. Stud. 2024, 51, 101617. [Google Scholar] [CrossRef]
  50. Shaowei, N.; Jie, W.; Juliang, J.; Xiaoyan, X.; Yuliang, Z.; Fan, S.; Linlin, Z. Comprehensive evaluation of satellite-derived precipitation products considering spatial distribution difference of daily precipitation over eastern China. J. Hydrol.-Reg. Stud. 2022, 44, 101242. [Google Scholar] [CrossRef]
  51. Sloughter, J.M.L.; Raftery, A.E.; Gneiting, T.; Fraley, C. Probabilistic quantitative precipitation forecasting using Bayesian model averaging. Mon. Weather. Rev. 2007, 135, 3209–3220. [Google Scholar] [CrossRef]
  52. Tourian, M.J.; Saemian, P.; Ferreira, V.G.; Sneeuw, N.; Frappart, F.; Papa, F. A copula-supported Bayesian framework for spatial downscaling of GRACE-derived terrestrial water storage flux. Remote Sens. Environ. 2023, 295, 113685. [Google Scholar] [CrossRef]
  53. Chen, Y.; Yuan, W.; Xia, J.; Fisher, J.B.; Dong, W.; Zhang, X.; Liang, S.; Ye, A.; Cai, W.; Feng, J. Using Bayesian model averaging to estimate terrestrial evapotranspiration in China. J. Hydrol. 2015, 528, 537–549. [Google Scholar] [CrossRef]
  54. Yang, T.; Li, Q.; Chen, X.; De Maeyer, P.; Yan, X.; Liu, Y.; Zhao, T.; Li, L. Spatiotemporal variability of the precipitation concentration and diversity in Central Asia. Atmos. Res. 2020, 241, 104954. [Google Scholar] [CrossRef]
  55. Quan, D.; Xing, C.; Tiexi, C.; Xing-Wu, C. Relationship between extremes of precipitation and discharge in the Huaihe River Basin. J. Nanjing Univ. (Nat. Sci.). 2009, 45, 790–801. [Google Scholar] [CrossRef]
  56. Stephens, C.M.; Pham, H.T.; Marshall, L.A.; Johnson, F.M. Which Rainfall Errors Can Hydrologic Models Handle? Implications for Using Satellite-Derived Products in Sparsely Gauged Catchments. Water Resour. Res. 2022, 58, e2020WR029331. [Google Scholar] [CrossRef]
  57. Nanding, N.; Wu, H.; Tao, J.; Maggioni, V.; Beck, H.E.; Zhou, N.; Huang, M.; Huang, Z. Assessment of precipitation error propagation in discharge simulations over the contiguous United States. J. Hydrometeorol. 2021, 22, 1987–2008. [Google Scholar] [CrossRef]
  58. Gou, J.; Miao, C.; Sorooshian, S.; Duan, Q.; Guo, X.; Su, T. Satellite-based precipitation error propagation in the hydrological modeling chain across China. J. Hydrol. 2024, 632, 130906. [Google Scholar] [CrossRef]
  59. Yin, J.; Guo, S.; Gu, L.; Zeng, Z.; Liu, D.; Chen, J.; Shen, Y.; Xu, C.-Y. Blending multi-satellite, atmospheric reanalysis and gauge precipitation products to facilitate hydrological modelling. J. Hydrol. 2021, 593, 125878. [Google Scholar] [CrossRef]
  60. He, K.; Chen, X.; Liu, J.; Zhao, D. A multiple-step scheme for the improvement of satellite precipitation products over the Tibetan Plateau from multisource information. Sci. Total Environ. 2023, 873, 162378. [Google Scholar] [CrossRef]
  61. Rahman, K.U.; Shang, S.; Shahid, M.; Wen, Y.; Khan, Z. Application of a dynamic clustered bayesian model averaging (DCBA) algorithm for merging multisatellite precipitation products over Pakistan. J. Hydrometeorol. 2020, 21, 17–37. [Google Scholar] [CrossRef]
  62. Ma, Y.; Yang, Y.; Han, Z.; Tang, G.; Maguire, L.; Chu, Z.; Hong, Y. Comprehensive evaluation of ensemble multi-satellite precipitation dataset using the dynamic bayesian model averaging scheme over the Tibetan Plateau. J. Hydrol. 2018, 556, 634–644. [Google Scholar] [CrossRef]
  63. Jiang, S.; Zhang, Z.; Huang, Y.; Chen, X.; Chen, S. Evaluating the TRMM multisatellite precipitation analysis for extreme precipitation and streamflow in Ganjiang River basin, China. Adv. Meteorol. 2017, 2017, 2902493. [Google Scholar] [CrossRef]
  64. Zhao, Y.; Xu, K.; Dong, N.; Wang, H. Optimally integrating multi-source products for improving long series precipitation precision by using machine learning methods. J. Hydrol. 2022, 609, 127707. [Google Scholar] [CrossRef]
  65. Seo, J.Y.; Lee, S.-I. Fusion of Multi-Satellite Data and Artificial Neural Network for Predicting Total Discharge. Rem. Sens. 2020, 12, 2248. [Google Scholar] [CrossRef]
Figure 1. Elevation (a) and landcover types (b) of the Ganjiang River Basin. The landcover types are as follows: 0 (Water), 1 (Evergreen Needleleaf Forest), 2 (Evergreen Broadleaf Forest), 4 (Deciduous Broadleaf Forest), 5 (Mixed Forest), 6 (Woodland), 7 (Wooded Grassland), 8 (Closed Shrubland), 9 (Open Shrubland), 10 (Grassland), 11 (Cropland), and 14 (Unclassified).
Remotesensing 17 01154 g001
Figure 2. Flowchart of the methodology used in this study.
Remotesensing 17 01154 g002
Figure 3. Schematic diagram of the BMA method.
Remotesensing 17 01154 g003
Figure 4. Daily-scale metrics of evaluated precipitation products (2008–2020).
Remotesensing 17 01154 g004
Figure 5. Probability distributions of precipitation intensity for missed events (a) and false alarms (b).
Remotesensing 17 01154 g005
Figure 6. Box plots of daily-scale evaluation metrics for six precipitation products (2008–2020). The six metrics are as follows: (a) CC, (b) RB, (c) RMSE, (d) KGE, (e) POD, (f) FAR.
Remotesensing 17 01154 g006
Figure 7. Spatial distributions of the KGE metric. The six precipitation products are as follows: (a) CHIRPS, (b) ERA5, (c) GSMaP-G, (d) IMERG-F, (e) BMA, (f) MSWEP.
Remotesensing 17 01154 g007
Figure 8. Spatial distributions of average annual precipitation. The gauge-based observations and six precipitation products are as follows: (a) Gauge-based, (b) CHIRPS, (c) ERA5, (d) GSMaP-G, (e) IMERG-F, (f) BMA, (g) MSWEP.
Remotesensing 17 01154 g008
Figure 9. Scatter plots of gauge-based precipitation and six precipitation products at the daily scale (2008–2020). The six precipitation products are as follows: (a) CHIRPS, (b) ERA5, (c) GSMaP-G, (d) IMERG-F, (e) BMA, (f) MSWEP.
Remotesensing 17 01154 g009
Figure 10. Box plots of monthly-scale evaluation metrics for six precipitation products (2008–2020). The four metrics are as follows: (a) CC, (b) RB, (c) RMSE, (d) KGE.
Remotesensing 17 01154 g010
Figure 11. Seasonal average evaluation metrics of six precipitation products (2008–2020).
Remotesensing 17 01154 g011
Figure 12. Weights of the four ensemble members of BMA.
Remotesensing 17 01154 g012
Figure 13. Spatial distribution of weights for (a) CHIRPS, (b) ERA5, (c) GSMaP-G, (d) IMERG-F.
Remotesensing 17 01154 g013
Figure 14. Comparison of observed and simulated daily runoff in the Ganjiang River Basin (2010–2020).
Remotesensing 17 01154 g014
Figure 15. Comparison of observed and simulated monthly runoff in the Ganjiang River Basin (2010–2020).
Remotesensing 17 01154 g015
Figure 16. Observed and simulated average monthly runoff during wet and dry seasons (2010–2020).
Remotesensing 17 01154 g016
Figure 17. Error propagation ratio K of six precipitation products from precipitation to runoff in the Ganjiang River Basin.
Remotesensing 17 01154 g017
Table 2. Soil parameter variables of the VIC model and their perfect values.
ParametersUnitDescriptionValue RangePerfect Value
b_infilt-Variable infiltration capacity curve[0.1, 0.4]0.39
Dsmaxmm/dayMaximum velocity of base flow[0, 30]27.79
Ds-Fraction of Dsmax where non-linear
baseflow begins
[0.1, 1]0.95
Ws-Fraction of maximum soil moisture
where non-linear baseflow occurs
[0.1, 1]0.50
D2mThe second soil-layer thickness[0.1, 1]0.27
D3mThe third soil-layer thickness[0.1, 3]1.67
Table 3. Metrics for evaluating precipitation estimation accuracy and hydrological simulation performance.
Evaluation MetricsEquationValue RangePerfect Value
Correlation coefficient (CC) C C = k = 1 K ( O k O ¯ ) ( S k S ¯ ) k = 1 K ( O k O ¯ ) 2 k = 1 K ( S k S ¯ ) 2 [−1, 1]1
Relative bias (RB) R B = k = 1 K ( S k O k ) k = 1 K O k × 100 % (−∞, +∞)0
Root mean square error (RMSE) R M S E = 1 K k = 1 K ( S k O k ) 2 [0, +∞)0
Kling–Gupta
efficiency (KGE)
K G E = 1 ( C C 1 ) 2 + ( α 1 ) 2 + ( β 1 ) 2
α = S ¯ O ¯   β = C V S C V O
(−∞, 1]1
Probability of
detection (POD)
P O D = X X + Y [0, 1]1
False alarm ratio (FAR) F A R = Z X + Z [0, 1]0
Nash–Sutcliffe efficiency (NSE) N S E = 1 k = 1 K ( R S , k R O , k ) 2 k = 1 K ( R O , k R ¯ O ) 2 (−∞, 1]1
Note: S k and O k represent estimated and observed precipitation, respectively; S ¯ and O ¯ represent the mean values of S and O , respectively; K denotes the number of samples; C V S and C V O represent the standard deviations for S and O , respectively; X and Y denote the number of observed precipitation events correctly detected and not detected by S , respectively; Z denotes the number of precipitation events detected by S but that have not actually occurred; R S , k and R O , k represent simulated and observed runoff, respectively; and R ¯ O represents the mean value of R O .
Table 4. Monthly-scale metrics of evaluated precipitation products (2008–2020).
ProductsCCRB (%)RMSE (mm)KGE
CHIRPS0.944.1938.430.90
ERA50.9125.9875.900.71
GSMaP-G0.96−6.3130.730.91
IMERG-F0.961.9329.650.95
BMA0.976.6228.850.93
MSWEP0.95−8.2435.010.90
Note: The bold text represents the best single metric.
Table 5. The NSE values of precipitation products during the calibration period, verification period, and the entire study period.
ProductsCalibrationVerificationEntire Study Period
Gauge-based0.860.740.80
CHIRPS0.480.290.39
ERA50.070.050.07
GSMaP-G0.870.690.79
IMERG-F0.730.400.57
BMA0.770.610.70
MSWEP0.870.770.82
Disclaimer/Publisher’s Note: The statements, opinions and data contained in all publications are solely those of the individual author(s) and contributor(s) and not of MDPI and/or the editor(s). MDPI and/or the editor(s) disclaim responsibility for any injury to people or property resulting from any ideas, methods, instructions or products referred to in the content.

